Grasp the Large, Let Go of the Small: The Transformation ... · CHANG-TAI HSIEH University of...
52
295 CHANG-TAI HSIEH University of Chicago ZHENG (MICHAEL) SONG Chinese University of Hong Kong Grasp the Large, Let Go of the Small: The Transformation of the State Sector in China ABSTRACT In the late 1990s, China’s industrial sector was dominated by state-owned firms. We document how this changed after 1998. More than 80 percent of the state-owned firms in 1998 were shut down or privatized by 2007. Among firms we classify as state-controlled in 2007, many were restruc- tured and registered as private firms with a controlling share held by a state- owned conglomerate or were new firms established after 1998. In 2007, almost half of the state-controlled firms were registered as private firms, and about 40 percent were new firms established after 1998. The privatization and con- vergence in labor productivity decelerated after 2007, but the establishment of new state-owned firms continued at roughly the same rate. When we interpret these facts through the lens of an equilibrium model of heterogeneous firms, we find that the transformation of firms that remained under state control and the creation of new state-controlled firms together account for 21 percent of China’s growth from 1998 to 2007 and 18 percent of its growth from 2007 to 2012. However, the exit and privatization of state-owned firms had a negligible effect on aggregate growth. A central feature of the industrial revolution in China over the last two decades is the decline of the state-owned sector. Figure 1 illustrates that the share of state-owned firms in industrial output declined from 50 percent in 1998 to 30 percent by 2005, and has continued to fall since then, albeit at a slower rate. This fact naturally suggests that China’s growth was driven by the growth of the private sector and the reallocation of resources away from state-owned firms. According to a popular view, the growth of the private sector was only possible when, starting in the late
Transcript of Grasp the Large, Let Go of the Small: The Transformation ... · CHANG-TAI HSIEH University of...
295
CHANG-TAI HSIEHUniversity of Chicago
ZHENG (MICHAEL) SONGChinese University of Hong Kong
Grasp the Large, Let Go of the Small: The Transformation of the
State Sector in China
ABSTRACT In the late 1990s, China’s industrial sector was dominated by state-owned firms. We document how this changed after 1998. More than 80 percent of the state-owned firms in 1998 were shut down or privatized by 2007. Among firms we classify as state-controlled in 2007, many were restruc-tured and registered as private firms with a controlling share held by a state-owned conglomerate or were new firms established after 1998. In 2007, almost half of the state-controlled firms were registered as private firms, and about 40 percent were new firms established after 1998. The privatization and con-vergence in labor productivity decelerated after 2007, but the establishment of new state-owned firms continued at roughly the same rate. When we interpret these facts through the lens of an equilibrium model of heterogeneous firms, we find that the transformation of firms that remained under state control and the creation of new state-controlled firms together account for 21 percent of China’s growth from 1998 to 2007 and 18 percent of its growth from 2007 to 2012. However, the exit and privatization of state-owned firms had a negligible effect on aggregate growth.
A central feature of the industrial revolution in China over the last two decades is the decline of the state-owned sector. Figure 1 illustrates
that the share of state-owned firms in industrial output declined from 50 percent in 1998 to 30 percent by 2005, and has continued to fall since then, albeit at a slower rate. This fact naturally suggests that China’s growth was driven by the growth of the private sector and the reallocation of resources away from state-owned firms. According to a popular view, the growth of the private sector was only possible when, starting in the late

296 Brookings Papers on Economic Activity, Spring 2015
1990s, state-owned firms were shut down or privatized. The shutdown of loss-making state-owned firms released resources that were more profit-ably employed by private firms. Privatizing state-owned firms may have raised their productivity by more closely aligning control and cash-flow rights. The industrial revolution in China is thus nothing more than the triumph of “Markets over Mao,” to quote the title of a recent book by Nicholas Lardy (2014).
Another view is that China’s growth was driven by “state capitalism.” Advocates of the role of state capitalism point out that although many state-owned firms were closed or privatized, the remaining state-owned firms are among the largest firms in China today. For example, 67 of the
Figure 1. Revenue Share of State-Owned Firms, 1998–2013a
2000 2002 2004 2006 2008 2010 2012
0.1
0.2
0.3
0.4
0.5China Statistical Yearbookb
State-controlled firmsc
Firms registered as state-ownedd
Revenue share
Source: Authors’ calculations, based on microdata from China’s Industrial Survey and published tabulations from the China Statistical Yearbook.
a. Firm data are tabulations from China’s Industrial Survey from 1998–2007 and 2012; firm data for 2008–2011 are missing.
b. State-owned firms in the industrial sector in the China Statistical Yearbook. c. Firms we identify as state-owned but not necessarily registered as state-owned, based on firm data.d. Firms formally registered as state-owned firms, based on firm data.

CHANG-TAI HSIEH and ZHENG (MICHAEL) SONG 297
69 Chinese companies in Fortune’s 2014 list of the 500 largest compa-nies in the world are state-owned. One can also point to the experience of specific state-owned companies. Consider, for example, the experience of the Baoshan Steel Company. Baoshan, a large steel manufacturer in Shanghai, became a publicly traded company in 2000.1 The controlling share (75 percent) is held by a holding company (the BaoSteel Group) wholly owned by the Chinese central government.2 Baoshan has done very well since the late 1990s. Total sales increased from USD 3.7 billion in 2000 to USD 23.1 billion by 2007. Profits increased by even more, from USD 527 million in 2000 to USD 2.2 billion by 2007. Baoshan is currently the largest steel producer in China and one of the largest steel producers in the world.3 The experience of Baoshan is an example of how state-owned firms have changed. Such firms, which are among the larg-est companies in China today, have typically been partially privatized but always with a controlling share held by a large state-owned conglomerate. The term used in China for this ownership change is that large state-owned firms were “corporatized,” not privatized. Furthermore, there is a wide-spread perception that such firms have been enormously successful, per-haps even too successful. For example, a new popular phrase in China is guo jin min tui, which translates roughly as “the state advances, the private sector retreats.” Implicit in this slogan is the belief that state-owned firms have been successful, but their success has had negative aggregate effects.
What is missing in this debate is evidence, and this is what we pro-vide in this paper. We use detailed firm-level data from China’s Industrial Survey to measure the quantitative importance of the transformation of the state sector on aggregate productivity growth. First, we document the triumph of “Markets over Mao” in the Chinese industrial sector from 1998 to 2007: more than 83 percent of all state-owned firms in the industrial sector in 1998 were shut down or privatized by 2007, with higher rates among smaller state-owned firms. Second, we document the “corporati-zation” of the surviving state-owned firms: among firms we identify as
1. Technically, Baoshan was closed in 2000, and a new company called Baoshan Com-pany Limited was established with the assets of the old state company and publicly listed on the Shanghai Stock Exchange.
2. Baoshan is legally controlled by the central government’s State-Owned Assets Super-vision and Administration Commission (SASAC), and Baoshan’s senior executives are appointed by the Organization Department of the Chinese Communist Party.
3. These numbers are from Baoshan’s annual reports. As we discuss later in the paper, Baoshan is only one of the firms in the BaoSteel Group.

298 Brookings Papers on Economic Activity, Spring 2015
state-controlled in 2007, almost half are officially registered as private firms. Third, we find that the labor productivity of surviving state-controlled firms and privatized firms converged to that of private firms by 2007, but that capital productivity among state-owned and privatized firms remained about 40 percent lower (compared to private firms). Fourth, we find that many new state-owned firms were established between 1998 and 2007: such firms accounted for approximately 36 percent of all state-owned firms in 2007. Finally, parts of this process decelerated after 2007: after that point there was less privatization of state-owned firms, and the growth in labor productivity of state-owned firms relative to that of private firms slowed down from 2007 to 2012 (compared to the 1998–2007 period), but the cre-ation of new state-owned firms continued after 2007 at roughly the same rate, as in the earlier period.
We then interpret these facts through the lens of an equilibrium model of heterogeneous firms. We find that the exit and privatization of state-owned firms had negligible effects on aggregate output growth, account-ing for about 3 percent of the aggregate growth in China’s industrial sector from 1998 to 2007 and zero percent of growth from 2007 to 2012. Thus, a simple version of the “Markets over Mao” story for China’s growth does not appear to be correct. The bulk of China’s growth is driven (in a proxi-mate sense) by two other forces. First, the “corporatization” of the surviv-ing state-controlled firms and the establishment of new state-owned firms collectively accounts for 21 percent of the growth from 1998 to 2007 and 18 percent of the growth from 2007 to 2012. Second, the residual, which is due to the growth of private firms, accounts for 70 to 80 percent of aggre-gate growth after 1998. In sum, we find that the quasi-privatization “cor-poratization” of firms that remained under state control and the creation of new state-controlled firms played an important role in China’s growth, but the biggest force behind China’s growth is neither state capitalism nor the simple version of the “Markets over Mao” story.
The rest of the paper is organized as follows. Section I presents the facts regarding the characteristics of exiting firms, survivors, and entrants in the state sector relative to that of their private counterparts. In section II, we lay out a model to guide our empirical analysis. We then use the model in section III to back out firm-level productivity and distortions. We also explore the institutional forces behind the dramatic changes in the state sector in section IV. Section V quantifies the effect on aggregate GDP of the reallocation toward private firms through the exit and privatization of state-owned firms and the productivity improvements among surviving state-owned firms. Section VI concludes.

CHANG-TAI HSIEH and ZHENG (MICHAEL) SONG 299
I. Grasp the Large, Let Go of the Small
This section describes the institutional background behind the state sector reforms that began in the late 1990s. We then present a comprehensive set of empirical facts found in China’s industrial firm data. We pay special attention to the identification of state ownership, which is often disguised by the firms’ legal registration.
The main data we use are the microdata from the Annual Survey of Industries conducted by China’s National Bureau of Statistics from 1998 to 2007 and for 2012.4 This survey is a census of all state-owned firms and non-state-owned firms (henceforth referred to as private firms) in the industrial sector that have more than 5 million RMB in revenues.5 The unit of observation in the data is a registered firm. For the firms owned by the state-owned industrial groups, each firm is a separate observation in our data.
I.A. Institutional Background
The policy changes we describe below were formally announced in 1999 in the Fourth Plenum of the Communist Party’s Central Committee.6 The slogan adopted by the Communist Party to describe the proposed reforms was “Grasp the Large, Let Go of the Small.” “Let Go of the Small” refers to the fact that small state-owned firms were to be closed or sold.
As for the large state-owned firms, the plan was that large firms were to be “grasped” by the state. By grasp, the central committee meant that large state-owned firms were to be merged into large industrial conglom-erates, and the control over these conglomerates was to be consolidated by the central government or by local governments. In the steel sector, for example, five large industrial groups were created in the late 1990s and early 2000s, and ownership of the state-owned steel manufactur-ers was transferred to these groups. Three of these groups are owned by the Chinese central government (BaoSteel Group, WuSteel Group, and AnSteel Group) and two by provincial governments (Hebei Iron
4. We do not have access to the microdata from 2008 to 2011.5. The threshold was raised to 20 million RMB in 2011.6. See Central Committee of the Communist Party of China (1999) for the formal
announcement. As is typical with all the major reforms implemented in China, the offi-cial decision in 1999 was preceded by several years of small-scale experimentation. See Aivazian, Ge, and Qui (2005) for an assessment of the initial experiments with reforms in corporate governance.

300 Brookings Papers on Economic Activity, Spring 2015
and Steel Group, and Shandong Steel Group). The BaoSteel Group, for example, controls six large steel manufacturers—three wholly owned by the group and three (including Baoshan) publicly traded with the group as the controlling shareholder.
The automobile industry provides another example. In this sector, state-owned automobile companies were consolidated into six state-owned conglomerates, the largest of which is the Shanghai Automotive Industry Corporation (SAIC) Group owned by the Shanghai local government. The SAIC Group owns a controlling share of the equity (73 percent) of the original state-owned firm (SAIC Motor Co., Ltd.), which is now a publicly traded company. In turn, SAIC Motor Co., Ltd., holds 50 per-cent of the equity of two new companies jointly established with General Motors (Shanghai-GM) and Volkswagen (Shanghai-Volkswagen).7
A more fundamental goal of “Grasp the Large” was to transform the large state-owned firms into profit-maximizing firms under the control of the Chinese state. Two aspects of the reorganization of large state-owned firms were meant to accomplish this goal. First, state-owned firms were often incorporated as limited liability corporations, and the managers were to be held accountable for the firm’s bottom line. The terminology used in China was that state-owned firms were to be “corporatized.” The parent company, as the controlling shareholder, was to monitor the firm and be responsible for appointing and deciding the compensation of the firm’s senior managers. In turn, the senior executives of the parent com-pany (the industrial group) were to be directly appointed by the local government (in the case of groups owned by local governments, such as the SAIC Group) or by the Central Organization Department of the Com-munist Party (in the case of groups owned by the central government, such as the BaoSteel Group).
In addition, although the plans laid out in the late 1990s did not mention the establishment of new state-owned firms, we will show that this was also an important part of what happened. Because the new state-owned firms are predominantly large firms, we will also label the creation of new state-owned firms as part of what was meant by “Grasp the Large.”
The question is how the Chinese state chose to exercise its right of con-trol over the industrial groups and, in particular, what criteria it used to reward and punish the groups’ senior executives. In 2003, the State-Owned Assets Supervision and Administration Commission (SASAC) was set up
7. The SAIC Group also owns other companies, but the biggest company under its con-trol is SAIC Motor Co., Ltd.

CHANG-TAI HSIEH and ZHENG (MICHAEL) SONG 301
as the legal owner of the state-owned groups.8 This body was set up simul-taneously at the central- and local-government levels. However, the ulti-mate hiring and firing authority was kept in the hands of the Communist Party’s Organization Department. We have little information on how the Organization Department exercised its authority. What we can do is mea-sure the performance of these firms, which we do in the rest of section I.
I.B. State Ownership
Identifying state-owned firms is key to our analysis. A common way to identify state ownership in China is through the firm’s legal registra-tion. Specifically, firms in China are legally registered as state-owned, collectively owned, privately owned, limited-liability corporations, share-holding firms (including publicly traded), or foreign firms. In this system of classification, state ownership is typically defined as being legally reg-istered as state-owned.
There are two problems with using a firm’s legal registration to identify ownership, particularly for state-owned firms. First, many firms that are ultimately state-owned are legally registered as foreign firms. This can happen because firms in which at least a third of the ownership is foreign-held can be registered as foreign firms. For example, the joint ventures of the Shanghai local government with GM and Volkswagen (Shanghai-GM and Shanghai-Volkswagen) are registered as foreign firms. This can also happen when the firm is owned by a holding company registered outside of mainland China. For example, Lenovo and China National Offshore Oil Corporation (CNOOC) (a state-owned oil company) are owned by holding companies registered in Hong Kong and, thus, legally registered as foreign firms in China.
Second, many state-owned firms, particularly since 1998, are registered as limited-liability or publicly traded companies, albeit with the control-ling stake held by a state-controlled holding company. The Baoshan Steel Company and SAIC Group’s stand-alone car company (SAIC Motor Co., Ltd.) are examples of publicly listed companies and thus are registered as share-holding companies. However, for both companies a controlling stake is held by a holding company owned by the Chinese state (the central
8. With the exception of state-owned tobacco companies and state-owned financial institutions, ownership of all state-owned groups was transferred to the SASAC in 2003. Tobacco companies are controlled by the State Tobacco Monopoly Administration and finan-cial institutions by a holding company (Huijin) controlled by China’s Banking Regulatory Commission.
302 Brookings Papers on Economic Activity, Spring 2015
government in the case of Baoshan and the local Shanghai government in the case of SAIC).
Instead of using the firm’s legal registration to identify state ownership, we use another approach. First, our data provide the shares of the firm’s registered capital that are owned by the state, by a collective, by “private persons,” by foreigners, and by “legal persons.” Here, a legal person can be another firm or a holding company. For example, publicly traded state-owned firms such as Baoshan and SAIC typically have a minority share of their registered capital held by private persons (the publicly traded share) and a majority share held by a legal person (the state-owned parent holding company). Our data do not provide additional information on the identity of such legal persons, but the share of the registered capital owned by legal persons in the Chinese industrial sector has increased since 1998, particularly among large firms.9 Second, our data provide information on the firm’s controlling shareholder. In particular, they classify the control-ling shareholder of the firm as either the state, a collective, a foreigner, or a private person.
We use these two variables to define state-owned firms. Specifically, we define a firm as state-owned when the share of registered capital held directly by the state exceeds or equals 50 percent or when the state is reported as the controlling shareholder. The former definition captures traditional state-owned firms when the state owns all or the majority of the firm’s registered capital. The latter definition captures publicly traded firms when the state holds a controlling stake through a holding company, but excludes firms when the state may hold a minority share through a holding company.
We supplemented this definition of state ownership by manually check-ing the websites of all the industrial firms in the top one percentile of the firm-value-added distribution in 2007. We find that virtually all the firms that we identified as state-owned through this laborious procedure are also coded as state-owned using our definition. Interestingly, our forensic analy-sis indicates that of firms in the top one percentile, more than two-thirds are directly or indirectly controlled by SASAC, but almost half of these firms are legally registered as private firms. Our procedure might understate the state share if some companies do not publicly reveal the state’s ownership stake on their websites. On the other hand, we might overstate the state
9. Among the firms that survived from 1998 through 2007, the legal person registered capital share was above 10 percent for 22 percent of them in 1998 and for 30 percent of them by 2007. Among the large firms with the initial value added in the top decile, the shares were 27 and 43 percent in 1998 and 2007, respectively.

CHANG-TAI HSIEH and ZHENG (MICHAEL) SONG 303
share if some SASAC firms are ultimately privately owned but use SASAC to mask their ownership stake. For example, the Sydney Morning Herald reported in 2011 that a large shadow bank in Chongqing (Chongqing Inter-national Trust) legally owned by the local government of Chongqing was in fact privately owned by an associate of the Party Secretary of Chongqing at the time.10
The top panel of figure 1 shows that the revenue share of state-owned firms, by our definition, is similar to that reported by the China Statistical Yearbook. The figure also shows that using the firm’s legal registration to define state ownership would understate the size of the state sector. Figure 2 plots the number of state-owned firms that are registered as private firms as a share of the number of firms we define as state-owned. In 1998, approxi-mately 15 percent of state-owned firms were registered as private firms. By
10. John Garnaut, “Bo Can Do! One Man Does His Bit to Be the Great Will of China,” Sydney Morning Herald, August 7, 2011.
0.1
0.2
0.3
0.4
0.5
Source: Authors’ calculations, based on microdata from China’s Industrial Survey.
2000 2002 2004 2006 2008 2010
Unweighted
Weighted
Figure 2. Share of State-Controlled Firms Registered as Private Firms, 1998–2012

304 Brookings Papers on Economic Activity, Spring 2015
2007, almost half of the state-owned firms were registered as some form of privately owned firm. Among state-owned firms registered as private firms in 2007, approximately 60 percent were registered as limited-liability cor-porations, 16 percent were publicly traded companies, and 18 percent were registered as foreign firms.11 This share has continued to rise since 2007; by 2012 almost 60 percent of the state controlled firms were registered as nonstate firms.
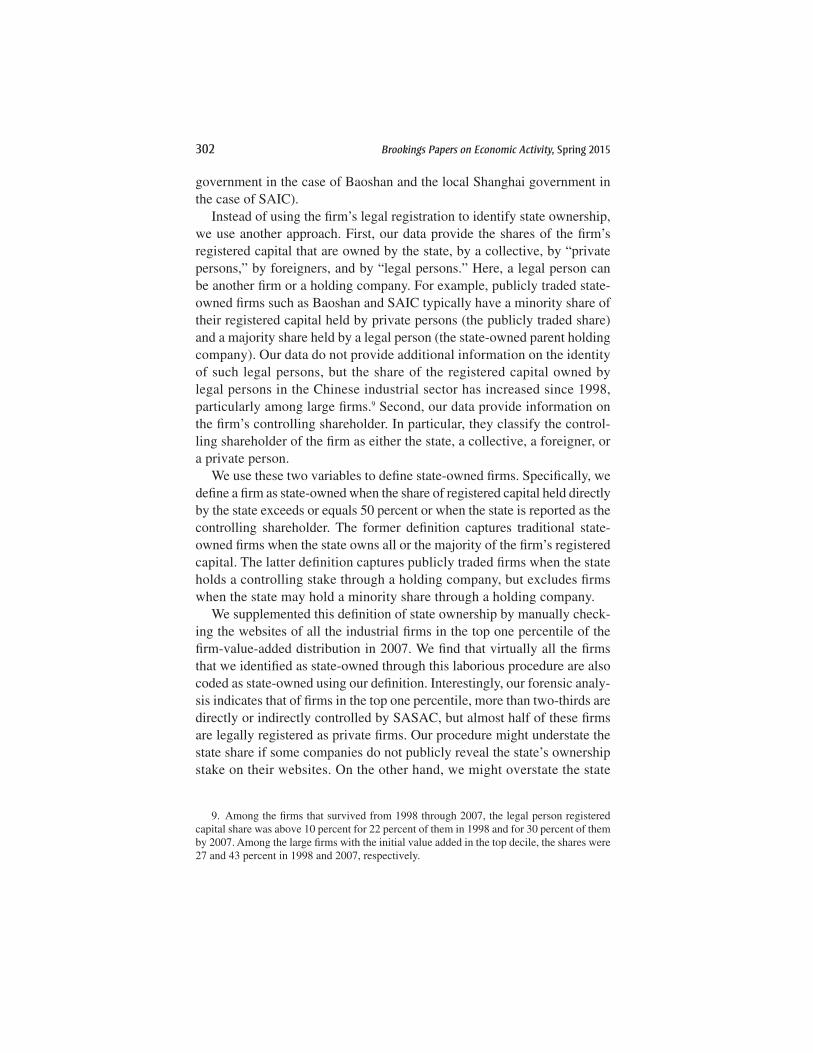
Table 1 presents the number and total employment of the firms in our sample in 1998 and 2007. Table 2 presents similar statistics for the sample in 2007 and 2012.12
I.C. Size, Labor, and Capital Productivity
We use firms’ registration ID provided in the data to match firms over time. The registration ID may change when a firm is restructured or acquired
11. See the online appendix for details. Online appendixes to all papers in this volume may be found at the Brookings Papers web page, www.brookings.edu/bpea, under “Past Editions.”
12. One issue with the data is that because of the size thresholds for inclusion in the sample, some firms that are not in the sample in a given year show up in the data in later years. In table 1, we restrict the 2007 data to firms that were either born after 1998 or that were present in the data in 1998. Similarly, in table 2, we restrict the 2012 sample to firms that were born after 2007 or were present in the data in 2007.
Table 1. Firms and Employment by Ownership, 1998–2007a
No. of firms Employment
State-owned in 1998 Exit by 2007 38.1 15,077 State-owned in 2007 7.6 12,679 Private in 2007 5.0 3,196Private in 1998 Exit by 2007 58.2 11,871 Private in 2007 28.1 8,422State-owned in 2007 Entrant 4.2 2,475 State-owned in 1998 7.6 9,308Private in 2007 Entrant 199.4 30,767 State-owned in 1998 5.0 2,512 Private in 1998 28.1 11,549
Source: Authors’ calculations, based on microdata from China’s Industrial Survey.a. Number of firms and employment is in thousands. Entrants in 2007 are the firms established between
1999 and 2007 (inclusive).
CHANG-TAI HSIEH and ZHENG (MICHAEL) SONG 305
by another firm. For the sample of firms that we cannot match over time with the registration ID, we also use the firms’ names, addresses, and phone numbers to identify surviving firms that changed their registration ID.13 About 95 percent of the panel is identified by the registration ID, while the remainder are matched by firm name, address, and phone number.
The other variables from the 1998–2007 data that we use are value added, employment, and the book value of the firm’s capital stock net of depreciation. We define the real capital stock at time t as
1 ,11K K
BK BK
Pt t
t t
tK
( )= − δ + −−
−
where BK is the book value of capital and PK is the price of capital.14 Labor input is measured by employment, since our data do not include the com-position of the firms’ labor force. However, as a robustness check we use
Table 2. Firms and Employment by Ownership, 2007–12
No. of firms Employment
State-owned in 2007 Exit by 2012 9.2 4,591 State-owned in 2012 8.7 11,437 Private in 2012 1.4 759Private in 2007 Exit by 2012 158.9 20,822 Private in 2012 138.9 36,886State-owned in 2012 Entrant 2.7 1,189 State-owned in 2007 8.7 10,524Private in 2012 Entrant 70.1 15,052 State-owned in 2007 1.4 806 Private in 2007 138.9 50,937
Source: Authors’ calculations, based on microdata from China’s Industrial Survey.
13. We follow the procedure used by Brandt, Van Biesebroeck, and Zhang (2012).14. We use Perkins and Rawski’s (2008) estimates of the price of capital. The initial
book value of capital stock is initial book value reported by the firm for firms established after 1998. For firms founded before 1998, we assume that the book value in 1998 is given by BKt0
= BKt1/(1 + g)t
1−t
0, where BKt0 is the projected initial book value of the capital stock
in year t0; BKt1 is the book value of capital stock when the firm first appears in the data set in
year t1; and g is the average growth rate of the capital stock in the period we observe in the data after year t1.

306 Brookings Papers on Economic Activity, Spring 2015
the firm-level records of the 2004 Economic Census (which has informa-tion on the educational composition of firms’ labor force) to measure dif-ferences in labor quality across firms. The 2012 data do not have the value added or the net book value of the capital stock. In the 2007–12 panel, we use revenues instead of value added and the gross book value of the capital stock instead of the real capital stock.
To control for industry effects, all the firm-level variables we present are, unless otherwise stated, scaled by the median values of surviving pri-vate firms in the same two-digit industry.
EXITERS Table 3 presents the average annual exit rate for state-owned and privately owned firms for the 1991–95, 1998–2007, and 2007–12 time periods.15 The average exit rate for state-owned firms was under one percent a year from 1991 to 1995 and increased to approximately 13 and 16 percent a year in 1998–2007 and 2007–12, respectively. Among private firms, the exit rate was roughly similar across the three time periods, at about 12 to 13 percent a year. Figure 3 presents the average annual exit rate from 1998 to 2007 (top panel) and 2007 to 2012 (bottom panel) of state-owned and private firms for each size bin as defined by the firms’ value added in 1998 and 2007, respectively. Exit rates of smaller state-owned firms are higher than those of comparably sized private firms. The annual exit rate from 1998 to 2007 exceeds 30 percent among state-owned firms in the bottom 10th percentile of the size distribution, about 10 percentage points higher than comparably sized private firms over the same time period. Exit rates for small state-owned firms from 2007 to 2012 are also
Table 3. Annual Exit Rate, 1991–2012Percent
1991–95 1998–2007 2007–12
State-owneda 0.9 13.2 15.8Private 13.2 12.0 13.8
Source: The exit rates from 1998 to 2007 and from 2007 to 2012 are computed from China’s Indus-trial Survey. The exit rate from 1991 to 1995 is computed from the 1996 China Statistical Yearbook and the microdata of the 1995 Industrial Census.
a. State-owned firms that were privatized are not considered exiting firms.
15. The exit rates from 1998 to 2007 and from 2007 to 2012 are computed from the Industrial Survey. The exit rate from 1991 to 1995 is computed from the 1996 China Statisti-cal Yearbook and the microdata of the 1995 Industrial Census. State-owned firms that were privatized are not considered exiting firms. See the online appendix for additional details.

CHANG-TAI HSIEH and ZHENG (MICHAEL) SONG 307
Source: Authors’ calculations, based on microdata from China’s Industrial Survey. a. Based on ownership in 1998; size is value added in 1998.b. Based on ownership in 2007; size is value added in 2007.
5
10
15
20
25
30
10 25 50
Size percentile in initial year
Size percentile in initial year
75 90 99
1998−2007a
5
10
15
20
25
30
10 25 50 75 90 99
State-owned
Private
2007−12b
Percent
Percent
Figure 3. Annual Exit Rate, 1998–2007 and 2007–12

308 Brookings Papers on Economic Activity, Spring 2015
higher than those of comparably sized private firms over the same period, but the difference is not as large as in the earlier period (1998 to 2007).
Table 4 quantifies the characteristics of state-owned firms in 1998 (rela-tive to private firms that survived until 2007). Comparing the first row (exit-ing state-owned firms) with the third row (surviving state-owned firms), we can see that value added, labor productivity, and capital productivity are generally lower among exiting state-owned firms than among surviv-ing state-owned firms. These patterns are roughly consistent with the goal implicit in the slogan “Let Go of the Small,” although the implementation seems far from perfect. Many small state-owned firms were not closed and some large state-owned firms were closed.
SURVIVORS We now turn to the balanced panel of firms between 1998 and 2007 and between 2007 and 2012. We focus on three groups of surviv-ing firms in the two balanced panels: state-owned, privatized state-owned, and private firms.
We begin with the balanced panel of firms between 1998 and 2007. Fig-ure 4 plots the fraction of the state-owned firms that were privatized over the two time periods. Specifically, figure 4 plots the annual average over each time period of the fraction of state-owned firms that were privatized from 1998 to 2007 (top panel) and from 2007 to 2012 (bottom panel) in bins defined by percentiles of the firms’ value added in 1998 (top panel) and
Table 4. Firm Characteristics by Ownership, 1998a
(Weighted mean relative to surviving private firms)
Value-addedb Value-added/worker c Value-added/capitald
State-owned in 1998 Exit by 2007 −0.830 −1.155 −1.250
(0.013) (0.009) (0.011) Privatized by 2007 0.288 −0.536 −0.870
(0.021) (0.015) (0.018) State-owned in 2007 1.128 −0.518 −1.060
(0.017) (0.012) (0.014)Private in 1998 Exit by 2007 −0.578 −0.191 0.107
(0.012) (0.009) (0.010)
Source: Authors’ calculations, based on microdata from China’s Industrial Survey.a. The reference group in each column is private firms in 1998 that survived until 2007. All observa-
tions are weighted by employment. Standard errors are in parentheses.b. Value added is log value added,c. Value added/worker is log value added per worker.d. Value added/capital is log value added per unit of capital.

CHANG-TAI HSIEH and ZHENG (MICHAEL) SONG 309
Source: Authors’ calculations, based on microdata from China’s Industrial Survey. a. Number of state-owned firms in 1998 that were private in 2007 relative to the number of state-owned firms
in 1998 that survived until 2007 (including state-owned firms in 1998 that were privatized by 2007) divided by nine (number of years between 1998 and 2007). Size is value added in 1998.
b. Number of state-owned firms in 2007 that were private in 2012 relative to the number of state-owned firms in 2007 that survived until 2012 divided by five (number of years between 2007 and 2012). Size is value added in 2007.
Size percentile in initial year
Size percentile in initial year
1998−2007a
2007−12b
Percent
Percent
1
2
3
4
5
10 25 50 75 90 99
1
2
3
4
5
10 25 50 75 90 99
Figure 4. Annual Privatization Rate of State-Owned Firms, 1998–2007 and 2007–12

310 Brookings Papers on Economic Activity, Spring 2015
2007 (bottom panel). From 1998 to 2007, there is an inverse U-shaped rela-tionship between the probability of privatization and the initial size of the state-owned firms in 1998. Although the goal was that small state-owned firms were to be closed or privatized (“let go”), many of the smallest state-owned firms were kept under state control. From 1998 to 2007, only 30 to 35 percent of the surviving state-owned firms in the bottom decile of the size distribution were privatized. The privatization rate is highest among midsized state-owned firms and lowest among the largest state-owned firms, which is consistent with the officially stated goal that large firms were to be kept under state control (“grasped” by the Chinese state). But again, implementation was highly imperfect, as many small state-owned firms were not privatized or closed.
The pattern of privatization from 2007 to 2012 is different in two respects. First, the overall privatization rate is lower than from 1998 to 2007. Second, there is no longer the inverse U shape seen in the earlier period. The probability of privatization after 2007 strictly decreases accord-ing to the initial size of the state-owned firms in 2007.
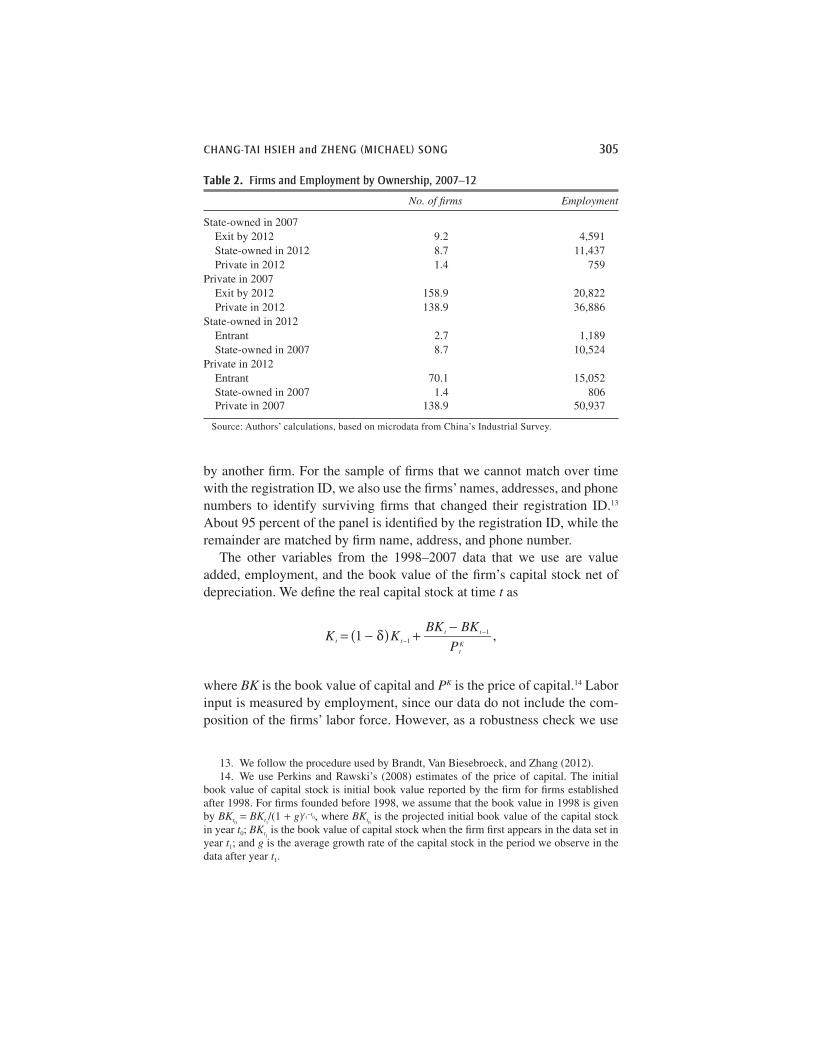
Figure 5 presents the distribution of employment by value added among state-owned (top panel) and privatized firms (bottom panel) in 1998 and 2007. The size distribution of state-owned and privatized firms shifted slightly to the left from 1998 to 2007, relative to the value added of private firms in each year. Furthermore, the change in size distribution is similar for state-owned and privatized firms.
Figure 6 plots the corresponding distribution of employment by labor productivity (value added/employment) in 1998 and 2007. The figure shows that the labor productivity of the two groups of state-owned firms was significantly lower than that of private firms in 1998. The difference in 1998 was about 40 percent (table 4). By 2007, the gap in labor productiv-ity had narrowed significantly, about equally for firms that remained under state control and those that were privatized by 2007. Table 4 quantifies the characteristics of state owned firms in 2007 relative to incumbent private firms (firms that were also in operation in 1998). The difference in labor productivity between the two groups of firms narrowed between 1998 and 2007, rising from about 60 percent of the labor productivity of private firms in 1998 to 75 percent in 2007.
Figure 7 plots the distribution of capital productivity (value added/capital). The capital productivity of state-owned firms is also significantly lower than that of private firms in 1998. Table 4 indicates that the aver-age capital productivity of state-owned firms was about 35 percent of that of private firms in 1998. By 2007, the gap in capital productivity had
CHANG-TAI HSIEH and ZHENG (MICHAEL) SONG 311
Source: Authors’ calculations, based on microdata from China’s Industrial Survey. a. Sample is the balanced panel from 1998 to 2007. Size is measured by firm value added normalized by mean
of value added of private firms in each year. Observation for each firm is weighted by employment. b. State-owned firms are state-owned in 1998 and 2007. c. Privatized firms are state-owned in 1998 and privately owned in 2007.
Value added (mean private firms = 1)
Value added (mean private firms = 1)
State-owned firmsb
Privatized state-owned firmsc
Density of employment
Density of employment
0.05
0.10
0.15
1⁄16 1⁄4 1 4 16 64 256
0.05
0.10
0.15
1⁄16 1⁄4 1 4 16 64 256
1998
2007
1998
2007
Figure 5. Value Added of State-Owned and Privatized Firms, 1998 and 2007a

312 Brookings Papers on Economic Activity, Spring 2015
Source: Authors’ calculations, based on microdata from China’s Industrial Survey. a. Sample is the balanced panel from 1998 to 2007. Labor productivity is normalized by employment weighted
mean of labor productivity of surviving private firms in each year. Observation for each firm is weighted by firm employment. See figure 5 notes for definition of state-owned and privatized state-owned firms.
Value added per worker (mean private firms = 1)
Value added per worker (mean private firms = 1)
State-owned firms
Privatized state-owned firms
Density of employment
Density of employment
0.10
0.20
0.30
0.10
0.20
0.30
1⁄8 1⁄4 1⁄2 1 2 4 8
1⁄8 1⁄4 1⁄2 1 2 4 8
1998
2007
1998
2007
Figure 6. Labor Productivity of State-Owned and Privatized Firms, 1998 and 2007a

CHANG-TAI HSIEH and ZHENG (MICHAEL) SONG 313
Source: Authors’ calculations, based on microdata from China’s Industrial Survey. a. Sample is the balanced panel from 1998 to 2007. Labor productivity is normalized by employment weighted
mean of labor productivity of surviving private firms in each year. Observation for each firm is weighted by firm employment. See figure 5 notes for definition of state-owned and privatized state-owned firms.
Value added/capital (mean private firms = 1)
Value added/capital (mean private firms = 1)
State-owned firms
Privatized state-owned firms
Density of employment
Density of employment
0.10
0.20
0.30
0.10
0.20
0.30
1⁄8 1⁄4 1⁄2 1 2 4
1⁄8 1⁄4 1⁄2 1 2 4
1998
2007
1998
2007
Figure 7. Capital Productivity of State-Owned and Privatized Firms, 1998 and 2007a

314 Brookings Papers on Economic Activity, Spring 2015
narrowed slightly: capital productivity of state-owned firms was then about 47 percent of that of private firms (table 5). And, perhaps surprisingly, there was still a significant gap in capital productivity between privatized and private firms in 2007.
The fact that the size distribution of state-owned and privatized firms shifted to the left suggests that the effects may have been different for small compared with large state-owned firms. When we look explicitly at growth rates for firms of different sizes (based on their size in 1998), we find that state-owned firms that were small (large) in 1998 grew at a slower (faster) rate compared to private firms with the same initial size. The heterogene-ity across the size distribution carries over when we look at relative labor productivity growth but is less pronounced for the relative capital produc-tivity growth. This evidence suggests that despite the government’s goal of converting surviving state-owned firms into profit-maximizing firms, among those that remained under state control this may have only hap-pened among the larger state-owned firms.
We end this section by showing the changes in revenues, labor produc-tivity, and capital productivity among state-owned firms operating in 2007 and in 2012. The main limitation is that the 2012 data do not include firm value added or the net book value of the capital stock. In the absence of these data, we measure firm size by revenues, labor productivity as the ratio of revenues to employment, and capital productivity as the ratio of revenues
Table 5. Firm Characteristics by Ownership, 2007a
(Weighted mean relative to surviving private firms)
Value addedb Value added/worker c Value added/capitald
State-owned in 2007 Entrant 0.526 0.107 −0.282
(0.022) (0.015) (0.016) State-owned in 1998 0.812 −0.322 −0.751
(0.015) (0.010) (0.012)Private in 2007 Entrant −1.035 −0.065 0.460
(0.009) (0.006) (0.007) State-owned in 1998 −0.003 −0.278 −0.557
(0.020) (0.013) (0.015)
Source: Authors’ calculations, based on microdata from China’s Industrial Survey.a. The reference group is surviving private firms in 2007 (that also existed in 1998). All observations are
weighted by employment. Entrants are firms established after 1998. Standard errors are in parentheses.b. Value added is log value added.c. Value added/worker is log value added per worker.d. Value added/capital is log value added per unit of capital.

CHANG-TAI HSIEH and ZHENG (MICHAEL) SONG 315
to the gross book value of the capital stock. We present the distribution of revenues, labor productivity, and capital productivity of state-owned firms in 2007 and 2012 in figure 8 (normalized by the relevant statistic of incum-bent private firms). To be clear, the sample is the balanced panel of firms that were operating and state-owned during those two years. As can be seen in the top panel, relative size of incumbent state-owned firms was roughly the same in 2012 compared to 2007. The middle panel shows that aver-age labor productivity of the state-owned firms continued to increase from 2007 to 2012 relative to incumbent private firms, albeit at a lower rate than in the 1998 to 2007 period. Finally, the bottom panel shows that there is little convergence in capital productivity after 2007.
ENTRANTS We now turn to entrants. In the 1998–2007 panel, entrants are defined as firms created after 1998. Table 1 indicates that such entrants account for about a third of the state-owned firms in 2007. In terms of employment, state-owned entrants account for more than 20 percent of total employment of state-owned firms in 2007. Figure 9 plots the distri-bution of value added (top panel), labor productivity (middle panel), and capital productivity (bottom panel) of state-owned entrants and private entrants. As before, we normalize by the corresponding statistic for sur-viving private firms. The top panel shows that new state-owned firms are significantly larger than new private firms. The middle panel shows that the labor productivity of new state-owned firms and new private firms is about the same as that of surviving private firms. The bottom panel shows that the capital productivity of new state-owned firms is lower than that of surviving private firms, while the capital productivity of new private firms is about the same.
Table 2 indicates that state-owned entrants in 2012 (defined as state-owned firms created after 2007) account for about 10 percent of employ-ment among state-owned firms in 2012. On an annualized basis, the entry rate of state-owned firms is only slightly lower in 2007–12 compared to the entry rate in 1998–2007.16 Figure 10 plots the distribution of revenues (top panel), labor productivity (middle panel), and capital productivity (bottom panel) of new state-owned firms and private firms in 2012. As in 2007, the labor productivity of new state-owned firms is about the same as in new private firms and capital productivity is lower in new state-owned firms. What is different is that new state-owned firms are now much bigger rela-tive to new private firms (compared to 2007).
16. 10 percent over 5 years = 2 percent per year in 2007–12, whereas 21 percent over 9 years = 2.3 percent per year in 1998–2007.

316 Brookings Papers on Economic Activity, Spring 2015
Source: Authors’ calculations, based on microdata from China’s Industrial Survey. a. Sample is firms in 2007 established after 1998. Observations are weighted by employment and normalized
by weighted mean of incumbent private firms in 2007.
Revenue
Labor productivity (revenue/worker)
Capital productivity (revenue/capital)
Density of employment
Density of employment
Density of employment
0.05
0.10
0.10
0.20
0.10
0.20
0.15
Mean incumbent private firms = 1
Mean incumbent private firms = 1
Mean incumbent private firms = 1
1⁄4 1⁄2 1 2 4 8 16 32 64 128 256 512
2007
2012
1⁄8 1⁄4 1⁄2 1 2 4 8 16
1⁄8 1⁄4 1⁄2 1 2 4
2007
2012
2007
2012
Figure 8. Size and Productivity of State-Owned Firms, 2007 and 2012a

CHANG-TAI HSIEH and ZHENG (MICHAEL) SONG 317
Source: Authors’ calculations, based on microdata from China’s Industrial Survey. a. Sample is the balanced panel of state-owned firms from 2007 to 2012. Observation for each firm is weighted
by employment and normalized by weighted mean of surviving private firms in each year. State-owned firms are state-owned in 2007 and 2012.
Density of employment
Density of employment
Density of employment
0.05
0.10
0.10
0.20
0.10
0.20
0.15
Mean incumbent private firms = 1
1⁄32 1⁄8 1⁄2 2 8 32
Mean incumbent private firms = 1
1⁄8 1⁄4 1⁄2 1 2 4 8 16
State-owned
Private
State-ownedPrivate
Mean incumbent private firms = 1
1⁄8 1⁄4 1⁄2 1 2 4 8 16
Size (value added)
Labor productivity (value added/worker)
Capital productivity (value added/capital)
State-owned Private
Figure 9. Size and Productivity of Entrants in 2007a

318 Brookings Papers on Economic Activity, Spring 2015
Source: Authors’ calculations, based on microdata from China’s Industrial Survey. a. Sample is firms in 2012 established after 2007. Observations are weighted by employment and normalized
by weighted mean of surviving private firms in 2012.
Revenue
Revenue/worker
Revenue/capital
Density of employment
Density of employment
Density of employment
0.05
0.10
0.10
0.20
0.05
0.15
0.20
0.10
0.15
0.20
Mean incumbent private firms = 1
Mean incumbent private firms = 1
Mean incumbent private firms = 1
1⁄4 1⁄2 1 2 4 8 16 32 64 128 256 512
State-owned
Private
1⁄8 1⁄4 1⁄2 1 2 4 8 16
1⁄16 1⁄8 1⁄4 1⁄2 1 2 4 8
State-owned
Private
State-owned
Private
Figure 10. Size and Productivity of Entrants in 2012a

CHANG-TAI HSIEH and ZHENG (MICHAEL) SONG 319
I.D. Main Facts
The main facts may be summarized as follows.Exit rates: Exit rates increased after 1998 among state-owned firms,
particularly for small state-owned firms.Privatization: Large state-owned firms were kept mostly under state
control, but the smallest state-owned firms that survived were also kept under state ownership. Midsized state-owned firms were the most likely to be privatized from 1998 to 2007. After 2007, privatization rates declined on average but increased for small state-owned firms.
State-owned vs. privatized firms: The performance of the average state-owned firm is similar to that of the average privatized firm. For both groups of firms, from 1998 to 2007, the labor productivity gap with surviving pri-vate firms narrowed significantly and the capital productivity gap narrowed by much less. Capital productivity was still less than 50 percent of that of private firms. The growth of labor productivity of state-owned firms relative to that of private firms slowed down after 2007. There was little conver-gence in capital productivity from 2007 to 2012.
Small vs. large state-owned firms: The labor productivity gap with sur-viving private firms narrowed significantly between 1998 and 2007 for large state-owned firms and widened for small state-owned firms.
New state-owned firms: Many new state-owned firms were established after 1998. New state-owned firms are larger, have the same labor produc-tivity, and have lower capital productivity compared to new private firms.
II. A Model-Based Accounting Framework
This section presents a standard model of heterogeneous firms with mono-polistic competition. We use this framework to quantify the effect of the dif ferent forces behind China’s growth. Aggregate output is a constant-elasticity-of-substitution (CES) aggregate of the output of individual firms,
1 .1
1
1
Q Qii
N
∑( )( ) = −η−η
Here, i indexes the firm; N is the number of firms; Qi is firm output; and 1/η > 1 is the elasticity of substitution between varieties. Firm output is given by
,1Q A K Li i i i= α −α
where Ai denotes firm-specific total factor productivity (TFP).

320 Brookings Papers on Economic Activity, Spring 2015
Each firm chooses factor inputs, output, and revenue to maximize cur-rent profits
2 1 1 ,PQ wL rKi i i iL
i iK
i( ) ( )( ) π = − + τ − + τ
where Pi is the firm-specific output price; Li and Ki denote labor and capi-tal inputs; w and r denote the common undistorted cost of labor and capital; and τL
i and τKi denote firm-specific distortions to the cost of labor and
capital. To be clear, we do not believe that τLi and τK
i are necessarily explicit taxes or subsidies. Rather, they are a stand-in for a variety of departures from standard competitive markets, such as preferential access to capital for certain types of firms or political pressures to main-tain employment within state-owned firms.
Profit maximization yields these standard first-order conditions:
3 1 1 1 ,MPLPQ
Lwi
i i
i
iL( ) ( )( ) ( )≡ − α − η = + τ
4 1 1 .MPKPQ
Kri
i i
i
iK( ) ( )( ) ≡ α − η = + τ
This says that the values of the marginal product of labor (MPLi) and the marginal product of capital (MPKi) are proportional to average labor pro-ductivity and capital productivity, respectively. Crucial to this result is the assumption of common markups and capital elasticities. Furthermore, mar-ginal and average products of labor and capital are higher in firms with higher labor and capital costs, as represented by τL
i and τKi.
Equilibrium allocations are as follows:
51 1
,1
1
PQA
i ii
iK
iL( ) ( )
( ) ∝+ τ + τ
⎛⎝⎜
⎞⎠⎟α −α
−ηη
61
1 1 1,1
1
LA
i
iL
i
iK
iL( ) ( )
( ) ∝+ τ + τ + τ
⎛⎝⎜
⎞⎠⎟α −α
−ηη
71
1 1 1.1
1
KA
i
iK
i
iK
iL( ) ( )
( ) ∝+ τ + τ + τ
⎛⎝⎜
⎞⎠⎟α −α
−ηη
CHANG-TAI HSIEH and ZHENG (MICHAEL) SONG 321
It is useful to combine equations 3, 4, and 5 to express firm revenue in terms of variables that can be measured in the data:
8 .1
1
PQA
PQ
L
PQ
K
i ii
i i
i
i i
i
( ) ∝⎛⎝⎜
⎞⎠⎟
⎛⎝⎜
⎞⎠⎟
⎡
⎣
⎢⎢⎢⎢
⎤
⎦
⎥⎥⎥⎥
α −α
−ηη
This says firm revenue is increasing in Ai and decreasing in average labor and capital productivity. Intuitively, the firms with high labor and capital productivity are the ones with high marginal products of labor and capital, which reduce input demand and firm size (holding Ai fixed).
Equation 3 interprets low average product of labor as reflecting low marginal product of labor. However, consider a production function that incorporates overhead labor, fi:
9 .1Q A K L fi i i i i( )( ) = −α −α
Here, fi has a straightforward interpretation for state-owned firms: It repre-sents the redundant workers who produce zero marginal product but cannot be fired. With overhead labor, the marginal product of labor is no longer proportional to the average product of labor. We denote τ̂L
i as the distortions that affect MPL, while τ L
i still stands for the distortions that affect labor productivity. To see the relationship between the two distortions, the first-order condition for labor can be expressed this way:
10 1 1 1 ˆ .PQ
L
f
Li i
i
iL i
i
iL( )( ) ∝ + τ = −⎛
⎝⎜⎞⎠⎟
+ τ
The gap in the average product of labor, as represented by τ Li , can be
decomposed into two components: fi and τ̂ Li . A reduction in fi will not
affect the marginal product of labor but will increase the average product. In what follows, we will note wherever the distinction matters between the marginal-product and the overhead-cost interpretations of the average product.
To close the model, we assume labor supply is fixed (and normalized to one). In addition, we assume r is exogenous and given by the world interest
322 Brookings Papers on Economic Activity, Spring 2015
rate. We later consider an alternative where the supply of capital in China is fixed.
After we impose profit maximization and market clearing, aggregate output is
11 * ,1
1
1
Y N A Z( )( ) =η−η
−α
where
* 1,
* ,
* 1* ,
,
,
1
1
1
1
11
1
AN
A
ZMP
MPY
YN
A
A
MP MPK MPL
MP r MPL
ii
i
i
ii
i i i
∑
∑
( )≡
≡ ⎛⎝⎜
⎞⎠⎟
⎡
⎣
⎢⎢
⎤
⎦
⎥⎥
≡ ⎛⎝
⎞⎠
≡
≡
η−η
−ηη
α −α
α−α
−ηη
η−η
−ηη
and MPL denotes the average marginal product of labor.
The first term, ,1Nη−η in equation 11 is the standard variety effect. More
entry and less exit, all else equal, will increase aggregate output. The sec-ond term, A*, is a harmonic mean of firm TFP and reflects the direct effect of firm TFP. The third term, Z, measures the effect of resource misalloca-tion: more dispersed marginal products across firms, all else equal, lower the aggregate output. This term equals one when the marginal product of labor and capital is the same across firms. The exponent, 1 1 ,− α measures the effect of endogenous capital accumulation. If we drop the assumption that the cost of capital is exogenous and, instead, assume a fixed supply of capital, this effect would not be there and the exponent would be one.
To see the effect of entry and exit on aggregate growth between times t and t + 1, we group firms into those that exit after year t, those that enter between t and t + 1, and incumbent firms that exist during the two years, and we denote each group by these subscripts: exit for the exiting firms, ent

CHANG-TAI HSIEH and ZHENG (MICHAEL) SONG 323
for the entering firms, and inc for the incumbent firms. The ratio of aggre-gate output at time t + 1 to aggregate output at time t is:
Y
Y
N A ZMP
MPt
t
ent t ent t ent t
t
ent+
+ + +
+
=1
1 1 1
1
, , ,
,
*tt
inc t inc t inc t
tN A Z
MP
+
−
+ + +
⎛⎝⎜
⎞⎠⎟
+1
1
1 1 1
ηη
, , ,* ++
+
−
⎛⎝⎜
⎞⎠⎟
1
1
1
MP
N A Z
inc t
exit t exit t exit
,
, , ,*
ηη
tt
t
exit t
inc t inc t inc t
MP
MPN A Z
,
, , ,*⎛
⎝⎜⎞⎠⎟
+
−1 ηη MMP
MP
t
inc t,
⎛⎝⎜
⎞⎠⎟
⎡
⎣
⎢⎢⎢⎢⎢⎢
⎤
⎦
⎥⎥⎥⎥⎥⎥
−
−
1
11
1
ηη
ηη −−
( )
α
,
12
Here, A* is a harmonic mean of firm TFP and N the number of firms of each group (exiters, entrants, and incumbents), Z is the index of allocative efficiency within each group of firms, and MP denotes the weighted aver-age of the marginal product of each group. We can use equation 12 to map the effect of entry and exit of state-owned firms on aggregate growth.
The effect of exit on aggregate productivity growth can be seen by
adding *,
1
N A Z MP MPexit exit exit exit( )−ηη to Yt+1, as if the exiters survived at t + 1.
There are two main effects. First, exit implies a loss of varieties, and the effect on aggregate output is given by the product of the number of exiting firms Nexit and the productivity of the average exiting firm A*
exit .Second, exit may also affect overall allocative efficiency. The term Zexit
captures the allocative efficiency among exiters. The effect on the alloca-tive efficiency between exiters and incumbents is captured by ,MP MPexit which measures the gap between the marginal product among exiters and the average marginal product among all firms in the economy. If the marginal product of resources used by the exiting firm is equal to the aver-age marginal product, then the envelope theorem applies and there is no net welfare gain from the reallocation of resources. In that case, the effect of exit on aggregate output is unambiguously negative. However, if the mar-ginal product of exiting firms is lower than the average marginal product— when 1MP MPexit > —then the reallocation of resources from exiting firms increases MP and therefore increases aggregate output. The net effect on aggregate output depends on whether the gain from reallocation exceeds the direct effect of the loss of productive firms.
The mechanisms by which entry affects aggregate growth are similar.
Here, the effect of entrants is captured by * ., 1 , 1 , 1 1 , 1
1
N A Z MP MPent t ent t ent t t ent t( )+ + + + +
−ηη
First, the direct effect of entry on aggregate growth is given by Nent A*ent.
More entry, and entry of more productive firms, increases aggregate
324 Brookings Papers on Economic Activity, Spring 2015
output. In addition, there can be general equilibrium effects on other firms depending on the gap between the marginal product of entrants relative to the average, which is captured by .1 , 1MP MPt ent t+ + When the marginal product of entrants is the same as that of other firms, the envelope theorem applies again and there is no additional effect of entry. However, when the marginal product of entrants exceeds the average—when 1MP MPent < — the reallocation of resources toward entrants improves overall resource allocation, which increases aggregate output.
We can also use equation 12 to analyze the effect of incumbent firms on aggregate growth. The effect of incumbent firms on aggregate out-
put growth is given by * ., 1 , 1 , 1 1 , 1
1
N A Z MP MPinc t inc t inc t t inc t( )+ + + + +
−ηη For instance,
privatization of state-owned firms may improve firm TFP, and the effect on aggregate output is given by
� ���� �����13
1
1
1.
the direct effect the reallocation effect
Y
A
Y
A
L
AMPL MPL
i
i
i
i
i
i( )( ) ∂∂
=− α
+η
−⎡
⎣
⎢⎢⎢
⎤
⎦
⎥⎥⎥
The first term of equation 13 captures the effect of Ai on the productivity of the representative firm, holding the efficiency of resource allocation fixed. We think of this as the direct effect of TFP. The second term measures the effect of higher firm TFP on the efficiency of resource allocation. The re - allocation effect is negative if the firm’s MPL is below the average MPL, and it is positive otherwise. Intuitively, labor is reallocated to firms with higher TFP. This reallocation has no effects on allocative efficiency if the firm’s marginal product of labor is the same as that of other firms. This would be the case if the average product of labor of the firm that experiences TFP growth is the same as the average, or if the gap in the average product of labor entirely reflects overhead costs rather than differences in the marginal cost of labor. However, if the marginal product of labor in the firm is lower than the average, higher TFP increases employment in the low-marginal-product firm, which worsens the overall efficiency of resource allocation. If the gap in marginal products is sufficiently large, the negative reallocation effect can dominate the technological effect. Specifically, equation 13 can be expressed as:
141
1
1,
Y
A
L
AMPL MPL
i
i
i
i( )( ) ∂∂
=− α χη
− χ

CHANG-TAI HSIEH and ZHENG (MICHAEL) SONG 325
where 1 1
1 11.
( )( )( )
χ ≡ − η − α− α − η
< If ,MPL MPLi < χ an increase in the firm’s
TFP will lower aggregate output. Whether higher TFP increases or lowers aggregate output depends on the gap between the firm’s MPL and the aver-age marginal product (and the value of χ).
Privatization may also change the gap in the average product of capital and labor of the privatized firms (relative to the other firms). In equation 12 this is captured by the change in .MP MPinc For example, if state-owned firms had been forced to employ more workers than necessary, the aver-age product of labor of state-owned firms could decline after they were privatized and no longer faced political constraints to keep unproductive workers on the payroll. Similarly, privatized state-owned firms might no longer have preferential access to capital, which is modeled here as a decline in τi
K. The effect of a change in the gap in MPL relative to the aver-age on aggregate output is given by
151
1.
Y LMPL MPL
iL
i
iL i( )( ) ∂
∂τ= − − α
χη + τ−
This says that a narrowing of the gap between a firm’s average product of labor and the overall average product of labor always increases aggre-gate output. Although equation 15 assumes that the change in the average product of labor is driven by a change in marginal labor costs, the effect on aggregate output would be the same if the change in the average product of labor were driven by the elimination of redundant labor in state-owned firms. Similarly, the effect on aggregate output of a change in a given firm’s MPK follows:
161
.Y L
MPL MPLiK
i
iK i( )( ) ∂
∂τ= − α
χη + τ− χ
The reason this looks different from the effect of changes in MPL is the assumption that capital is available elastically at world interest rates. A decline in MPK of a firm is like a positive TFP shock, and the TFP shock can have a negative effect on aggregate output if it significantly worsens the allocation of labor.
The “corporatization” of state-owned firms could have two effects on aggregate output. First, firm TFP could increase, although the effect of an improvement in firm TFP on aggregate output is ambiguous and would

326 Brookings Papers on Economic Activity, Spring 2015
depend on whether the direct effect of higher TFP exceeded the effect of changes in resource allocation. Second, state-owned firms could increase their average product of labor by shedding surplus labor, which would unambiguously increase aggregate output.
In this paper, we use equation 12 to measure the effect on aggregate output of three forces: (i) exit and privatization of state-owned firms; (ii) “corporatization” of incumbent state-owned firms; and (iii) entry of new state-owned firms. To be sure, these three forces will only explain (in a proximate sense) a fraction of the aggregate output growth in China’s indus-trial sector. The residual is aggregate growth driven by the private sector.
Measuring the components of this residual is beyond the scope of this paper, but equation 12 also lays out what these components might be. First, there is the effect of the entry of new private firms, an effect that is increasing in both the number and the productivity of the new private firms. Second, there is the direct effect of the productivity growth of incumbent private firms. Third, if the marginal product of private firms is higher than that of state firms, private entry and productivity growth will have the addi-tional effect of improving the allocation of resources. Fourth and finally, private sector growth can also be driven by an improvement in the effi-ciency of resource allocation within private firms (such as due to an overall improvement in the efficiency of capital markets).
Finally, it is useful to compare the data-inference exercise based on equation 12 with a commonly used accounting decomposition of aggregate growth. There are many variants of this decomposition, but a common one decomposes growth in aggregate output per worker into growth due to re - allocation toward firms with high output per worker and growth in output per worker within each group of firms.17 The former is interpreted as the gain from reallocation, and the latter as firm TFP growth. Specifically, in a model where labor is the only factor of production, aggregate growth in output per worker y is given by
171
1.1 , 1 1 , 1 1
, ,
y
y
y l y l
y l y lt
t
ent t t inc t t
exit t t inc t t
( )( )
( ) =− +
− ++ + + + +
As before, the subscripts ent, exit, and inc refer to entrants, exiters, and incumbents, and l refers to the employment share of incumbent firms.
17. This decomposition was first used by Baily, Hulten, and Campbell (1992). See Brandt, Van Biesebroeck, and Zhang (2012) for an application of this decomposition to pro-ductivity growth in China.

CHANG-TAI HSIEH and ZHENG (MICHAEL) SONG 327
Equation 17 suggests the following inferences from the microdata. First, reallocation increases aggregate output when the employment share of high y firms increases, and it decreases aggregate output otherwise. For example, firm exit increases aggregate output only if the output per worker of exiting firms is lower than that of incumbent firms. Among incumbent firms, an increase in the employment share of private firms raises aggregate output if the output per worker of private firms is higher than that of state-owned firms. Second, the change in output per worker of a group of firms (such as incumbent firms, state-owned firms, or private firms) would be interpreted as the result of TFP growth. For example, if output per worker growth is higher among private firms compared to state-owned firms, then TFP growth must have been higher among private firms compared to state-owned firms.
The inferences based on equation 12 differ in both aspects. First, the equation also indicates that reallocation toward high y firms or sectors increases aggregate output, but for a different reason. In the equilibrium model of heterogeneous firms, such reallocation increases aggregate out-put by lowering the dispersion in the marginal product of resources across firms and not by increasing the employment share of high TFP firms. In fact, an increase in the employment share of high TFP firms could lower output if the marginal product of resources of high TFP firms were low. Second, we interpret an increase in y of a given group of firms as reflecting either an increase in the marginal product or as an elimination of redundant labor and not necessarily as evidence of increases in TFP.
These differences stem from the different assumptions underlying the two approaches. The accounting approach assumes that differences in y across firms reflect firm TFP and is unclear about what exactly drives dif-ferences in the employment share. Our approach assumes that differences in y only reflect differences in the marginal product of labor, while differ-ences in TFP across firms show up as differences in the employment share.
Ultimately the validity of any approach depends on whether the assump-tions are reasonable. Equation 12 is based on a specific equilibrium model of heterogeneous firms. Some of the assumptions (common factor elas-ticities and markups across firms, for example) may be unrealistic, but we can assess whether the results are sensitive to alternative assumptions (see Song and Wu 2014). A decomposition based on equation 17 may also pro-vide the correct answers, but to our knowledge the precise assumptions behind this approach, such as what determines the equilibrium allocation of resources between firms and the conditions under which differences in y reflect differences in firm TFP, have never been spelled out. Understanding

328 Brookings Papers on Economic Activity, Spring 2015
the conditions under which inferences based on equation 17 are correct is an important task that we leave for future work.
III. Productivity and Distortions of State-Owned and Privatized Firms
We now interpret the facts presented in section I through the lens of the model in section II. We apply the model to each industry and then aggre-gate industry output into aggregate output. To capture the industry effects, we allow δ, w, and α to be industry-specific. We also assume the labor force to be fixed in an industry.18
We begin with the differences in labor productivity between state and private firms. According to equation 3, differences in the average product of labor reflect differences in the marginal revenue product of labor. The convergence in labor productivity from 1998 to 2007 between state-owned and private firms shown in figure 6 indicates that the marginal product of labor in state-owned firms converged to that of private firms over this time period.19 Similarly, equation 4 indicates that the gap in the average prod-uct of capital between state-owned and privatized firms relative to private firms reflects differences in the marginal product of capital. Therefore, the evidence in figures 7 and 8 indicates that the marginal product of capital in state-owned firms was lower than that of private firms, and that much of this gap was still present in 2007 and 2012. Furthermore, there is little dif-ference in average product of labor and capital between state-owned firms that remained under state control and those that were privatized. In par-ticular, the marginal product of capital of the privatized firms in 2007 was almost the same as that of the state-owned firms, as if the privatized firms continued to have access to capital on the same terms as the state-owned firms. And among the new state-owned firms, figures 9 and 10 indicate the average product of labor is similar to that of private firms, but the average product of capital is substantially lower.
The fact that the average product of capital is lower among state-owned and privatized state-owned firms, and has remained low, is not surprising if the low average product of capital reflects low marginal product of capital. In turn, the low marginal product of capital may reflect preferential access
18. We can generate a fixed labor supply in an industry by assuming that aggregate out-put is a Cobb-Douglas aggregate of aggregate industry output.
19. See also Kamal and Lovely (2013) for the convergence of the average product of labor between state and private firms.

CHANG-TAI HSIEH and ZHENG (MICHAEL) SONG 329
to capital among state-owned and privatized firms. Preferential access to capital increases the profits of firms with access. Under this interpretation, it appears that formerly state-owned firms, even after they are privatized, continue to benefit from preferential access to capital.
In contrast to the patterns in capital productivity, there is significant con-vergence of labor productivity between state-owned and private firms. We see this among the surviving state-owned firms, among the newly estab-lished state-owned firms, and even among the privatized state-owned firms. This finding is hard to interpret if lower labor productivity reflects a lower marginal cost of labor, but it is easy to interpret if state-owned firms had a substantial amount of redundant labor. The fact that the average product of labor is lower among state-owned firms in 1998 could be due to overstaff-ing in these firms.20 The political pressure to employ redundant workers declined after 1998, as state-owned firms became corporatized and presum-ably were incentivized to maximize profits. In our data, employment in the surviving state-owned firms declined by 3.6 million workers from 1998 to 2007, about 40 percent of their initial employment. We do not know how many of these workers were redundant workers, but note that a decline in the number of redundant workers will show up as a decline in the average product of labor and in the labor share. Specifically, we can rewrite equa-tion 10 as follows:
� �� ��18
1 ˆ 1
1.
Labor Share
wL
Y f LiL
i
i i i
( )( ) + τ∝
−
Equation 18 shows that the labor share falls when fi/Li falls. Figure 11 plots the average labor shares of state-owned, privatized, and private firms in the 1998–2007 balanced panel.21
Finally, from equation 8, firm productivity A can be measured as the residual of firm value added after controlling for the effect of the average product of capital and labor. We use the labor share of private firms in each
20. According to a survey conducted by the Chinese Academy of Social Science in 1995, the narrowly defined redundant workers—that is, those who are idle and have no definite position—accounted for more than 10 percent of total employment in about half of the state-owned firms (Dai 1996).
21. We use value added shares of an industry (averaged over 1998–2007) as the weight to aggregate labor shares. The initial labor shares of state-owned and privatized firms were considerably higher than those of private firms. Moreover, the labor shares of state-owned and privatized firms fell substantially after 1998.

330 Brookings Papers on Economic Activity, Spring 2015
two-digit industry to measure industry-specific α where we adjust the labor share in each sector such that we match the labor share in China’s industrial sector.22 We use a baseline value of 1/η = 7, corresponding to a markup of 1.17.23 To calculate 2012 firm TFP, we convert revenues to value added by the average industry value added revenue ratios in 2004–07. Firm TFP presented below is scaled by the median TFP of surviving private firms in the same industry.24
We find A of exiting state-owned firms to be about half of that of surviv-ing state-owned firms in 1998–2007, while there are no clear differences in A across entrants with different ownership types. Figure 12 plots the
Source: Authors’ calculations, based on microdata from China’s Industrial Survey.
1999 2000 2001 2002 2003 2004 2005 2006
0.25
0.30
0.35
0.40
0.45
State-owned firms
Privatized state-owned firms
Private firms
Figure 11. Labor Share, 1998–2007a
22. See the online appendix. We use the labor share of private firms because distortions may bias the labor share of state-owned firms.
23. We later show the results with different values of 1/η as well as allowing markups to differ across state-owned and private firms.
24. We drop industries that have less than ten surviving private firms. The five indus-tries are Extraction of Petroleum and Natural Gas, Mining of Other Ores, Manufacture of Tobacco, Recycling and Disposal of Waste, and Production and Supply of Gas.

CHANG-TAI HSIEH and ZHENG (MICHAEL) SONG 331
Source: Authors’ calculations, based on microdata from China’s Industrial Survey. a. Total factor productivity is normalized by mean of surviving private firms in each year. The sample is the
balanced panel from 1998 to 2007. b. Firms that were state-owned in 1998 and 2007. c. Privatized firms that were state-owned in 1998 and privately owned in 2007.
Total factor productivity (private firms = 1)
Total factor productivity (private firms = 1)
State-owned firmsb
Privatized state-owned firmsc
Density of employment
Density of employment
0.05
0.15
0.10
0.20
0.05
0.15
0.10
0.20
1⁄16 1⁄8 1⁄4 1⁄2 1 2 4 8 16 32
1⁄16 1⁄8 1⁄4 1⁄2 1 2 4 8 16 32
1998
2007
1998
2007
Figure 12. Total Factor Productivity in State-Owned and Privatized Firms, 1998 and 2007a

332 Brookings Papers on Economic Activity, Spring 2015
resulting distribution of A of state-owned firms (top panel) and privatized firms (bottom panel) in the balanced panel from 1998 to 2007. The top panel indicates that A of state-owned firms was lower than that of private firms in 1998. By 2007, the gap in A between state-owned firms and private firms had narrowed. Similarly, A of privatized firms was lower compared to private firms, but the gap had also declined by 2007. Specifically, the weighted average TFP of surviving state-owned firms relative to that of surviving private firms increased from approximately 55 to 75 percent. The relative TFP of surviving privatized firms increased from approximately 60 to 77 percent.
We next examine heterogeneity in the change in A across the size distri-bution. The top panel of figure 13 plots the ratio of A of state-owned firms relative to private firms in bins defined by the value added in 1998 (top panel). This figure indicates that A of state-owned firms in the top decile in firm size in 1998 was 30 to 40 percent of that of the privately owned firms of comparable size in 1998. By 2007, among the top decile of state-owned firms, A had increased to about 60 percent of that of the same group of pri-vate firms. For small state-owned firms, the pattern is exactly the opposite. In 1998, A of the smallest state-owned firms was 80 to 90 percent of that of private firms of comparable size. By 2007, A among state-owned firms had dropped to about 40 percent of that of the same group of private firms. The bottom panel plots the relative A of the privatized firms. Here, there is less heterogeneity across the size distribution. On average, A of privatized firms grows at faster rates than that of private firms, and this is the case throughout the size distribution. These findings are the mirror images of the facts documented in section I.C.
Finally, subject to the caveats about the limitations of the 2012 data mentioned previously, figure 14 plots the distribution of TFP in a balanced panel of state-owned firms in 2007 and 2012. As can be seen, the figure shows that TFP of state-owned firms continues to grow at a faster rate after 2007 compared to private firms.
In summary, we find high growth rates of TFP and reduction in labor distortions among state-owned and privatized firms since the late 1990s. However, the return to capital continues to be significantly lower among state-owned and privatized firms than among private firms. Large state-owned firms have particularly high growth rates in TFP relative to their private counterparts, but the opposite is true for small state-owned firms.
We end this section with three sets of robustness checks. First, we measure labor input by employment, which implicitly assumes that labor quality is the same across firms. However, the gap in labor productivity
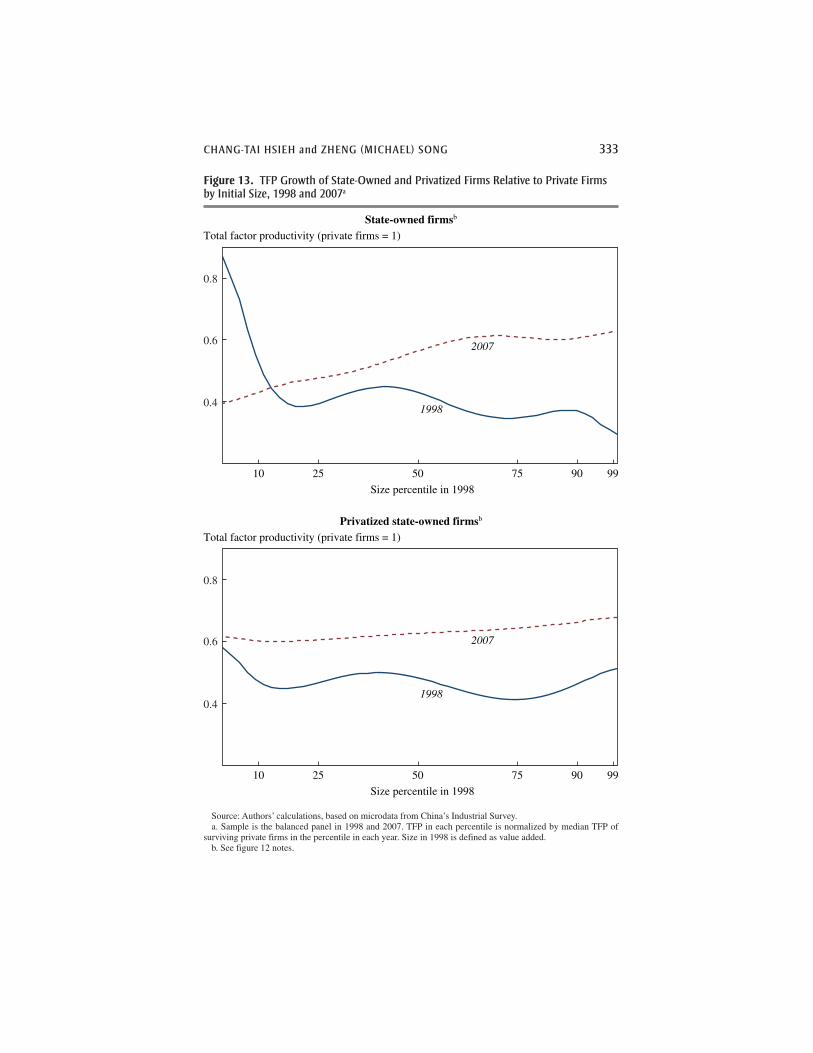
CHANG-TAI HSIEH and ZHENG (MICHAEL) SONG 333
Figure 13. TFP Growth of State-Owned and Privatized Firms Relative to Private Firms by Initial Size, 1998 and 2007a
Source: Authors’ calculations, based on microdata from China’s Industrial Survey. a. Sample is the balanced panel in 1998 and 2007. TFP in each percentile is normalized by median TFP of
surviving private firms in the percentile in each year. Size in 1998 is defined as value added. b. See figure 12 notes.
Size percentile in 1998
Size percentile in 1998
State-owned firmsb
Privatized state-owned firmsb
Total factor productivity (private firms = 1)
Total factor productivity (private firms = 1)
0.6
0.4
0.8
0.6
0.4
0.8
10 25 50 75 90 99
1998
2007
10 25 50 75 90 99
1998
2007

334 Brookings Papers on Economic Activity, Spring 2015
between state and private firms shown in figure 9 may be due to differences in worker quality. To check this, we use data from the 2004 Economic Cen-sus to measure the differences in worker quality between state and private firms. The 2004 Census indicates that workers in state-owned firms have, on average, 1.3 more years of schooling than workers in private firms.25 When we adjust for the implied gap in worker quality (using estimates of the Mincerian return to schooling), this reduces labor productivity among surviving privatized state-owned firms by about 10 percent. The conver-gence of labor productivity between state and private firms is not affected, though.
Second, the convergence of TFP is robust to alternative assumptions on markups. Lowering 1/η to 3 gives essentially the same relative TFP growth of surviving state-owned firms. Our calculations assume that markups are the same for all firms. We now consider the possibility that
Figure 14. Total Factor Productivity of State-Owned Firms, 2007 and 2012a
Source: Authors’ calculations, based on microdata from China’s Industrial Survey. a. Total factor productivity is normalized by mean of surviving private firms in each year. Sample is the
balanced panel of state-owned firms from 2007 to 2012; firms identified as state-owned in 2007 and 2012.
Total factor productivity (private firms = 1)
Density of employment
0.10
0.20
1⁄16 1⁄8 1⁄4 1⁄2 1 2 4 8 16
2007
2012
25. The 2004 Economic Census provides data on the educational composition of employment in each firm. See the online appendix.

CHANG-TAI HSIEH and ZHENG (MICHAEL) SONG 335
state-owned firms have higher markups than private firms. This has two effects on the empirical results.26 First, although higher markups among state-owned firms change the implied levels of TFP, τL
i, and τKi for these
firms, they do not change their implied growth rates. Second, if we assume that markups among privatized state-owned firms decline after becoming privatized, then the implied growth rate of TFP among privatized firms would be higher than shown in figure 10. In addition, the implied reduction in labor and capital distortions among the privatized firms would be larger than shown in figures 6 and 7.
Finally, the evidence presented above suggests that the convergence of labor productivity between state-owned and private firms can be explained by the reduction in the number of surplus workers in the state sector (instead of an increase in the marginal product of labor in state-owned firms). Notice that with the presence of surplus labor, Ai has to be adjusted by fi.
We consider a scenario in which (i) redundant workers exist only in the firms that are initially state-owned and have labor productivity below the average of surviving private firms in the same industry; and (ii) the labor productivity gap entirely reflects the number of redundant workers. These assumptions are rather extreme, implying massive labor redundancy that accounts for approximately 54 and 35 percent of state employment in 1998 and 2007, respectively. In this scenario, the TFP growth of state-owned firms has to be adjusted downward by falling surplus labor. In the benchmark case, the weighted average TFP of surviving state-owned firms relative to that of surviving private firms grew by approximately 36 percent from 1998 through 2007, while in the scenario adopting the above assump-tions on fi the growth would decrease to approximately 26 percent. Despite this, the TFP convergence between state and private firms would remain qualitatively unchanged.
IV. Why Have State-Owned Firms Changed?
We now turn to institutional forces that may be behind the patterns pre-sented in the last section.
First, governance may have improved among large state-owned firms. Figure 2 shows that almost half of the state-owned firms in 2007 and nearly 60 percent of them in 2012 were legally registered as private firms. For a
26. See the online appendix for details on the model with variable markups, as well as the empirical results.

336 Brookings Papers on Economic Activity, Spring 2015
subset of these firms for which we can put together detailed ownership information, the typical form this takes is that of state-owned firms “corpo-ratized” with a minority share traded in the stock market and merged into a large state-owned conglomerate. We do not have information on the precise ownership structure of all the firms in the data, but we do know the share of registered capital held by “legal persons.” For the sample of state-owned firms for which we have ownership information, the legal person share in the data matches the equity share of the state-owned conglomerate. Figure 15 shows that the average share of registered capital held by legal persons increased dramatically among all state-owned firms after 1998.
Second, there is clear evidence that state-owned firms face greater com-petition from private firms. Although the goal of the Chinese government was to restrict entry by private firms in the strategic or “pillar” industries, private firms have actually entered in many of the industries where the state has sought to maintain the dominance of state-owned firms.27 Table 6 presents the value-added share for state-owned firms in nine such indus-tries (these industries account for about half of China’s industrial output) in 1998 and 2007 and the revenue share in 2007 and 2012 (remember that the 2012 data do not report value added, only revenue). Although state-owned firms have a dominant share in most of these industries, the state’s share has shrunk in all sectors (except for Electric and Heat Power). Furthermore, the decline of the state share continued after 2007. The decline in the other (nonstrategic) sectors is even more dramatic: The overall value added share of state-owned firms in the industrial sector fell from approximately 55 to 34 percent from 1998 to 2007.
Table 7 examines the correlation of private-sector entry with productiv-ity growth in the state sector across two-digit sectors. We define the private entry rate as the number of new private firms created within a single year relative to the number of all private firms in that year. The private entry rate averaged 7.6 percent in the 1998–2007 period, with a standard devia-tion of eight percentage points across industries. Column 1 shows that the private-sector entry rate is positively correlated with productivity growth. The effect is independent of ownership.
Third, many of the state-owned firms after 1998 were newly established. As figures 9 and 10 show, these firms were large and also enjoyed preferen-tial access to capital. Such firms may also have provided competition to the surviving state-owned firms. The entry rate of state-owned firms after 1998
27. See the online appendix for details on “strategic” and “pillar” industries.

CHANG-TAI HSIEH and ZHENG (MICHAEL) SONG 337
Figure 15. State-Owned Firms with “Legal Person” Ownership Share Greater than 50 Percent, 1998–2012a
Source: Authors’ calculations, based on microdata from China’s Industrial Survey.a. This figure plots the number of state-owned firms with legal person share above or equal to 50 percent as a
share of the number of all state-owned firms in each year.b. Weighted by revenue share.
0.1
0.2
0.3
0.4
2000 2002 2004 2006 2008 2010
Unweighted
Weighted b
Table 6. Share of State-Owned Firms in Strategic SectorsPercent
Value-added share Revenue share
1998 2007 2007 2012
Mining of coal 82 66 66 61Extraction of petroleum 100 97 98 91Processing of petroleum 88 63 75 70Chemical 51 24 27 20Ferrous metals 79 46 45 37Nonferrous metals 54 34 34 36Transport equipment 65 49 51 44Communication equipment 42 8 6 9Electric and heat power 86 88 91 93
Source: Authors’ calculations, based on microdata from China’s Industrial Survey.

338 Brookings Papers on Economic Activity, Spring 2015
is about 2.1 percent per year, with a standard deviation of 0.8 percentage points across two-digit sectors (the correlation between the private entry rate and state firm entry rate is approximately 0.6). Column 2 in table 7 shows that the entry rate of state-owned firms is also positively correlated with the TFP growth of state-owned firms. Comparing the R2 in columns 1 and 2, it appears that the entry of new state-owned firms explains more of the variation in TFP growth among surviving state-owned firms. The entry
Table 7. Total Factor Productivity Growth and Market Entry, 1998 to 2007a
(1) (2) (3)
Dependent variable = Total factor productivity growth, state-owned firmsb
Private entry ratec 0.737(0.251)
State entry rated 3.613(1.019)
Δ State Herfindahle −0.160(0.0711)
R2 0.213 0.282 0.137
Dependent variable = Total factor productivity growth, privatized firmsf
Private entry rate 0.874(0.236)
State entry rate 3.419(0.947)
Δ State Herfindahl −0.183(0.0671)
R2 0.307 0.296 0.189
Dependent variable = Total factor productivity growth, private firmsg
Private entry rate 1.284(0.337)
State entry rate 1.587(1.707)
Δ State Herfindahl −0.0266(0.110)
R2 0.312 0.026 0.002
Source: Authors’ calculations, based on microdata from China’s Industrial Survey.a. Dependent variables are average annual TFP growth rates of median firms of each type in the bal-
anced panel from 1998 to 2007. Each observation is a two-digit industry (N=34). Standard errors clus-tered by industry in parentheses.
b. State-owned firms are state-owned in 1998 and 2007.c. Number of new private firms/total private firms in each year.d. Number of new state-owned firms/total state-owned firms in each year.e. Δ State Herfindahl is the average change in the Herfindahl index for state-owned firms in the bal-
anced panel.f. Firms that were stated-owned in 1998 and privately owned in 2007.g. Firms that were privately owned in both 1998 and 2007.

CHANG-TAI HSIEH and ZHENG (MICHAEL) SONG 339
rate of state-owned firms is also positively correlated with TFP growth in the privatized state-owned firms, but not in the surviving private firms.
More generally, an explicit goal of the central government’s industrial reorganization plans was to generate competition among the state-owned firms. In the case of the automobile industry, Dunne (2011) argues that the main competition faced by Shanghai-GM (GM’s joint venture with the state-owned SAIC Group) is between the two large automobile com-panies owned by its joint-venture partner SAIC Group. For example, Dunne (2011) describes how SAIC’s joint venture with Volkswagen introduced the Volkswagen Passat to undercut Shanghai-GM’s profits from the Buick. To capture this force, we measure the market power of state-owned firms using the Herfindahl index. Column 3 in table 7 shows that TFP growth among surviving state-owned firms is lower in sectors in which the Herfindahl index of surviving state-owned firms increases. This fact also suggests that the high TFP growth rate among surviving state-owned firms is not simply mismeasured monopoly power. If it were, then we should find a positive correlation between the market concentration of state-owned firms and the same firms’ TFP growth. However, the facts suggest that the exact opposite is true.
Finally, there is some evidence that unsuccessful state-owned conglom-erates are forced to sell their firms to other state-owned conglomerates. For example, the Baoshan Steel Company, discussed earlier, is perhaps the most successful steel manufacturer in China. Since 2007, its parent com-pany (the BaoSteel Group) has acquired three large steel manufacturers owned by other state-owned industrial groups.28 One of these companies is ShaoSteel, a publicly traded steel manufacturer that was owned by local governments in Guangdong Province. After ShaoSteel suffered losses total-ing almost USD 400 million between 2008 and 2012, the BaoSteel Group acquired the firm in 2012.29 The case of the Nanjing Automotive Group (owned by the local government of Nanjing) is another example. This com-pany also ran perpetual deficits before the SAIC Group acquired it in 2007.
There are no systematic data on the extent of this reallocation, but some basic facts about the groups and firms owned by the central SASAC sug-gest this may have been important. When the central SASAC was first
28. Specifically, BaoSteel acquired Bayi Steel in 2007, Ningbo Steel in 2007, and Shao-Steel in 2012.
29. The data on losses from 2008 to 2012 is from ShaoSteel’s annual reports. News reports indicate that ShaoSteel’s senior management was replaced after the firm was acquired by the BaoSteel Group.

340 Brookings Papers on Economic Activity, Spring 2015
established in 2003, it was in charge of 189 industrial groups that con-trolled a total of 15,546 firms. By 2010, the number of industrial groups it owned had been whittled down to 124. At the same time, these 124 groups controlled a total of 23,738 firms. Put differently, due to this reallocation process, the number of firms controlled by the average central SASAC group increased from about 82 in 2003 to 191 in 2010.
V. Implications for Aggregate Output
We now turn to the assessment of the aggregate implications of the changes observed in the state sector. Although it might seem that high TFP growth and a reduction in labor distortions in the state sector would have posi-tive effects on aggregate welfare, there will be offsetting effects in general equilibrium. As discussed in the theoretical model in section II, depend-ing on the parameter values, the effect on allocative efficiency of TFP growth among firms where marginal products are low offsetting effects may be large enough that aggregate output is lower when state-owned firms increase TFP.
We start with the 2007 data and then calculate aggregate output under two counterfactuals, which we will call “Let Go of the Small” and “Grasp the Large,” defined this way:
— “Grasp the Large” assumes that (i) TFP and distortions of surviv-ing state-owned firms would be the same as their initial values; and (ii) no new state-owned firms would be established.
— “Let Go of the Small” assumes that (i) TFP and distortions of priva-tized firms would be the same as their initial values; and (ii) exiting state-owned firms would survive, with TFP and distortions equal to their initial values.
In each counterfactual, we start with the 2007 data and calculate the hypo-thetical level of aggregate output under each scenario. We keep the aggre-gate labor supply fixed and assume that the aggregate supply of capital is available elastically at an exogenously determined world interest rate in the benchmark calculation (we relax this assumption later).
Table 8 presents the percentage decline in aggregate output in 2007 in each scenario. The first column, “No surplus labor,” assumes that τL
i repre-sents gaps in the marginal product of labor, so here any increases in TFP among firms with a sufficiently low average product of labor may lower aggregate output. The first three rows present the effect of the closure and privatization of state-owned firms. The first row shows that 2007 aggregate
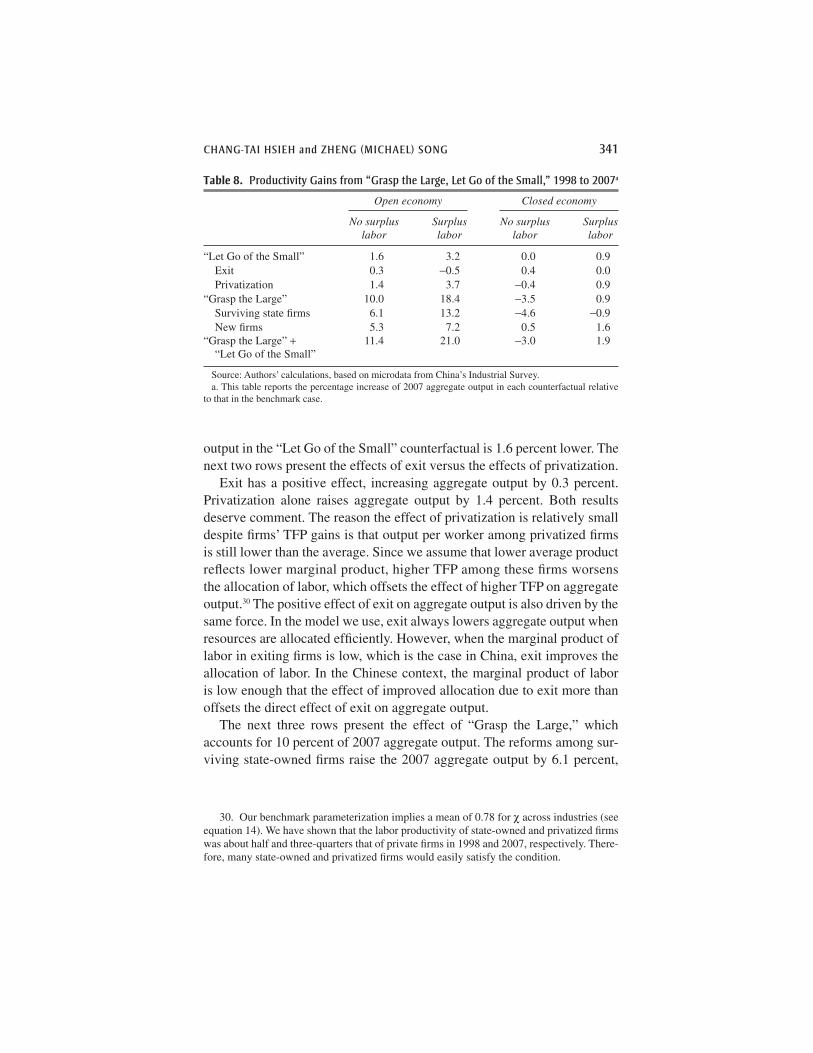
CHANG-TAI HSIEH and ZHENG (MICHAEL) SONG 341
output in the “Let Go of the Small” counterfactual is 1.6 percent lower. The next two rows present the effects of exit versus the effects of privatization.
Exit has a positive effect, increasing aggregate output by 0.3 percent. Privatization alone raises aggregate output by 1.4 percent. Both results deserve comment. The reason the effect of privatization is relatively small despite firms’ TFP gains is that output per worker among privatized firms is still lower than the average. Since we assume that lower average product reflects lower marginal product, higher TFP among these firms worsens the allocation of labor, which offsets the effect of higher TFP on aggregate output.30 The positive effect of exit on aggregate output is also driven by the same force. In the model we use, exit always lowers aggregate output when resources are allocated efficiently. However, when the marginal product of labor in exiting firms is low, which is the case in China, exit improves the allocation of labor. In the Chinese context, the marginal product of labor is low enough that the effect of improved allocation due to exit more than offsets the direct effect of exit on aggregate output.
The next three rows present the effect of “Grasp the Large,” which accounts for 10 percent of 2007 aggregate output. The reforms among sur-viving state-owned firms raise the 2007 aggregate output by 6.1 percent,
30. Our benchmark parameterization implies a mean of 0.78 for χ across industries (see equation 14). We have shown that the labor productivity of state-owned and privatized firms was about half and three-quarters that of private firms in 1998 and 2007, respectively. There-fore, many state-owned and privatized firms would easily satisfy the condition.
Table 8. Productivity Gains from “Grasp the Large, Let Go of the Small,” 1998 to 2007a
Open economy Closed economy
No surplus labor
Surplus labor
No surplus labor
Surplus labor
“Let Go of the Small” 1.6 3.2 0.0 0.9 Exit 0.3 −0.5 0.4 0.0 Privatization 1.4 3.7 −0.4 0.9“Grasp the Large” 10.0 18.4 −3.5 0.9 Surviving state firms 6.1 13.2 −4.6 −0.9 New firms 5.3 7.2 0.5 1.6“Grasp the Large” + “Let Go of the Small”
11.4 21.0 −3.0 1.9
Source: Authors’ calculations, based on microdata from China’s Industrial Survey.a. This table reports the percentage increase of 2007 aggregate output in each counterfactual relative
to that in the benchmark case.

342 Brookings Papers on Economic Activity, Spring 2015
and the creation of new state-owned firms accounts for 5.3 percent of the aggregate output in 2007. The fact that newly formed state-owned firms contribute almost as much to aggregate output as surviving state-owned firms may be surprising, given that total value added of surviving state-owned firms in 2007 was about four times larger than that of the new state-owned firms. The difference in the contribution of these groups of large state-owned firms stems from the fact that average labor productiv-ity among new state-owned firms is about the same as that of the average private firm, so the entry of these firms does not worsen the allocation of labor. In contrast, the average product of labor among state-owned firms in 2007 was still lower than that of the average private firm. Consequently, as in the case with privatized state-owned firms, here higher TFP among state-owned firms worsens the allocation of labor, which offsets the effect of higher firm TFP on aggregate output.
The estimates in column 1 assume that gaps in the average product of labor reflect differences in the marginal product. However, the evidence presented in section III suggests that the convergence of labor productivity between state-owned and private firms can be explained by the reduction in the number of surplus workers in the state sector (instead of an increase in the marginal product of labor in state-owned firms). In column 2, we assume that (i) gaps in the average product of labor between state-owned and private firms entirely reflect the number of redundant workers in the state sector but that the marginal product of labor is the same in the two sectors;31 and (ii) redundant workers in the state sector have zero pro-ductivity and, hence, reducing fi does not affect labor supply. With those assumptions, TFP growth in firms with low labor productivity does not worsen the allocation of labor. As can be seen, the effects on aggregate out-put are now almost twice as large (compared to the estimates in column 1). “Let Go of the Small” accounts for 3.2 percent of aggregate output in 2007, and “Grasp the Large” accounts for 18.4 percent. The two reforms together, shown in the last row, account for 21.0 percent of aggregate output in 2007.
We have so far assumed that the aggregate supply of capital in China is perfectly elastic. This can be the case because of capital mobility or because a consumption Euler equation generates a constant interest rate. Zheng Song, Kjetil Storesletten, and Fabrizio Zilibotti (2011) document that sav-ings have exceeded investments in China, suggesting that an open economy with an elastic supply of capital is a reasonable assumption for the country.
31. fi/Li is assumed to be the same among state-owned firms.

CHANG-TAI HSIEH and ZHENG (MICHAEL) SONG 343
In addition, Chong-En Bai, Chang-Tai Hsieh, and Yingyi Qian (2006) find that the return to capital among nonstate firms was roughly constant over this time period, which is consistent with a fixed cost of capital.
Nonetheless, it is useful to examine the welfare effects when we assume a fixed capital stock at the aggregate level. The results are reported in the last two columns. Since the marginal product of capital is lower among sur-viving state-owned firms, privatized state-owned firms, and newly estab-lished state-owned firms, the implication of a fixed capital stock is that higher productivity growth among these firms raises the equilibrium inter-est rate and worsens the allocation of capital. Column 3 further assumes that low labor productivity reflects low marginal product, so the effect of TFP growth among low-labor-productivity firms also worsens the alloca-tion of labor. This is the worst-case scenario, because higher TFP growth among state-owned firms potentially worsens the allocation of both labor and capital. As can be seen, the effect of this alternative assumption is dra-matic. For example, the effect of higher TFP growth among surviving state-owned firms worsens aggregate output by almost 5 percent. Intuitively, the marginal products of capital and labor were low enough in these firms in 2007 that the effect of higher TFP on resource misallocation should over-whelm the direct effect of higher TFP on aggregate output. This effect is less strong among the newly established state-owned firms. This is because the creation of these firms worsens the allocation of capital (the average productivity of capital is lower in these firms) but not the allocation of labor (their average productivity of labor is about the same as the average).
The last column assumes that gaps in labor productivity reflect redun-dant workers (as in column 2). Here, higher TFP growth in low-labor- productivity firms has no effect on the efficiency of labor allocation. Thus, comparing columns 2 and 4 isolates the effect of TFP on capital allocation. The effect of worse capital allocation due to TFP growth in low-capital-return firms is very large. The effect of worse capital allocation due to TFP growth among surviving state-owned firms lowers aggregate output by more than 14 percent (13.2 + 0.9). The effect of worse capital allocation due to the entry of state-owned firms that have high TFP but low capital return lowers aggregate output by 5.6 percent (7.2 − 1.6).
In summary, the magnitude of the welfare gain depends on how elastic the capital supply is. If the reality is that the cost of capital to private firms does not change due to the reform of state-owned firms, the effect of the reform is likely to have increased aggregate output significantly. Similarly, the effect of TFP growth also depends on the extent to which it worsens the allocation of labor. Although we present evidence that the convergence

344 Brookings Papers on Economic Activity, Spring 2015
between state and private firms in labor productivity is due to the reduction in redundant workers, we do not know whether the remaining gap in 2007 reflects differences in the marginal product of labor or in the number of redundant workers.
Finally, following the same steps as described above, we find that the exit and closure of state-owned firms from 2007 to 2012 had a negligible effect on aggregate output growth over this time period. In turn, the trans-formation among incumbent state-owned firms and the creation of new state-owned firms over this time period (their “corporatization”) account for approximately 18 percent of aggregate growth from 2007 to 2012.32 Thus, the transformation of the state sector continues to play an impor-tant role in China’s growth, but its importance relative to other forces has remained small since 2007.
VI. Conclusion
We document the dramatic transformation of Chinese state-owned firms after the late 1990s. Smaller state-owned firms were closed or privatized; large state-owned firms were corporatized and merged into large state-owned holding companies; and new state-owned firms were created. We show that labor productivity and TFP increased in the privatized and sur-viving state-owned firms. In contrast, there was little convergence in the capital productivity of state-owned and privatized firms after 1998. Among the newly established state-owned firms, we show that TFP and labor pro-ductivity of state-owned firms are about the same as those of their private counterparts, while capital productivity of state-owned firms is signifi-cantly lower.
Although these changes unambiguously increase state-sector profits, the effects on welfare are more ambiguous. If higher TFP in state-owned firms does not worsen resource allocation, then the reform of the state sector was potentially responsible for 20 percent of aggregate output in 2007. How-ever, if the aggregate supply of capital is fixed, the effect of higher TFP and the creation of new high-TFP state-owned firms could have worsened the allocation of capital by enough that the net effect on aggregate output may be negative. Likewise, if the marginal product of labor among state-owned firms is low, higher TFP can also lower aggregate output by reallocating workers away from private firms, where the marginal product of labor is presumably higher.
32. We conduct counterfactuals for 2007–12 in an open economy with no surplus labor.

CHANG-TAI HSIEH and ZHENG (MICHAEL) SONG 345
We end with three suggestions for future work. First, although we pro-vide suggestive evidence that changes in corporate governance, competi-tion from private firms and other state-owned groups, and reallocation of assets between state-owned groups may have been important drivers of the changes observed in state-owned firms, the evidence is far from conclu-sive. Second, our analysis of the welfare effect of “Grasp the Large, Let Go of the Small” relies on a specific model, but the effect may be different with a different model. Finally, although our estimates suggest that the transfor-mation of the state sector, particularly the corporatization of state-owned firms and the creation of new state-owned firms, was an important force behind China’s growth, it is clear that the main driver of China’s growth is something else. Figuring out the unexplained residual in this paper is clearly a central question for future work.
ACKNOWLEDGMENTS We thank Wancong Li and Jie Luo for excellent research assistance and Loren Brandt, Amit Khandelwahl, and the editors for helpful comments.

346 Brookings Papers on Economic Activity, Spring 2015
References
Aivazian, Varouj A., Ying Ge, and Jiaping Qiu. 2005. “Can Corporatization Improve the Performance of State-Owned Enterprises Even without Privatiza-tion?” Journal of Corporate Finance 11: 791–808.
Bai, Chong-En, Chang-Tai Hsieh, and Yingyi Qian. 2006. “The Returns to Capital in China.” Brookings Papers on Economic Activity, Fall: 61–102.
Baily, Martin, Charles Hulten, and David Campbell. 1992. “Productivity Dynamics in Manufacturing Plants.” Brookings Papers on Economic Activity, Micro-economics 187–267.
Brandt, Loren, Johannes Van Biesebroeck, and Yifan Zhang. 2012. “Creative Accounting or Creative Destruction? Firm-Level Productivity Growth in Chinese Manufacturing.” Journal of Development Economics 97: 339–51.
Central Committee of the Communist Party of China. 1999. “The Decision of the Central Committee of the Communist Party of China on Major Issues Concerning the Reform and Development of State-Owned Enterprises.” Adopted at the Fourth Plenum of the 15th Communist Party of China Cen-tral Committee on September 22, 1999. http://www.lawinfochina.com/display.aspx?lib=law&id=991&CGid
Dai, Yuanchen. 1996. Employment and Income in an Economy with Surplus Labor (in Chinese). Shanghai: Far East Publishing House.
Dunne, Michael. 2011. American Wheels, Chinese Roads: The Story of General Motors in China. Hoboken: Wiley.
Kamal, Fariha, and Mary E. Lovely. 2013. “Labor Allocation in China: Implicit Taxation of the Heterogeneous Non-State Sector.” CESifo Economic Studies 59: 731–58.
Lardy, Nicholas R. 2014. Markets over Mao: The Rise of Private Business in China. Washington: Peterson Institute for International Economics.
Perkins, Dwight H., and Thomas G. Rawski. 2008. Appendix to “Forecasting China’s Economic Growth to 2025.” In China’s Great Economic Transforma-tion, edited by Dwight H. Perkins and Thomas G. Rawski. Cambridge Univer-sity Press.
Song, Zheng, Kjetil Storesletten, and Fabrizio Zilibotti. 2011. “Growing Like China.” American Economic Review 101: 202–41.
Song, Zheng, and Guiying Laura Wu. 2014. “Identifying Capital Misallocation.” Working Paper. http://faculty.chicagobooth.edu/zheng.song/research/SW_web.pdf.