Graphics in Java Part I. Lecture Objectives Understand the basic concepts of Computer Graphics Learn...
33
Graphics in Java Part I
-
date post
21-Dec-2015 -
Category
Documents
-
view
220 -
download
2
Transcript of Graphics in Java Part I. Lecture Objectives Understand the basic concepts of Computer Graphics Learn...

Graphics in JavaPart I

Lecture Objectives
• Understand the basic concepts of Computer Graphics
• Learn about Computer Graphics Applications
• Learn about the Coordinate System of Computer Graphics
• Learn about the basic and advanced transformations in Computer Graphics

Lecture Objectives
• Outline:
Graphics Applications
What is Computer Graphics?
Representations in Graphics
Supporting Disciplines
Coordinate Systems
Basic and Advanced Transformations

Graphics Applications• Entertainment: Cinema
Pixar: Monster’s Inc.
A Bug’s Life (Pixar)

Graphics Applications (Cont’d)• Medical Visualization
MIT: Image-Guided Surgery Project
Th
e V
isib
le H
um
an
Pro
jec
t

• Scientific Visualization
Graphics Applications (Cont’d)• Computer Aided Design (CAD)
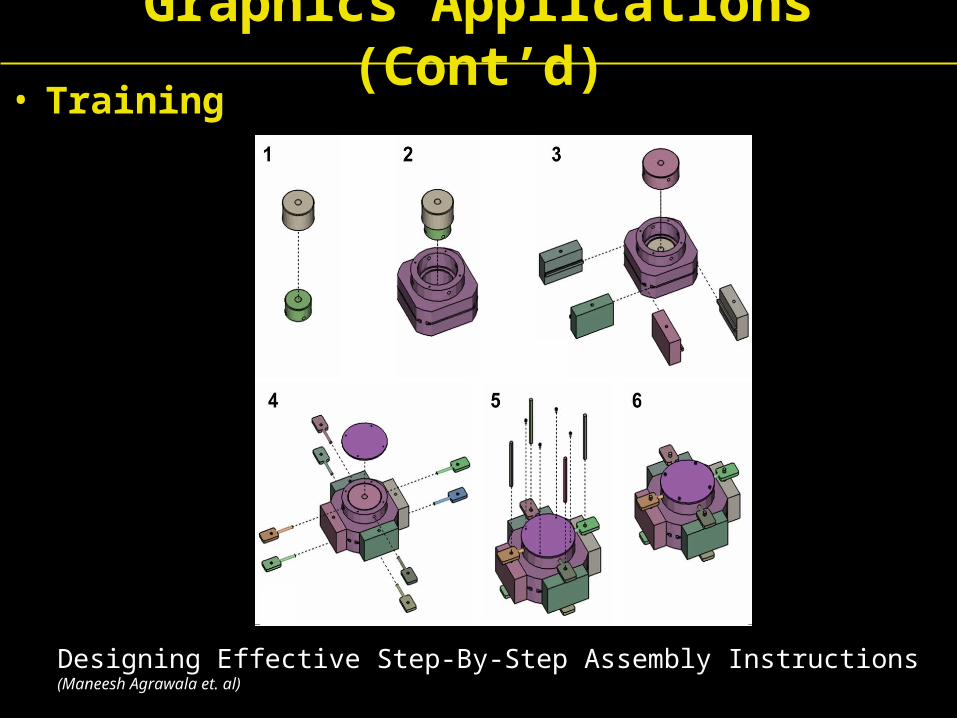
• Training
Designing Effective Step-By-Step Assembly Instructions (Maneesh Agrawala et. al)
Graphics Applications (Cont’d)

• Game Modeling and Simulation
GT Racer 3
Polyphony Digital: Gran Turismo 3, A Spec
Graphics Applications (Cont’d)

• The major application that we will be dealing with extensively in the next coming lectures is that of developing graphical user interfaces Windows Menus Buttons Textboxes ...
Graphics Applications (Cont’d)

What is Computer Graphics?• Computer graphics: generating 2D images of a
3D world represented in a computer.
• Main tasks: modeling: (shape) creating and representing the geometry
of objects in the 3D world rendering: (light, perspective) generating 2D images of the
objects animation: (movement) describing how objects change in
time

Representations in GraphicsA) Vector Graphics:
• Image is represented by continuous geometric objects: lines, curves, etc.
B) Raster Graphics:
• Image is represented as a rectangular grid of colored pixels PIXEL = PIcture ELement
X

Raster Graphics• Generic
• Image processing techniques
• Geometric Transformation: loss of information
• Relatively high processing time in terms of the number of pixels
• Realistic images, textures, ...
• Examples: Paint, PhotoShop, ...

Sample Image Processing Techniques
• Edge Detection
• Image Denoising
Raster Graphics (Cont’d)

Vector graphics• Graphics objects: geometry + color
• Relatively low processing time in terms of the number of graphic objects
• Geometric transformation possible without loss of information (zoom, rotate, …)
• Examples: PowerPoint, CorelDraw, SVG, ...
Vector Graphics

Scalable Vector Graphics (SVG)<?xml version="1.0" standalone="no"?>
<!DOCTYPE svg PUBLIC "-//W3C//DTD SVG 1.1//EN"
"http://www.w3.org/Graphics/SVG/1.1/DTD/svg11.dtd">
<svg width="12cm" height="4cm" viewBox="0 0 1200 400"
xmlns="http://www.w3.org/2000/svg" version="1.1">
<desc>Example polygon01 - star and hexagon</desc>
<!-- Show outline of canvas using 'rect' element -->
<rect x="1" y="1" width="1198" height="398"
fill="none" stroke="blue" stroke-width="2" />
<polygon fill="red" stroke="blue" stroke-width="10"
points="350,75 379,161 469,161 397,215
423,301 350,250 277,301 303,215
231,161 321,161" />
<polygon fill="lime" stroke="blue" stroke-width="10"
points="850,75 958,137.5 958,262.5
850,325 742,262.6 742,137.5" />
</svg>

From Modeling to Processing
ImageMath. ModelImage Analysis(pattern recognition)
Image Synthesis(Rendering)
Modeling Image processing

Supporting Disciplines• Computer science (algorithms, data structures,
software engineering, …)
• Mathematics (geometry, numerical, …)
• Physics (Optics, mechanics, …)
• Psychology (Colour, perception)
• Art and design

Computer Graphics: Transformations
• Types of transformations
• Screen and World Coordinate Systems
• Matrix representations of transformations
• 2D Transformations
• 3D Transformations

Graphical Transformations: Basics• There are several standard graphics transformation.
• All involve plotting images on the screen in terms of points and the lines connecting those points.
• Each programming language has its own particular constructs for drawing items on the screen.
•"screen" here includes printer output and invisible background buffers for efficient cached graphics (see Double buffering later)
• Regardless of language particulars, the various graphics transformations themselves remain logically the same.
• Here, will deal with the logic of the transformations.
• Consult language books/manuals re: how to do the mechanics of the actual drawing.

• Translation: moving an item from one location to another, e.g., moving thru a room or landscape.
• Rotation: changing the orientation of an item at a given location, e.g., spinning around.
• Scaling: changing the size of an item as it appears on the screen, e.g., an item gets larger or smaller.
• Clipping:: knowing where to stop drawing an item because it partially extends beyond the screen.
Graphical Transformations: Basics (Cont’d)

More advanced operations:• Hidden surface algorithms: dealing with (removing) aspects of items that are hidden from view.
• Representing 3D shapes: how to represent 3D items in a 2D medium.
• Displaying depth relationships: how to achieve realistic perspective.
• Shading, reflection, ambient lighting: how to achieve realistic lighting effects.
In this lecture, will deal only with basics: translation, scaling, and rotation.
Graphical Transformations: Advanced

Basic ideas: World vs. Viewport
The representation of the world
Viewport into that world
• Representation of world stays the same.
• View of world changes as you move around in it, i.e., the viewport moves.
World and Viewport

• Both viewport and the "world" have coordinate systems.• The entire computer screen is a set of pixels (short for picture elements). So is a window on the desktop of a screen. So is a canvas inside a window.• Pixels form a two-dimensional grid with the coordinates (0,0) being the upper-left and the max number of pixels in each dimension forming the lower-right (say, your system provides 1024,768).• So the screen coordinates are as follows:
(0,0)
(1024, 768)
Coordinates

• The lines to be drawn are given in world coordinates with the origin fixed at the center of the computer screen, e.g., (1024, 768 resolution means a center point of 512, 384)
• All the transformations are:• applied to the world coordinates• then mapped to the real (screen) coordinates.
• This allows of computation of the logical transformations to be separated from hard details of viewing surface.
• Do not want to tie the model to available resolution. Mapping from world coordinates to screen coordinates allows us to keep two levels of abstraction separate: model vs. device
World Coordinates
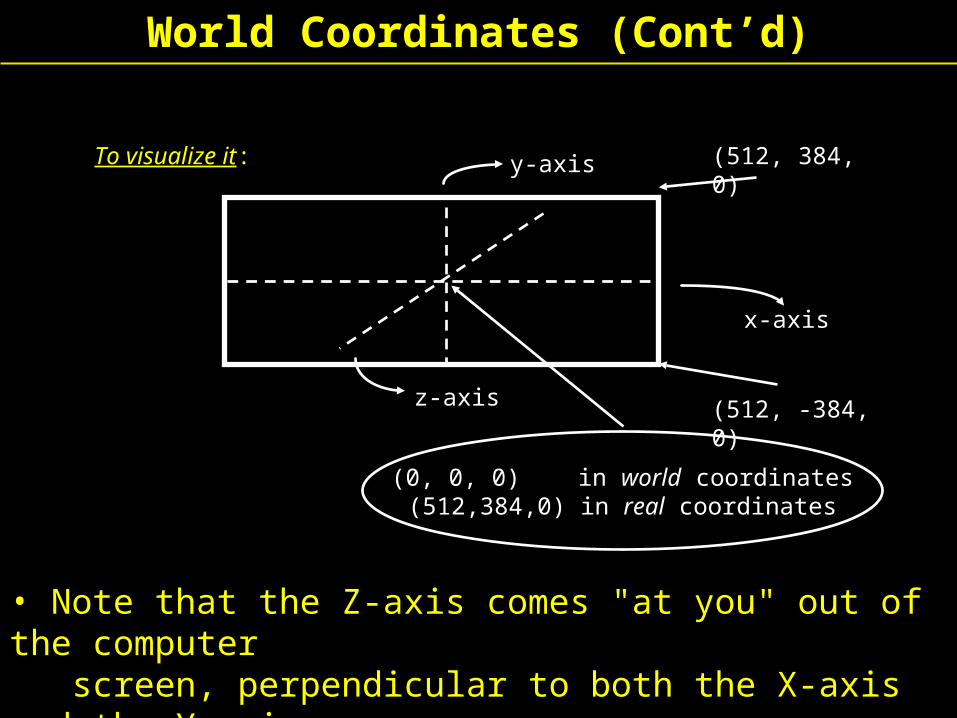
To visualize it:
x-axis
y-axis
z-axis
(0, 0, 0) in world coordinates(512,384,0) in real coordinates
• Note that the Z-axis comes "at you" out of the computer screen, perpendicular to both the X-axis and the Y-axis.
(512, 384, 0)
(512, -384, 0)
World Coordinates (Cont’d)

For example:• world point (0,0,0) is really (512, 384) when you plot (display) it.• world point (100, -20,0) is really (612, 404) when you plot it.
• Notice: real X coordinate gets larger with positive X world coordinates.
• Notice: real Y coordinates gets larger with negative Y world coordinates.
World Coordinates (Cont’d)

Basic transformations: (for simplicity, 2D)
Translation: x' = x + Dx y' = y + Dy
where Dx is relative distance in x dimension, Dy is relative distance in y dimension, prime indicates new point in space.
Computation:
[x' y'] = [x y] + [Dx Dy] P' = P + T
Translation

[x' y'] = [x y] + [Dx Dy]
Each point gets translatedEach point gets translated
Translation (Cont’d)
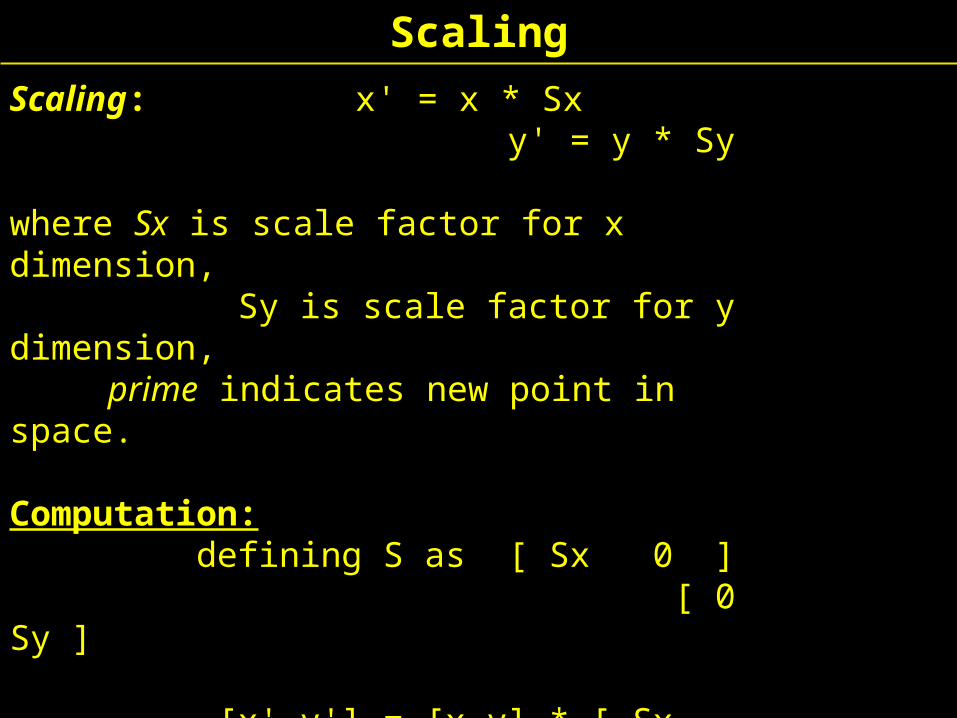
Scaling: x' = x * Sx y' = y * Sy
where Sx is scale factor for x dimension, Sy is scale factor for y dimension, prime indicates new point in space. Computation: defining S as [ Sx 0 ] [ 0 Sy ]
[x' y'] = [x y] * [ Sx 0 ] [ 0 Sy ]
P' = P * S
Scaling
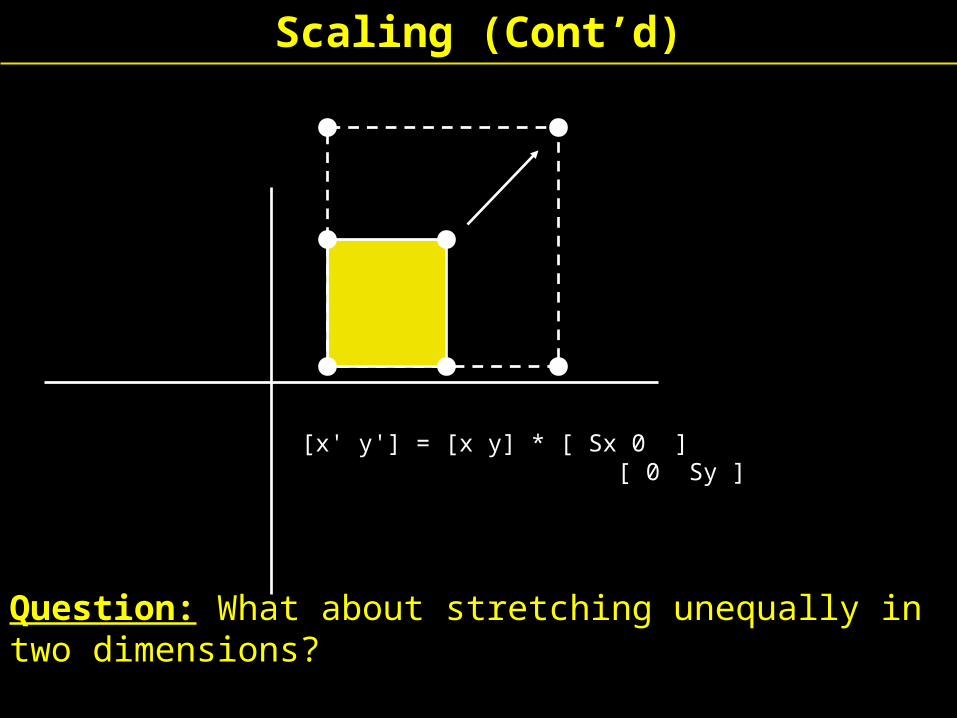
[x' y'] = [x y] * [ Sx 0 ] [ 0 Sy ]
Question: What about stretching unequally in two dimensions?
Scaling (Cont’d)

Rotation: x' = xcos - ysin y' = xsin + ycos where is angle of rotation and prime indicates new point in space.
Computation: [x' y'] = [x y] * [ cos sin ] [-sin cos ] P' = P * RNote: positive angles are counter-clockwise from x toward y; for negative angles (clockwise) use identities:
cos(- ) = cos , and
sin(- ) = -sin
Rotation

[x' y'] = [x y] * [ cos sin ] [-sin cos ]
Rotation (Cont’d)

Notes on Rotation: • There is a difference between: "rotation around center point of object“ and "rotation around origin of Cartesian world" Example: • Imagine a ball on a tether mounted to pole• Do you want the ball itself to spin around on the end of the tether?• Or do you want the ball-and-tether to rotate around the pole?To rotate an object about its own center point:
• first translate object to origin, • then do rotation • then translate back
Rotation Around a Fixed Point