Neckermann - Gids 3 - Egypte, Kaapverdië, Marokko & Tunesië (Zomer 2014)

GRAPHICAL INTRUSION DETECTION SYSTEM (GIDS) PROJECT.
Diego Alejandro Ortiz Yepes. <[email protected], [email protected]>
Cód. 200111079
Universidad de los Andes 2006

Index.
Index...............................................................................................................................................................1 1. Introduction.................................................................................................................................................3 2. Intrusion Detection: Key concepts..............................................................................................................4
Definition. ....................................................................................................................................................4 Why intrusions happen. ..............................................................................................................................4 The importance of intrusion detection. .......................................................................................................4 The goal and classification of IDSs. ...........................................................................................................5 Graphical Intrusion Detection: Motivation and previous work. ...................................................................8
3. The GIDS Project. ................................................................................................................................... 14 Overall Project Description and Requirements........................................................................................ 14 General Design........................................................................................................................................ 14
Host Agents (HIDS Agents). ................................................................................................................ 15 HIDS Collector Agents. ........................................................................................................................ 16 NIDS Agents (Sensors)........................................................................................................................ 19 GIDS Database. ................................................................................................................................... 19 IDS Server............................................................................................................................................ 19 Graphical Clients (GIDS Clients). ........................................................................................................ 20
The HIDS Visualization Model.......................................................................................................... 20 The NIDS Visualization Model.......................................................................................................... 21 The Integration Model....................................................................................................................... 22
GIDS Graphical Visualization Models...................................................................................................... 23 HIDS Graphical Visualization Model. ................................................................................................... 23 NIDS Graphical Visualization Model. ................................................................................................... 26
Detailed Design Documentation. ............................................................................................................. 29 Using the GIDS Client.............................................................................................................................. 29
Connection Controls............................................................................................................................. 30 Messages Pane. .................................................................................................................................. 31 Monitored Hosts Tree........................................................................................................................... 31 HIDS Visualization. .............................................................................................................................. 31 NIDS Visualization. .............................................................................................................................. 32 Host/Agent Static Information. ............................................................................................................. 33 Host States Information........................................................................................................................ 33
Proposed Architectures. .......................................................................................................................... 33 Future work and improvements. .............................................................................................................. 34
General System Improvements............................................................................................................ 35 Graphical User Interface Improvements. ............................................................................................. 35
- 1 -

NIDS Graphical Visualization Model Improvements. ........................................................................... 36 HIDS Graphical Visualization Model Improvements. ........................................................................... 37
4. Conclusions. ............................................................................................................................................ 38 References. ................................................................................................................................................. 39 5. Appendixes.............................................................................................................................................. 40
Appendix 1. Project Specification Browsing Instructions......................................................................... 40 Appendix 2. Deploying the GIDS............................................................................................................. 41
1. Configuring the GIDS Database. ..................................................................................................... 41 2. Configuring and running the Host Agents (SNMP Agents).............................................................. 43 3. Configuring and running the HIDS Collector Agents. ...................................................................... 45 4. Integrating Snort Sensors to the GIDS. ........................................................................................... 46 5. Configuring and running the IDS Server. ......................................................................................... 47 6. Configuring and running the Graphical Client. ................................................................................. 49
- 2 -

1. Introduction.
This document reviews basic intrusion detection concepts as well as some interesting non-traditional graphical approaches to the same matter. Based on such approaches’ inherent advantages, a graphical intrusion detection system (GIDS) that aims to integrate graphically a light-weight host intrusion detection system with a fully functional network intrusion detection system is developed. Finally, the GIDS client user interface is described, explaining its visualization models through captures taken from the operational graphical client.
Specifically, this project’s scope is stated as: designing and implementing a basic functional Graphical Intrusion Detection System, by combining and integrating seamlessly a light-weight host intrusion detection system with a fully functional network intrusion detection system in a graphical non-traditional fashion.
Note that this document describes the required background concepts to develop the GIDS project as well as its overall design and results, however, the project implementation (source code and binaries) and its detailed documentation are available on the “GIDS Project CD”.
The rest of this document is organized in four sections, briefly described below:
Part 2. Intrusion Detection: Key concepts. This section reviews some relevant background concepts regarding classical intrusion detection systems and introduces some innovative graphical approaches to the same subject, many of which inspired this project.
Part 3. The GIDS Project. This section describes the GIDS Project main aspects, namely, its requirements, its overall design, some proposed deployment architectures, the graphical client user interface (thoroughly explaining its visualization models, both from their intrinsic geometric properties as well as from their practical implementation on the GIDS client), and some further work and improvements.
Part 4. Conclusions. This section states the GIDS Project conclusions.
Part 5. Appendixes. This section contains detailed instructions for navigating the project detailed documentation and for deploying the system, particularly, explaining how to configure and run each of the system components.
- 3 -

2. Intrusion Detection: Key concepts.
Definition. The first issue to be addressed when discussing about intrusion detection is the definition itself of an “intrusion”: It is generally accepted in the context of computer systems and networks that an intrusion is the presence of unauthorized system or network activity in any of such systems [9]. The intrusion definition is quite vague as the intrusion event itself can take many forms, such as a valid user trying to escalate his privileges, a worm or a virus wasting host and network resources while running and spreading, or an unauthorized user (or machine) trying remotely to access a confidential corporate database.
Why intrusions happen. If we lived in a perfect world, intrusions wouldn’t happen because people would not be interested in purposefully misusing computer or network resources, computer programs would do exactly what they were designed to do and the Internet would have been designed with integrated security from its first days.
However, for a plethora of reasons such as obtaining free (or cheap) resources like bandwidth or disk space, gathering valuable or confidential information, emotional and political motivations [9], and personal pride, amusement or satisfaction, there is a bunch of people trying to access computer systems without being authorized to do so.
Also, it must be considered that when the Internet was designed, the main goal was open communication, and security was not a priority [2],[4]. As a result of such design, attacks and intrusions through the Internet are relatively simple to perform.
In fact, there are a lot of scripts and applications that allow script-kiddies to automatically scan for “vulnerable” machines and networks through the Internet or Intranets in order to identify potential targets that can be intruded and misused.
It is also important to note that not all intruders are humans, or humans deliberately using applications to intrude computer systems, but some of them are simply buggy applications that misuse computer resources in a way they are not supposed or expected to.
The importance of intrusion detection. Up to this point, it has been explained what an intrusion is, why it happens and by who it is performed. The next issue to be considered is the importance of detecting intrusions as soon as they start taking place: If the intrusion event was the goal itself, the vast majority of intrusions would be completely irrelevant and there would be no point in devoting resources (technical and human) to their detection.
However, the problem with intrusions is not constituted by the intrusions themselves, but with their consequences: There is no harm with an unprivileged user escalating its privileges, the harm is in what the user does invested with those privileges; there is no harm when an unauthorized user accesses confidential information, the harm is in what he does with such information.
In fact, the most important reason for intrusion detection is the prevention of potential financial loss generated by the intrusion [2],[4]. When a worm spreads through the corporate network, it is wasting the money that the company is investing on network resources; when an intruder vandalizes a company’s website, the reputation of the company is damaged and financial loses might arise as a result of the intrusion event, because of the loss of confidence by the market.
- 4 -

In order to avoid the financial damage generated by intrusions, specialized software and hardware has been designed over time to identify and notify as soon as an intrusion event starts taking place. Such software and/or hardware receive the generic name of intrusion detection systems (IDSs), which are classified into several families, mainly depending on the strategies that they use to identify intrusions, on how they react to intrusions or where they are placed in the monitored system.
The goal and classification of IDSs. IDSs ultimate goal is to identify and report all intrusions as so and ignore all normal events, in other words, the perfect (ideal) IDS would have a false negative rate -percentage of intrusion events misclassified as normal events- equal to zero as well as a false positive rate - percentage of normal events misclassified as intrusions- equal to zero because it would not misidentify any normal event with an intrusion.
While some IDSs identify intrusions using a known good approach, some others use a known bad approach [5],[9]. The first family is known as “misuse detection based IDSs” as they work learning the “normal” state of the system (usually through neural networks or fuzzy logic techniques) and identify intrusions detecting deviations from such “normal state”.
The second family is known as “anomaly detection IDSs” because they identify intrusions by matching them with a predefined database of patterns that are considered anomalous. Such patterns are also known as signatures or rules, thus giving this family the name of “signature based” or “rule based” IDSs.
Misuse detection based IDSs are useful in slowly changing environments because the system “normal state” can be determined accurately, whereas in dynamic environments it is hard to know what “normal” is, thus complicating the intrusion detection task.
On the other hand, anomaly detection IDSs are very handy when placed in dynamic environments because they know how to identify intrusions regardless of how rapidly the system changes. However, their drawback is that they must have knowledge of all possible intrusion patterns in order to identify all intrusions, which is know to be an intricate task as new intrusion patterns appear almost everyday, complicating the rule set maintenance (keeping it up to date and accurately tuned with the monitored system).
As a matter of fact, the success of a rule/signature based IDS is mainly determined by the selection and tuning of its rules: If the rule set is too general or the rules define patterns that are too general, the false positive rate will tend to be very high, thus generating too many false alerts. On the other hand, if the rule set is kept out of date, if it does not have enough rules, or if the rules are too specific, the false negative rate will tend to be quite high, therefore missing a lot of intrusion events.
Similarly, the success of a misuse based IDS is determined by how updated and accurate the “normal” state is kept, for the reason that if the system changes and the “normal” state is not updated accordingly, both false negatives -and particularly- false positives will tend to increase.
Besides, there are two main risks when updating the “normal state”: First, the system is not expected to be intruded frequently when building it because such frequent intrusions might be recognized as “normal” events afterwards, thus increasing the false-negative rate, and second, the “normal” state must be comprehensive enough to incorporate all possible system states considered as normal, as any normal state not incorporated into the “normal” model will be considered as an intrusion, consequently raising the false negative rate.
Other important IDS classification is based on their functionality and location in the monitored computer system, specifically, three families are distinguished using this criterion [9]:
- 5 -

• NIDS: Network Intrusion Detection Systems. (Figure 1)
These systems detect intrusion events across a whole network segment. They are normally placed on an independent machine that silently sniffs and detects intrusions in the network traffic transported across the monitored network segment. It does not place any overhead in the monitored system.
Figure 1. Network Intrusion Detection System Layout [9].
• HIDS: Host Intrusion Detection Systems. (Figure 2)
These systems detect intrusion events affecting a single host. They usually run at the same host being monitored, consuming (often a lot of) resources, which often renders their deployment counterproductive.
Figure 2. Host Intrusion Detection System Layout [9].
- 6 -

• DIDS: Distributed Intrusion Detection Systems. (Figure 3)
These systems consist in a combination of NIDS sensors (For example, on a switched network or an Intranet consisting on several IP networks, more than one NIDS sensor might be necessary to monitor all network traffic), a combination of HIDS sensors (if more than one host is being monitored) or a combination of both NIDS and HIDS sensors
Figure 3. Distributed Intrusion Detection System Layout [9].
Finally, it is important to understand what an IDS does once an intrusion attempt is detected [9]: While a few IDSs are capable of deploying counterstrikes, or in general terms, actively responding to the intrusion (for example, dropping a suspicious network connection, or finishing the intrusion process at the intruded host), most IDSs respond passively to the intrusion event. Such passive response usually consists on a textual log entry displayed through a computer screen, logged into an intrusion log file (as shown in Figure 4) or database, or sent via email or SMS to a pager or mobile phone.
Figure 4. Example of an IDS log file generated by Snort [10], one of the most popular open source NIDSs.
- 7 -

Graphical Intrusion Detection: Motivation and previous work.
As it has been just mentioned above, the vast majority of IDSs notify intrusion events through text logs that are presented to an analyst and/or stored into a log file or database.
Although such logs have significant relevance during retrospective intrusion analysis, they are rarely used for real time intrusion detection because log analysis is a complicated and time consuming task. Furthermore, in order to figure out that an intrusion is taking place many logs might need to be correlated and many entries in the same log happening at different moments in time might need to be related to get the “big picture” of the intrusion event.
Moreover, the complexity of textual log analysis is a natural consequence of the way humans (and most machines) process textual information, which is a perceptually serial process [2]. In other words, most humans when presented with a collection of text lines won’t see the “overall picture”, but will read one line after the other sequentially because it is what culturally we have learned to do.
On the other hand, graphically encoded information has a lot of advantages over textually encoded information because the first is processed by humans using a perceptually parallelized process [2]. Such parallelism makes graphical information encoding very useful (when a proper graphical model is selected) in cases where there is a lot of complex interrelated information [1] spanning many dimensions (such as time, space, actors) to be shown.
Furthermore, graphical representations do not only compress spatially the encoded information, but reveal many hidden relationships in the data making them evident not only to humans, but to machines. That is because most graphical representations are based on mathematical models that can be used by machines to detect relationships and deviations, not from the original textual set of data, but rather from the mathematical model depicted graphically.
Although the advantages of graphical visualization over textual visualization are indisputable, not many IDSs have been provided with advanced graphical visualization user interfaces that exploit those advantages. It is important to clarify that although most IDSs have some sort of GUI (Graphical User Interface), such interfaces do not make any use of advanced or elaborate visualization techniques, but are rather limited to lay out the intrusion event logs in tables (using colors and font properties). Such textual information layout does facilitate the intrusion analysis tasks; nonetheless, the analysis is still performed on textual information with the respective disadvantages mentioned at the beginning of this section.
Some examples of this kind of IDS user interfaces are ACID (“Analysis Console for Intrusion Databases”) [8],[9] , SGUIL (Snort GUI for Lamers) [6],[9] and IDEA (“Intrusion Detection Exchange Architecture”) [7]. All three examples provide user interfaces pluggable to Snort-generated intrusion alerts databases, and as it is possible to appreciate in Figure 5, Figure 6, and Figure 7, as much as GUIs are provided, the information is presented in a fundamentally textual based manner.
- 8 -

Figure 5. ACID User interface. Taken from: http://www.snort.gr.jp/docs/acid/acid4.gif [5].
Figure 6. SGUIL User interface. Taken from: http://sguil.sourceforge.net/images/0.5/portscan.png
- 9 -

Figure 7. IDEA User interface. Taken from: http://idea-arch.sourceforge.net/images/console_screen2.jpg
Despite of the lack of “pure” graphic intrusion detection user interfaces in commercial and open source IDSs, several interesting papers have been written exploring novel and interesting visualization techniques that inspired this project. Among those papers, [4] suggest a visual behavior characterization model for intrusion and misuse detection depicted in Figure 8.
Figure 8. Visual model proposed in [4]
In [2] presents an interesting visual model for intrusion events originated from any number of machines affecting a single host. Such model is based on glyphs, which are “decorated” arrows briefly described in Figure 9 and shown working in Figure 10.
- 10 -

Figure 9. Main characteristics of the visual intrusion detection model based on Glyphs [2]
Figure 10. Glyph based visual intrusion detection model working [2]
- 11 -

Complementarily, in [1] and [5] a visualization model for anomaly based host intrusion detection is presented, consisting on geometric shapes called “spicules”, which result from the deformation of a sphere, as shown in Figure 11.
Figure 11. Ideal spicule form. According to the Webster online dictionary, a spicule is “a slender pointed usually hard
body”. According to [1], a spicule is “a spheroid geometric primitive”.
Particularly, in [1] the spicule visualization model is explained, describing its main characteristics and providing a simple 2D spicule representation (Figure 12). The main idea behind using spicules for host anomaly detection is employing their spikes (protuberances) as monitored resources graphical metaphors. Such spikes’ length, width and –particularly- the angle they describe with respect to the equator plane are given semantic meaning to indicate the state of the resource represented by the spike. Ultimately, capturing hosts states from the monitored host under normal circumstances will generate a 3D spicule graphical model representing how the monitored host should look like under these conditions (normal state). Once defined, such normal state can be tessellated (combined graphically) with the current state spicule in order to detect deviations between the normal state spicule spikes and their current state counterparts, as well as allowing the visual intrusion detection task by making evident the deformation of the “normal” spicule shape.
Figure 12. 2D Spicule representation. [1]
- 12 -

Finally, in [5] a 3D approximation to the spicule shape described in [1] is presented. Such representation does not give any volume representation to the spikes, but simply represents them as two dimensional colored vectors, as shown in Figure 13.
Figure 13. Spicule 3D approximation model, as presented in [5]
The visualization models presented in [1] and [5] (Spicule) and in [2] (Glyphs) were the main motivation for this project as they were found to be simple yet capable of presenting, summarizing and relating graphically big amounts of information that could be visually interpreted by humans in order to quickly find intrusions. Furthermore, it was judged that combining and interrelating these models in a single user interface would empower the intrusion analyst not only to detect graphically intrusion attempts through the models, but to get the big picture of an intrusion simultaneously from the network traffic and the involved host states’ changes.
- 13 -

3. The GIDS Project.
This section shows the GIDS project design, listing the characteristics expected from the proof of concept application, describing the components integrating it and their detailed design. Subsequently, the NIDS and HIDS graphical visualization models are explained, describing their characteristics and how they effectively encode intrusion information. Finally, some improvements and future work on the GIDS project design and implementation are presented.
Overall Project Description and Requirements The system developed by this project aims to integrate visually a host intrusion detection system and a network intrusion detection system based on some previous work presented mostly in [1] and [2], Particularly, such system is expected to:
• Encode IDS information in a non-textual graphical fashion.
• Facilitate the graphical correlation of HIDS and NIDS data.
• Allow multiple users to connect simultaneously to the system in a distributed fashion.
• Being able to run in real time and retrospective modes. Real time mode will allow users to detect network intrusions as soon as they start happening, while retrospective mode shall allow them to perform intrusion analysis over existing (previously collected) NIDS and HIDS information.
General Design. In order to satisfy the requirements presented above and ultimately achieve the project goal, the GIDS Project has been designed as a six component system (Figure 14), each of which is explained later on this section.
Figure 14. Graphical intrusion detection system components.
- 14 -

Globally speaking, the GIDS is integrated by a misuse detection HIDS, an anomaly detection NIDS and a graphical front end. In fact, technically speaking, it could be classified as a hybrid graphical distributed intrusion detection system.
A misuse detection HIDS has been chosen because it is easier to identify intrusions as abnormal states that deviate from a hosts’ “normal” state. Interestingly, if the spicule model presented in [1] is used (as it has been planned to), over time the HIDS could also detect anomalies because such model allows the extraction of “attack spicules” that could be later employed as intrusion signatures. However, to achieve this kind of behavior, each “type” of intrusion needs to happen on different monitored systems in order to obtain a refined attack spicule representing the intrusion. Consequently, in the first phase of this project the HIDS is only acting as a known good IDS.
As it was mentioned before, most HIDSs normally run at the hosts they monitor, which was to be avoided given that it was desired to generate as little overhead possible on the monitored hosts. Since no suitable HIDS was found to be integrated into the project, it was decided to implement a simple HIDS based on host agents and proactive collector agents. The host agents were to be responsible of collecting host status information (from the hosts where they were running at) making it available to the collector agents, which in their turn collected such information, sending it to a storage facility for later intrusion detection purposes.
Having decided the HIDS approach, an anomaly detection NIDS was chosen because it adapts easier to wherever environment it might be installed. Further, determining what “normal” network traffic is, tends to be quite a cumbersome and complex task, therefore ruling out the use of a misuse detection NIDS. Moreover, given that the project’s main concern was graphical intrusion detection data visualization, the idea was to integrate an existing NIDS and an existing HIDS to devote most effort to graphical representation of information generated by these systems. For that reason, Snort [1] came as an ideal NIDS candidate because it is open source, it has been deeply tested, it is widely used, it is vastly documented and its rule set is comprehensive and kept up to date.
Once defined the NIDS and HIDS global approaches, all system components presented in Figure 14 are described below.
Host Agents (HIDS Agents). This component periodically collects status information from the host where it is being executed, making the latest version of such information (current host state) available to the HIDS collector agent responsible of monitoring this host. The idea behind making such information available is to detect anomalies (possible intrusions) when one or more of these variables values deviate radically from their “normal” or average values, which are computed by the IDS Server component.
Status information is composed of a set of variables determining the condition of a given host at a given time. Such variables are normally related to resources, times or quantities measurable at the host, for example: percentage of used memory, percentage of used disk space, processor load, number of processes, uptime and number of logger users among many others.
In fact, it was found that SNMP agents [14],[15] implementing the Host resources MIB [16] could be used as HIDS host agents based on the fact that these agents provide a plethora of host status information and exhibit the following additional advantages:
- 15 -
• They are based on open standards such as [14], therefore making their implementation feasible by anyone who desires or needs to do so.
• There are plenty of SNMP agents available for many operating Systems. Particularly, Ms Windows1 comes with an integrated SNMP agent implementing the Host Resources MIB [16].
• Almost any host’s measurable resource can be monitored using the Host Resources MIB [16], or some other MIB, which can be integrated into existing SNMP agents.
• Most SNMP agents consume little resources as they don’t do any processing, just query information from the host periodically or when requested.
Host agents (SNMP agents) were determined to provide some minimum number of monitored host state variables to collector agents in order to build acceptably complete normal host states. Such variables are all included in the Host resources MIB [16], so that any SNMP agent implementing such MIB could be integrated to the system. Particularly, host agents were to provide status information regarding the following variables:
• Uptime. Number of milliseconds passed since the host was last booted.
• Number of logged on users. Number of users currently logged into the host.
• Number of processes. Number of processes (both user and system) running at the host.
• Processor load. Processor usage percentage.
• Main memory (RAM) usage. Percentage of used main memory.
• Virtual memory usage. Percentage of used virtual memory.
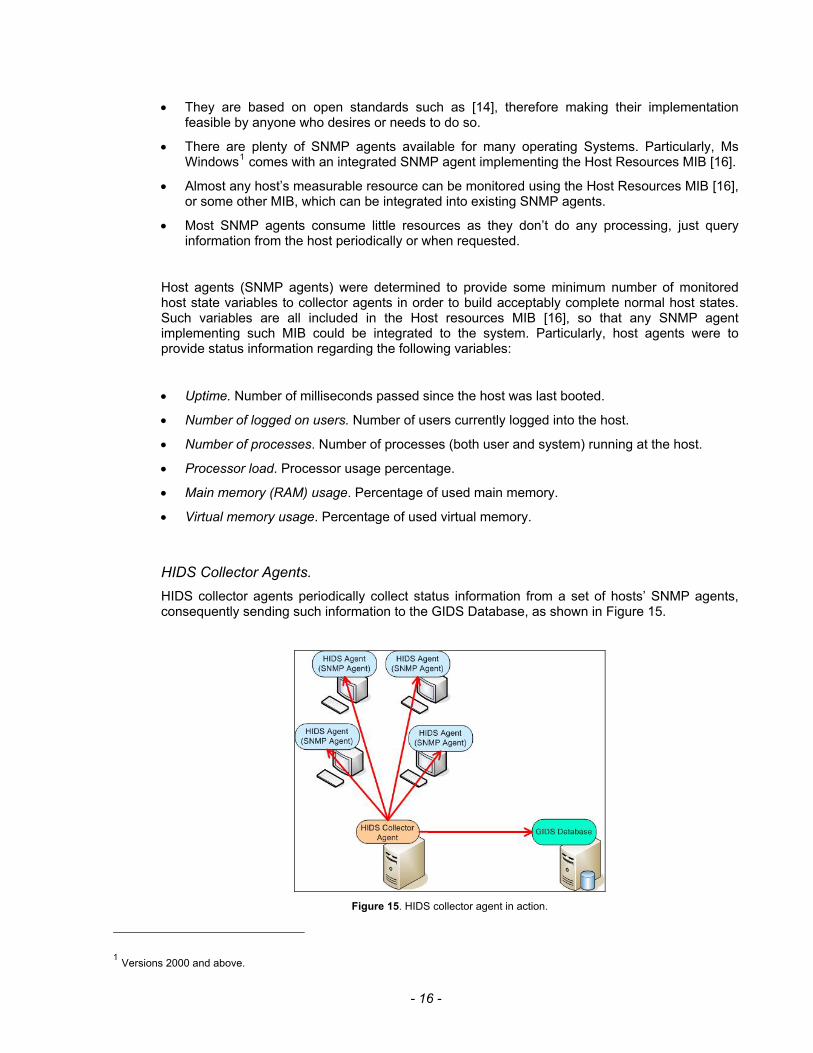
HIDS Collector Agents. HIDS collector agents periodically collect status information from a set of hosts’ SNMP agents, consequently sending such information to the GIDS Database, as shown in Figure 15.
Figure 15. HIDS collector agent in action.
1 Versions 2000 and above.
- 16 -

These agents must be able to collect information from a set of hosts given their names, even when their IP addresses change (for example, in a DHCP enabled network).
If an error contacting any of the monitored hosts should arise, it is to be logged into the GIDS Database. Furthermore, the agent is expected to keep working even when some or all the monitored hosts go offline.
Note that more than one HIDS collector agent might be necessary when monitored hosts are connected to disjoint networks, because a single agent might not be able to reach all monitored hosts, as shown in Figure 16.
Figure 16. Disjoint networks: More than one HIDS agent is needed to collect states from all monitored hosts.
The HIDS collector agent implementation is expected to be composed of four main components (Figure 17): A SNMP component (hidsAgent.snmp package) that communicates and queries the monitored hosts’ SNMP agents, an Entities component (entities package) defining object like representation for monitored hosts, their states and the agent itself; a Database access component (dao and dao.agent packages) used to send collected host status information and runtime errors (such as an unreachable hosts) to the GIDS Database, and a Scheduler and Controller component (hidsAgent. daemon package) responsible of scheduling and controlling information retrieval (from the monitored hosts) and information dispatching (to the database).
Figure 17. HIDS collector agent components.
- 17 -

Table Name Field Name Descriptionhids_agents Information About the HIDS Collector Agents
hids_agent_id Agent IDagent_name Agent Name
last_updateTimestamp of the last host state inserted into the database by this agent
agent_ip Last known agent IP addressagent_description Agent description
hosts Information about the monitored hostshost_name Host namehost_os Host operating systemhids_agent_id HIDS Collector agent responsible for this host
host_states Host states informationhost_status_id Host state ID
host_idMonitored host from which this state was collected
timestamp Timestamp at which this state was captured from the monitored host
host_ip Host IP addresstime_up Host uptimenum_users Number of users logged on the hostnum_processes Number of processes running at the hostprocessor_load Processor loadmemory_ram_total_size Main memory sizememory_ram_used_size Used main memorymemory_virtual_total_size Virtual memory sizememory_virtual_used_size Used virtual memory
error_messages Error messages (Global categories)error_message_code Error message IDerror_message_descr Error message (category)
errors HIDS Collector Agents and IDS Server errorserror_id Error IDerror_specific_descr Specific error descriptiontimestamp Error timestamperror_message_id Error global category
agent_id HIDS Collector Agent where the error was generated
host_id Monitored host that caused the error
Table 1. HIDS Database schema entities description.
- 18 -
NIDS Agents (Sensors). As it was mentioned above, Snort [10] was selected to be integrated into the project as the NIDS main component. In fact, it was found that it did not only scan network traffic for intrusions, but also provided an output plug-in that automatically logged these intrusion alerts into a database (SnortDB plug-in [20]), which was exactly the treatment the GIDS required for all intrusion alerts.
As well as with HIDS collector agents, it is important to be aware that more than one NIDS sensor might be necessary when monitoring switched or disjoint networks, because not all monitored network traffic might be accessible at the Snort sensor location.
Finally, it must be noticed that Snort inner workings as well as proper Snort configuration and tuning are topics outside the scope of this project; hence, if more information regarding those topics is required, the reader is strongly encouraged to visit [10] or read [9].
GIDS Database. This component constitutes the central information repository where both NIDS intrusion alerts and monitored host states are to be stored in order to be later retrieved and/or processed by the IDS server.
Although all intrusion detection information passes through the GIDS database before being processed by the IDS server, this architecture serves both for retrospective as well as real time intrusion detection. The latter is performed using the most recent information appended to the database whereas the first is done using older information previously inserted into the database by the HIDS collector agents and the NIDS agents (Snort sensors).
The NIDS alerts database schema can be found at [21] or in the GIDS Project CD, at “Docs/Diagrams/Database Schemas/nids_shema.pdf” and its documentation can be found at [20]. The HIDS database schema can be found at the GIDS Project CD, at “Docs/Diagrams/Database Schemas/hids_shema.pdf” and its description is summarized in Table 1.
IDS Server. The IDS Server component is to communicate both with the GIDS database and the connected graphical clients, acquiring NIDS alerts information as well as host states from the database, processing them and sending them to the graphical clients when requested. Actually, NIDS alerts do not need further processing because the Snort sensors deployed through the monitored network resolve all information regarding these alerts, storing it at the GIDS database. Conversely, host states do need further processing by the IDS Server in order to extract intrusion patterns from such states by determining “normal” host states and comparing them to collected host states in order to detect deviations that might be indicators of an intrusion.
The IDS Server global architecture is shown in Figure 18, where the following components can be distinguished:
• DAO (dao and dao.server packages): This component is responsible for the communication between the IDS Server and the GIDS Database, specifically, it was decided that the server was to use JDBC (Java Database Connectivity) [18] to communicate with the GIDS Database, mainly because it allowed the server application to be independent from the particular DBMS implementation being used by the GIDS Database.
- 19 -

• IDSServer (idsServer package): This component is responsible of “normal” host states determination, NIDS intrusion alerts and monitored host states caching, and graphical clients façade definition and implementation. Note that the communication between graphical clients and IDS Server was decided to be implemented using RMI (Remote Method Invocation) [19], primarily because of its simplicity and author’s expertise with this particular technology.
• Entities (entities package): Defines object-like representations for monitored hosts, their states, HIDS collector agents, NIDS agents and NIDS intrusion alerts.
Figure 18. IDS Server components
Graphical Clients (GIDS Clients). It could be said that Graphical Clients are the GIDS main component as their task is to display IDS information graphically using non-traditional visualization models, based on information provided by the IDS Server.
As it was stated in the project requirements, the graphical client was expected to run both in real time as well as retrospective mode. The first mode only required the last NIDS and HIDS states to be graphically displayed via the user interface, while the second required that HIDS and NIDS information generated during the retrospective session period could be navigated and recreated (i.e. animated) in the user interface. In order to accomplish such requirements as well as the others defined before, three vital issues remained to be resolved for this component: the HIDS visualization model, the NIDS visualization model, and the integration model; each of which is explained below.
The HIDS Visualization Model.
The HIDS visualization model was determined to be an adaptation from the spicule based model presented in [1] (Figure 12). Such model was selected because it intrinsically exhibits deviations from a normal state, which is determined by a combination of several monitored host variables values (such as the ones provided by the HIDS agents).
- 20 -

Let us recall that spicules can be defined as degenerated spheres whose spikes (protuberances deformating the sphere) can be used to track the state of a set of variables. Specifically, when a spike is given a fixed longitude, the value of the variable it represents can be measured using the latitude of the spike (ranging between the equator and the north pole). Actually, [1] presents a model that gives semantic meaning to the spicule nucleolus and the spikes’ length, however, for this project only the latitude of the spikes is to be given a particular semantic meaning.
In fact, the later approach is the same taken in [5], where the visualization model (Figure 13) seemed quite simple because the spikes were plain 2D lines. It was then decided to adapt such model so that the spikes would be modeled as fixed length cones with their bases positioned at the center of the spicule, providing more volume and better appearance to the overall spicule shape. Further, each spike (cone) would have a permanent assigned color depending on the variable it represented.
The spicule visualization model just described displays a given host state in a snapshot, however, it would not be useful for intrusion detection if the user could not compare it with the normal (expected) host state. Thus, each monitored variable was to be represented twice at each host state spicule: A solid colored cone was to represent the current variable state while another wire-framed cone (of the same color) was to represent the normal (expected) state of such variable. The incorporation of the normal host state into the spicule representation completes the HIDS visualization model as it allows visual comparison between captured host states and calculated normal host states, based on relationships between monitored variables and combined deviations from expected states.
The NIDS Visualization Model.
The NIDS visualization model was inspired by the glyph based model presented in [2] (Figure 10). Although such model is intended to show intrusions on a single monitored host, it was extended in order to enable it to encode intrusion alerts affecting a set of selected hosts.
In fact, while the model presented in [2] places the monitored host at the center of the scene and the attacker hosts surrounding it (using concentric rings centered at the monitored host), the proposed NIDS visualization model lines all monitored hosts horizontally on the top of the visualization scene and lays out attacking hosts on “level lines” parallel to the monitored hosts using the rest of the scene (at the bottom of the monitored hosts).
This model groups spatially the monitored hosts o a single row, where they can be represented using a predefined host icon that textually indicate their host names and last known IP addresses. The rest of the scene is filled by level lines where the attacking hosts are laid out. Such level lines are horizontal lines placed below the monitored hosts representing the importance or relevance of the attacker hosts. For instance, the level line just below the monitored hosts might contain all hosts in the same monitored network, the next might contain attacking hosts with IP addresses assigned by the same ISP and the southernmost line might contain all other attacking hosts. Although filtering policies can be very refined, the GIDS client is expected to provide a simple way to customize such filters, particularly based on IP addresses patterns.
Attacking hosts are to be automatically placed as bold dots on the level lines just described above. If a monitored attacker host is clicked, its information must be displayed via the graphical client user interface; otherwise, some kind information regarding such “non-monitored” host must be shown through an external window (i.e. A browser window) using an external data source (for instance, a whois query or a reverse DNS query).
Intrusion alerts are to be shown as line segments connecting attacker hosts to their respectively attacked (monitored) hosts. Such lines should encode intrusion information through the line’s color, width and alpha (transparency) values, as explained below:
The color is used to represent the alert priority: red means high priority (critical) alerts, yellow means intermediate priority alerts and blue means low risk alerts. Note that such classification is based on the levels assigned by the Snort sensor depending on the signatures matched by the intrusion events [9]).
- 21 -

The alert line width represents the relative alert frequency, which is the concentration of identical alerts during a fixed interval of time, ending at the moment being represented by the NIDS scene (t) and stating at (t- r), where r is defined as the “Reiterativity window”. The concept of relative alert frequency allows the model to provide higher visual relevance to frequent and reiterative alerts facilitating the identification of intrusions based on their persistence in time.
The alert line alpha value is necessary because NIDS scenes do not show intrusion information at time t, but rather during interval [t-r,t], where r is the alert’s “Decay time”. The use of this attribute is pertinent because showing an interval of time enriches the visualization model giving it a historical (time based) dimension, worth being considered as intrusion patterns might arise not only at precise moments but during relatively short time intervals.
Thus, for the model to visually distinguish the time when alerts happen (it is necessary to know which alerts are recent and which happened in the past) the alpha value is used: the older the alert, the higher its alpha value, so newer alerts will appear solid-colored while older ones will appear almost transparent, blending themselves with the background of the scene.
The Integration Model.
It was required that both visualization models were somehow integrated. Such integration was obtained by synchronizing the HIDS and the NIDS models on the following events:
• When a given host state was selected, its spicule was generated and shown. At the same time, the NIDS scene was built showing the time when the selected host state was generated.
• When a NIDS scene was generated representing time t and a monitored host was selected, the displayed host state was to be updated to the one generated at time t.
• In case a monitored host or a monitored attacker host was selected on the NIDS scene, their information as well as their HIDS state at the same time of the NIDS scene was to be shown.
Graphical Client Architecture.
In order to implement the GIDS Client, five main components were determined to be required as shown in Figure 19: The Spicule and NIDS Scene components would be responsible of generating the HIDS and NIDS visualizations respectively; the UIController component would be responsible of controlling and coordinating the user interface depending on its operation mode (real time or retrospective), delegating on the Real Time Controller when necessary. Finally, the Cache component would be responsible of fetching and caching NIDS alerts as well as host states when the client was running in retrospective mode. Such approach seemed necessary for efficiency reasons, as big amounts of information would be required by the visualization models, especially when running animations (a particular set of host states and/or NIDS scenes being displayed consecutively over a period of time).
- 22 -

Figure 19. Graphical client components.
GIDS Graphical Visualization Models. This section further explains the presented visualization models, illustrating and commenting some captures generated by the graphical client implementation. At the same time, heuristics are given to interpret and use these visualization models for intrusion detection purposes.
HIDS Graphical Visualization Model. Figure 20 shows a spicule where solid spikes (current state) and wire-framed spikes (normal state) of the same color create small angles, representing small deviations from the host expected state. Note that the bigger the angle between spikes of the same color, the bigger the deviation from the variable expected state.
Figure 20. Spicule representing a host state subtly deviated from the “normal” state.
- 23 -

By default, spikes are mapped to colors as shown in Table 2.
Variable represented by the Spike. Spike Color.
Uptime. Magenta
Number of logged on users. Blue
Number of processes. Green
Processor load. Red
Main memory (RAM) usage. Cyan
Virtual memory usage. Orange
Table 2. Spikes color coding.
It can be observed on Figure 20 that the logged on users spike (blue) is not accompanied by a blue wire-framed spike. It is important to note that wire-framed spikes are always rendered, so whenever it is not possible to see them, it is because the current state spike matches exactly the expected state spike. Particularly in this case, the current number of logged on users corresponds exactly to the expected number of such users. Further, Figure 21 depicts a host state identical to the expected host state, and therefore, no wire-framed spikes are visible.
Figure 21. Spicule representing a host state identical to the “normal” state.
Although Figure 21 shows a host matching its ideal expected state in all monitored variables, this kind of behavior does not occur often because most hosts normally present slight variations from their expected or normal states. Moreover, such states are not exact predictions, but rather calculated approximations to the hosts’ normal states, based on historical behavior and prone to error due to the calculation process as well as anomalies incorporated into the normal model. Consequently, the intrusion analyst should expect to encounter spicules more like the one shown in Figure 20, characterized by slight deviations in some of the monitored variables.
In fact, what the user has to be aware of are those spicules where many solid spikes describe big angles with their wire-framed counterparts, as shown in Figure 22.
- 24 -

Figure 22. Spicule representing a host state highly deviated from the “normal” state.
Notice that two conditions are met by Figure 22: first, most solid state spikes are very close to the spicule’s north pole, indicating a high level of resources being used, and second, these spikes comprise big angles with their wire-framed counterparts, showing that such behavior is highly deviated from the expected one.
It must be noted that the latter condition is what really determines the intrusion event, while the first just gives a hint of it. In other words, for an intrusion to be identified via the spicule model, it is necessary that the current state spikes are deviated from their expected state counterparts, regardless of the monitored variables current values, which can be very low or very high. Indeed, it might be the rule for a given host to keep its monitored resources underused, or on the contrary, consume most of such resources (as shown by Figure 23). In any case, such situations describe normal states without indicating an intrusion, or graphically, no matter how close to the north pole (or the equator) the solid spikes are, as long as they are close to their wire-framed counterparts.
[INSERT FIGURE: spiculeHighLoad.jpg]
Figure 23. Spicule representing a highly loaded host. Note that although all current state spikes appear near the north pole, there is not intrusion event being shown because all solid spikes describe small angles with their wire-framed
counterparts.
- 25 -

Lastly, Figure 24 shows a spicule representation where one variable -processor load (red)- is highly deviated from its expected state, another variable –main memory usage (cyan) is slightly deviated from its expected state and all the other monitored variables are relatively non-deviated from their expected states. This situation describes a scenario where it cannot be immediately decided whether there is an intrusion attempt being shown by the model or not. Note that there are only two variables showing deviations (actually, one and a half because the RAM memory usage does not appear to be highly deviated). As a matter of fact, such spicule could either represent the state of a host at the moment when a resource demanding application was launched, therefore increasing the processor and RAM memory usage, or an intrusion event where the processor and the main memory are being consumed by the intruder.
In order to help the user deciding which situation is being represented by the spicule, it must be born in mind that it cannot be considered neither isolated in time nor in space, because the host it represents has a state history and is surrounded by another machines. Thus, past states must be examined in order to determine if the deviation corresponds to a sudden event or responds to an expected pattern, and the NIDS scene must be checked for graphical hints of intrusion events affecting the studied host generated by other hosts.
Figure 24. Spicule representing a host state deviated from the “normal” state on two variables.
NIDS Graphical Visualization Model.
Figure 25. NIDS Scene: SNMP queries (yellow) & port scan intrusion alerts (blue).
- 26 -
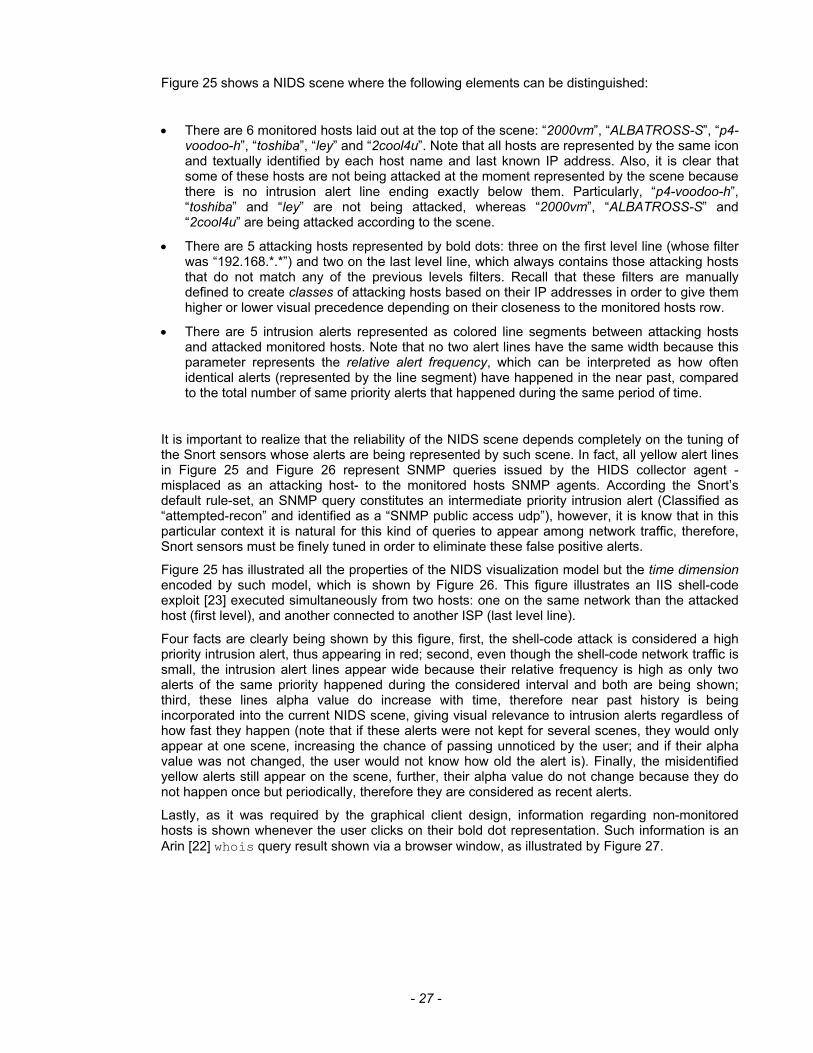
Figure 25 shows a NIDS scene where the following elements can be distinguished:
• There are 6 monitored hosts laid out at the top of the scene: “2000vm”, “ALBATROSS-S”, “p4-voodoo-h”, “toshiba”, “ley” and “2cool4u”. Note that all hosts are represented by the same icon and textually identified by each host name and last known IP address. Also, it is clear that some of these hosts are not being attacked at the moment represented by the scene because there is no intrusion alert line ending exactly below them. Particularly, “p4-voodoo-h”, “toshiba” and “ley” are not being attacked, whereas “2000vm”, “ALBATROSS-S” and “2cool4u” are being attacked according to the scene.
• There are 5 attacking hosts represented by bold dots: three on the first level line (whose filter was “192.168.*.*”) and two on the last level line, which always contains those attacking hosts that do not match any of the previous levels filters. Recall that these filters are manually defined to create classes of attacking hosts based on their IP addresses in order to give them higher or lower visual precedence depending on their closeness to the monitored hosts row.
• There are 5 intrusion alerts represented as colored line segments between attacking hosts and attacked monitored hosts. Note that no two alert lines have the same width because this parameter represents the relative alert frequency, which can be interpreted as how often identical alerts (represented by the line segment) have happened in the near past, compared to the total number of same priority alerts that happened during the same period of time.
It is important to realize that the reliability of the NIDS scene depends completely on the tuning of the Snort sensors whose alerts are being represented by such scene. In fact, all yellow alert lines in Figure 25 and Figure 26 represent SNMP queries issued by the HIDS collector agent -misplaced as an attacking host- to the monitored hosts SNMP agents. According the Snort’s default rule-set, an SNMP query constitutes an intermediate priority intrusion alert (Classified as “attempted-recon” and identified as a “SNMP public access udp”), however, it is know that in this particular context it is natural for this kind of queries to appear among network traffic, therefore, Snort sensors must be finely tuned in order to eliminate these false positive alerts.
Figure 25 has illustrated all the properties of the NIDS visualization model but the time dimension encoded by such model, which is shown by Figure 26. This figure illustrates an IIS shell-code exploit [23] executed simultaneously from two hosts: one on the same network than the attacked host (first level), and another connected to another ISP (last level line).
Four facts are clearly being shown by this figure, first, the shell-code attack is considered a high priority intrusion alert, thus appearing in red; second, even though the shell-code network traffic is small, the intrusion alert lines appear wide because their relative frequency is high as only two alerts of the same priority happened during the considered interval and both are being shown; third, these lines alpha value do increase with time, therefore near past history is being incorporated into the current NIDS scene, giving visual relevance to intrusion alerts regardless of how fast they happen (note that if these alerts were not kept for several scenes, they would only appear at one scene, increasing the chance of passing unnoticed by the user; and if their alpha value was not changed, the user would not know how old the alert is). Finally, the misidentified yellow alerts still appear on the scene, further, their alpha value do not change because they do not happen once but periodically, therefore they are considered as recent alerts.
Lastly, as it was required by the graphical client design, information regarding non-monitored hosts is shown whenever the user clicks on their bold dot representation. Such information is an Arin [22] whois query result shown via a browser window, as illustrated by Figure 27.
- 27 -

Figure 26. Sequence of consecutive NIDS Alerts, Shell-code attack.
- 28 -

Figure 27. Non-monitored attacking host information. Available from [22]
Detailed Design Documentation. The detailed design documentation (packages, classes and method specifications) has been generated as an independent browsable html site that can be found in the Project CD. For further information about its location and navigation instructions, see Appendix 1.
Using the GIDS Client. This section describes the GIDS client user interface (UI), which was designed to be as simple as possible, giving visual precedence to the visualization models specified and illustrated above. Figure 28 shows a screen capture from the graphical client UI, identifying its main parts, which are further explained immediately below.
- 29 -

Figure 28. Graphical Client UI Description.
Connection Controls. The connection controls are located at the UI window top left corner, where three buttons can be found: “Create connection” ( ), “Terminate connection” ( ) and “Close Application” ( ). The latter closes the graphical client window terminating the application, while the second only terminates an established connection with the server but leaves the client window opened. The “Create connection” button, displays the dialogue window shown in Figure 29 where the connection properties are requested. Particularly, through the radio buttons the session type is determined, either as “Real Time” or “Retrospective”. In case the later is selected, the period to be considered in the retrospective analysis must be specified through the date input fields at the bottom of the dialogue.
Figure 29. Session properties dialogue.
- 30 -

Once the connection parameters have been set up and the session properties dialogue has been closed pressing the “Connect” button, the UI is ready to display intrusion detection information. Note that if the selected session type is retrospective, the specified period of time is shown on the title bar. Also, it might be possible for the UI to take some time to respond while it caches relevant NIDS alerts and HIDS states.
Messages Pane. This pane shows information messages (green background) and error messages (red background) generated by the GIDS client application. Such messages can be removed from the pane clicking the “Clear all messages from the UI” at the bottom of the pane.
Monitored Hosts Tree. This pane displays a tree containing the system HIDS collector agents and their monitored hosts. Agent nodes have the tree root node as their common parent, while host nodes appear as children of their respective HIDS collector agents. All nodes but the root can be clicked on to obtain more information about the entity they represent. Particularly:
• When a HIDS collector agent node is clicked, its information is shown at the “Host/Agent static information” pane.
• When a host node is clicked, its static information is shown at the same pane (“Host/Agent static information”), and depending on the current session type, the host states information table is updated as follows: If the session type is retrospective, all available host states collected from the selected host during the retrospective session period are included into the table, whereas if the session is real time, only the last available host state is included into such table.
HIDS Visualization. This pane contains the HIDS visualization model (spicule) and its controls, which are detailed by Figure 30.
Figure 30. Spicule visualization controls.
- 31 -

The “Generate Spicule” button is enabled only after a host has been selected on the “monitored hosts tree” and a spicule has not been generated yet for such host. Once pressed, the last available host state spicule is generated and the button is disabled, The “Previous Spicule button” displays the spicule representing the host state generated immediately before the one actually being shown, conversely, the “Next Spicule” shows the spicule representing the host state generated immediately after the one currently being shown. The “Spicule date” field shows the current spicule date and might be modified by the user to generate a spicule at a given date (by setting the date and then pressing ”Generate Spicule at”). The “Zoom in” and “Zoom out” buttons are self-explanatory, while the “Animate Spicule” button displays the animation properties dialogue (Figure 31) used to set up the spicule animation parameters.
Figure 31. Animation properties dialogue.
This dialogue is the same for the spicule animation as well as the NIDS scene animation. On the top, the animation interval is set through the date input fields, and below the animation frame rate is selected moving the slider. Note that each particular state can be shown for at least a second and at most five seconds, before the animation automatically displays the next scene. Once these parameters have been entered, and the “Animate” button has been pressed, the animation is launched and it can be stopped pressing the “Animate Spicule” (or “Animate NIDS scene”, depending on the case) button, whose icon was changed to ( ) once the animation started.
NIDS Visualization.
Figure 32. NIDS Scene controls.
This pane contains the NIDS visualization model implementation and its controls, which are similar to those in the HIDS visualization pane. These controls -shown in Figure 32- have the following functions:
- 32 -

• Previous NIDS Scene: Displays the NIDS scene as reported by the NIDS sensors immediately before the one actually being shown.
• Next NIDS Scene: Displays the NIDS scene as reported by the NIDS sensors immediately after the one actually being shown.
• NIDS Scene date: Shows the current NIDS scene date. It might be modified by the user to generate a NIDS scene at a given date, by setting the date and then pressing ”Generate NIDS Scene at”).
• Animate Spicule: Displays the animation properties dialogue (Figure 31) in order to set up a NIDS scene animation.
Note that whenever a monitored host is clicked on the NIDS scene (even when running a NIDS scene animation), the HIDS spicule visualization model is updated to show the clicked host status at the NIDS scene date.
Host/Agent Static Information. This pane shows static information regarding selected hosts or HIDS collector agents at the “monitored hosts tree”.
Host States Information. This pane contains a table where textual information regarding hosts states is shown. Such table holds all available host states generated during the retrospective session period, or only the last available selected host state in case the client is running in real time mode. Note that whenever a host state is selected on the table, its respective spicule is generated and the NIDS scene is synchronized to the time when the selected host state was generated.
Proposed Architectures. Having described the GIDS components and presented its visualization models, a final brief word must be said about the system proposed architectures. Figure 33 shows the ideal system architecture, thought for heavy duty environments where there is a large set of hosts to be monitored as well as big amounts of network traffic to be scanned for intrusion events.
Note that the ideal architecture considers at least two disjoint networks: the monitored network(s), where the monitored hosts are connected and network traffic is scanned for intrusion attempts, and the monitoring network, where the NIDS and HIDS information is exchanged between HIDS Collector agents, NIDS agents, the IDS Database, the IDS server and graphical clients. This architecture is thought for these environments where little network overhead is to be generated by the GIDS on the monitored network. Besides, note that some NIDS sensors and HIDS collector agents are running on dedicated machines because there are high volumes of network traffic to be analyzed and/or a large set of hosts being monitored by a single HIDS collector agent. Also, the GIDS Database is replicated for performance reasons as a high rate of host status information is expected to be received by the database simultaneously with queries from the IDS server.
On the other hand, a simplified architecture (Figure 34) is proposed for testing environments or networks where a small group of host is being monitored. Notice that this architecture does not distinguish between monitored and monitoring networks (the GIDS components are deployed on the same network where the monitored hosts are connected), all NIDS agents run at the same machines as HIDS collector agents, and the GIDS database is not replicated.
- 33 -

Figure 33. Ideal system architecture.
Figure 34. Simplified system architecture.
Future work and improvements. Once the GIDS Project was designed, implemented and tested some aspects were found to be improvable -as it is natural with any project -. These particular matters are listed in this section as issues that can be used as guidelines for future work in the project. Additionally, some very particular improvable implementation details are not listed here, but appear in the application source code as comments preceded by the “TODO [Improvement]” string.
- 34 -

General System Improvements.
• It would be more appropriate to use Web services rather than RMI to communicate the graphical clients with the IDS server as these components would be further decoupled and communication security could be easily incorporated. Moreover, it would allow the client to be written in a different programming language than the IDS Server.
• When operating in retrospective mode, graphical clients are caching locally both NIDS alerts and host states generated during the retrospective session period. Despite this approach being very efficient for relatively short periods and a few monitored hosts, when bigger periods are considered or the monitored set of hosts grows, it is not the best caching policy. Thus, the graphical client caching policy must be refined or dynamically adapted to better accommodate to different usage scenarios.
• The IDS Server component is caching past NIDS alerts and host states requested from all different clients connected to it. While alerts and hosts states caching is required in order to minimize database accesses, it should be limited to a certain size, as the server memory consumption grows very high when many clients are connected and request information generated during long and disjoint periods of time.
• Although the NIDS and HIDS are related via the graphical client user interface, a higher level of correlation is required to be performed at the IDS server. The ultimate goal would be automatic intrusion detection at the IDS server (both in real time and retrospective modes).
• While the HIDS visualization model seems to be very effective, the average (normal) state calculation process must be reviewed and refined as machines normally exhibit different normal states over different periods of time. For instance, a particular monitored host, say, an Internet proxy server might be normally loaded in the early morning and after lunch but rather idle during some other periods of the day, specially during night. It is desirable that the normal host state provided by the IDS server considered this kind of seasonal normality.
Graphical User Interface Improvements.
• The host states table at the bottom right of the GIDS Client window did not prove to be to as useful as it was expected; therefore, it could be removed from the user interface and replaced with some other graphical visualization pane regarding the HIDS.
• Java3D is an interesting object oriented 3D graphics API, however, it does not appear to be as stable as the rest of the standard Java Runtime Environment. In fact, users must manually install the Java3D Runtime (which is not available to all platforms that the standard JRE is) in order to execute any Java3D application, particularly, the GIDS Graphical client. Moreover, some inconvenient issues2 appeared when using Java3D Runtime v.1.3.1 for Windows provided by Sun.
For all the reasons listed above, it is suggested to evaluate other programming languages and/or graphical APIs for the Graphical clients.
2 See: Appendix 2 GIDS Project User’s Manual. > Configuring and running the Graphical Client. > Known issues.
- 35 -

NIDS Graphical Visualization Model Improvements.
• The current visualization model does not visually distinguish classes of monitored hosts. Actually, the same icon is being used to represent all monitored hosts. Different icons should be used for different classes of monitored hosts, e.g. database servers, mail servers, workstations, etc.
• The quality of the information regarding non-monitored attacker hosts could be improved. At present, the only information being shown to the user is the result of a simple Arin whois query [22] based on the attacker host IP address. It is desirable that such information was richer (for example, including geographic location of the attacker, as shown in Figure 35) and was presented via the application user interface rather than using an external browser window.
Figure 35. Geographic location of an IP address. Provided by Geobytes (http://www.geobytes.com).
- 36 -

HIDS Graphical Visualization Model Improvements.
• According to [1], spicule based visualization models can encode up to 360 different monitored variables. Although this number of variables might be visually overwhelming, some more variables can be added to the HIDS visualization model making it richer.
• The spicule south hemisphere is wasted space as all monitored variables’ spikes range from the equator up to the north pole as seen in Figure 36. It would be interesting to try the effectiveness of a visualization model where some of these spikes ranged from the equator down to the south pole, or using the spicule south hemisphere for some other purpose.
Figure 36. Spicule wasted space
• It would be interesting to make the spicule nucleolus size variable, providing such size with particular semantics.
• When a spicule animation is running, only one spicule is shown at a given time, hence time related behavior (changes in the spicule shape) is not encoded by the graphical model. It would be useful to encode the “trajectory” of the spicule overall shape change by showing a few past spicules at the same time with the current one, distinguishing them by their spikes alpha value.
- 37 -

4. Conclusions.
The GIDS project has shown that it is possible to combine host and network intrusion detection information using non-traditional graphical models. These models certainly facilitate detecting intrusions based on the intrinsically parallel nature of the human graphical processing task. Further, the presence of graphical information has been found to obsolete the need for textual information as graphical models can be rich enough to encode all relevant information contained across its textual counterpart in a more succinct guise.
Nonetheless, it was found that it is not easy to develop an IDS, even using some existing components (such as SNMP agents as HIDS agents and Snort sensors as NIDS agents). Clearly, this project IDS features are incipient compared to other open source and commercial IDSs, granted that those systems do not normally incorporate interesting graphical visualization techniques, have been developed for a longer period of time and by a bigger group of people.
In fact, it is the opinion of the author that graphical intrusion detection should concentrate in developing, refining and fine tuning appropriate visualization models pluggable to already existing IDSs. The focus must be kept in visualization as well as user interaction while exploiting the correlation features as well as aggregate information generated by these existing systems through data mining and sophisticated analysis techniques.
- 38 -

References.
[1] G. Vert, D. Frincke, J. McConell. “A Visual Mathematical Model for Intrusion Detection”. Available at: http://www.csee.umbc.edu/ cadip/docs/NetworkIntrusion/paperF3.pdf
[2] R. Erbasher, K. Walker, D. Frincke. “Intrusion and Misuse Detection in Large Scale Systems”. Available at: http://www.cs.albany.edu/~erbacher/publications/CGAGlyphBasedIntrusionDetection.pdf
[3] S. Teoh, K. Ma, S. Wu, T. Jankun-Kelly. “Detecting Flaws and intruders with Visual Data Analysis”. Available at: http://www.cs.ucdavis.edu/~ma/papers/cga2004.pdf
[4] R. Erbasher, D. Frincke. “Visual Behavior Characterization for Intrusion and Misuse Detection”. Available at: http://www.cs.albany.edu/~erbacher/publications/VisualBehaviorCharacterization-SPIE01.pdf
[5] N. Cole, G. Vert, B. Yuan. “Visual Algebra System For Detecting Port Attacks On Computer Systems”. Available at: http://www.cse.unr.edu/~ncole/docs/Visual%20Algebra.pdf
[6] “SGUIL - The Analyst Console for Network Security Monitoring.” Available at: http://sguil.sourceforge.net/.
[7] “IDEA - Intrusion Detection Exchange Architecture”. Available at: http://idea-arch.sourceforge.net
[8] R. Danyliw. “Analysis Console for Intrusion Databases”. Available at: http://www.cert.org/ kb/acid/
[9] R. Alder, J. Babbin, A. Doxtater, J. Foster, T. Kohlenberg, M. Rash. “Snort 2.1 Intrusion Detection”, Second Edition, Syngress, 2004.
[10] “Snort™ The Open Source Network Intrusion Detection System”. Available at: http://www.snort.org
[11] “Sistema de Detección de Intrusos”. Available at: http://www.creangel.com/nuke/ html/modules.php?name=News&file=article&sid=183
[12] M. Tanase. “The Future of IDS”. Available at: http://www.securityfocus.com/infocus/1518
[13] P. Innella. “The Evolution of Intrusion Detection Systems”. Available at: http://www.securityfocus.com/infocus/1514
[14] D. Mauro, K. Schmidt. “Essential SNMP”. O'Reilly, 2001
[15] J. Kurose, K. Ross. “Computer Networking. A top-down approach featuring the Internet”. Third Edition, Addison Wesley, 2005
[16] S. Waldbusser, P. Grillo. “RFC 2790. Host Resources MIB”. 2000. Available at: ftp://ftp.rfc-editor.org/in-notes/rfc2790.txt
[17] J. Zawodny, D. Balling. “High Performance MySQL”. First Edition. O’Reilly. 2004.
[18] Sun Microsystems. “JDBC Technology”. Available at: http://java.sun.com/products/jdbc/
[19] Sun Microsystems. “Java Remote Method Invocation (Java RMI)”. Available at: http://java.sun.com/products/jdk/rmi/index.jsp
[20] R. Danyliw. “Snort Database Plugin Documentation”. Available at: http://www.andrew.cmu.edu/user/rdanyliw/snort/snortdb/snortdb.html
[21] C. Reid “Snort Database Schema v1.06”. Available at: http://cvs.snort.org/viewcvs.cgi /snort/doc/snort_schema_v106.pdf?rev=1.3
[22] “American Registry for Internet Numbers”. Available at: http://www.arin.net/
[23] The Hacker’s Choice. “Microsoft IIS 5 SSL exploit”. Source code available from: http://www.thc.org/exploits/THCIISSLame.c
- 39 -

5. Appendixes.
Appendix 1. Project Specification Browsing Instructions.
1. Class diagrams are available at “D:\Docs\Project Docs\Class Diagrams” (assuming the GIDS Project CD is inside drive “D”).
2. The detailed design documentation can be browsed opening “D:\Docs\Project Docs\index.htm”.
Selecting a diagram entity on the top frame or selecting a tree node on the bottom-left frame will display the selected entity documentation on the bottom-right frame.
- 40 -

Appendix 2. Deploying the GIDS.
1. Configuring the GIDS Database. The GIDS Project is configured to log monitored host states and intrusion events into a MySQL database3 (it has been tested with MySQL 4.1 and MySQL 5.0, available from http://dev.mysql.com/downloads /mysql/).
Before running any other component of the GIDS Project, it is necessary to create the system database schemas as well as the database users, as shown below
Requirements.
a. A properly installed MySQL Database Server must be running.
b. You should know the database root user password (or have a user with enough privileges to create databases).
c. The machine where the database server is running must be reachable through the network by the machines running NIDS (Snort) sensors and HIDS collector agents.
d. The GIDS Project CD.
e. Ant 1.6.5 or above (Available from http://ant.apache.org/) must be installed.
Instructions.
Database creation.
a. A hard disk copy of “D:/Bin/IDSDatabase” (assuming the GIDS Project CD is inside drive “D”) must be made into the hard drive. For example, “D:/Bin/IDSDatabase” might be copied to “C:/GIDSProject/”.
b. Open a console window.
c. Start a MySQL session with an user capable of creating databases:
mysql -u root --password
d. Issue the database creation SQL statements:
create database gids;
create database snort;
quit
e. Set the current directory to “C:/GIDSProject/” or wherever you copied “D:/Bin/IDSDatabase” to.
f. Configure the database access properties defined in “C:/GIDSProject/IDSDatabase/conf/ build.conf“.
g. Create the HIDS and the Snort (NIDS) database schemas running the “Create DBs” ant task defined in “C:/GIDSProject/IDSDatabase/build.xml”.
ant "Create DBs"
3 The MySQL driver is included with the project binaries. It must be noted that any other database management system (DBMS) can be used as long as a JDBC driver for such DBMS exist.
- 41 -

User creation.
h. Create the following users at the database:
A. User name: nidsagent
Default Password: nidsagent
User description: Used by NIDS (Snort) agents to log network intrusion alerts into the database.
User Privileges: Insert, Select and Update on snort.*
B. User name: hidsagent
Default Password: hidsagent
User description: Used by HIDS Collector Agents to store monitored host states into the database
User Privileges: Insert, Select and Update on gids.*
C. User name: server
Default Password: server
User description: Used by the IDS server to query the GIDS database.
User Privileges: Select on gids.* and snort.*
- 42 -

2. Configuring and running the Host Agents (SNMP Agents). The HIDS portion of the project is based on status information periodically collected from the monitored host’s SNMP agents. HIDS Collector Agents will be able to collect information from any SNMP agent implementing the Host MIB (1.3.6.1.2.1.25) and sharing the same SNMP community name (The default name is “public”)
Requirements.
a. The monitored host operating system where the SNMP agent is to be configured and run must be Windows 2000 or above as the following instructions show how to activate the SNMP agent incorporated by Windows 2000 and above4.
It is important to note that there are other SNMP agents implementing the host MIB capable of running in other operating systems as well as Windows. In case you decide to use one of those implementations, you need to follow the corresponding documentation in order to set them up.
b. In case the SNMP agent is not installed, you might need the Windows installation files.
Instructions.
Verify that the SNMP agent is installed
a. Double-click “Add or Remove Programs” in the Control Panel.
b. Select the “Add or Remove Windows Components” tab and verify that all components in the “Management and Monitoring tools” are installed. If they are not, they must be installed.
Configure the SNMP agent properties.
c. Open Computer Management (Click Start, point to Settings, and click Control Panel. Double-click Administrative Tools and then double-click Computer Management)
d. In the console tree, click Services.
e. In the details pane, click SNMP Service
f. On the Action menu, click Properties.
g. On the Agent tab, check all Services boxes.
4 Adapted from: http://www.microsoft.com/windows2000/en/advanced/help/default.asp?url=/windows2000/en/advanced/help/snmp_install.htm
- 43 -

h. On the Security tab, add the “public” community or create a new one with READ-ONLY rights.
i. On the same tab, select “Accept SNMP Packets from any host”, or for greater security, select “Accept SNMP Packets from these hosts” and add the HIDS Collector agent host responsible of monitoring this machine to the trusted hosts list (bottom).
- 44 -

Running the SNMP service.
j. On the General tab, select “Automatic” startup type; press “Apply” and then “Start” or “Restart”.
3. Configuring and running the HIDS Collector Agents. The HIDS collector agents periodically retrieve status information from the monitored hosts and send it to the GIDS database. Such information is collected to be processed later by the IDS server and finally displayed through the GIDS Clients.
A single HIDS collector agent is able to retrieve information from any number of hosts as long as they run SNMP agents that can be reached through the network, thus, if there are multiple disjoint networks being monitored more than one HIDS collector agent is going to be required to monitor hosts in all these networks.
Requirements.
a. All monitored hosts by the HIDS collector agent must be running SNMP agents implementing the Host MIB. Such SNMP agents must share the same community name and must be reachable through the network by the HIDS collector agent machine
b. The GIDS Database must be properly configured and running.
c. The GIDS Project CD.
d. Java Runtime Environment 1.5.0_05 or above must be installed.
e. Ant 1.6.5 or above (Available from http://ant.apache.org/) must be installed.
Instructions.
a. A hard disk copy of “D:/Bin/GIDSCommonCode” and “D:/Bin/HIDSAgent” (assuming the GIDS Project CD is inside drive “D”) must be made into the hard drive. For example, “D:/Bin/GIDSCommonCode” might be copied to “C:/GIDSProject/GIDSCommonCode” and “D:/Bin/HIDSAgent” might be copied to “C:/GIDSProject/HIDSAgent” (Note that the parent folder is the same for both copied folders).
b. Configure the agent options in “C:/GIDSProject/HIDSAgent/conf/build.conf”
- 45 -

c. Configure the agent database access options in “C:/GIDSProject/HIDSAgent/conf/ hidsAgent_bd.conf”
d. Insert the monitored host names in “C:/GIDSProject/HIDSAgent/conf/ hidsAgent_hosts.conf” following the instructions provided at the top of the file.
e. Configure the SNMP properties in “C:/GIDSProject/HIDSAgent/conf/ hidsAgent_snmp.conf”
f. Open a console window setting the current directory to “C:/GIDSProject/HIDSAgent/”.
g. Run the HIDS collector agent executing the “run HIDS AGENT (bin)” ant task defined in “C:/GIDSProject/HIDSAgent/build.xml“.
ant "run HIDS AGENT (bin)"
Known Issues.
a. If the HIDS collector agent is running on a Windows machine and the monitored hosts do not have static IP Addresses, it has been found that once a monitored host IP address changes, the agent takes approximately ten minutes to detect the change because the name to IP translation is cached by the NetBIOS service during that time.
4. Integrating Snort Sensors to the GIDS. The NIDS portion of the project is based on the Snort IDS System, available from http://www.snort.org. Particularly, once the Snort sensors are deployed through the network (and properly tuned with an adequate rule set), it is necessary to configure the MySQL output plug-in so the sensors will send the intrusion alerts directly to the GIDS database.
It is important to note that Snort inner workings as well as proper Snort configuration and tuning are topics outside the scope of this project; hence these particular instructions are limited to show how to configure Snort to send the intrusion alerts to the GIDS database.
If more information about Snort is required, the reader is strongly encouraged to visit http://www.snort.org, or read: “Snort 2.1 Intrusion Detection” by Alder and others.
Requirements.
a. The Snort sensor(s) must be already installed and configured.
b. The GIDS Database must be properly configured and running.
Instructions.
a. In order to configure the MySQL output plug-in, the snort.conf file must be edited. Specifically, the following line must be added to the output plug-in section of such file, as shown below::
output database: log, mysql, user=<NIDS database user> password=<NIDS database password> dbname=<NIDS database name> sensor_name=<NIDS Sensor name>
- 46 -

or using the default values:
output database: log, mysql, user=nidsagent password=nidsagent dbname=snort sensor_name=sensor1
5. Configuring and running the IDS Server.
Requirements.
a. The GIDS Project CD.
b. Java Runtime Environment 1.5.0_05 or above must be installed.
c. Ant 1.6.5 or above (Available from http://ant.apache.org/) must be installed.
Instructions.
a. A hard disk copy of “D:/Bin/GIDSCommonCode” and “D:/Bin/IDSServer” (assuming the GIDS Project CD is inside drive “D”) must be made into the hard drive. For example, “D:/Bin/GIDSCommonCode” might be copied to “C:/GIDSProject/GIDSCommonCode” and “D:/Bin/IDSServer” might be copied to “C:/GIDSProject/IDSServer” (Note that the parent folder is the same for both copied folders).
b. Configure the global server options in “C:/GIDSProject/IDSServer /conf/build.conf”
- 47 -

c. Configure the server database access options in “C:/GIDSProject/IDSServer /conf/IDSServer_bd.conf”
d. Configure the server remote name in “C:/GIDSProject/IDSServer /conf/IDSServer_naming.conf”.
e. Open a console window setting the current directory to “C:/GIDSProject/IDSServer/”.
f. Run the RMI Registry.
ant "3. run Registry"
g. Run the HTTP server (code-base for remote clients).
ant "6-1. run HTTP Server (bin)"
h. Run the IDS Server
ant "6-2. run IDS SERVER (bin)"
- 48 -

6. Configuring and running the Graphical Client. The graphical client is the main component of the GIDS project as it displays HIDS and NIDS information in a graphical non-traditional fashion. In order to accomplish such visualization, the project uses the Java3D API which is not included in standard JRE distributions; therefore it needs to be installed before running the GIDS Client. Once the Java3D runtime environment has been installed, the client is ready to be run following the instructions below.
Requirements.
a. The GIDS Database must be properly configured and running.
b. The IDS Server must be running and the machine hosting it must be reachable from Graphical Client host.
c. The GIDS Project CD.
d. Java Runtime Environment 1.5.0_05 or above must be installed.
e. Java3D must be installed. Further documentation, installation files and instructions can be found at:
https://java3d.dev.java.net/
Documentation
http://java.sun.com/products/java-media/3D/downloads/index.html
API Documentation, Windows installer download links and instructions.
http://java.sun.com/products/java-media/3D/ports.html
Other platform implementations (mostly links).
f. Ant 1.6.5 or above (Available from http://ant.apache.org/) must be installed.
Instructions.
a. A hard disk copy of “D:/Bin/GIDSCommonCode” and “D:/Bin/GIDSClient” (assuming the GIDS Project CD is inside drive “D”) must be made into the hard drive. For example, “D:/Bin/GIDSCommonCode” might be copied to “C:/GIDSProject/GIDSCommonCode” and “D:/Bin/GIDSClient” might be copied to “C:/GIDSProject/GIDSClient” (Note that the parent folder is the same for both copied folders).
b. Configure the client options in “C:/GIDSProject/GIDSClient/conf/build.conf”
c. Configure the server remote name in “C:/GIDSProject/GIDSClient/conf/ IDSServer_naming.conf”.
d. Configure the visualization properties in “C:/GIDSProject/GIDSClient/conf/ visualizationProperties.conf”.
e. Open a console window setting the current directory to “C:/GIDSProject/GIDSClient” folder.
f. Launch the Graphical client running the “run GIDS CLIENT (bin)” ant task defined in “C:/GIDSProject/build.xml”
ant "run GIDS CLIENT (bin)"
- 49 -

Known Issues.
During testing, the following issues have been found with the Java3D Runtime v.1.3.1 for Windows provided by Sun. Note that this bugs seem to be platform and version dependent.
a. If a 3D scene is tried to be rendered using some ATI graphics cards along with the OpenGL based Java 3D Runtime, the following error happens5:
“wglCreateContext Failed: The pixel format is invalid”.
The suggested solution is to use the DirectX based Java 3D Runtime implementation or disabling all hardware acceleration and/or enabling the advanced graphics-driver property "Force 16 bit Z buffer depth"6.
b. Once a 3D scene is rendered, the window containing it cannot be moved because the following exception is thrown:
Exception in thread "J3D-Renderer-1" java.lang.UnsatisfiedLinkError: resizeD3DCanvas
at javax.media.j3d.Canvas3D.resizeD3DCanvas(Native Method) at
javax.media.j3d.Canvas3D.d3dResize(Canvas3D.java:3588) at
javax.media.j3d.Renderer.doWork(Renderer.java:451) at
javax.media.j3d.J3dThread.run(J3dThread.java:250)
c. If the application window is moved to the secondary display (even partially) before any 3D scene is rendered, as soon as one of such scenes is tried to be rendered, the following exception is thrown:
java.lang.IllegalArgumentException: adding a container to a container on a different GraphicsDevice
5 Detailed information available at: http://www.javadesktop.org/forums/thread.jspa?threadID=4783&messageID=388676 According to http://forum.java.sun.com/thread.jspa?threadID=637817&tstart=105 the bug has been fixed, but this Java3D version has not been tested with the GIDS Project
- 50 -

About the Author…
Diego Alejandro Ortiz Yepes is a Systems and Computing Engineering student at Los Andes University in Bogotá, Colombia. His primary interests involve Information Security and Intrusion Detection Systems. The publications he has co-authored as an undergraduate student are: “IDSs and IPSs: A practical comparison” (in Spanish), available at: http://www.criptored.upm.es/guiateoria/gt_m142w.htm; “MAC Filters evasion in 802.11 networks” (in Spanish), available at: http://www.criptored.upm.es/guiateoria/gt_m142v.htm; and “Forensic data analysis: A methodological proposal and its application using The Sleuth Kit and Encase” (in Spanish), available at: http://www.criptored.upm.es/guiateoria/gt_m142y.htm.
This paper as well as the GIDS project design and implementation were developed during the second semester of 2005 as Diego’s graduation project, under the supervision of Professor Milton E. Quiroga.
Bogotá D.C. January, 2006
- 51 -