Non-Hierarchical Sequencing Graphs. Algorithmic Graph Theory2.

HAL Id: inria-00506596https://hal.inria.fr/inria-00506596
Submitted on 28 Jul 2010
HAL is a multi-disciplinary open accessarchive for the deposit and dissemination of sci-entific research documents, whether they are pub-lished or not. The documents may come fromteaching and research institutions in France orabroad, or from public or private research centers.
L’archive ouverte pluridisciplinaire HAL, estdestinée au dépôt et à la diffusion de documentsscientifiques de niveau recherche, publiés ou non,émanant des établissements d’enseignement et derecherche français ou étrangers, des laboratoirespublics ou privés.
Graph-based analysis of Textured Images forHierarchical SegmentationR. Gaetano, G. Scarpa, T. Sziranyi
To cite this version:R. Gaetano, G. Scarpa, T. Sziranyi. Graph-based analysis of Textured Images for Hierarchical Seg-mentation. British Machine Vision Conference, BMVC 2010, Aug 2010, Aberystwyth, UK, UnitedKingdom. inria-00506596

GAETANO ET AL.: GRAPH-BASED ANALYSIS OF TEXTURED IMAGES 1
Graph-based Analysis of Textured Images
for Hierarchical Segmentation
Raffaele Gaetano 1,3
1 ARIANA Research Group,
INRIA Sophia Antipolis - Méditerranée,
Sophia Antipolis, FRANCE
Giuseppe Scarpa 2
2 Dip. Ing. Biomed., Elett. e Telecom.
Università degli Studi “Federico II”,
Napoli, ITALY
Tamás Szirányi 3
3 SZTAKI - DEVA Group
Magyar Tudományos Akadémia,
Budapest, HUNGARY
Abstract
The Texture Fragmentation and Reconstruction (TFR) algorithm has been recently
introduced [9] to address the problem of image segmentation by textural properties, based
on a suitable image description tool known as the Hierarchical Multiple Markov Chain
(H-MMC) model. TFR provides a hierarchical set of nested segmentation maps by first
identifying the elementary image patterns, and then merging them sequentially to identify
complete textures at different scales of observation.
In this work, we propose a major modification to the TFR by resorting to a graph
based description of the image content and a graph clustering technique for the enhance-
ment and extraction of image patterns. A procedure based on mathematical morphology
will be introduced that allows for the construction of a color-wise image representation
by means of multiple graph structures, along with a simple clustering technique aimed at
cutting the graphs and correspondingly segment groups of connected components with a
similar spatial context.
The performance assessment, realized both on synthetic compositions of real-world
textures and images from the remote sensing domain, confirm the effectiveness and po-
tential of the proposed method.
1 Introduction
The analysis and extraction of textural information from image data is a relevant topic in the
image analysis and processing domains, mainly due to its transversality w.r.t. the addressed
application areas. Apart from being of interest in the segmentation of natural images from
the real world [9], texture analysis ofter comes of great use also in more specific application
domains such as medical imaging [12] and remote sensing [3, 5].
This work addresses the problem of hierarchical image segmentation driven by textural
properties. The rationale that we follow here is based on the consideration that, especially
in certain domains, an image can often be regarded as a complex composition of different
c© 2010. The copyright of this document resides with its authors.
It may be distributed unchanged freely in print or electronic forms.
2 GAETANO ET AL.: GRAPH-BASED ANALYSIS OF TEXTURED IMAGES
textures, appearing at different scales and typically related to each other by hierarchical
relationships. In particular, we here start from the framework introduced in [9], where a
hierarchical texture modeling approach has been proposed, namely the Hierarchical Multiple
Markov Chain model (H-MMC), along with the Texture Fragmentation and Reconstruction
(TFR) algorithm for hierarchical image segmentation. Given the good potential expressed
by these tools, we decided to carry on with their development by enriching the modeling
approach with the use of a graph based image representation, to enhance the description of
spatial interactions over the image and provide a robust support for the localization of texture
patterns.
For the sake of brevity, considerations about the state of the art in hierarchical/multi-scale
segmentation are left out here, referring the reader to [9] for an extensive discussion on the
subject. As for the use of graph structures in image analysis and segmentation, this is cer-
tainly not a novelty by itself: an early work in image processing [6] already proposed Region
Adjacency Graphs as efficient tools to provide a “spatial view” of an image, and many works
have been using them for segmentation as described in [13]. In [14] for example, starting
from single pixels or elementary homogeneous regions (what is generally called superpixel)
a complete segmentation is performed by associating similarity measures to graph edges
and recursively merging nodes or extracting spanning trees. More recently, thanks to the
breakthrough work of Shi and Malik [10], a new approach to image segmentation based on
global graph partitioning has been introduced, that opened to a new optimization framework
based on the minimization of energy functions depending on graph measures. Extensions of
this approach to the multiscale case have also been proposed, e.g. in [1], as well as many
fundamental advances in the theoretical framework that can be found up to recent times [7].
In this work, a multiple graph based representation is proposed, built starting from an
initial partition of the image, and aimed at defining spatial relationships among elementary
connected components, in order to discover similarities in the spatial context and extract
texture patterns by means of a multiple graph clustering.
2 Texture Fragmentation and Reconstruction (TFR)
First we provide a brief recall to the reference modeling strategy and the related optimization
method, in order to highlight their potential and show current limitations, referring the reader
to [9] for a more detailed description and experimental results.
Since its first formulation, the Hierarchical Multiple Markov Chain family of models has
been proposed as a simple and effective tool to represent the visual properties of an image
at any scale of observation, by means of its “broad sense” textural information: the core
of the modeling strategy is the joint definition of texture components (patterns) at different
scales and spatial interactions among them. The Texture Fragmentation and Reconstruction
(TFR) algorithm has been then proposed as an actual hierarchical segmentation technique
based on fitting image content into a H-MMC model. The TFR follows the well known
split-and-merge paradigm: in a first fragmentation phase, clusters of elementary regions that
share the same spectral and contextual properties are detected. These elementary patterns
are then merged two-by-two during the reconstruction phase, giving rise to a hierarchy of
nested segmentation maps at different scales of observation.
A flowchart of the algorithm is depicted in Fig. 1. It consists of three steps: a color-
based classification (CBC), a spatial context based clustering (SBC) and a texture merging
phase. The first two steps constitute the fragmentation phase, while texture reconstruction

GAETANO ET AL.: GRAPH-BASED ANALYSIS OF TEXTURED IMAGES 3
Figure 1: Flowchart of TFR.
(a) data (b) CBC (c) partial CBC
(d) partial SBC (e) 12 class map (f) 6 class map
Figure 2: A sample segmentation process.
is performed in the last step. The CBC is the only step of the procedure that works at pixel
level, while subsequent steps move on the scale of connected components. The sequence of
images in Fig. 2 ideally follows a sample segmentation process by showing its intermediate
outputs, that will be discussed in the following.
Color Based Classification: this step carries out a color segmentation of the image;
all pixels with the same color form a class, that in textured images is typically spread over
the image giving origin to multiple color-homogeneous connected components. Color seg-
mentation here is performed using the unsupervised TS-MRF algorithm described in [2],
because of its favourable properties in dealing with noise and high-frequency irregularities.
The number of color classes Kc, that represents a parameter value for TFR, is fixed a priori.
In Fig. 2(b) the 24-class output of the CBC block for the sample texture mosaic of Fig. 2(a),
taken from the Prague Texture Segmentation Benchmark [4], is shown. The choice of TS-
MRF is by no means critical: in principle any color segmentation algorithm capable to single
out homogeneous regions and classify them by color could perform similarly, given that an
excessive noise or a too high degree of fragmentation can reduce the quantity of information
on spatial interactions.
Spatial Context Based Clustering: the aim of this block is readily appreciated by com-
paring Fig. 2(c), where a detailed view of 4 out of 24 color classes is shown, with Fig. 2(d).
From the 4 color classes of the former, fragment groups are further split to obtain clusters of
connected components that belong each to a single textured area.
To provide a similar decomposition, each fragment is characterized by means of a suit-
able description of its spatial context, and then a clustering in this feature space is operated,
independently for each color class, to form groups of fragments of the same color that also
share the same neighbourhood configuration. More precisely, given Ω the set of color classes
available, Sω a subset of pixels of the same color class ω ∈ Ω, and ωk the label of its k-th
connected component, the latter is associated with a set of probabilities:
p j(ω′|ωk) =
|Sωk
j−→ω ′
|
|Sωk|
(1)
with j ∈ N,NE,E,SE,S,SW,W,NW, representing the likelihood of finding a pixel

4 GAETANO ET AL.: GRAPH-BASED ANALYSIS OF TEXTURED IMAGES
of color ω ′ when moving from a location of the fragment ωk in the direction j. The red
fragments of the upper-left texture of Fig. 2(a), for example, will be characterized by a
large probability of finding a blue pixel when leaving the region in the right direction and
a black pixel when leaving to the left. The output of this block will be the finest scale
segmentation map, with each segment consisting of a portion of the image homogeneous in
terms of spectral/microtextural and contextual properties.
Scale/Interaction Based Texture Merging: this step has the goal of recovering all
texture-coherent portions of the image, through multiple scales in a hierarchical fashion.
This process consists of a sequence of binary region merging, selecting each time the im-
age portion less likely to represent a complete and independent texture and merging it with
its dominant neighbour, until the whole image is reconstructed. The core of this step is in
the definition of the Texture Score [9], that basically measures the texture completeness of a
current set of fragments ξ by means of three different terms, respectively related to its area,
compactness and nearest neighbour dominance:
T Sξ = p(ξ ) ·1
p(ξ |ξ )·
p(ξ |ξ )
maxξ ′ 6=ξ p(ξ ′|ξ )(2)
where p(ξ |ξ ) is the probability of leaving the region ξ in any direction and p(ξ ′|ξ ) the prob-
ability to reach the set ξ ′ in any direction. The described procedure generates the hierarchical
stack of segmentation maps, the most meaningful ones appearing evidently in the top levels
of the retrieved tree structure, as shown in Fig. 2(e) and 2(f) for the previous example where
the 12- and 6-class maps are shown respectively.
2.1 Addressing a weakness of TFR
The TFR presents several interesting properties: it is able to recognize macro-texture at vari-
ous scales of observation, it is unsupervised, and hence applicable in many different domains,
and the region-based image modeling helps keeping the computational load reduced com-
pared to other hierarchical segmenters. However, besides the good performances achieved
by the TFR algorithm in different applications [3, 9], experimental evidence also pointed out
several limitations and weak points that motivate further research. In this work we limit the
scope of this analysis to the SBC block of Fig. 1.
The original SBC block is based on the independent featuring and clustering of con-
nected components, without any specific spatial constraint: the features described in Eq. 1
are collected, and a reduction is performed using Principal Component Analysis. Clustering
is realized using the K-means technique, by fixing a priori the number of desired clusters
Ks for each color class. The described choices generally lead to a quick and reliable out-
put. However, in more complex cases, for example when color information is limited or in
presence of significant scale differences, generally leading to largely unbalanced clusters, the
K-means clustering is likely to perform unsatisfactorily, mainly due to the following reasons:
• statistical clustering needs a large number of samples to be reliable: in case of highly
unbalanced “actual” clusters, K-means can easily give rise to a seriously erroneous
clustering;
• the necessity of compacting data to cope with the curse of dimensionality reduces the
accuracy of context description;

GAETANO ET AL.: GRAPH-BASED ANALYSIS OF TEXTURED IMAGES 5
(a) (b) (c) (d)
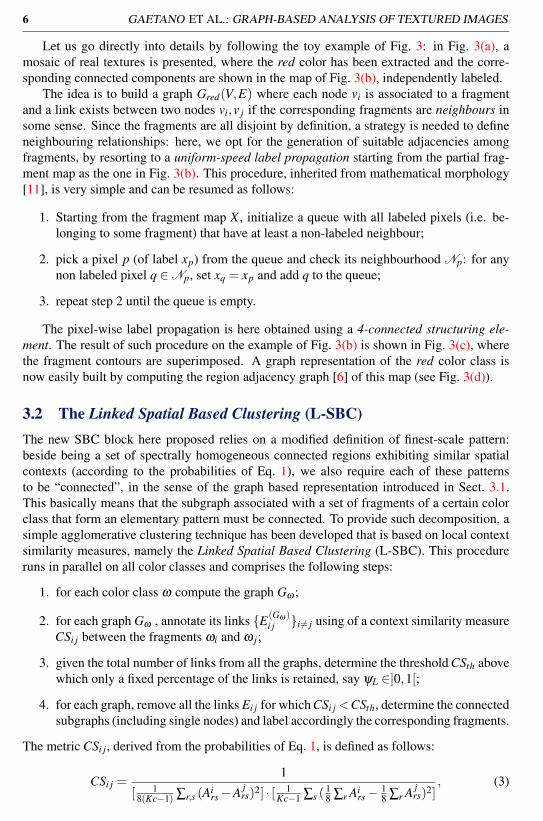
Figure 3: Toy example of the color-wise graph construction. In 3(a) a sample texture mosaic
is shown, whose red subset is highlighted in 3(b) where each connected component (frag-
ment) has a different label. In 3(c), the fragment map after label propagation is shown, and
the relative RAG is depicted in 3(d).
• in the absence of spatial constraints, no control is provided on cluster localization in
space, thus renouncing to a consistent information, since fragments of the same texture
evidently are “close” to each other with high probability.
In the following section, we propose a completely new implementation for this block,
where the clustering approach is no longer divisive but agglomerative. This is here obtained
by switching to graph structures, that keep track of the proximity among fragments and help
measuring context differences locally instead of relying on global statistics.
3 Proposed Method
The main rationale for the method introduced here concerns the importance of spatial prox-
imity in forming intra-textural patterns from a group of fragments. Including spatial location
as a feature in the existing scheme is not reasonable, both because the varying shapes of
fragments make any possible position feature inaccurate, and because the feature space di-
mension would be even higher compromising the reliability of clustering.
Our idea, then, is to associate to each map of color-uniform fragments a graph based rep-
resentation that allows for the definition of neighbourhood relationships. This superimposed
topology will provide additional information about the spatial localization of clusters, and
hence drive cluster formation so as to avoid, for example, to merge clusters that are separated
by unrelated textures.
To achieve this goal, two main issues have to be solved. First of all, the construction
of the graph structure is not trivial, since the fragments are generally disconnected and we
cannot unambiguously determine “who neighbours who” in this context (consider a map like
the one of Fig. 3(b)). Furthermore, once this topology is defined, we need to choose suit-
able metrics to measure context differences and deploy a fast and effective graph clustering
technique.
3.1 Building the graph based image representation
The graph based representation introduced here relies on the definition of multiple graphs,
associated one-to-one with the color classes of the image. Hence, the starting point for the
analysis of spatial contexts is again the color classification described in Sect. 2.
6 GAETANO ET AL.: GRAPH-BASED ANALYSIS OF TEXTURED IMAGES
Let us go directly into details by following the toy example of Fig. 3: in Fig. 3(a), a
mosaic of real textures is presented, where the red color has been extracted and the corre-
sponding connected components are shown in the map of Fig. 3(b), independently labeled.
The idea is to build a graph Gred(V,E) where each node vi is associated to a fragment
and a link exists between two nodes vi,v j if the corresponding fragments are neighbours in
some sense. Since the fragments are all disjoint by definition, a strategy is needed to define
neighbouring relationships: here, we opt for the generation of suitable adjacencies among
fragments, by resorting to a uniform-speed label propagation starting from the partial frag-
ment map as the one in Fig. 3(b). This procedure, inherited from mathematical morphology
[11], is very simple and can be resumed as follows:
1. Starting from the fragment map X , initialize a queue with all labeled pixels (i.e. be-
longing to some fragment) that have at least a non-labeled neighbour;
2. pick a pixel p (of label xp) from the queue and check its neighbourhood Np: for any
non labeled pixel q ∈ Np, set xq = xp and add q to the queue;
3. repeat step 2 until the queue is empty.
The pixel-wise label propagation is here obtained using a 4-connected structuring ele-
ment. The result of such procedure on the example of Fig. 3(b) is shown in Fig. 3(c), where
the fragment contours are superimposed. A graph representation of the red color class is
now easily built by computing the region adjacency graph [6] of this map (see Fig. 3(d)).
3.2 The Linked Spatial Based Clustering (L-SBC)
The new SBC block here proposed relies on a modified definition of finest-scale pattern:
beside being a set of spectrally homogeneous connected regions exhibiting similar spatial
contexts (according to the probabilities of Eq. 1), we also require each of these patterns
to be “connected”, in the sense of the graph based representation introduced in Sect. 3.1.
This basically means that the subgraph associated with a set of fragments of a certain color
class that form an elementary pattern must be connected. To provide such decomposition, a
simple agglomerative clustering technique has been developed that is based on local context
similarity measures, namely the Linked Spatial Based Clustering (L-SBC). This procedure
runs in parallel on all color classes and comprises the following steps:
1. for each color class ω compute the graph Gω ;
2. for each graph Gω , annotate its links E(Gω )i j i6= j using of a context similarity measure
CSi j between the fragments ωi and ω j;
3. given the total number of links from all the graphs, determine the threshold CSth above
which only a fixed percentage of the links is retained, say ψL ∈]0,1[;
4. for each graph, remove all the links Ei j for which CSi j <CSth, determine the connected
subgraphs (including single nodes) and label accordingly the corresponding fragments.
The metric CSi j, derived from the probabilities of Eq. 1, is defined as follows:
CSi j =1
[ 18(Kc−1) ∑r,s (A
irs −A
jrs)2] · [ 1
Kc−1 ∑s (18 ∑r Ai
rs −18 ∑r A
jrs)2]
, (3)
GAETANO ET AL.: GRAPH-BASED ANALYSIS OF TEXTURED IMAGES 7
(a) (b) (c) (d)
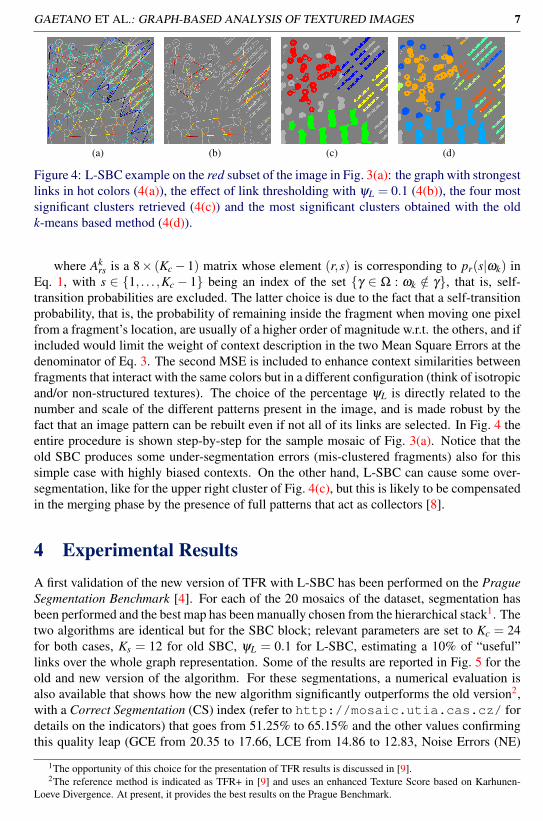
Figure 4: L-SBC example on the red subset of the image in Fig. 3(a): the graph with strongest
links in hot colors (4(a)), the effect of link thresholding with ψL = 0.1 (4(b)), the four most
significant clusters retrieved (4(c)) and the most significant clusters obtained with the old
k-means based method (4(d)).
where Akrs is a 8× (Kc − 1) matrix whose element (r,s) is corresponding to pr(s|ωk) in
Eq. 1, with s ∈ 1, . . . ,Kc − 1 being an index of the set γ ∈ Ω : ωk /∈ γ, that is, self-
transition probabilities are excluded. The latter choice is due to the fact that a self-transition
probability, that is, the probability of remaining inside the fragment when moving one pixel
from a fragment’s location, are usually of a higher order of magnitude w.r.t. the others, and if
included would limit the weight of context description in the two Mean Square Errors at the
denominator of Eq. 3. The second MSE is included to enhance context similarities between
fragments that interact with the same colors but in a different configuration (think of isotropic
and/or non-structured textures). The choice of the percentage ψL is directly related to the
number and scale of the different patterns present in the image, and is made robust by the
fact that an image pattern can be rebuilt even if not all of its links are selected. In Fig. 4 the
entire procedure is shown step-by-step for the sample mosaic of Fig. 3(a). Notice that the
old SBC produces some under-segmentation errors (mis-clustered fragments) also for this
simple case with highly biased contexts. On the other hand, L-SBC can cause some over-
segmentation, like for the upper right cluster of Fig. 4(c), but this is likely to be compensated
in the merging phase by the presence of full patterns that act as collectors [8].
4 Experimental Results
A first validation of the new version of TFR with L-SBC has been performed on the Prague
Segmentation Benchmark [4]. For each of the 20 mosaics of the dataset, segmentation has
been performed and the best map has been manually chosen from the hierarchical stack1. The
two algorithms are identical but for the SBC block; relevant parameters are set to Kc = 24
for both cases, Ks = 12 for old SBC, ψL = 0.1 for L-SBC, estimating a 10% of “useful”
links over the whole graph representation. Some of the results are reported in Fig. 5 for the
old and new version of the algorithm. For these segmentations, a numerical evaluation is
also available that shows how the new algorithm significantly outperforms the old version2,
with a Correct Segmentation (CS) index (refer to http://mosaic.utia.cas.cz/ for
details on the indicators) that goes from 51.25% to 65.15% and the other values confirming
this quality leap (GCE from 20.35 to 17.66, LCE from 14.86 to 12.83, Noise Errors (NE)
1The opportunity of this choice for the presentation of TFR results is discussed in [9].2The reference method is indicated as TFR+ in [9] and uses an enhanced Texture Score based on Karhunen-
Loeve Divergence. At present, it provides the best results on the Prague Benchmark.

8 GAETANO ET AL.: GRAPH-BASED ANALYSIS OF TEXTURED IMAGES
Figure 5: Results of TFR algorithm on several texture mosaics from the Prague Benchmark.
First row: source texture mosaics. Second row: ground truths. Third and fourth rows: best
segmentation results using TFR+ and new results obtained using TFR w/L-SBC.
Figure 6: An aerial image of Minori (NA, Italy, c©AvioRiprese S.R.L.) and the correspond-
ing 3- and 4-class segmentation respectively with classical TFR and TFR w/L-SBC.
from 31.38 to 25.59). These improvements are mainly due to the facts that the L-SBC block
succeeded in keeping the elementary texture patterns well localized in the image while the
classical SBC tends to produce an excessive spread or noisy clusters, generating many noise
errors and having a non negligible impact on the subsequent merging phase. This is testi-
fied by the higher degree of irregularity of classical TFR maps and the general tendency to
undersegmentation. A slight increase in the total running time has been experienced, but
the overall computational load remains limited (a 512×512 image is processed in 23 to 25
seconds with this version against an average of 20 for the old one, on a machine equipped
with a 1.66 GHz processor).
As a further assessment, we also show here some experiments on very high resolution
images from the remote sensing domain, where TFR already proved to be an effective tool
for multiscale image classification [3]. Results are shown in Fig. 6 and Fig. 7, where con-
tours of the segmentation maps obtained with the new technique are superimposed to the
source image. Such maps are again manually picked from the hierarchical set. The first
experiment (Fig. 6) concerns an aerial image of an area around Naples, Italy (size 500×750,

GAETANO ET AL.: GRAPH-BASED ANALYSIS OF TEXTURED IMAGES 9
Figure 7: First row: an image of San Diego (CA, USA, c©IKONOS) from the Ikonos satel-
lite, and the urban-peripheral classification provided respectively by the old and new algo-
rithm. Second row: a GeoEye-1 image of San Francisco (CA, USA, c©GEOEYE), with the
respective segmentations (old TFR and TFR w/L-SBC) of several intra-urban environments.
4 bands with a spatial resolution of around 80 cm) exibiting 3 main classes (sea, urban area
and hillside). Again, the number of initial color classes is fixed to Kc = 8 for both algo-
rithms, with Ks = 5 for SBC and ψL = 0.1 for L-SBC (this set has been kept also for the
next experiments). Classical TFR (second and third image) fails to correctly detect inland
classes, mainly because of the lack of color information that limits the reliability of contex-
tual features, while the new version correctly isolates the hillside area and, one level below
on the hierarchy, also provides the segmentation of the seashore, that clearly exhibits differ-
ent textural properties. In Fig. 7 (first row), urban area segmentation of an image provided by
the Ikonos satellite is presented (2004×2004 pixels, 4 pansharpened bands with 1 m spatial
resolution), with the classical TFR providing a good result for binary classification, basically
including all urban and peripheral parts in one class and outer vegetation in the other, while
the new technique identifies, along with the urban class including main roads, a separated
class comprising the industrial area in the north, and two different vegetation areas. In the
end, a third experiment is presented in the second row of Fig. 7, on a challenging GeoEye-
1 image exhibiting several different intra-urban environments (1600×1600 pixels at 45 cm
resolution). Here, the old TFR fails, getting stuck on fine details mainly because the majority
of the detected elementary texture patterns are spread all over the image. Very interesting in
this case is the segmentation provided by the new algorithm, where the main environments
have been neatly detected according to their visual aspect, with the only possible oversplit of
the central and top-right areas, whose fragments are characterized by a different orientation.
5 Conclusions
In this work, we have presented some advances in the Texture Fragmentation and Recon-
struction algorithm, a recently proposed hierarchical image segmentation algorithm. A

10 GAETANO ET AL.: GRAPH-BASED ANALYSIS OF TEXTURED IMAGES
technique for the detection of elementary texture patterns with homogeneous spectral and
contextual properties has been developed that relies on the use of graph structures. The
algorithm starts from a suitable partition of the image in color/microtextural classes, and
works independently for each class. Given a partial class map that comprises a series of
color-homogeneous connected components, thanks to the morphological construction of re-
gion adjacencies, a graph is built where each node represents a fragment and a link exists
if two fragments are “neighbours”. These links are then annotated by measuring the con-
text similarity between the fragments associated with the link vertices. Graph cuts, obtained
by removing links below an automatically determined threshold, carry out the texture pat-
terns. Integration of this technique into the TFR algorithm has proved successful, providing
promising results both on the Prague Segmentation Benchmark and on real-world images
from the remote sensing domain. Further research is under way to optimize the graph clus-
tering. The definition of a new texture score metric, which take into account the color-wise
graph structures introduced here, will also be object of future works.
6 Acknowledgements
This work has been carried out during the tenure of a post-doctoral fellowship (Gaetano’s
post-doc) promoted by the ERCIM consortium, which the authors would like to thank.
References
[1] T. Cour, F. Bénézit, and J. Shi. Spectral segmentation with multiscale graph decompo-
sition. Proc. of IEEE Conference on Computer Vision and Pattern Recognition CVPR
2005, 2:1124–1131, June 2005.
[2] C. D’Elia, G. Poggi, and G. Scarpa. A tree-structured Markov random field model for
Bayesian image segmentation. IEEE Trans. on Im. Proc., 12(10):1259–1273, October
2003.
[3] R. Gaetano, G. Scarpa, and G. Poggi. Hierarchical texture based segmentation of mul-
tiresolution remote sensing images. IEEE Trans. on Geo. and Rem. Sens., 47(7):2129–
2141, August 2009.
[4] M. Haindl and S. Mikeš. Texture segmentation benchmark. In Proceedings of the
19th International Conference on Pattern Recognition, ICPR 2008, pages 1–4, Los
Alamitos, December 2008. IEEE Computer Society. ISBN 978-1-4244-2174-9. doi:
http://dx.doi.org/10.1109/ICPR.2008.4761118.
[5] A. S. Laliberte and A. Rango. Texture and scale in object-based analysis of subdecime-
ter resolution unmanned aerial vehicle (uav) imagery. IEEE Transactions on Geo-
science and Remote Sensing, 47(3):761–770, 2009.
[6] T. Pavlidis. Structural Pattern Recognition. Springer, New York, 1980.
[7] Anil Raj and Chris H. Wiggins. An information-theoretic derivation of min-cut-based
clustering. IEEE Transactions on Pattern Analysis and Machine Intelligence, 32(6):
988–995, 2010.

GAETANO ET AL.: GRAPH-BASED ANALYSIS OF TEXTURED IMAGES 11
[8] G. Scarpa, R. Gaetano, and G. Poggi. Texture image segmentation by hierarchical
modeling. In Proc. European Signal Processing Conference, EUSIPCO 2008, Lau-
sanne (CH), August 2008.
[9] G. Scarpa, R. Gaetano, M. Haindl, and J. Zerubia. Hierarchical multiple markov chain
model for unsupervised texture segmentation. IEEE Trans. on Im. Proc., 18(8):1830–
1843, August 2009.
[10] J. Shi and J. Malik. Normalized cuts and image segmentation. IEEE Transactions on
Pattern Analysis and Machine Intelligence, 22(8):888–905, Aug. 2000.
[11] P. Soille. Morphological Image Analysis, Principle and Applications, 2nd ed. Springer-
Verlag, 2002.
[12] L. Srensen, S. B. Shaker, and M. de Bruijne. Quantitative analysis of pulmonary em-
physema using local binary patterns. IEEE Transactions on Medical Imaging, 29(2):
559–569, 2010.
[13] A. Tremeau and P. Colantoni. Regions adjacency graph applied to color image seg-
mentation. IEEE Transactions on Image Processing, 9(4):735–744, 2000.
[14] T. Vlachos and A. G. Constantinides. Graph-theoretical approach to colour picture
segmentation and contour classification. IEE Proceedings I Communications, Speech
and Vision, 140(1):36–45, 1993.