Graph Analytics using the Vertica Relational Database · Graph Analytics using the Vertica...
13
Graph Analytics using the Vertica Relational Database Alekh Jindal * Samuel Madden * Mal ´ u Castellanos ? Meichun Hsu ? * CSAIL, MIT ? Vertica, HP Software Abstract Graph analytics is becoming increasingly popular, with a deluge of new systems for graph analytics having been proposed in the past few years. These systems often start from the assumption that a new storage or query processing system is needed, in spite of graph data being often collected and stored in a relational database in the first place. In this paper, we study Vertica relational database as a platform for graph analytics. We show that vertex-centric graph analysis can be translated to SQL queries, typically involving table scans and joins, and that modern column-oriented databases are very well suited to running such queries. Specifically, we present an experimental evaluation of the Vertica relational database sys- tem on a variety of graph analytics, including iterative analysis, a combination of graph and relational analyses, and more complex 1- hop neighborhood graph analytics, showing that it is competitive to two popular vertex-centric graph analytics systems, namely Giraph and GraphLab. 1. INTRODUCTION Recent years have seen growing interest in the area of graph data management from businesses and academia. This focus on graphs arises from their use in a number of new applications, including so- cial network analytics, transportation, ad and e-commerce recom- mendation systems, and web search. As a result, a deluge of new graph data management systems have been proposed. In particular, many systems focus on graph analytics, e.g., efficiently computing statistics and other metrics over graphs, such as PageRank or short- est paths. These graph analytics workloads are seen as quite differ- ent from traditional database analytics, largely due to the iterative nature of many of these computations, and the perceived awkward- ness of expressing graph analytics as SQL queries (which typically involves multiple self-joins on tables of nodes and edges). Exam- ples of these new systems include a number of so-called “vertex- centric” systems (e.g., Pregel [1], Giraph [2], GraphLab [3], Trin- ity [4], and Pregelix [5]). 1.1 Why Relational Databases? Given the popular demand for graph analytics, a natural question is whether or not traditional database systems really are a bad fit for these graph analytics workloads? This question arises because, in many real-world scenarios, graph data is collected and stored in a relational database in the first place and it is expensive to move data around. Given this, if it is avoidable, users may prefer not to ex- port their data from the relational database into a graph database. Rather, they would like to perform the graph analytics (with com- parable performance) directly with the relational engine, without the expensive step of copying data into a file system (or distributed storage system like HDFS), in order to be processed by a graph system, and then (possibly) back into the relational system for fur- ther processing. Indeed, some early efforts to implement graph queries in relational databases [6, 7, 8] have shown promise in this regard, but have typically only evaluated one or a small number of benchmarks, and not demonstrated the feasibility of implementing an efficient, general-purpose graph engine in a relational system. Apart from the need to avoid copying data in and out of file sys- tems, graph engines suffer from another limitation. As graphs get larger and larger, frequently the users want to (or will have to) select a subset of a graph before performing analysis on it. For example, it is unlikely that a user will run a single-source shortest path query on the entire trillion node Facebook graph — this would be pro- hibitively slow on any system. Rather, it is more likely that users will run several shortest paths queries over different subsets of the graph (e.g., the N-hop neighbors of some particular user.) Further- more, real-world graphs have vertices and edges accompanied by several other attributes. For example, edges in a social network may be of different types such as friends, family, or classmates. Simi- larly nodes may have several attributes to describe the properties of each person in the social network, e.g., their username, birth- date, and so on. Given such metadata, an analyst would typically do some ad-hoc relational analysis in addition to the graph anal- ysis. For instance, the analyst may want to preprocess and shape the graph before running the actual graph algorithm, e.g., filtering edges based on timestamp or limiting the graph to just close friends of a particular user. Similarly, he may want to analyze the output of the graph analysis, e.g., computing aggregates to count the number of edges or nodes satisfying some property, or other statistics. Such pre- and post- processing of graph data requires relational operators such as selection, projection, aggregation, and join, for which rela- tional databases are highly optimized. In addition to combining relational analysis, several graph anal- yses compute aggregates over a larger neighborhood. For example, counting the triangles in a graph requires every vertex to access its neighbors’ neighbors (which could potentially form the three vertices of the triangle). Likewise, finding whether a vertex acts as a bridge (weak ties) between two disconnected vertices requires every vertex to check for the presence of edges between its neigh- bors, i.e. the 1-hop neighborhood. Vertex-centric interfaces like Pregel [1] are tedious for expressing the above queries, as they re- quire sending neighborhood information to all its neighbors in the first superstep and then performing the actual analysis in the sec- ond superstep. SQL, on the other hand, is a much more powerful and general purpose language for capturing such analyses. For ex- ample, in Vertica, we can express triangle counting as a three-way self-join over the edge table very efficiently [7]. Similarly, we can detect weak ties using two inner joins (to get the two vertices on either side of the bridge) and one outer join (to make sure that the two vertices are not connected by an edge). Thus, by simply adding more joins, SQL is more flexible at expressing such graph analyses. Finally, the query optimizer in a relational database picks the best plan for the multi-join queries and the system can take care of re-segmenting the data when needed. As an example, the optimizer may decide to fully pipeline the triangle counting query and never materialize the intermediate output. This is in contrast to static 1 arXiv:1412.5263v1 [cs.DB] 17 Dec 2014
Transcript of Graph Analytics using the Vertica Relational Database · Graph Analytics using the Vertica...
Graph Analytics using the Vertica Relational Database
Alekh Jindal∗ Samuel Madden∗ Malu Castellanos? Meichun Hsu?
∗CSAIL, MIT ?Vertica, HP Software
AbstractGraph analytics is becoming increasingly popular, with a deluge ofnew systems for graph analytics having been proposed in the pastfew years. These systems often start from the assumption that anew storage or query processing system is needed, in spite of graphdata being often collected and stored in a relational database in thefirst place. In this paper, we study Vertica relational database asa platform for graph analytics. We show that vertex-centric graphanalysis can be translated to SQL queries, typically involving tablescans and joins, and that modern column-oriented databases arevery well suited to running such queries. Specifically, we presentan experimental evaluation of the Vertica relational database sys-tem on a variety of graph analytics, including iterative analysis, acombination of graph and relational analyses, and more complex 1-hop neighborhood graph analytics, showing that it is competitive totwo popular vertex-centric graph analytics systems, namely Giraphand GraphLab.
1. INTRODUCTIONRecent years have seen growing interest in the area of graph data
management from businesses and academia. This focus on graphsarises from their use in a number of new applications, including so-cial network analytics, transportation, ad and e-commerce recom-mendation systems, and web search. As a result, a deluge of newgraph data management systems have been proposed. In particular,many systems focus on graph analytics, e.g., efficiently computingstatistics and other metrics over graphs, such as PageRank or short-est paths. These graph analytics workloads are seen as quite differ-ent from traditional database analytics, largely due to the iterativenature of many of these computations, and the perceived awkward-ness of expressing graph analytics as SQL queries (which typicallyinvolves multiple self-joins on tables of nodes and edges). Exam-ples of these new systems include a number of so-called “vertex-centric” systems (e.g., Pregel [1], Giraph [2], GraphLab [3], Trin-ity [4], and Pregelix [5]).
1.1 Why Relational Databases?Given the popular demand for graph analytics, a natural question
is whether or not traditional database systems really are a bad fit forthese graph analytics workloads? This question arises because, inmany real-world scenarios, graph data is collected and stored in arelational database in the first place and it is expensive to move dataaround. Given this, if it is avoidable, users may prefer not to ex-port their data from the relational database into a graph database.Rather, they would like to perform the graph analytics (with com-parable performance) directly with the relational engine, withoutthe expensive step of copying data into a file system (or distributedstorage system like HDFS), in order to be processed by a graphsystem, and then (possibly) back into the relational system for fur-ther processing. Indeed, some early efforts to implement graphqueries in relational databases [6, 7, 8] have shown promise in this
regard, but have typically only evaluated one or a small number ofbenchmarks, and not demonstrated the feasibility of implementingan efficient, general-purpose graph engine in a relational system.
Apart from the need to avoid copying data in and out of file sys-tems, graph engines suffer from another limitation. As graphs getlarger and larger, frequently the users want to (or will have to) selecta subset of a graph before performing analysis on it. For example,it is unlikely that a user will run a single-source shortest path queryon the entire trillion node Facebook graph — this would be pro-hibitively slow on any system. Rather, it is more likely that userswill run several shortest paths queries over different subsets of thegraph (e.g., the N-hop neighbors of some particular user.) Further-more, real-world graphs have vertices and edges accompanied byseveral other attributes. For example, edges in a social network maybe of different types such as friends, family, or classmates. Simi-larly nodes may have several attributes to describe the propertiesof each person in the social network, e.g., their username, birth-date, and so on. Given such metadata, an analyst would typicallydo some ad-hoc relational analysis in addition to the graph anal-ysis. For instance, the analyst may want to preprocess and shapethe graph before running the actual graph algorithm, e.g., filteringedges based on timestamp or limiting the graph to just close friendsof a particular user. Similarly, he may want to analyze the output ofthe graph analysis, e.g., computing aggregates to count the numberof edges or nodes satisfying some property, or other statistics. Suchpre- and post- processing of graph data requires relational operatorssuch as selection, projection, aggregation, and join, for which rela-tional databases are highly optimized.
In addition to combining relational analysis, several graph anal-yses compute aggregates over a larger neighborhood. For example,counting the triangles in a graph requires every vertex to accessits neighbors’ neighbors (which could potentially form the threevertices of the triangle). Likewise, finding whether a vertex actsas a bridge (weak ties) between two disconnected vertices requiresevery vertex to check for the presence of edges between its neigh-bors, i.e. the 1-hop neighborhood. Vertex-centric interfaces likePregel [1] are tedious for expressing the above queries, as they re-quire sending neighborhood information to all its neighbors in thefirst superstep and then performing the actual analysis in the sec-ond superstep. SQL, on the other hand, is a much more powerfuland general purpose language for capturing such analyses. For ex-ample, in Vertica, we can express triangle counting as a three-wayself-join over the edge table very efficiently [7]. Similarly, we candetect weak ties using two inner joins (to get the two vertices oneither side of the bridge) and one outer join (to make sure that thetwo vertices are not connected by an edge). Thus, by simply addingmore joins, SQL is more flexible at expressing such graph analyses.
Finally, the query optimizer in a relational database picks thebest plan for the multi-join queries and the system can take care ofre-segmenting the data when needed. As an example, the optimizermay decide to fully pipeline the triangle counting query and nevermaterialize the intermediate output. This is in contrast to static
1
arX
iv:1
412.
5263
v1 [
cs.D
B]
17
Dec
201
4
query execution plans in typical graph analytics systems such asGiraph. Furthermore, since graph manipulations in Giraph are notimplemented as operators, it is difficult to modify or extend theGiraph execution pipeline. Relational databases, on the other hand,are extensible by design.
1.2 Why Column Stores?Graph analytics typically involves scan-oriented table joins fol-
lowed by aggregates, which are highly suited for column-orientedrelational databases like Vertica. In an earlier effort, we comparedthe performance of different relational data stores over graph queriesand column stores were a clear winner [9]. This is due to combi-nation of several features in modern column stores, including effi-cient data storage (vertical partitioning and compression), vector-ized data access, query pipelining, late materialization, and numer-ous join optimizations. Furthermore, in contrast to the narrow ta-bles in raw graphs, the presence of metadata results in wide vertexand edge tables, where column stores will perform especially wellwith as they only need to access the columns that are relevant forthe analysis.
In this paper, we describe four key aspects necessary to buildhigh-performance graph analytics in the Vertica column-orienteddatabase. First, we look at how we can translate the logical queryplans of vertex-centric graph queries into relational operators andrun them as standard SQL. Although vertex compute functions canbe rewritten into pure SQL in some cases, we find that table UDFs(offered by many relational databases, including Vertica) are suffi-cient to express arbitrarily complex vertex functions as well. Sec-ond, we show several query optimization techniques to tune theperformance of graph queries on Vertica. These include consid-ering updating vs replacing the nodes table on each iteration, in-cremental evaluation of queries, and eliminating redundant joins.Third, we outline several features specific to a column-store likeVertica that makes it well suited to run graph analytics queries. Fi-nally, we show how Vertica can be optimized using table UDFsto run iterative graph analytics in-memory, which significantly re-duces the disk I/Os (and overall query time) at the cost of highermemory footprint.Contributions. In summary, our key contributions are as follows:
(1.) We take a closer look at vertex-centric graph processing, usingthe Giraph system (a popular graph analytics system) as an exam-ple. We show that vertex-centric graph processing can be expressedas a query execution plan, which in the case of Giraph is a fixedplan that is used to run all Giraph programs. We then show that thisplan can be expressed as a logical query plan that can be optimizedusing a relational query optimizer (Section 2).
(2.) We show how we can translate this vertex-centric plan intoSQL, which can be run on standard relational databases. We de-scribe several query optimizations to improve the performance ofvertex-centric queries and describe Vertica specific features to runthese queries efficiently. As a concrete example, we discuss thephysical query execution plan of single source shortest path on Ver-tica. Lastly, we show how Vertica can be extended via table UDFsto run the entire unmodified vertex-centric query in-memory and asa single transaction (Section 3).
(3.) We provide an extensive experimental evaluation of severaltypical graph queries on large, billion-edge graphs in Vertica. Wecompare it with two popular vertex-centric graph processing sys-tems, GraphLab and Giraph. Our key findings are: (i) Vertica hascomparable end-to-end performance to these popular vertex-centricsystems, (ii) Vertica has a much smaller memory footprint thanother systems, at the cost of much greater disk I/O, (iii) We can
public void compute( Iterable<IntWritable> messages) {
// get the minimum distanceif ( getSuperstep () == 0)
setValue (new DoubleWritable(Integer .MAX VALUE));int minDist = isSource () ? 0 : Integer .MAX VALUE;for ( IntWritable message : messages)
minDist = Math.min(minDist, message.get () ) ;
// send messages to all edges if new minimum is foundif (minDist < getValue() . get () ) {
setValue (new IntWritable (minDist)) ;for (Edge<?, ?> edge : getEdges() ) {
int distance = minDist + edge.getValue () . get () ;sendMessage(edge. getTargetVertexId () , new IntWritable ( distance ) ) ;
}}voteToHalt () ; // halt
}
Listing 1: Single Source Shortest Path in Giraph.
extend Vertica to trade an increased memory footprint for fasterruntimes, comparable to that of GraphLab, (iv) relational enginesnaturally excel at combining graph analysis with relational analy-sis, and (v) relational engines can implement more complex 1-hopneighborhood graph analyses, which vertex-centric programmingcannot express efficiently (Section 4).
2. BACKGROUNDVertex-centric graph processing, first proposed in Pregel [1], has
become the most popular general purpose way of processing graphdata, due to its ease-of-use and proven ability of engines based onit to scale to large graphs [3, 10, 4, 11, 5]. In this section, we firstrecap the vertex-centric programming model. Then, to understandthe graph processing in a typical vertex-centric system, we analyzethe execution pipeline in Giraph, an open-source implementationof Pregel, and express it as a logical query plan. Other Pregel-like systems use a similar static query plan, though some may usedifferent scheduling strategies, e.g. GraphLab.
2.1 Vertex-centric ModelIn the vertex-centric programming model, the user provides a
UDF (the vertex program) specifying the computation that happensat each vertex of the graph. The UDFs update the vertex state andcommunicate by sharing messages with neighboring vertices. Theunderlying execution engine may choose to run the vertex-centricprograms synchronously, as a series of supersteps with synchro-nization between then, or asynchronously, where threads update arepresentation of the graph in shared memory. Programmers do nothave to worry about details such how the graph is partitioned acrossnodes/threads, how it is distributed across multiple machines, orhow message passing and coordination works. Each vertex maybe on the same physical machine or a different, remote machine.The concept is similar to MapReduce, where programmers onlyspecify map and the reduce functions without worrying about thesystem details. To illustrate, Listing 1 shows how a programmerwould implement single source shortest paths (SSSP) using Gi-raph (other Pregel-like systems have very similar syntax). In thisprogram, each vertex compares its current shortest distance to thesource to the distance reported by each of its neighbors, and if ashorter distance is found, updates its distance and propagates theupdated distance to its neighbors.
2.2 Giraph Execution PipelineWe now provide a detailed study of execution workflow used in
Giraph, to illustrate the key steps in vertex-centric program execu-tion. Giraph runs graph analyses as user provided vertex-centric
2

Hash-based shuffling No sorting, as opposed to Hadoop Intermediate data is not persisted
Gira
ph M
appe
r
Scan
RecRead
Shuffle
W1 W2 W3 W4
… … …
Server Data
vertexComputeShuffle
partition storeW1 W2 W3 W4
… … …edge storemessage store
synchronizeMaster
Server Data
vertexComputeShuffle
partition storeW1 W2 W3 W4
… … …edge storemessage store
synchronizeMaster
Server Data
cleanupstore
partition storeW1 W2 W3 W4
… … …edge storemessage store
synchronizeMaster
SplitG=(V,E)HDFS
G’=(V’,E’)HDFS
…
Inpu
t Sup
erst
epSu
pers
tep
1O
utpu
t Sup
erst
ep…
….
Physical Execution Pipeline Logical Query Plan
V E
M
V’ U M’
vertexCompute
γV
V.id=E.from
V.id=M.to
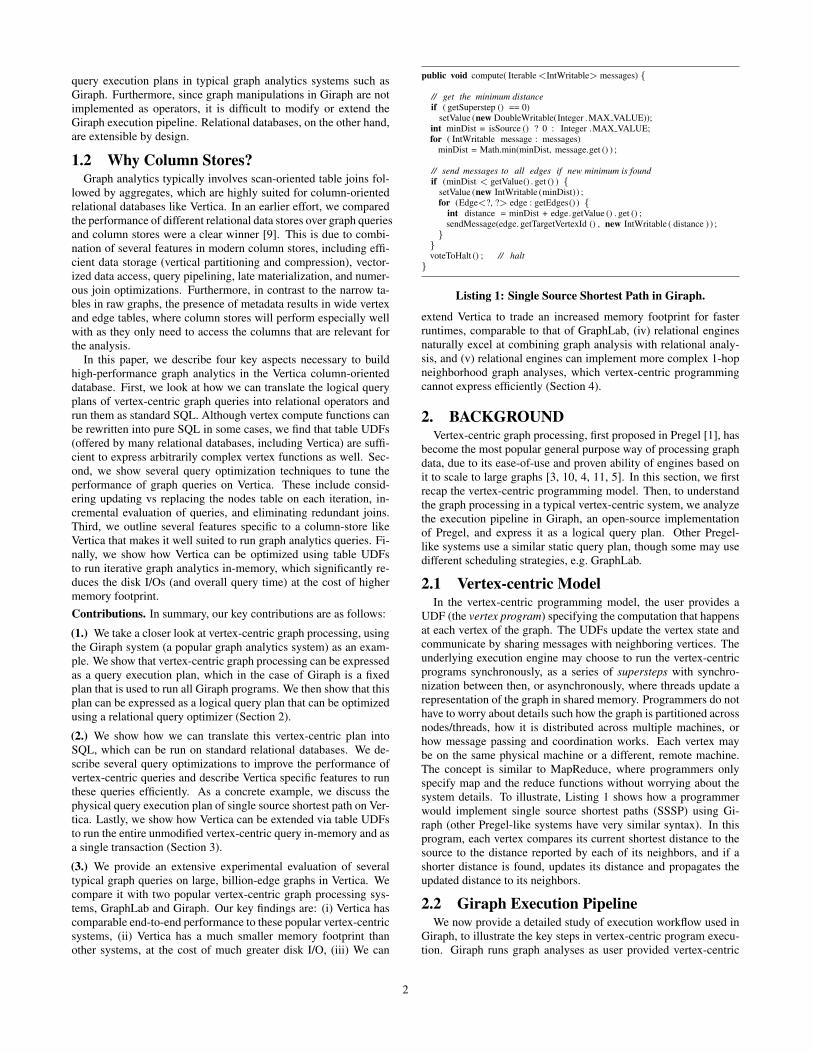
Figure 1: Giraph Physical Execution Pipeline and its LogicalRepresentation.
programs on top of Hadoop MapReduce. The user provides thecomputation that happens at each vertex of the graph and Giraphtakes care of running it in a distributed fashion over a large cluster.
Specifically, Giraph executes the vertex-centric query as a map-only job (the GiraphMapper) on Hadoop MapReduce. However, ituses the Hadoop MapReduce infrastructure only to allocate nodes,using mappers simply as containers for Giraph workers. These mapjobs run for the duration of the job, repeatedly executing the com-pute UDF and communicating with other mappers over sockets. Toillustrate this data flow, the left-side of Figure 1 shows the physicalexecution of Giraph with four workers W1 to W4. The executionin Giraph is organized into supersteps, wherein each worker oper-ates in parallel during the superstep and the workers synchronizeat the end of the superstep. During the InputSuperstep, the systemsplits the input graph into a list of vertices V and list of edges Eas it reads data from HDFS. Each worker reads the split assignedto it, parses it into vertices and edges, and partitions them acrossall workers, typically using a hash-based partitioner. Each workerthen builds its ServerData, consisting of three components: (i) thepartition store to keep the partition vertices and related metadata,(ii) the edge store to keep the partition edges and related metadata,and (iii) the message store to keep the incoming messages for thispartition. At the end of the InputSuperstep, i.e. when all work-ers have finished creating the ServerData, the workers are ready toperform the actual vertex computation. In each superstep after theInputSuperstep, the workers run the vertexCompute UDF for thevertices in their respective partition and shuffle the outgoing mes-sages across all workers. The workers then update their respectiveServerData and wait for everyone to finish the superstep (the syn-chronize barrier). Finally, when there are no more messages to pro-cess, the workers store the output graph back in HDFS during theOutputSuperstep. Thus, we see that similar to MapReduce execu-tion in Hadoop [12], Giraph has a static hard-coded query executionpipeline.
2.3 Logical Query Plan
Hash-based shuffling No sorting, as opposed to Hadoop Intermediate data is not persisted
Gira
ph M
appe
r
VM
V’ U M’vertexCompute
γV
V.id=E.fromV.id=M.to
E
E
M
vertexCompute
γV
V.id=M.to
M’
V’
V
V.id=E.from
E
vertexCompute
γV1
V1.id=E.to
V’
V1V2
V2.id=E.from
1 2 3
V’
E
γV1
V1.id=E.to
V1
V2
V2.id=E.from
Γd’=min(V2.d+1)
σd’<V1.d
V’
E
γV1
V1.id=E.to
V1
V2
V2.id=E.from
Γcc’=min(V2.id)
σcc’<V1.cc V’
E
γV1
V1.id=E.to
V1
V2
V2.id=E.from
ΓV1.r=0.15/n+0.85*sum(V2.r/V2.outD)
Giraph logicalquery plan
Pushing down the vertexCompute UDF
Replacing M by V E
Figure 2: Rewriting Giraph Logical Query Plan.
The above Giraph physical execution pipeline can also be rep-resented as a logical query plan, consisting of relational operatorsand the vertexCompute UDF. The right-side of Figure 1 shows sucha simplified logical query plan. Assuming that the graph structureitself remains unchanged1, the Giraph execution pipeline is essen-tially a distributed vertex update query. That is, it takes the set ofvertices V (each having an id and a value), edges E (each having asource and a destination vertex id) and messages M (each havingdestination vertex id and the message value), runs the vertexCom-pute UDF for each vertex, and produces the set of output vertices(V ′) and messages (M ′), as shown on the right in Figure 1.
The downside of the above vertex-centric query execution in Gi-raph is that all graph analysis is forced to fit into a fixed queryplan. This is not desirable for several analyses. For example, trian-gle counting, which requires a three-way join over the edges table,is very difficult to fit in this model. Moreover, the Giraph logicalquery plan is not really implemented as a composition of query op-erators, making it very difficult to modify, extend, or add function-ality to the execution pipeline. For instance, the join with M is im-plemented as a sort merge join; changing to another join implemen-tation would require several deep changes in the system. Further-more, even if one could extend or modify the physical executionpipeline, e.g. switch merge join to hash join, Giraph cannot makedynamic decisions regarding the best physical plan. For example,hash join may be suitable for very large numbers of intermediatemessages and merge join better for small numbers of messages.Giraph does not have this flexibility. Finally, Giraph is a custombuilt query processor restricted to a specific type of graph analysis.It cannot be used for more broader types of queries, e.g. multi-hopanalysis, or end-to-end graph analysis, e.g. analyzing the output ofgraph analysis, or combining multiple graph analyses.
In the rest of the paper, we show how relational databases canovercome many of these limitations and, in particular, how Verticais highly suited for a variety of graph analytics.
3. GRAPH ANALYTICS USING VERTICAIn this section, we describe how vertex-centric queries can be run
in SQL on a relational database like Vertica. The goal of this sec-tion is to show how we can: (i) translate vertex-centric graph analy-ses to standard SQL queries, (ii) apply several query optimizationsto improve the performance of graph analyses, and (iii) leveragekey features of Vertica for efficiently executing these graph analyt-ics queries.
3.1 Translation to SQLIn the following, we describe how we rewrite and translate the
Giraph logical query plan to standard SQL.
3.1.1 Eliminating the message table1This is true for several typical vertex-centric graph analysis, suchas PageRank, shortest paths, connected components, etc.
3
Hash-based shuffling No sorting, as opposed to Hadoop Intermediate data is not persisted
Gira
ph M
appe
r
VM
V’ U M’vertexCompute
γV
V.id=E.fromV.id=M.to
E
E
M
vertexCompute
γV
V.id=M.to
M’
V’
V
V.id=E.from
E
vertexCompute
γV1
V1.id=E.to
V’
V1V2
V2.id=E.from
1 2 3
V’
E
γV1
V1.id=E.to
V1
V2
V2.id=E.from
Γd’=min(V2.d+1)
σd’<V1.d
V’
E
γV1
V1.id=E.to
V1
V2
V2.id=E.from
Γcc’=min(V2.id)
σcc’<V1.cc V’
E
γV1
V1.id=E.to
V1
V2
V2.id=E.from
ΓV1.r=0.15/n+0.85* sum(V2.r/V2.outD)
Giraph logicalquery plan
Pushing down the vertexCompute UDF
Replacing M by V E
(a) SSSP
Hash-based shuffling No sorting, as opposed to Hadoop Intermediate data is not persisted
Gira
ph M
appe
r
VM
V’ U M’vertexCompute
γV
V.id=E.fromV.id=M.to
E
E
M
vertexCompute
γV
V.id=M.to
M’
V’
V
V.id=E.from
E
vertexCompute
γV1
V1.id=E.to
V’
V1V2
V2.id=E.from
1 2 3
V’
E
γV1
V1.id=E.to
V1
V2
V2.id=E.from
Γd’=min(V2.d+1)
σd’<V1.d
V’
E
γV1
V1.id=E.to
V1
V2
V2.id=E.from
Γcc’=min(V2.id)
σcc’<V1.cc V’
E
γV1
V1.id=E.to
V1
V2
V2.id=E.from
ΓV1.r=0.15/n+0.85* sum(V2.r/V2.outD)
Giraph logicalquery plan
Pushing down the vertexCompute UDF
Replacing M by V E
(b) CC
Hash-based shuffling No sorting, as opposed to Hadoop Intermediate data is not persisted
Gira
ph M
appe
r
VM
V’ U M’vertexCompute
γV
V.id=E.fromV.id=M.to
E
E
M
vertexCompute
γV
V.id=M.to
M’
V’
V
V.id=E.from
E
vertexCompute
γV1
V1.id=E.to
V’
V1V2
V2.id=E.from
1 2 3
V’
E
γV1
V1.id=E.to
V1
V2
V2.id=E.from
Γd’=min(V2.d+1)
σd’<V1.d
V’
E
γV1
V1.id=E.to
V1
V2
V2.id=E.from
Γcc’=min(V2.id)
σcc’<V1.cc V’
E
γV1
V1.id=E.to
V1
V2
V2.id=E.from
ΓV1.r=0.15/n+0.85*sum(V2.r/V2.outD)
Giraph logicalquery plan
Pushing down the vertexCompute UDF
Replacing M by V E
(c) PageRank
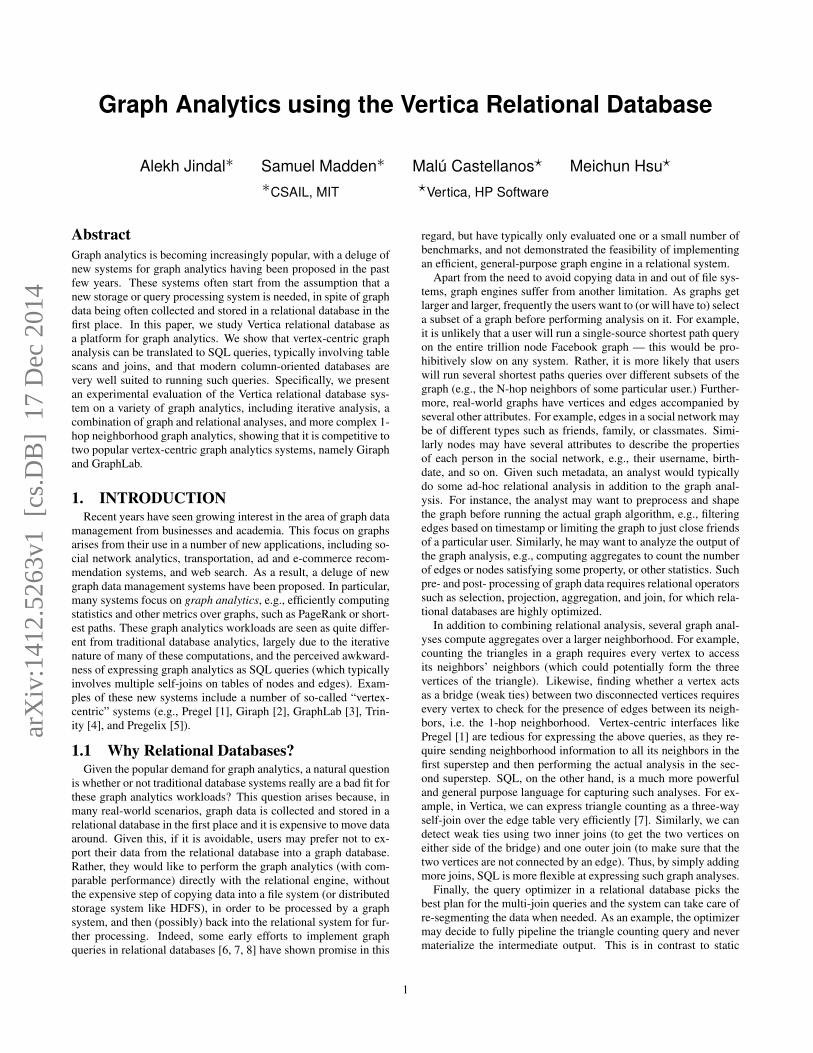
Figure 3: Logical query plans for three vertex-centric queries:(i) single source shortest path (SSSP), (ii) connect components(CC), and PageRank.
Consider again the Giraph logical query plan, shown on the leftin Figure 2. The relation M in this plan is an intermediate outputand an artifact of message passing, a consistency mechanism inGiraph. Since relational databases take care of consistency andallow us to operate directly on the relational tables, we can get ridof M . Note that the relation M is used to communicate the newvalues of vertices to its neighbors. Therefore, we can push downthe vertex compute function and obtain the new messages M ′ byjoining the new vertex values (V ′) with the outgoing edges (E), asshown in the middle of Figure 2. Finally, we can replace M withV 1 E and get rid of relation M completely, as shown on the rightin Figure 2. This simplified query plan deals only with relations Vand E as the input and produces modified relation V ′ as output.
3.1.2 Translating the vertex compute functionsThe vertexCompute in the Giraph logical query plan (Figure 1)
can be an arbitrary user defined function, similar to map/reduce inthe MapReduce framework. However, for many graph analytics,the vertex function involves relatively simple and well defined ag-gregate operations, which can be expressed directly in relationalalgebra/SQL. For example, the vertex function for SSSP in List-ing 1 finds the MIN of the neighboring distances and applies thefilter for detecting smaller distances, i.e.:
SSSP : vertexCompute 7−→ σd’<V1.d(Γd’=min(V2.d+1))
Figure 3(a) shows the resulting logical query plan. Similarly, thevertex function for connected components finds the minimum ver-tex ID amongst its neighbors and filters for new minimum found(Figures 3(b)), whereas the vertex function for PageRank combinesthe PageRank of its neighbors (Figure 3(c)), i.e.:
CC : vertexCompute 7−→ σcc’<V1.cc(Γcc’=min(V2.id))
PageRank : vertexCompute 7−→ ΓV1.r=
0.15n
+0.85∗sum(V2.r
V2.outD)
By rewriting the vertex functions as relational expressions, the re-sulting query plans become purely relational and can be imple-mented completely in standard SQL, without using user-definedfunction features in the database system at all (we describe a moregeneral implementation based on UDFs in Section 3.4 below). Forinstance, we could write SSSP from Figure 3(a) as the followingSQL expression:
SELECT v1.id, MIN(v2.d+1) AS dFROM vertex AS v1, edge AS e, vertex AS v2WHERE v2.id = e.from_node AND v1.id = e.to_nodeGROUP BY e.to_node, v1.dHAVING MIN(v2.d+1) < v1.d
The above SQL query computes the minimum neighboring distanceof every vertex and filters, via the HAVING clause, distances that
are smaller than the already known distance. The resulting verticescan then be used to update the vertex relation, as shown in List-ing 2.
UPDATE vertex AS v SET v.d=v’.dFROM (
SELECT v1.id, MIN(v2.d+1) AS dFROM vertex AS v1, edge AS e, vertex AS v2WHERE v2.id = e.from node AND v1.id = e.to nodeGROUP BY e.to node, v1.dHAVING MIN(v2.d+1) < v1.d
) AS v’WHERE v.id=v’.id;
Listing 2: Shortest Path in SQL.Finally, a driver program (run via a stored procedure) repeatedly
runs the above shortest path query as long as there are any updates,i.e. at least one of the vertices finds a shorter distance.
3.2 Query OptimizationsThe advantage of expressing graph analysis as relational queries
is that we can apply several relational query optimizations, i.e. wehave the flexibility to optimize the queries in several different waysin order to boost performance, in contrast to the hard-coded exe-cution pipeline in Giraph. In the following, we present three suchquery optimizations that can be used to tune the performance. Weuse vertex-centric single source shortest paths as the running ex-ample. However, of course, these optimizations are applicable ingeneral to SQL-based graph analytics.
3.2.1 Update Vs ReplaceGraph queries often involve updating large portions of the graph
over and over again. However, large number of updates can be abarrier to good performance, especially in read optimized systemslike Vertica. To overcome this problem, we can instead replace thevertex or edge table with a new copy of tables containing the up-dated values. For instance, the single source shortest path involvesupdating all vertices that find a smaller distance in an iteration. Aswe explore the graph in parallel, the number of such vertices canquickly grow very large. Therefore, instead of updating the ver-tices in the existing vertex relation, we can create a new vertexrelation (vertex prime) by joining the updated vertices with thenon-updated vertices:
CREATE TABLE vertex prime ASSELECT v.id, ISNULL(v’.d, v.d) AS d
FROM vertex AS v LEFT JOIN (SELECT v1.id AS id, MIN(v2.d+1) AS d
FROM vertex AS v1, edge AS e, vertex AS v2WHERE v2.id=e.from node AND v1.id=e.to nodeGROUP BY e.to node, v1.dHAVING MIN(v2.d+1) < v1.d
) AS v’ON v.id = v’ . Id ;
Listing 3: Shortest Path with Replace instead of Update.Afterwards, we replace vertexwith vertex prime. This replace-ment is quite fast, and, in general, creating a new table is fasterthan updating because it allows new records to be written sequen-tially to the table, rather than performing random I/O to update-in-place or recording large delete lists in Vertica. One downsideof this approach is that we lose the physical design (i.e., indexes)on the original table, and physical designs are expensive to createduring query execution. However, many graph analyses, includingPageRank and SSSP, update only the smaller vertex table and there-fore the physical designs on the larger edge table can be preserved.Still, update-in-place may be more efficient for algorithms that per-form small numbers of updates. For instance, the parallel graph
4

exploration in single source shortest path updates very few verticesin the first few iterations. Therefore, a more sophisticated approachis to apply updates in the first few iterations before switching to re-place. In this work, we experimentally determine a fixed thresholdto switch from updates to replace. Eventually, of course, a cost-based optimizer could be use to determine when to switch.
3.2.2 Incremental EvaluationTypically, iterative queries process different portions of the data
in different iterations. As a result, there is an opportunity for in-cremental query evaluation. This is applicable to iterative graphqueries as well. For example, in single source shortest path, we donot need to explore the entire graph in every iteration. We needto only explore the neighbors of vertices that found a smaller dis-tance in the previous iteration. This introduces the overhead ofkeeping track of such vertices from previous iteration, but allowsus to benefit by only joining the incrementally updated vertices ta-ble (v update) with its neighbors. To achieve this, we initializev update with the startNode since that is the only vertex thatupdated its distance to 0. Thereafter, in each iteration, we get thenew set of updated vertices (v update prime) from the existingset (v update). Although we need to materialize additional inter-mediate output, we are able to exploit it to significantly reduce thejoin cardinalities by expanding only the neighbors of the updatedvertices. We can then replace v update by v update prime andget the updated set of vertices. Listing 4 shows the incrementallyevaluated single source shortest path query. Note that Giraph actu-ally employs a similar optimization as it only computes updates foractive vertices in each superstep.
CREATE TABLE v update prime ASSELECT v1.id, MIN(v2.d+1) AS d
FROM v update AS v2, edge AS e, vertex AS v1WHERE v2.id=e.from node AND v1.id=e.to nodeGROUP BY e.to node, v1.dHAVING MIN(v2.d+1) < v1.d;
DROP TABLE v update;ALTER TABLE v update prime RENAME TO v update ;
CREATE TABLE vertex prime ASSELECT v.id, ISNULL(v update.d, v.d) AS value
FROM vertex AS v LEFT JOIN v updateON v.id = v update . id ;
DROP TABLE vertex; ALTER TABLE vertex prime RENAME TO vertex;
Listing 4: Shortest Path with Incremental Evaluation.
3.2.3 Join EliminationSeveral graph analysis perform neighborhood access without read-
ing the metadata associated with the neighboring vertices. Thismeans that even though the logical query plan may have a join be-tween the vertex and the edge table, we read only the vertex id fromthe vertex table. Thus, the join is redundant and can be eliminated.For example, in the logical query plan for PageRank in Figure 3(c),we read only the vertex id from V1. Therefore, the join with V1 isredundant and can be eliminated as shown in Figure 4.Eliminating one of the joins in the above query will result in muchbetter performance because the output of V2 1 E, which is as bigas the number of edges itself, does not need to be re-partitionedagain to perform the second join.
In summary, vertex-centric graph analyses can be translated toSQL, enabling several optimization techniques to tune the perfor-mance. In the following section, we look at the actual query execu-tion of these graph queries and describe what makes Vertica a good
Hash-based shufflingNo sorting, as opposed to Hadoop Intermediate data is not persisted
Gira
ph M
appe
r
VM
V’ U M’vertexCompute
γV
V.id=E.fromV.id=M.to
E
E
M
vertexCompute
γV
V.id=M.to
M’
V’
V
V.id=E.from
E
vertexCompute
γV1
V1.id=E.to
V’
V1V2
V2.id=E.from
1 2 3
V’
E
γV1
V1.id=E.to
V1
V2
V2.id=E.from
Γd’=min(V2.d+1)
σd’<V1.d
V’
E
γV1
V1.id=E.to
V1
V2
V2.id=E.from
Γcc’=min(V2.id)
σcc’<V1.cc V’
E
γV1
V1.id=E.to
V1
V2
V2.id=E.from
ΓV1.r=0.15/n+0.85*sum(V2.r/V2.outD)
Giraph logicalquery plan
Pushing down the vertexCompute UDF
Replacing M by V E
V’
E
γE.to
V2
V2.id=E.from
Γr=0.15/n+0.85*sum(V2.r/V2.outD)
V2
E
γV.id
VV.id=E.from
ΓoutD=count(*)
Figure 4: Join Elimination in PageRank.
choice for such analyses.
3.3 Query ExecutionIn the previous section, we saw that graph analyses typically in-
volve full table scans and joins over the vertex and the edge tables.We now look at some of the features that makes Vertica well-suitedfor executing such queries. Specifically, we describe four key fea-tures that Vertica provides: (i) an optimized physical database de-sign, (ii) join optimizations, (iii) query pipelining, and (iv) intra-query parallelism. Thereafter, we walk through the query execu-tion plan of single source shortest path in Vertica and contrast itwith that of Giraph.
3.3.1 Physical DesignVertica provides rich support for creating physical designs in or-
der to boost query performance. For instance, it allows creatingprojections, sort orders, and segmentations within and across dif-ferent nodes, as well as several encoding and compression schemes.See [13] for more details on physical design using Vertica. Al-though the columnar data representation is not useful for projec-tions over narrow vertex and edge tables with just a few columns,it is useful for efficiently compressing these tables and saving diskI/O. As a result, we can create multiple table projections over thesetables, in order to boost the performance of queries, while still notexceeding the raw data size. For instance, we can create two pro-jections over the edge table, one segmented on from node and theother on to node, in order to perform different self-joins over theedge table locally. Likewise, we can sort the projections on differ-ent attributes for performing merge join instead of hash join as wellas for evaluating selection predicates.
Thus, using Vertica, developers can efficiently encode and com-press their graph data, create multiple sort orders and partitionings,and based on the physical design, leverage the query optimizer toautomatically pick the best physical query operators for their anal-ysis at run time.
3.3.2 Join OptimizationsGraph analyses when written in SQL make heavy use of joins.
Vertica is highly optimized to efficiently execute such joins overlarge tables. For example, it can perform joins directly on com-pressed data without decoding it, apply type dependent just-in-timecompilation of the join condition in order to avoid branching, anduse sideways information passing (SIP) to push down the join con-dition as selection predicate over the outer input and thus filtertuples early on [14]. Furthermore, databases are not limited to aspecific join implementation. Rather, the optimizer can choose be-tween hash or merge joins, or even dynamically switch between thetwo.
Efficient join processing is a key feature that makes graph anal-ysis possible in Vertica, by allowing developers to quickly traverseand manipulate large graphs via repeated self-joins.
3.3.3 Query Pipelining
5
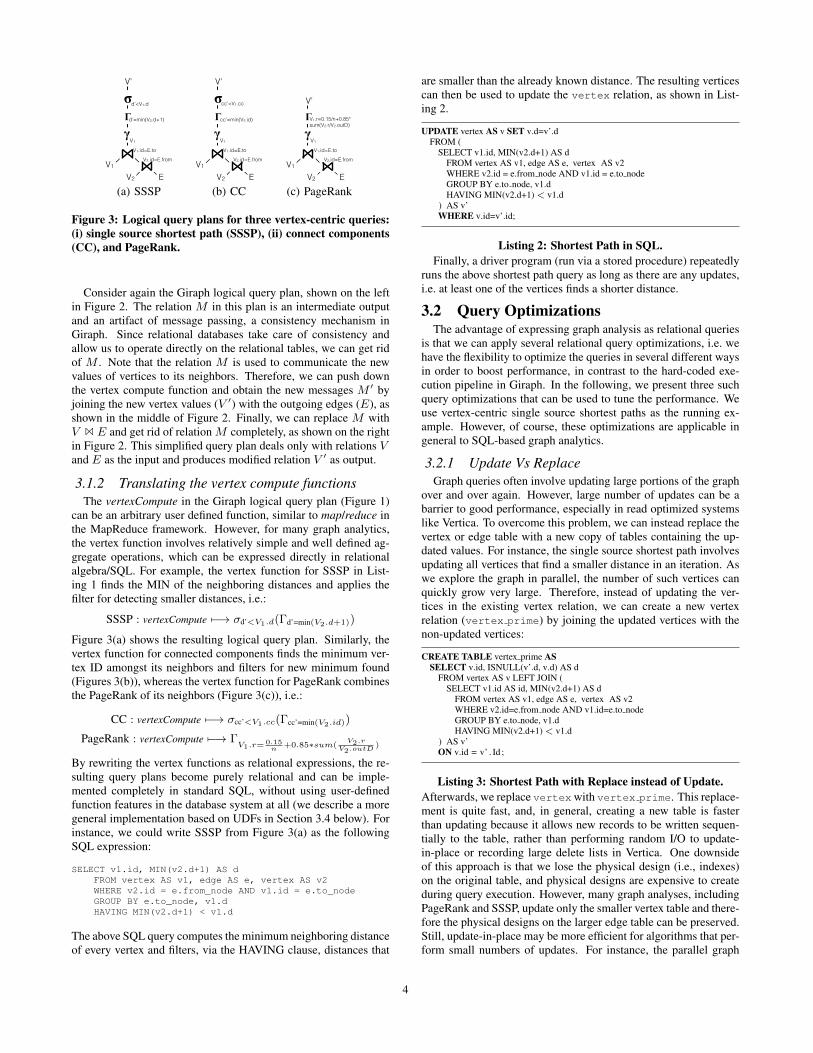
BASE QUERY PLANQuery: explain SELECT e.to_node AS id, min(n1.value+1) AS value
FROM twitter_node AS n1, twitter_edge AS e, twitter_node AS n2 WHERE n1.id=e.from_node AND n2.id=e.to_node
GROUP BY e.to_nodeHAVING min(n1.value+1) < min(n2.value);
All Nodes Vector:
node[0]=node0 (initiator) Up node[1]=node1 (executor) Up node[2]=node2 (executor) Up node[3]=node3 (executor) Up
Root OutBlk=[UncTuple(2)]
NewEENode OutBlk=[UncTuple(2)]
ExprEval: e.to_node, <SVAR>
Recv from: node0,node1,node2,node3
Send to: node0
FilterStep: (<SVAR> < <SVAR>)
GroupByPipe: 1 keysAggs: min((n1.value + 1)), min(n2.value)
StorageMergeStep: twitter_edge; 1 sorted
GroupByPipe: 1 keysAggs: min((n1.value + 1)), min(n2.value)
ExprEval: e.to_node, (n1.value + 1), n2.value
Join: Merge-Join: using previous join and twitter_node_b0
Join: Hash-Join: using twitter_edge and twitter_node_b0
ScanStep: twitter_edgeSIP2(HashJoin): e.from_nodeSIP1(MergeJoin): e.to_node
to_node (not emitted),from_nodeRecv from: node0,node1,node2,node3
Send to: node0,node1,node2,node3
StorageUnionStep: twitter_node_b0
ScanStep: twitter_node_b0id, value
StorageMergeStep: twitter_node_b0; 1 sorted
ScanStep: twitter_node_b0id, value
Figure 5: Query execution plan of shortest paths in Vertica.
Vertica supports pipelined query execution, which avoids mate-rializing intermediate results that would otherwise require repeatedaccess to disk. This is important because graph queries involvejoin operations that can have large intermediate results which canbenefit dramatically from pipelining. For instance, in each itera-tion, the single source shortest path joins a vertex with its incom-ing edges and incoming nodes, thereby resulting in an intermediateresult with cardinality equal to the number of edges. We can in-duce pipelining for such queries by creating sort orders on join andgroup by attributes. Additionally, we can express graph operationsas nested queries, allowing the query optimizer to employ pipelin-ing between the inner and outer query when possible. This is incontrast to Giraph, which blocks the execution and materializes allintermediate output before running the vertex compute function.
Thus, pipelining allows Vertica to avoid materializing large inter-mediate outputs, which are typical in graph queries. This reducesmemory footprint and improves performance.
3.3.4 Intra-query ParallelismVertica includes capabilities that allow it employ multiple cores
to process a single query. To allow Vertica to explore graphs inparallel as much as possible, we rewrite graph exploration queriesthat involve a self-join on the edges table by adding a GROUP BYclause on the edge id, and let Vertica partition the groups acrossCPU cores to process subgraphs in parallel. Though such parallelgraph exploration ends up doing more work in each iteration, it stillreduces the number of joins and results in much better performance.
3.3.5 Example SSSP Query Execution on Vertica
Hash-based shufflingNo sorting, as opposed to Hadoop Intermediate data is not persisted
1 2 3Giraph logicalquery plan
vertexCompute UDF as Table UDF
Replacing join with union
VM
V’ U M’vertexCompute
γV
V.id=E.fromV.id=M.to
EV
M
V’ U M’
γV.pid
V.id=E.fromV.id=M.to
E
sort
vertexCompute
V M
V’ U M’
γV.pid
E
sort
vertexCompute
U
V E
VE
γV.pid
sort
U
V’
M’
Vertex Compute
V’ U M’
V’
SynchronizationUpdates
Table UDF
Table UDFTable UDF
V M
V’ U M’
γV.pid
E
sort
vertexCompute
U
Table UDF
1 Disk-based Iterations 2 In-Memory Iterations
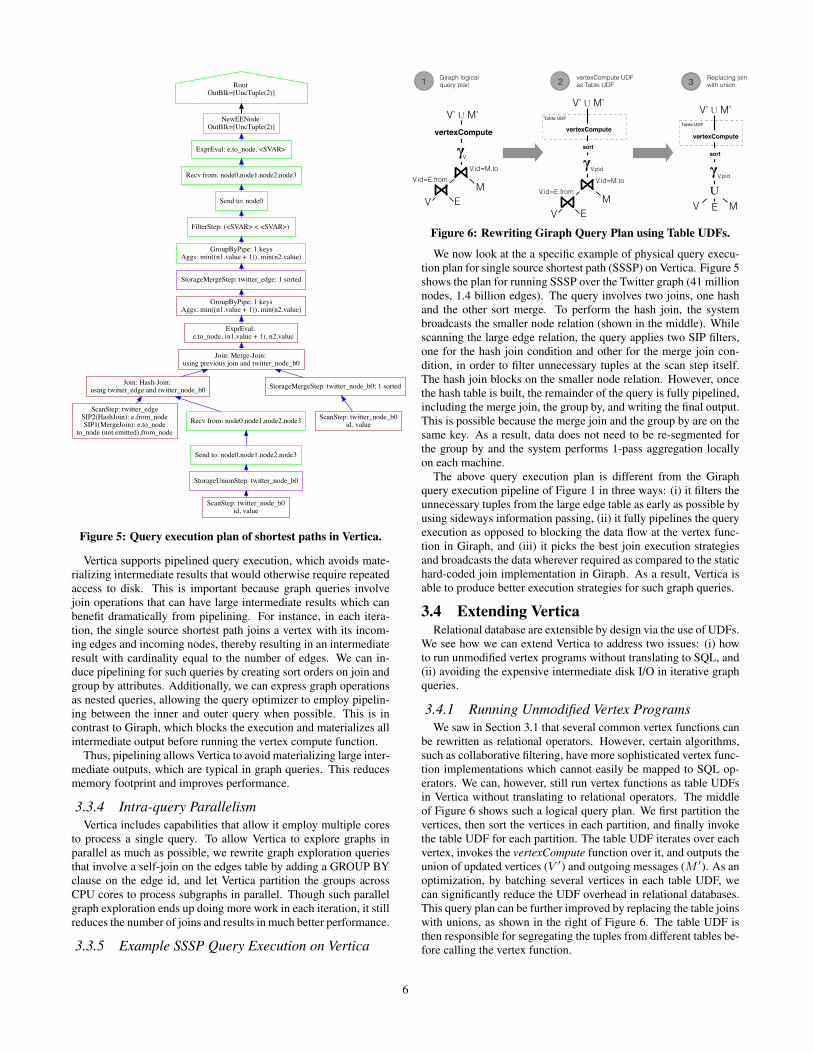
Figure 6: Rewriting Giraph Query Plan using Table UDFs.
We now look at the a specific example of physical query execu-tion plan for single source shortest path (SSSP) on Vertica. Figure 5shows the plan for running SSSP over the Twitter graph (41 millionnodes, 1.4 billion edges). The query involves two joins, one hashand the other sort merge. To perform the hash join, the systembroadcasts the smaller node relation (shown in the middle). Whilescanning the large edge relation, the query applies two SIP filters,one for the hash join condition and other for the merge join con-dition, in order to filter unnecessary tuples at the scan step itself.The hash join blocks on the smaller node relation. However, oncethe hash table is built, the remainder of the query is fully pipelined,including the merge join, the group by, and writing the final output.This is possible because the merge join and the group by are on thesame key. As a result, data does not need to be re-segmented forthe group by and the system performs 1-pass aggregation locallyon each machine.
The above query execution plan is different from the Giraphquery execution pipeline of Figure 1 in three ways: (i) it filters theunnecessary tuples from the large edge table as early as possible byusing sideways information passing, (ii) it fully pipelines the queryexecution as opposed to blocking the data flow at the vertex func-tion in Giraph, and (iii) it picks the best join execution strategiesand broadcasts the data wherever required as compared to the statichard-coded join implementation in Giraph. As a result, Vertica isable to produce better execution strategies for such graph queries.
3.4 Extending VerticaRelational database are extensible by design via the use of UDFs.
We see how we can extend Vertica to address two issues: (i) howto run unmodified vertex programs without translating to SQL, and(ii) avoiding the expensive intermediate disk I/O in iterative graphqueries.
3.4.1 Running Unmodified Vertex ProgramsWe saw in Section 3.1 that several common vertex functions can
be rewritten as relational operators. However, certain algorithms,such as collaborative filtering, have more sophisticated vertex func-tion implementations which cannot easily be mapped to SQL op-erators. We can, however, still run vertex functions as table UDFsin Vertica without translating to relational operators. The middleof Figure 6 shows such a logical query plan. We first partition thevertices, then sort the vertices in each partition, and finally invokethe table UDF for each partition. The table UDF iterates over eachvertex, invokes the vertexCompute function over it, and outputs theunion of updated vertices (V ′) and outgoing messages (M ′). As anoptimization, by batching several vertices in each table UDF, wecan significantly reduce the UDF overhead in relational databases.This query plan can be further improved by replacing the table joinswith unions, as shown in the right of Figure 6. The table UDF isthen responsible for segregating the tuples from different tables be-fore calling the vertex function.
6

Hash-based shuffling No sorting, as opposed to Hadoop Intermediate data is not persisted
1 2 3Giraph logicalquery plan
vertexCompute UDF as Table UDF
Replacing join with union
VM
V’ U M’vertexCompute
γV
V.id=E.fromV.id=M.to
EV
M
V’ U M’
γV.pid
V.id=E.fromV.id=M.to
E
sort
vertexCompute
V M
V’ U M’
γV.pid
E
sort
vertexCompute
U
V E
VE
γV.pid
sort
U
V’
M’
Vertex Compute
V’ U M’
V’
SynchronizationUpdates
Table UDF
Table UDFTable UDF
V M
V’ U M’
γV.pid
E
sort
vertexCompute
U
Table UDF
1 Disk-based Iterations 2 In-Memory Iterations
Figure 7: In-memory Vertex-centric Query Execution in Ver-tica.3.4.2 Avoiding Intermediate Disk I/Os
Iterative queries generate a significant amount of intermediatedata in each iteration. Since relational databases run iterative queriesvia an external driver program, the output of each iteration is spilledto disk, thereby resulting in substantial additional I/O. This I/O isalso happens when running vertex functions as table UDFs. How-ever, we can implement a special table UDF in which the UDF in-stances load the entire graph at the beginning and store the graph inshared memory, without writing the output of each iteration to disk(emulating the Giraph-like map-only behavior using table UDFsin Vertica). The right side of Figure 6 shows such a query plan.Of course this approach has less I/O at the cost of a higher mem-ory footprint. And since the entire graph analysis runs as a singletransaction, many of the database overheads such as locking, log-ging, and buffer lookups are further reduced. However, the UDF isnow responsible for materializing and updating V 1 E, as well aspropagating the messages from one iteration to the other (the syn-chronization barrier). Still, once implemented2, the shared memoryextension allows users to run unmodified vertex programs (or thosewhich are difficult to translate to SQL). In some cases it can alsoyield a significant speed-up (up to 2.6 times) over even native SQLvariants (as shown in our experiments).
4. EXPERIMENTSIn this section, we describe the experiments we performed to an-
alyze and benchmark the performance of Vertica (version 6.1.2) ongraph analytics, and to compare it to dedicated graph-processingsystems (Giraph and GraphLab). We organize our experiments asfollows. First, we look at the performance of several typical graphqueries over large billion-edge graphs. Second, we dig deeper andlook at the memory footprint and disk I/Os incurred and analyzethe differences. Third, we evaluate our in-memory table UDF im-plementation of vertex-centric programs over different graph anal-yses. Fourth, we study end-to-end graph processing, comprising ofgraph algorithms combined with relational operators to sub-selectportions of the graph prior to running analytics, project out graphstructure from graph meta-data, and perform aggregations and joinsafter the graph analysis completes. Finally, we look at more com-plex graph analytics beyond vertex-centric analysis, namely 1-hopanalysis, and evaluate the utility of Vertica on these operations.Hardware. Our test bed consists of a cluster of 4 machines, eachhaving 12 (6x2) 2GHz Xeon cores, running 24-threads with hyper-threading, 48GB of memory, 1.4T disk, running on RHEL Santiago2Our current implementation runs on multiple cores on a singlenode. Future work will look at distributing it across several nodes.
Type Name Nodes Edges
Directed
Twitter-small 81,306 1,768,149GPlus 107,614 13,673,453LiveJournal 4,847,571 68,993,773Twitter 41,652,230 1,468,365,182
Undirected YouTube 1,134,890 2,987,624LiveJournal-undir 3,997,962 34,681,189
Table 1: The datasets used in the evaluation.
Metric Dataset Vertica GraphLab Giraph
Upload Time (sec) LiveJournal 45.927 15.621 12.049Twitter 916.421 472.358 267.799
Disk Usage (GB) LiveJournal 0.423 3.030 3.030Twitter 9.964 73.140 73.140
Table 2: Data preparation over two datasets.
6.4. We ran all experiments with cold cache and report the averageof three runs.Baselines. We compare Vertica with two popular vertex-centricgraph processing engines, Giraph (version 1.0.0 running on Hadoop1.0.4 with 4 workers per-node) and GraphLab (version 2.2 runningon 4 nodes via MPI and using all available threads).Datasets. We ran our benchmarks on a variety of datasets of vary-ing sizes, including both directed as well as undirected graphs.Table 1 shows the different datasets used in our evaluation. Alldatasets are publicly available at http://snap.stanford.edu/data.Data Preparation. The queries in our experiments must be readdata from an underlying data store before running the analysis.While Vertica reads data from its internal data store, Giraph andGraphLab read the data from HDFS. All datasets are stored as alist of nodes and a list of edges. For GraphLab, we further split thedata files into 4 parts, such that each node can load (ingress=grid)the graph in parallel during analysis. Table 2 summarizes the datapreparation costs for the three systems. We can see that Giraph andGraphLab simply copy the raw files to HDFS and load faster thanVertica. However, Vertica has significantly less disk usage, due tocompression and encoding, compared to Giraph and GraphLab.
4.1 Typical Vertex-centric AnalysisWe first look at the performance of three typical graph queries,
namely PageRank, SSSP, and connected components, on Verticaand compare it with Giraph and GraphLab. Then, we break thetotal query time into the time to load/store from disk and the actualgraph analysis time. We used the built-in PageRank, SSSP, andconnected component algorithms for Giraph (provided as examplealgorithms) and GraphLab (provided in the graph analytics toolkit).For Vertica, we implemented these three algorithms as describedbelow:PageRank. We implemented PageRank query shown in Figure 4 asa combination of two SQL statements on the Vertex (V) and Edge(E) tables: (i) to compute the outbound PageRank contributed byevery vertex:CREATE TABLE V_outbound ASSELECT id, value/Count(to_id) AS new_valueFROM E,VWHERE E.from_id=V.idGROUP BY id,value;
and (ii) to compute the total PageRank of a vertex as a sum of in-coming PageRanks:CREATE TABLE V_prime ASSELECT to_node AS id, 0.15/N+0.85*SUM(new_value) AS valueFROM E,V_outboundWHERE E.from_id=V_outbound.idGROUP BY to_id;
After each iteration, we replace the old vertex table V with V prime,i.e. drop V and rename V prime to V.
7

Connected Component
LiveJournal Twitter
GraphLab 42.209 462.632
Giraph 82.0425 437.904
Vertica 62.039497 377.965
LineRank (per iteration)
LiveJournal Twitter
Giraph
Vertica 60.6500052 1453.418775
Tim
e (s
econ
ds)
0
125
250
375
500
LiveJournal Twitter
378.0
62.0
437.9
82.0
462.6
42.2
GraphLabGiraphVertica
Tim
e (s
econ
ds)
0
200
400
600
800
Untitled 1 Untitled 2
GiraphVertica
PageRank (3 iterations)
LiveJournal Twitter
Giraph 91.30166666666667
553.67333333333333
Vertica 18.69866666666667
193.0605
Tim
e (s
econ
ds)
0
150
300
450
600
Untitled 1 Untitled 2
193.1
18.7
553.7
91.3
GiraphVertica
Shortest Path-1
LiveJournal Twitter
GraphLab 30.253 392.107
Giraph 66.560 303.889
Vertica 39.732901 279.364689
Tim
e (s
econ
ds)
0
125
250
375
500
LiveJournal Twitter
279.4
39.7
303.9
66.6
392.1
30.3
GraphLabGiraphVertica
Shortest Path (per superstep for Twitter)
Input 1 2 3 4 5 6 7 8 9 10 11 12 13 14 15 16 17 Output
Giraph 148.0483.330 1.137 1.384 7.305 43.35715.7869.146 2.495 1.416 1.235 5.351 1.723 1.367 1.173 1.126 3.039 1.088 13.744Vertica 0 13.00768927.2334098.93665320.16783720.92998243.52610131.52689318.73158415.78384515.0841597.7416410.3548839.0573978.58478810.31774810.0449955.995795
Tim
e (s
econ
ds)
0
40
80
120
160
IterationsInp
ut 1 2 3 4 5 6 7 8 9 10 11 12 13 14 15 16 17Outp
ut
GiraphVertica
PageRank (total of 10 iterations)
LiveJournal Twitter
GraphLab 41.44 493.511
Giraph 126.82 1040.81
Vertica 62.23063 643.535
Tim
e (s
econ
ds)
0
300
600
900
1,200
LiveJournal Twitter
643.5
62.2
1040.8
126.8
493.5
41.4
GraphLabGiraphVertica
PageRank (per superstep for Twitter)
Input 1 2 3 4 5 6 7 8 9 10 Output
Giraph 143.52966.650103.60083.30887.06781.50185.20883.54879.21281.44585.85615.747Vertica 0 7.163878100.72478276.58791877.87374777.55075576.98139676.45138576.79525278.10283376.881002 0
Tim
e (s
econ
ds)
0
40
80
120
160
IterationsInp
ut 1 2 3 4 5 6 7 8 9 10Outp
ut
GiraphVertica
Bi-edges: 1867.98 sec
Shortest Path (per superstep for Twitter)-1
Input 1 2 3 4 5 6 7 8 9 10 11 12 13 14 15 16 17 18 19 20 21 22 23 24 25 26 27 28 29 30 31 32 33 34 35 36 37 38 39 40 41 42 43 44 45 46 47 48 49 50 51 52 53 54 55 56 57 58 59 60 61 62 63 64 65 66 67 68 69 70 71 72 73 74 75 Output
Giraph 147.58261.60862.57118.63110.8112.158 1.451 1.264 1.37 1.439 1.293 1.189 5.824 1.068 1.034 1.091 1.144 1.014 0.946 0.957 1.048 1.087 1.017 1.097 1.039 0.97 1.021 1.038 1.056 0.987 1.007 0.968 1.007 1.007 0.99 0.987 1.021 1.021 0.964 1.182 1.131 1.03 0.945 0.925 1.062 1.038 1.032 0.954 1.006 1.042 1.024 0.887 1.118 0.988 0.984 0.956 1.024 1.026 0.92 0.92 1.082 1.028 1.048 1.044 0.962 0.979 1.036 0.946 1.004 0.966 0.951 1.009 0.96 0.919 1.096 1.019 5.503Vertica 5.66030188.86565477.75300770.8516362.43566620.9996218.72108811.35781411.1949259.8650985.38888
Tim
e (s
econ
ds)
0
40
80
120
160
IterationsInp
ut 5 10 15 20 25 30 35 40 45 50 55 60 65 70 75Outp
ut
GiraphVertica
PageRank (Twitter)
Load / Store Iterations
GraphLab 374.811 118.7
Giraph 159.28 837.40
Vertica 0.00000 725.113
Tim
e (s
econ
ds)
0
350
700
1050
1400
GraphLab Giraph Vertica
Load / StoreIterations
Shortest Paths (Twitter)
Load / Store Iterations
GraphLab 366.607 25.5
Giraph 161.79 101.46
Vertica 0.00000 277.025
Connected Components (Twitter)
Load / Store Iterations
GraphLab 370.709 91.923
Giraph 153.09 233.44
Vertica 0.00000 373.094
Tim
e (s
econ
ds)
0
150
300
450
600
GraphLab Giraph Vertica
Load / StoreIterations
Tim
e (s
econ
ds)
0
150
300
450
600
GraphLab Giraph Vertica
Load / StoreIterations
(a) PageRank
Connected Component
LiveJournal Twitter
GraphLab 42.209 462.632
Giraph 82.0425 437.904
Vertica 62.039497 377.965
LineRank (per iteration)
LiveJournal Twitter
Giraph
Vertica 60.6500052 1453.418775
Tim
e (s
econ
ds)
0
125
250
375
500
LiveJournal Twitter
378.0
62.0
437.9
82.0
462.6
42.2
GraphLabGiraphVertica
Tim
e (s
econ
ds)
0
200
400
600
800
Untitled 1 Untitled 2
GiraphVertica
PageRank (3 iterations)
LiveJournal Twitter
Giraph 91.30166666666667
553.67333333333333
Vertica 18.69866666666667
193.0605
Tim
e (s
econ
ds)
0
150
300
450
600
Untitled 1 Untitled 2
193.1
18.7
553.7
91.3
GiraphVertica
Shortest Path-1
LiveJournal Twitter
GraphLab 30.253 392.107
Giraph 66.560 303.889
Vertica 39.732901 279.364689
Tim
e (s
econ
ds)
0
125
250
375
500
LiveJournal Twitter
279.4
39.7
303.9
66.6
392.1
30.3
GraphLabGiraphVertica
Shortest Path (per superstep for Twitter)
Input 1 2 3 4 5 6 7 8 9 10 11 12 13 14 15 16 17 Output
Giraph 148.0483.330 1.137 1.384 7.305 43.35715.7869.146 2.495 1.416 1.235 5.351 1.723 1.367 1.173 1.126 3.039 1.088 13.744Vertica 0 13.00768927.2334098.93665320.16783720.92998243.52610131.52689318.73158415.78384515.0841597.7416410.3548839.0573978.58478810.31774810.0449955.995795
Tim
e (s
econ
ds)
0
40
80
120
160
IterationsInp
ut 1 2 3 4 5 6 7 8 9 10 11 12 13 14 15 16 17Outp
ut
GiraphVertica
PageRank (total of 10 iterations)
LiveJournal Twitter
GraphLab 41.44 493.511
Giraph 126.82 1040.81
Vertica 62.23063 643.535
Tim
e (s
econ
ds)
0
300
600
900
1,200
LiveJournal Twitter
643.5
62.2
1040.8
126.8
493.5
41.4
GraphLabGiraphVertica
PageRank (per superstep for Twitter)
Input 1 2 3 4 5 6 7 8 9 10 Output
Giraph 143.52966.650103.60083.30887.06781.50185.20883.54879.21281.44585.85615.747Vertica 0 7.163878100.72478276.58791877.87374777.55075576.98139676.45138576.79525278.10283376.881002 0
Tim
e (s
econ
ds)
0
40
80
120
160
IterationsInp
ut 1 2 3 4 5 6 7 8 9 10Outp
ut
GiraphVertica
Bi-edges: 1867.98 sec
Shortest Path (per superstep for Twitter)-1
Input 1 2 3 4 5 6 7 8 9 10 11 12 13 14 15 16 17 18 19 20 21 22 23 24 25 26 27 28 29 30 31 32 33 34 35 36 37 38 39 40 41 42 43 44 45 46 47 48 49 50 51 52 53 54 55 56 57 58 59 60 61 62 63 64 65 66 67 68 69 70 71 72 73 74 75 Output
Giraph 147.58261.60862.57118.63110.8112.158 1.451 1.264 1.37 1.439 1.293 1.189 5.824 1.068 1.034 1.091 1.144 1.014 0.946 0.957 1.048 1.087 1.017 1.097 1.039 0.97 1.021 1.038 1.056 0.987 1.007 0.968 1.007 1.007 0.99 0.987 1.021 1.021 0.964 1.182 1.131 1.03 0.945 0.925 1.062 1.038 1.032 0.954 1.006 1.042 1.024 0.887 1.118 0.988 0.984 0.956 1.024 1.026 0.92 0.92 1.082 1.028 1.048 1.044 0.962 0.979 1.036 0.946 1.004 0.966 0.951 1.009 0.96 0.919 1.096 1.019 5.503Vertica 5.66030188.86565477.75300770.8516362.43566620.9996218.72108811.35781411.1949259.8650985.38888
Tim
e (s
econ
ds)
0
40
80
120
160
IterationsInp
ut 5 10 15 20 25 30 35 40 45 50 55 60 65 70 75Outp
ut
GiraphVertica
PageRank (Twitter)
Load / Store Iterations
GraphLab 374.811 118.7
Giraph 159.28 837.40
Vertica 0.00000 725.113
Tim
e (s
econ
ds)
0
350
700
1050
1400
GraphLab Giraph Vertica
Load / StoreIterations
Shortest Paths (Twitter)
Load / Store Iterations
GraphLab 366.607 25.5
Giraph 161.79 101.46
Vertica 0.00000 277.025
Connected Components (Twitter)
Load / Store Iterations
GraphLab 370.709 91.923
Giraph 153.09 233.44
Vertica 0.00000 373.094
Tim
e (s
econ
ds)
0
150
300
450
600
GraphLab Giraph Vertica
Load / StoreIterations
Tim
e (s
econ
ds)
0
150
300
450
600
GraphLab Giraph Vertica
Load / StoreIterations
(b) Shortest Path
Connected Component
LiveJournal Twitter
GraphLab 42.209 462.632
Giraph 82.0425 437.904
Vertica 62.039497 377.965
LineRank (per iteration)
LiveJournal Twitter
Giraph
Vertica 60.6500052 1453.418775
Tim
e (s
econ
ds)
0
125
250
375
500
LiveJournal Twitter
378.0
62.0
437.9
82.0
462.6
42.2
GraphLabGiraphVertica
Tim
e (s
econ
ds)
0
200
400
600
800
Untitled 1 Untitled 2
GiraphVertica
PageRank (3 iterations)
LiveJournal Twitter
Giraph 91.30166666666667
553.67333333333333
Vertica 18.69866666666667
193.0605
Tim
e (s
econ
ds)
0
150
300
450
600
Untitled 1 Untitled 2
193.1
18.7
553.7
91.3
GiraphVertica
Shortest Path-1
LiveJournal Twitter
GraphLab 30.253 392.107
Giraph 66.560 303.889
Vertica 39.732901 279.364689
Tim
e (s
econ
ds)
0
125
250
375
500
LiveJournal Twitter
279.4
39.7
303.9
66.6
392.1
30.3
GraphLabGiraphVertica
Shortest Path (per superstep for Twitter)
Input 1 2 3 4 5 6 7 8 9 10 11 12 13 14 15 16 17 Output
Giraph 148.0483.330 1.137 1.384 7.305 43.35715.7869.146 2.495 1.416 1.235 5.351 1.723 1.367 1.173 1.126 3.039 1.088 13.744Vertica 0 13.00768927.2334098.93665320.16783720.92998243.52610131.52689318.73158415.78384515.0841597.7416410.3548839.0573978.58478810.31774810.0449955.995795
Tim
e (s
econ
ds)
0
40
80
120
160
IterationsInp
ut 1 2 3 4 5 6 7 8 9 10 11 12 13 14 15 16 17Outp
ut
GiraphVertica
PageRank (total of 10 iterations)
LiveJournal Twitter
GraphLab 41.44 493.511
Giraph 126.82 1040.81
Vertica 62.23063 643.535
Tim
e (s
econ
ds)
0
300
600
900
1,200
LiveJournal Twitter
643.5
62.2
1040.8
126.8
493.5
41.4
GraphLabGiraphVertica
PageRank (per superstep for Twitter)
Input 1 2 3 4 5 6 7 8 9 10 Output
Giraph 143.52966.650103.60083.30887.06781.50185.20883.54879.21281.44585.85615.747Vertica 0 7.163878100.72478276.58791877.87374777.55075576.98139676.45138576.79525278.10283376.881002 0
Tim
e (s
econ
ds)
0
40
80
120
160
IterationsInp
ut 1 2 3 4 5 6 7 8 9 10Outp
ut
GiraphVertica
Bi-edges: 1867.98 sec
Shortest Path (per superstep for Twitter)-1
Input 1 2 3 4 5 6 7 8 9 10 11 12 13 14 15 16 17 18 19 20 21 22 23 24 25 26 27 28 29 30 31 32 33 34 35 36 37 38 39 40 41 42 43 44 45 46 47 48 49 50 51 52 53 54 55 56 57 58 59 60 61 62 63 64 65 66 67 68 69 70 71 72 73 74 75 Output
Giraph 147.58261.60862.57118.63110.8112.158 1.451 1.264 1.37 1.439 1.293 1.189 5.824 1.068 1.034 1.091 1.144 1.014 0.946 0.957 1.048 1.087 1.017 1.097 1.039 0.97 1.021 1.038 1.056 0.987 1.007 0.968 1.007 1.007 0.99 0.987 1.021 1.021 0.964 1.182 1.131 1.03 0.945 0.925 1.062 1.038 1.032 0.954 1.006 1.042 1.024 0.887 1.118 0.988 0.984 0.956 1.024 1.026 0.92 0.92 1.082 1.028 1.048 1.044 0.962 0.979 1.036 0.946 1.004 0.966 0.951 1.009 0.96 0.919 1.096 1.019 5.503Vertica 5.66030188.86565477.75300770.8516362.43566620.9996218.72108811.35781411.1949259.8650985.38888
Tim
e (s
econ
ds)
0
40
80
120
160
IterationsInp
ut 5 10 15 20 25 30 35 40 45 50 55 60 65 70 75Outp
ut
GiraphVertica
PageRank (Twitter)
Load / Store Iterations
GraphLab 374.811 118.7
Giraph 159.28 837.40
Vertica 0.00000 725.113
Tim
e (s
econ
ds)
0
350
700
1050
1400
GraphLab Giraph Vertica
Load / StoreIterations
Shortest Paths (Twitter)
Load / Store Iterations
GraphLab 366.607 25.5
Giraph 161.79 101.46
Vertica 0.00000 277.025
Connected Components (Twitter)
Load / Store Iterations
GraphLab 370.709 91.923
Giraph 153.09 233.44
Vertica 0.00000 373.094
Tim
e (s
econ
ds)
0
150
300
450
600
GraphLab Giraph Vertica
Load / StoreIterations
Tim
e (s
econ
ds)
0
150
300
450
600
GraphLab Giraph Vertica
Load / StoreIterations
(c) Connected Components
Figure 8: Typical vertex-centric Analysis Using Vertica.
Connected Component
LiveJournal Twitter
GraphLab 42.209 462.632
Giraph 82.0425 437.904
Vertica 62.039497 377.965
LineRank (per iteration)
LiveJournal Twitter
Giraph
Vertica 60.6500052 1453.418775
Tim
e (s
econ
ds)
0
125
250
375
500
LiveJournal Twitter
378.0
62.0
437.9
82.0
462.6
42.2
GraphLabGiraphVertica
Tim
e (s
econ
ds)
0
200
400
600
800
Untitled 1 Untitled 2
GiraphVertica
PageRank (3 iterations)
LiveJournal Twitter
Giraph 91.30166666666667
553.67333333333333
Vertica 18.69866666666667
193.0605
Tim
e (s
econ
ds)
0
150
300
450
600
Untitled 1 Untitled 2
193.1
18.7
553.7
91.3
GiraphVertica
Shortest Path-1
LiveJournal Twitter
GraphLab 30.253 392.107
Giraph 66.560 303.889
Vertica 39.732901 279.364689
Tim
e (s
econ
ds)
0
125
250
375
500
LiveJournal Twitter
279.4
39.7
303.9
66.6
392.1
30.3
GraphLabGiraphVertica
Shortest Path (per superstep for Twitter)
Input 1 2 3 4 5 6 7 8 9 10 11 12 13 14 15 16 17 Output
Giraph 148.0483.330 1.137 1.384 7.305 43.35715.7869.146 2.495 1.416 1.235 5.351 1.723 1.367 1.173 1.126 3.039 1.088 13.744Vertica 0 13.00768927.2334098.93665320.16783720.92998243.52610131.52689318.73158415.78384515.0841597.7416410.3548839.0573978.58478810.31774810.0449955.995795
Tim
e (s
econ
ds)
0
40
80
120
160
Input 1 2 3 4 5 6 7 8 9 10 11 12 13 14 15 16 17
Output
GiraphVertica
PageRank (total of 10 iterations)
LiveJournal Twitter
GraphLab 41.44 493.511
Giraph 126.82 1040.81
Vertica 62.23063 643.535
Tim
e (s
econ
ds)
0
300
600
900
1,200
LiveJournal Twitter
643.5
62.2
1040.8
126.8
493.5
41.4
GraphLabGiraphVertica
PageRank (per superstep for Twitter)
Input 1 2 3 4 5 6 7 8 9 10 Output
Giraph 143.52966.650103.60083.30887.06781.50185.20883.54879.21281.44585.85615.747Vertica 0 7.163878100.72478276.58791877.87374777.55075576.98139676.45138576.79525278.10283376.881002 0
Tim
e (s
econ
ds)
0
40
80
120
160
Input 1 2 3 4 5 6 7 8 9 10
Output
GiraphVertica
Bi-edges: 1867.98 sec
Shortest Path (per superstep for Twitter)-1
Input 1 2 3 4 5 6 7 8 9 10 11 12 13 14 15 16 17 18 19 20 21 22 23 24 25 26 27 28 29 30 31 32 33 34 35 36 37 38 39 40 41 42 43 44 45 46 47 48 49 50 51 52 53 54 55 56 57 58 59 60 61 62 63 64 65 66 67 68 69 70 71 72 73 74 75 Output
Giraph 147.58261.60862.57118.63110.8112.158 1.451 1.264 1.37 1.439 1.293 1.189 5.824 1.068 1.034 1.091 1.144 1.014 0.946 0.957 1.048 1.087 1.017 1.097 1.039 0.97 1.021 1.038 1.056 0.987 1.007 0.968 1.007 1.007 0.99 0.987 1.021 1.021 0.964 1.182 1.131 1.03 0.945 0.925 1.062 1.038 1.032 0.954 1.006 1.042 1.024 0.887 1.118 0.988 0.984 0.956 1.024 1.026 0.92 0.92 1.082 1.028 1.048 1.044 0.962 0.979 1.036 0.946 1.004 0.966 0.951 1.009 0.96 0.919 1.096 1.019 5.503Vertica 5.66030188.86565477.75300770.8516362.43566620.9996218.72108811.35781411.1949259.8650985.38888
Tim
e (s
econ
ds)
0
40
80
120
160
Input 5 10 15 20 25 30 35 40 45 50 55 60 65 70 75
Output
GiraphVertica
PageRank (Twitter)
Load / Store Iterations
GraphLab 374.811 118.7
Giraph 159.28 837.40
Vertica 0.00000 725.113
Tim
e (s
econ
ds)
0
350
700
1050
1400
GraphLab Giraph Vertica
Load / StoreIterations
Shortest Paths (Twitter)
Load / Store Iterations
GraphLab 366.607 25.5
Giraph 161.79 101.46
Vertica 0.00000 277.025
Connected Components (Twitter)
Load / Store Iterations
GraphLab 370.709 91.923
Giraph 153.09 233.44
Vertica 0.00000 373.094
Tim
e (s
econ
ds)
0
150
300
450
600
GraphLab Giraph Vertica
Load / StoreIterations
Tim
e (s
econ
ds)
0
150
300
450
600
GraphLab Giraph Vertica
Load / StoreIterations
(a) PageRank
Connected Component
LiveJournal Twitter
GraphLab 42.209 462.632
Giraph 82.0425 437.904
Vertica 62.039497 377.965
LineRank (per iteration)
LiveJournal Twitter
Giraph
Vertica 60.6500052 1453.418775
Tim
e (s
econ
ds)
0
125
250
375
500
LiveJournal Twitter
378.0
62.0
437.9
82.0
462.6
42.2
GraphLabGiraphVertica
Tim
e (s
econ
ds)
0
200
400
600
800
Untitled 1 Untitled 2
GiraphVertica
PageRank (3 iterations)
LiveJournal Twitter
Giraph 91.30166666666667
553.67333333333333
Vertica 18.69866666666667
193.0605
Tim
e (s
econ
ds)
0
150
300
450
600
Untitled 1 Untitled 2
193.1
18.7
553.7
91.3
GiraphVertica
Shortest Path-1
LiveJournal Twitter
GraphLab 30.253 392.107
Giraph 66.560 303.889
Vertica 39.732901 279.364689
Tim
e (s
econ
ds)
0
125
250
375
500
LiveJournal Twitter
279.4
39.7
303.9
66.6
392.1
30.3
GraphLabGiraphVertica
Shortest Path (per superstep for Twitter)
Input 1 2 3 4 5 6 7 8 9 10 11 12 13 14 15 16 17 Output
Giraph 148.0483.330 1.137 1.384 7.305 43.35715.7869.146 2.495 1.416 1.235 5.351 1.723 1.367 1.173 1.126 3.039 1.088 13.744Vertica 0 13.00768927.2334098.93665320.16783720.92998243.52610131.52689318.73158415.78384515.0841597.7416410.3548839.0573978.58478810.31774810.0449955.995795
Tim
e (s
econ
ds)
0
40
80
120
160
Input 1 2 3 4 5 6 7 8 9 10 11 12 13 14 15 16 17
Output
GiraphVertica
PageRank (total of 10 iterations)
LiveJournal Twitter
GraphLab 41.44 493.511
Giraph 126.82 1040.81
Vertica 62.23063 643.535
Tim
e (s
econ
ds)
0
300
600
900
1,200
LiveJournal Twitter
643.5
62.2
1040.8
126.8
493.5
41.4
GraphLabGiraphVertica
PageRank (per superstep for Twitter)
Input 1 2 3 4 5 6 7 8 9 10 Output
Giraph 143.52966.650103.60083.30887.06781.50185.20883.54879.21281.44585.85615.747Vertica 0 7.163878100.72478276.58791877.87374777.55075576.98139676.45138576.79525278.10283376.881002 0
Tim
e (s
econ
ds)
0
40
80
120
160
Input 1 2 3 4 5 6 7 8 9 10
Output
GiraphVertica
Bi-edges: 1867.98 sec
Shortest Path (per superstep for Twitter)-1
Input 1 2 3 4 5 6 7 8 9 10 11 12 13 14 15 16 17 18 19 20 21 22 23 24 25 26 27 28 29 30 31 32 33 34 35 36 37 38 39 40 41 42 43 44 45 46 47 48 49 50 51 52 53 54 55 56 57 58 59 60 61 62 63 64 65 66 67 68 69 70 71 72 73 74 75 Output
Giraph 147.58261.60862.57118.63110.8112.158 1.451 1.264 1.37 1.439 1.293 1.189 5.824 1.068 1.034 1.091 1.144 1.014 0.946 0.957 1.048 1.087 1.017 1.097 1.039 0.97 1.021 1.038 1.056 0.987 1.007 0.968 1.007 1.007 0.99 0.987 1.021 1.021 0.964 1.182 1.131 1.03 0.945 0.925 1.062 1.038 1.032 0.954 1.006 1.042 1.024 0.887 1.118 0.988 0.984 0.956 1.024 1.026 0.92 0.92 1.082 1.028 1.048 1.044 0.962 0.979 1.036 0.946 1.004 0.966 0.951 1.009 0.96 0.919 1.096 1.019 5.503Vertica 5.66030188.86565477.75300770.8516362.43566620.9996218.72108811.35781411.1949259.8650985.38888
Tim
e (s
econ
ds)
0
40
80
120
160
Input 5 10 15 20 25 30 35 40 45 50 55 60 65 70 75
Output
GiraphVertica
PageRank (Twitter)
Load / Store Iterations
GraphLab 374.811 118.7
Giraph 159.28 837.40
Vertica 0.00000 725.113
Tim
e (s
econ
ds)
0
350
700
1050
1400
GraphLab Giraph Vertica
Load / StoreIterations
Shortest Paths (Twitter)
Load / Store Iterations
GraphLab 366.607 25.5
Giraph 161.79 101.46
Vertica 0.00000 277.025
Connected Components (Twitter)
Load / Store Iterations
GraphLab 370.709 91.923
Giraph 153.09 233.44
Vertica 0.00000 373.094
Tim
e (s
econ
ds)
0
150
300
450
600
GraphLab Giraph Vertica
Load / StoreIterations
Tim
e (s
econ
ds)
0
150
300
450
600
GraphLab Giraph Vertica
Load / StoreIterations
(b) Shortest Path
Connected Component
LiveJournal Twitter
GraphLab 42.209 462.632
Giraph 82.0425 437.904
Vertica 62.039497 377.965
LineRank (per iteration)
LiveJournal Twitter
Giraph
Vertica 60.6500052 1453.418775
Tim
e (s
econ
ds)
0
125
250
375
500
LiveJournal Twitter
378.0
62.0
437.9
82.0
462.6
42.2
GraphLabGiraphVertica
Tim
e (s
econ
ds)
0
200
400
600
800
Untitled 1 Untitled 2
GiraphVertica
PageRank (3 iterations)
LiveJournal Twitter
Giraph 91.30166666666667
553.67333333333333
Vertica 18.69866666666667
193.0605
Tim
e (s
econ
ds)
0
150
300
450
600
Untitled 1 Untitled 2
193.1
18.7
553.7
91.3
GiraphVertica
Shortest Path-1
LiveJournal Twitter
GraphLab 30.253 392.107
Giraph 66.560 303.889
Vertica 39.732901 279.364689
Tim
e (s
econ
ds)
0
125
250
375
500
LiveJournal Twitter
279.4
39.7
303.9
66.6
392.1
30.3
GraphLabGiraphVertica
Shortest Path (per superstep for Twitter)
Input 1 2 3 4 5 6 7 8 9 10 11 12 13 14 15 16 17 Output
Giraph 148.0483.330 1.137 1.384 7.305 43.35715.7869.146 2.495 1.416 1.235 5.351 1.723 1.367 1.173 1.126 3.039 1.088 13.744Vertica 0 13.00768927.2334098.93665320.16783720.92998243.52610131.52689318.73158415.78384515.0841597.7416410.3548839.0573978.58478810.31774810.0449955.995795
Tim
e (s
econ
ds)
0
40
80
120
160
Input 1 2 3 4 5 6 7 8 9 10 11 12 13 14 15 16 17
Output
GiraphVertica
PageRank (total of 10 iterations)
LiveJournal Twitter
GraphLab 41.44 493.511
Giraph 126.82 1040.81
Vertica 62.23063 643.535
Tim
e (s
econ
ds)
0
300
600
900
1,200
LiveJournal Twitter
643.5
62.2
1040.8
126.8
493.5
41.4
GraphLabGiraphVertica
PageRank (per superstep for Twitter)
Input 1 2 3 4 5 6 7 8 9 10 Output
Giraph 143.52966.650103.60083.30887.06781.50185.20883.54879.21281.44585.85615.747Vertica 0 7.163878100.72478276.58791877.87374777.55075576.98139676.45138576.79525278.10283376.881002 0
Tim
e (s
econ
ds)
0
40
80
120
160
Input 1 2 3 4 5 6 7 8 9 10
Output
GiraphVertica
Bi-edges: 1867.98 sec
Shortest Path (per superstep for Twitter)-1
Input 1 2 3 4 5 6 7 8 9 10 11 12 13 14 15 16 17 18 19 20 21 22 23 24 25 26 27 28 29 30 31 32 33 34 35 36 37 38 39 40 41 42 43 44 45 46 47 48 49 50 51 52 53 54 55 56 57 58 59 60 61 62 63 64 65 66 67 68 69 70 71 72 73 74 75 Output
Giraph 147.58261.60862.57118.63110.8112.158 1.451 1.264 1.37 1.439 1.293 1.189 5.824 1.068 1.034 1.091 1.144 1.014 0.946 0.957 1.048 1.087 1.017 1.097 1.039 0.97 1.021 1.038 1.056 0.987 1.007 0.968 1.007 1.007 0.99 0.987 1.021 1.021 0.964 1.182 1.131 1.03 0.945 0.925 1.062 1.038 1.032 0.954 1.006 1.042 1.024 0.887 1.118 0.988 0.984 0.956 1.024 1.026 0.92 0.92 1.082 1.028 1.048 1.044 0.962 0.979 1.036 0.946 1.004 0.966 0.951 1.009 0.96 0.919 1.096 1.019 5.503Vertica 5.66030188.86565477.75300770.8516362.43566620.9996218.72108811.35781411.1949259.8650985.38888
Tim
e (s
econ
ds)
0
40
80
120
160
Input 5 10 15 20 25 30 35 40 45 50 55 60 65 70 75
Output
GiraphVertica
PageRank (Twitter)
Load / Store Iterations
GraphLab 374.811 118.7
Giraph 159.28 837.40
Vertica 0.00000 725.113
Tim
e (s
econ
ds)
0
350
700
1050
1400
GraphLab Giraph Vertica
Load / StoreIterations
Shortest Paths (Twitter)
Load / Store Iterations
GraphLab 366.607 25.5
Giraph 161.79 101.46
Vertica 0.00000 277.025
Connected Components (Twitter)
Load / Store Iterations
GraphLab 370.709 91.923
Giraph 153.09 233.44
Vertica 0.00000 373.094
Tim
e (s
econ
ds)
0
150
300
450
600
GraphLab Giraph Vertica
Load / StoreIterations
Tim
e (s
econ
ds)
0
150
300
450
600
GraphLab Giraph Vertica
Load / StoreIterations
(c) Connected Components
Figure 9: Per-iteration runtime of typical vertex-centric Analysis on Twitter graph.
Connected Component
LiveJournal Twitter
GraphLab 42.209 462.632
Giraph 82.0425 437.904
Vertica 62.039497 377.965
LineRank (per iteration)
LiveJournal Twitter
Giraph
Vertica 60.6500052 1453.418775
Tim
e (s
econ
ds)
0
125
250
375
500
LiveJournal Twitter
378.0
62.0
437.9
82.0
462.6
42.2
GraphLabGiraphVertica
Tim
e (s
econ
ds)
0
200
400
600
800
Untitled 1 Untitled 2
GiraphVertica
PageRank (3 iterations)
LiveJournal Twitter
Giraph 91.30166666666667
553.67333333333333
Vertica 18.69866666666667
193.0605
Tim
e (s
econ
ds)
0
150
300
450
600
Untitled 1 Untitled 2
193.1
18.7
553.7
91.3
GiraphVertica
Shortest Path-1
LiveJournal Twitter
GraphLab 30.253 392.107
Giraph 66.560 303.889
Vertica 39.732901 279.364689
Tim
e (s
econ
ds)
0
125
250
375
500
LiveJournal Twitter
279.4
39.7
303.9
66.6
392.1
30.3
GraphLabGiraphVertica
Shortest Path (per superstep for Twitter)
Input 1 2 3 4 5 6 7 8 9 10 11 12 13 14 15 16 17 Output
Giraph 148.0483.330 1.137 1.384 7.305 43.35715.7869.146 2.495 1.416 1.235 5.351 1.723 1.367 1.173 1.126 3.039 1.088 13.744Vertica 0 13.00768927.2334098.93665320.16783720.92998243.52610131.52689318.73158415.78384515.0841597.7416410.3548839.0573978.58478810.31774810.0449955.995795
Tim
e (s
econ
ds)
0
40
80
120
160
Input 1 2 3 4 5 6 7 8 9 10 11 12 13 14 15 16 17
Output
GiraphVertica
PageRank (total of 10 iterations)
LiveJournal Twitter
GraphLab 41.44 493.511
Giraph 126.82 1040.81
Vertica 62.23063 643.535
Tim
e (s
econ
ds)
0
300
600
900
1,200
LiveJournal Twitter
643.5
62.2
1040.8
126.8
493.5
41.4
GraphLabGiraphVertica
PageRank (per superstep for Twitter)
Input 1 2 3 4 5 6 7 8 9 10 Output
Giraph 143.52966.650103.60083.30887.06781.50185.20883.54879.21281.44585.85615.747Vertica 0 7.163878100.72478276.58791877.87374777.55075576.98139676.45138576.79525278.10283376.881002 0
Tim
e (s
econ
ds)
0
40
80
120
160
Input 1 2 3 4 5 6 7 8 9 10
Output
GiraphVertica
Bi-edges: 1867.98 sec
Shortest Path (per superstep for Twitter)-1
Input 1 2 3 4 5 6 7 8 9 10 11 12 13 14 15 16 17 18 19 20 21 22 23 24 25 26 27 28 29 30 31 32 33 34 35 36 37 38 39 40 41 42 43 44 45 46 47 48 49 50 51 52 53 54 55 56 57 58 59 60 61 62 63 64 65 66 67 68 69 70 71 72 73 74 75 Output
Giraph 147.58261.60862.57118.63110.8112.158 1.451 1.264 1.37 1.439 1.293 1.189 5.824 1.068 1.034 1.091 1.144 1.014 0.946 0.957 1.048 1.087 1.017 1.097 1.039 0.97 1.021 1.038 1.056 0.987 1.007 0.968 1.007 1.007 0.99 0.987 1.021 1.021 0.964 1.182 1.131 1.03 0.945 0.925 1.062 1.038 1.032 0.954 1.006 1.042 1.024 0.887 1.118 0.988 0.984 0.956 1.024 1.026 0.92 0.92 1.082 1.028 1.048 1.044 0.962 0.979 1.036 0.946 1.004 0.966 0.951 1.009 0.96 0.919 1.096 1.019 5.503Vertica 5.66030188.86565477.75300770.8516362.43566620.9996218.72108811.35781411.1949259.8650985.38888
Tim
e (s
econ
ds)
0
40
80
120
160
Input 5 10 15 20 25 30 35 40 45 50 55 60 65 70 75
Output
GiraphVertica
PageRank (Twitter)
Load / Store Iterations
GraphLab 374.811 118.7
Giraph 159.28 837.40
Vertica 0.00000 725.113
Tim
e (s
econ
ds)
0
350
700
1050
1400
GraphLab Giraph Vertica
Load / Store TimeAlgorithm Time
Shortest Paths (Twitter)
Load / Store Iterations
GraphLab 366.607 25.5
Giraph 161.79 101.46
Vertica 0.00000 277.025
Connected Components (Twitter)
Load / Store Iterations
GraphLab 370.709 91.923
Giraph 153.09 233.44
Vertica 0.00000 373.094
Tim
e (s
econ
ds)
0
150
300
450
600
GraphLab Giraph Vertica
Load / Store TimeAlgorithm Time
Tim
e (s
econ
ds)
0
150
300
450
600
GraphLab Giraph Vertica
Load / Store TimeAlgorithm Time
(a) PageRank
Connected Component
LiveJournal Twitter
GraphLab 42.209 462.632
Giraph 82.0425 437.904
Vertica 62.039497 377.965
LineRank (per iteration)
LiveJournal Twitter
Giraph
Vertica 60.6500052 1453.418775
Tim
e (s
econ
ds)
0
125
250
375
500
LiveJournal Twitter
378.0
62.0
437.9
82.0
462.6
42.2
GraphLabGiraphVertica
Tim
e (s
econ
ds)
0
200
400
600
800
Untitled 1 Untitled 2
GiraphVertica
PageRank (3 iterations)
LiveJournal Twitter
Giraph 91.30166666666667
553.67333333333333
Vertica 18.69866666666667
193.0605
Tim
e (s
econ
ds)
0
150
300
450
600
Untitled 1 Untitled 2
193.1
18.7
553.7
91.3
GiraphVertica
Shortest Path-1
LiveJournal Twitter
GraphLab 30.253 392.107
Giraph 66.560 303.889
Vertica 39.732901 279.364689
Tim
e (s
econ
ds)
0
125
250
375
500
LiveJournal Twitter
279.4
39.7
303.9
66.6
392.1
30.3
GraphLabGiraphVertica
Shortest Path (per superstep for Twitter)
Input 1 2 3 4 5 6 7 8 9 10 11 12 13 14 15 16 17 Output
Giraph 148.0483.330 1.137 1.384 7.305 43.35715.7869.146 2.495 1.416 1.235 5.351 1.723 1.367 1.173 1.126 3.039 1.088 13.744Vertica 0 13.00768927.2334098.93665320.16783720.92998243.52610131.52689318.73158415.78384515.0841597.7416410.3548839.0573978.58478810.31774810.0449955.995795
Tim
e (s
econ
ds)
0
40
80
120
160
Input 1 2 3 4 5 6 7 8 9 10 11 12 13 14 15 16 17
Output
GiraphVertica
PageRank (total of 10 iterations)
LiveJournal Twitter
GraphLab 41.44 493.511
Giraph 126.82 1040.81
Vertica 62.23063 643.535
Tim
e (s
econ
ds)
0
300
600
900
1,200
LiveJournal Twitter
643.5
62.2
1040.8
126.8
493.5
41.4
GraphLabGiraphVertica
PageRank (per superstep for Twitter)
Input 1 2 3 4 5 6 7 8 9 10 Output
Giraph 143.52966.650103.60083.30887.06781.50185.20883.54879.21281.44585.85615.747Vertica 0 7.163878100.72478276.58791877.87374777.55075576.98139676.45138576.79525278.10283376.881002 0
Tim
e (s
econ
ds)
0
40
80
120
160
Input 1 2 3 4 5 6 7 8 9 10
Output
GiraphVertica
Bi-edges: 1867.98 sec
Shortest Path (per superstep for Twitter)-1
Input 1 2 3 4 5 6 7 8 9 10 11 12 13 14 15 16 17 18 19 20 21 22 23 24 25 26 27 28 29 30 31 32 33 34 35 36 37 38 39 40 41 42 43 44 45 46 47 48 49 50 51 52 53 54 55 56 57 58 59 60 61 62 63 64 65 66 67 68 69 70 71 72 73 74 75 Output
Giraph 147.58261.60862.57118.63110.8112.158 1.451 1.264 1.37 1.439 1.293 1.189 5.824 1.068 1.034 1.091 1.144 1.014 0.946 0.957 1.048 1.087 1.017 1.097 1.039 0.97 1.021 1.038 1.056 0.987 1.007 0.968 1.007 1.007 0.99 0.987 1.021 1.021 0.964 1.182 1.131 1.03 0.945 0.925 1.062 1.038 1.032 0.954 1.006 1.042 1.024 0.887 1.118 0.988 0.984 0.956 1.024 1.026 0.92 0.92 1.082 1.028 1.048 1.044 0.962 0.979 1.036 0.946 1.004 0.966 0.951 1.009 0.96 0.919 1.096 1.019 5.503Vertica 5.66030188.86565477.75300770.8516362.43566620.9996218.72108811.35781411.1949259.8650985.38888
Tim
e (s
econ
ds)
0
40
80
120
160
Input 5 10 15 20 25 30 35 40 45 50 55 60 65 70 75
Output
GiraphVertica
PageRank (Twitter)
Load / Store Iterations
GraphLab 374.811 118.7
Giraph 159.28 837.40
Vertica 0.00000 725.113
Tim
e (s
econ
ds)
0
350
700
1050
1400
GraphLab Giraph Vertica
Load / Store TimeAlgorithm Time
Shortest Paths (Twitter)
Load / Store Iterations
GraphLab 366.607 25.5
Giraph 161.79 101.46
Vertica 0.00000 277.025
Connected Components (Twitter)
Load / Store Iterations
GraphLab 370.709 91.923
Giraph 153.09 233.44
Vertica 0.00000 373.094
Tim
e (s
econ
ds)
0
150
300
450
600
GraphLab Giraph Vertica
Load / Store TimeAlgorithm Time
Tim
e (s
econ
ds)
0
150
300
450
600
GraphLab Giraph Vertica
Load / Store TimeAlgorithm Time
(b) Shortest Path
Connected Component
LiveJournal Twitter
GraphLab 42.209 462.632
Giraph 82.0425 437.904
Vertica 62.039497 377.965
LineRank (per iteration)
LiveJournal Twitter
Giraph
Vertica 60.6500052 1453.418775
Tim
e (s
econ
ds)
0
125
250
375
500
LiveJournal Twitter
378.0
62.0
437.9
82.0
462.6
42.2
GraphLabGiraphVertica
Tim
e (s
econ
ds)
0
200
400
600
800
Untitled 1 Untitled 2
GiraphVertica
PageRank (3 iterations)
LiveJournal Twitter
Giraph 91.30166666666667
553.67333333333333
Vertica 18.69866666666667
193.0605
Tim
e (s
econ
ds)
0
150
300
450
600
Untitled 1 Untitled 2
193.1
18.7
553.7
91.3
GiraphVertica
Shortest Path-1
LiveJournal Twitter
GraphLab 30.253 392.107
Giraph 66.560 303.889
Vertica 39.732901 279.364689
Tim
e (s
econ
ds)
0
125
250
375
500
LiveJournal Twitter
279.4
39.7
303.9
66.6
392.1
30.3
GraphLabGiraphVertica
Shortest Path (per superstep for Twitter)
Input 1 2 3 4 5 6 7 8 9 10 11 12 13 14 15 16 17 Output
Giraph 148.0483.330 1.137 1.384 7.305 43.35715.7869.146 2.495 1.416 1.235 5.351 1.723 1.367 1.173 1.126 3.039 1.088 13.744Vertica 0 13.00768927.2334098.93665320.16783720.92998243.52610131.52689318.73158415.78384515.0841597.7416410.3548839.0573978.58478810.31774810.0449955.995795
Tim
e (s
econ
ds)
0
40
80
120
160
Input 1 2 3 4 5 6 7 8 9 10 11 12 13 14 15 16 17
Output
GiraphVertica
PageRank (total of 10 iterations)
LiveJournal Twitter
GraphLab 41.44 493.511
Giraph 126.82 1040.81
Vertica 62.23063 643.535
Tim
e (s
econ
ds)
0
300
600
900
1,200
LiveJournal Twitter
643.5
62.2
1040.8
126.8
493.5
41.4
GraphLabGiraphVertica
PageRank (per superstep for Twitter)
Input 1 2 3 4 5 6 7 8 9 10 Output
Giraph 143.52966.650103.60083.30887.06781.50185.20883.54879.21281.44585.85615.747Vertica 0 7.163878100.72478276.58791877.87374777.55075576.98139676.45138576.79525278.10283376.881002 0
Tim
e (s
econ
ds)
0
40
80
120
160
Input 1 2 3 4 5 6 7 8 9 10
Output
GiraphVertica
Bi-edges: 1867.98 sec
Shortest Path (per superstep for Twitter)-1
Input 1 2 3 4 5 6 7 8 9 10 11 12 13 14 15 16 17 18 19 20 21 22 23 24 25 26 27 28 29 30 31 32 33 34 35 36 37 38 39 40 41 42 43 44 45 46 47 48 49 50 51 52 53 54 55 56 57 58 59 60 61 62 63 64 65 66 67 68 69 70 71 72 73 74 75 Output
Giraph 147.58261.60862.57118.63110.8112.158 1.451 1.264 1.37 1.439 1.293 1.189 5.824 1.068 1.034 1.091 1.144 1.014 0.946 0.957 1.048 1.087 1.017 1.097 1.039 0.97 1.021 1.038 1.056 0.987 1.007 0.968 1.007 1.007 0.99 0.987 1.021 1.021 0.964 1.182 1.131 1.03 0.945 0.925 1.062 1.038 1.032 0.954 1.006 1.042 1.024 0.887 1.118 0.988 0.984 0.956 1.024 1.026 0.92 0.92 1.082 1.028 1.048 1.044 0.962 0.979 1.036 0.946 1.004 0.966 0.951 1.009 0.96 0.919 1.096 1.019 5.503Vertica 5.66030188.86565477.75300770.8516362.43566620.9996218.72108811.35781411.1949259.8650985.38888
Tim
e (s
econ
ds)
0
40
80
120
160
Input 5 10 15 20 25 30 35 40 45 50 55 60 65 70 75
Output
GiraphVertica
PageRank (Twitter)
Load / Store Iterations
GraphLab 374.811 118.7
Giraph 159.28 837.40
Vertica 0.00000 725.113
Tim
e (s
econ
ds)
0
350
700
1050
1400
GraphLab Giraph Vertica
Load / Store TimeAlgorithm Time
Shortest Paths (Twitter)
Load / Store Iterations
GraphLab 366.607 25.5
Giraph 161.79 101.46
Vertica 0.00000 277.025
Connected Components (Twitter)
Load / Store Iterations
GraphLab 370.709 91.923
Giraph 153.09 233.44
Vertica 0.00000 373.094
Tim
e (s
econ
ds)
0
150
300
450
600
GraphLab Giraph Vertica
Load / Store TimeAlgorithm Time
Tim
e (s
econ
ds)
0
150
300
450
600
GraphLab Giraph Vertica
Load / Store TimeAlgorithm Time
(c) Connected Components
Figure 10: Cost breakdown of typical vertex-centric Analysis on Twitter graph.
Single Source Shortest Path (SSSP). We implemented SSSP onVertica using the query shown in Listing 4, i.e. we incrementallycompute the distances and replace the old vertex table with the newone, unless the number of updates is less than 5000, in which casewe update the vertex table in-place.Connected Components. We implemented the HCC algorithm [15]in Vertica (this is the same algorithm used in Giraph). HCC assignseach node to a component identifier. We initialize the vertex valueswith their ids and in each iteration the vertex updates are computed(similar to SSSP) as follows:CREATE TABLE v_update_prime ASSELECT v1.id, MIN(v2.value) AS valueFROM v_update AS v2, edge AS e, vertex AS v1WHERE v2.id=e.from_node AND v1.id=e.to_nodeGROUP BY v1.id, v1.valueHAVING MIN(v2.value) < v1.value;
As in shortest paths, we apply these updates either in-place or byreplacing the vertex table, depending upon the number of updates.Additionally, we apply two optimizations: (1) we do not performincremental computation at first; rather, we update all vertices inthe first few iterations, i.e. we use the entire vertex table instead ofv update in the above query, (2) since the component ids can be
propagated in either edge direction, we propagate them in oppositedirections over alternate iterations, i.e. we change the join conditionin the above query to: v2.id=e.to node AND v1.id=e.from node.These optimizations help to significantly speed up the convergenceof the algorithm, since component ids can be propagated quicklyon either edge directions.
Figures 8(a), 8(b), and 8(c) show the query runtime of PageRank(10 iterations), SSSP, and Connected Components on GraphLab,Giraph, and Vertica over directed graphs using 4 machines. We cansee that Vertica outperforms Giraph and is comparable to GraphLabon these three queries, both on the smaller LiveJournal graph aswell as the billion edge Twitter graph. The reason is that thesequeries are full scan-oriented join queries for which Vertica is heav-ily optimized. A reader might also think that our SQL implemen-tations are thoroughly hand crafted, which is actually true. In fact,one of our goals in this paper is to show that if developers reallycare about the graph algorithms they can tune them quite a bit in theSQL engines. In Section 4.3, we evaluate our more general sharedmemory implementation to run arbitrary vertex-centric UDFs.
Note that the advantage of Vertica varies across benchmarks. Forexample, on the Twitter graph, Vertica has 40% improvement over
8
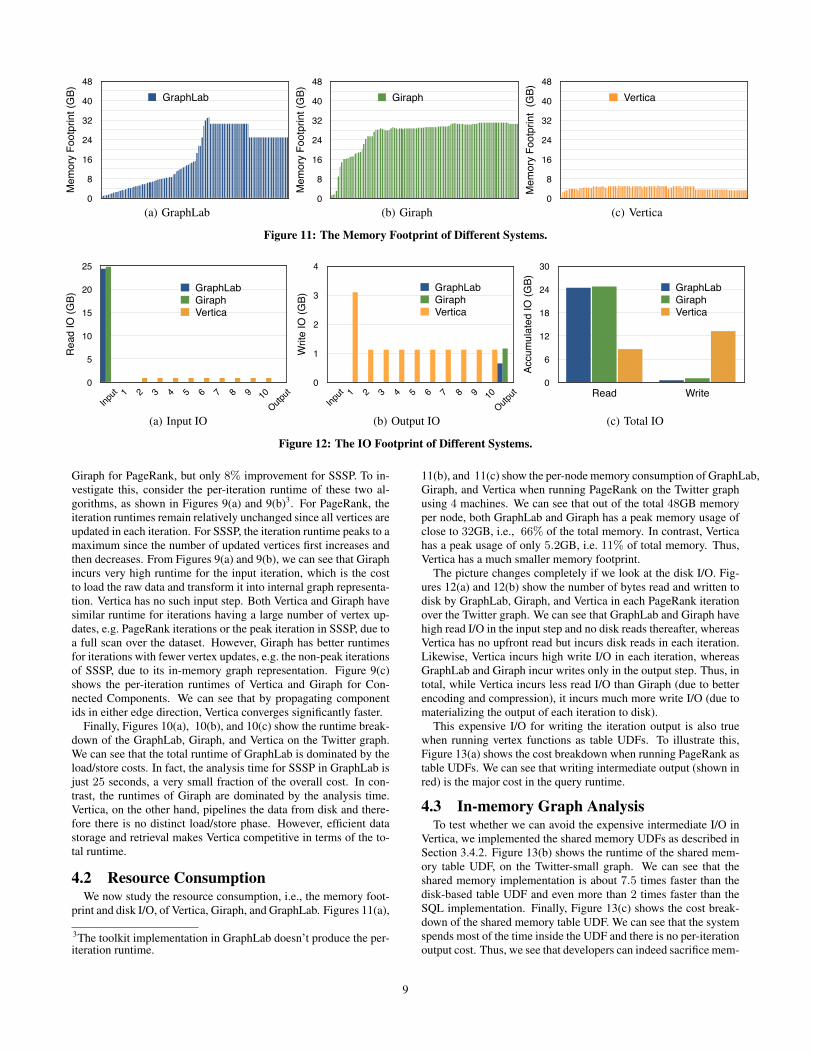
Disk I/O: bytes read
Input 1 2 3 4 5 6 7 8 9 10 Output
Total
GraphLab
24.38 24.38Giraph 24.80
247724.8024776279926
Vertica 0 0.0797363
0.9485969
0.9485969
0.9485969
0.9485969
0.9485969
0.9485969
0.9485969
0.9485969
0.9485969
0 8.61710928473622
Read
IO (G
B)
0
5
10
15
20
25
Input 1 2 3 4 5 6 7 8 9 10
Output
GraphLabGiraphVertica
Disk I/O: bytes written
Input 1 2 3 4 5 6 7 8 9 10 Output
Total
GraphLab
0.6659667968750.665966796875Giraph 1.162708334624771.16270833462477Vertica 0 3.103332966566091.132107630372051.132107630372051.132107630372051.132107630372051.132107630372051.132107630372051.132107630372051.132107630372051.132107630372050 13.2923016399145
Writ
e IO
(GB)
0
1
2
3
4
Input 1 2 3 4 5 6 7 8 9 10
Output
GraphLabGiraphVertica
Total I/O
Read Write
GraphLab 24.38 0.665966796875
Giraph 24.80247762799261.16270833462477
Vertica 8.6171092847362213.2923016399145
Accu
mul
ated
IO (G
B)
0
6
12
18
24
30
Read Write
GraphLabGiraphVertica
Table 1
Vertica Giraph GraphLab
0.618931 1.18717 0.682426
2.66477 1.53716 0.828197
2.85276 1.74782 1.11526
3.32222 3.06425 1.26548
3.24784 8.87862 1.55106
4.00165 13.0163 1.6863
4.0029 14.843 2.01369
4.00306 16.0345 2.15664
4.00327 16.1241 2.45057
4.00346 16.3522 2.6035
3.37668 16.5131 2.874
4.25254 17.0164 2.99626
4.05005 17.2526 3.25139
4.5032 17.3312 3.36543
4.48816 18.159 3.68496
4.47684 18.5232 3.84452
4.47672 18.8235 4.15305
4.51923 19.0535 4.28076
4.07025 20.2701 4.54293
5.07447 22.3931 4.66988
4.71683 24.3588 4.83318
4.82393 25.4106 4.96341
4.81039 25.4114 5.22519
4.79879 25.4134 5.32691
4.93113 25.456 5.62209
4.91565 27.2292 5.75922
4.37033 28.1097 6.0388
4.13215 28.1108 6.1818
4.87063 28.4687 6.46082
4.8595 28.7771 6.61161
4.84404 28.5011 6.90736
4.83248 28.2838 7.05424
4.82265 27.8964 7.35824
4.19115 27.9215 7.49028
5.19909 28.08 7.78964
4.84802 28.5727 7.90083
4.95004 29.1925 8.14
4.93834 28.9236 8.2793
4.92286 28.6739 8.45631
4.91106 28.5522 8.49706
4.91751 28.5977 8.58068
4.46943 28.6479 8.68507
5.08484 28.5422 9.78622
4.96843 28.5967 10.0203
4.95331 28.6151 11.2029
4.94164 28.7323 11.4627
4.93005 28.8031 11.9849
4.92014 28.8068 12.248
4.10617 28.7496 12.7786
4.94611 28.7518 13.0435
4.74366 28.8059 13.5779
4.97414 28.9044 13.8435
4.95887 28.8631 14.3689
4.94749 28.9279 14.6326
4.9362 29.0655 15.158
4.93922 29.2825 15.4254
4.28719 29.249 18.626
5.18806 29.2818 21.6047
4.9771 29.2003 21.6047
4.96585 29.1622 25.0819
4.95027 29.1624 29.8613
4.93867 29.2714 31.7696
4.9347 29.2715 33.0667
3.93609 29.5734 33.181
4.47414 29.574 30.4928
4.49083 29.6699 30.4928
4.95993 29.561 30.4937
4.94867 29.5922 30.4941
4.93323 29.5922 30.4943
4.92178 29.865 30.4944
4.93016 30.3174 30.4944
4.19854 30.4258 30.4944
5.19421 30.7612 30.4944
4.9726 30.762 30.4942
4.9749 30.6475 30.4965
4.96305 30.5348 30.4963
4.95487 30.4303 30.4968
4.94587 30.4304 30.4972
4.95371 30.2695 30.497
3.7276 30.2696 30.4972
3.71587 30.2701 30.4974
3.70415 30.3379 30.4971
3.68854 30.3959 30.4975
3.67682 30.502 30.4975
3.6651 30.5026 30.4974
3.64947 30.5026 30.4975
3.63769 30.7121 30.4975
3.62598 30.9973 24.9625
3.6105 30.9969 24.9625
3.60392 30.997 24.9625
3.59292 30.997 24.9625
3.57729 30.9968 24.9625
3.56559 30.9972 24.9625
3.54997 30.9972 24.9625
3.53824 31.1218 24.9625
3.52655 31.1604 24.9625
3.51093 31.2126 24.9625
3.49921 31.2128 24.9625
3.48748 31.2129 24.9625
3.47186 31.1609 24.9625
3.46014 31.0451 24.9625
3.44842 31.0212 24.9625
3.43279 31.0919 24.966
3.42107 31.027 24.9657
3.40546 30.9331 24.9653
3.39374 30.6771 24.9612
3.38201 30.6791 24.9657
3.36639 30.6791 24.9657
3.35468 30.6791 24.9653
3.34296 30.6791 24.9612
Mem
ory
Foot
prin
t (G
B)
0
8
16
24
32
40
48Vertica
Mem
ory
Foot
prin
t (G
B)
0
8
16
24
32
40
48Giraph
Mem
ory
Foot
prin
t (G
B)
0
8
16
24
32
40
48GraphLab
(a) GraphLab
Disk I/O: bytes read
Input 1 2 3 4 5 6 7 8 9 10 Output
Total
GraphLab
24.38 24.38Giraph 24.80
247724.8024776279926
Vertica 0 0.0797363
0.9485969
0.9485969
0.9485969
0.9485969
0.9485969
0.9485969
0.9485969
0.9485969
0.9485969
0 8.61710928473622
Read
IO (G
B)
0
5
10
15
20
25
Input 1 2 3 4 5 6 7 8 9 10
Output
GraphLabGiraphVertica
Disk I/O: bytes written
Input 1 2 3 4 5 6 7 8 9 10 Output
Total
GraphLab
0.6659667968750.665966796875Giraph 1.162708334624771.16270833462477Vertica 0 3.103332966566091.132107630372051.132107630372051.132107630372051.132107630372051.132107630372051.132107630372051.132107630372051.132107630372051.132107630372050 13.2923016399145
Writ
e IO
(GB)
0
1
2
3
4
Input 1 2 3 4 5 6 7 8 9 10
Output
GraphLabGiraphVertica
Total I/O
Read Write
GraphLab 24.38 0.665966796875
Giraph 24.80247762799261.16270833462477
Vertica 8.6171092847362213.2923016399145
Accu
mul
ated
IO (G
B)
0
6
12
18
24
30
Read Write
GraphLabGiraphVertica
Table 1
Vertica Giraph GraphLab
0.618931 1.18717 0.682426
2.66477 1.53716 0.828197
2.85276 1.74782 1.11526
3.32222 3.06425 1.26548
3.24784 8.87862 1.55106
4.00165 13.0163 1.6863
4.0029 14.843 2.01369
4.00306 16.0345 2.15664
4.00327 16.1241 2.45057
4.00346 16.3522 2.6035
3.37668 16.5131 2.874
4.25254 17.0164 2.99626
4.05005 17.2526 3.25139
4.5032 17.3312 3.36543
4.48816 18.159 3.68496
4.47684 18.5232 3.84452
4.47672 18.8235 4.15305
4.51923 19.0535 4.28076
4.07025 20.2701 4.54293
5.07447 22.3931 4.66988
4.71683 24.3588 4.83318
4.82393 25.4106 4.96341
4.81039 25.4114 5.22519
4.79879 25.4134 5.32691
4.93113 25.456 5.62209
4.91565 27.2292 5.75922
4.37033 28.1097 6.0388
4.13215 28.1108 6.1818
4.87063 28.4687 6.46082
4.8595 28.7771 6.61161
4.84404 28.5011 6.90736
4.83248 28.2838 7.05424
4.82265 27.8964 7.35824
4.19115 27.9215 7.49028
5.19909 28.08 7.78964
4.84802 28.5727 7.90083
4.95004 29.1925 8.14
4.93834 28.9236 8.2793
4.92286 28.6739 8.45631
4.91106 28.5522 8.49706
4.91751 28.5977 8.58068
4.46943 28.6479 8.68507
5.08484 28.5422 9.78622
4.96843 28.5967 10.0203
4.95331 28.6151 11.2029
4.94164 28.7323 11.4627
4.93005 28.8031 11.9849
4.92014 28.8068 12.248
4.10617 28.7496 12.7786
4.94611 28.7518 13.0435
4.74366 28.8059 13.5779
4.97414 28.9044 13.8435
4.95887 28.8631 14.3689
4.94749 28.9279 14.6326
4.9362 29.0655 15.158
4.93922 29.2825 15.4254
4.28719 29.249 18.626
5.18806 29.2818 21.6047
4.9771 29.2003 21.6047
4.96585 29.1622 25.0819
4.95027 29.1624 29.8613
4.93867 29.2714 31.7696
4.9347 29.2715 33.0667
3.93609 29.5734 33.181
4.47414 29.574 30.4928
4.49083 29.6699 30.4928
4.95993 29.561 30.4937
4.94867 29.5922 30.4941
4.93323 29.5922 30.4943
4.92178 29.865 30.4944
4.93016 30.3174 30.4944
4.19854 30.4258 30.4944
5.19421 30.7612 30.4944
4.9726 30.762 30.4942
4.9749 30.6475 30.4965
4.96305 30.5348 30.4963
4.95487 30.4303 30.4968
4.94587 30.4304 30.4972
4.95371 30.2695 30.497
3.7276 30.2696 30.4972
3.71587 30.2701 30.4974
3.70415 30.3379 30.4971
3.68854 30.3959 30.4975
3.67682 30.502 30.4975
3.6651 30.5026 30.4974
3.64947 30.5026 30.4975
3.63769 30.7121 30.4975
3.62598 30.9973 24.9625
3.6105 30.9969 24.9625
3.60392 30.997 24.9625
3.59292 30.997 24.9625
3.57729 30.9968 24.9625
3.56559 30.9972 24.9625
3.54997 30.9972 24.9625
3.53824 31.1218 24.9625
3.52655 31.1604 24.9625
3.51093 31.2126 24.9625
3.49921 31.2128 24.9625
3.48748 31.2129 24.9625
3.47186 31.1609 24.9625
3.46014 31.0451 24.9625
3.44842 31.0212 24.9625
3.43279 31.0919 24.966
3.42107 31.027 24.9657
3.40546 30.9331 24.9653
3.39374 30.6771 24.9612
3.38201 30.6791 24.9657
3.36639 30.6791 24.9657
3.35468 30.6791 24.9653
3.34296 30.6791 24.9612
Mem
ory
Foot
prin
t (G
B)
0
8
16
24
32
40
48Vertica
Mem
ory
Foot
prin
t (G
B)
0
8
16
24
32
40
48Giraph
Mem
ory
Foot
prin
t (G
B)
0
8
16
24
32
40
48GraphLab
(b) Giraph
Disk I/O: bytes read
Input 1 2 3 4 5 6 7 8 9 10 Output
Total
GraphLab
24.38 24.38Giraph 24.80
247724.8024776279926
Vertica 0 0.0797363
0.9485969
0.9485969
0.9485969
0.9485969
0.9485969
0.9485969
0.9485969
0.9485969
0.9485969
0 8.61710928473622
Read
IO (G
B)
0
5
10
15
20
25
Input 1 2 3 4 5 6 7 8 9 10
Output
GraphLabGiraphVertica
Disk I/O: bytes written
Input 1 2 3 4 5 6 7 8 9 10 Output
Total
GraphLab
0.6659667968750.665966796875Giraph 1.162708334624771.16270833462477Vertica 0 3.103332966566091.132107630372051.132107630372051.132107630372051.132107630372051.132107630372051.132107630372051.132107630372051.132107630372051.132107630372050 13.2923016399145
Writ
e IO
(GB)
0
1
2
3
4
Input 1 2 3 4 5 6 7 8 9 10
Output
GraphLabGiraphVertica
Total I/O
Read Write
GraphLab 24.38 0.665966796875
Giraph 24.80247762799261.16270833462477
Vertica 8.6171092847362213.2923016399145
Accu
mul
ated
IO (G
B)
0
6
12
18
24
30
Read Write
GraphLabGiraphVertica
Table 1
Vertica Giraph GraphLab
0.618931 1.18717 0.682426
2.66477 1.53716 0.828197
2.85276 1.74782 1.11526
3.32222 3.06425 1.26548
3.24784 8.87862 1.55106
4.00165 13.0163 1.6863
4.0029 14.843 2.01369
4.00306 16.0345 2.15664
4.00327 16.1241 2.45057
4.00346 16.3522 2.6035
3.37668 16.5131 2.874
4.25254 17.0164 2.99626
4.05005 17.2526 3.25139
4.5032 17.3312 3.36543
4.48816 18.159 3.68496
4.47684 18.5232 3.84452
4.47672 18.8235 4.15305
4.51923 19.0535 4.28076
4.07025 20.2701 4.54293
5.07447 22.3931 4.66988
4.71683 24.3588 4.83318
4.82393 25.4106 4.96341
4.81039 25.4114 5.22519
4.79879 25.4134 5.32691
4.93113 25.456 5.62209
4.91565 27.2292 5.75922
4.37033 28.1097 6.0388
4.13215 28.1108 6.1818
4.87063 28.4687 6.46082
4.8595 28.7771 6.61161
4.84404 28.5011 6.90736
4.83248 28.2838 7.05424
4.82265 27.8964 7.35824
4.19115 27.9215 7.49028
5.19909 28.08 7.78964
4.84802 28.5727 7.90083
4.95004 29.1925 8.14
4.93834 28.9236 8.2793
4.92286 28.6739 8.45631
4.91106 28.5522 8.49706
4.91751 28.5977 8.58068
4.46943 28.6479 8.68507
5.08484 28.5422 9.78622
4.96843 28.5967 10.0203
4.95331 28.6151 11.2029
4.94164 28.7323 11.4627
4.93005 28.8031 11.9849
4.92014 28.8068 12.248
4.10617 28.7496 12.7786
4.94611 28.7518 13.0435
4.74366 28.8059 13.5779
4.97414 28.9044 13.8435
4.95887 28.8631 14.3689
4.94749 28.9279 14.6326
4.9362 29.0655 15.158
4.93922 29.2825 15.4254
4.28719 29.249 18.626
5.18806 29.2818 21.6047
4.9771 29.2003 21.6047
4.96585 29.1622 25.0819
4.95027 29.1624 29.8613
4.93867 29.2714 31.7696
4.9347 29.2715 33.0667
3.93609 29.5734 33.181
4.47414 29.574 30.4928
4.49083 29.6699 30.4928
4.95993 29.561 30.4937
4.94867 29.5922 30.4941
4.93323 29.5922 30.4943
4.92178 29.865 30.4944
4.93016 30.3174 30.4944
4.19854 30.4258 30.4944
5.19421 30.7612 30.4944
4.9726 30.762 30.4942
4.9749 30.6475 30.4965
4.96305 30.5348 30.4963
4.95487 30.4303 30.4968
4.94587 30.4304 30.4972
4.95371 30.2695 30.497
3.7276 30.2696 30.4972
3.71587 30.2701 30.4974
3.70415 30.3379 30.4971
3.68854 30.3959 30.4975
3.67682 30.502 30.4975
3.6651 30.5026 30.4974
3.64947 30.5026 30.4975
3.63769 30.7121 30.4975
3.62598 30.9973 24.9625
3.6105 30.9969 24.9625
3.60392 30.997 24.9625
3.59292 30.997 24.9625
3.57729 30.9968 24.9625
3.56559 30.9972 24.9625
3.54997 30.9972 24.9625
3.53824 31.1218 24.9625
3.52655 31.1604 24.9625
3.51093 31.2126 24.9625
3.49921 31.2128 24.9625
3.48748 31.2129 24.9625
3.47186 31.1609 24.9625
3.46014 31.0451 24.9625
3.44842 31.0212 24.9625
3.43279 31.0919 24.966
3.42107 31.027 24.9657
3.40546 30.9331 24.9653
3.39374 30.6771 24.9612
3.38201 30.6791 24.9657
3.36639 30.6791 24.9657
3.35468 30.6791 24.9653
3.34296 30.6791 24.9612
Mem
ory
Foot
prin
t (G
B)
0
8
16
24
32
40
48Vertica
Mem
ory
Foot
prin
t (G
B)
0
8
16
24
32
40
48Giraph
Mem
ory
Foot
prin
t (G
B)
0
8
16
24
32
40
48GraphLab
(c) Vertica
Figure 11: The Memory Footprint of Different Systems.
Disk I/O: bytes read
Input 1 2 3 4 5 6 7 8 9 10 Output
Total
GraphLab
24.38 24.38Giraph 24.80
247724.8024776279926
Vertica 0 0.0797363
0.9485969
0.9485969
0.9485969
0.9485969
0.9485969
0.9485969
0.9485969
0.9485969
0.9485969
0 8.61710928473622
Read
IO (G
B)
0
5
10
15
20
25
Input 1 2 3 4 5 6 7 8 9 10
Output
GraphLabGiraphVertica
Disk I/O: bytes written
Input 1 2 3 4 5 6 7 8 9 10 Output
Total
GraphLab
0.6659667968750.665966796875Giraph 1.162708334624771.16270833462477Vertica 0 3.103332966566091.132107630372051.132107630372051.132107630372051.132107630372051.132107630372051.132107630372051.132107630372051.132107630372051.132107630372050 13.2923016399145
Writ
e IO
(GB)
0
1
2
3
4
Input 1 2 3 4 5 6 7 8 9 10
Output
GraphLabGiraphVertica
Total I/O
Read Write
GraphLab 24.38 0.665966796875
Giraph 24.80247762799261.16270833462477
Vertica 8.6171092847362213.2923016399145
Accu
mul
ated
IO (G
B)
0
6
12
18
24
30
Read Write
GraphLabGiraphVertica
Table 1
Vertica Giraph GraphLab
0.618931 1.18717 0.682426
2.66477 1.53716 0.828197
2.85276 1.74782 1.11526
3.32222 3.06425 1.26548
3.24784 8.87862 1.55106
4.00165 13.0163 1.6863
4.0029 14.843 2.01369
4.00306 16.0345 2.15664
4.00327 16.1241 2.45057
4.00346 16.3522 2.6035
3.37668 16.5131 2.874
4.25254 17.0164 2.99626
4.05005 17.2526 3.25139
4.5032 17.3312 3.36543
4.48816 18.159 3.68496
4.47684 18.5232 3.84452
4.47672 18.8235 4.15305
4.51923 19.0535 4.28076
4.07025 20.2701 4.54293
5.07447 22.3931 4.66988
4.71683 24.3588 4.83318
4.82393 25.4106 4.96341
4.81039 25.4114 5.22519
4.79879 25.4134 5.32691
4.93113 25.456 5.62209
4.91565 27.2292 5.75922
4.37033 28.1097 6.0388
4.13215 28.1108 6.1818
4.87063 28.4687 6.46082
4.8595 28.7771 6.61161
4.84404 28.5011 6.90736
4.83248 28.2838 7.05424
4.82265 27.8964 7.35824
4.19115 27.9215 7.49028
5.19909 28.08 7.78964
4.84802 28.5727 7.90083
4.95004 29.1925 8.14
4.93834 28.9236 8.2793
4.92286 28.6739 8.45631
4.91106 28.5522 8.49706
4.91751 28.5977 8.58068
4.46943 28.6479 8.68507
5.08484 28.5422 9.78622
4.96843 28.5967 10.0203
4.95331 28.6151 11.2029
4.94164 28.7323 11.4627
4.93005 28.8031 11.9849
4.92014 28.8068 12.248
4.10617 28.7496 12.7786
4.94611 28.7518 13.0435
4.74366 28.8059 13.5779
4.97414 28.9044 13.8435
4.95887 28.8631 14.3689
4.94749 28.9279 14.6326
4.9362 29.0655 15.158
4.93922 29.2825 15.4254
4.28719 29.249 18.626
5.18806 29.2818 21.6047
4.9771 29.2003 21.6047
4.96585 29.1622 25.0819
4.95027 29.1624 29.8613
4.93867 29.2714 31.7696
4.9347 29.2715 33.0667
3.93609 29.5734 33.181
4.47414 29.574 30.4928
4.49083 29.6699 30.4928
4.95993 29.561 30.4937
4.94867 29.5922 30.4941
4.93323 29.5922 30.4943
4.92178 29.865 30.4944
4.93016 30.3174 30.4944
4.19854 30.4258 30.4944
5.19421 30.7612 30.4944
4.9726 30.762 30.4942
4.9749 30.6475 30.4965
4.96305 30.5348 30.4963
4.95487 30.4303 30.4968
4.94587 30.4304 30.4972
4.95371 30.2695 30.497
3.7276 30.2696 30.4972
3.71587 30.2701 30.4974
3.70415 30.3379 30.4971
3.68854 30.3959 30.4975
3.67682 30.502 30.4975
3.6651 30.5026 30.4974
3.64947 30.5026 30.4975
3.63769 30.7121 30.4975
3.62598 30.9973 24.9625
3.6105 30.9969 24.9625
3.60392 30.997 24.9625
3.59292 30.997 24.9625
3.57729 30.9968 24.9625
3.56559 30.9972 24.9625
3.54997 30.9972 24.9625
3.53824 31.1218 24.9625
3.52655 31.1604 24.9625
3.51093 31.2126 24.9625
3.49921 31.2128 24.9625
3.48748 31.2129 24.9625
3.47186 31.1609 24.9625
3.46014 31.0451 24.9625
3.44842 31.0212 24.9625
3.43279 31.0919 24.966
3.42107 31.027 24.9657
3.40546 30.9331 24.9653
3.39374 30.6771 24.9612
3.38201 30.6791 24.9657
3.36639 30.6791 24.9657
3.35468 30.6791 24.9653
3.34296 30.6791 24.9612
Mem
ory
Foot
prin
t (G
B)
0
8
16
24
32
40
48Vertica
Mem
ory
Foot
prin
t (G
B)
0
8
16
24
32
40
48Giraph
Mem
ory
Foot
prin
t (G
B)
0
8
16
24
32
40
48GraphLab
(a) Input IO
Disk I/O: bytes read
Input 1 2 3 4 5 6 7 8 9 10 Output
Total
GraphLab
24.38 24.38Giraph 24.80
247724.8024776279926
Vertica 0 0.0797363
0.9485969
0.9485969
0.9485969
0.9485969
0.9485969
0.9485969
0.9485969
0.9485969
0.9485969
0 8.61710928473622
Read
IO (G
B)
0
5
10
15
20
25
Input 1 2 3 4 5 6 7 8 9 10
Output
GraphLabGiraphVertica
Disk I/O: bytes written
Input 1 2 3 4 5 6 7 8 9 10 Output
Total
GraphLab
0.6659667968750.665966796875Giraph 1.162708334624771.16270833462477Vertica 0 3.103332966566091.132107630372051.132107630372051.132107630372051.132107630372051.132107630372051.132107630372051.132107630372051.132107630372051.132107630372050 13.2923016399145
Writ
e IO
(GB)
0
1
2
3
4
Input 1 2 3 4 5 6 7 8 9 10
Output
GraphLabGiraphVertica
Total I/O
Read Write
GraphLab 24.38 0.665966796875
Giraph 24.80247762799261.16270833462477
Vertica 8.6171092847362213.2923016399145
Accu
mul
ated
IO (G
B)
0
6
12
18
24
30
Read Write
GraphLabGiraphVertica
Table 1
Vertica Giraph GraphLab
0.618931 1.18717 0.682426
2.66477 1.53716 0.828197
2.85276 1.74782 1.11526
3.32222 3.06425 1.26548
3.24784 8.87862 1.55106
4.00165 13.0163 1.6863
4.0029 14.843 2.01369
4.00306 16.0345 2.15664
4.00327 16.1241 2.45057
4.00346 16.3522 2.6035
3.37668 16.5131 2.874
4.25254 17.0164 2.99626
4.05005 17.2526 3.25139
4.5032 17.3312 3.36543
4.48816 18.159 3.68496
4.47684 18.5232 3.84452
4.47672 18.8235 4.15305
4.51923 19.0535 4.28076
4.07025 20.2701 4.54293
5.07447 22.3931 4.66988
4.71683 24.3588 4.83318
4.82393 25.4106 4.96341
4.81039 25.4114 5.22519
4.79879 25.4134 5.32691
4.93113 25.456 5.62209
4.91565 27.2292 5.75922
4.37033 28.1097 6.0388
4.13215 28.1108 6.1818
4.87063 28.4687 6.46082
4.8595 28.7771 6.61161
4.84404 28.5011 6.90736
4.83248 28.2838 7.05424
4.82265 27.8964 7.35824
4.19115 27.9215 7.49028
5.19909 28.08 7.78964
4.84802 28.5727 7.90083
4.95004 29.1925 8.14
4.93834 28.9236 8.2793
4.92286 28.6739 8.45631
4.91106 28.5522 8.49706
4.91751 28.5977 8.58068
4.46943 28.6479 8.68507
5.08484 28.5422 9.78622
4.96843 28.5967 10.0203
4.95331 28.6151 11.2029
4.94164 28.7323 11.4627
4.93005 28.8031 11.9849
4.92014 28.8068 12.248
4.10617 28.7496 12.7786
4.94611 28.7518 13.0435
4.74366 28.8059 13.5779
4.97414 28.9044 13.8435
4.95887 28.8631 14.3689
4.94749 28.9279 14.6326
4.9362 29.0655 15.158
4.93922 29.2825 15.4254
4.28719 29.249 18.626
5.18806 29.2818 21.6047
4.9771 29.2003 21.6047
4.96585 29.1622 25.0819
4.95027 29.1624 29.8613
4.93867 29.2714 31.7696
4.9347 29.2715 33.0667
3.93609 29.5734 33.181
4.47414 29.574 30.4928
4.49083 29.6699 30.4928
4.95993 29.561 30.4937
4.94867 29.5922 30.4941
4.93323 29.5922 30.4943
4.92178 29.865 30.4944
4.93016 30.3174 30.4944
4.19854 30.4258 30.4944
5.19421 30.7612 30.4944
4.9726 30.762 30.4942
4.9749 30.6475 30.4965
4.96305 30.5348 30.4963
4.95487 30.4303 30.4968
4.94587 30.4304 30.4972
4.95371 30.2695 30.497
3.7276 30.2696 30.4972
3.71587 30.2701 30.4974
3.70415 30.3379 30.4971
3.68854 30.3959 30.4975
3.67682 30.502 30.4975
3.6651 30.5026 30.4974
3.64947 30.5026 30.4975
3.63769 30.7121 30.4975
3.62598 30.9973 24.9625
3.6105 30.9969 24.9625
3.60392 30.997 24.9625
3.59292 30.997 24.9625
3.57729 30.9968 24.9625
3.56559 30.9972 24.9625
3.54997 30.9972 24.9625
3.53824 31.1218 24.9625
3.52655 31.1604 24.9625
3.51093 31.2126 24.9625
3.49921 31.2128 24.9625
3.48748 31.2129 24.9625
3.47186 31.1609 24.9625
3.46014 31.0451 24.9625
3.44842 31.0212 24.9625
3.43279 31.0919 24.966
3.42107 31.027 24.9657
3.40546 30.9331 24.9653
3.39374 30.6771 24.9612
3.38201 30.6791 24.9657
3.36639 30.6791 24.9657
3.35468 30.6791 24.9653
3.34296 30.6791 24.9612
Mem
ory
Foot
prin
t (G
B)
0
8
16
24
32
40
48Vertica
Mem
ory
Foot
prin
t (G
B)
0
8
16
24
32
40
48Giraph
Mem
ory
Foot
prin
t (G
B)
0
8
16
24
32
40
48GraphLab
(b) Output IO
Disk I/O: bytes read
Input 1 2 3 4 5 6 7 8 9 10 Output
Total
GraphLab
24.38 24.38Giraph 24.80
247724.8024776279926
Vertica 0 0.0797363
0.9485969
0.9485969
0.9485969
0.9485969
0.9485969
0.9485969
0.9485969
0.9485969
0.9485969
0 8.61710928473622
Read
IO (G
B)
0
5
10
15
20
25
Input 1 2 3 4 5 6 7 8 9 10
Output
GraphLabGiraphVertica
Disk I/O: bytes written
Input 1 2 3 4 5 6 7 8 9 10 Output
Total
GraphLab
0.6659667968750.665966796875Giraph 1.162708334624771.16270833462477Vertica 0 3.103332966566091.132107630372051.132107630372051.132107630372051.132107630372051.132107630372051.132107630372051.132107630372051.132107630372051.132107630372050 13.2923016399145
Writ
e IO
(GB)
0
1
2
3
4
Input 1 2 3 4 5 6 7 8 9 10
Output
GraphLabGiraphVertica
Total I/O
Read Write
GraphLab 24.38 0.665966796875
Giraph 24.80247762799261.16270833462477
Vertica 8.6171092847362213.2923016399145
Accu
mul
ated
IO (G
B)
0
6
12
18
24
30
Read Write
GraphLabGiraphVertica
Table 1
Vertica Giraph GraphLab
0.618931 1.18717 0.682426
2.66477 1.53716 0.828197
2.85276 1.74782 1.11526
3.32222 3.06425 1.26548
3.24784 8.87862 1.55106
4.00165 13.0163 1.6863
4.0029 14.843 2.01369
4.00306 16.0345 2.15664
4.00327 16.1241 2.45057
4.00346 16.3522 2.6035
3.37668 16.5131 2.874
4.25254 17.0164 2.99626
4.05005 17.2526 3.25139
4.5032 17.3312 3.36543
4.48816 18.159 3.68496
4.47684 18.5232 3.84452
4.47672 18.8235 4.15305
4.51923 19.0535 4.28076
4.07025 20.2701 4.54293
5.07447 22.3931 4.66988
4.71683 24.3588 4.83318
4.82393 25.4106 4.96341
4.81039 25.4114 5.22519
4.79879 25.4134 5.32691
4.93113 25.456 5.62209
4.91565 27.2292 5.75922
4.37033 28.1097 6.0388
4.13215 28.1108 6.1818
4.87063 28.4687 6.46082
4.8595 28.7771 6.61161
4.84404 28.5011 6.90736
4.83248 28.2838 7.05424
4.82265 27.8964 7.35824
4.19115 27.9215 7.49028
5.19909 28.08 7.78964
4.84802 28.5727 7.90083
4.95004 29.1925 8.14
4.93834 28.9236 8.2793
4.92286 28.6739 8.45631
4.91106 28.5522 8.49706
4.91751 28.5977 8.58068
4.46943 28.6479 8.68507
5.08484 28.5422 9.78622
4.96843 28.5967 10.0203
4.95331 28.6151 11.2029
4.94164 28.7323 11.4627
4.93005 28.8031 11.9849
4.92014 28.8068 12.248
4.10617 28.7496 12.7786
4.94611 28.7518 13.0435
4.74366 28.8059 13.5779
4.97414 28.9044 13.8435
4.95887 28.8631 14.3689
4.94749 28.9279 14.6326
4.9362 29.0655 15.158
4.93922 29.2825 15.4254
4.28719 29.249 18.626
5.18806 29.2818 21.6047
4.9771 29.2003 21.6047
4.96585 29.1622 25.0819
4.95027 29.1624 29.8613
4.93867 29.2714 31.7696
4.9347 29.2715 33.0667
3.93609 29.5734 33.181
4.47414 29.574 30.4928
4.49083 29.6699 30.4928
4.95993 29.561 30.4937
4.94867 29.5922 30.4941
4.93323 29.5922 30.4943
4.92178 29.865 30.4944
4.93016 30.3174 30.4944
4.19854 30.4258 30.4944
5.19421 30.7612 30.4944
4.9726 30.762 30.4942
4.9749 30.6475 30.4965
4.96305 30.5348 30.4963
4.95487 30.4303 30.4968
4.94587 30.4304 30.4972
4.95371 30.2695 30.497
3.7276 30.2696 30.4972
3.71587 30.2701 30.4974
3.70415 30.3379 30.4971
3.68854 30.3959 30.4975
3.67682 30.502 30.4975
3.6651 30.5026 30.4974
3.64947 30.5026 30.4975
3.63769 30.7121 30.4975
3.62598 30.9973 24.9625
3.6105 30.9969 24.9625
3.60392 30.997 24.9625
3.59292 30.997 24.9625
3.57729 30.9968 24.9625
3.56559 30.9972 24.9625
3.54997 30.9972 24.9625
3.53824 31.1218 24.9625
3.52655 31.1604 24.9625
3.51093 31.2126 24.9625
3.49921 31.2128 24.9625
3.48748 31.2129 24.9625
3.47186 31.1609 24.9625
3.46014 31.0451 24.9625
3.44842 31.0212 24.9625
3.43279 31.0919 24.966
3.42107 31.027 24.9657
3.40546 30.9331 24.9653
3.39374 30.6771 24.9612
3.38201 30.6791 24.9657
3.36639 30.6791 24.9657
3.35468 30.6791 24.9653
3.34296 30.6791 24.9612
Mem
ory
Foot
prin
t (G
B)
0
8
16
24
32
40
48Vertica
Mem
ory
Foot
prin
t (G
B)
0
8
16
24
32
40
48Giraph
Mem
ory
Foot
prin
t (G
B)
0
8
16
24
32
40
48GraphLab
(c) Total IO
Figure 12: The IO Footprint of Different Systems.
Giraph for PageRank, but only 8% improvement for SSSP. To in-vestigate this, consider the per-iteration runtime of these two al-gorithms, as shown in Figures 9(a) and 9(b)3. For PageRank, theiteration runtimes remain relatively unchanged since all vertices areupdated in each iteration. For SSSP, the iteration runtime peaks to amaximum since the number of updated vertices first increases andthen decreases. From Figures 9(a) and 9(b), we can see that Giraphincurs very high runtime for the input iteration, which is the costto load the raw data and transform it into internal graph representa-tion. Vertica has no such input step. Both Vertica and Giraph havesimilar runtime for iterations having a large number of vertex up-dates, e.g. PageRank iterations or the peak iteration in SSSP, due toa full scan over the dataset. However, Giraph has better runtimesfor iterations with fewer vertex updates, e.g. the non-peak iterationsof SSSP, due to its in-memory graph representation. Figure 9(c)shows the per-iteration runtimes of Vertica and Giraph for Con-nected Components. We can see that by propagating componentids in either edge direction, Vertica converges significantly faster.
Finally, Figures 10(a), 10(b), and 10(c) show the runtime break-down of the GraphLab, Giraph, and Vertica on the Twitter graph.We can see that the total runtime of GraphLab is dominated by theload/store costs. In fact, the analysis time for SSSP in GraphLab isjust 25 seconds, a very small fraction of the overall cost. In con-trast, the runtimes of Giraph are dominated by the analysis time.Vertica, on the other hand, pipelines the data from disk and there-fore there is no distinct load/store phase. However, efficient datastorage and retrieval makes Vertica competitive in terms of the to-tal runtime.
4.2 Resource ConsumptionWe now study the resource consumption, i.e., the memory foot-
print and disk I/O, of Vertica, Giraph, and GraphLab. Figures 11(a),
3The toolkit implementation in GraphLab doesn’t produce the per-iteration runtime.
11(b), and 11(c) show the per-node memory consumption of GraphLab,Giraph, and Vertica when running PageRank on the Twitter graphusing 4 machines. We can see that out of the total 48GB memoryper node, both GraphLab and Giraph has a peak memory usage ofclose to 32GB, i.e., 66% of the total memory. In contrast, Verticahas a peak usage of only 5.2GB, i.e. 11% of total memory. Thus,Vertica has a much smaller memory footprint.
The picture changes completely if we look at the disk I/O. Fig-ures 12(a) and 12(b) show the number of bytes read and written todisk by GraphLab, Giraph, and Vertica in each PageRank iterationover the Twitter graph. We can see that GraphLab and Giraph havehigh read I/O in the input step and no disk reads thereafter, whereasVertica has no upfront read but incurs disk reads in each iteration.Likewise, Vertica incurs high write I/O in each iteration, whereasGraphLab and Giraph incur writes only in the output step. Thus, intotal, while Vertica incurs less read I/O than Giraph (due to betterencoding and compression), it incurs much more write I/O (due tomaterializing the output of each iteration to disk).
This expensive I/O for writing the iteration output is also truewhen running vertex functions as table UDFs. To illustrate this,Figure 13(a) shows the cost breakdown when running PageRank astable UDFs. We can see that writing intermediate output (shown inred) is the major cost in the query runtime.
4.3 In-memory Graph AnalysisTo test whether we can avoid the expensive intermediate I/O in
Vertica, we implemented the shared memory UDFs as described inSection 3.4.2. Figure 13(b) shows the runtime of the shared mem-ory table UDF, on the Twitter-small graph. We can see that theshared memory implementation is about 7.5 times faster than thedisk-based table UDF and even more than 2 times faster than theSQL implementation. Finally, Figure 13(c) shows the cost break-down of the shared memory table UDF. We can see that the systemspends most of the time inside the UDF and there is no per-iterationoutput cost. Thus, we see that developers can indeed sacrifice mem-
9
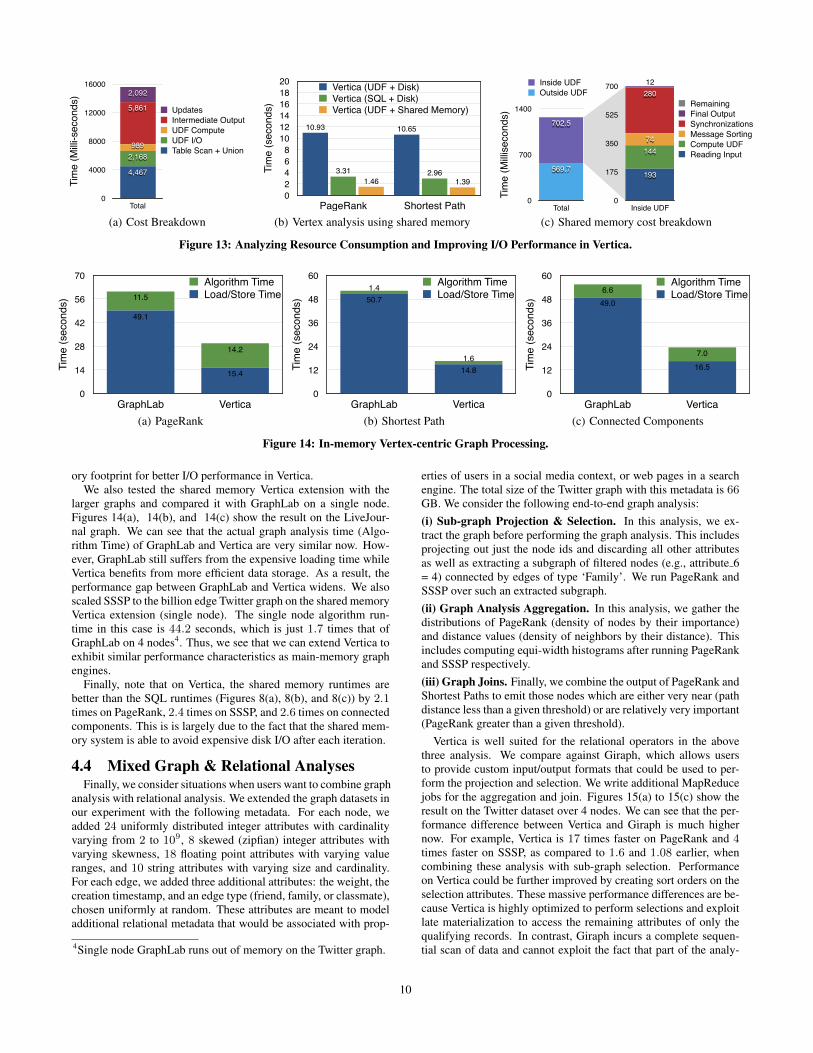
Table 2
Giraph Vertica (UDF)
Vertica (SQL)
Vertica (UDF, Shared Memory)
PageRank 46.956666666666710.92925766666673.313333333333331.45955966666667
Shortest Path 43.666666666666710.646985 2.956350333333331.38871466666667
Tim
e (s
econ
ds)
02468
101214161820
PageRank Shortest Path
1.391.462.963.31
10.6510.93
Vertica (UDF + Disk)Vertica (SQL + Disk)Vertica (UDF + Shared Memory)
Twitter-small dataset
Table 4
PageRank
Table Scan + Union
4466.924
UDF I/O 2168.054
UDF Compute 988.823
Intermediate Output
5861.264
Updates 2091.897
Tim
e (M
illi-s
econ
ds)
0
4000
8000
12000
16000
Total
2,092
5,861
9892,168
4,467
Table Scan + UnionUDF I/OUDF ComputeIntermediate OutputUpdates
Table 5
PageRank
Reading Input 193.119744
Compute UDF 144.243712
Message Sorting 73.51936
Synchronizations 279.91296
Final Output 11.714048
Remaining 32.021504
0
175
350
525
700
Inside UDF
12280
74144
193
Reading InputCompute UDFMessage SortingSynchronizationsFinal OutputRemaining
Table 6
PageRank
Outside UDF 569.66484266667
Inside UDF 702.509824
Tim
e (M
illise
cond
s)
0
700
1400
Total
702.5
569.7
Outside UDFInside UDF
PageRank (10 iterations)
GraphLab Vertica
Load Time 49.07 15.385
Algorithm Time 11.5 14.244
Total Time 60.570 29.629
Shortest Paths
GraphLab Vertica
Load Time 50.714 14.849
Algorithm Time 1.4 1.649
Total Time 52.114 16.498
Connected Components
GraphLab Vertica
Load Time 49 16.505
Algorithm Time 6.641 7.032
Total Time 55.641 23.537
0
14
28
42
56
70
GraphLab Vertica
14.2
11.5
15.4
49.1
Load TimeAlgorithm Time
0
12
24
36
48
60
GraphLab Vertica
1.6
1.4
14.8
50.7Load TimeAlgorithm Time
0
12
24
36
48
60
GraphLab Vertica
7.0
6.6
16.5
49.0
Load TimeAlgorithm Time
Load Time
GraphLab Vertica
PageRank 49.07 15.385
Shortest Paths 50.714 14.849
Connected Components
49 16.505
Algorithm Time
GraphLab Vertica
PageRank 11.5 14.244
Shortest Paths 1.4 1.649
Connected Components
6.641 7.032
0
20
40
60
80
PageRank Shortest Paths Connected Components
GraphLabVertica
0
4
8
12
16
PageRank Shortest Paths Connected Components
GraphLabVertica
(a) Cost Breakdown
Table 2
Giraph Vertica (UDF)
Vertica (SQL)
Vertica (UDF, Shared Memory)
PageRank 46.956666666666710.92925766666673.313333333333331.45955966666667
Shortest Path 43.666666666666710.646985 2.956350333333331.38871466666667
Tim
e (s
econ
ds)
02468
101214161820
PageRank Shortest Path
1.391.462.963.31
10.6510.93
Vertica (UDF + Disk)Vertica (SQL + Disk)Vertica (UDF + Shared Memory)
Twitter-small dataset
Table 4
PageRank
Table Scan + Union
4466.924
UDF I/O 2168.054
UDF Compute 988.823
Intermediate Output
5861.264
Updates 2091.897
Tim
e (M
illi-s
econ
ds)
0
4000
8000
12000
16000
Total
2,092
5,861
9892,168
4,467
Table Scan + UnionUDF I/OUDF ComputeIntermediate OutputUpdates
Table 5
PageRank
Reading Input 193.119744
Compute UDF 144.243712
Message Sorting 73.51936
Synchronizations 279.91296
Final Output 11.714048
Remaining 32.021504
0
175
350
525
700
Inside UDF
12280
74144
193
Reading InputCompute UDFMessage SortingSynchronizationsFinal OutputRemaining
Table 6
PageRank
Outside UDF 569.66484266667
Inside UDF 702.509824
Tim
e (M
illise
cond
s)
0
700
1400
Total
702.5
569.7
Outside UDFInside UDF
PageRank (10 iterations)
GraphLab Vertica
Load Time 49.07 15.385
Algorithm Time 11.5 14.244
Total Time 60.570 29.629
Shortest Paths
GraphLab Vertica
Load Time 50.714 14.849
Algorithm Time 1.4 1.649
Total Time 52.114 16.498
Connected Components
GraphLab Vertica
Load Time 49 16.505
Algorithm Time 6.641 7.032
Total Time 55.641 23.537
0
14
28
42
56
70
GraphLab Vertica
14.2
11.5
15.4
49.1
Load TimeAlgorithm Time
0
12
24
36
48
60
GraphLab Vertica
1.6
1.4
14.8
50.7Load TimeAlgorithm Time
0
12
24
36
48
60
GraphLab Vertica
7.0
6.6
16.5
49.0
Load TimeAlgorithm Time
Load Time
GraphLab Vertica
PageRank 49.07 15.385
Shortest Paths 50.714 14.849
Connected Components
49 16.505
Algorithm Time
GraphLab Vertica
PageRank 11.5 14.244
Shortest Paths 1.4 1.649
Connected Components
6.641 7.032
0
20
40
60
80
PageRank Shortest Paths Connected Components
GraphLabVertica
0
4
8
12
16
PageRank Shortest Paths Connected Components
GraphLabVertica
(b) Vertex analysis using shared memory
Table 2
Giraph Vertica (UDF)
Vertica (SQL)
Vertica (UDF, Shared Memory)
PageRank 46.956666666666710.92925766666673.313333333333331.45955966666667
Shortest Path 43.666666666666710.646985 2.956350333333331.38871466666667
Tim
e (s
econ
ds)
02468
101214161820
PageRank Shortest Path
1.391.462.963.31
10.6510.93
Vertica (UDF + Disk)Vertica (SQL + Disk)Vertica (UDF + Shared Memory)
Twitter-small dataset
Table 4
PageRank
Table Scan + Union
4466.924
UDF I/O 2168.054
UDF Compute 988.823
Intermediate Output
5861.264
Updates 2091.897Ti
me
(Milli
-sec
onds
)
0
4000
8000
12000
16000
Total
2,092
5,861
9892,168
4,467
Table Scan + UnionUDF I/OUDF ComputeIntermediate OutputUpdates
Table 5
PageRank
Reading Input 193.119744
Compute UDF 144.243712
Message Sorting 73.51936
Synchronizations 279.91296
Final Output 11.714048
Remaining 32.021504
0
175
350
525
700
Inside UDF
12280
74144
193
Reading InputCompute UDFMessage SortingSynchronizationsFinal OutputRemaining
Table 6
PageRank
Outside UDF 569.66484266667
Inside UDF 702.509824
Tim
e (M
illise
cond
s)
0
700
1400
Total
702.5
569.7
Outside UDFInside UDF
PageRank (10 iterations)
GraphLab Vertica
Load Time 49.07 15.385
Algorithm Time 11.5 14.244
Total Time 60.570 29.629
Shortest Paths
GraphLab Vertica
Load Time 50.714 14.849
Algorithm Time 1.4 1.649
Total Time 52.114 16.498
Connected Components
GraphLab Vertica
Load Time 49 16.505
Algorithm Time 6.641 7.032
Total Time 55.641 23.537
0
14
28
42
56
70
GraphLab Vertica
14.2
11.5
15.4
49.1
Load TimeAlgorithm Time
0
12
24
36
48
60
GraphLab Vertica
1.6
1.4
14.8
50.7Load TimeAlgorithm Time
0
12
24
36
48
60
GraphLab Vertica
7.0
6.6
16.5
49.0
Load TimeAlgorithm Time
Load Time
GraphLab Vertica
PageRank 49.07 15.385
Shortest Paths 50.714 14.849
Connected Components
49 16.505
Algorithm Time
GraphLab Vertica
PageRank 11.5 14.244
Shortest Paths 1.4 1.649
Connected Components
6.641 7.032
0
20
40
60
80
PageRank Shortest Paths Connected Components
GraphLabVertica
0
4
8
12
16
PageRank Shortest Paths Connected Components
GraphLabVertica
(c) Shared memory cost breakdown
Figure 13: Analyzing Resource Consumption and Improving I/O Performance in Vertica.
Table 2
Giraph Vertica (UDF)
Vertica (SQL)
Vertica (UDF, Shared Memory)
PageRank 46.956666666666710.92925766666673.313333333333331.45955966666667
Shortest Path 43.666666666666710.646985 2.956350333333331.38871466666667
Tim
e (s
econ
ds)
02468
101214161820
PageRank Shortest Path
1.391.462.963.31
10.6510.93
Vertica (UDF + Disk)Vertica (SQL + Disk)Vertica (UDF + Shared Memory)
Twitter-small dataset
Table 4
PageRank
Table Scan + Union
4466.924
UDF I/O 2168.054
UDF Compute 988.823
Intermediate Output
5861.264
Updates 2091.897
Tim
e (M
illi-s
econ
ds)
0
4000
8000
12000
16000
Total
2,092
5,861
9892,168
4,467
Table Scan + UnionUDF I/OUDF ComputeIntermediate OutputUpdates
Table 5
PageRank
Reading Input 193.119744
Compute UDF 144.243712
Message Sorting 73.51936
Synchronizations 279.91296
Final Output 11.714048
Remaining 32.021504
0
175
350
525
700
Inside UDF
12280
74144
193
Reading InputCompute UDFMessage SortingSynchronizationsFinal OutputRemaining
Table 6
PageRank
Outside UDF 569.66484266667
Inside UDF 702.509824
Tim
e (M
illise
cond
s)
0
700
1400
Total
702.5
569.7
Outside UDFInside UDF
PageRank (10 iterations)
GraphLab Vertica
Load Time 49.07 15.385
Algorithm Time 11.5 14.244
Total Time 60.570 29.629
Shortest Paths
GraphLab Vertica
Load Time 50.714 14.849
Algorithm Time 1.4 1.649
Total Time 52.114 16.498
Connected Components
GraphLab Vertica
Load Time 49 16.505
Algorithm Time 6.641 7.032
Total Time 55.641 23.537
Tim
e (s
econ
ds)
0
14
28
42
56
70
GraphLab Vertica
14.2
11.5
15.4
49.1
Load/Store TimeAlgorithm Time
Tim
e (s
econ
ds)
0
12
24
36
48
60
GraphLab Vertica
1.6
1.4
14.8
50.7 Load/Store TimeAlgorithm Time
Tim
e (s
econ
ds)
0
12
24
36
48
60
GraphLab Vertica
7.0
6.6
16.5
49.0Load/Store TimeAlgorithm Time
Load Time
GraphLab Vertica
PageRank 49.07 15.385
Shortest Paths 50.714 14.849
Connected Components
49 16.505
Algorithm Time
GraphLab Vertica
PageRank 11.5 14.244
Shortest Paths 1.4 1.649
Connected Components
6.641 7.032
0
20
40
60
80
PageRank Shortest Paths Connected Components
GraphLabVertica
0
4
8
12
16
PageRank Shortest Paths Connected Components
GraphLabVertica
Shortest Paths (Twitter Graph)
GraphLab Vertica
Load Time 290.923
Algorithm Time 44.207
Total Time 335.130
(a) PageRank
Table 2
Giraph Vertica (UDF)
Vertica (SQL)
Vertica (UDF, Shared Memory)
PageRank 46.956666666666710.92925766666673.313333333333331.45955966666667
Shortest Path 43.666666666666710.646985 2.956350333333331.38871466666667
Tim
e (s
econ
ds)
02468
101214161820
PageRank Shortest Path
1.391.462.963.31
10.6510.93
Vertica (UDF + Disk)Vertica (SQL + Disk)Vertica (UDF + Shared Memory)
Twitter-small dataset
Table 4
PageRank
Table Scan + Union
4466.924
UDF I/O 2168.054
UDF Compute 988.823
Intermediate Output
5861.264
Updates 2091.897
Tim
e (M
illi-s
econ
ds)
0
4000
8000
12000
16000
Total
2,092
5,861
9892,168
4,467
Table Scan + UnionUDF I/OUDF ComputeIntermediate OutputUpdates
Table 5
PageRank
Reading Input 193.119744
Compute UDF 144.243712
Message Sorting 73.51936
Synchronizations 279.91296
Final Output 11.714048
Remaining 32.021504
0
175
350
525
700
Inside UDF
12280
74144
193
Reading InputCompute UDFMessage SortingSynchronizationsFinal OutputRemaining
Table 6
PageRank
Outside UDF 569.66484266667
Inside UDF 702.509824
Tim
e (M
illise
cond
s)
0
700
1400
Total
702.5
569.7
Outside UDFInside UDF
PageRank (10 iterations)
GraphLab Vertica
Load Time 49.07 15.385
Algorithm Time 11.5 14.244
Total Time 60.570 29.629
Shortest Paths
GraphLab Vertica
Load Time 50.714 14.849
Algorithm Time 1.4 1.649
Total Time 52.114 16.498
Connected Components
GraphLab Vertica
Load Time 49 16.505
Algorithm Time 6.641 7.032
Total Time 55.641 23.537
Tim
e (s
econ
ds)
0
14
28
42
56
70
GraphLab Vertica
14.2
11.5
15.4
49.1
Load/Store TimeAlgorithm Time
Tim
e (s
econ
ds)
0
12
24
36
48
60
GraphLab Vertica
1.6
1.4
14.8
50.7 Load/Store TimeAlgorithm Time
Tim
e (s
econ
ds)
0
12
24
36
48
60
GraphLab Vertica
7.0
6.6
16.5
49.0Load/Store TimeAlgorithm Time
Load Time
GraphLab Vertica
PageRank 49.07 15.385
Shortest Paths 50.714 14.849
Connected Components
49 16.505
Algorithm Time
GraphLab Vertica
PageRank 11.5 14.244
Shortest Paths 1.4 1.649
Connected Components
6.641 7.032
0
20
40
60
80
PageRank Shortest Paths Connected Components
GraphLabVertica
0
4
8
12
16
PageRank Shortest Paths Connected Components
GraphLabVertica
Shortest Paths (Twitter Graph)
GraphLab Vertica
Load Time 290.923
Algorithm Time 44.207
Total Time 335.130
(b) Shortest Path
Table 2
Giraph Vertica (UDF)
Vertica (SQL)
Vertica (UDF, Shared Memory)
PageRank 46.956666666666710.92925766666673.313333333333331.45955966666667
Shortest Path 43.666666666666710.646985 2.956350333333331.38871466666667
Tim
e (s
econ
ds)
02468
101214161820
PageRank Shortest Path
1.391.462.963.31
10.6510.93
Vertica (UDF + Disk)Vertica (SQL + Disk)Vertica (UDF + Shared Memory)
Twitter-small dataset
Table 4
PageRank
Table Scan + Union
4466.924
UDF I/O 2168.054
UDF Compute 988.823
Intermediate Output
5861.264
Updates 2091.897
Tim
e (M
illi-s
econ
ds)
0
4000
8000
12000
16000
Total
2,092
5,861
9892,168
4,467
Table Scan + UnionUDF I/OUDF ComputeIntermediate OutputUpdates
Table 5
PageRank
Reading Input 193.119744
Compute UDF 144.243712
Message Sorting 73.51936
Synchronizations 279.91296
Final Output 11.714048
Remaining 32.021504
0
175
350
525
700
Inside UDF
12280
74144
193
Reading InputCompute UDFMessage SortingSynchronizationsFinal OutputRemaining
Table 6
PageRank
Outside UDF 569.66484266667
Inside UDF 702.509824
Tim
e (M
illise
cond
s)
0
700
1400
Total
702.5
569.7
Outside UDFInside UDF
PageRank (10 iterations)
GraphLab Vertica
Load Time 49.07 15.385
Algorithm Time 11.5 14.244
Total Time 60.570 29.629
Shortest Paths
GraphLab Vertica
Load Time 50.714 14.849
Algorithm Time 1.4 1.649
Total Time 52.114 16.498
Connected Components
GraphLab Vertica
Load Time 49 16.505
Algorithm Time 6.641 7.032
Total Time 55.641 23.537
Tim
e (s
econ
ds)
0
14
28
42
56
70
GraphLab Vertica
14.2
11.5
15.4
49.1
Load/Store TimeAlgorithm Time
Tim
e (s
econ
ds)
0
12
24
36
48
60
GraphLab Vertica
1.6
1.4
14.8
50.7 Load/Store TimeAlgorithm Time
Tim
e (s
econ
ds)
0
12
24
36
48
60
GraphLab Vertica
7.0
6.6
16.5
49.0Load/Store TimeAlgorithm Time
Load Time
GraphLab Vertica
PageRank 49.07 15.385
Shortest Paths 50.714 14.849
Connected Components
49 16.505
Algorithm Time
GraphLab Vertica
PageRank 11.5 14.244
Shortest Paths 1.4 1.649
Connected Components
6.641 7.032
0
20
40
60
80
PageRank Shortest Paths Connected Components
GraphLabVertica
0
4
8
12
16
PageRank Shortest Paths Connected Components
GraphLabVertica
Shortest Paths (Twitter Graph)
GraphLab Vertica
Load Time 290.923
Algorithm Time 44.207
Total Time 335.130
(c) Connected Components
Figure 14: In-memory Vertex-centric Graph Processing.
ory footprint for better I/O performance in Vertica.We also tested the shared memory Vertica extension with the
larger graphs and compared it with GraphLab on a single node.Figures 14(a), 14(b), and 14(c) show the result on the LiveJour-nal graph. We can see that the actual graph analysis time (Algo-rithm Time) of GraphLab and Vertica are very similar now. How-ever, GraphLab still suffers from the expensive loading time whileVertica benefits from more efficient data storage. As a result, theperformance gap between GraphLab and Vertica widens. We alsoscaled SSSP to the billion edge Twitter graph on the shared memoryVertica extension (single node). The single node algorithm run-time in this case is 44.2 seconds, which is just 1.7 times that ofGraphLab on 4 nodes4. Thus, we see that we can extend Vertica toexhibit similar performance characteristics as main-memory graphengines.
Finally, note that on Vertica, the shared memory runtimes arebetter than the SQL runtimes (Figures 8(a), 8(b), and 8(c)) by 2.1times on PageRank, 2.4 times on SSSP, and 2.6 times on connectedcomponents. This is is largely due to the fact that the shared mem-ory system is able to avoid expensive disk I/O after each iteration.
4.4 Mixed Graph & Relational AnalysesFinally, we consider situations when users want to combine graph
analysis with relational analysis. We extended the graph datasets inour experiment with the following metadata. For each node, weadded 24 uniformly distributed integer attributes with cardinalityvarying from 2 to 109, 8 skewed (zipfian) integer attributes withvarying skewness, 18 floating point attributes with varying valueranges, and 10 string attributes with varying size and cardinality.For each edge, we added three additional attributes: the weight, thecreation timestamp, and an edge type (friend, family, or classmate),chosen uniformly at random. These attributes are meant to modeladditional relational metadata that would be associated with prop-
4Single node GraphLab runs out of memory on the Twitter graph.
erties of users in a social media context, or web pages in a searchengine. The total size of the Twitter graph with this metadata is 66GB. We consider the following end-to-end graph analysis:(i) Sub-graph Projection & Selection. In this analysis, we ex-tract the graph before performing the graph analysis. This includesprojecting out just the node ids and discarding all other attributesas well as extracting a subgraph of filtered nodes (e.g., attribute 6= 4) connected by edges of type ‘Family’. We run PageRank andSSSP over such an extracted subgraph.(ii) Graph Analysis Aggregation. In this analysis, we gather thedistributions of PageRank (density of nodes by their importance)and distance values (density of neighbors by their distance). Thisincludes computing equi-width histograms after running PageRankand SSSP respectively.(iii) Graph Joins. Finally, we combine the output of PageRank andShortest Paths to emit those nodes which are either very near (pathdistance less than a given threshold) or are relatively very important(PageRank greater than a given threshold).
Vertica is well suited for the relational operators in the abovethree analysis. We compare against Giraph, which allows usersto provide custom input/output formats that could be used to per-form the projection and selection. We write additional MapReducejobs for the aggregation and join. Figures 15(a) to 15(c) show theresult on the Twitter dataset over 4 nodes. We can see that the per-formance difference between Vertica and Giraph is much highernow. For example, Vertica is 17 times faster on PageRank and 4times faster on SSSP, as compared to 1.6 and 1.08 earlier, whencombining these analysis with sub-graph selection. Performanceon Vertica could be further improved by creating sort orders on theselection attributes. These massive performance differences are be-cause Vertica is highly optimized to perform selections and exploitlate materialization to access the remaining attributes of only thequalifying records. In contrast, Giraph incurs a complete sequen-tial scan of data and cannot exploit the fact that part of the analy-
10

Projection
PageRank ShortestPath
Giraph 226.64333333333333
146.96333333333333
Vertica 28.29866666666667
54.80286666666667
Selection
PageRank ShortestPath
Giraph 954.552 405.449
Vertica 55.579 101.298
Aggregation
PageRank ShortestPath
Giraph 1089.646 349.878
Vertica 643.927126 279.781814
Join
PageRank + Shortest Path
Giraph 1435.882
Vertica 926.993418
Tim
e (s
econ
ds)
0
75
150
225
300
PageRank ShortestPath
GiraphVertica
Tim
e (s
econ
ds)
0
250
500
750
1000
PageRank ShortestPath
GiraphVertica
Tim
e (s
econ
ds)
0
275
550
825
1100
PageRank ShortestPath
GiraphVertica
Tim
e (s
econ
ds)
0
400
800
1200
1600
PageRank
GiraphVertica
PageRank + DM
Projection Selection Aggregation
Join
Giraph 226.64333333333333
191.32 287.90466666666666
430.13466666666666
Vertica 28.29866666666667
11.12666666666667
30.65933333333333
84.16852333333333
ShortestPath + DM
Projection Selection Aggregation
Join
Giraph 146.96333333333333
139.71666666666667
186.82166666666666
430.13466666666666
Vertica 54.80286666666667
6.4967903333333354.035053 84.16852333333333
Tim
e (s
econ
ds)
0
125
250
375
500
Relational OperatorsProjection Selection Aggregation Join
84.254.0
6.5
54.8
430.1
186.8139.7147.0
Giraph Vertica
(a) Subgraph Projection & Selection
Projection
PageRank ShortestPath
Giraph 226.64333333333333
146.96333333333333
Vertica 28.29866666666667
54.80286666666667
Selection
PageRank ShortestPath
Giraph 954.552 405.449
Vertica 55.579 101.298
Aggregation
PageRank ShortestPath
Giraph 1089.646 349.878
Vertica 643.927126 279.781814
Join
PageRank + Shortest Path
Giraph 1435.882
Vertica 926.993418
Tim
e (s
econ
ds)
0
75
150
225
300
PageRank ShortestPath
GiraphVertica
Tim
e (s
econ
ds)
0
250
500
750
1000
PageRank ShortestPath
GiraphVertica
Tim
e (s
econ
ds)
0
275
550
825
1100
PageRank ShortestPath
GiraphVertica
Tim
e (s
econ
ds)
0
400
800
1200
1600
PageRank
GiraphVertica
PageRank + DM
Projection Selection Aggregation
Join
Giraph 226.64333333333333
191.32 287.90466666666666
430.13466666666666
Vertica 28.29866666666667
11.12666666666667
30.65933333333333
84.16852333333333
ShortestPath + DM
Projection Selection Aggregation
Join
Giraph 146.96333333333333
139.71666666666667
186.82166666666666
430.13466666666666
Vertica 54.80286666666667
6.4967903333333354.035053 84.16852333333333
Tim
e (s
econ
ds)
0
125
250
375
500
Relational OperatorsProjection Selection Aggregation Join
84.254.0
6.5
54.8
430.1
186.8139.7147.0
Giraph Vertica
(b) Graph Analysis Aggregation
Projection
PageRank ShortestPath
Giraph 226.64333333333333
146.96333333333333
Vertica 28.29866666666667
54.80286666666667
Selection
PageRank ShortestPath
Giraph 954.552 405.449
Vertica 55.579 101.298
Aggregation
PageRank ShortestPath
Giraph 1089.646 349.878
Vertica 643.927126 279.781814
Join
PageRank + Shortest Path
Giraph 1435.882
Vertica 926.993418
Tim
e (s
econ
ds)
0
75
150
225
300
PageRank ShortestPath
GiraphVertica
Tim
e (s
econ
ds)
0
250
500
750
1000
PageRank ShortestPath
GiraphVertica
Tim
e (s
econ
ds)
0
275
550
825
1100
PageRank ShortestPath
GiraphVertica
Tim
e (s
econ
ds)
0
400
800
1200
1600
PageRank + Shortest Path
GiraphVertica
PageRank + DM
Projection Selection Aggregation
Join
Giraph 226.64333333333333
191.32 287.90466666666666
430.13466666666666
Vertica 28.29866666666667
11.12666666666667
30.65933333333333
84.16852333333333
ShortestPath + DM
Projection Selection Aggregation
Join
Giraph 146.96333333333333
139.71666666666667
186.82166666666666
430.13466666666666
Vertica 54.80286666666667
6.4967903333333354.035053 84.16852333333333
Tim
e (s
econ
ds)
0
125
250
375
500
Relational OperatorsProjection Selection Aggregation Join
84.254.0
6.5
54.8
430.1
186.8139.7147.0
Giraph Vertica
(c) Graph Join
Figure 15: Mixed graph and relational analysis.
sis is relational in nature. Rather, developers are required to stitchGiraph programs with programs in another data processing enginesuch as Hadoop MapReduce or Spark. Similar results are obtainedon aggregation and join queries.
In summary, several data management operations, such as pro-jection, selection, aggregation, and join, fit naturally with graphoperations. To perform these operations efficiently, we need sev-eral features from relational databases, including efficient layouts,indexes, and statistics, in the graph management system. Column-oriented databases are already well equipped with these techniques,whereas native graphs stores lack optimized implementations ofthem. As a result Vertica excels on benchmarks that include a mixof relational and graph operations.
4.5 Beyond Vertex-centric AnalysesLet us now look at more advanced graph analytics. Consider the
following two 1-hop neighborhood graph queries.(i) Strong Overlap. Find all pairs of nodes having a large numberof common neighbors, between them. For simplicity, we defineoverlap as the number of common neighbors. However, we couldeasily extend the algorithm to include other definitions of overlap.Such an analysis to find the strongly overlapping nodes in a graphcould be useful in detecting similar entities. To implement sucha query using SQL we do a self-join on the edge table followedby a group by on the two leaf nodes and a count of the number ofcommon neighbors between them. Finally, all those pairs of nodeswhich have less than the threshold number of common neighborsare filtered.SELECT e1.from_node as n1,e2.from_node as n2, count(*)FROM edge e1JOIN edge e2 ON e1.to_node=e2.to_nodeAND e1.from_node<e2.from_nodeGROUP BY e1.from_node,e2.from_nodeHAVING count(*) > THRESHOLD
(ii) Weak Ties. Find all nodes that act as a bridge between two oth-erwise disconnected node-pairs. The goal is to find all such weakties which connect at least a threshold number of node pairs. Thisis a slightly more complicated query because we need to test fordisconnection between node pairs. Using SQL, this could be im-plemented as a three-way join, with the second join being a leftjoin, and counting all cases when the third edge does not exist.SELECT e1.to_node AS Id,sum(CASE WHEN e3.to_node IS NULL THEN 1 ELSE 0 END)/2 AS CFROM edge e1JOIN edge e2 ON e1.to_node=e2.from_nodeAND e1.from_node<>e2.to_nodeLEFT JOIN edge e3 ON e2.to_node=e3.from_nodeAND e1.from_node=e3.to_nodeGROUP BY e1.to_nodeHAVING C > THRESHOLD
While the above queries are straightforward to implement andrun on Vertica, they are tedious to implement in vertex-centric graph
Query Dataset Vertica Giraph
Strong Overlap Youtube 259.56 230.01LiveJournal-undir 381.05 out of memory
Weak Ties Youtube 746.14 out of memoryLiveJournal-undir 1,475.99 out of memory
Table 3: 1-hop Neighborhood Analysis.
processing systems. For instance, in Giraph, each vertex needs tobroadcast its neighborhood in the first superstep in order to accessthe 1-hop neighborhood. Thereafter, we perform the actual analysisin the subsequent supersteps. Unfortunately, this results in repli-cating the graph several times in memory. As an optimization inGiraph, we can reduce the number of messages by sending mes-sages only to those neighbors with a higher node id. In addition,we can reduce the size of messages by sending only the ids whichare smaller than the id of the receiving vertex. Still, passing neigh-borhoods as messages is not natural in the vertex-centric model andincurs the overhead of serializing and deserializing the nodes ids.
Table 3 shows the performance of Vertica and Giraph over thetwo 1-hop neighborhood analyses running on 4 nodes. We can seethat Giraph runs out of memory when scaling to larger graphs (evenafter allocating 12GB to each of the 4 workers on each of the 4nodes). This is because the graphs are quite dense and sendingthe entire 1-hop neighborhood results in memory usage proportionto the graph size times the average out-degree of a node. Vertica,on the other hand, does not suffer from such issues and works forlarger graphs as well.
In summary, while Giraph is good for typical graph algorithmssuch as PageRank and Shortest Paths, it is hard to program andpoor in performance for advanced graph analytics such as findingnodes with strong overlap. Vertica, on the other hand is quite facileat such analysis and allows programmers to perform a wide rangeof analytics, and also yield significantly better performance.
5. RELATED WORKExisting graph data management systems address two classes of
query workloads: (i) low latency online graph query processing,e.g. social network transactions, and (ii) offline graph analytics,e.g. PageRank computation. Typical examples of systems for on-line graph processing include RDF stores (such as Jena [16] andAllegeroGraph [17]) and key value stores (such as Neo4j [18] andHypergraphDB [19]). Some recent graph processing systems wraparound relational databases to provide efficient online query pro-cessing. These include TAO [20] from Facebook and FlockDB [21]from Twitter, both of which wrap around MySQL to build a dis-tributed and scalable graph processing system. Thus, low latencyonline graph query processing can be mapped to traditional onlineprocessing in relational databases.
Graph analytics, on the other hand, is seen as completely dif-ferent from traditional data analytics, typically due to its scale and
11

iterative nature. As a result a plethora of graph processing systemshave been recently proposed. These include vertex-centric systems,e.g. Pregel [1], Giraph [2], GraphLab [3] and its extensions [22,23, 24], GPS [10], Trinity [4], GRACE [11, 25], Pregelix [5];neighborhood-centric systems, e.g. Giraph++ [26], NScale [27, 28];datalog-based systems, e.g. Socialite [29, 30], GrDB [31, 32]; SPARQL-based systems, e.g. G-SPARQL [33]; and matrix-oriented systems,e.g. Pegasus [15]. Some recent works have also looked at specificgraph analysis using relational databases. Examples include trian-gle counting [7], shortest paths [34, 6], subgraph pattern match-ing [8], and social network analysis [35, 36]. Others have lookedat the utility of combining graph analysis with relational opera-tors [37, 38].
In this work, we have a particular emphasis on the question asto whether, in general relational databases and Vertica in partic-ular can provide a performant, easy-to-use engine on which graphanalytics can be layered, as opposed to looking at specific analyses.
6. LESSONS LEARNED & CONCLUSIONGraph analytics is emerging as an important application area,
with several graph data management systems having been recentlyproposed. These systems, however, require users to switch to yetanother data management system. This paper demonstrates that ef-ficient and scalable graph analytics is possible within Vertica rela-tional database system. We implemented a variety of graph analy-ses on Vertica as well as two popular vertex-centric graph analyticssystem. Our results show that Vertica has comparable end-to-endruntime performance, without requiring the use of a purpose-builtgraph engine. In addition, we showed that using table UDFs, devel-opers can trade memory footprint for reduced disk I/O and improvethe performance of iterative queries even further. In summary, thekey takeaways from our analysis and evaluation in this paper are:Graph analytics can be expressed and tuned in RDBMSs. Re-lational databases are general purpose data processing systems andgraph operations can be expressed as relational operators in a re-lational database. Furthermore, relational databases can be effec-tively tuned to offer good performance on graph queries, yieldingperformance that is competitve with dedicated graph stores.Column-oriented databases excel at graph analytics. We showedthat column-oriented databases like Vertica can have comparable orbetter performance than popular graph processing systems (specif-ically, Giraph) on a variety of graph analytics. This is becausethese queries typically involves full scans, joins, and aggregatesover large tables, for which Vertica is heavily optimized. These op-timizations include efficient physical data representation (columnarlayout, compression, sorting, segmentation), pipelined query exe-cution, and an optimizer to automatically pick the best physicalplan.The RDBMS advantage: Graph + Relational Analysis. Apartfrom outperforming graph processing systems on graph analysis,the real advantage of relational databases is the ability to com-bine graph analysis with relational analysis. This is because graphanalysis is typically accompanied by relational analysis, either as apreparatory step or as a final reporting step. Such relational anal-ysis is either impossible or highly inefficient in graph processingsystems, while is natural to express in relational databases.Some graph queries are difficult to express in vertex-centricgraph systems. We showed that the vertex-centric programmingmodel is a poor fit for several complex graph analyses. In particu-lar, it is very difficult to program and run graph analysis involving1-hop neighborhoods on vertex-centric systems. This is becausethe scope of vertex-centric computations is restricted to a vertexand its immediate neighbors. In contrast, RDBMSs do not have
such limitations and can efficiently execute 1-hop neighborhoodcomputations.RDBMSs are a box full of goodies. Relational databases comewith many features that are not present (yet) in the next generationof graph processing systems. These include update handling, trans-actions, checkpointing and recovery, fault tolerance, durability, in-tegrity constraints, type checking, ACID etc. Current-generationgraph processing systems simply do not come with this rich set offeatures. One might think of stitching multiple systems togetherand coordinating between them to achieve these features, e.g. us-ing HBase for transactions and Giraph for analytics, but then wehave the additional overhead of stitching these systems together.Of course, with time, graph-engines may evolve these features, butour results suggest that these graph systems should be layered onRDBMS, not built outside of them, which would enable them toinherit these features for free without giving up performance. Fur-thermore, in many scenarios, the raw data for the graphs is main-tained in a relational database in the first place. In such situations,it would make sense to be able to perform graph analytics withinthe same data management system.7. REFERENCES[1] G. Malewicz, M. H. Austern et al., “Pregel: A System for
Large-Scale Graph Processing,” SIGMOD, 2010.[2] “Apache Giraph,” http://giraph.apache.org.[3] Y. Low, J. Gonzalez et al., “Distributed GraphLab: A Framework for
Machine Learning and Data Mining in the Cloud,” PVLDB, 2012.[4] B. Shao, H. Wang, and Y. Li, “Trinity: A Distributed Graph Engine
on a Memory Cloud,” SIGMOD, 2013.[5] “Pregelix,” http://hyracks.org/projects/pregelix.[6] A. Welc, R. Raman et al., “Graph Analysis Do We Have to Reinvent
the Wheel?” GRADES, 2013.[7] “Counting Triangles with Vertica,”
vertica.com/2011/09/21/counting-triangles.[8] J. Huang, K. Venkatraman, and D. J. Abadi, “Query Optimization of
Distributed Pattern Matching,” ICDE, 2014.[9] A. Jindal, “Benchmarking Graph Databases,” http://istc-bigdata.org
/index.php/benchmarking-graph-databases, 2013.[10] S. Salihoglu et al., “GPS: A Graph Processing System,” SSDBM,
2013.[11] G. Wang, W. Xie et al., “Asynchronous Large-Scale Graph
Processing Made Easy,” CIDR, 2013.[12] J. Dittrich and al., “Hadoop++: Making a Yellow Elephant Run Like
a Cheetah (Without It Even Noticing),” PVLDB, vol. 3, no. 1, 2010.[13] “Physical Design Automation in Vertica,” www.vertica.com
/2014/07/21/physical-design-automation-in-the-hp-vertica-analytic-database.
[14] A. Lamb, M. Fuller et al., “The Vertica Analytic Database: C-store 7Years Later,” PVLDB, vol. 5, no. 12, 2012.
[15] U. Kang et al., “PEGASUS: A Peta-Scale Graph Mining System -Implementation and Observations,” ICDM, 2009.
[16] “Apache Jena,” http://jena.apache.org.[17] “AllegroGraph,” http://franz.com/agraph/allegrograph.[18] “Neo4j,” http://www.neo4j.org.[19] “HyperGraphDB,” http://www.hypergraphdb.org.[20] N. Bronson, Z. Amsden et al., “TAO: Facebook’s Distributed Data
Store for the Social Graph,” USENIX ATC, 2013.[21] “FlockDB,” http://github.com/twitter/flockdb.[22] J. E. Gonzalez, Y. Low et al., “PowerGraph: Distributed
Graph-Parallel Computation on Natural Graphs,” OSDI, 2012.[23] A. Kyrola, G. Blelloch, and C. Guestrin, “GraphChi: Large-Scale
Graph Computation on Just a PC,” OSDI, 2012.[24] C. Xie, R. Chen et al., “SYNC or ASYNC: Time to Fuse for
Distributed Graph-parallel Computation,” PPoPP, 2014.[25] W. Xie, G. Wang et al., “Fast Iterative Graph Computation with
Block Updates,” PVLDB, vol. 6, no. 14, pp. 2014–2025, 2013.[26] Y. Tian, A. Balmin et al., “From ”Think Like a Vertex” to ”Think
Like a Graph”,” PVLDB, vol. 7, no. 3, pp. 193–204, 2013.
12
[27] A. Quamar, A. Deshpande, and J. Lin, “NScale:Neighborhood-centric Large-Scale Graph Analytics in the Cloud,”arxiv.org/abs/1405.1499.
[28] ——, “NScale: Neighborhood-centric Analytics on Large Graphs,”VLDB, 2014.
[29] M. S. Lam, S. Guo, and J. Seo, “SociaLite: Datalog Extensions forEfficient Social Network Analysis,” ICDE, 2013.
[30] J. Seo, J. Park et al., “Distributed SociaLite: A Datalog-BasedLanguage for Large-Scale Graph Analysis,” VLDB, 2013.
[31] W. E. Moustafa, H. Miao et al., “A System for Declarative andInteractive Analysis of Noisy Information Networks,” SIGMOD,2013.
[32] W. E. Moustafa, G. Namata et al., “Declarative Analysis of NoisyInformation Networks,” GDM, 2011.
[33] S. Sakr, S. Elnikety, and Y. He, “G-SPARQL: A Hybrid Engine forQuerying Large Attributed Graphs,” CIKM, 2012.
[34] J. Gao, R. Jin et al., “Relational Approach for Shortest PathDiscovery over Large Graphs,” PVLDB, vol. 5, no. 4, 2011.
[35] S. Lawande, L. Shrinivas et al., “Scalable Social Graph AnalyticsUsing the Vertica Analytic Platform,” BIRTE, 2011.
[36] R. Angles, A. Prat-Perez et al., “Benchmarking Database Systemsfor Social Network Applications,” GRADES, 2013.
[37] R. S. Xin, J. E. Gonzalez et al., “GraphX: A Resilient DistributedGraph System on Spark,” GRADES, 2013.
[38] A. Jindal, P. Rawlani, and S. Madden, “Vertexica: Your RelationalFriend for Graph Analytics!” VLDB, 2014.
13