Granulation in K-type Dwarf Stars - arXiv · stellar granulation and its impact on the observed...
16
arXiv:0810.5247v1 [astro-ph] 29 Oct 2008 Astronomy & Astrophysics manuscript no. ramirez-p1 c ESO 2018 September 4, 2018 Granulation in K-type Dwarf Stars I. Spectroscopic observations I. Ram´ ırez ⋆ , C. Allende Prieto ⋆⋆ , and D. L. Lambert McDonald Observatory and Department of Astronomy, University of Texas, Austin, TX 78712-0259, USA Received September 4, 2008; accepted October 23, 2008 ABSTRACT Aims. We seek to detect and quantify the effects of surface convection (granulation) on the line spectra of K-dwarfs as a first step towards a rigorous testing of hydrodynamic models for their atmospheres. Methods. Very high resolution (R ≃ 160, 000 − 210, 000), high signal-to-noise ratio (S /N 300) spectra of nine bright K-dwarfs were obtained with the 2dcoud´ e spectrograph on the 2.7 m Telescope at McDonald Observatory to determine wavelength shifts and asymmetries of Fe i lines. Spectra of the same stars acquired with the High Resolution Spectrograph (R ≃ 120, 000) on the 9.2 m Hobby Eberly Telescope were used as radial velocity templates to calibrate the wavelength scale of the 2dcoud´ e spectra. Results. The observed shapes and positions of Fe i lines reveal asymmetries and wavelength shifts that indicate the presence of granulation. In particular, line bisectors show characteristic C-shapes while line core wavelengths are blueshifted by an amount that increases with decreasing equivalent width (EW). On average, Fe i line bisectors have a span that ranges from nearly 0 for the weakest lines (residual core flux 0.7) to about 75 m s −1 for the strongest lines (residual core flux ≃ 0.3) while wavelength shifts range from about −150 m s −1 in the weakest (EW ≃ 10 mÅ) lines to 0 in the strongest (EW 100 mÅ) features. A more detailed inspection of the bisectors and wavelength shifts reveals star-to-star differences that are likely associated with differences in stellar parameters, projected rotational velocity, and stellar activity. While the former two are well understood and confirmed by our data, the relation to stellar activity, which is based on our finding that the largest departures from the expected behavior are seen in the most active stars, requires further investigation. For the inactive, slow projected rotational velocity stars, we detect, unequivocally, a plateau in the line-shifts at large EW values (EW 100 mÅ), a behavior that had been identified before only in the solar spectrum. The detection of this plateau allows us to determine the zero point of the convective blueshifts, which is useful to determine absolute radial velocities. Thus, we are able to measure such velocities with a mean uncertainty of about 60 m s −1 for four of our sample stars. Key words. stars: atmospheres – stars: late-type – techniques: spectroscopic – sun: granulation 1. Introduction The atmospheric structures of cool stars with convective en- velopes are inhomogeneous due to the interplay between the ra- diation field and the thermodynamic properties of the gas. Near the surface, radiation losses and the strong temperature sensitiv- ity of the continuum opacity induce a very steep temperature gra- dient, driving convection. The ascending cells of gas (granules) cool down quickly and the gas falls back into the stellar interior through filamentary structures (intergranular lanes). The down- flows are filamentary due to mass conservation and they pro- duce the buoyancy work necessary to support the upflows (e.g., Stein & Nordlund 1998). This phenomenon, granulation, is di- rectly observed in spatially resolved images and spectrograms of the solar disk. For distant stars, and also for the Sun, the signa- tures of granulation can be detected in their spectra using precise measurements of absorption line profiles (e.g., Gray 1982, 2005; Gray & Toner 1985; Gray & Nagel 1989; Dravins 1987a, 2008; Asplund et al. 2000; Allende Prieto et al. 2002). The high degree of correlation between the intensity and velocity fields in inhomogeneous stellar atmospheres produces asymmetric lines (in particular when the stellar disk is unre- ⋆ Current address: Max Planck Institute for Astrophysics, Postfach 1317, 85741 Garching, Germany ⋆⋆ Current address: Mullard Space Science Laboratory, University College London, Holmbury St. Mary, Dorking, Surrey RH5 6NT, UK solved), with characteristic shapes for the line bisectors (the midpoints of the horizontal segments across the wings of the lines). In addition, the wavelengths of spatially unresolved lines are blueshifted, owing to the larger contribution to the emergent flux from the brighter, hotter ascending gas. These Doppler shifts are often referred to as convective blueshifts. Note, however, that not all lines seen in a stellar spectrum suffer from these effects but only those that are formed in layers that are deep enough into the stellar atmosphere, where the correlation between tempera- ture and velocity fields due to granulation is strong. For example, molecular features, which form in cool high photospheric layers, are not expected to be blueshifted. Hydrodynamic simulations including the effect of the radiation field are necessary to better understand granula- tion. Two-dimensional, as well as three-dimensional radiative- hydrodynamic models have been computed for the Sun (e.g., Nordlund 1982; Steffen & Freytag 1991; Stein & Nordlund 1998; Robinson et al. 2003; V¨ ogler 2004) as well as other stars (e.g., Nordlund & Dravins 1990; Asplund 2005; Collet et al. 2006, 2007; Trampedach 2007). Despite the fact that, due to computational limitations, these models describe only a small, hopefully representative, piece of the stellar envelope and have a limited spatial resolution, they have been remarkably success- ful at reproducing the observed properties of the solar (e.g., Dravins et al. 1981; Steffen & Freytag 1991; Asplund et al. 2000) and stellar granulation (e.g., Dravins & Nordlund 1990;
Transcript of Granulation in K-type Dwarf Stars - arXiv · stellar granulation and its impact on the observed...

arX
iv:0
810.
5247
v1 [
astr
o-ph
] 29
Oct
200
8Astronomy & Astrophysicsmanuscript no. ramirez-p1 c© ESO 2018September 4, 2018
Granulation in K-type Dwarf StarsI. Spectroscopic observations
I. Ramırez⋆, C. Allende Prieto⋆⋆, and D. L. Lambert
McDonald Observatory and Department of Astronomy, University of Texas, Austin, TX 78712-0259, USA
Received September 4, 2008; accepted October 23, 2008
ABSTRACT
Aims. We seek to detect and quantify the effects of surface convection (granulation) on the line spectra of K-dwarfs as a first steptowards a rigorous testing of hydrodynamic models for theiratmospheres.Methods. Very high resolution (R ≃ 160, 000− 210, 000), high signal-to-noise ratio (S/N & 300) spectra of nine bright K-dwarfswere obtained with the 2dcoude spectrograph on the 2.7 m Telescope at McDonald Observatory to determine wavelength shifts andasymmetries of Fei lines. Spectra of the same stars acquired with the High Resolution Spectrograph (R ≃ 120, 000) on the 9.2 mHobby Eberly Telescope were used as radial velocity templates to calibrate the wavelength scale of the 2dcoude spectra.Results. The observed shapes and positions of Fei lines reveal asymmetries and wavelength shifts that indicate the presence ofgranulation. In particular, line bisectors show characteristic C-shapes while line core wavelengths are blueshiftedby an amount thatincreases with decreasing equivalent width (EW). On average, Fei line bisectors have a span that ranges from nearly 0 for the weakestlines (residual core flux& 0.7) to about 75 m s−1 for the strongest lines (residual core flux≃ 0.3) while wavelength shifts range fromabout−150 m s−1 in the weakest (EW ≃ 10 mÅ) lines to 0 in the strongest (EW & 100 mÅ) features. A more detailed inspectionof the bisectors and wavelength shifts reveals star-to-star differences that are likely associated with differences in stellar parameters,projected rotational velocity, and stellar activity. While the former two are well understood and confirmed by our data,the relationto stellar activity, which is based on our finding that the largest departures from the expected behavior are seen in the most activestars, requires further investigation. For the inactive, slow projected rotational velocity stars, we detect, unequivocally, a plateau in theline-shifts at largeEW values (EW & 100 mÅ), a behavior that had been identified before only in thesolar spectrum. The detection ofthis plateau allows us to determine the zero point of the convective blueshifts, which is useful to determine absolute radial velocities.Thus, we are able to measure such velocities with a mean uncertainty of about 60 m s−1 for four of our sample stars.
Key words. stars: atmospheres – stars: late-type – techniques: spectroscopic – sun: granulation
1. Introduction
The atmospheric structures of cool stars with convective en-velopes are inhomogeneous due to the interplay between the ra-diation field and the thermodynamic properties of the gas. Nearthe surface, radiation losses and the strong temperature sensitiv-ity of the continuum opacity induce a very steep temperaturegra-dient, driving convection. The ascending cells of gas (granules)cool down quickly and the gas falls back into the stellar interiorthrough filamentary structures (intergranular lanes). Thedown-flows are filamentary due to mass conservation and they pro-duce the buoyancy work necessary to support the upflows (e.g.,Stein & Nordlund 1998). This phenomenon,granulation, is di-rectly observed in spatially resolved images and spectrograms ofthe solar disk. For distant stars, and also for the Sun, the signa-tures of granulation can be detected in their spectra using precisemeasurements of absorption line profiles (e.g., Gray 1982, 2005;Gray & Toner 1985; Gray & Nagel 1989; Dravins 1987a, 2008;Asplund et al. 2000; Allende Prieto et al. 2002).
The high degree of correlation between the intensity andvelocity fields in inhomogeneous stellar atmospheres producesasymmetric lines (in particular when the stellar disk is unre-
⋆ Current address: Max Planck Institute for Astrophysics, Postfach1317, 85741 Garching, Germany⋆⋆ Current address: Mullard Space Science Laboratory, UniversityCollege London, Holmbury St. Mary, Dorking, Surrey RH5 6NT,UK
solved), with characteristic shapes for theline bisectors (themidpoints of the horizontal segments across the wings of thelines). In addition, the wavelengths of spatially unresolved linesare blueshifted, owing to the larger contribution to the emergentflux from the brighter, hotter ascending gas. These Doppler shiftsare often referred to asconvective blueshifts. Note, however, thatnot all lines seen in a stellar spectrum suffer from these effectsbut only those that are formed in layers that are deep enough intothe stellar atmosphere, where the correlation between tempera-ture and velocity fields due to granulation is strong. For example,molecular features, which form in cool high photospheric layers,are not expected to be blueshifted.
Hydrodynamic simulations including the effect of theradiation field are necessary to better understand granula-tion. Two-dimensional, as well as three-dimensional radiative-hydrodynamic models have been computed for the Sun (e.g.,Nordlund 1982; Steffen & Freytag 1991; Stein & Nordlund1998; Robinson et al. 2003; Vogler 2004) as well as other stars(e.g., Nordlund & Dravins 1990; Asplund 2005; Collet et al.2006, 2007; Trampedach 2007). Despite the fact that, due tocomputational limitations, these models describe only a small,hopefully representative, piece of the stellar envelope and have alimited spatial resolution, they have been remarkably success-ful at reproducing the observed properties of the solar (e.g.,Dravins et al. 1981; Steffen & Freytag 1991; Asplund et al.2000) and stellar granulation (e.g., Dravins & Nordlund 1990;
2 Ramırez et al.: Granulation in K-Dwarfs. I.
Allende Prieto et al. 2002). These theory vs. observation com-parisons, however, have been performed for only a few stars andoften using a limited set of spectral features. Thus, there is an ur-gent need for quantitative testing of the fundamental predictionsof these hydrodynamic simulations in order to better understandstellar granulation and its impact on the observed spectra.
Of particular interest is the impact of granulation on the de-termination of fundamental parameters and chemical composi-tions of stars. With few exceptions, most of these studies use“classical” one-dimensional model atmospheres, which arecal-culated adopting plane parallel geometry, hydrostatic equilib-rium, energy flux conservation, and local thermodynamic equi-librium (LTE), in addition to ignoring the effects of magneticfields, rotation, and chromospheric activity (e.g., Kurucz1979,1993; Gustafsson et al. 1975, 2008). Although state-of-the-arthydrodynamic simulations share with classical models manyofthese basic assumptions, they take into account the atmosphericinhomogeneities associated with the granulation phenomenon.
Spectroscopic studies using classical model atmosphereshave provided a wealth of useful information for general astro-physics and cosmology (see, e.g., the reviews by Wheeler et al.1989 and McWilliam 1997) and it is, therefore, very important tocheck whether the abundances determined using classical meth-ods are self-consistent. Exploring the impact of granulation (alsoreferred to as “3D effects”) on abundances and fundamental pa-rameters derived using classical methods, in particular for K-dwarfs (see below), is therefore crucial to improve our knowl-edge of cosmochemistry.
Since the lifetimes of K-dwarfs (∼ 20 Gyr) are larger thanthe age of the Galaxy (13.73±0.12 Gyr, Hinshaw et al. 2009), noK-dwarf (and, evidently, no other cooler dwarf star) has evolvedoff the main sequence yet. Thus, as opposed to F and early Gmain-sequence stars, samples of K-dwarfs are free from biasesin chemical evolution studies due to stellar death. Although M-dwarf and cooler star samples are also free from these biases,the analysis of their spectra is complicated by the abundanceof molecules and condensates (dust, clouds), uncertain opac-ities and molecular equilibrium calculations, which make themodel atmosphere computation difficult (e.g., Hauschildt et al.1999; Burrows et al. 2006) and the spectroscopic analysis ardu-ous (ill-defined continuum, atomic lines blended with molecularbands). In addition, they are very faint and therefore difficult toobserve at high resolution and signal-to-noise ratio (S/N) (e.g.,Woolf & Wallerstein 2005; Bean et al. 2006).
K-dwarf spectra are also useful for radial velocity determina-tions due to the large number of spectral lines present. Currently,radial velocity uncertainties of a fraction of 1 km s−1 are consid-ered reasonable for studies of kinematics and stellar abundances.Even with the highestS/N and highest resolving power spec-tra, these uncertainties cannot be reduced, in an absolute sense,below a level of a few hundreds of meters per second due tosystematic errors. One of these is the relativistic gravitationalredshift, which can be, however, reasonably well estimatedfromstellar mass and radius determinations, at least for nearbystars(e.g., Dravins et al. 1999). The other important source of uncer-tainty is due to granulation.
Typically, granulation effects introduce a radial velocity un-certainty on the order of several hundreds of meters per second,an error that depends on the lines used, given that wavelengthshifts depend on the properties of the spectral line, in partic-ular line strength. If both gravitational redshift and convectiveblueshift are properly taken into account, the uncertaintyin theabsolute radial velocity of the standard stars, some of which are
K-dwarfs (e.g., Stefanik et al. 1999), could be reduced dramati-cally to only a few tens of meters per second.
Standard stars with very accurate absolute radial velocitiescan be crucial for the interpretation of data from massive kine-matic (and abundance) surveys such as RAVE (Steinmetz et al.2006), GAIA (e.g., Perryman 2005), APOGEE (Majewski et al.2007), and SDSS/SEGUE (Re Fiorentin et al. 2007). In partic-ular, constant radial velocity objects can replace comparisonlamps as wavelength calibrators, if needed (for example, this hasbeen proposed for the GAIA mission, where the observations ofa group of “well-behaved” stars will be used to self-calibrateits very stable spectrograph; Katz et al. 2004). The determina-tion of accurate radial velocities is also important for thede-tection of long term variability (e.g., unresolved wide binaries).Furthermore, the elimination of systematic errors from spectro-scopically determined radial velocities is necessary to assess thereliability of non-spectroscopic methods of radial velocity de-termination, such as those involving astrometric measurements,for example via secular parallax/proper motion variations or thevarying extent of moving clusters (Dravins et al. 1999). Whilethese techniques were envisioned as early as the 1900’s, theirapplicability has been limited by the accuracy of the astromet-ric data. Currently, for example withHipparcos (Perryman et al.1997) data, only the moving cluster method can in somecases achieve accuracies below 1 km s−1 (Lindegren et al. 2000;Madsen et al. 2002) but the advent of future space astrometrymissions (in particular GAIA), which will improve the accuracyof stellar parallaxes and proper motions by at least two orders ofmagnitude, guarantees that these techniques will become verypowerful and the results widely used.
In this series of papers, we perform a detailed study of gran-ulation in K-dwarfs and explore its impact on the observed spec-tra, in particular line shapes and wavelength shifts, as well asspectroscopic abundances and fundamental parameters. In thispaper (Paper I), we look for the basic signatures of granula-tion on very high quality spectra of a small sample of K-dwarfs.Paper II (Ramırez et al. 2009a) deals with hydrodynamic sim-ulations of K-dwarf envelopes, and in Paper III (Ramırez etal.2009b) we explore the impact of 3D effects on the determinationof stellar abundances and fundamental parameters.
The data acquisition and processing are described in de-tail in this paper. Therefore, some sections are more relevant toPaper II or Paper III than to this paper. For example, the discus-sion about continuum normalization (Sect. 3.4) will be importantfor our study of 3D effects on spectroscopic abundance determi-nations in Paper III while the details about the instrumental pro-file (Sect. 3.5) will be crucial for our comparison of predicted toobserved line profiles in Paper II.
2. Detection of granulation signatures in K-dwarfspectra
At least 5 independent points across a spectral line are re-quired to define its bisector (e.g., Dravins 1987b). Thus, for typ-ical strong lines in K-dwarf spectra with a full width of about10 km s−1, we need at least 2 km s−1 resolution, orR = λ/∆λ =150, 000. In practice, however, the feasibility of measuring linebisectors also depends on the magnitude of the granulation ef-fects and the level of noise. In K-dwarfs, granulation effectsare very small, on the order of tens to a few hundreds of me-ters per second. Numerical tests show that only at very highresolving power (R & 150, 000) and high signal-to-noise ratio(S/N & 1, 000) the line bisectors associated with granulation are
Ramırez et al.: Granulation in K-Dwarfs. I. 3
well defined. To reach such highS/N, however, very long ex-posure times are required for typical K-dwarfs (even the bright-est, nearest ones), which makes the observations impractical formid-sized telescopes. AtS/N ≃ 300 andR ≃ 200, 000, the linebisectors are noisy, but the overall shapes of the bisectorsdue togranulation are still detectable.
In addition to the limitations due to finiteS/N, line blends,which are particularly important in K-dwarfs, can severelydis-tort the line bisectors. One way to overcome the effect of blendsis to group bisectors of lines of the same species and similarstrength, given that they form in roughly the same photosphericlayers and are, therefore, expected to experience similar granula-tion temperature and velocity fluctuations. In this context, widespectral coverage observations are ideal because they allow us toselect a large number of clean lines from each spectrum.
For the measurement of wavelength shifts, on the otherhand, it is necessary to have, in addition to very well calibratedspectra, accurate laboratory measurements of rest wavelengths.Unfortunately, these are currently at the level of about 75 ms−1
(Sect. 4.2), and our results are therefore subject to these uncer-tainties. The type of study presented here would therefore greatlybenefit from efforts by laboratory physicists to improve thesewavelength measurements.
3. Observations
3.1. Target selection
The Spectroscopic Survey of Stars in the Solar Neighborhood(S4N, Allende Prieto et al. 2004) contains all G and early K-dwarfs (K2V and earlier) within 15 pc. Cooler stars are alsoincluded in the survey but their sampling is not complete.We used this catalog, and the stellar parameters derived there,to select our targets by constraining their effective tempera-tures to the range 4600 K. Teff . 5250 K and metallicities to−0.25. [Fe/H] . +0.25, in addition to their observability fromMcDonald Observatory. Nine K-type dwarf stars were selectedand are listed in Table 1.
We also obtained spectra of Procyon and the day skylight,the latter as a proxy for the solar spectrum, to check the accu-racy of our data reduction procedures, given that these stars havevery high quality spectra available from previous studies (e.g.,Griffin & Griffin 1996; Kurucz et al. 1984). Note, however, thatthe skylight spectrum obtained in this manner may be slightlydifferent than the real solar spectrum because the sky fills thespectrograph slit completely, therefore making the data reduc-tion different from that of a point source, and it is known thataerosol and Rayleigh-Brillouin scattering affect slightly the ob-served line shapes and strengths (Gray et al. 2000).
3.2. Observations and data reduction
The data for our sample stars were acquired in 5 observing runsbetween February 2006 and May 2007. The spectra were ob-tained with the 2dcoude spectrograph (Tull et al. 1995) on the2.7 m Harlan J. Smith Telescope at McDonald Observatory, us-ing the cs21 mode (grating e2, focus f1), which is expected todeliver a spectral resolution ofR ≃ 210, 000 (see, however,Sect. 3.5). In the cs21 mode, a single exposure results in anechelle spectrum of about 20 orders, each of them covering ap-proximately 20 Å. By rotating the spectrograph grating to 7 dif-ferent positions (hereafter referred to as “instrumental setups”),full coverage from 5580 to 7900 Å was achieved.
Previous observational studies of granulation in K-dwarfs(e.g., Dravins 1987a; Gray 1982, 2005) have used very highquality data but with an otherwise limited spectral coverage,sometimes involving the analysis of only one spectral feature.Although the quality of our observations is similar or slightlysuperior to that of these pioneering studies, our wavelength cov-erage surpasses all of them.
A typical single exposure of 20 minutes for aV ≃ 6 star re-sulted inS/N ≃ 100 under good observing conditions. To reachour required signal-to-noise ratio (S/N & 300), several single ex-posures of the same setup were co-added before merging theminto a single spectrum. Sects. 3.3 and 3.4 explain the details ofthe co-adding and merging procedures.
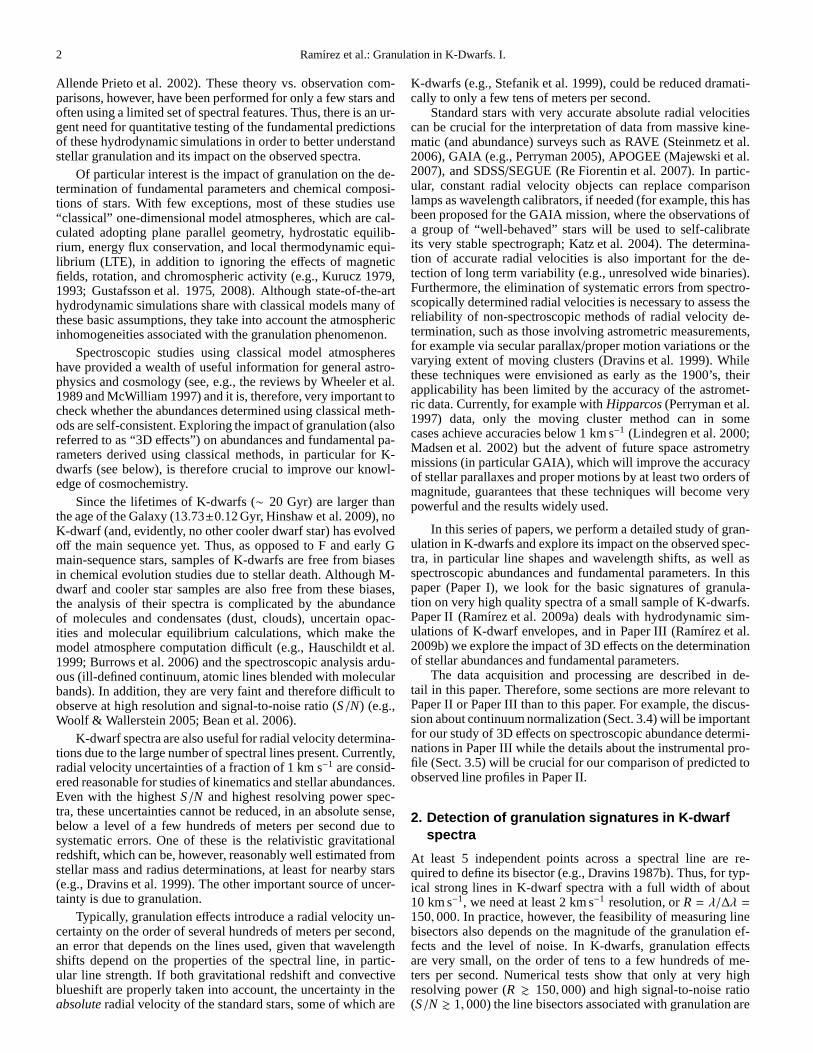
Data reduction (bad pixel removal, overscan correction, flat-fielding, and scattered light correction) was performed using thestandard IRAF1 echelle package. Comparison lamp (ThAr)spectra were obtained approximately every hour to ensure anaccurate wavelength calibration (5× 10⁻⁴ Å of RMS scatter onaverage). Instead of linearizing the wavelength solutions(i.e.,resampling each order to a wavelength scale of constant step),the actual pixel-to-wavelength relations were preserved to mini-mize interpolation errors in the observed counts. Fig. 1 shows anexample of a reduced spectrum.
In addition to the 2dcoude data, we obtained spectra of oursample stars using the High Resolution Spectrograph (HRS; Tull1998; Hill et al. 2006) on the 9.2 m Hobby-Eberly Telescope(HET) for wavelength calibration purposes (details are given inSect. 3.4). This instrument is capable of deliveringR ≃ 120, 000spectra with complete wavelength coverage from 6000 to 7900Å(red chip) and from 4100 to 5900 Å (blue chip) in one single ex-posure. The process of data reduction was similar to that appliedto the 2dcoude data. For these spectra, the accuracy of the wave-length solutions is about 10−3 Å for the red chip and 5× 10⁻⁴ Åfor the blue chip. Exposure times were set to reachS/N ≃ 750 atthe center of the red chip. The procedures described in the nextsection were also applied to these data.
3.3. Shifting and co-adding: increasing the S/N ratios
As explained above, several individual exposures of each setupwere required to reach high signal-to-noise ratios. Co-addingthem is not trivial because even after correcting for the Earth’smotion, wavelength shifts due to the intrinsic radial velocity ofthe star (e.g., due to binarity, variability, and presence of planets)or instrumental and environmental effects (the 2dcoude spectro-graph is not inside a vacuum chamber) are present between expo-sures. These shifts are on the order of tens to hundreds of metersper second and, therefore, of the same magnitude as the effectswe are trying to resolve. Consequently, these shifts must betakeninto account before co-adding in order to keep the spectra usefulfor granulation studies.
We determined radial velocity shifts between pairs of spectraof the same object by cross-correlation in the Fourier space, af-ter rebinning the spectra to have a constant step in logλ. Ordersseverely affected by telluric lines (more than 50% of theλ range)were discarded. Our cross-correlation calculations were madeusing the IDLxc code by Allende Prieto (2007) and not the pop-ular IRAF fxcor task because the latter requires the spectra tobe linearized, a procedure that we avoided (see Sect. 3.2).
1 IRAF is distributed by the National Optical AstronomyObservatories, which are operated by the Association of Universitiesfor Research in Astronomy, Inc., under cooperative agreement with theNational Science Foundation –http://iraf.noao.edu
4 Ramırez et al.: Granulation in K-Dwarfs. I.
HIP V d SpT MV Teff [Fe/H] Notesmag pc mag K dex
37279 0.3 3.50 F5 2.7 6677 +0.08 Procyon,α CMi, HD 61421, HR 2943, GJ 280 A· · · · · · G2 4.8 5777 +0.00 skylight
96100 4.7 5.77 K0 5.9 5218 −0.22 σ Dra, HD 185144, HR 7462, GJ 76426779 6.2 12.24 K1 5.8 5150 +0.11 HD 37394, HR 1925, GJ 21116537 3.7 3.22 K2 6.2 5052 −0.08 ǫ Eri, HD 22049, HR 1084, GJ 14488601 4.0 5.09 K0 5.5 5050 −0.04 70 Oph, HD 165341, HR 6572, GJ 70264797 6.5 11.23 K2 6.0 4915 −0.15 HD 115404, GJ 505 A37349 7.2 14.20 K2 6.4 4889 +0.00 HD 61606, GJ 282 A86400 6.5 10.71 K3 6.4 4833 −0.05 HD 160346, GJ 688
114622 5.6 6.53 K3 6.5 4743 +0.09 HD 219134, HR 8832, GJ 89223311 6.2 8.81 K3 6.5 4641 +0.26 HD 32147, HR 1614, GJ 183
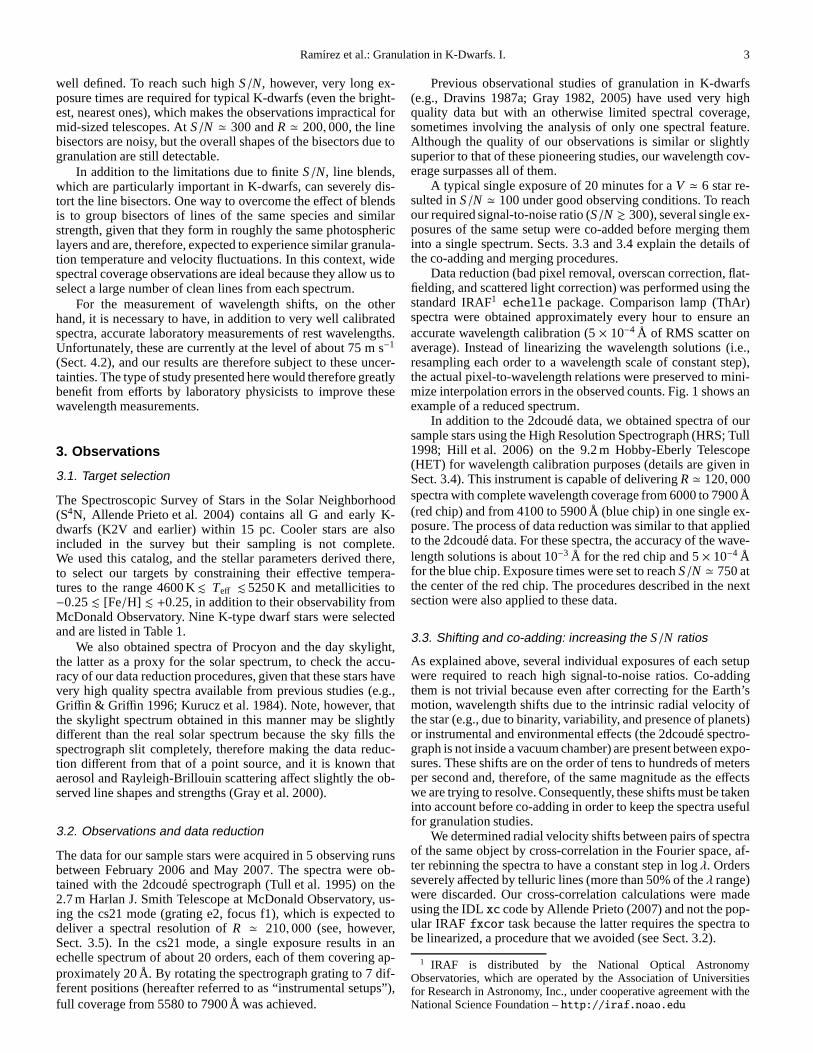
Table 1. Sample observed in this work. Basic data (V, SpT) were obtained from SIMBAD. Distances and absolute magnitudes arebased onHipparcos parallaxes. The atmospheric parametersTeff and [Fe/H] are those determined by Allende Prieto et al. (2004)and have typical uncertainties of about 100 K and 0.1 dex, respectively.
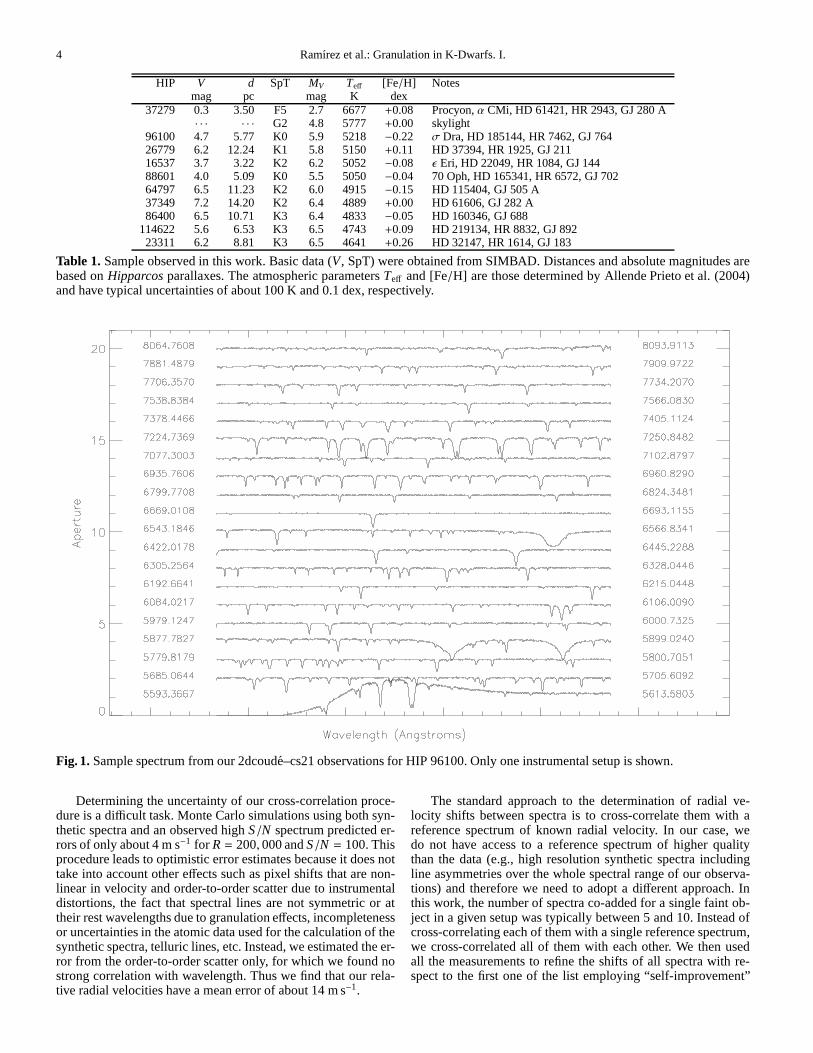
Fig. 1. Sample spectrum from our 2dcoude–cs21 observations for HIP 96100. Only one instrumental setup is shown.
Determining the uncertainty of our cross-correlation proce-dure is a difficult task. Monte Carlo simulations using both syn-thetic spectra and an observed highS/N spectrum predicted er-rors of only about 4 m s−1 for R = 200, 000 andS/N = 100. Thisprocedure leads to optimistic error estimates because it does nottake into account other effects such as pixel shifts that are non-linear in velocity and order-to-order scatter due to instrumentaldistortions, the fact that spectral lines are not symmetricor attheir rest wavelengths due to granulation effects, incompletenessor uncertainties in the atomic data used for the calculationof thesynthetic spectra, telluric lines, etc. Instead, we estimated the er-ror from the order-to-order scatter only, for which we foundnostrong correlation with wavelength. Thus we find that our rela-tive radial velocities have a mean error of about 14 m s−1.
The standard approach to the determination of radial ve-locity shifts between spectra is to cross-correlate them with areference spectrum of known radial velocity. In our case, wedo not have access to a reference spectrum of higher qualitythan the data (e.g., high resolution synthetic spectra includingline asymmetries over the whole spectral range of our observa-tions) and therefore we need to adopt a different approach. Inthis work, the number of spectra co-added for a single faint ob-ject in a given setup was typically between 5 and 10. Instead ofcross-correlating each of them with a single reference spectrum,we cross-correlated all of them with each other. We then usedall the measurements to refine the shifts of all spectra with re-spect to the first one of the list employing “self-improvement”

Ramırez et al.: Granulation in K-Dwarfs. I. 5
(Allende Prieto 2007). Using this technique, the mean errorinthe relative radial velocities was reduced by about 15%.
After correcting for the radial velocity shifts, the spectrawere coadded using an algorithm that minimizes interpolationerrors in the observed fluxes. When coadding, each original pixelhas to be interpolated to some common wavelength scale. Onemay be tempted to use the wavelength solution of one of thespectra and interpolate the rest to that dispersion at the risk ofintroducing large interpolation errors. Instead, we determined,for each set of spectra to be coadded, a wavelength solution suchthat the flux interpolation distances are minimized.
The pixel-to-wavelength relation of the first spectrum wasused as a starting reference. The mean difference between adja-cent pixels,δλ, was then determined. For each pixel in the ref-erence spectrum, we defined a box extending to±δλ/2 aroundits wavelength. Next, we looked at the rest of the spectra andfound all pixels with wavelengths within that box. The averagewavelength of all those pixels was then adopted for that particu-lar position. In this way, the mean interpolation distance was re-duced by a factor of 2, compared to the case in which the spectraare interpolated to the dispersion of the first (or any other ref-erence) spectrum. The interpolation distance for the linear case(i.e., rebinning the spectra to a common constant step disper-sion) is substantially larger (a typical factor of 5 to 10) but, asexplained above, we avoided this type of interpolation.
3.4. Normalization and “merging”
As explained in Sect. 3.1, all of our sample stars are included inthe S4N survey of Allende Prieto et al. (2004), which providesatlases of spectra covering the wavelength range from 362 to921 nm with a resolving powerR ≃ 60, 000. The continuumnormalization of these data is superb; not only were the blazeshapes removed by fitting high order polynomials to the up-per envelopes of the observed fluxes in each order, but also thesmooth variation of the blaze shapes in the direction perpendic-ular to the dispersion was taken into account, thus removingtheinstrumental response with a very careful two-dimensionalmod-eling, as described in Barklem et al. (2002). This normalizationwas essentially inherited by our spectra using the procedure de-scribed below.
Each order of our coadded cs21 spectra (one instrumentalsetup at a time) was divided by its corresponding cs23 piece fromthe S4N data set, after lowering the resolution of the cs21 data tomatch that of the cs23 data, correcting for radial velocity shifts,and rebinning to a common wavelength scale. In principle, theresult should be a smooth function corresponding to the shape ofthe continuum (the upper “envelope”) of the cs21 observations.However, due to the finiteS/N values and temporal variations ofthe strengths of some lines (in particular the telluric ones), thisenvelope had to be smoothed out using a median filter of widthequal to 100 pixels (about 2 Å). The cs21 data were then dividedby this envelope in each order, for each instrumental setup.
The coadded and normalized cs21 data (7 setups for eachobject) were finally merged using an HET spectrum of the sameobject as a radial velocity template. Note that the spectra for eachsetup can have a different radial velocity, since we only removedrelative, and not absolute, Doppler shifts (Sect. 3.3). Therefore,each order of a cs21 setup was cross-correlated with its corre-sponding piece in the HET-HRS spectrum, after lowering theresolution of the former to match theR ∼ 120, 000 of the HRS, todetermine the radial velocity needed to align the cs21 spectrumwith the HET-HRS spectrum, which has a unique wavelength
solution. The robust (iterated and weighted) average shiftof allorders for each setup was adopted to correct the cs21 data, thusremoving inaccurate shifts from orders affected by telluric linesor instrumental defects. In the regions of overlap, a weightedmean for the fluxes was calculated after adopting the commonrobust rebinning explained in Sect. 3.3. Fig. 2 illustratesthis stepof the data processing.
On average, the order-to-order scatter of the radial velocitiesused for the merging of setups was 70 m s−1. This error is largerthan the 12 m s−1 error quoted in Sect. 3.3 for the order-to-orderscatter of the cs21 data alone, in part due to the lower resolvingpower of HRS, but also probably because of distortions in thewavelength-to-pixel mapping of HRS. Note that the regions ofoverlap of the different cs21 setups are small compared to thewavelength coverage of each order. Only within the regions ofoverlap, spectral line shapes are affected by this large mergingerror of 70 m s−1. The majority of spectral lines (approximately80% of them), however, are not in the regions of overlap andthe wavelength mapping within a spectral line is still accurateat the 12 m s−1 level. On the other hand, in the final mergedspectrum, the absolute wavelength scale of all setups and orderscombined is uncertain to about 70 m s−1. This 70 m s−1 uncer-tainty will have an effect on our measurements of wavelengthshifts (Sect. 4.2) but not on the line profiles or their bisectors.
3.5. Resolving power and instrumental profile
To calculate the resolving power of 2dcoude-cs21, we used theThAr exposures. We measured the full width at half maximum(FWHM) of individual Th (fTh) and Ar (fAr) lines using the lineidentifications of Murphy et al. (2007). Note that the Th lines aresharper than the Ar lines due to their different atomic weights,which makes thermal broadening more important for the lat-ter. The thermal broadening (σ) is inversely proportional to thesquare root of the atomic weightA; thus
σTh
σAr=
(
AAr
ATh
)1/2
= 0.415. (1)
If the instrumental FWHM isf , then
f 2 + σ2Th = f 2
Th (2)
f 2 + σ2Ar = f 2
Ar (3)
from which we obtain an expression for the instrumental FWHMthat is independent of temperature:
f 2 =f 2Th − 0.17f 2
Ar
0.83. (4)
The resolving power is thenλ/ f .The measured FWHM values were found to vary signifi-
cantly with time, even within a given run of a few days. Fromone run to another (months apart), the change in the averageFWHM values was significant, as shown in the upper panel ofFig. 3. Temperature broadening effects alone cannot explain thediversity of values seen in Fig. 3 given that less than 5% of thebroadening of Th lines is thermal (see lower panel of Fig. 3).Considering changes of 10% in the temperature of the ThArlamp (which was actually well controlled), the total broadeningwould be affected by only 0.05×
√0.1=1.6% or less, yet in Fig. 3
(upper panel) we see variations of up to 20%. The minimum andmaximum values of the resolving power of our observations areabout 160,000 and 210,000, respectively.

6 Ramırez et al.: Granulation in K-Dwarfs. I.
Fig. 2. Merging of spectra from different instrumental setups (P1-7). Only one order per setup is shown here; note that each setuphas about 20 orders in different wavelength regions (see Fig. 1). The fluxes have been shifted arbitrarily in the vertical direction forclarity. The cs21 pieces (P1-7) have been aligned with the HET+HRS spectrum by means of cross-correlation and are ready to bemerged.
Fig. 3. Upper panel: Average FWHM of the instrumental profilefor each of our observing runs. The 2dcoude spectrograph (cs21mode) is expected to deliverf ≃ 1.4 km s−1 at all times; thedifferences shown here reveal that the spectrograph has sufferedfrom focus degradation. Lower panel: Average ratio of instru-mental to Th line FWHM values for each of our observing runs.The constancy of this ratio suggests that the differences seen inthe upper panel of this figure are not related to temperature ef-fects on the ThAr lamp.
Note that in Eqs. 2 and 3, as well as in the discussion givenabove, it was assumed that the instrumental profile of the spec-trograph was Gaussian. Although the actual ThAr line profiles
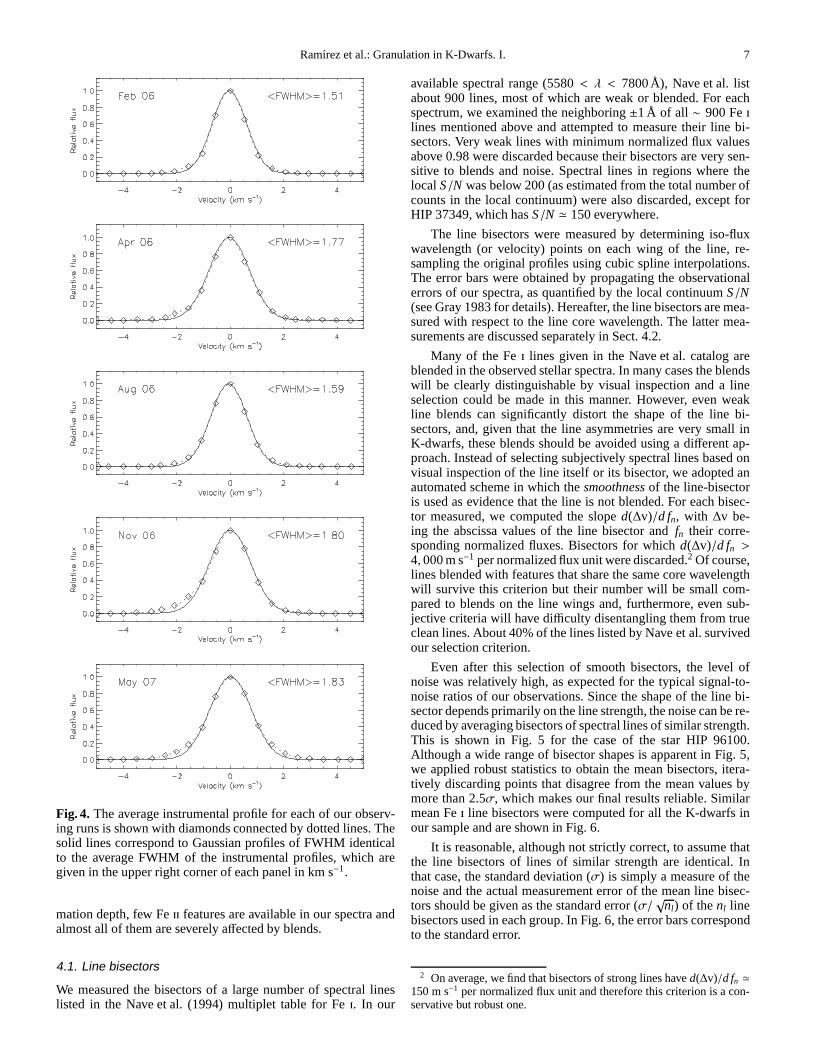
are slightly asymmetric, Gaussian fits made reasonably goodap-proximations, as shown in Fig. 4, where theaverage Th line pro-files for each observing run are shown. They were obtained fromthe individual Th line profiles, normalized to 1 at their maxi-mum before averaging in bins of 0.5 km s−1, which correspondsto about one-third of the width of the resolution element. The de-parture from Gaussianity of the real instrumental profile shownin Fig. 4 is very small. The most prominent non-Gaussian fea-ture is observed on the blue wing of the instrumental profile (near−2 km s−1) and it amounts to less than 10 %. In fact, when theinstrumental profile was sharpest (in February 2006), the maxi-mum difference between the real profile and the Gaussian profilewas only about 5%. A similar bump on the red wing is observedonly for the May 2007 observations, which correspond to themost degraded (wider) instrumental profile of our observations.This information will be crucial for the comparison of observedline profiles with those predicted by hydrodynamic model atmo-spheres in Paper II.
4. Measurement of the granulation signatures
The spectra of K-dwarfs, in particular those with near solarandsuper-solar metallicities, are very rich in absorption lines. Forspectroscopic studies of granulation, iron is an ideal element; ithas a large atomic mass, which implies low thermal broaden-ing and therefore a high sensitivity to non-thermal fields, oneisotope is much more abundant than the others, thus reducingthe impact of asymmetries due to fine structure, it is abundant,and its atomic structure is very complex, allowing a very largenumber of transitions. Furthermore, contrary to most otherheavyelements, reliable laboratory data are available for iron.In thispaper, we deal with the detection of the granulation signaturesusing Fei lines exclusively. Although the granulation effects areexpected to be stronger in Feii lines owing to their larger for-
Ramırez et al.: Granulation in K-Dwarfs. I. 7
Fig. 4. The average instrumental profile for each of our observ-ing runs is shown with diamonds connected by dotted lines. Thesolid lines correspond to Gaussian profiles of FWHM identicalto the average FWHM of the instrumental profiles, which aregiven in the upper right corner of each panel in km s−1.
mation depth, few Feii features are available in our spectra andalmost all of them are severely affected by blends.
4.1. Line bisectors
We measured the bisectors of a large number of spectral lineslisted in the Nave et al. (1994) multiplet table for Fei. In our
available spectral range (5580< λ < 7800 Å), Nave et al. listabout 900 lines, most of which are weak or blended. For eachspectrum, we examined the neighboring±1 Å of all ∼ 900 Feilines mentioned above and attempted to measure their line bi-sectors. Very weak lines with minimum normalized flux valuesabove 0.98 were discarded because their bisectors are very sen-sitive to blends and noise. Spectral lines in regions where thelocalS/N was below 200 (as estimated from the total number ofcounts in the local continuum) were also discarded, except forHIP 37349, which hasS/N ≃ 150 everywhere.
The line bisectors were measured by determining iso-fluxwavelength (or velocity) points on each wing of the line, re-sampling the original profiles using cubic spline interpolations.The error bars were obtained by propagating the observationalerrors of our spectra, as quantified by the local continuumS/N(see Gray 1983 for details). Hereafter, the line bisectors are mea-sured with respect to the line core wavelength. The latter mea-surements are discussed separately in Sect. 4.2.
Many of the Fei lines given in the Nave et al. catalog areblended in the observed stellar spectra. In many cases the blendswill be clearly distinguishable by visual inspection and a lineselection could be made in this manner. However, even weakline blends can significantly distort the shape of the line bi-sectors, and, given that the line asymmetries are very smallinK-dwarfs, these blends should be avoided using a different ap-proach. Instead of selecting subjectively spectral lines based onvisual inspection of the line itself or its bisector, we adopted anautomated scheme in which thesmoothness of the line-bisectoris used as evidence that the line is not blended. For each bisec-tor measured, we computed the sloped(∆v)/d fn, with ∆v be-ing the abscissa values of the line bisector andfn their corre-sponding normalized fluxes. Bisectors for whichd(∆v)/d fn >4, 000 m s−1 per normalized flux unit were discarded.2 Of course,lines blended with features that share the same core wavelengthwill survive this criterion but their number will be small com-pared to blends on the line wings and, furthermore, even sub-jective criteria will have difficulty disentangling them from trueclean lines. About 40% of the lines listed by Nave et al. survivedour selection criterion.
Even after this selection of smooth bisectors, the level ofnoise was relatively high, as expected for the typical signal-to-noise ratios of our observations. Since the shape of the linebi-sector depends primarily on the line strength, the noise canbe re-duced by averaging bisectors of spectral lines of similar strength.This is shown in Fig. 5 for the case of the star HIP 96100.Although a wide range of bisector shapes is apparent in Fig. 5,we applied robust statistics to obtain the mean bisectors, itera-tively discarding points that disagree from the mean valuesbymore than 2.5σ, which makes our final results reliable. Similarmean Fei line bisectors were computed for all the K-dwarfs inour sample and are shown in Fig. 6.
It is reasonable, although not strictly correct, to assume thatthe line bisectors of lines of similar strength are identical. Inthat case, the standard deviation (σ) is simply a measure of thenoise and the actual measurement error of the mean line bisec-tors should be given as the standard error (σ/
√nl) of thenl line
bisectors used in each group. In Fig. 6, the error bars correspondto the standard error.
2 On average, we find that bisectors of strong lines haved(∆v)/d fn ≃150 m s−1 per normalized flux unit and therefore this criterion is a con-servative but robust one.

8 Ramırez et al.: Granulation in K-Dwarfs. I.
Fig. 5. Mean bisectors for HIP 96100 (black solid lines with error bars) obtained from individual line bisectors (gray lines). Theerror bars correspond to a 1σ scatter.
The mean line bisectors for HIP 96100 have the largestspan3 among our sample stars. There are three reasons that canexplain this. First, the star has the hottest effective tempera-ture in the sample, second, its metallicity is lower than solar([Fe/H] = −0.22), and, finally, its projected rotational veloc-ity is the lowest among our sample stars (V sini ≃ 0.8 km s−1,see Appendix A). The granulation effects, and in fact the abso-lute magnitude of the inhomogeneities, are predicted to increasewith effective temperature and also with decreasing metallicity,although probably the latter effect is significantly smaller (e.g.,Allende Prieto et al. 1999), while low projected rotationalveloc-ities (V sini < 1 km s−1) do not alter the shape of the line bisec-tors significantly, as will be shown in Paper II. The dependenceon effective temperature has in fact been observed in real stars(e.g., Gray 1992).
In this context, it is interesting to see the case of the nextfew hotter stars, HIP 26779, HIP 16537, HIP 88601, HIP 64797,and HIP 37349, which do not show bisectors with large spans.In fact, in some cases they are smaller than those of the cooleststar in our sample (HIP 23311). The reason for this is probablytheir largeV sini values (approximately between 2 and 3 km s−1,see Appendix A), which reduces the span of the line bisec-tors (Paper II). We note here that the data for HIP 64797 andHIP 37349 are noisier than the average. Most of the observa-tions for HIP 64797 were made under poor weather conditionswhile the spectrum of HIP 37349 has onlyS/N ∼ 150.
In addition to the stellar rotation effect in the 5 stars men-tioned above, it is also interesting to note that they show highlevels of chromospheric activity (with the possible exceptionof HIP 88601), as evidenced by their Caii H and K line pro-files (Appendix B). Chromospheric effects on spectral line for-mation have not yet been studied in enough detail to deter-mine quantitatively their impact on our line bisector measure-ments. Nevertheless, the fact that the signatures of granulationseem to be slightly different in the most active stars of our sam-ple suggests a correlation. An active chromosphere may havean impact on the line shapes and intensities in several ways.Emission may fill the cores of some lines, as it is obvious inthe H and K lines, but it may be also present to a lesser ex-tent in weaker lines. Zeeman splitting could be measurable dueto the presence of strong magnetic fields (e.g., Gray 1984b;Borrero 2008), while magnetic pressure may have an impact onthe photospheric structure. We can conclude that the line bisec-tors are significantly affected by the presence of strong mag-netic fields and/or stellar activity, although the magnitude and
3 We define the “span” as the difference in velocity between the red-dest and bluest points of the line bisector.
Fig. 7. As in Fig. 6 for our observations of the Sun and Procyon.
impact of these effects are largely unknown for stars other thanthe Sun, where this effect has been documented in some detail(e.g., Balasubramaniam 2002; Schlichenmaier et al. 2004).
HIP 86400 is our reference star because it has parametersvery close to those adopted in the calculation of the 3D modelatmosphere that we will study in Paper II. While the mean bisec-tor for the weak lines shows no significant asymmetry (a span ofonly about 15 m s−1 ), the strongest lines show bisectors thatspan about 75 m s−1 on average.
The coolest stars in our sample, HIP 114622 and HIP 23311,both have relatively lowV sini (. 2 km s−1, Appendix A). Theirspectra are richer in spectral lines compared to those of ourothersample stars and this is perhaps the reason why their mean bisec-tors show large deviations from the expected behavior near thecontinuum. In fact, the bisectors approach zero velocity there,which points to the influence of numerous blends randomly dis-tributed on both sides of the spectral lines. Nonetheless, far fromthe continuum, their line bisectors are similar to those of the ref-erence star HIP 86400. Therefore, it is likely that the granulationcontrast does not change significantly in dwarf stars of effectivetemperature between 4600 and 4800 K.
To check that our measurements of line asymmetries are notaffected by observational or data processing artifacts, we ob-tained mean line bisectors in our skylight and Procyon spectraas well (Fig. 7). The mean bisectors of the skylight are much

Ramırez et al.: Granulation in K-Dwarfs. I. 9
Fig. 6. Mean line bisectors for our sample of K-dwarfs, measured with respect to their core wavelengths. Shifts of−200 and−400 m s−1 have been applied to the weaker lines for clarity. The error bars correspond to the standard error of the line-to-linescatter, i.e.,σ/
√nl, whereσ is the standard deviation andnl the number of lines. Bisector points for whichσ > 200 m s−1 have
been discarded (these often appear near the continuum).
larger than those of our reference star. Note, however, thatourskylight observations are significantly different than stellar ones.Solar line bisectors have been determined using the actual so-lar spectrum (e.g., Kurucz et al. 1984) by several authors (e.g.,Dravins et al. 1981; Asplund et al. 2000; Allende Prieto et al.2002), who show that their amplitudes are about twice as largeas those shown in Fig. 7, although this is in part due to the factthat their observations have higher spectral resolution (for ex-ample, the Kurucz et al. atlas has a resolving power of 500,000).The mean bisectors measured in our Procyon spectrum, however,are in excellent agreement with those measured elsewhere (e.g.,Dravins 1987a; Gray 1989; Allende Prieto et al. 2002). Note thatthe metallic lines in the spectrum of this hotter star are, ingen-eral, weaker than those observed in K-dwarfs and, in our spec-tral range, very few strong lines are available. This is the reasonwhy Fig. 7 does not show the strongest mean line bisector forProcyon.
4.2. Wavelength shifts
The second fundamental test of granulation signatures in stel-lar spectra involves measuring core wavelength shifts. A largeconvective blueshift is expected to occur for the weakest lines,which are formed in deep layers and see strong granulation con-trasts, while the cores of strong lines are much less affected giventhat they form in the highest photospheric layers, where thecor-relation between intensity and velocity fields is weak. We shouldtherefore look at the relation between line shift and line strength(quantified, for example, by the line equivalent width) to deter-mine the magnitude of the granulation effects and compare themto the model predictions.
Unfortunately, there are large uncertainties in the determina-tion of the line shifts from our observed spectra, some of whichare independent of the quality of our data. For example, veryac-curate laboratory wavelengths for large numbers of spectral fea-tures are necessary. The catalog by Nave et al. (1994) is perhapsone of the most accurate and complete line lists currently avail-

10 Ramırez et al.: Granulation in K-Dwarfs. I.
Fig. 8. Core wavelength shifts measured in the spectra of our samplestars as a function of line equivalent width (small diamonds).The filled circles with error bars represent average values in bins of equivalent width. The zero point of this relation has been setusing the strongest lines, those that define the plateau.
able for this purpose. Nevertheless, the wavelengths measuredby them, in the best cases, have uncertainties of about 75 m s−1.
We measured the core wavelengths of as many Fei lines aspossible included in the Nave et al. (1994) catalog and restrictedour measurements to those lines that have wavelengths measuredwith uncertainties lower than about 75 m s−1. The core wave-lengths were obtained by fitting fourth order polynomials tothe11 points closest to the flux minimum. A more detailed descrip-tion of the method we adopted to determine core wavelengthsand their errors is given by Allende Prieto et al. (2002).
Since the wavelength shifts in the solar spectrum have beenmeasured with accuracy (e.g., Allende Prieto & Garcıa Lopez1998a) and the convective blueshift vs. equivalent width rela-tion is well defined there, we used our results for the skylightspectrum to perform a line selection. Only those lines for whichthe convective blueshifts were between 2σ of the mean line shiftvs. equivalent width trend were used. Statistically, this selectionreduces the impact of line blends and misidentifications.
Our measured line shifts could be systematically displacedwith respect to their absolute values due to the gravitational red-shift and the uncertainty in the absolute stellar radial velocity.Thus, we adopted an arbitrary zero point using the core wave-
length shifts of the strongest lines. Basically, the mean line shiftof the strongest lines was set to zero (see below for details).
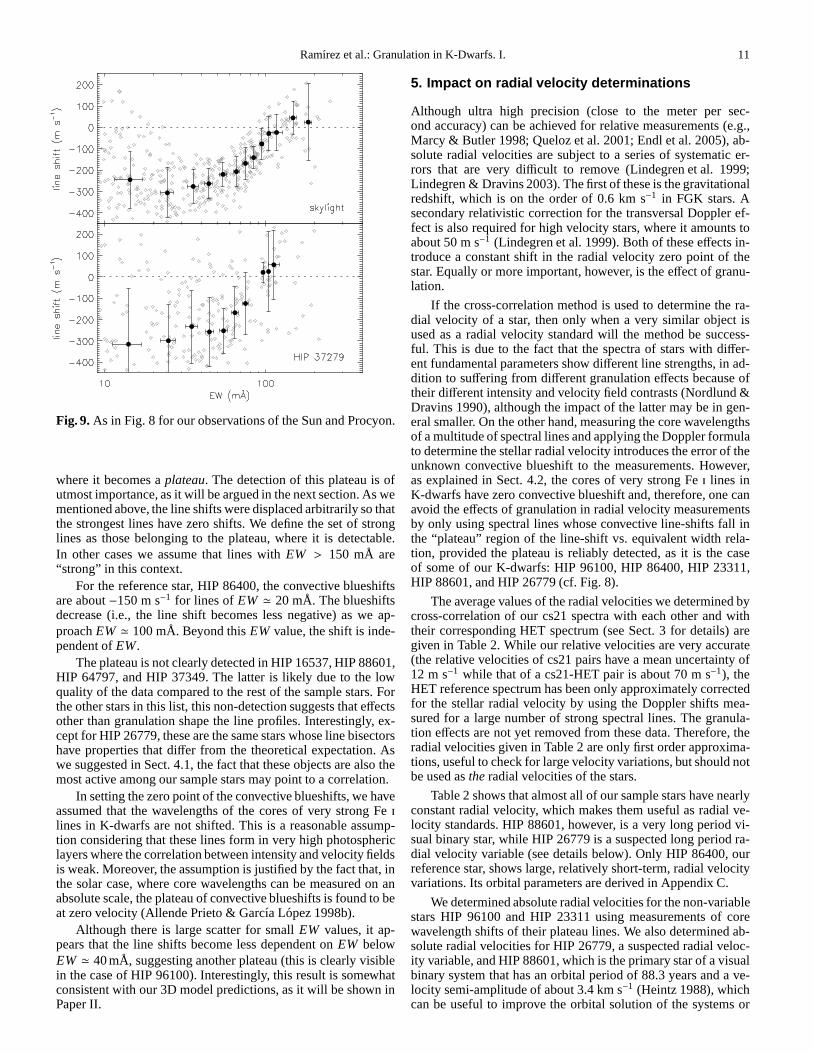
The line shift vs. equivalent width relations for our samplestars are shown in Figs. 8 and 9. In each panel, we show the indi-vidual line shifts as well as averaged values in bins of equivalentwidth (the filled circles with error bars) to allow a better visual-ization given the large scatter observed. The bins have a widthof 10 mÅ belowEW = 100 mÅ and 35 mÅ above it. When thenumber of data points per bin is lower than 3, the bin-averagedvalues are not shown.
The basic signature of granulation is evident in all cases. Thestrongest lines show the smallest blueshifts while weaker linesare significantly blueshifted. Furthermore, the slope in the lineshift vs. equivalent width relation is larger for the skylight com-pared to the K-dwarf observations and even larger for Procyon.Although the scatter for the latter is large and there is not enoughline strength coverage to draw in reasonably well the actualformand zero point of the trend (Fig. 9), this has been established byprevious studies (e.g., Allende Prieto et al. 2002).
In several cases (e.g., HIP 96100, HIP 26779, HIP 86400,HIP 23311) it is clear that the trend is nearly linear for the weaklines but it reaches a saturation point at about 100 mÅ, from
Ramırez et al.: Granulation in K-Dwarfs. I. 11
Fig. 9. As in Fig. 8 for our observations of the Sun and Procyon.
where it becomes aplateau. The detection of this plateau is ofutmost importance, as it will be argued in the next section. As wementioned above, the line shifts were displaced arbitrarily so thatthe strongest lines have zero shifts. We define the set of stronglines as those belonging to the plateau, where it is detectable.In other cases we assume that lines withEW > 150 mÅ are“strong” in this context.
For the reference star, HIP 86400, the convective blueshiftsare about−150 m s−1 for lines ofEW ≃ 20 mÅ. The blueshiftsdecrease (i.e., the line shift becomes less negative) as we ap-proachEW ≃ 100 mÅ. Beyond thisEW value, the shift is inde-pendent ofEW.
The plateau is not clearly detected in HIP 16537, HIP 88601,HIP 64797, and HIP 37349. The latter is likely due to the lowquality of the data compared to the rest of the sample stars. Forthe other stars in this list, this non-detection suggests that effectsother than granulation shape the line profiles. Interestingly, ex-cept for HIP 26779, these are the same stars whose line bisectorshave properties that differ from the theoretical expectation. Aswe suggested in Sect. 4.1, the fact that these objects are also themost active among our sample stars may point to a correlation.
In setting the zero point of the convective blueshifts, we haveassumed that the wavelengths of the cores of very strong Fei
lines in K-dwarfs are not shifted. This is a reasonable assump-tion considering that these lines form in very high photosphericlayers where the correlation between intensity and velocity fieldsis weak. Moreover, the assumption is justified by the fact that, inthe solar case, where core wavelengths can be measured on anabsolute scale, the plateau of convective blueshifts is found to beat zero velocity (Allende Prieto & Garcıa Lopez 1998b).
Although there is large scatter for smallEW values, it ap-pears that the line shifts become less dependent onEW belowEW ≃ 40 mÅ, suggesting another plateau (this is clearly visiblein the case of HIP 96100). Interestingly, this result is somewhatconsistent with our 3D model predictions, as it will be showninPaper II.
5. Impact on radial velocity determinations
Although ultra high precision (close to the meter per sec-ond accuracy) can be achieved for relative measurements (e.g.,Marcy & Butler 1998; Queloz et al. 2001; Endl et al. 2005), ab-solute radial velocities are subject to a series of systematic er-rors that are very difficult to remove (Lindegren et al. 1999;Lindegren & Dravins 2003). The first of these is the gravitationalredshift, which is on the order of 0.6 km s−1 in FGK stars. Asecondary relativistic correction for the transversal Doppler ef-fect is also required for high velocity stars, where it amounts toabout 50 m s−1 (Lindegren et al. 1999). Both of these effects in-troduce a constant shift in the radial velocity zero point ofthestar. Equally or more important, however, is the effect of granu-lation.
If the cross-correlation method is used to determine the ra-dial velocity of a star, then only when a very similar object isused as a radial velocity standard will the method be success-ful. This is due to the fact that the spectra of stars with differ-ent fundamental parameters show different line strengths, in ad-dition to suffering from different granulation effects because oftheir different intensity and velocity field contrasts (Nordlund &Dravins 1990), although the impact of the latter may be in gen-eral smaller. On the other hand, measuring the core wavelengthsof a multitude of spectral lines and applying the Doppler formulato determine the stellar radial velocity introduces the error of theunknown convective blueshift to the measurements. However,as explained in Sect. 4.2, the cores of very strong Fei lines inK-dwarfs have zero convective blueshift and, therefore, one canavoid the effects of granulation in radial velocity measurementsby only using spectral lines whose convective line-shifts fall inthe “plateau” region of the line-shift vs. equivalent widthrela-tion, provided the plateau is reliably detected, as it is thecaseof some of our K-dwarfs: HIP 96100, HIP 86400, HIP 23311,HIP 88601, and HIP 26779 (cf. Fig. 8).
The average values of the radial velocities we determined bycross-correlation of our cs21 spectra with each other and withtheir corresponding HET spectrum (see Sect. 3 for details) aregiven in Table 2. While our relative velocities are very accurate(the relative velocities of cs21 pairs have a mean uncertainty of12 m s−1 while that of a cs21-HET pair is about 70 m s−1), theHET reference spectrum has been only approximately correctedfor the stellar radial velocity by using the Doppler shifts mea-sured for a large number of strong spectral lines. The granula-tion effects are not yet removed from these data. Therefore, theradial velocities given in Table 2 are only first order approxima-tions, useful to check for large velocity variations, but should notbe used asthe radial velocities of the stars.
Table 2 shows that almost all of our sample stars have nearlyconstant radial velocity, which makes them useful as radialve-locity standards. HIP 88601, however, is a very long period vi-sual binary star, while HIP 26779 is a suspected long period ra-dial velocity variable (see details below). Only HIP 86400,ourreference star, shows large, relatively short-term, radial velocityvariations. Its orbital parameters are derived in AppendixC.
We determined absolute radial velocities for the non-variablestars HIP 96100 and HIP 23311 using measurements of corewavelength shifts of their plateau lines. We also determined ab-solute radial velocities for HIP 26779, a suspected radial veloc-ity variable, and HIP 88601, which is the primary star of a visualbinary system that has an orbital period of 88.3 years and a ve-locity semi-amplitude of about 3.4 km s−1 (Heintz 1988), whichcan be useful to improve the orbital solution of the systems or
12 Ramırez et al.: Granulation in K-Dwarfs. I.
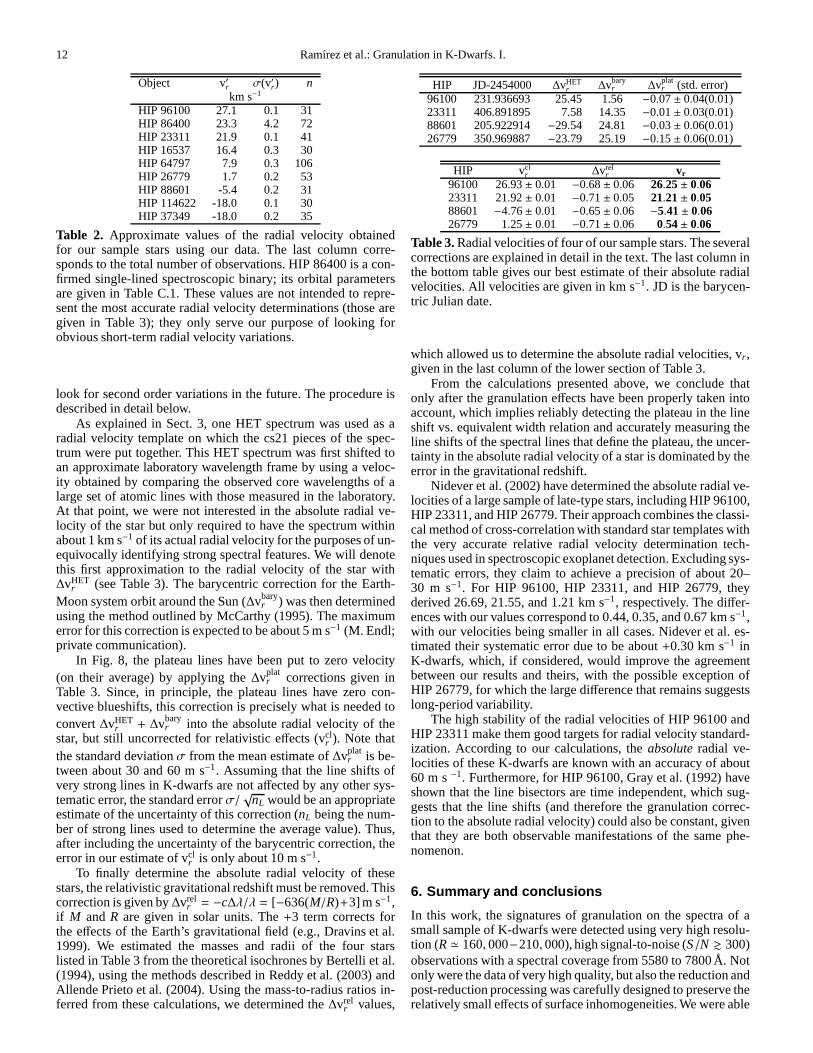
Object v′r σ(v′r) nkm s−1
HIP 96100 27.1 0.1 31HIP 86400 23.3 4.2 72HIP 23311 21.9 0.1 41HIP 16537 16.4 0.3 30HIP 64797 7.9 0.3 106HIP 26779 1.7 0.2 53HIP 88601 -5.4 0.2 31HIP 114622 -18.0 0.1 30HIP 37349 -18.0 0.2 35
Table 2. Approximate values of the radial velocity obtainedfor our sample stars using our data. The last column corre-sponds to the total number of observations. HIP 86400 is a con-firmed single-lined spectroscopic binary; its orbital parametersare given in Table C.1. These values are not intended to repre-sent the most accurate radial velocity determinations (those aregiven in Table 3); they only serve our purpose of looking forobvious short-term radial velocity variations.
look for second order variations in the future. The procedure isdescribed in detail below.
As explained in Sect. 3, one HET spectrum was used as aradial velocity template on which the cs21 pieces of the spec-trum were put together. This HET spectrum was first shifted toan approximate laboratory wavelength frame by using a veloc-ity obtained by comparing the observed core wavelengths of alarge set of atomic lines with those measured in the laboratory.At that point, we were not interested in the absolute radial ve-locity of the star but only required to have the spectrum withinabout 1 km s−1 of its actual radial velocity for the purposes of un-equivocally identifying strong spectral features. We willdenotethis first approximation to the radial velocity of the star with∆vHET
r (see Table 3). The barycentric correction for the Earth-Moon system orbit around the Sun (∆vbary
r ) was then determinedusing the method outlined by McCarthy (1995). The maximumerror for this correction is expected to be about 5 m s−1 (M. Endl;private communication).
In Fig. 8, the plateau lines have been put to zero velocity(on their average) by applying the∆vplat
r corrections given inTable 3. Since, in principle, the plateau lines have zero con-vective blueshifts, this correction is precisely what is needed toconvert∆vHET
r + ∆vbaryr into the absolute radial velocity of the
star, but still uncorrected for relativistic effects (vclr ). Note that
the standard deviationσ from the mean estimate of∆vplatr is be-
tween about 30 and 60 m s−1. Assuming that the line shifts ofvery strong lines in K-dwarfs are not affected by any other sys-tematic error, the standard errorσ/
√nL would be an appropriate
estimate of the uncertainty of this correction (nL being the num-ber of strong lines used to determine the average value). Thus,after including the uncertainty of the barycentric correction, theerror in our estimate of vcl
r is only about 10 m s−1.To finally determine the absolute radial velocity of these
stars, the relativistic gravitational redshift must be removed. Thiscorrection is given by∆vrel
r = −c∆λ/λ = [−636(M/R)+3] m s−1,if M andR are given in solar units. The+3 term corrects forthe effects of the Earth’s gravitational field (e.g., Dravins et al.1999). We estimated the masses and radii of the four starslisted in Table 3 from the theoretical isochrones by Bertelli et al.(1994), using the methods described in Reddy et al. (2003) andAllende Prieto et al. (2004). Using the mass-to-radius ratios in-ferred from these calculations, we determined the∆vrel
r values,
HIP JD-2454000 ∆vHETr ∆vbary
r ∆vplatr (std. error)
96100 231.936693 25.45 1.56 −0.07± 0.04(0.01)23311 406.891895 7.58 14.35−0.01± 0.03(0.01)88601 205.922914 −29.54 24.81 −0.03± 0.06(0.01)26779 350.969887 −23.79 25.19 −0.15± 0.06(0.01)
HIP vclr ∆vrel
r vr
96100 26.93± 0.01 −0.68± 0.06 26.25 ± 0.0623311 21.92± 0.01 −0.71± 0.05 21.21 ± 0.0588601 −4.76± 0.01 −0.65± 0.06 −5.41 ± 0.0626779 1.25± 0.01 −0.71± 0.06 0.54 ± 0.06
Table 3. Radial velocities of four of our sample stars. The severalcorrections are explained in detail in the text. The last column inthe bottom table gives our best estimate of their absolute radialvelocities. All velocities are given in km s−1. JD is the barycen-tric Julian date.
which allowed us to determine the absolute radial velocities, vr,given in the last column of the lower section of Table 3.
From the calculations presented above, we conclude thatonly after the granulation effects have been properly taken intoaccount, which implies reliably detecting the plateau in the lineshift vs. equivalent width relation and accurately measuring theline shifts of the spectral lines that define the plateau, theuncer-tainty in the absolute radial velocity of a star is dominatedby theerror in the gravitational redshift.
Nidever et al. (2002) have determined the absolute radial ve-locities of a large sample of late-type stars, including HIP96100,HIP 23311, and HIP 26779. Their approach combines the classi-cal method of cross-correlation with standard star templates withthe very accurate relative radial velocity determination tech-niques used in spectroscopic exoplanet detection. Excluding sys-tematic errors, they claim to achieve a precision of about 20–30 m s−1. For HIP 96100, HIP 23311, and HIP 26779, theyderived 26.69, 21.55, and 1.21 km s−1, respectively. The differ-ences with our values correspond to 0.44, 0.35, and 0.67 km s−1,with our velocities being smaller in all cases. Nidever et al. es-timated their systematic error due to be about+0.30 km s−1 inK-dwarfs, which, if considered, would improve the agreementbetween our results and theirs, with the possible exceptionofHIP 26779, for which the large difference that remains suggestslong-period variability.
The high stability of the radial velocities of HIP 96100 andHIP 23311 make them good targets for radial velocity standard-ization. According to our calculations, theabsolute radial ve-locities of these K-dwarfs are known with an accuracy of about60 m s−1. Furthermore, for HIP 96100, Gray et al. (1992) haveshown that the line bisectors are time independent, which sug-gests that the line shifts (and therefore the granulation correc-tion to the absolute radial velocity) could also be constant, giventhat they are both observable manifestations of the same phe-nomenon.
6. Summary and conclusions
In this work, the signatures of granulation on the spectra ofasmall sample of K-dwarfs were detected using very high resolu-tion (R ≃ 160, 000−210, 000), high signal-to-noise (S/N & 300)observations with a spectral coverage from 5580 to 7800 Å. Notonly were the data of very high quality, but also the reduction andpost-reduction processing was carefully designed to preserve therelatively small effects of surface inhomogeneities. We were able

Ramırez et al.: Granulation in K-Dwarfs. I. 13
to determine relative radial velocity shifts with a mean accuracyof 12 m s−1 for pairs of spectra of the same object, without re-quiring the spectrograph to be placed in a vacuum chamber or su-perimposing iodine features on the stellar spectra. The accuratedetermination of relative shifts was crucial for coadding multi-ple exposures of the same object to increase the signal-to-noiseratio of the observations while keeping the data useful for thedetection and measurement of the relatively weak granulationsignatures, which require very highS/N. However, we cannotguarantee that these values correspond to the real relativeveloc-ity variations of the stars because of shifts that could havebeenintroduced by instrumental imperfections and/or environmentaleffects (e.g., variations of the air properties in the spectrographroom). In addition, we used a method of coaddition such thatthe interpolation distances in the resampling of frames beforecoadding was reduced by a factor of 2 compared to the standardmethod, thus reducing the impact of interpolation errors.
Using our carefully processed spectra, we measured the bi-sectors of a large number of Fei lines and averaged them out ingroups of similar line-strength to minimize the impact of blendsand noise. The observed mean bisectors show a characteristicC-shape, although for the strongest lines they have a shape thatresembles only the lower part of the letter C (sometimes alsoreferred to as a backslash shape:\), which spans up to about100 m s−1, even though the exact value depends on the particu-lar K-dwarf star under consideration. We find that the stellar pro-jected rotational velocity and activity influence the shapes of theline bisectors, reducing their magnitudes compared to inactivestars with lowV sini values. Although the effect of the projectedrotational velocity is well understood, the details of the depen-dence on stellar activity, which we conclude it exists basedon acorrelation of level of chromospheric emission with line bisectorspan, remain open to investigation.
Core wavelength shifts were also determined for all our K-dwarf sample stars and they were found to show the typicalproperties of stellar granulation; for example, the weakest lines,which are formed in deep regions of the photosphere, where thecorrelation between temperature and velocity fields is stronger,show the largest blueshifts (around−150 m s−1). Furthermore,the blueshifts decrease (i.e., the core wavelength shift, by defi-nition positive for redshift, increases) for stronger lines and, forsome of our sample stars, they appear to reach a constant valuefor Fe i lines stronger thanEW ≃ 100 mÅ. We interpret thisplateau as line formation taking place in high photosphericlay-ers, where the correlation between intensity and velocity fieldsis very weak or null and therefore the convective line shiftsareexpected to be nearly zero. This behavior had been identifiedbe-fore only in the solar spectrum. The detection of a plateau allowsus to determine the zero point of the convective blueshifts,whichis necessary to remove the large uncertainties due to granulationin the determination of absolute stellar radial velocities. In someof our K-dwarfs, the plateau could not be reliably detected,mostlikely due to extrinsic effects such as observational noise, scatterdue to large rotational velocities, or stellar activity.
Thanks to our quantitative understanding of the effects ofgranulation on the core wavelengths of Fei lines in the spectra ofK-dwarfs, we have been able to determine the absolute radialve-locities of two stars that have non-variable radial velocities anda very well defined plateau in the convective blueshift vs. linestrength relation (HIP 96100 and HIP 23311). These extremelyaccurate measurements make these stars, together with the Sunand asteroids with known orbits, the best radial velocity stan-dards available. In addition, we have measured radial velocitieswith similar precision for two stars that show long-term vari-
ability: HIP 88601, which is the primary star of a visual binarysystem, and HIP 26779, a suspected radial velocity variable.
The apparent non-detection of the plateau in other samplestars does not imply that granulation on their surfaces behavesdifferently, given that they suffer from other phenomena that pre-clude detection. Thus, in principle, it is possible to remove theerrors due to granulation on measurements of absolute radial ve-locities of many K-type dwarf stars, which could be extremelyuseful for future massive spectroscopic surveys, where millionsof K-dwarfs can be used to establish an accurate zero point forthe stellar radial velocities.
Acknowledgements. This work was supported in part by the Robert A. WelchFoundation of Houston, Texas. We thank Mike Endl for providing the barycen-tric corrections for the Earth-Moon system used in our determination of abso-lute radial velocities and the anonymous referee for his/her constructive criti-cism. Some of the data used in this work were obtained at the Hobby-EberlyTelescope (HET), which is a joint project of the University of Texas at Austin,the Pennsylvania State University, Stanford University, Ludwig-Maximilians-Universitat Munchen, and Georg-August-Universitat G¨ottingen. The HET isnamed in honor of its principal benefactors, William P. Hobby and RobertE. Eberly. We are indebted to D. Doss as well as the HET and McDonaldObservatory staffs for their support during our observations.
ReferencesAllende Prieto, C. 2007, AJ, 134, 1843Allende Prieto, C., Asplund, M., Garcıa Lopez, R. J., & Lambert, D. L. 2002,
ApJ, 567, 544Allende Prieto, C., Barklem, P. S., Lambert, D. L., & Cunha, K. 2004, A&A,
420, 183Allende Prieto, C. & Garcıa Lopez, R. J. 1998a, A&AS, 131, 431Allende Prieto, C. & Garcıa Lopez, R. J. 1998b, A&AS, 129, 41Allende Prieto, C., Garcıa Lopez, R. J., Lambert, D. L., & Gustafsson, B. 1999,
ApJ, 526, 991Allende Prieto, C., Lambert, D. L., Tull, R. G., & MacQueen, P. J. 2002, ApJ,
566, L93Asplund, M. 2005, ARA&A, 43, 481Asplund, M., Nordlund, Å., Trampedach, R., Allende Prieto,C., & Stein, R. F.
2000, A&A, 359, 729Balasubramaniam, K. S. 2002, ApJ, 575, 553Baraffe, I. & Chabrier, G. 1996, ApJ, 461, L51Barklem, P. S., Stempels, H. C., Allende Prieto, C., et al. 2002, A&A, 385, 951Basri, G., Mohanty, S., Allard, F., et al. 2000, ApJ, 538, 363Bean, J. L., Sneden, C., Hauschildt, P. H., Johns-Krull, C. M., & Benedict, G. F.
2006, ApJ, 652, 1604Beatty, T. G., Fernandez, J. M., Latham, D. W., et al. 2007, ApJ, 663, 573Benz, W. & Mayor, M. 1984, A&A, 138, 183Bertelli, G., Bressan, A., Chiosi, C., Fagotto, F., & Nasi, E. 1994, A&AS, 106,
275Borrero, J. M. 2008, ApJ, 673, 470Burrows, A., Sudarsky, D., & Hubeny, I. 2006, ApJ, 640, 1063Collet, R., Asplund, M., & Trampedach, R. 2006, ApJ, 644, L121Collet, R., Asplund, M., & Trampedach, R. 2007, A&A, 469, 687Dravins, D. 1987a, A&A, 172, 211Dravins, D. 1987b, A&A, 172, 200Dravins, D. 2008, A&A, in press (arXiv/0810.2533)Dravins, D., Gullberg, D., Lindegren, L., & Madsen, S. 1999,in Astronomical
Society of the Pacific Conference Series, Vol. 185, IAU Colloq. 170: PreciseStellar Radial Velocities, ed. J. B. Hearnshaw & C. D. Scarfe, p. 41
Dravins, D., Lindegren, L., & Nordlund, Å. 1981, A&A, 96, 345Dravins, D. & Nordlund, Å. 1990, A&A, 228, 203Endl, M., Cochran, W. D., Hatzes, A. P., & Wittenmyer, R. A. 2005, in Revista
Mexicana de Astronomia y Astrofisica Conference Series, ed.S. Torres-Peimbert & G. MacAlpine, Vol. 23, 64–67
Fekel, F. C. 1997, PASP, 109, 514Gaidos, E. J., Henry, G. W., & Henry, S. M. 2000, AJ, 120, 1006Glebocki, R. & Stawikowski, A. 2000, Acta Astronomica, 50, 509Gray, D. F. 1982, ApJ, 255, 200Gray, D. F. 1983, PASP, 95, 252Gray, D. F. 1984a, ApJ, 281, 719Gray, D. F. 1984b, ApJ, 277, 640Gray, D. F. 1989, PASP, 101, 832Gray, D. F. 1992, The Observation and Analysis of Stellar Photospheres, 2nd ed.
(Cambridge University Press, June 1992)
14 Ramırez et al.: Granulation in K-Dwarfs. I.
Gray, D. F. 2005, PASP, 117, 711Gray, D. F., Baliunas, S. L., Lockwood, G. W., & Skiff, B. A. 1992, ApJ, 400,
681Gray, D. F. & Nagel, T. 1989, ApJ, 341, 421Gray, D. F. & Toner, C. G. 1985, PASP, 97, 543Gray, D. F., Tycner, C., & Brown, K. 2000, PASP, 112, 328Griffin, R. E. & Griffin, R. 1996, VizieR Online Data Catalog, 3169Gustafsson, B., Bell, R. A., Eriksson, K., & Nordlund, Å. 1975, A&A, 42, 407Gustafsson, B., Edvardsson, B., Eriksson, K., et al. 2008, A&A, 486, 951Hale, A. 1994, AJ, 107, 306Hauschildt, P. H., Allard, F., & Baron, E. 1999, ApJ, 512, 377Heintz, W. D. 1988, JRASC, 82, 140Hill, G. J., MacQueen, P. J., Palunas, P., Shetrone, M. D., & Booth, J. A. 2006,
in Proceedings of the SPIE, vol. 6269, eds. McLean, Ian S.; Iye, MasanoriHinshaw, G., Weiland, J. L., Hill, R. S., et al. 2009, ApJS, inpress
(arXiv/0803.0732)Jancart, S., Jorissen, A., Babusiaux, C., & Pourbaix, D. 2005, A&A, 442, 365Jefferys, W. H., Fitzpatrick, M. J., & McArthur, B. E. 1988, Celestial Mechanics,
41, 39Katz, D., Munari, U., Cropper, M., et al. 2004, MNRAS, 354, 1223King, J. R., Villarreal, A. R., Soderblom, D. R., Gulliver, A. F., & Adelman, S. J.
2003, AJ, 125, 1980Kurucz, R. L. 1979, ApJS, 40, 1Kurucz, R. L. 1993, ATLAS9 Stellar Atmosphere Programs and 2km/s
grid. Kurucz CD-ROM No. 13. Cambridge, Mass.: SmithsonianAstrophysical Observatory, 1993., 13
Kurucz, R. L., Furenlid, I., Brault, J., & Testerman, L. 1984, Solar flux atlas from296 to 1300 nm (National Solar Observatory Atlas, Sunspot, New Mexico:National Solar Observatory, 1984)
Lindegren, L. & Dravins, D. 2003, A&A, 401, 1185Lindegren, L., Dravins, D., & Madsen, S. 1999, in Astronomical Society of the
Pacific Conference Series, Vol. 185, IAU Colloq. 170: Precise Stellar RadialVelocities, ed. J. B. Hearnshaw & C. D. Scarfe, 73
Lindegren, L., Madsen, S., & Dravins, D. 2000, A&A, 356, 1119Madsen, S., Dravins, D., & Lindegren, L. 2002, A&A, 381, 446Majewski, S. R., Skrutskie, M. F., Schiavon, R. P., et al. 2007, in American
Astronomical Society Meeting Abstracts, Vol. 211, American AstronomicalSociety Meeting Abstracts, 132.08
Marcy, G. W. & Butler, R. P. 1998, ARA&A, 36, 57McCarthy, C. 1995, Master’s thesis, San Francisco State UniversityMcWilliam, A. 1997, ARA&A, 35, 503Murphy, M. T., Tzanavaris, P., Webb, J. K., & Lovis, C. 2007, MNRAS, 378,
221Nave, G., Johansson, S., Learner, R. C. M., Thorne, A. P., & Brault, J. W. 1994,
ApJS, 94, 221Nidever, D. L., Marcy, G. W., Butler, R. P., Fischer, D. A., & Vogt, S. S. 2002,
ApJS, 141, 503Nordlund, Å. 1982, A&A, 107, 1Nordlund, Å. & Dravins, D. 1990, A&A, 228, 155Noyes, R. W., Hartmann, L. W., Baliunas, S. L., Duncan, D. K.,& Vaughan,
A. H. 1984, ApJ, 279, 763Perryman, M. A. C. 2005, in Astronomical Society of the Pacific Conference
Series, Vol. 338, Astrometry in the Age of the Next Generation of LargeTelescopes, ed. P. K. Seidelmann & A. K. B. Monet, 3
Perryman, M. A. C., Lindegren, L., Kovalevsky, J., et al. 1997, A&A, 323, L49Queloz, D., Mayor, M., Udry, S., et al. 2001, The Messenger, 105, 1Ramırez, I. 2008, PhD thesis, The University of Texas at AustinRamırez, I., Allende Prieto, C., Asplund, M., Koesterke, L., & Lambert, D. L.
2009a, in preparation (Paper II)Ramırez, I., Allende Prieto, C., Asplund, M., Koesterke, L., & Lambert, D. L.
2009b, in preparation (Paper III)Re Fiorentin, P., Bailer-Jones, C. A. L., Lee, Y. S., et al. 2007, A&A, 467, 1373Reddy, B. E., Tomkin, J., Lambert, D. L., & Allende Prieto, C.2003, MNRAS,
340, 304Robinson, F. J., Demarque, P., Li, L. H., et al. 2003, MNRAS, 340, 923Rocha-Pinto, H. J. & Maciel, W. J. 1998, MNRAS, 298, 332Saar, S. H. & Brandenburg, A. 1999, ApJ, 524, 295Saar, S. H. & Donahue, R. A. 1997, ApJ, 485, 319Saar, S. H. & Osten, R. A. 1997, MNRAS, 284, 803Schlichenmaier, R., Bellot Rubio, L. R., & Tritschler, A. 2004, A&A, 415, 731Smith, M. A. 1978, ApJ, 224, 584Smith, M. A. 1983, PASP, 95, 268Stefanik, R. P., Latham, D. W., & Torres, G. 1999, in Astronomical Society of the
Pacific Conference Series, Vol. 185, IAU Colloq. 170: Precise Stellar RadialVelocities, ed. J. B. Hearnshaw & C. D. Scarfe, 354
Steffen, M. & Freytag, B. 1991, in Reviews in Modern Astronomy, Vol. 4,Reviews in Modern Astronomy, ed. G. Klare, 43–60
Stein, R. F. & Nordlund, Å. 1998, ApJ, 499, 914
Steinmetz, M., Zwitter, T., Siebert, A., et al. 2006, AJ, 132, 1645Tokovinin, A. A. 1991, A&AS, 91, 497Tokovinin, A. A. 1992, A&A, 256, 121Trampedach, R. 2007, in American Institute of Physics Conference Series, Vol.
948, American Institute of Physics Conference Series, 141–148Tull, R. G. 1998, in Proc. SPIE Vol. 3355, p. 387-398, OpticalAstronomical
Instrumentation, Sandro D’Odorico; Ed., 387–398Tull, R. G., MacQueen, P. J., Sneden, C., & Lambert, D. L. 1995, PASP, 107,
251Valenti, J. A. & Fischer, D. A. 2005, ApJS, 159, 141Vogler, A. 2004, A&A, 421, 755Wheeler, J. C., Sneden, C., & Truran, Jr., J. W. 1989, ARA&A, 27, 279Woolf, V. M. & Wallerstein, G. 2005, MNRAS, 356, 963
Appendix A: Projected rotational velocities
Most of our sample stars have one or more entriesin The Catalog of Stellar Projected Rotational Velocities(Glebocki & Stawikowski 2000), which is a compilation ofV sini values available in the literature and, therefore, deter-mined using a number of different techniques such as Fouriertransform of line-profile (FTPL), cross-correlation (C-C), cali-brated line-width at half maximum (FWHM), and convolutionwith calculated rotational broadening (Conv). Table A.1 lists thevalues given in this catalog for our sample of K-dwarfs (the orig-inal references are also provided). Entries giving only upper orlower limits as well as very old and uncertain values have beenexcluded. Note that Fekel (1997) calibrated his method usingmeasurements by D. F. Gray and his results are therefore not in-dependent from, for example, those given in Gray (1984a). Inaddition, Fekel’s assumption of a constant macroturbulentve-locity for K-dwarfs makes those results less reliable. TheV sinivalues determined by Valenti & Fischer (2005) are also giveninTable A.1.
By convolving line profiles predicted by a 3D K-dwarfmodel atmosphere with projected rotational velocity profiles,as it will be described in detail in Paper II, we determined amore accurateV sini value for HIP 86400. The result is given inTable A.1. Proper disk integrations were compared against theconvolution method and the line profiles computed with both ap-proaches were found to agree remarkably well (Ramırez 2008,pp. 88–90). We did not perform similar calculations for the othersample stars because the line profiles are very sensitive to thestellar parameters, in particular effective temperature, and onlyHIP 86400 has parameters identical (within observational errors)to those of the 3D model.
Appendix B: Chromospheric activity
Many K-type dwarf stars reveal high levels of chromosphericactivity in the form of emission in the cores of very strong lines(e.g., Noyes et al. 1984). This may have an important impact onthe shapes of spectral lines in general. In Fig. B.1, we showthe spectral region around the Caii H and K lines for all oursample stars except Procyon. The data were acquired from thespectroscopic survey of Allende Prieto et al. (2004) but we havereduced the resolution to aboutR = 8, 000 for clarity in the il-lustration. The chromospheric activity indexR′HK for each star isalso given in Fig. B.1. This information is relevant to the discus-sion presented in Sect. 4.

Ramırez et al.: Granulation in K-Dwarfs. I. 15
Object V sini Technique Reference(km s−1)
HIP 96100 0.6± 0.8 FWHM Fekel (1997)0.8± 0.4 FTLP Gray (1984a)1.4± 0.5 Conv Valenti & Fischer (2005)
HIP 26779 4.0± 0.6 C-C Gaidos et al. (2000)3.3± 0.5 Conv Valenti & Fischer (2005)
HIP 16537 1.5± 2.0 C-C Benz & Mayor (1984)2.0± 0.8 FWHM Fekel (1997)2.2± 0.4 FTLP Gray (1984a)1.7± 0.3 Conv Saar & Osten (1997)1.4± 1.0 Conv Saar & Osten (1997)1.0± 0.5 FTLP Smith (1983)2.5± 1.3 C-C Tokovinin (1992)2.4± 0.5 Conv Valenti & Fischer (2005)
HIP 88601 3.1± 0.8 FWHM Fekel (1997)3.3± 1.0 FTLP Smith (1978)1.6± 0.4 FTLP Gray (1984a)
HIP 64797 3.9± 0.8 FWHM Fekel (1997)2.8± 0.6 Conv Hale (1994)
HIP 37349 2.5± 0.5 Conv Valenti & Fischer (2005)HIP 86400 2.6± 2.0 C-C Benz & Mayor (1984)
1.6± 0.2 Conv* TWHIP 114622 2.1± 0.8 FWHM Fekel (1997)
1.8± 0.5 Conv Valenti & Fischer (2005)HIP 23311 0.8± 0.8 Conv Saar & Osten (1997)
1.4± 1.8 C-C Tokovinin (1992)1.7± 0.5 Conv Valenti & Fischer (2005)
Table A.1. V sini values reported in the literature for our K-dwarf sample stars. The value determined for HIP 86400 inPaper II of this work (TW) is also given.
Appendix C: Orbital solution for the single-linedspectroscopic binary HIP 86400
Combining our radial velocity data with those of Tokovinin(1991), we were able to fit a spectroscopic orbit for the pri-mary star of the HIP 86400 system using the GaussFit package(Jefferys et al. 1988). The resulting orbital parameters are givenin Table C.1 and the model fit to the data is shown in Fig. C.1.
The mass function of the system is 0.00153± 0.00008M⊙,which implies a mass of about 0.42M⊙ for the secondary, as-suming a mass of 0.85M⊙ for the primary (determined fromisochrones) and sini = 0.32 (as measured astrometrically byJancart et al. 2005). This corresponds to an M-dwarf star with aneffective temperature around 3500 K (Baraffe & Chabrier 1996;Basri et al. 2000) whose contribution to the flux is relativelysmall in the visible and near infrared (a secondary spectrumhasnot been detected yet). Using the spectral energy distributionscalculated from Kurucz model atmospheres, we find that the sur-face flux from the M-dwarf in the HIP 86400 system is about 8%of the flux emitted by the K-dwarf in the spectral region of inter-est for this work. Considering that the flux received on Earthisproportional to the angular diameter of the star squared andtheradii of 0.4M⊙ dwarfs are about 0.4R⊙ (Beatty et al. 2007), thecontribution to the flux from the M-dwarf to our observed spec-trum of HIP 86400 is about (0.4/0.8)2×8%= 2 %, given that theradius of the primary, the K-dwarf, is about 0.8R⊙.
Fig. B.1. Medium resolution spectra of our K-dwarfs and the Sunin the region around the Caii H and K lines. The activity indexR′HK is shown in each panel, as given by Saar & Brandenburg(1999), except for the cases marked with the following symbols:[*] =Rocha-Pinto & Maciel (1998), [#]= King et al. (2003), [$]= Saar & Donahue (1997).
Parameter Value UnitsOrbital period (P) 83.713± 0.005 daysTime of periastron passage (T ) 2447723.54± 0.47 JDEccentricity (e) 0.288± 0.012Longitude of periastron (ω) 135.99± 1.97 degreesSemi-amplitude of RV curve (K1) 5.86± 0.10 km s−1
Velocity of the center of mass (γa) 22.095± 0.077 km s−1
Velocity of the center of mass (γb) 21.194± 0.070 km s−1
Mass function (fm) 0.00153± 0.00008 M⊙
Table C.1. Orbital parameters obtained by fitting the radial ve-locity data of HIP 86400. Two values forγ are given; the firstone,γa, corresponds to our observations, whileγb was obtainedfor Tokovinin (1991) data. A systematic difference of about0.9 km s−1, with our velocities being larger, is present betweenthe two data sets. The rest of the parameters were derived usingthe combined data set. The radial velocity curve of HIP 86400isshown in Fig. C.1.
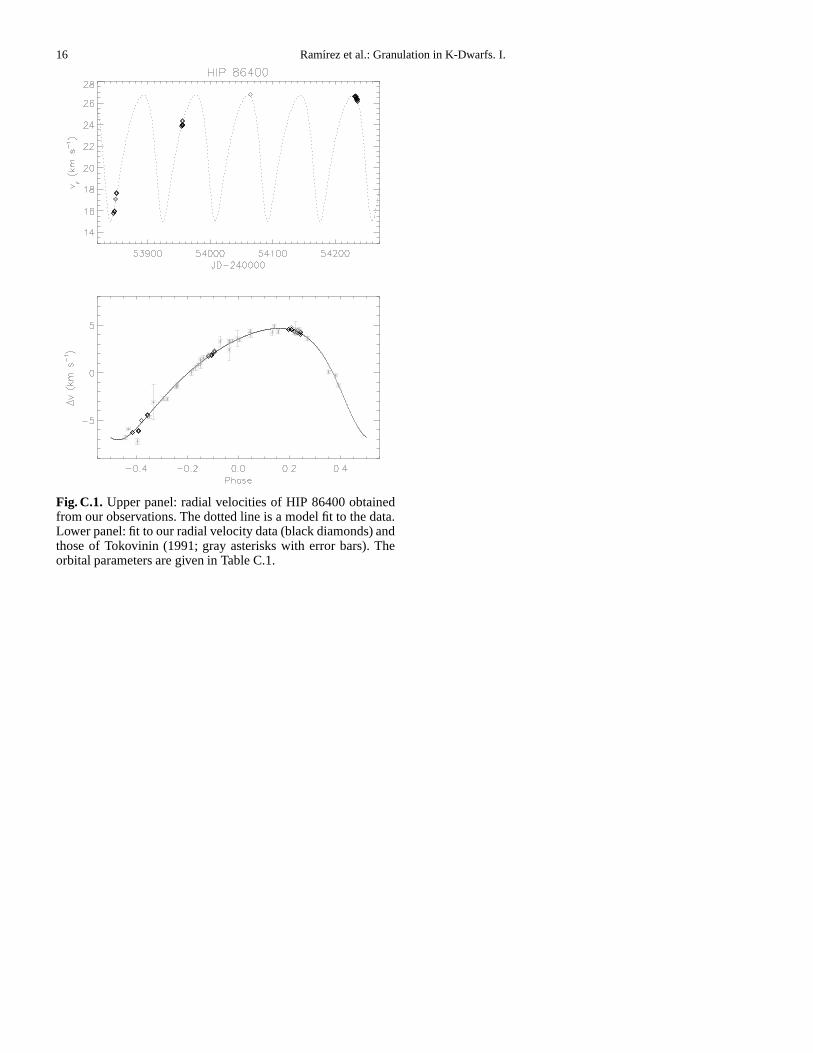
16 Ramırez et al.: Granulation in K-Dwarfs. I.
Fig. C.1. Upper panel: radial velocities of HIP 86400 obtainedfrom our observations. The dotted line is a model fit to the data.Lower panel: fit to our radial velocity data (black diamonds)andthose of Tokovinin (1991; gray asterisks with error bars). Theorbital parameters are given in Table C.1.