Grant agreement no. 667510 GLINT
19
D5.2 Dependence of detection thresholds on administration ways PU Page 1 Version 1.0 “This project has received funding from the European Union’s Horizon 2020 research and innovation programme under the Grant Agreement No 667510“ Grant agreement no. 667510 GLINT Research and Innovation Action H2020-PHC-2015-two-stage D5.2 Dependence of detection thresholds on administration ways Work Package: 5 Due date of deliverable: 31/12/2016 Actual submission date: 01/02/2017 Lead beneficiary: TAU Contributors: UNITO Reviewers: M. Zaiss (MPG), X. Golay (UCL) Project co-funded by the European Commission within the H2020 Programme (2014-2020) Dissemination Level PU Public YES CO Confidential, only for members of the consortium (including the Commission Services) CI Classified, as referred to in Commission Decision 2001/844/EC
Transcript of Grant agreement no. 667510 GLINT

D5.2 Dependence of detection thresholds on administration ways
PU Page 1 Version 1.0
“This project has received funding from the European Union’s Horizon 2020 research and innovation programme under the Grant Agreement No 667510“
Grant agreement no. 667510
GLINT
Research and Innovation Action
H2020-PHC-2015-two-stage
D5.2 Dependence of detection thresholds on administration ways
Work Package: 5
Due date of deliverable: 31/12/2016
Actual submission date: 01/02/2017
Lead beneficiary: TAU
Contributors: UNITO
Reviewers: M. Zaiss (MPG), X. Golay (UCL)
Project co-funded by the European Commission within the H2020 Programme (2014-2020)
Dissemination Level
PU Public YES
CO Confidential, only for members of the consortium (including the Commission Services)
CI Classified, as referred to in Commission Decision 2001/844/EC

D5.2 Dependence of detection thresholds on administration ways
PU Page 2 Version 1.0
“This project has received funding from the European Union’s Horizon 2020 research and innovation programme under the Grant Agreement No 667510“
Disclaimer The content of this deliverable does not reflect the official opinion of the European Union. Responsibility for the information and views expressed herein lies entirely with the author(s).

D5.2 Dependence of detection thresholds on administration ways
PU Page 3 Version 1.0
“This project has received funding from the European Union’s Horizon 2020 research and innovation programme under the Grant Agreement No 667510“
Contents
1 INTRODUCTION ................................................................................................... 4
2 METHODOLOGY AND APPROACH FOR ................................................................... 5
2.1 Glucose and 3OMG preparation ....................................................................... 5
2.2 Tumour- bearing animals .................................................................................. 5
2.2.1 Cell culture .......................................................................................................... 5 2.2.2 Subcutaneous implantation ................................................................................. 5 2.2.3 Orthotropic mammary fat pad implantation .......................................................... 5
2.3 GlucoCEST MRI protocol ................................................................................. 6
2.4 3OMG CEST MRI protocol ............................................................................... 7
3 REPORT ACTIVITIES CARRIED-OUT AND RESULTS .................................................. 9
3.1 Gluco CEST MRI .............................................................................................. 9
3.1.1 Intravenous glucose administration ..................................................................... 9 3.1.2 Oral glucose administration ............................................................................... 10
3.2 3OMG CEST MRI ........................................................................................... 12
4 CONCLUSIONS .................................................................................................. 17
4.1 GlucoCEST .................................................................................................... 17
4.2 3OMG CEST .................................................................................................. 18
5 BIBLIOGRAPHY / REFERENCES ........................................................................... 19

D5.2 Dependence of detection thresholds on administration ways
PU Page 4 Version 1.0
“This project has received funding from the European Union’s Horizon 2020 research and innovation programme under the Grant Agreement No 667510“
1 Introduction
The CEST contrast attainable following glucose or 3OMG administration is dependent on
several conditions, including the injected dose and the administration route. The aim of this
task is to assess the influence of these factors on the detection of the CEST contrast in in vivo
conditions in tumor bearing mice. For this purpose, dose-dependent studies were performed
to determine i) the minimum administered dose and ii) the more favourable administration
route of glucose and 3OMG for different ways of administration.
All the above mentioned factors will provide a detailed description of the GlucoCEST and
3OMG CEST contrast in vivo, allowing a precise characterization of the CEST properties of
the investigated molecules.
D5.2 Dependence of detection thresholds on administration ways
PU Page 5 Version 1.0
“This project has received funding from the European Union’s Horizon 2020 research and innovation programme under the Grant Agreement No 667510“
2 Methodology and Approach for
2.1 Glucose and 3OMG preparation
Glucose solution for both intravenous and oral administration was prepared dissolving D-
glucose (Sigma-Aldrich) in saline solution to obtain a 3 M solution (0.54 g/mL). The solution
was then filtered with a 200 nm membrane filters in order to preserve the suspensions from
bacterial contamination.
3OMG and D-glucose were obtained from Sigma-Aldrich, Israel. Solutions of 3OMG and D-
glucose were prepared in 10 mM phosphate-buffered saline (PBS).
2.2 Tumour- bearing animals
2.2.1 Cell culture
B16-F10 (mouse melanoma cells), 4T1 (mouse mammary cancer cells), MDA-MB-231 and
MCF7 (human mammary cancer cells) were obtained from American Type Culture
Collection (ATCC). B13-F10 cells were cultured in DMEM supplemented with 10% FBS,
100 µg/ml penicillin and 100 /ml streptomycin. 4T1, MDA-MB-231 and MCF7 cells were
cultured in high glucose DMEM supplemented with 10% PBS, 100 µg/ml penicillin, 100
/ml streptomycin, 12.5 /ml nystatin and 2 mM L-glutamine (Sigma, Israel). All the cells
were grown at 37°C in a humidified atmosphere containing 5% CO2.
2.2.2 Subcutaneous implantation
Male C57BL/6 mice (Charles River Laboratories Italia S.r.l., Calco Italia) were maintained
under specific pathogen free conditions in the animal facility of the Molecular Biotechnology
Center, University of Turin, and treated in accordance with the University Ethical Committee
and European guidelines under directive 2010/63. Male C57BL/6 mice were inoculated with
350.000 B16-F10 melanoma cells in both flanks 15 days before imaging acquisitions.
Before imaging, mice were anesthetized by isoflurane, placed on the MRI bed and breath rate
was monitored by an air pillow placed below the animal (SA Instruments, Stony Brook, NY;
USA).For a group of mice the tail vein was cannulated with a catheter to inject glucose
through a 27-gauge needle.
2.2.3 Orthotropic mammary fat pad implantation
BALB/C or nu/nu or severe combined immune deficiency (SCID-ICR) female mice were
purchased and housed in the breeding facility of Tel Aviv University. Orthotropic xenograft

D5.2 Dependence of detection thresholds on administration ways
PU Page 6 Version 1.0
“This project has received funding from the European Union’s Horizon 2020 research and innovation programme under the Grant Agreement No 667510“
tumors were induced in the mice by injecting 4T1 cells or human MDA-MB-231 or MCF7
cells (106/100l cells) into the lower left mammary gland of 6-8-week-old female mice (17–
22 grams, Envigo, Israel) using a 27-gauge needle. The tumors were allowed to grow for 10–
14 days (4T1) or 18 days (MBA-MB-231) or 30 days (MCF7), reaching an average tumor
volume of 5±2 mm3. Mice were imaged by CEST MRI on week 2 (4T1 Model) or 3-5 (MBA-
MB-231 or MCF7 Model) post implantation. All experiments with animal models were
carried out in compliance with the principles of the Israel National Research Council (NRC)
and were approved by Tel Aviv University institutional animal care and use committee
(IACUC) (01-15-057 ; 01-16-005).
2.3 GlucoCEST MRI protocol
MR images were acquired with a Bruker 7T BioSpin MRI GmbH scanner (BrukerBiospin,
Ettlingen, Germany) equipped with a 30mm 1H birdcage coil.
After the scout image acquisition, T2w anatomical images were acquired with a RARE
sequence and the same geometry was used for the following CEST experiments.
The experiments were obtained by irradiating the sample with a single continuous wave
presaturation block pulse of 2μT applied for 5 sec. The saturation frequency offset was varied
between 10 and -10 ppm with a frequency resolution of 0.2 ppm. MR images were acquired
using a Spin Echo RARE sequence (TR/TE/NEX/Rare Factor 6.0 sec/4.7 msec/2/64); centric
encoding, field of view = 3 cm x 3 cm; slice thickness = 2 mm; matrix = 64 x 64.
After one pre contrast images, a group of mice received a bolus injection of ca. 0.12 mL
glucose solution at different doses (3g/Kg n=4, 1.5g/Kg n=4 and 0.75g/Kg n=4) and 5 post
contrast images were acquired. After one hour from the acquisition of the pre contrast
images, the other group of mice received an oral gavage of 0.12 mL glucose solution at
different doses (3g/Kg n=4, 1.5g/Kg n=4 and 0.75g/Kg n=4) and 5 post contrast images were
acquired by imaging the same tumor slice as for the pre-injection image.
All the CEST images were elaborated in MATLAB (The Mathworks, Inc., Natick, MA,
USA) using custom scripts. Anatomical and Z-spectrum images were first segmented by
using an intensity-threshold filter (1). The Z-spectra were interpolated, on a voxel-by-voxel
basis, by smoothing splines (2) to identify the correct position of the bulk water, thus
removing artefacts arising from B0 inhomogeneity. On this basis, the interpolated Z-spectrum
was shifted so that the bulk water resonance corresponds to the zero frequency and corrected

D5.2 Dependence of detection thresholds on administration ways
PU Page 7 Version 1.0
“This project has received funding from the European Union’s Horizon 2020 research and innovation programme under the Grant Agreement No 667510“
intravoxel saturation transfer (ST) effects were calculated. Then, a second filter was applied
to remove CEST effect arising from noisy data, calculating the coefficient of determination
R2 for the interpolating curve to take into account the signal-to-noise ratio of single voxels
(noisy Z-spectra present low R2 values). Only voxels with high R
2 (>0.99) were considered in
the ST% calculation.
The ST effect was estimated from the expression:
𝑆𝑇 =𝑆(−1.2𝑝𝑝𝑚)−𝑆(1.2𝑝𝑝𝑚)
𝑆0 [1]
where S0 was the signal at -10ppm.
Results are reported as:
ΔST % = [(ST effect post acquisition – ST effect pre acquisition) ∗ 100]
Moreover, the ST signal was calculated as the area under the ST curve from 0 to 2.2 ppm
(STint_bulk) (3). In vivo results are reported as:
ΔST intBulk % = [(ST effect post acquisition – ST effect pre acquisition) ∗ 100] [2]
2.4 3OMG CEST MRI protocol
A Bruker 7 Tesla (T) BioSpec scanner with 30 cm bore size was used to scan implanted
xenograft mammary tumors of mice before and after administration (IV, PO or IP) of 3OMG
(dissolved in PBS, physiological pH). Mice bearing 4T1 or MDA-MB-231 or MCF7 tumors,
with an average tumor volume of 2-7 mm3, were fasted for 12 hours (with water access)
prior to the experiments in order to reduce and stabilize blood glucose levels ,anesthetized
with isoflurane (1–2%), and scanned with a volume coil that was used for RF transmission
(without surface coil). Mouse body temperature was monitored and maintained at 37oC.
T2 RARE anatomical images (RARE factor-8, TR-3000ms, TE-11.7ms) were acquired to
identify the slice presenting the maximum tumor size. The CEST images were generated as
follows: a series of T2 RARE images (RARE factor-1, TR-3000 ms, TE-11.7 ms) were
collected from a single 1 mm coronal slice of the abdominal area (acquisition matrix before
zero filling 128X64, field of view of 40X40 mm2) after a 2 s presaturation pulse of B1=2.4 T
at the hydroxyl proton frequency offset of ±1.2 ppm from the water signal. CEST images
were acquired before and for an hour after 3OMG administration. The CEST was measured
by magnetization transfer asymmetry:

D5.2 Dependence of detection thresholds on administration ways
PU Page 8 Version 1.0
“This project has received funding from the European Union’s Horizon 2020 research and innovation programme under the Grant Agreement No 667510“
CEST()=[MSAT(-)-MSAT()]/M0 [3]
The mean intensities in the selected region of interest (ROI) of the tumors were used for the
% CEST plot, based on the T2 weighted images. No corrections for the B0 inhomogeneity
were used in the present work because no significant change was observed after such
corrections in our previous works. The line width of the water peak was approximately 30
Hz.

D5.2 Dependence of detection thresholds on administration ways
PU Page 9 Version 1.0
“This project has received funding from the European Union’s Horizon 2020 research and innovation programme under the Grant Agreement No 667510“
3 Report Activities carried-out and results
3.1 Gluco CEST MRI
In order to determine the minimum injected dose needed to obtain enough GlucoCEST
contrast, mice inoculated with B16-f10 melanoma cells in both flanks underwent glucose i.v.
or gavage administration at 3g/Kg, 1.5g/Kg and 0.75g/Kg dose. Pre and post contrast images
were acquired with a pre-clinical 7T scanner.
3.1.1 Intravenous glucose administration
Figure 1: An anatomical T2 weighted image (before D-glucose administration). b,c:
GlucoCEST map before (b) and ~12 min (c) after i.v. injection of D-glucose, 1.5 g/kg. D,e,
and f: GlucoCEST contrast obtained injecting glucose solution at high (3g/Kg), medium
(1.5g/Kg) and low (0.75g/Kg) dose via intravenous route. Data are reported as the difference
(ΔST %) between the ST effect before and after the intravenous injection. A detection
threshold fixed at 1% is visible as a dashed line.
The bar charts illustrate a glucoCEST contrast that is dose dependent. At high dose of glucose
administration, right after 6 minutes of injection an increase in signal is shown; the
glucoCEST contrast steadily increases reaching a ΔST of 4% after 30 minutes post injection.
At medium dose of glucose administration, the increase in the glucoCEST contrast can be
observed after 12 minutes post injection (higher than the detection threshold fixed at 1%) and
D5.2 Dependence of detection thresholds on administration ways
PU Page 10 Version 1.0
“This project has received funding from the European Union’s Horizon 2020 research and innovation programme under the Grant Agreement No 667510“
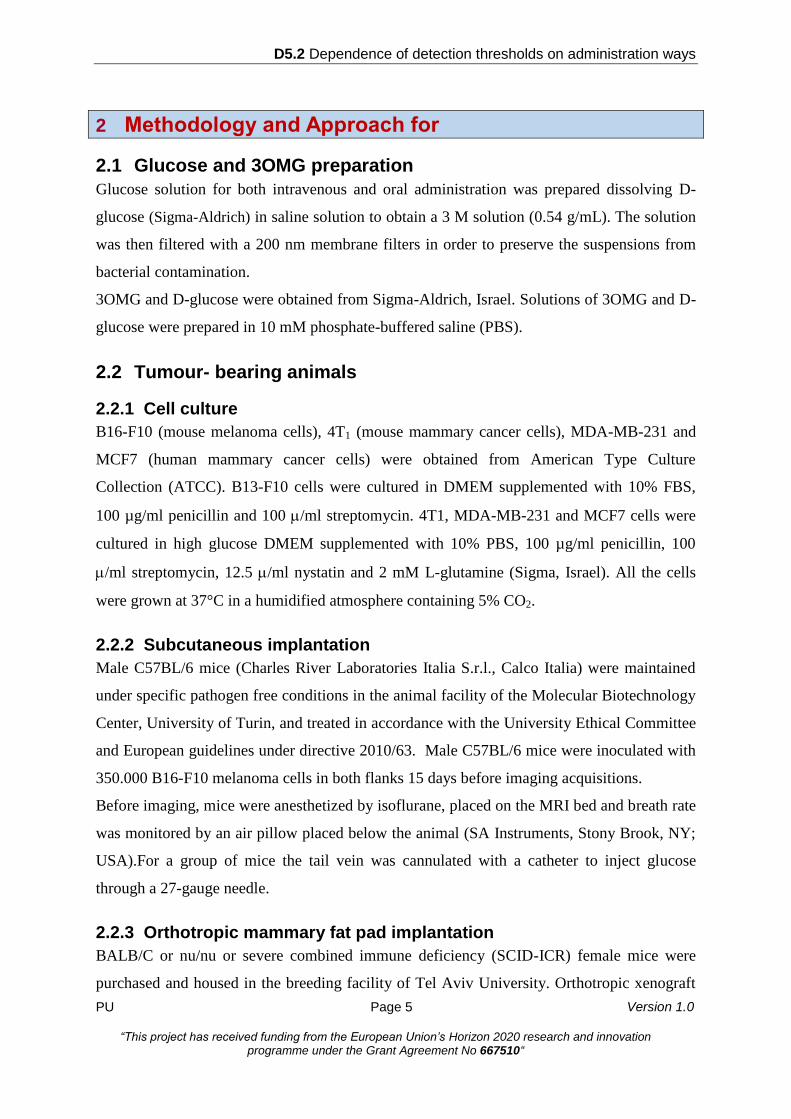
it remain stable at 2% of increase in contrast after 30 minutes of glucose injection. At low
dose of glucose administration, the signal remains lower than the detection threshold fixed at
1% at all the investigated time points.
Figure 2 a,b and c: GlucoCEST contrast obtained injecting glucose solution at high (3g/Kg),
medium (1.5g/Kg) and low (0.75g/Kg) dose via intravenous bolus. Data are reported as the
variation (ΔST intBulk %) between the ST effect percentage post minus pre intravenous
injection calculated as the integral bulk. A detection threshold fixed at 1% is visible as a
dashed line.
The ΔSTint_bulk estimate of GlucoCEST contrast shows a detectable increase of contrast at
1.5% after the administration of only the highest glucose dose. The detected GlucoCEST
contrast remains stable at a value close to 1.5% during the whole acquisition, following a
slight increase from 0.6% up to 1.7% after 12 minutes of injection. At medium and low dose
of glucose i.v. administration the glucoCEST contrast calculated as STint_bulk is below the
fixed threshold up to 30 min post administration.
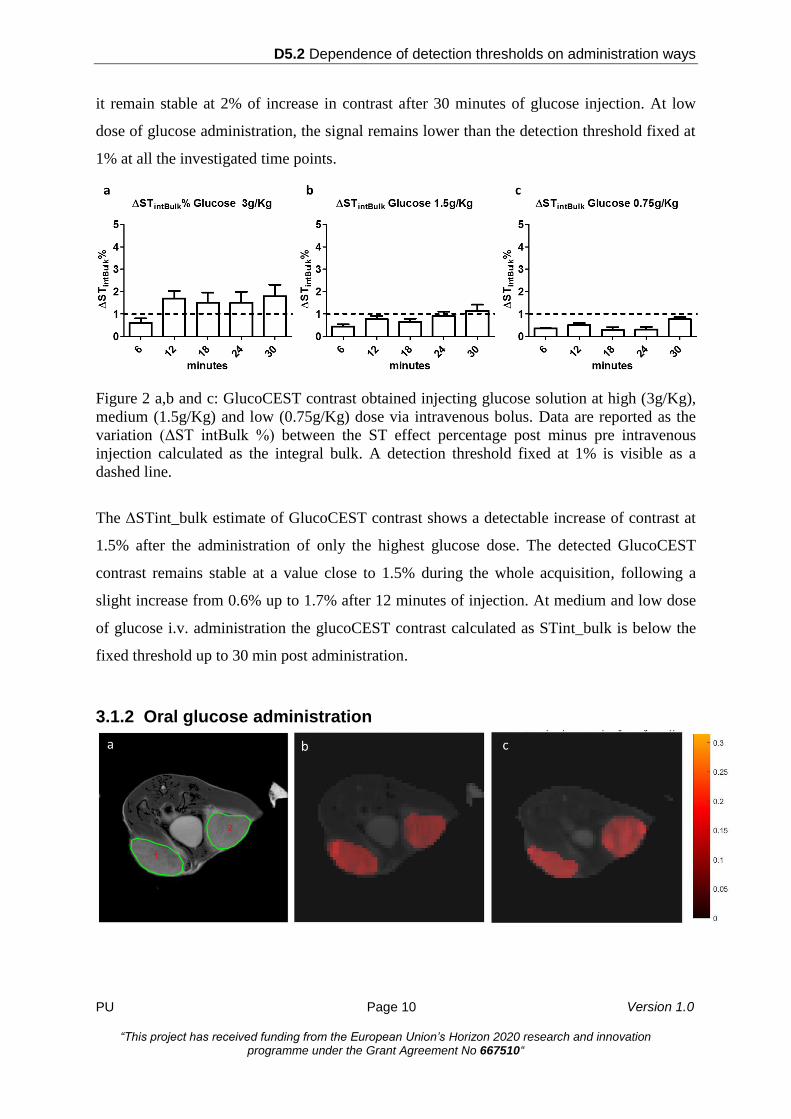
3.1.2 Oral glucose administration

D5.2 Dependence of detection thresholds on administration ways
PU Page 11 Version 1.0
“This project has received funding from the European Union’s Horizon 2020 research and innovation programme under the Grant Agreement No 667510“
Figure 3: An anatomical T2 weighted image (before D-glucose administration). b,c:
GlucoCEST map before (b) and ~12 min (c) after oral treatment of D-glucose, 3 g/kg. D,e,
and f: GlucoCEST contrast obtained following glucose administration at high (3g/Kg),
medium (1.5g/Kg) and low (0.75g/Kg) dose via oral gavage. Data are reported as the
variation (ΔST %) between the ST effect before and after oral administration. A detection
threshold fixed at 1% is visible as a dashed line.
A glucoCEST contrast above the detection threshold of 1% is visible only at the highest dose
of oral administered glucose with a slight increase over time. The high glucose dose showed a
ΔST signal detectable (higher than 1 %) 12 minutes after gavage. The increase in GlucoCEST
contrast peaked to 2.4% after 30 minutes post gavage. At medium and low the signal
remained stables below the detection threshold of 1%.
Figure 4 a,b and c: GlucoCEST contrast obtained administrating glucose solution at high
(3g/Kg), medium (1.5g/Kg) and low (0.75g/Kg) dose via oral gavage. Data are reported as
the variation (ΔST int_bulk %) between post and pre administration, calculated as the area
under the ST curve in the range 0-2.2 ppm. A detection threshold fixed at 1% is visible as a
dashed line.
The ST signals calculated as the integral bulk are higher than the detection threshold only at
the high glucose dose, in the same way as when calculated with the ST estimate. At high dose
of glucose, the signal is greater than the detection threshold fixed at 1% and this value is

D5.2 Dependence of detection thresholds on administration ways
PU Page 12 Version 1.0
“This project has received funding from the European Union’s Horizon 2020 research and innovation programme under the Grant Agreement No 667510“
maintained during the whole acquisition time, despite being lower in comparison to the ST
estimate. Signals derived from medium glucose dose had values close to the detection
threshold of 1%, whereas glucoCEST contrast from the lower dose were not detectable at all.
3.2 3OMG CEST MRI
In vivo 3OMG-CEST MRI experiments were performed on three breast cancer xenograft
models: highly malignant mice breast cancer tumors (4T1) and two human breast cancer
tumors (MDA-MB-231 and MCF7), all implanted ortotopically in 8 week old female Balb/C
(4T1) and athymic nu/nu or SCID/ICR mice (MDA-MB-231 and MCF7). Three methods of
administration of the CEST agent were tested: intra-venous through the tail vein (IV), per-os
by oral gavage (PO) and intraperitoneal (IP). Representative T2 weighted anatomical images
and the 3OMG-CEST contrast of 4T1, MDA-MB-231 and MCF7 breast tumors are shown in
Fig. 5. The relatively large CEST signal at baseline (Fig.5 b,e,h) is probably due to the
presence of other metabolites, such as the glycosaminoglycans and poly-sialic acid residues
of mucoproteins known to be abundant in many tumors (4,5). While the T2 weighted images
exhibited only the morphology pattern (Fig.5a,d,g), CEST MRI following 3OMG
administration gave clear patterns of the tumors that can be easily distinguished from other
parts of the body in the three tested models (Fig.5c,f,i), reflecting the metabolic activity of the
tumors. The CEST effect of the three tumors models lasted more than an hour following PO
administration of 1.0 g/kg 3OMG. Fig. 5 j and k show that the CEST contrast at 1.2 ppm
(relative to the water signal) of the 4T1 tumor has higher signal (P=0.009) than that of MDA-
MB-231 and MCF7 tumors.

D5.2 Dependence of detection thresholds on administration ways
PU Page 13 Version 1.0
“This project has received funding from the European Union’s Horizon 2020 research and innovation programme under the Grant Agreement No 667510“
Figure 5: Imaging of three breast cancer models: 4T1 (a-c), MDA-MB-231 (d-f) and
MCF-7 (g-i): a,d,g: T2 weighted images of the three models, respectively. b,e,h: CEST maps
at baseline, for the three models respectively. c,f,i.: CEST maps ~60 min. after 3OMG
administration (PO, 1.0 g/kg), for the three models, respectively. j: An example of the time
series of the % CEST observed in the tumors, for the three models. k: A bar graph showing
average 3OMG-CEST contrast ± SD, i.e. the %CEST due to the addition of 3OMG, at an
hour after 3OMG administration, for the three examined tumors: 4T1 (n=6), MCF7 (n=1) and
MDA-MB-231, (n=3). Green arrows point out the tumors and the red arrows for the urinary
bladder. The CEST was measured at a frequency offset of 1.2 ppm, B1=2.4 T.
In the 4T1 model, PO administration of 0.45–3.0 g/kg 3OMG increased the CEST signals of
the tumors by ~2–10% relative to the baseline (Fig. 6d). A one-way ANOVA was used to test
for differences in the obtained % CEST among 3OMG doses, showing statistically significant
differences (P < 0.00001); Tukey’s post hoc test showed that the main differences are
between 7 groups of doses.
A significant CEST contrast can be considered when achieving about 4% CEST above the
baseline, to ensure that the signal can be quantified easily (and in order to cancel the
contribution of the background). This CEST level was achieved at a dose of ~0.6 g/kg 3OMG
(Fig. 6d) that can be defined as the lowest effective dose in mice (by oral administration).
Fig. 6 (a-c) is an example for an experiment where a necrotic area was present at the center
of the tumor. The difference between the CEST images (Fig.6 b and c) can be ascribed to the
trapped (3OMG) in the tumor. As can be seen (Fig.6 c), the CEST effect was most
pronounced at the rim of the tumor, presumably the most metabolic active part.

D5.2 Dependence of detection thresholds on administration ways
PU Page 14 Version 1.0
“This project has received funding from the European Union’s Horizon 2020 research and innovation programme under the Grant Agreement No 667510“
Figure 6: Dose dependence of 3OMG-CEST MRI for mice bearing 4T1 breast tumors at
a frequency offset of 1.2 ppm, B1=2.4 T. a: A T2 weighted image before administration of
the agent. b: A CEST image before administration of the agent; 12% CEST were obtained in
the tumor. c: A CEST image 80 min after PO treatment with 3OMG, 0.6 g/kg; 16.4% CEST
were obtained in the tumor. The marked ROI (a) was used for the CEST calculation. Green
arrows point out the tumor and the red arrows for the urinary bladder. d: Bar graph showing
mean ± SD of 3OMG-CEST contrast (one hour after 3OMG administration (n=24).
The 3OMG-CEST method was compared to that of glucoCEST (Fig. 7). For that purpose, we
performed a side by side experiment in the same animal, within an interval of ~8 hours
between the two CEST methods. 3OMG-CEST MRI gave higher CEST effect (4.6%) than
that of D-glucose (2.7%) even at half of the dosage used for the latter (0.7 g/kg 3OMG vs 1.5
g/kg D-glucose). Moreover, the glucoCEST lasted only for a short time and was reduced to
the baseline after 40 minutes, while that of 3OMG persisted for more than an hour.

D5.2 Dependence of detection thresholds on administration ways
PU Page 15 Version 1.0
“This project has received funding from the European Union’s Horizon 2020 research and innovation programme under the Grant Agreement No 667510“
Figure 7: 3OMG CEST vs. glucoCEST MRI kinetics measurements in 4T1 breast tumor
model of the same animal. a. An anatomical T2 weighted image (before D-glucose
administration). b,c: CEST map before (b) and ~60 min (c) after PO treatment with D-
glucose, 1.5 g/kg (at frequency offset of 1.2 ppm, B1=2.4 T). No remarkable CEST contrast
was obtained in the tumor referred to the baseline. d. An anatomical T2 weighted image
(before 3OMG administration). e,f: CEST map before (e) and ~60 min after (f) PO treatment
with 3OMG, 0.7 g/kg (at frequency offset of 1.2 ppm, B1=2.4 T). Approximately 4% CEST
were obtained in the tumor referred to the baseline). Green arrows point out the tumor. g. The
time series of the % CEST achieved in 4T1 tumor following treatment with D-glucose (1.5
g/kg) vs. 3OMG (0.7 g/kg).
In this study, the efficacy of different modes of 3OMG administration was examined (Fig. 8).
A total of 9 mice bearing 4T1 tumors received 3OMG via IV, IP and PO administration (for
each administration mode n=3) and the %CEST obtained in the tumors was compared. For
the three modes of administration, the same maximum effect was obtained, achieved at about
20min after treatment.

D5.2 Dependence of detection thresholds on administration ways
PU Page 16 Version 1.0
“This project has received funding from the European Union’s Horizon 2020 research and innovation programme under the Grant Agreement No 667510“
Figure 8: Mice bearing 4T1 tumors received 3OMG via IV, IP and PO administration and the
% CEST obtained in the tumors was compared.

D5.2 Dependence of detection thresholds on administration ways
PU Page 17 Version 1.0
“This project has received funding from the European Union’s Horizon 2020 research and innovation programme under the Grant Agreement No 667510“
4 Conclusions
4.1 GlucoCEST
Both the per os and the intravenous administrations allowed to obtain a detectable
glucoCEST contrast in tumor bearing mice with a 7T scanner following a continuous wave
presaturation block pulse (2 μT) applied for 5 sec.
Upon i.v. administration, enough GlucoCEST contrast was detectable with an injected dose of 1.5
g / Kg, with a minimum increase of glucoCET contrast, from baseline values, of ca. 2%. The
same dose of 1.5 g/kg was not sufficient to provide enough contrast when administered per os.
As a consequence, the minimum detectable dose following oral administration was of 3 g /kg,
with an average increase of ca. 2-3% from baseline CEST contrast.
The intravenous administration provided the maximum glucoCEST contrast at all the investigated
administered doses.
The averaged increase in GlucoCEST contrast was similar to that already observed in other
tumor models, being in the range 0.6-4%, according to the administered dose. In contrast to
previous reports, where the exploited magnetic fields where in the range 9.4-11.7T, we used a
lower, despite still high-field, magnet (7T). Our increase in GlucoCEST contrast (2-4%) was
comparable with that obtained with a 11.7T MRI scanner and with a similar dose of 3g/kg
injected by i.v (6). A marked higher glucoCEST contrast was observed, when calculated with
the STint_bulk estimate, in comparison to that reported by exploiting a 9.4T, likely reflecting
the higher injected dose (1.5g/kg vs. ca. 0.2 g/kg) (7).
These results show that GlucoCEST contrast is still feasible at magnetic fields lower than
those used at preclinical level. Further confirmations are still needed with magnetic fields in
the clinical range (3T).
A marked difference in GlucoCEST contrast was observed, at the same doses, between the
i.v. and the per os administration, with the intravenous injection providing higher contrast.
One explanation could be that the intravenous route allow a faster and higher dose already
available to extravasate in the tumor region in the first minutes post injection, whereas the
gavage administration require longer time for absorption and distribution. Another
explanation may result in the set-up of the per os administration, that requires to move the
mouse in and out from the MRI scanner for pre- and post-glucose administration, thus
resulting in a non-perfect selection of the same tumor slice/region between pre- and post-
contrast image acquisitions.

D5.2 Dependence of detection thresholds on administration ways
PU Page 18 Version 1.0
“This project has received funding from the European Union’s Horizon 2020 research and innovation programme under the Grant Agreement No 667510“
Overall these data suggest that the best administration route is the intravenous one that allows
glucose to reach directly the tumour region through the vascular system and generate
appreciable CEST effect even at a low dose of 1.5 g /kg.
4.2 3OMG CEST
In this study, the method of 3OMG-CEST MRI was investigated and characterized in the
mouse xenografts of three breast tumor lines: 4T1, MDA-MB-231 and MCF7. This work
validates and extends the previous research and development of 3OMG-CEST MRI on D1-
DMBA-3 breast tumors. The three tested tumor models showed significant CEST effects that
improved with increasing doses of the administered 3OMG; the 4T1 tumors that are
considered the most aggressive tumor model gave the highest CEST signal. This evidence
may have strong implications for the future utility of 3OMG CEST technique, as the ability to
discriminate between tumors of differencing pathological stage.
Apparently, 3OMG lowest effective dose in mice (by oral administration) was defined as
~0.6mg/kg, providing a CEST signal of 4% (Fig. 6d). Scaling the dose used in this study to a
70 kg human would correspond to 3.5 g of 3OMG (calculation was based on the ratio
between mice and human surface area).
The validity of the method was tested for different modes of administration (PO, IV and IP);
all produced approximately the same CEST signal following 20min. after treatment. As PO
administration is considered to be less invasive relative to the others, it is the preferred route
of administration whenever possible.

D5.2 Dependence of detection thresholds on administration ways
PU Page 19 Version 1.0
“This project has received funding from the European Union’s Horizon 2020 research and innovation programme under the Grant Agreement No 667510“
5 Bibliography / References
1. Chu V, Hamarneh G. MATLAB–ITK interface for medical image filtering, segmentation,
and registration. Proc SPIE Med Imaging: Image Process 2006;6144:1–8.
2. Stancanello J, Terreno E, Castelli DD, Cabella C, Uggeri F, Aime S. Development and
validation of a smoothing-splines-based correction method for improving the analysis of
CEST-MR images. Contrast Media Mol Imaging 2008;3:136–149.
3. Terreno, E.; Stancanello, J.; Longo, D.; Castelli, D. D.; Milone, L.; Sanders, H. M.; Kok,
M. B.; Uggeri, F.; Aime, S. Contrast Media Mol. Imaging 2009, 4, 237-47.
4. Shinar, H.; Battistel, M. D.; Mandler, M.; Lichaa, F.; Freedberg, D. I.; Navon, G.
Carbohydrate Research 2014, 389, 165.
5. Song, X.; Airan, R. D.; Arifin, D. R.; Bar-Shir, A.; Kadayakkara, D. K.; Liu, G.; Gilad, A.
A.; van Zijl, P. C. M.; McMahon, M. T.; Bulte, J. W. M. Nature Communication 2015, 6.
6. Xu, X.; Chan, K. W.; Knutsson, L.; Artemov, D.; Xu, J.; Liu, G.; Kato, Y.; Lal, B.;
Laterra, J.; McMahon, M. T.; van Zijl, P. C. Magn. Reson. Med. 2015, 74, 1556-63.
7. Walker-Samuel, S.; Ramasawmy, R.; Torrealdea, F.; Rega, M.; Rajkumar, V.; Johnson, S.
P.; Richardson, S.; Goncalves, M.; Parkes, H. G.; Arstad, E.; Thomas, D. L.; Pedley, R. B.;
Lythgoe, M. F.; Golay, X. Nat. Med. 2013, 19, 1067-72.


![Agreement number: […] Model grant agreement (mono … · 2017. 12. 14. · Agreement number: […] Model grant agreement (mono beneficiary): October 2016 6 ARTICLE I.8 – SPECIAL](https://static.fdocuments.in/doc/165x107/5fbd350816f85d4961670c83/agreement-number-model-grant-agreement-mono-2017-12-14-agreement-number.jpg)