Grande Praire Ken Wong Innovation Workshop
26
KW330 Innovation: Beyond New Products Ken Wong
Transcript of Grande Praire Ken Wong Innovation Workshop

KW-330
Innovation: Beyond New Products
Ken Wong

Strategic Fit: The Basis of Planning
CUSTOMER ANALYSIS Who BUYS What, Where, When, How and Why
Determine Basis of Segmentation
ASSESS MARKET-COMPANY FIT Define Quality and
Identify Segments You Can Serve
COMPETITOR ANALYSIS Who OFFERS What, Where,
When, How and Why
Determine Basis ofDifferentiation
ASSESS PRODUCT-COMPANY FIT Evaluate Relative Quality and Identify Competitors
You Can Beat
COMPANY ANALYSISGiven your objectives and resources...what can you do, for whom, where and when?
DEVELOP PRODUCT-MARKET FIT Does a market exist for your intended price/quality level?
IF YES: Objectives focus on activities needed to communicate/deliver/insulate positioning IF NO: Objectives focus on the implicated remedial actions or new market entry
KW-057
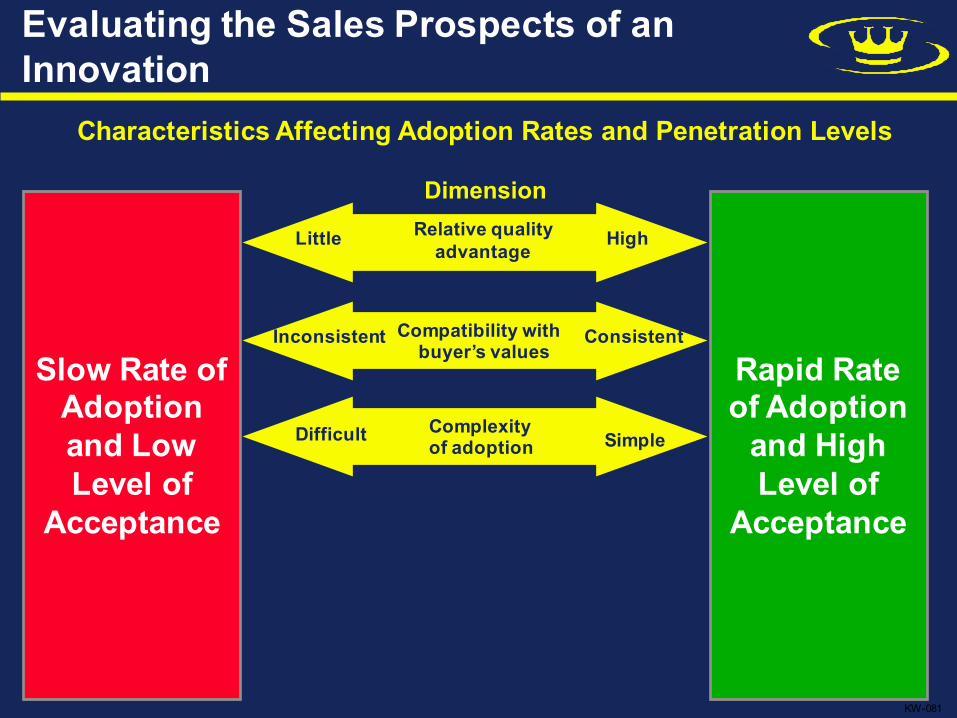
Evaluating the Sales Prospects of an Innovation
Slow Rate of Adoption and Low Level of
Acceptance
Rapid Rate of Adoption and High Level of
Acceptance
Characteristics Affecting Adoption Rates and Penetration Levels
Dimension
KW-081
Little HighRelative qualityadvantage
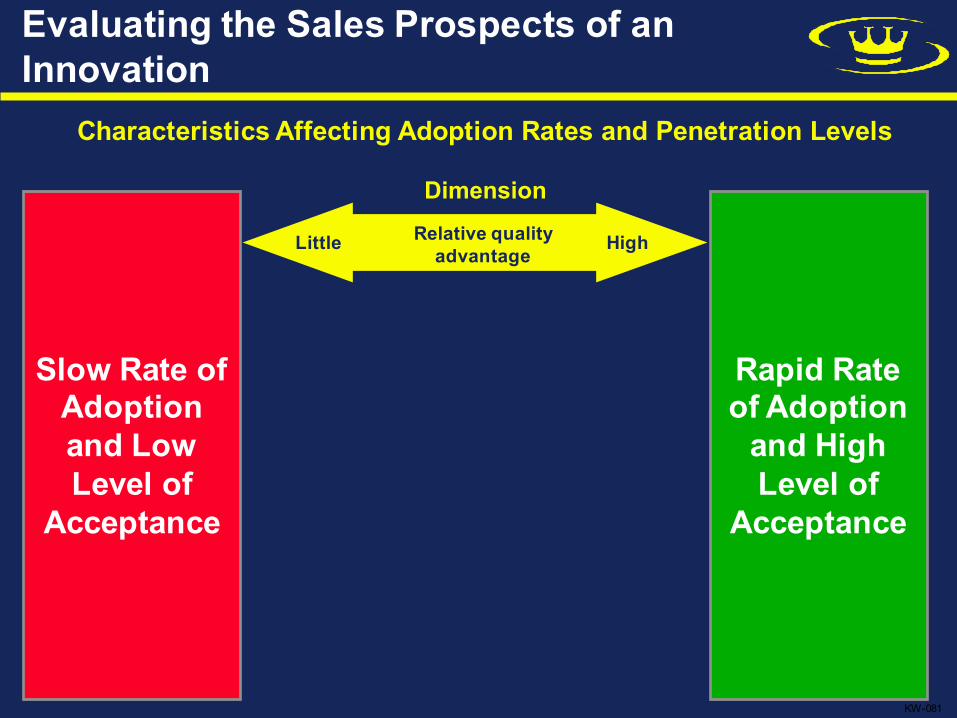
Evaluating the Sales Prospects of an Innovation
Slow Rate of Adoption and Low Level of
Acceptance
Rapid Rate of Adoption and High Level of
Acceptance
Characteristics Affecting Adoption Rates and Penetration Levels
Dimension
KW-081
Inconsistent ConsistentCompatibility withbuyer’s values
Little HighRelative qualityadvantage
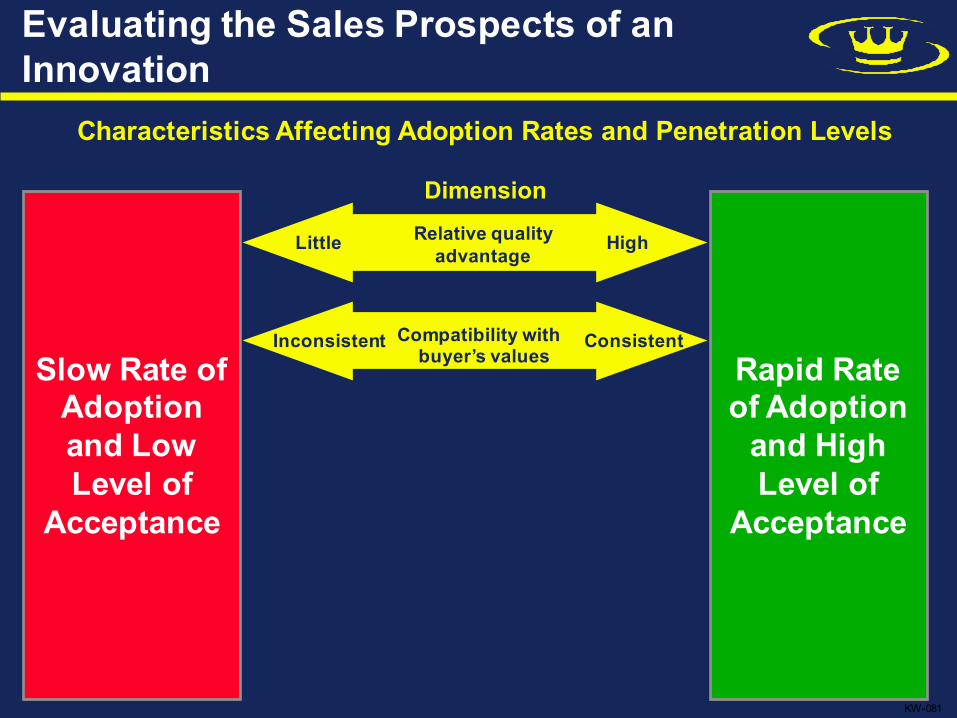
Finding Two: "What Matters Most" Depends On Your Profit Model
Marketing Effort
Customer Value
Barriers to Entry
Market Share Strategies
Product Innovation
Product Quality
Marketing Effort
Price Strategies
Margin
Volume
Process Innovation
Functional Efficiencies
Discretionary Spending
Integration
Cost Strategies
Net Income
New Products
New Markets
More Usage Occasions
More Usage Per Occasion
Market Size Strategies
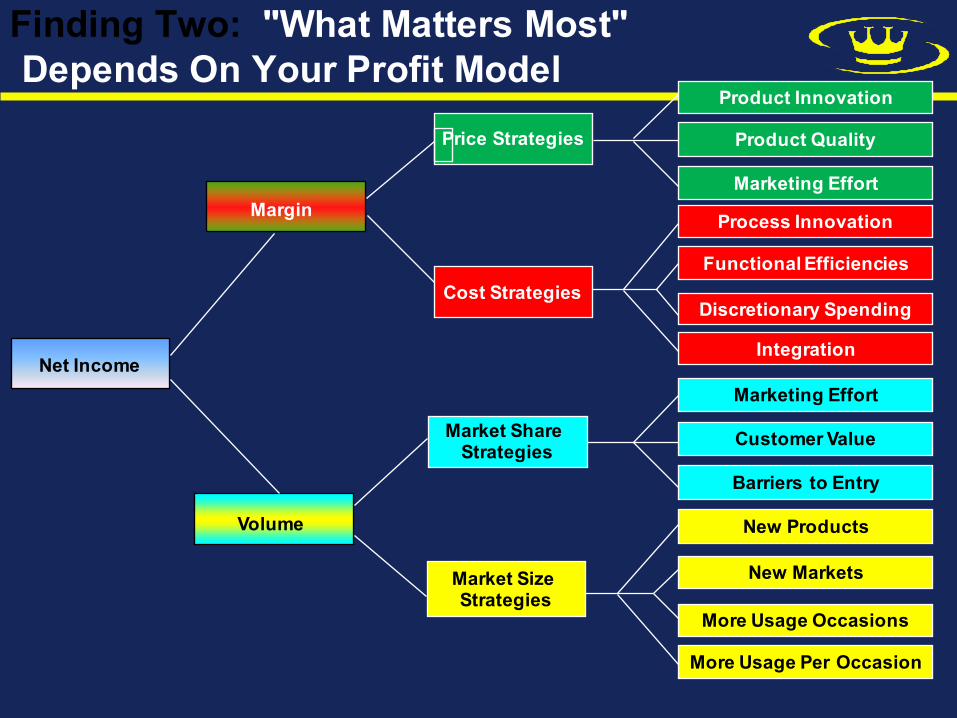
Evaluating the Sales Prospects of an Innovation
Slow Rate of Adoption and Low Level of
Acceptance
Rapid Rate of Adoption and High Level of
Acceptance
Characteristics Affecting Adoption Rates and Penetration Levels
Dimension
KW-081
Difficult SimpleComplexityof adoption
Inconsistent ConsistentCompatibility withbuyer’s values
Little HighRelative qualityadvantage
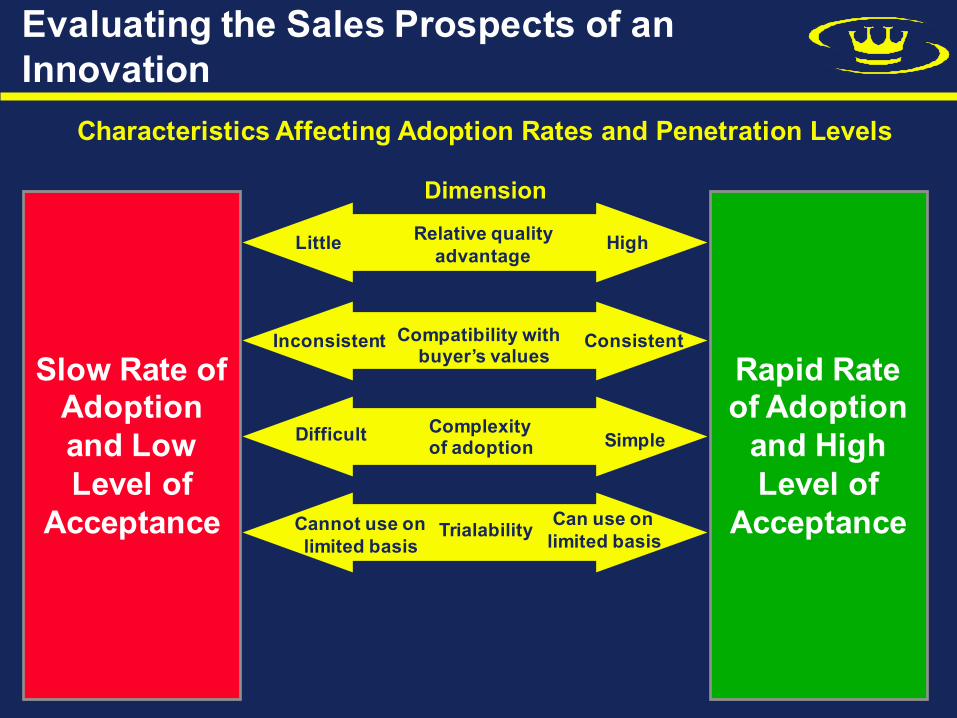
Evaluating the Sales Prospects of an Innovation
Slow Rate of Adoption and Low Level of
Acceptance
Rapid Rate of Adoption and High Level of
Acceptance
Characteristics Affecting Adoption Rates and Penetration Levels
Dimension
Cannot use on limited basis
Can use onlimited basisTrialability
Difficult SimpleComplexityof adoption
Inconsistent ConsistentCompatibility withbuyer’s values
Little HighRelative qualityadvantage
Three Types of Buyer Risk
1. Non-Performance
2. Downstream Consequences
3. Personal Status
Evaluating the Sales Prospects of an Innovation
Slow Rate of Adoption and Low Level of
Acceptance
Rapid Rate of Adoption and High Level of
Acceptance
Characteristics Affecting Adoption Rates and Penetration Levels
Dimension
KW-081
Difficult tocommunicate
Easy tocommunicate
Communicability
Cannot use on limited basis
Can use onlimited basisTrialability
Difficult SimpleComplexityof adoption
Inconsistent ConsistentCompatibility withbuyer’s values
Little HighRelative qualityadvantage
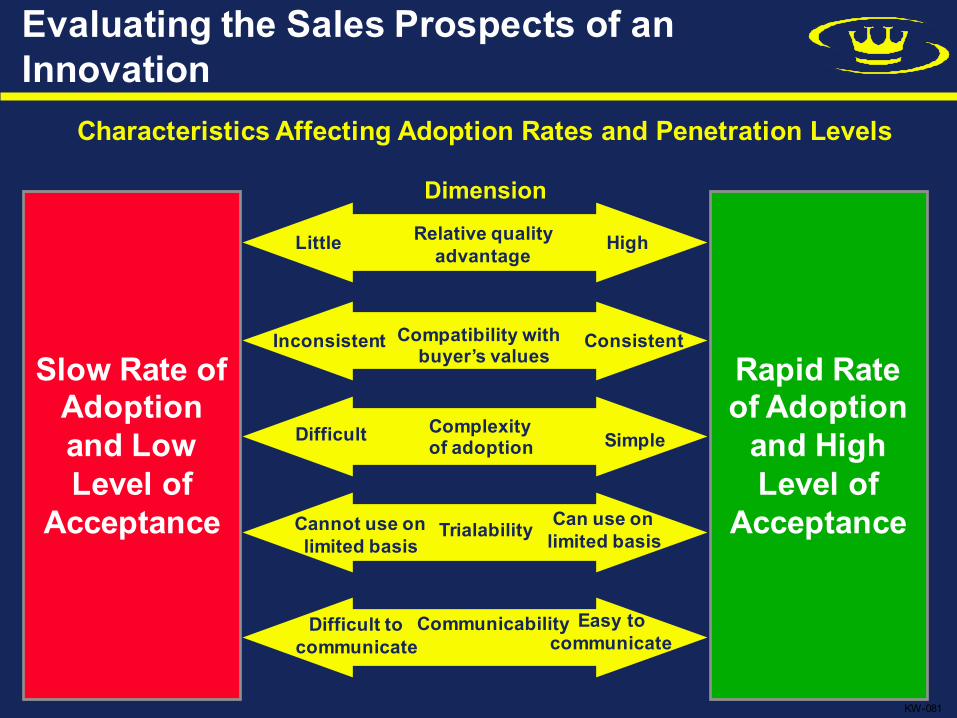

34%EarlyMajority
Customers Vary in Their Willingness to Innovate
Time of adoption of innovationsTime
% ofMarketBuyingfor theFirstTime
2.5%Innovators
13.5%Early Adopters
34%Late
Majority16%
Laggards
KW-082KW-082
34%EarlyMajority
34%Late
Majority16%
Laggards
THE “CHASM”

Growth Must Be “Stolen” in Mature Markets
0102030405060708090100
+13.5%
EarlyAdopters
+34.0%
EarlyMajority
+34.0%
LateMajority
+16.0%
Laggards orNon-Adopters
Time
PercentAdoption
KW-184
2.5%
Innovators

Why Customers’ Needs and Preferences Change Over Time
Price
High
Low
Price
High
Low
Price
High
Low
Low High Low High Low High
Customers lack experience• Need extensive support• Insist on high quality• Do not worry about priceif the functionality is thereEffective businesses cater to the factors that drive the diffusion of innovations
Customers build experience and volume;; they become less dependent on vendors for support and they become more powerful negotiatorsBuying is moved to the procurement function;; service becomes less vitalCompetitors enter on a lower price/quality basis or via more customization for the carriage trade
Stage 1: Early Market Development
Stage 2: Market Development
Stage 3: Market Saturation
Service Service Service
KW-084
InnovatorsInnovators
If the benefit is “trivial,” bargain basement buying occursIf the benefit is important or complex, aggressive buying occursNote: The situation will not change in all accounts at the same time or in the same way
EarlyAdopters
EarlyMajority
Innovators AggressiveBuyers
EarlyAdopters
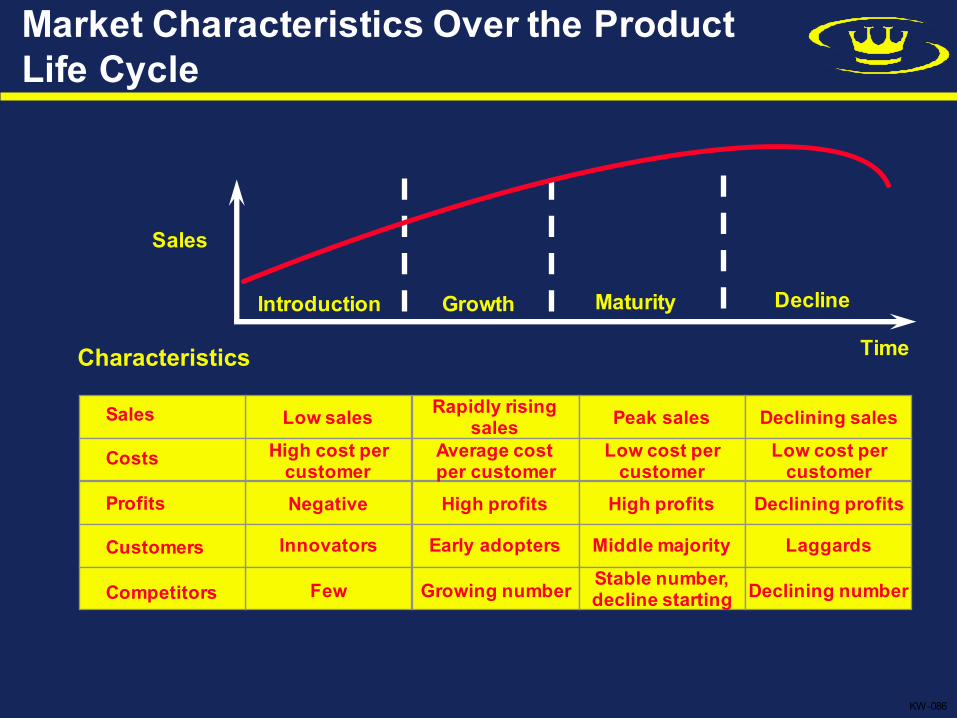
Market Characteristics Over the Product Life Cycle
GrowthIntroduction DeclineMaturity
Time
Sales
Characteristics
Low salesHigh cost percustomerNegative
Innovators
Few
Rapidly risingsales
Average costper customerHigh profits
Early adopters
Growing number
Peak salesLow cost percustomerHigh profits
Middle majorityStable number,decline starting
Declining salesLow cost percustomer
Declining profits
Laggards
Declining number
KW-086
Sales
Costs
Profits
Customers
Competitors
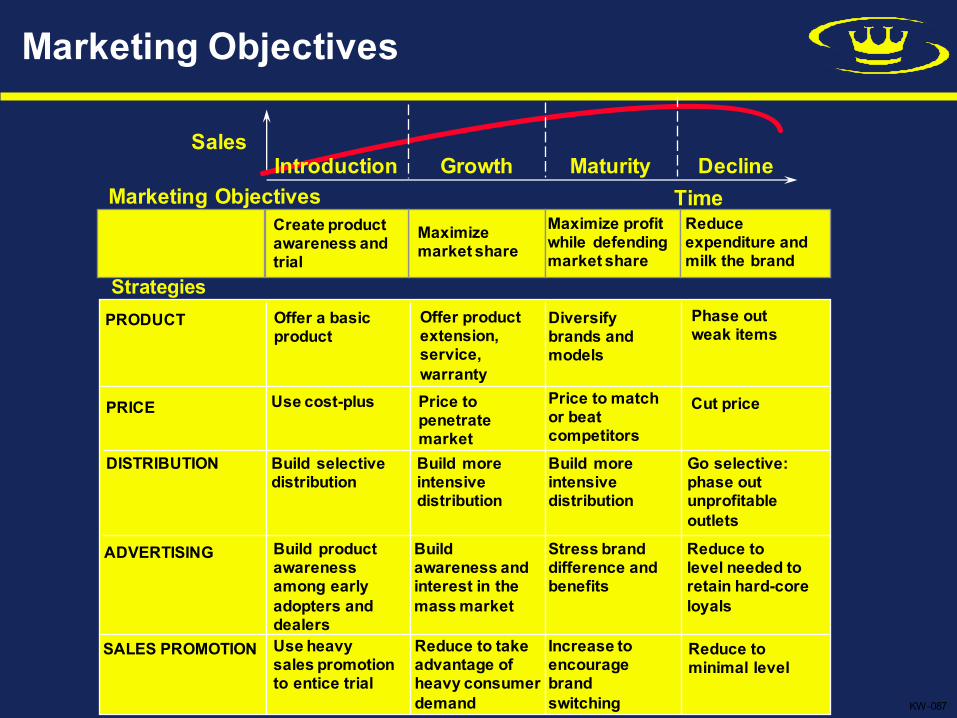
GrowthIntroduction DeclineMaturityTime
Sales
Marketing Objectives
StrategiesPRODUCT Offer a basic
productOffer product extension,service,warranty
Diversifybrands andmodels
Phase outweak items
PRICE Use cost-plus Price to penetratemarket
Price to matchor beatcompetitors
Cut price
DISTRIBUTION Build selectivedistribution
Build moreintensivedistribution
Build moreintensivedistribution
Go selective:phase outunprofitableoutlets
ADVERTISING Buildawareness and interest in the mass market
Stress brand difference and benefits
Reduce tolevel needed to retain hard-core loyals
Build productawareness among earlyadopters and dealers
SALES PROMOTION Use heavysales promotionto entice trial
Reduce to takeadvantage ofheavy consumerdemand
Increase toencouragebrand switching
Reduce tominimal level
Maximizemarket share
Maximize profitwhile defendingmarket share
Reduceexpenditure andmilk the brand
KW-087
Marketing Objectives
Create productawareness and trial
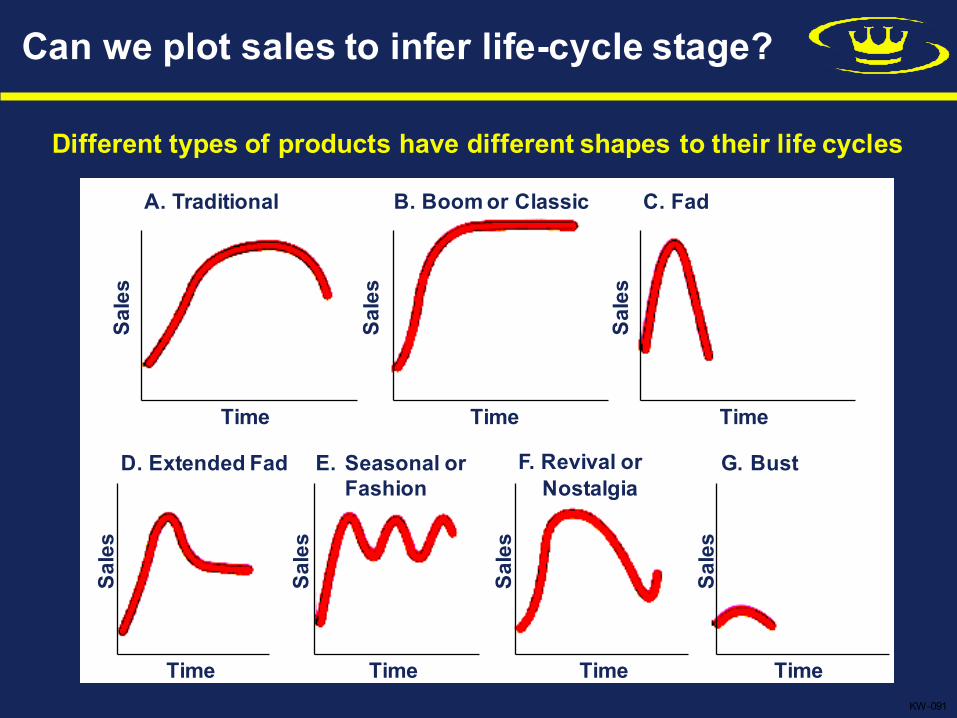
Can we plot sales to infer life-cycle stage?
Time Time Time
Time Time Time Time
Sales
Sales
Sales
Sales
Sales
Sales
Sales
A. Traditional B. Boom or Classic C. Fad
D. Extended Fad E. Seasonal orFashion
F. Revival orNostalgia
G. Bust
Different types of products have different shapes to their life cycles
KW-091
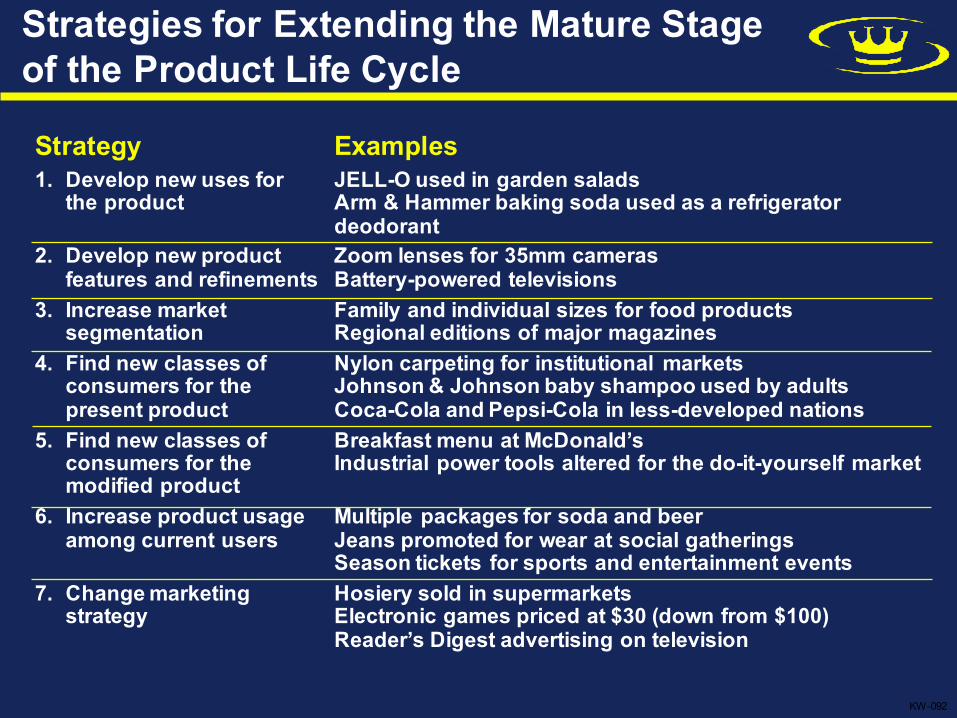
Strategies for Extending the Mature Stage of the Product Life Cycle
Strategy Examples1. Develop new uses for JELL-O used in garden saladsthe product Arm & Hammer baking soda used as a refrigerator
deodorant2. Develop new product Zoom lenses for 35mm camerasfeatures and refinements Battery-powered televisions
3. Increase market Family and individual sizes for food productssegmentation Regional editions of major magazines
4. Find new classes of Nylon carpeting for institutional marketsconsumers for the Johnson & Johnson baby shampoo used by adultspresent product Coca-Cola and Pepsi-Cola in less-developed nations
5. Find new classes of Breakfast menu at McDonald’sconsumers for the Industrial power tools altered for the do-it-yourself marketmodified product
6. Increase product usage Multiple packages for soda and beeramong current users Jeans promoted for wear at social gatherings
Season tickets for sports and entertainment events7. Change marketing Hosiery sold in supermarketsstrategy Electronic games priced at $30 (down from $100)
Reader’s Digest advertising on television
KW-092

Profitability Over the Life Cycle
KW-093

PORTFOLIO MODELS
KW-094
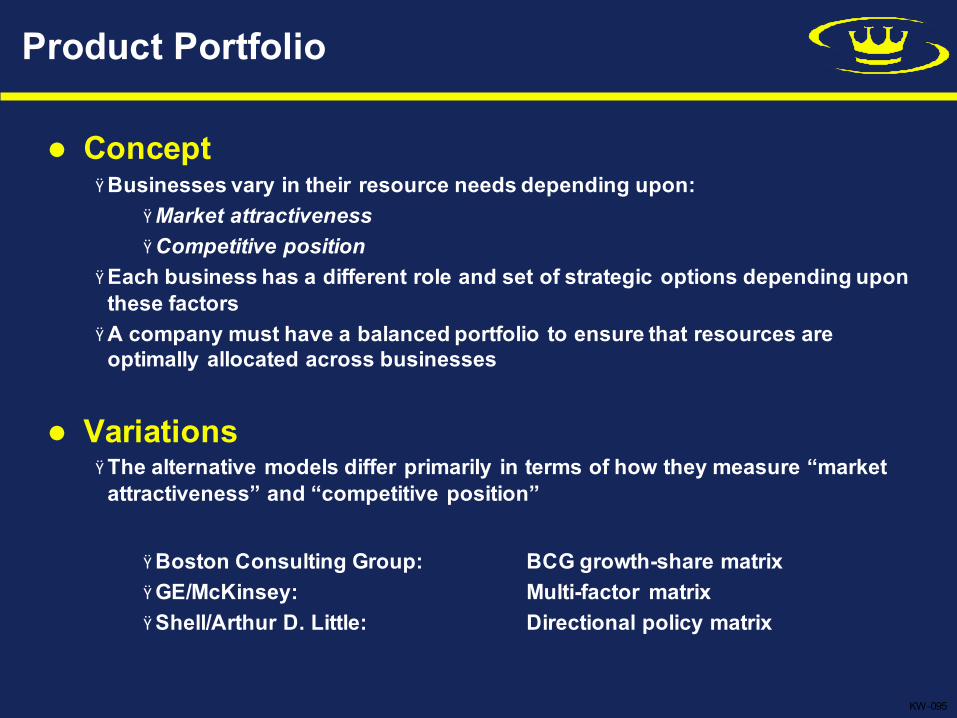
Product Portfolio
l ConceptŸBusinesses vary in their resource needs depending upon:
ŸMarket attractivenessŸCompetitive position
ŸEach business has a different role and set of strategic options depending upon these factors
ŸA company must have a balanced portfolio to ensure that resources are optimally allocated across businesses
l VariationsŸThe alternative models differ primarily in terms of how they measure “market attractiveness” and “competitive position”
ŸBoston Consulting Group: BCG growth-share matrixŸGE/McKinsey: Multi-factor matrixŸShell/Arthur D. Little: Directional policy matrix
KW-095
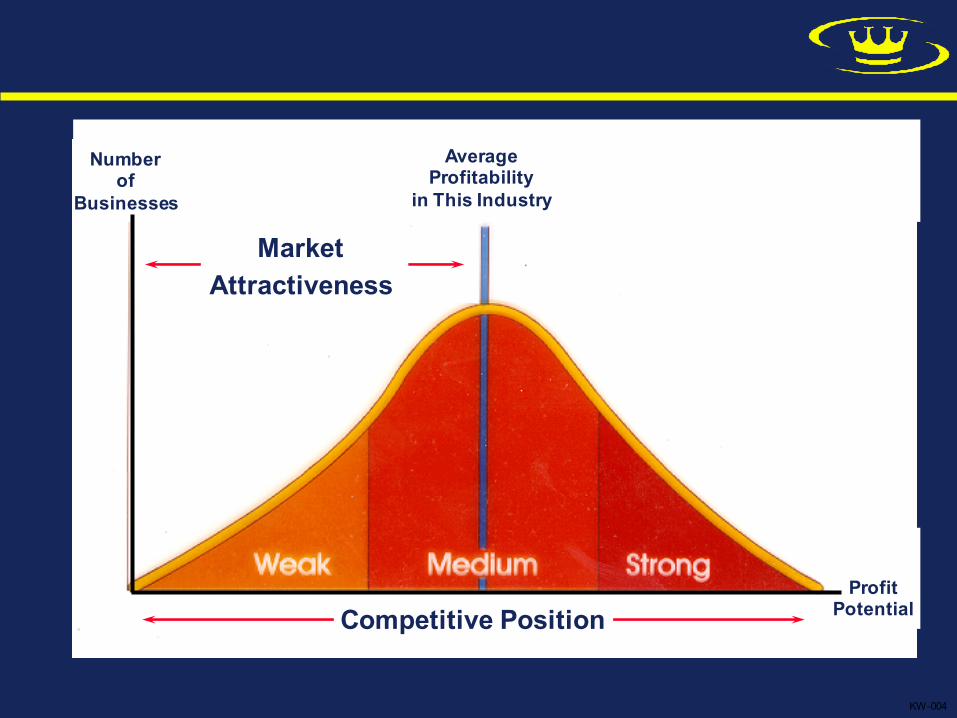
Determinants of Profitability
KW-004
MarketAttractiveness
AverageProfitability
in This Industry
Numberof
Businesses
Competitive PositionProfit
Potential
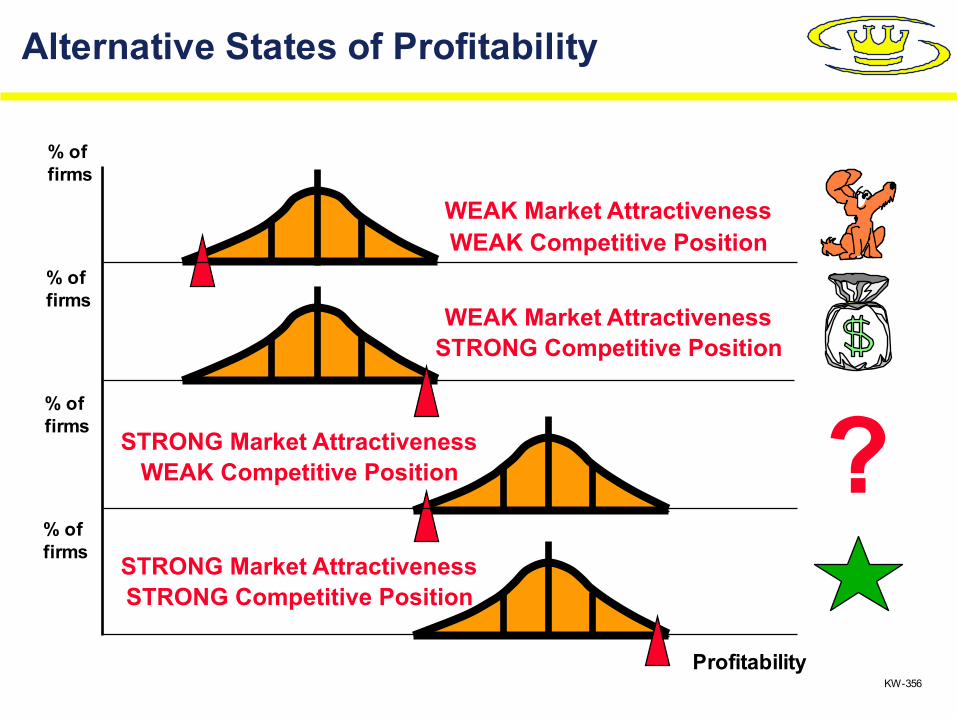
Alternative States of Profitability
WEAK Market AttractivenessWEAK Competitive Position
STRONG Market AttractivenessWEAK Competitive Position
WEAK Market AttractivenessSTRONG Competitive Position
STRONG Market AttractivenessSTRONG Competitive Position
KW-356
?Profitability
% offirms
% offirms
% offirms
% offirms

?
Boston Consulting Group’s Growth-Share Matrix
Objective:Increase Share or Out
LargeNegativeCash Flow
High
Low
GrowthRate or PLCStage
(Cash Use)
High LowRelative Market Share or Competitive Position
(Cash Generation)
Objective:Maintain/Reinforce Lead
Objective:Re-Focus or Out
Objective:Maintain Share (Hold)
Modest+ or -
Cash Flow
Modest+ or -
Cash Flow
LargePositiveCash Flow
KW-096

GE/McKinsey Multi-Factor Matrix
1
1
2 3 3
2 3
21
Evaluating the Ability to CompeteSizeGrowthShare by segmentCustomer loyaltyMarginsDistributionTechnology skillsPatentsMarketingFlexibilityOrganization
Evaluating Industry Attractiveness SizeGrowthCustomer satisfaction levelsCompetition: quality, types, effectiveness, commitment
Price levelsProfitabilityTechnologyGovernmental regulationsSensitivity to economic trends
High Medium Low
High
Medium
Low
1. Invest/grow2. Selectiveinvestment
3. Harvest/divest
Businessposition;; its ability to compete
Industry attractiveness
KW-098
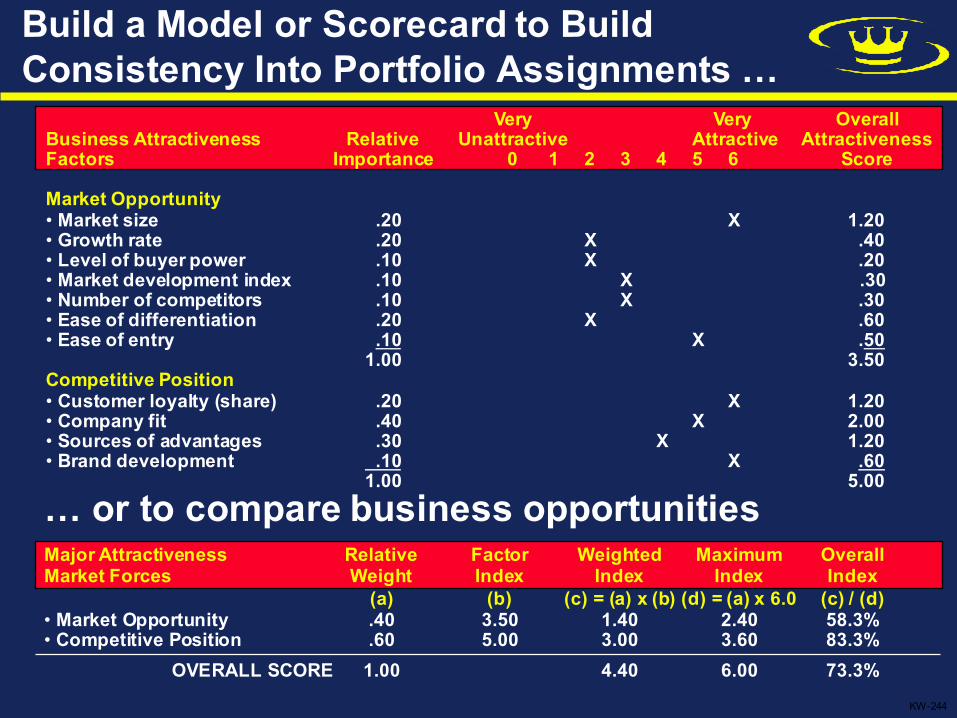
Build a Model or Scorecard to Build Consistency Into Portfolio Assignments …
Very Very OverallBusiness Attractiveness Relative Unattractive Attractive AttractivenessFactors Importance 0 1 2 3 4 5 6 Score
Market Opportunity• Market size .20 X 1.20• Growth rate .20 X .40• Level of buyer power .10 X .20• Market development index .10 X .30• Number of competitors .10 X .30• Ease of differentiation .20 X .60• Ease of entry .10 X .50
1.00 3.50Competitive Position• Customer loyalty (share) .20 X 1.20• Company fit .40 X 2.00• Sources of advantages .30 X 1.20• Brand development .10 X .60
1.00 5.00
KW-244
… or to compare business opportunitiesMajor Attractiveness Relative Factor Weighted Maximum OverallMarket Forces Weight Index Index Index Index
(a) (b) (c) = (a) x (b) (d) = (a) x 6.0 (c) / (d)• Market Opportunity .40 3.50 1.40 2.40 58.3%• Competitive Position .60 5.00 3.00 3.60 83.3%
OVERALL SCORE 1.00 4.40 6.00 73.3%
KW-101
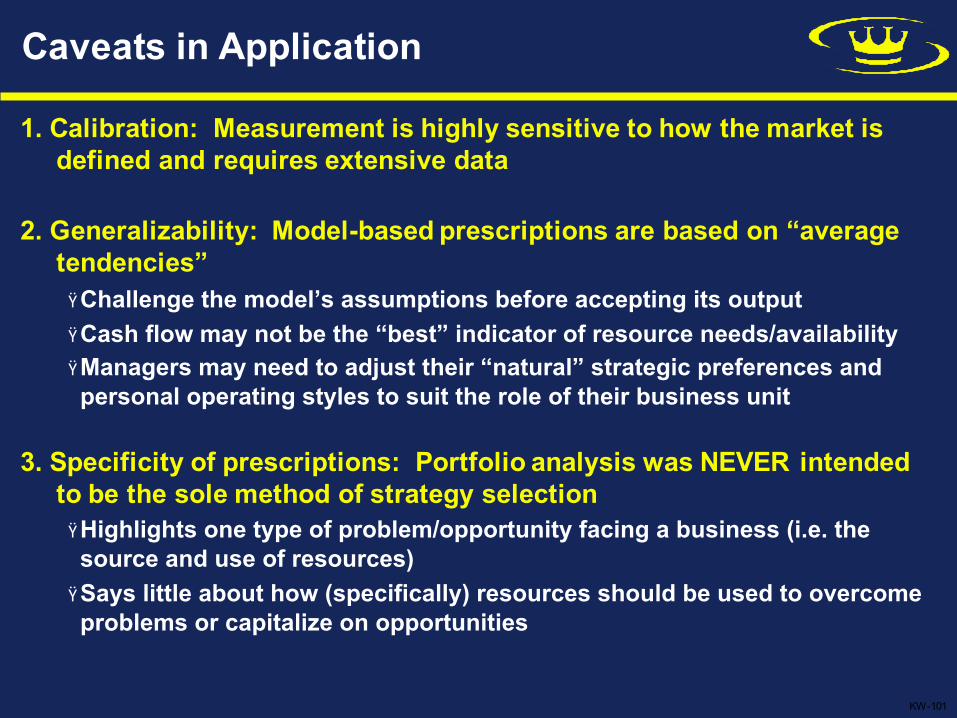
Caveats in Application
1. Calibration: Measurement is highly sensitive to how the market is defined and requires extensive data
2. Generalizability: Model-based prescriptions are based on “average tendencies”ŸChallenge the model’s assumptions before accepting its outputŸCash flow may not be the “best” indicator of resource needs/availabilityŸManagers may need to adjust their “natural” strategic preferences and personal operating styles to suit the role of their business unit
3. Specificity of prescriptions: Portfolio analysis was NEVER intended to be the sole method of strategy selectionŸHighlights one type of problem/opportunity facing a business (i.e. the source and use of resources)
ŸSays little about how (specifically) resources should be used to overcome problems or capitalize on opportunities