Grand Rapids Community College Executive Summary GRCC Workforce Statistics Fall 2008 to Fall 2012...
17
Grand Rapids Community College Executive Summary GRCC Workforce Statistics Fall 2008 to Fall 2012 Presented By: Cathy Wilson September 16, 2013
-
Upload
grant-howard -
Category
Documents
-
view
215 -
download
1
Transcript of Grand Rapids Community College Executive Summary GRCC Workforce Statistics Fall 2008 to Fall 2012...

Grand Rapids Community College
Executive SummaryGRCC Workforce Statistics
Fall 2008 to Fall 2012
Presented By: Cathy Wilson
September 16, 2013

2
GRCC WORKFORCE2008-2012
Race & Gender
Minorities Females# % # %
November 1, 2008 676 124 18.3% 360 53.3%
November 1, 2009 688 125 18.2% 373 54.2%
November 1, 2010 691 129 18.7% 374 54.1%
November 1, 2011 696 130 18.7% 381 54.7%November 1, 2012 673 131 19.5% 359 53.3%
5 year Difference: -3 7 1.2% -1 0.0%
Note: Regular, full & part time employees
Minority # & % increased Female # decrease; 0% change
DateTotal
Employees
Date Percent Fall 2008 21.4%Fall 2009 23.9%Fall 2010 24.3%Fall 2011 25.0%Fall 2012 24.1%
Total GRCC Students from Minority Population
Source: GRCC Institutional Research & Planning; Enrollment Report

3
Race/Ethnicity Breakdown2008 - 2012
Number
Date White Black Hispanic
Asian Amer
Native Amer
11/1/2008 552 79 32 8 511/1/2009 563 81 32 8 411/1/2010 562 81 35 10 311/1/2011 566 80 40 7 311/1/2012 542 84 38 7 2
Note: Regular, full & part time employees
Date White Black Hispanic
Asian Amer
Native Amer
11/1/2008 81.7% 11.7% 4.7% 1.2% 0.7%11/1/2009 81.8% 11.8% 4.7% 1.2% 0.6%11/1/2010 81.3% 11.7% 5.1% 1.4% 0.4%11/1/2011 81.3% 11.5% 5.7% 1.0% 0.4%11/1/2012 80.5% 12.5% 5.7% 1.0% 0.3%
Percentage

4
Employee Group BreakdownRace & Gender
November 1, 2012
Group Total Minorities Min % Females Fem %
# % # %
Exec, Adm & Professional 99 14 14.1% 48 48.5%
Faculty 248 38 15.3% 131 52.8%
Support 326 79 24.2% 180 55.2%
Total 673 131 19.5% 359 53.3%
Note: Regular, full & part time employees

5
Observations: Current Workforce11/01/12
Employee Group Highlights 53.3% Female representation overall
Highest in Support Staff (55.2%) Lowest in Exec, Admin & Managers (48.5%) Females represent almost half in each employee group
19.5% Minority representation overall Highest in Support Staff (24.2%) Lowest in Exec, Admin & Managers (14.1%) Minority New Hire rate is above its separation rate in each
Employee Group!

6
Public College ComparisonsGender, Race & Ethnicity
Description TotalTotal
FemaleTotal
Minority White Black HispAsian Amer
Nat Amer
2 or More Races Unknown
Nonres Alien
GRCC (FT & PT) 11/1/2012
673 53.3% 19.5% 80.5% 12.5% 5.7% 1.0% 0.3%
GR MSA (Kent, Muskegon, Ottawa
counties)1
538,290 47.6% 17.3% 82.4% 6.7% 7.2% 2.1% 0.3% 1.0% 0.3%
Mich - 2 yr Public Colleges Faculty &
Staff (FT only)2
8,626 57.8% 16.9% 81.7% 11.1% 2.4% 2.1% 0.8% 0.5% 1.3% 0.2%
Mich - 2 yr Public Colleges Faculty &
Staff (FT&PT)2
23,587 55.6% 15.5% 81.0% 10.7% 1.9% 2.0% 0.6% 0.3% 3.2% 0.3%
US - 2 yr Public Colleges Faculty &
Staff (FT&PT)2
638,814 57.6% 22.7% 72.7% 10.5% 7.2% 3.7% 0.8% 0.5% 4.0% 0.6%
Source: 12010 Census estimate;
2IPEDS 2011

Michigan 2 year Public CollegesFull Time FACULTY
Gender, Race/Ethnicity
7
Description Total Total Female
Total Minority
GRCC FT & PT FACULTY (11/1/2012) 248 52.8% 15.3%
Mich - All 2 yr Public
Colleges FT Faculty1 2,962 50.8% 12.8%
GR MSA (Kent, Ottawa, Muskegon
counties)2538,290 47.6% 17.3%
Source: 1IPEDS 2011; 22010 Census
Year TotalTotal
Minority11/1/2008 256 16.0%11/1/2009 257 15.2%11/1/2010 253 15.8%11/1/2011 258 15.1%11/1/2012 248 15.3%
GRCC FT & PT FACULTY HISTORY

Minority New Hire Rates (Total Workforce)5 Year Review
8
NEW HIRE ACTIVITY
DATE RANGE Tot Hires White Black Hispanic Asian Amer Native Amer
11/01/07 - 10/31/08 57 46 6 3 1 111/01/08 - 10/31/09 49 40 5 3 1 011/01/09 - 10/31/10 50 39 4 5 2 011/01/10 - 10/31/11 75 61 8 6 0 011/01/11 - 10/31/12 32 20 8 3 1 0
5 Year Total 263 204 31 19 5 1
DATE RANGE Tot Hires White Black Hispanic Asian Amer Native Amer
11/01/07 - 10/31/08 57 80.7% 10.5% 5.3% 1.8% 1.8%11/01/08 - 10/31/09 49 81.6% 10.2% 6.1% 2.0% 0.0%11/01/09 - 10/31/10 50 78.0% 8.0% 10.0% 4.0% 0.0%11/01/10 - 10/31/11 75 81.3% 10.7% 8.0% 0.0% 0.0%11/01/11 - 10/31/12 32 62.5% 25.0% 9.4% 3.1% 0.0%
5 Year Total 263 78.2% 12.3% 7.2% 1.9% 0.4%
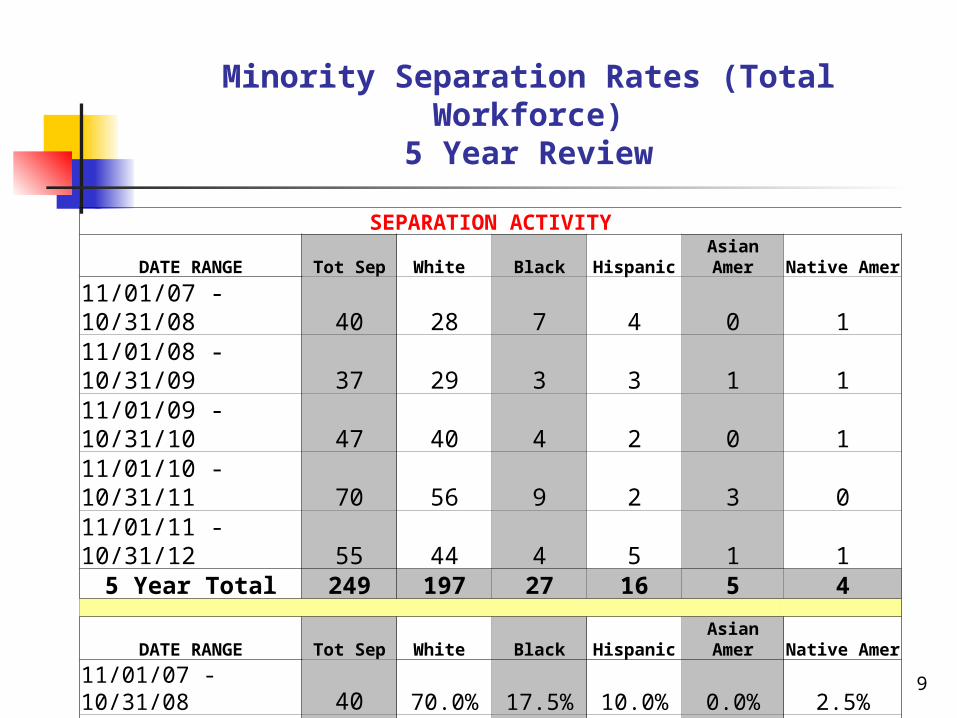
Minority Separation Rates (Total Workforce)
5 Year Review
9
SEPARATION ACTIVITYDATE RANGE Tot Sep White Black Hispanic Asian Amer Native Amer
11/01/07 - 10/31/08 40 28 7 4 0 111/01/08 - 10/31/09 37 29 3 3 1 111/01/09 - 10/31/10 47 40 4 2 0 111/01/10 - 10/31/11 70 56 9 2 3 011/01/11 - 10/31/12 55 44 4 5 1 1
5 Year Total 249 197 27 16 5 4
DATE RANGE Tot Sep White Black Hispanic Asian Amer Native Amer
11/01/07 - 10/31/08 40 70.0% 17.5% 10.0% 0.0% 2.5%11/01/08 - 10/31/09 37 78.4% 8.1% 8.1% 2.7% 2.7%11/01/09 - 10/31/10 47 85.1% 8.5% 4.3% 0.0% 2.1%11/01/10 - 10/31/11 70 80.0% 12.9% 2.9% 4.3% 0.0%11/01/11 - 10/31/12 55 80.0% 7.3% 9.1% 1.8% 1.8%
5 Year Total 249 79.1% 10.8% 6.4% 2.1% 1.6%

Minority Promotion Rates (Total Workforce)5 Year Review
10
PROMOTION ACTIVITYDATE RANGE Tot Promo White Black Hispanic Asian Amer Native Amer
11/01/07 - 10/31/08 43 35 6 1 1 011/01/08 - 10/31/09 29 25 3 1 0 011/01/09 - 10/31/10 25 13 10 2 0 011/01/10 - 10/31/11 32 24 6 1 1 011/01/11 - 10/31/12 12 10 1 1 0 0
5 Year Total 141 107 26 6 2 0
DATE RANGE Tot Promo White Black Hispanic Asian Amer Native Amer
11/01/07 - 10/31/08 43 81.4% 14.0% 2.3% 2.3% 0.0%
11/01/08 - 10/31/09 29 86.2% 10.4% 3.4% 0.0% 0.0%
11/01/09 - 10/31/10 25 52.0% 40.0% 8.0% 0.0% 0.0%
11/01/10 - 10/31/11 32 75.0% 18.8% 3.1% 3.1% 0.0%
11/01/11 - 10/31/12 12 83.3% 8.3% 8.3% 0.0% 0.0%
5 Year Total 141 75.9% 18.4% 4.3% 1.4% 0.0%

11
GRCC Applicants(for vacancies 11/1/11 – 10/31/12)
Total Qualified Applicants = 1174 Total Applicants (qualified and not qualified) = 1332 32 Hires: average 41 applicants per hire
Qualified Applicants who self-identified = 1050 89.4% rate of self-identification (based on total qualified applicants) 46.2% (485) females qualified applicants 26.3% (276) minority qualified applicants

12
Total WorkforceHire & Separation Rates
2008 – 2012 Total Minorities Females
DATE RANGE Hires Separations Hires Separations Hires Separations
11/01/07 - 10/31/08 57 40 11 12 43 2411/01/08 - 10/31/09 49 37 9 8 28 1511/01/09 - 10/31/10 50 47 11 7 27 2611/01/10 - 10/31/11 75 70 14 14 44 3711/01/11 - 10/31/12 32 55 12 11 12 34
5 Year Total 263 249 57 52 154 136
Total Minorities FemalesDATE RANGE Hires Separations Hire Rate Sep Rate Hire Rate Sep Rate
11/01/07 - 10/31/08 57 40 19.3% 30.0% 75.4% 60.0%11/01/08 - 10/31/09 49 37 22.4% 18.9% 55.1% 40.5%11/01/09 - 10/31/10 50 47 22.0% 14.9% 54.0% 55.3%11/01/10 - 10/31/11 75 70 18.7% 20.0% 59.0% 52.9%11/01/11 - 10/31/12 32 55 37.5% 20.0% 37.5% 61.8%
5 Year Total 263 249 21.7% 20.9% 58.6% 54.6% Note: Regular, full & part time employees
5 year Observations:Minority hire rate is above separation rate Female hire rate above separation rate

13
Employment Activities Summary Separation Observations11/1/2011 to 10/31/2012
Total Separations (voluntary & involuntary) = 55 Reasons for separation:
14 Retirements 2 Deaths 17 Resignations 21 Positions eliminated/grant ended 1 Misconduct
11 of the 55 separations were minority separations (20%)
Separations by GRCC employee group: 28 separations in Meet & Confer (includes 6 retirements) 17 separations in Faculty (includes 5 retirements) 8 separations in ESP (includes 2 retirements) 1 separation in CEBA (a retirement) 1 separation in Campus Police

14
Employee Group BreakdownPromotion & Employment Rates
11/01/11 - 10/31/12
Total Minorities FemalesEmployee Group Promotions Employed* Promotions Employed* Promotions Employed*
Exec, Adm & Mgr 7 99 0 14 3 48Faculty 0 248 0 38 0 131Support 5 326 2 79 1 180Total 12 673 2 131 4 359 Total Minorities Females
Employee Group Promotions Employed* Promotions Employed* Promotions Employed*
Exec, Adm & Mgr 7 99 0.0% 14.1% 42.9% 48.5%Faculty 0 248 0.0% 15.3% 0.0% 52.8%Support 5 326 40.0% 24.2% 20.0% 55.2%Total 12 673 16.7% 19.5% 33.3% 53.3%
Notes: Regular, full & part time employees at beginning of date range (11/01/12)

Employment Activities Summary Promotion & Employment Rates
11/01/11 - 10/31/12
Total Promotions = 12 (1.9% of Total Workforce) 2 (16.7%) Minorities (below employment rate of 19.5%) 4 (33.3%) Females (below Employment rate of 53.3%)
Executive, Administrator, Manager (7) No Minorities 3 (42.9%) Females
Support Staff (5) 2 (40.0%) Minorities 1 (20.0%) Female
15

Data Not Required for Affirmative Action Reporting: Adjunct Employees
16
SemesterTotal # of Adjuncts
Total # of Minorities
Total # of New Hires
% of New Minority New
Hires
Total # of New Hires who Attended ADJ
Event
Fall 2008 415 29 (6.9%) 99 9 (9.0%) NA
Winter 2009 427 31 (7.2%) 109 8 (7.3%) NA
Fall 2009 505 40 (7.9%) 164 16 (9.7%) NA
Winter 2010 535 41 (7.6%) 198 19 (9.5%) NA
Fall 2010 675 57 (8.4%) 105 12 (11.4%) NA
Winter 2011 684 67 (9.6%) 61 14 (23%) 15
Fall 2011 628 57 (9.1%) 42 7 (16.7%) 6
Winter 2012 600 52 (8.7%) 24 2 (8.3%) 9
Fall 2012 595 61 (10.2%) 27 5 (18.5%) 5
Winter 2013 574 53 (9.2%) 24 2 (8.3%) 5

Questions/Comments