Grand Canyon River Statistics, Five Year Review
23
It has been four years since the 2006 Colorado River Management Plan (CRMP) was adopted. The following pages answer five questions the National Park Service was recently asked: How many noncommercial launches go unused? What can you tell us about lottery applicants? Have noncommercial passengers changed? Are there many former waitlist members left? Will the February 2012 Main Lottery be just like the February 2011 Main Lottery? This presentation was given on Oct. 31, 2010 by Steve Sullivan, Permits Program Manager, Grand Canyon National Park and posted on Grand Canyon National Park’s website on Nov 3, 2010. Grand Canyon River Statistics, Five Year Update, Oct. 31, 2010 Page 1 of 23
Transcript of Grand Canyon River Statistics, Five Year Review
It has been four years since the 2006 Colorado River Management Plan (CRMP) was adopted. The following pages answer five questions the National Park Service was recently asked:
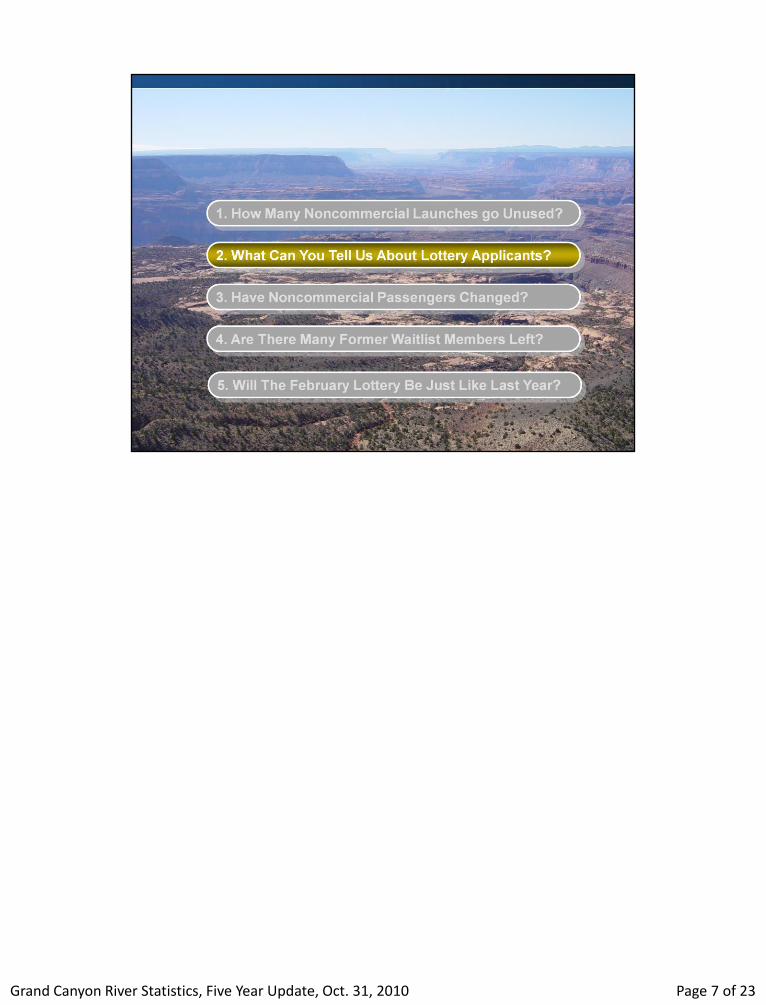
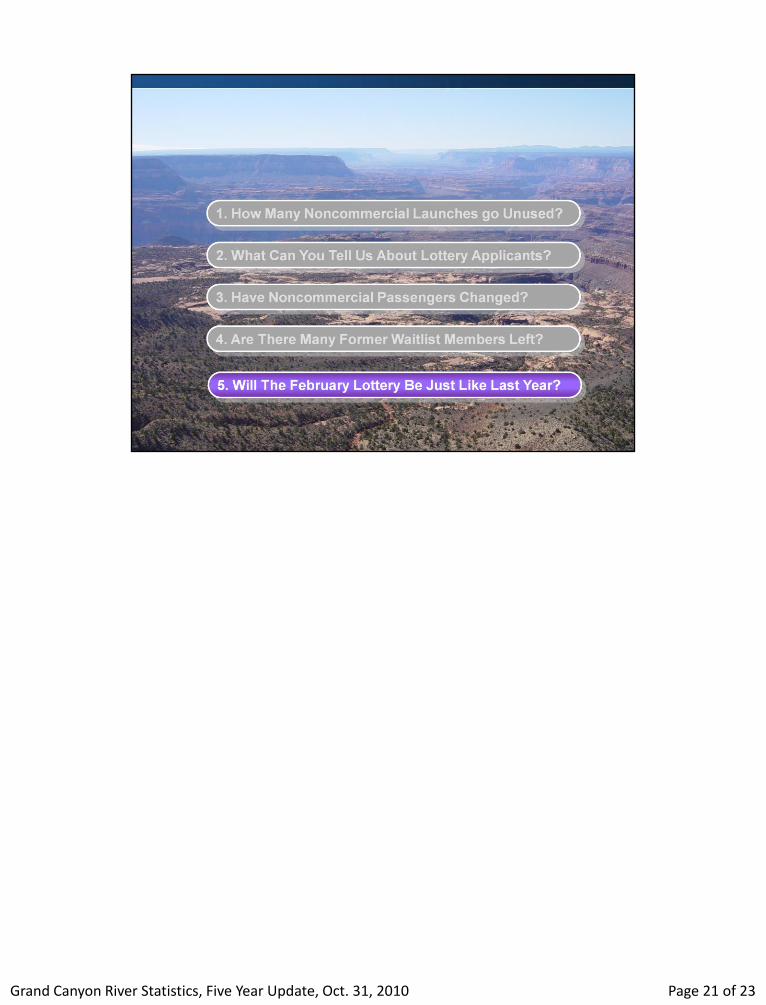
How many noncommercial launches go unused? What can you tell us about lottery applicants? Have noncommercial passengers changed? Are there many former waitlist members left? Will the February 2012 Main Lottery be just like the February 2011 Main Lottery? This presentation was given on Oct. 31, 2010 by Steve Sullivan, Permits Program Manager, Grand Canyon National Park and posted on Grand Canyon National Park’s website on Nov 3, 2010.
Grand Canyon River Statistics, Five Year Update, Oct. 31, 2010 Page 1 of 23
Grand Canyon River Statistics, Five Year Update, Oct. 31, 2010 Page 2 of 23
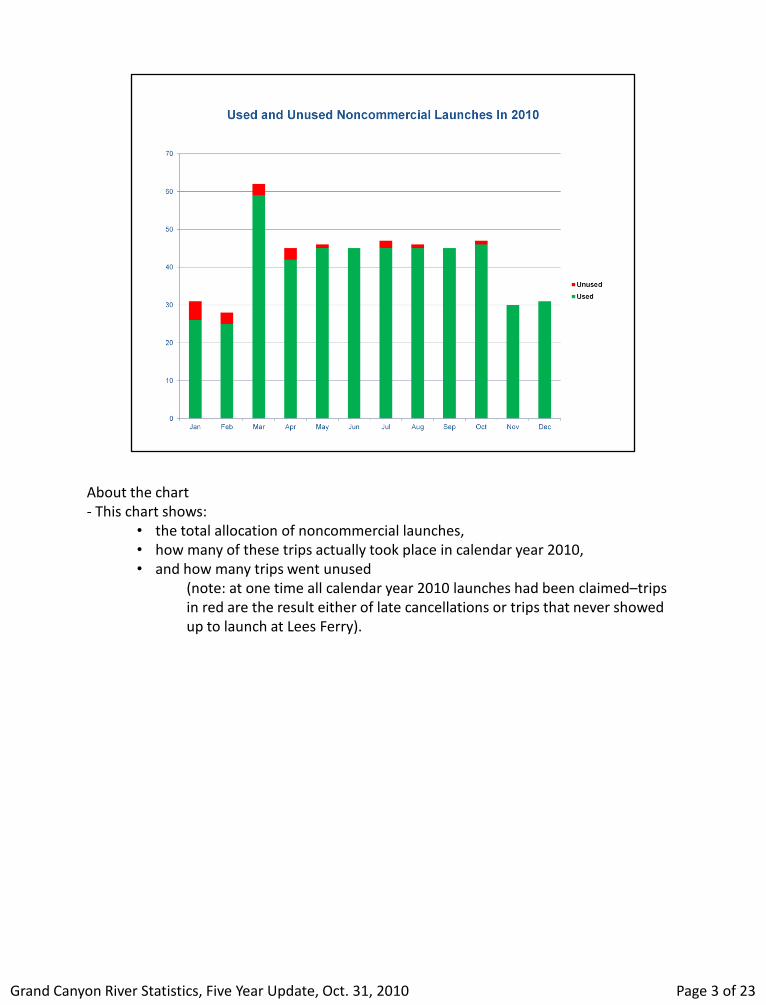
About the chart - This chart shows:
• the total allocation of noncommercial launches, • how many of these trips actually took place in calendar year 2010, • and how many trips went unused
(note: at one time all calendar year 2010 launches had been claimed–trips in red are the result either of late cancellations or trips that never showed up to launch at Lees Ferry).
Page 3 of 23 Grand Canyon River Statistics, Five Year Update, Oct. 31, 2010
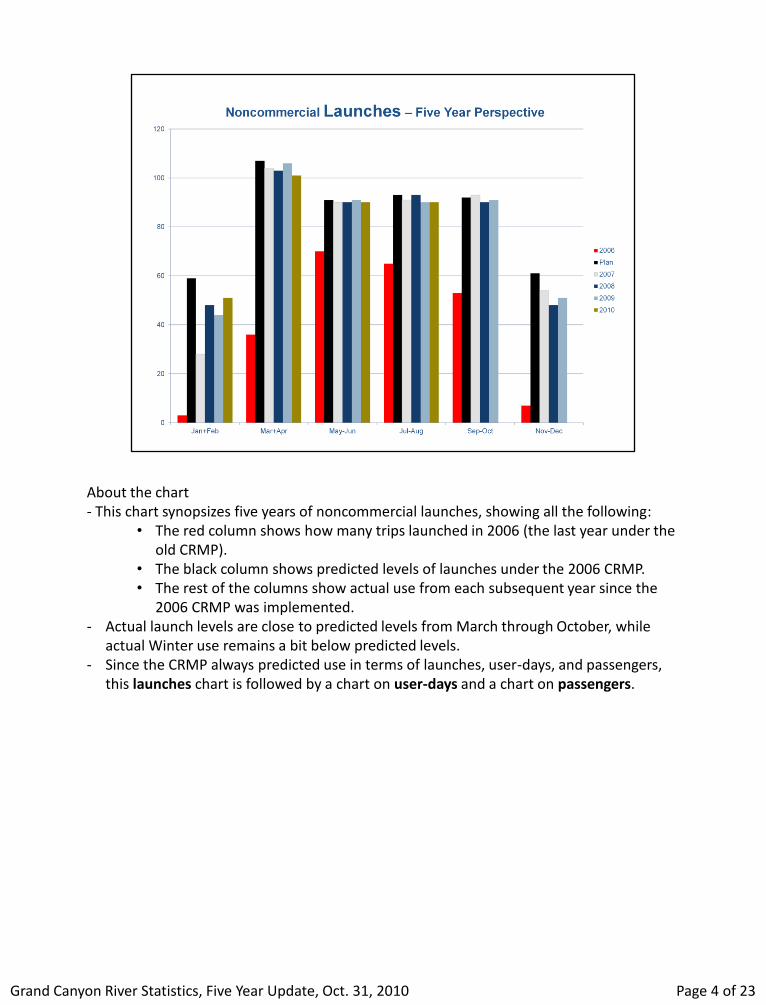
About the chart - This chart synopsizes five years of noncommercial launches, showing all the following:
• The red column shows how many trips launched in 2006 (the last year under the old CRMP).
• The black column shows predicted levels of launches under the 2006 CRMP. • The rest of the columns show actual use from each subsequent year since the
2006 CRMP was implemented. - Actual launch levels are close to predicted levels from March through October, while
actual Winter use remains a bit below predicted levels. - Since the CRMP always predicted use in terms of launches, user-days, and passengers,
this launches chart is followed by a chart on user-days and a chart on passengers.
Page 4 of 23 Grand Canyon River Statistics, Five Year Update, Oct. 31, 2010
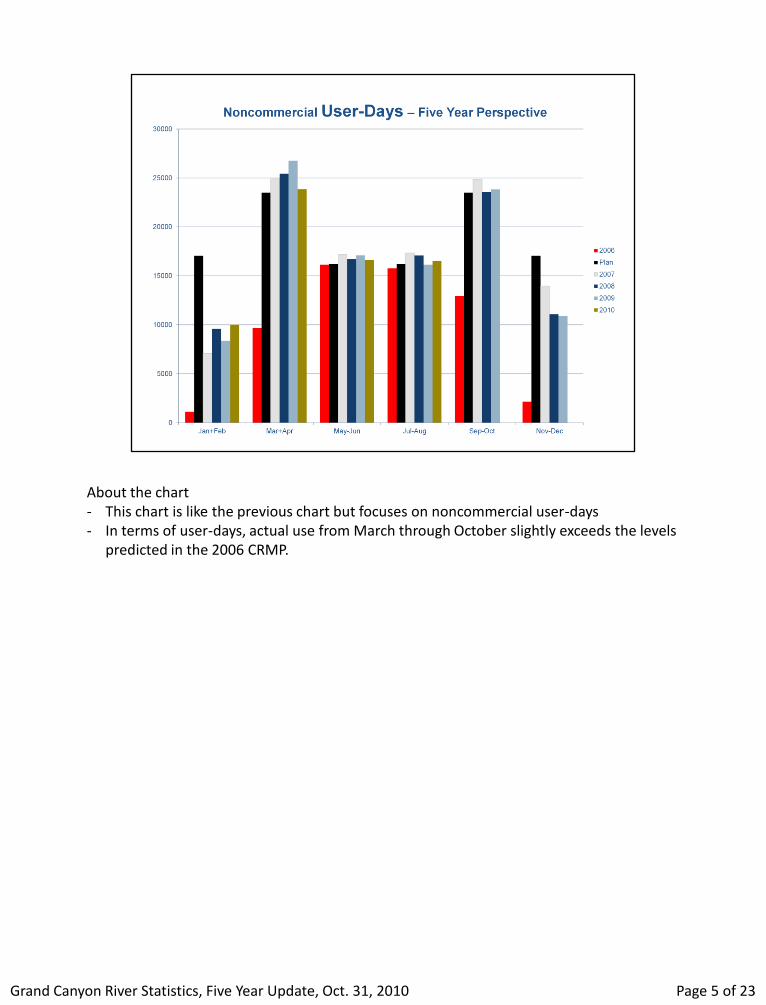
About the chart - This chart is like the previous chart but focuses on noncommercial user-days - In terms of user-days, actual use from March through October slightly exceeds the levels
predicted in the 2006 CRMP.
Page 5 of 23 Grand Canyon River Statistics, Five Year Update, Oct. 31, 2010
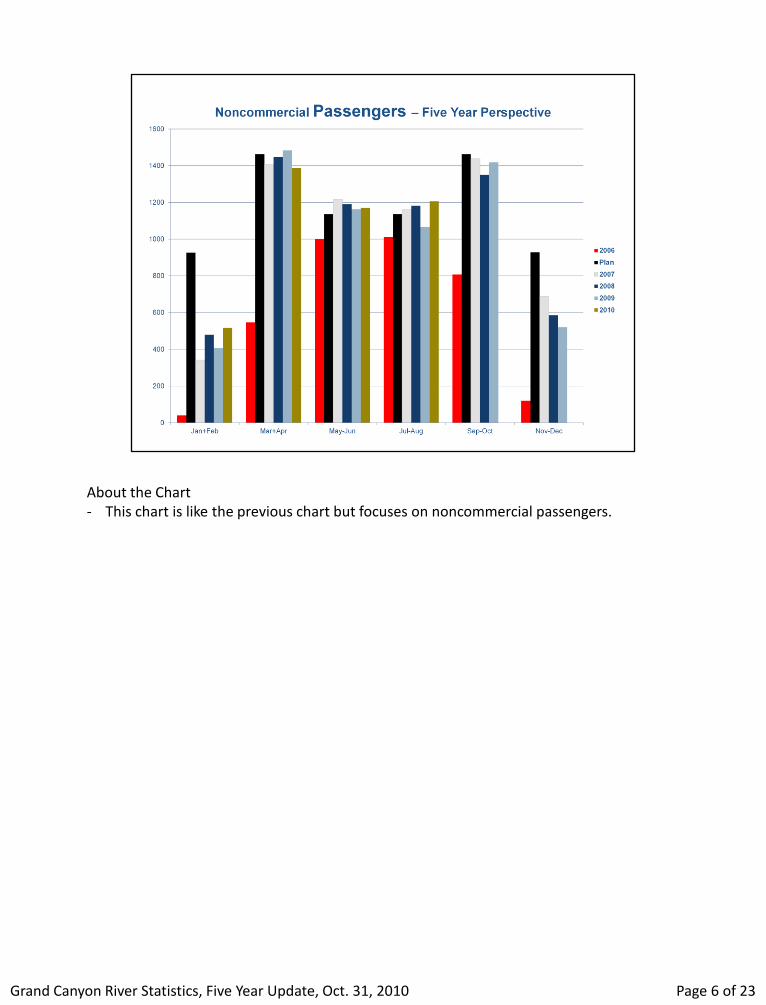
About the Chart - This chart is like the previous chart but focuses on noncommercial passengers.
Page 6 of 23 Grand Canyon River Statistics, Five Year Update, Oct. 31, 2010
Grand Canyon River Statistics, Five Year Update, Oct. 31, 2010 Page 7 of 23
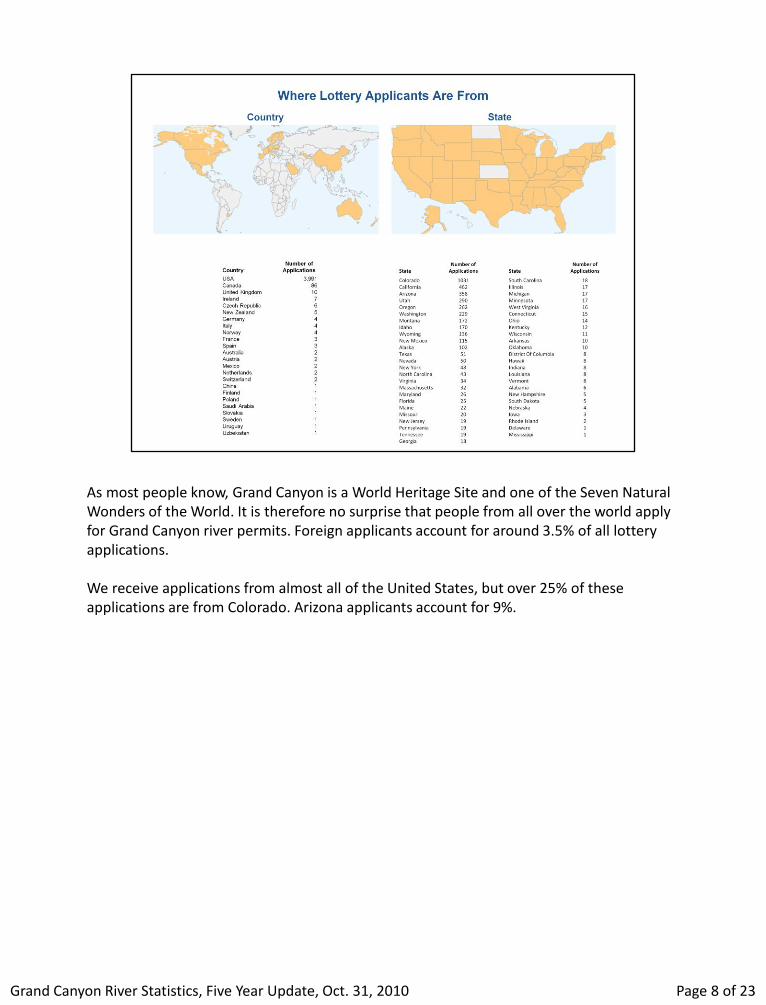
As most people know, Grand Canyon is a World Heritage Site and one of the Seven Natural Wonders of the World. It is therefore no surprise that people from all over the world apply for Grand Canyon river permits. Foreign applicants account for around 3.5% of all lottery applications. We receive applications from almost all of the United States, but over 25% of these applications are from Colorado. Arizona applicants account for 9%.
Page 8 of 23 Grand Canyon River Statistics, Five Year Update, Oct. 31, 2010
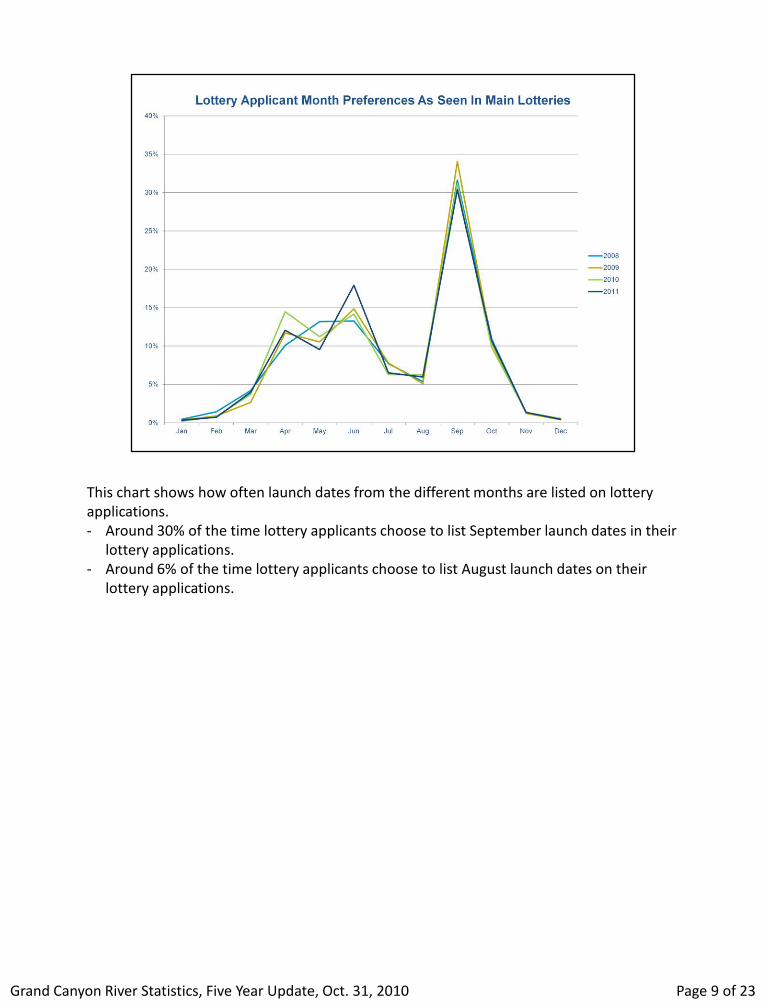
This chart shows how often launch dates from the different months are listed on lottery applications. - Around 30% of the time lottery applicants choose to list September launch dates in their
lottery applications. - Around 6% of the time lottery applicants choose to list August launch dates on their
lottery applications.
Page 9 of 23 Grand Canyon River Statistics, Five Year Update, Oct. 31, 2010
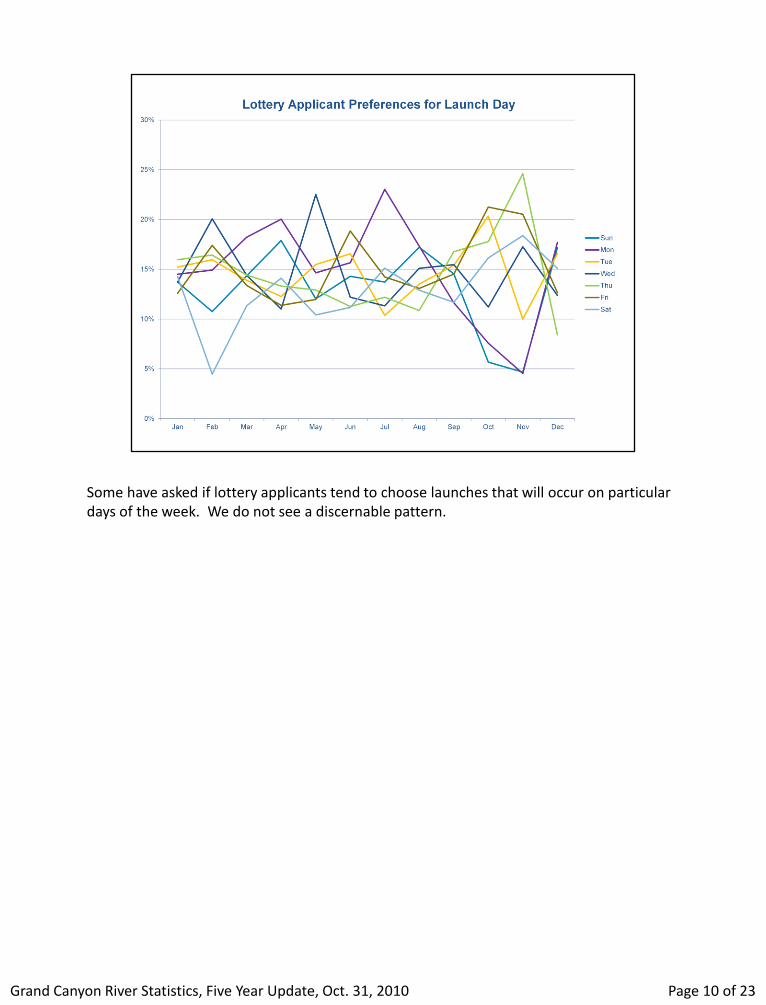
Some have asked if lottery applicants tend to choose launches that will occur on particular days of the week. We do not see a discernable pattern.
Page 10 of 23 Grand Canyon River Statistics, Five Year Update, Oct. 31, 2010
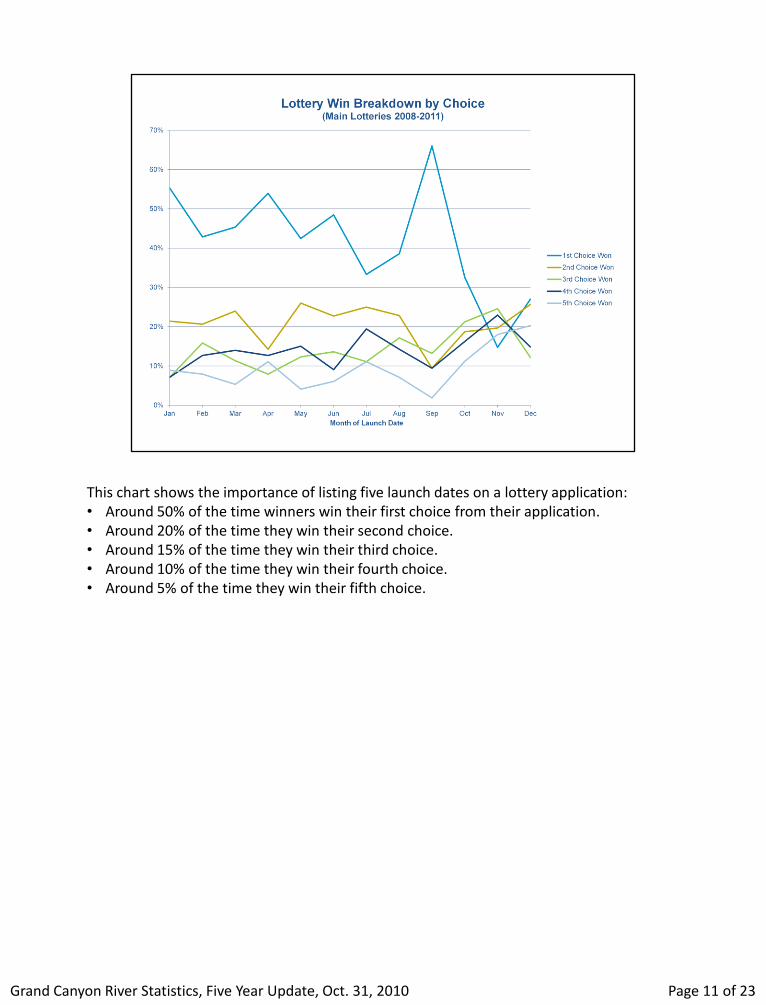
This chart shows the importance of listing five launch dates on a lottery application: • Around 50% of the time winners win their first choice from their application. • Around 20% of the time they win their second choice. • Around 15% of the time they win their third choice. • Around 10% of the time they win their fourth choice. • Around 5% of the time they win their fifth choice.
Page 11 of 23 Grand Canyon River Statistics, Five Year Update, Oct. 31, 2010
Grand Canyon River Statistics, Five Year Update, Oct. 31, 2010 Page 12 of 23
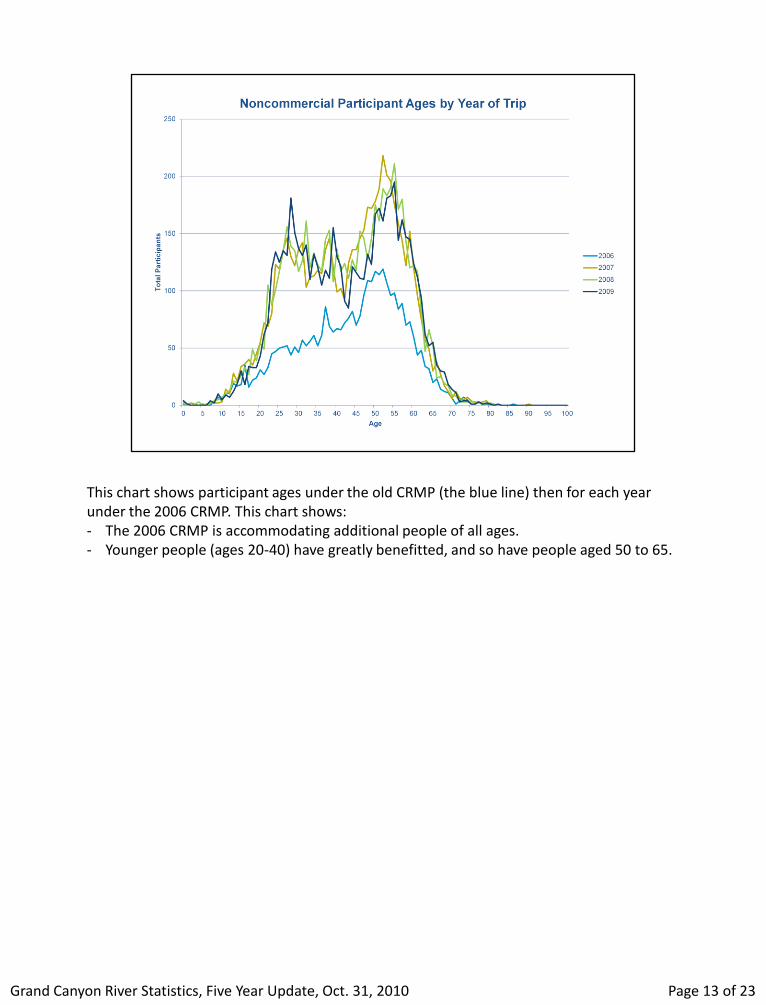
This chart shows participant ages under the old CRMP (the blue line) then for each year under the 2006 CRMP. This chart shows: - The 2006 CRMP is accommodating additional people of all ages. - Younger people (ages 20-40) have greatly benefitted, and so have people aged 50 to 65.
Page 13 of 23 Grand Canyon River Statistics, Five Year Update, Oct. 31, 2010
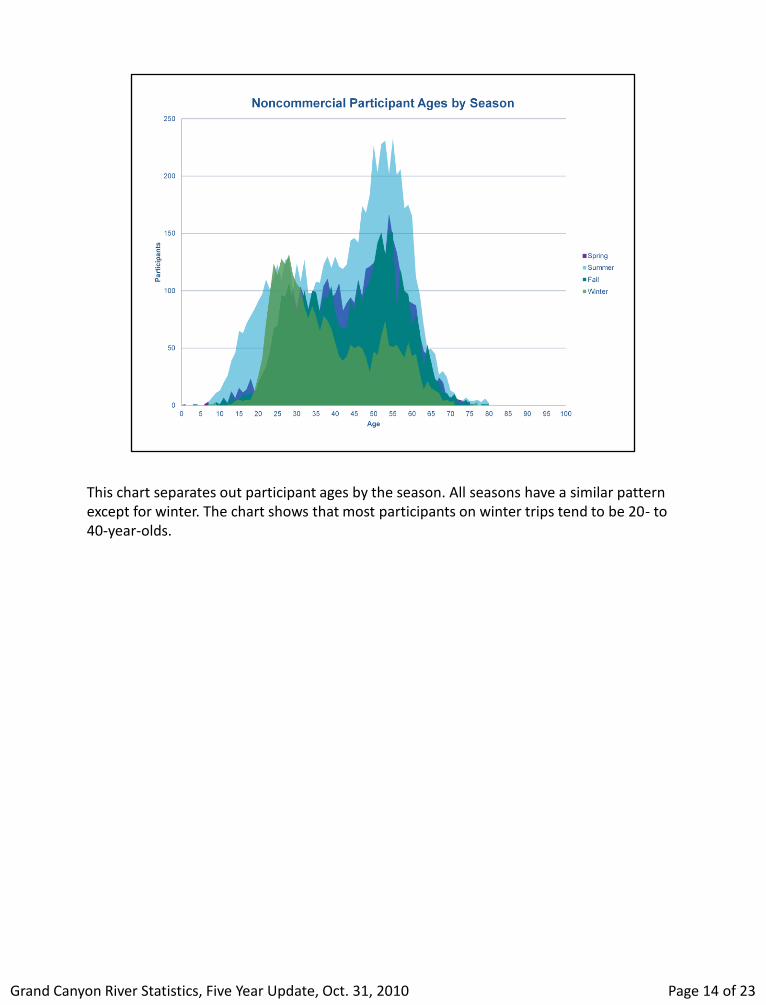
This chart separates out participant ages by the season. All seasons have a similar pattern except for winter. The chart shows that most participants on winter trips tend to be 20- to 40-year-olds.
Page 14 of 23 Grand Canyon River Statistics, Five Year Update, Oct. 31, 2010
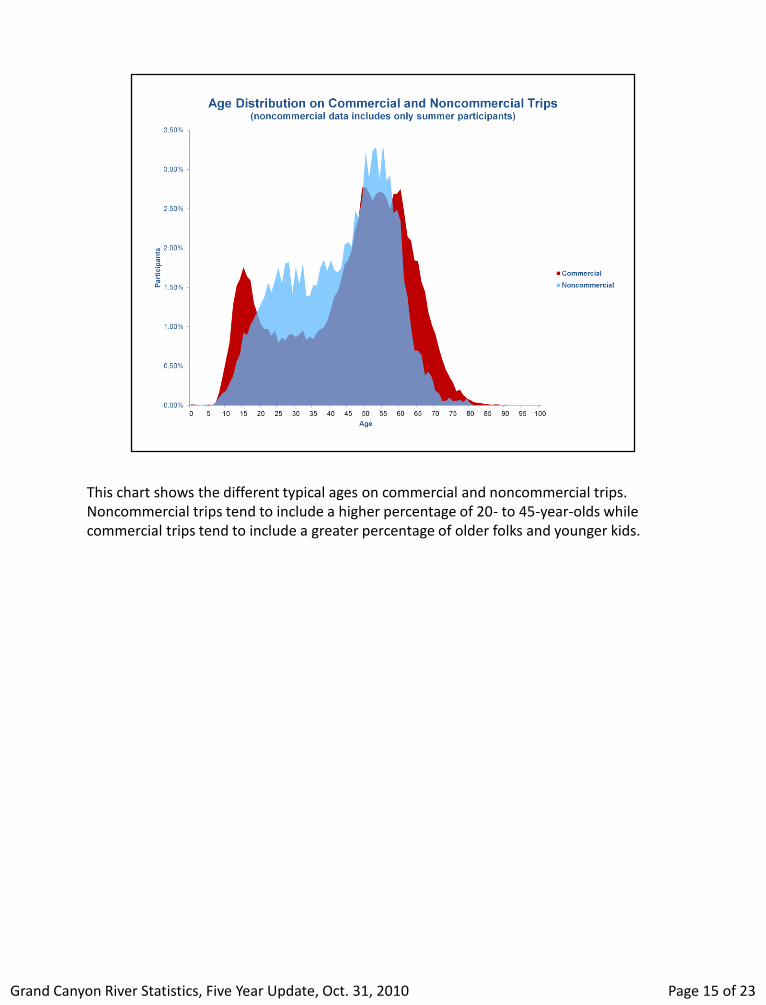
This chart shows the different typical ages on commercial and noncommercial trips. Noncommercial trips tend to include a higher percentage of 20- to 45-year-olds while commercial trips tend to include a greater percentage of older folks and younger kids.
Page 15 of 23 Grand Canyon River Statistics, Five Year Update, Oct. 31, 2010
Grand Canyon River Statistics, Five Year Update, Oct. 31, 2010 Page 16 of 23
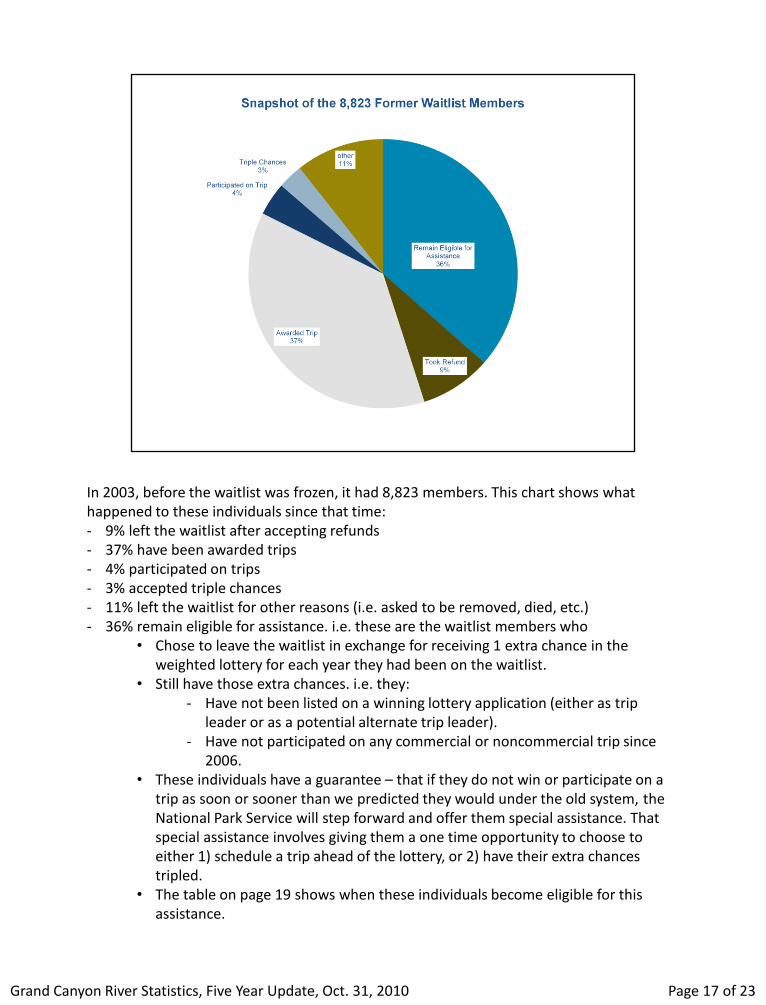
In 2003, before the waitlist was frozen, it had 8,823 members. This chart shows what happened to these individuals since that time: - 9% left the waitlist after accepting refunds - 37% have been awarded trips - 4% participated on trips - 3% accepted triple chances - 11% left the waitlist for other reasons (i.e. asked to be removed, died, etc.) - 36% remain eligible for assistance. i.e. these are the waitlist members who
• Chose to leave the waitlist in exchange for receiving 1 extra chance in the weighted lottery for each year they had been on the waitlist.
• Still have those extra chances. i.e. they: - Have not been listed on a winning lottery application (either as trip
leader or as a potential alternate trip leader). - Have not participated on any commercial or noncommercial trip since
2006. • These individuals have a guarantee – that if they do not win or participate on a
trip as soon or sooner than we predicted they would under the old system, the National Park Service will step forward and offer them special assistance. That special assistance involves giving them a one time opportunity to choose to either 1) schedule a trip ahead of the lottery, or 2) have their extra chances tripled.
• The table on page 19 shows when these individuals become eligible for this assistance.
Page 17 of 23 Grand Canyon River Statistics, Five Year Update, Oct. 31, 2010
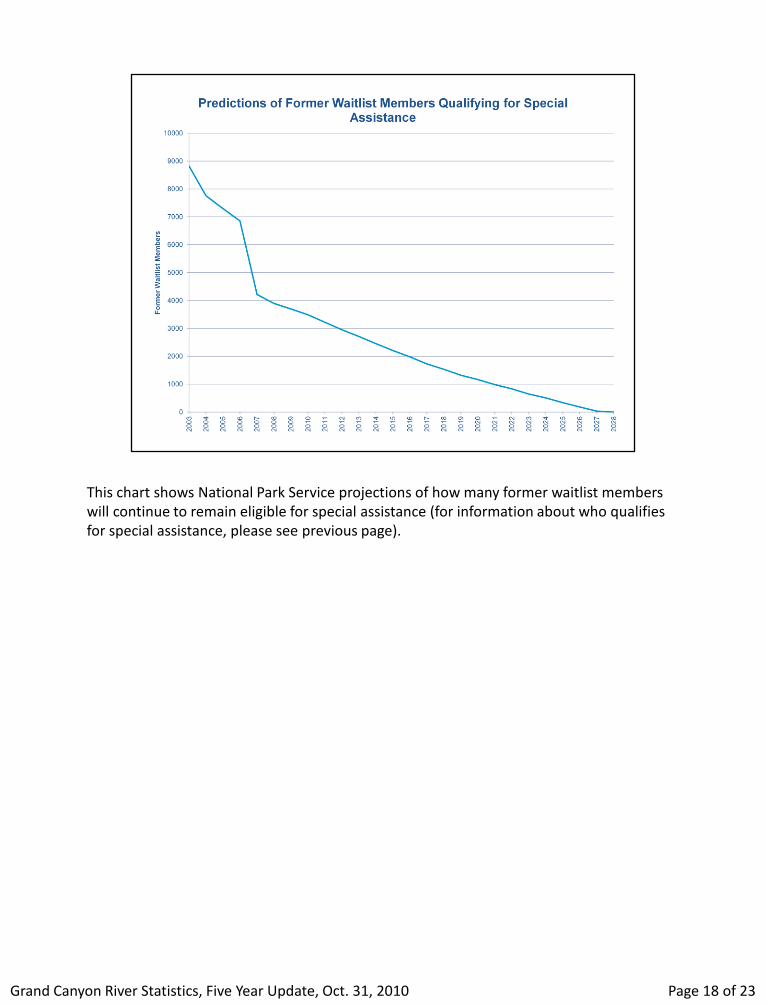
This chart shows National Park Service projections of how many former waitlist members will continue to remain eligible for special assistance (for information about who qualifies for special assistance, please see previous page).
Page 18 of 23 Grand Canyon River Statistics, Five Year Update, Oct. 31, 2010
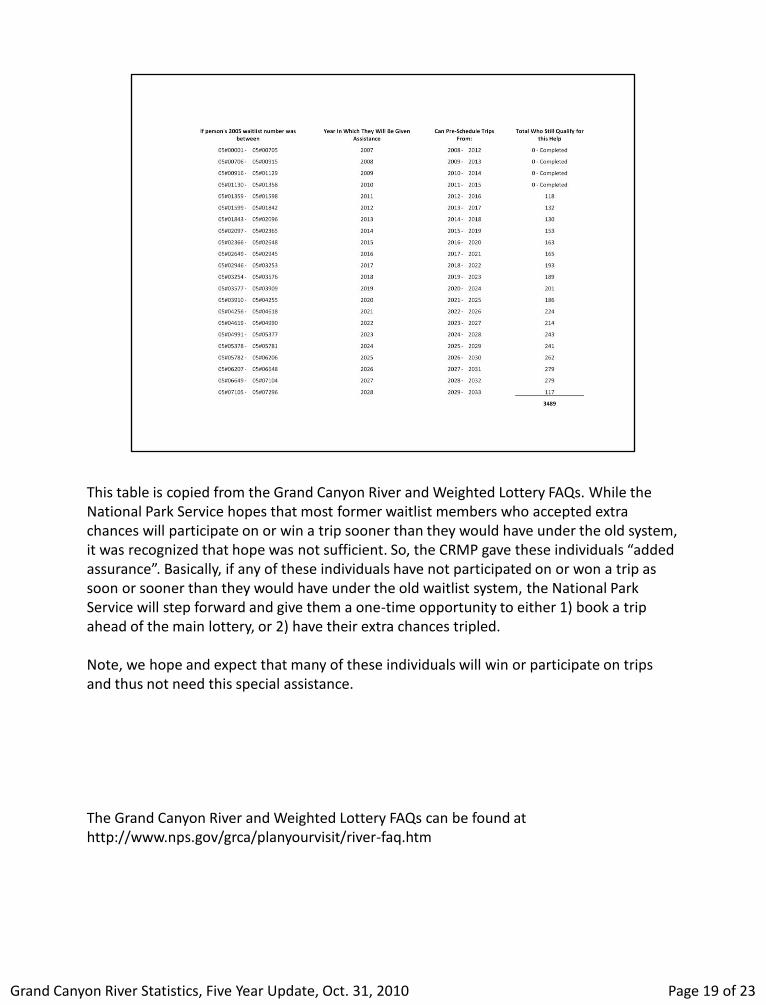
This table is copied from the Grand Canyon River and Weighted Lottery FAQs. While the National Park Service hopes that most former waitlist members who accepted extra chances will participate on or win a trip sooner than they would have under the old system, it was recognized that hope was not sufficient. So, the CRMP gave these individuals “added assurance”. Basically, if any of these individuals have not participated on or won a trip as soon or sooner than they would have under the old waitlist system, the National Park Service will step forward and give them a one-time opportunity to either 1) book a trip ahead of the main lottery, or 2) have their extra chances tripled. Note, we hope and expect that many of these individuals will win or participate on trips and thus not need this special assistance. The Grand Canyon River and Weighted Lottery FAQs can be found at http://www.nps.gov/grca/planyourvisit/river-faq.htm
Page 19 of 23 Grand Canyon River Statistics, Five Year Update, Oct. 31, 2010
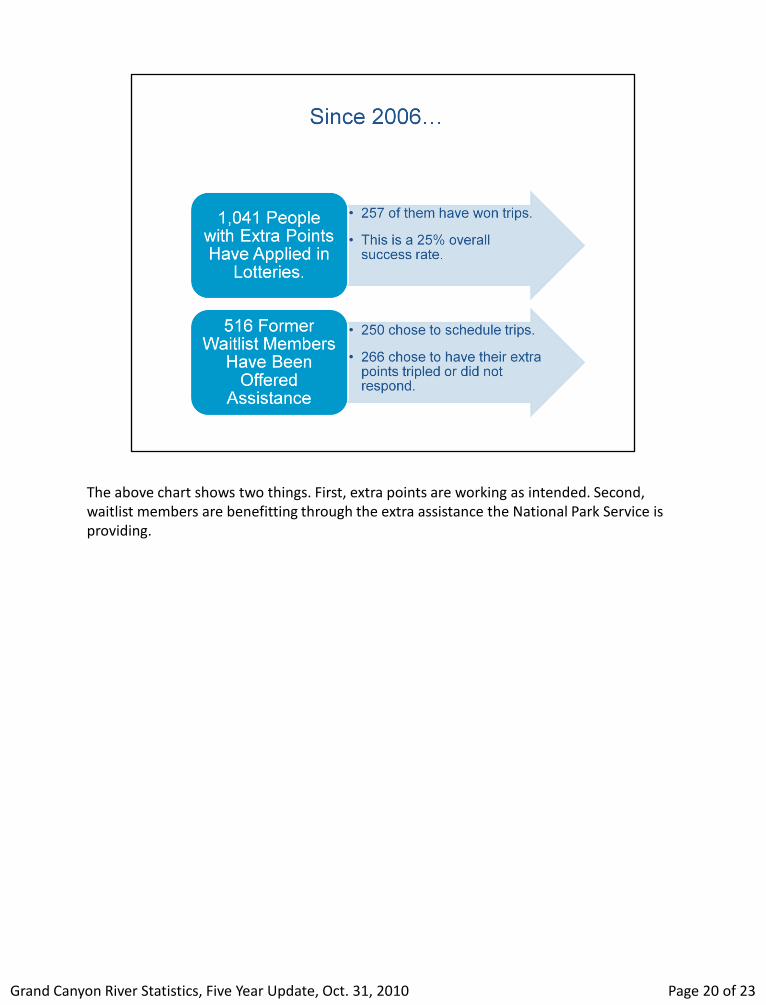
The above chart shows two things. First, extra points are working as intended. Second, waitlist members are benefitting through the extra assistance the National Park Service is providing.
Page 20 of 23 Grand Canyon River Statistics, Five Year Update, Oct. 31, 2010
Grand Canyon River Statistics, Five Year Update, Oct. 31, 2010 Page 21 of 23
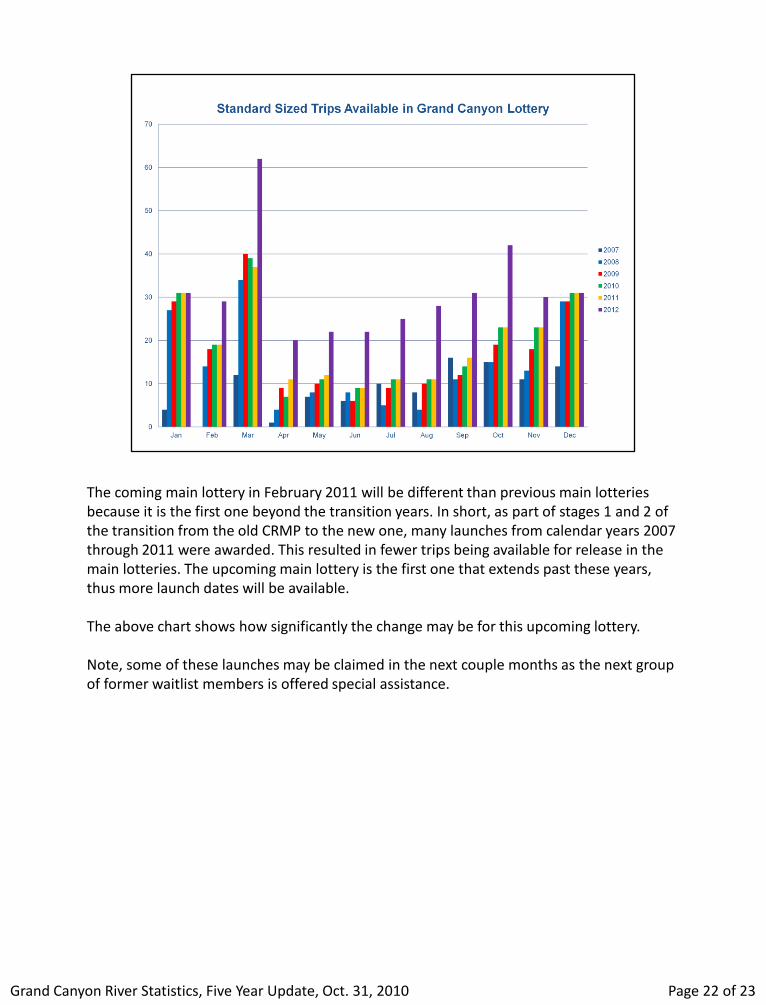
The coming main lottery in February 2011 will be different than previous main lotteries because it is the first one beyond the transition years. In short, as part of stages 1 and 2 of the transition from the old CRMP to the new one, many launches from calendar years 2007 through 2011 were awarded. This resulted in fewer trips being available for release in the main lotteries. The upcoming main lottery is the first one that extends past these years, thus more launch dates will be available. The above chart shows how significantly the change may be for this upcoming lottery. Note, some of these launches may be claimed in the next couple months as the next group of former waitlist members is offered special assistance.
Page 22 of 23 Grand Canyon River Statistics, Five Year Update, Oct. 31, 2010
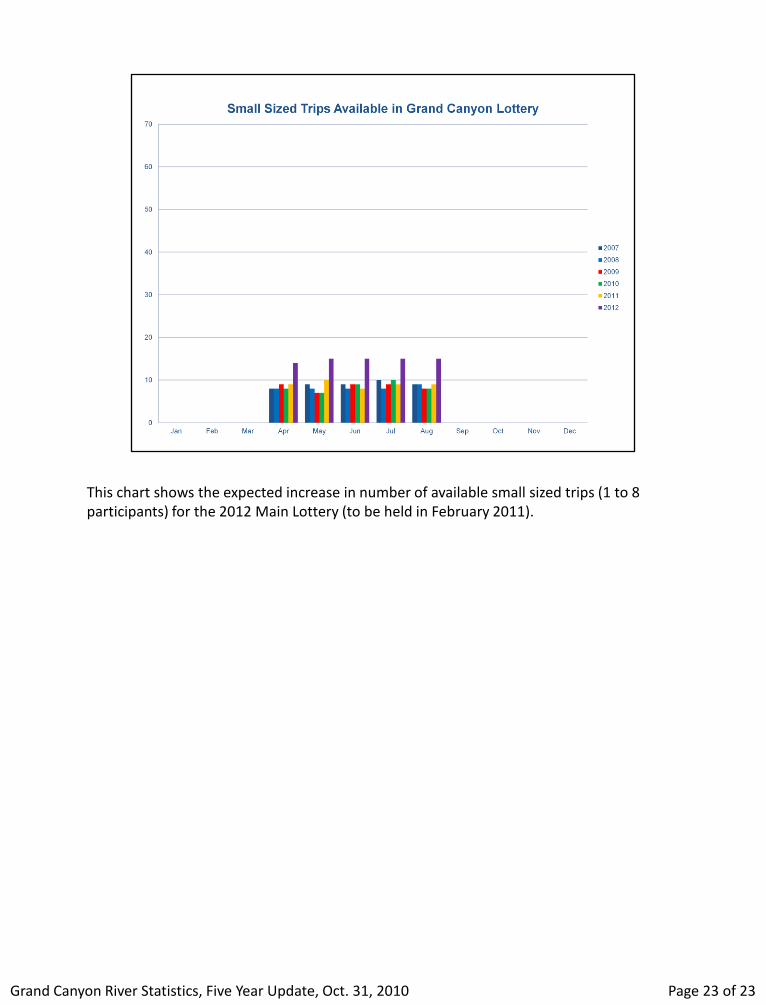
This chart shows the expected increase in number of available small sized trips (1 to 8 participants) for the 2012 Main Lottery (to be held in February 2011).
Page 23 of 23 Grand Canyon River Statistics, Five Year Update, Oct. 31, 2010