Introduction to Semiconductor Technology Teacher, Göran Thungström.

Göran Roos Professor, Strategic Design, Swinburne University
Chairman, VTT International
Honorary Professor at Warwick Business School, Warwick University Visiting Professor in Innovation Management and Business Model Innovation, VTT Technical Research Centre of Finland
Visiting Professor in Business Performance and Intangible Asset Management, Centre for Business Performance, Cranfield University Adjunct Professor, Mawson Institute, University of South Australia
Adjunct Professor, University of Adelaide Senior Advisor, Asia Pacific, Aalto Executive Education Academy

Making It In A High Cost Environment
The Importance Of Manufacturing
The Small Economy Issue
The Changing Shape Of Manufacturing
The Outdated Lens Of Public Statistics

Economist January 11 2012 ©Göran Roos 2012

©Göran Roos 2012 Roos, G., 2012, “Manufacturing for the Future”, Adelaide Thinker in Residence
Policy Report, Department of the Premier and Cabinet, Adelaide, Australia
Low Cost Environment High Cost Environment
Economic Lens: Neoclassical Innovation/Evolutionary &
Behavioural Economics
Normal basis for
competition: Lowest cost Highest Value for Money
Focus: Efficiency Efficiency & Effectiveness
Time horizon: Short Term Long Term
Innovation focus: Tactical Problem Solving Strategic Innovation
Innovation Behaviour: Arbitrage Value Creation & Value
Appropriation
Government Policy Tools: Supply Side Demand Side
Mindset: Owner Custodian
Profit use: Pocket Re-Invest

©Göran Roos 2012 OECD, Productivity Database, June 2011

For a high cost country like Sweden its export was distributed as roughly:
40% for high priced goods (+20 percentage points over the last 8 years)
50% for comparably prices goods and (-10 percentage points over the last 8 years)
10% for lower priced goods (+no change over the last 8 years)
Sweden’s National Innovation System has increased productivity in terms of both higher labour productivity and higher total factor productivity (TFP) more than other comparable EU countries. The TFP indicator thus points to a high degree of innovativeness for Sweden. Evidence of Sweden’s success according to an increase in ―high product quality in exports corroborates this picture.
©Göran Roos 2012 OECD data base
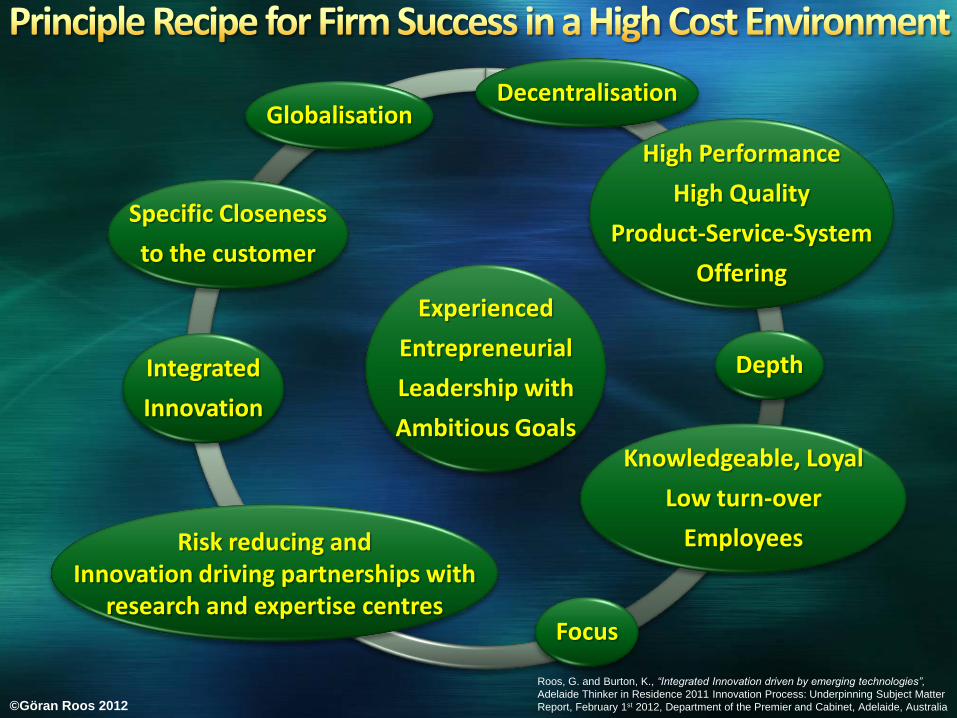
Experienced
Entrepreneurial
Leadership with
Ambitious Goals
Depth
Decentralisation
Knowledgeable, Loyal
Low turn-over
Employees
Focus
Integrated
Innovation
Globalisation
Specific Closeness
to the customer
High Performance
High Quality
Product-Service-System
Offering
Risk reducing and Innovation driving partnerships with
research and expertise centres
©Göran Roos 2012
Roos, G. and Burton, K., “Integrated Innovation driven by emerging technologies”,
Adelaide Thinker in Residence 2011 Innovation Process: Underpinning Subject Matter
Report, February 1st 2012, Department of the Premier and Cabinet, Adelaide, Australia

Australia SwedenAustralia Sweden
Australia Sweden
Intangible investments in manufacturing and business services
Intangible Investments = Investments in:• R&D• ICT• Organisational Structures• Design• Brand Equity• Education and Training
Edquist, H., 2011, Intangible investment and the Swedish manufacturing and service sector
paradox – what can Europe learn?, Research Institute of Industrial Economics, Stockholm, Sweden ©Göran Roos 2012

2
2.2
2.4
2.6
2.8
3
3.2
3.4
3.6
3.8
4
Australian score
Global best performing country score
OperationsManagement
Performance Management
PeopleManagement
Extracted from slide No. 17 in Green, R., 2011, Future of manufacturing – management, innovation and
productivity, Presentation, Australian Chambers Business Congress Gold Coast Convention Centre, June 1-3 2011 ©Göran Roos 2012

My responsibility as an employer is to make you the employee more employable during your tenure with me
My responsibility as an employee is to make you the employer more successful during my tenure with you
We both want more firms that are more successful
We differ on how to distribute the economic profit and social good that results from a successful firm
©Göran Roos 2012

Innovation Management Innovation Strategy &
Innovation Management System
Innovation to Create Value Through
Efficiency Improving Innovations, Technology Based
Innovations, Design Based Innovations, Art Based
Innovations and Hermeneutic Based Innovations
Inn
ovati
on
to
Ap
pro
pri
ate
Valu
e
Th
rou
gh
Eff
ec
tive
ne
ss
Im
pro
vin
g In
no
va
tio
ns
an
d
Bu
sin
es
s M
od
el B
as
ed
In
no
va
tio
ns
©Göran Roos 2012 Roos, G., “Integrated Innovation – The necessary route to profitability“,
in B+I Strategy (ed.), Estrategia, Bilbao, Spain, December, 2011, pp. 51-58

Types of Strategic Resources
Owned or Controlled
By the Firm
Owned or Controlled
By the Firm
Owned or Controlled
By the Firm
Additive Additive
Owned or Controlled
by the Other Party
Owned or Controlled
By the Employee
©Göran Roos 2012 Roos, G., Pike, S. and Fernström, L., “Managing Intellectual Capital in
Practice”, Butterworth-Heinemann, an imprint of Elsevier, USA, 2005/2006

MONETARY
PHYSICAL
RELATIONAL
ORGANISATIONAL
HUMAN
MONETARY PHYSICAL REL. ORG. HUMAN
Knowledge
codification,
new IP
Building &
developing
relationships
Developing
prototypes
Sales of
man-hours
Sale of IP,
processes &
knowledge
Produce
By
numbers
CRM
Developing
competence
through use
Relationship
arbitrage
Use of other
company’s
assets
Access to
process Co-learning
Sales of
products
Design
&
Chemical
effect
New
Processes
New
Knowledge
Investment
in assets
Investment
in building
links
Investment
in brands,
image and
systems
Recruitment
training,
conditions
Training
Chemical
synthesis
Word of
mouth
Systems
generate
IP
Investment
In financial
instruments
Examples of Resource Transformations
©Göran Roos 2012 Roos, G., Pike, S. and Fernström, L., “Managing Intellectual Capital in
Practice”, Butterworth-Heinemann, an imprint of Elsevier, USA, 2005/2006

Science Art
Medicine Design
Reductionist Approach Integrative Approach
Exploring ModelsChanging Reality
Subjective Understanding
Expressing ModelsQuestioning Reality
Individual Understanding
Explanatory ModelsExplaining Reality
Universal Understanding
Working ModelsImproving Reality
Hermeneutic Understanding
Abstract Presentation of Insights
Practical Presentation of Insights
Hermeneutic
©Göran Roos 2012
Roos, G. and Burton, K., “Integrated Innovation driven by emerging technologies”,
Adelaide Thinker in Residence 2011 Innovation Process: Underpinning Subject Matter
Report, February 1st 2012, Department of the Premier and Cabinet, Adelaide, Australia

Share of respondent Nordic companies that have developed products by combining different technologies or technical solutions, which traditionally were not used in their industry (2008)
©Göran Roos 2012
Larsen, P. B., Ahlqvist, T. and Friðriksson, K., 2009, Applying Technology Convergence for
Innovation in Nordic regions, Nordic Innovation Centre, Oslo, Norway
Eslake, S., 2011, Productivity: The Lost Decade, Paper presented to the annual policy conference
of the Reserve Bank of Australia, HC Coombs Conference Centre, Kirribilli, Sydney, 15th August
Australia 12%
Australia have a typical low cost environment approach of copying whilst
Sweden have a typical high cost environment approach of innovating

Value derived
from the
deployment of
the offering
Value derived
from the
possession of
the offering
Value derived
from the
appreciation
of the offering
Instrumental
value
Intrinsic
value Extrinsic
value
Relevance means highest total value delivered per unit of total cost
Cost=what I give up in return for what I get
©Göran Roos 2012 Roos, G., Pike, S. and Fernström, L., “Managing Intellectual Capital in
Practice”, Butterworth-Heinemann, an imprint of Elsevier, USA, 2005/2006

1. Positioning of THIS business within the company’s strategy
2. Description of the Product-Service-System/Solutions offering
3. Value Proposition for each of the target customer segments, target consumer segments and other definitive stakeholders
4. Description how the target customer segments, target consumer segments and other definitive stakeholders capture value from the offering
5. What competitive advantage does the offering enable or contribute to within the target customer segments, target consumer segments and other definitive stakeholders
6. Value attribute, attribute preference and attribute performance for each of the target customer segments, target consumer segments and other definitive stakeholders
7. What requirements must be fulfilled by the target customer segments, target consumer segments and other definitive stakeholders in order to be able to benefit from the offering
8. Description of how the Product-Service-System/Solutions offering should be implemented at the target customer segments, target consumer segments and other definitive stakeholders to ensure the targeted benefits (value)
9. Place, role and strategy of THIS business in the business ecosystem of which it is part
10. Technology base of the Product-Service-System/Solutions offering
11. Design base of the Product-Service-System/Solutions offering
12. Art base of the Product-Service-System/Solutions offering
13. Counselling (Hermeneutic) base of the Product-Service-System/Solutions offering
14. Outgoing logistics and Distribution Channel choice for each of the target customer segments, target consumer segments and other definitive stakeholders
15. Incoming logistics and supply chain choice
16. Relationship width, depth and frequency for each of the target customer segments and other definitive stakeholders
17. Value Configuration (Value Chain, Value Shop, Value Network)
18. Resources, Competitive Advantage and Resource Deployment Structure (IC Navigator)
19. Cost structure
20. Revenue Models
In a good Business Model the Economic value added generated exceeds the revenues from the primary offering
©Göran Roos 2012
Roos, G. and Burton, K., “Integrated Innovation driven by emerging technologies”,
Adelaide Thinker in Residence 2011 Innovation Process: Underpinning Subject Matter
Report, February 1st 2012, Department of the Premier and Cabinet, Adelaide, Australia

Value
Added
from
Industry
Mfg Value
produced
per capita
(A$ ‘000)
Share of
servitised
manufacturing
firms
(share of mfg
firms offering
solutions)*
R&D
expenditure
share of
GDP
ICT-
investments
share of
total
investment
in industry
Expected
growth
rate 2011
Share of
households
with access
to internet
Total
Ranking
among
selected
countries
Australia 29% 11 23% (4%) 2.1% 13.3% 3.0% 67% 11
Austria 31% 22 14% (10%) 2.7% 12.3% 4.0% 69% 8
Canada 33% 20 42% (15%)** 1.8% 16.2% 3.0% 73% 6
Denmark 26% 23 21% (11%) 2.7% 24.6% 2.0% 82% 5
Finland 32% 27 53% (28%) 3.5% 21.2% 5.2% 72% 2
Germany 30% 22 29% (17%) 2.5% 13.4% 4.8% 75% 7
Japan 28% 31 12% (4%) 3.4% 13.2% 2.0% 64% 9
Spain 28% 17 26% (5%) 1.4% 13.7% 0.8% 51% 12
Sweden 28% 32 27% (18%) 3.8% 25.0% 7.3% 84% 1
Switzerland 28% 43 28% (17%) 2.5% 20.3% 3.2% 74% 4
UK 24% 12 25% (9%) 1.9% 23.8% 1.8% 71% 10
US 22% 18 59% (21%) 2.8% 26.3% 2.3% 62% 3
http://stats.oecd.org/ & http://www.tradingeconomics.com/data-all-countries.aspx © Copyright Göran Roos 2011
*Neely, A., 2009, Exploring The Financial Consequences Of The Servitization Of Manufacturing, AIM Research Working Paper Series, 069-February -2009
** Estimated as an average of US and UK numbers

2
2.2
2.4
2.6
2.8
3
3.2
3.4
3.6
3.8
4
Australian score
Global best performing country score
OperationsManagement
Performance Management
PeopleManagement
Extracted from slide No. 17 in Green, R., 2011, Future of manufacturing – management, innovation and
productivity, Presentation, Australian Chambers Business Congress Gold Coast Convention Centre, June 1-3 2011 ©Göran Roos 2012

Understand the distinction between services and solutions
Innovate to generate High Value Add
Innovate to Appropriate the Value Add Generated
Work Collaboratively and Globally
Develop/Acquire and Leverage Superior Management Capability, Intangible Resources and Tangible Assets
Develop Low Resource Footprint Closed-Loop Production Systems in Industrial Symbiosis Clusters
Ensure organisational flexibility to rapidly adapt to changing market needs – including changing technologies and inputs used.
Develop the BRICS as export markets
Based on: Future Manufacturing Industry Innovation Council,
Discussion paper: Trends in manufacturing to 2020, Draft, 19 Sep 2011 ©Göran Roos 2012

©Göran Roos 2012
Resources
Agriculture
Low density space and Biodiversity
Education
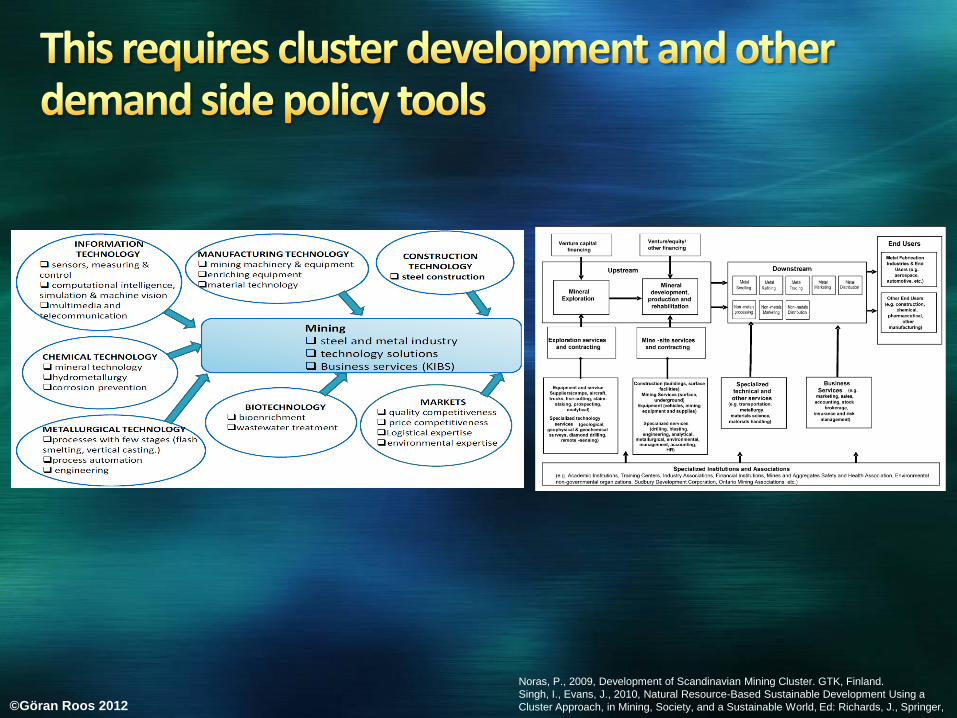
Noras, P., 2009, Development of Scandinavian Mining Cluster. GTK, Finland.
Singh, I., Evans, J., 2010, Natural Resource-Based Sustainable Development Using a
Cluster Approach, in Mining, Society, and a Sustainable World, Ed: Richards, J., Springer, ©Göran Roos 2012

The total forest industry production value by industry sectors
(Total production value in 2010 was EUR 20.4 billion)
Key money flows of the Finnish forest industry
(EUR millions) Employment in the Finnish forest cluster
Finnish Forest Industries Federation ©Göran Roos 2012

©Göran Roos 2012