Grammar, Punctuation, and Spelling: Controlling the Conventions of
49
DOCUMENT RESUME ED 282 928 TM 870 358 AUTHOR Applebee, Arthur N.; And Others TITLE Grammar, Punctuation, and Spelling: Controlling the Conventions of Written English at Ages 9, 13, and 17. The Nation's Report Card. INSTITUTION Educational Testing Service, Princeton, N.J.; National Assessment of Educational Progress, Princeton, NJ. SPONS AWINCY Office of Educational Research and Improvement (ED), Washington, DC. REPORT NO ETS-15-W-03; ISBN-0-88685-063-0; NAEP-15-W-03 PUB DATE Jun 87 GRANT NIE-G-83-0011 NOTE 49p.; This report supplements "Writing: Trends across the Decade, 1974-84" (ED 273 680) and "The Writing Report Card, Writing Achievement in American Schools" (ED 273 994). AVAILABLE FROM The Nation's Report Card, National Assessment of Educational Progress, Educational Testing Service, Rosedale Road, Princeton, NJ 08541-0001 ($6.50). PUB TYPE Reports - Research/Technical (143) EDRS PRICE MF01/PCO2 Plus Postage. DESCRIPTORS Age Differences; *Educational Assessment; Educational Trends; Elementary Secondary Education; *Grammar; *National Surveys; *Punctuation; Racial Differences; Sex Differences; *Spelling; Writing (Composition); *Writing Evaluation; Writing Skills IDENTIFIERS *National Assessment of Educational Progress ABSTRACT The National Assessment of Educational Progress (NAEP) administered a writing task to nationally representative samples of 9-, 13-, and 17-year-old students in order to assess their abilities to use the conventions of written English.'Approximately 2,000 students at each age level completed this task as part of NAEP's 1984 writing assessment. Subsamples were drawn from the total national sample. In order to have reasonable precision in comparisons between black students and white students, the black students were subsampled at a higher rate. In addition to measures of overall quality, each writing sample was analyzed for a variety of aspects of spelling, word choice, punctuation, and syntax. Experienced English teachers coded each sentence type and error on the papers. The analyzed papers were then entered into a computer-readable database. Analyses of data indicate that older students are more proficient than younger ones in their use of written language at both the sentence and the word levels: (1) older students use a greater proportion of complex sentences; (2) spelling improves markedly at the older ages; (3) students at all three ages make few errors in word choice or capitalization; and (4) the majority of students make very few punctuation errors. Because there is no consistent profile of the types of mistakes poor writers make, diagnosis of individual difficulties and instruction targeted at needed skills is recommended over large group drill and practice activities. The appendix contains the scoring guide outline. (LNO)
Transcript of Grammar, Punctuation, and Spelling: Controlling the Conventions of

DOCUMENT RESUME
ED 282 928 TM 870 358
AUTHOR Applebee, Arthur N.; And OthersTITLE Grammar, Punctuation, and Spelling: Controlling the
Conventions of Written English at Ages 9, 13, and 17.The Nation's Report Card.
INSTITUTION Educational Testing Service, Princeton, N.J.;National Assessment of Educational Progress,Princeton, NJ.
SPONS AWINCY Office of Educational Research and Improvement (ED),Washington, DC.
REPORT NO ETS-15-W-03; ISBN-0-88685-063-0; NAEP-15-W-03PUB DATE Jun 87GRANT NIE-G-83-0011NOTE 49p.; This report supplements "Writing: Trends across
the Decade, 1974-84" (ED 273 680) and "The WritingReport Card, Writing Achievement in American Schools"(ED 273 994).
AVAILABLE FROM The Nation's Report Card, National Assessment ofEducational Progress, Educational Testing Service,Rosedale Road, Princeton, NJ 08541-0001 ($6.50).
PUB TYPE Reports - Research/Technical (143)
EDRS PRICE MF01/PCO2 Plus Postage.DESCRIPTORS Age Differences; *Educational Assessment; Educational
Trends; Elementary Secondary Education; *Grammar;*National Surveys; *Punctuation; Racial Differences;Sex Differences; *Spelling; Writing (Composition);*Writing Evaluation; Writing Skills
IDENTIFIERS *National Assessment of Educational Progress
ABSTRACTThe National Assessment of Educational Progress
(NAEP) administered a writing task to nationally representativesamples of 9-, 13-, and 17-year-old students in order to assess theirabilities to use the conventions of written English.'Approximately2,000 students at each age level completed this task as part ofNAEP's 1984 writing assessment. Subsamples were drawn from the totalnational sample. In order to have reasonable precision in comparisonsbetween black students and white students, the black students weresubsampled at a higher rate. In addition to measures of overallquality, each writing sample was analyzed for a variety of aspects ofspelling, word choice, punctuation, and syntax. Experienced Englishteachers coded each sentence type and error on the papers. Theanalyzed papers were then entered into a computer-readable database.Analyses of data indicate that older students are more proficientthan younger ones in their use of written language at both thesentence and the word levels: (1) older students use a greaterproportion of complex sentences; (2) spelling improves markedly atthe older ages; (3) students at all three ages make few errors inword choice or capitalization; and (4) the majority of students makevery few punctuation errors. Because there is no consistent profileof the types of mistakes poor writers make, diagnosis of individualdifficulties and instruction targeted at needed skills is recommendedover large group drill and practice activities. The appendix containsthe scoring guide outline. (LNO)
r
S"-r-
THE NATION S
REPORTCARD laimal-11
Controlling the Conventions-
of Written En0Sh at Ages 9, 13, and 17
-sat,/444
D U C 1 1 Ci '1;`,1 t, I
THE NATION'S
REPORT
CARDMap
Grammar,Punctuation,
andSpellingControlling
the Conventionsof Written English
at Ages 9, 13, and 17Arthur N. Applebee
Judith A. LangerIna V.S. Mullis
June 1987
Report No: 15-W-03
Educational Testing Service
3

Table of Contents
Executive Summary 3
Chapter 1. Introduction and Overview 5
Chapter 2. General Characteristics of Student Writing 9
Chapter 3. Control of Conventions 25
Appendix 46
This report, No. 15.W.03, can be ordered from The Nation's Report Card, the NationalAssessment of Education& Progress (NAEP), at Educational Testing Service, Rosedale
Road, Princeton, New Jersey 08541.0001.
Library of Congress, Catalog Card Numben 87-061056
ISBN 0-88685-063-0
The work upon which this publication is based was performed pursuant to Grant No.NIE-G-83.0011 of the Office for Educational Research and Improvement It does not,however, necessarily reflect the views of that agency.
Educational Testing Service is an equal opportunity/affirmative action employer.
Educational Testing Sen4ce, ETS, andTesting Service.
24
are registered trademarks of Educational

Ca,
V
*
*..4
..
.o.
.-
a . ..
a
.
.-
.. "
.
.
,.-
.
.
.
.
t'
,...
.
.
I
. .
.-
.
..
a
, k.
a -
a
.
..
0
6
, V
.
.
a$$a
)"
1-
$
$s-
$

Introduction and Overview
When people think of writing instruction, part of their focus invari-ably turns to the conventions of written Englishto issues such
as grammar, punctuation, and spelling. While these conventions reflectwriters' needs to express themselves more clearly in written form, theyare often treated as a separate set of skillsto be taught, learned, andtested. "Have American schoolchildren mastered the mechanics?" is acontinuing question.
Since 1969, The Nation's Report Card, NAEP (National Assessmentof Educational Progress), has collected samples of student writing inresponse to a variety of assignments designed to assess proficiency inwritten expression. While the major focus of these assessments hasbeen on the ways in which 9-, 13-, and 17-year-olds organize andpresent their ideas, students' control of the conventions of writtenlanguage has also been analyzed and reported.
At each of the ages assessed, students have reported that theirteachers mark their papers for mechanical errors more frequently thanthey comment on their ideas (see The Writing Report Card). In Ameri-can schools, there has been a consistent focus on the mechanics ofwriting.
This report on the conventions of written language is intended as asupplement to Writing Trends Across the Decade, 197484 and to The
6 5

Writing Report Card, a report of NAEP's 1984 assessment of writingachievement.* The message of the three reports together echoes pastreports on writing and writing mechanics: Even though Americanschoolchildren have difficulty organizing and expressing their ideas in athoughtful manner, they have reasonable control over the conventionsof grammar, punctuation, and spelling.
What We Know About Students'Use of Writing Conventions:From Assessment to Action
The results of the 1984 assessment of the conventions of writing leadto a number of generalizations that can inform instructional practice:
1. Students are learning the conventions of writing. By age17, students write more complex and longer papers with amarkedly reduced rate of errors. They write more complex sen-tences and fewer sentence fragments and runons. Spelling per-formance improves substantially between ages 9 and 17; errorsin word choice and capitalization are rare at all three ages. Finally,the majority of students make very few punctuation errors. Stu-dents are learning what they are being taught and by the olderages appear to have developed control, if not perfection, in usingwritten language.
In general, Amedcan schools can take pride in their students'success in learning these skills and should continue to providestudents with a wide range of opportunities to engage in extendedwriting.
2. Everyone makes some errors. Even the best papers writtenfor the assessment usually included some errors. Particularly infirst-draft writing, when students do not have time to reflect on thesurface features of their writing and to make revisions, the occur-
A. Applebee, J. Langer, and I. Mullis. The Writing Report Card, Writing Achievement inAmerican Schools (Report No. 15-W-02). Princeton, NJ: National Assessment of Educa-tional Progress, Educational Testing Service, 1986.
A. Applebee, J. Langer, and I. Mullis. Writing lrends Across the Decade, 1974.84 (ReportNo. 15-W-01). Princeton, NJ: National Assessment of Educational Progress, EducationalTesting Service, 1986.
6
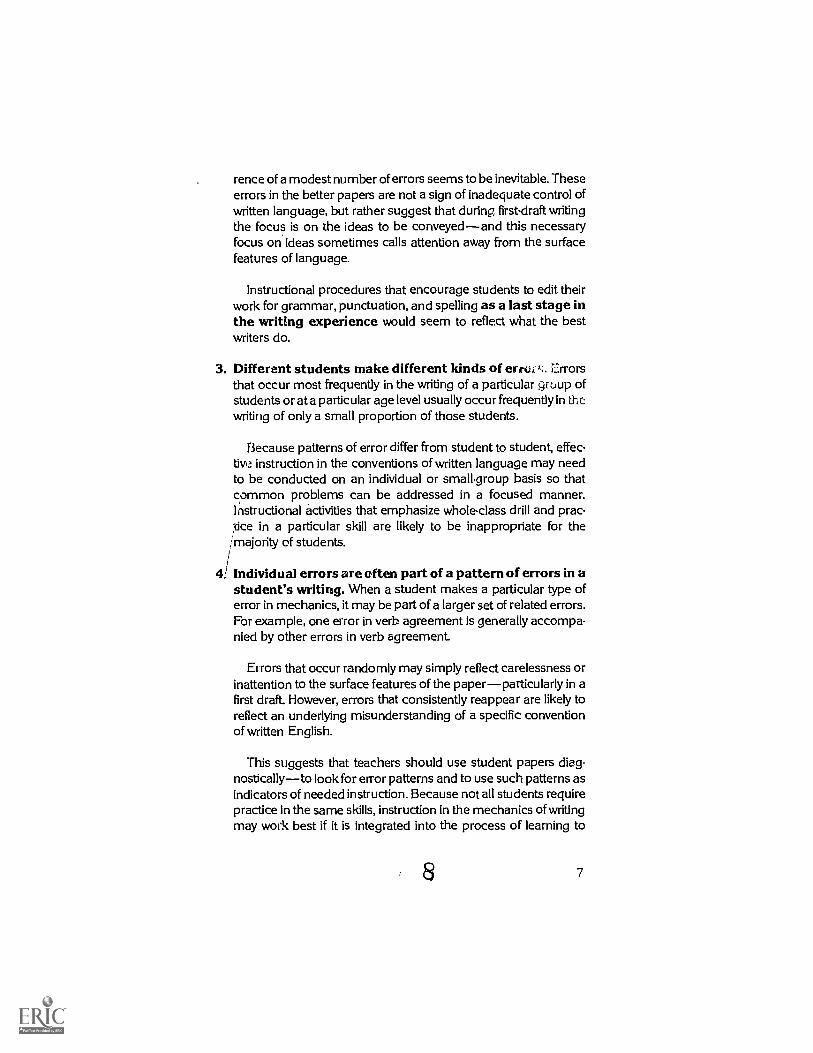
rence of a modest number of errors seems to be inevitable. Theseerrors in the better papers are not a sign of inadequate control ofwritten language, but rather suggest that during first-draft writingthe focus is on the ideas to be conveyedand this necessaryfocus on ideas sometimes calls attention away from the surfacefeatures of language.
Instructional procedures that encourage students to edit theirwork for grammar, punctuation, and spelling as a last stage inthe writing experience would seem to reflect what the bestwriters do.
3. Different students make different kinds of error &. Errorsthat occur most frequently in the writing of a particular group ofstudents or at a particular age level usually occur frequently in thewriting of only a small proportion of those students.
Because patterns of error differ from student to student, effec-tive instruction in the conventions of written language may needto be conducted on an individual or small.group basis so thatcommon problems can be addressed in a focused manner.Instructional activities that emphasize whole-class drill and prac-tice in a particular skill are likely to be inappropriate for the
/majority of students.
4! Individual errors are often part of a pattern of errors in astudent's writing. When a student makes a particular type oferror in mechanics, it may be part of a larger set of related errors.For example, one error in verb agreement is generally accompa-nied by other errors in verb agreement.
rors that occur randomly may simply reflect carelessness orinattention to the surface features of the paperparticularly in afirst draft. However, errors that consistently reappear are likely toreflect an underlying misunderstanding of a specific conventionof written English.
This suggests that teachers should use student papers diagnosticallyto look for error patterns and to use such patterns asindicators of needed instruction. Because not all students requirepractice in the same skills, instruction in the mechanics of writingmay work best if it is integrated into the process of learning to
7

write, and if it is responsive to particular needs. Teachers canfocus their help where it is most needed, on the particular featureof a student's writing that needs attention at a particular time.
5. Writing at greater length provides more opportunities tomake errors. Thus, the number of errors a student makes is inpart a function of how much is written. The longer papers writtenfor the assessment consistently included a greater number oferrors than did the shorter papers.
If teachers only concentrate on the number of errors studentsmake, it may have a negative effect on their willingness to write.For example, the lowest achieving student writers also write theshortest papersand this may be their way of keeping their errorcount low.
By being sensitive to this pattern, teachers can recognize thatthe errors that come with increased length may be indicative ofstudents' attempts at more thoughtful and more difficult writing.They can thus help students expect to be rewarded rather thanpenalized for taking on more extended or more complex writingtasks.
8

Chapter
General Characteristicsof Student Writing
The 1984 Writing Assessment
T he procedures used in the 1984 assessment of writing achieve-ment are presented in detail in The Writing Report Card. Nationally
representative samples of 9-, 13-, and 17year-old students completeda variety of writing tasks and answered questions about their attitudestoward and experiences with writing and related activities.* Results foroverall writing quality and its relationship to background questions arereported in two previous reports: Writing Trends Across the Decade,1974-84 and The Writing Report Card.
Assessing Students' Useof the Conventions of English
To examine students' ability to use the conventions of written English,one task that had been administered at all three age levels 9, 13, and17was selected for further analysis. For this task, students were
'MEP uses a deeply stratified, multi-stage sampling design. Each stage (primarysampling units, schools, and students) involves selecting random probability samples.The selection of primary sampling units Is controlled by community size, type, andgeographic region.
1 0 9

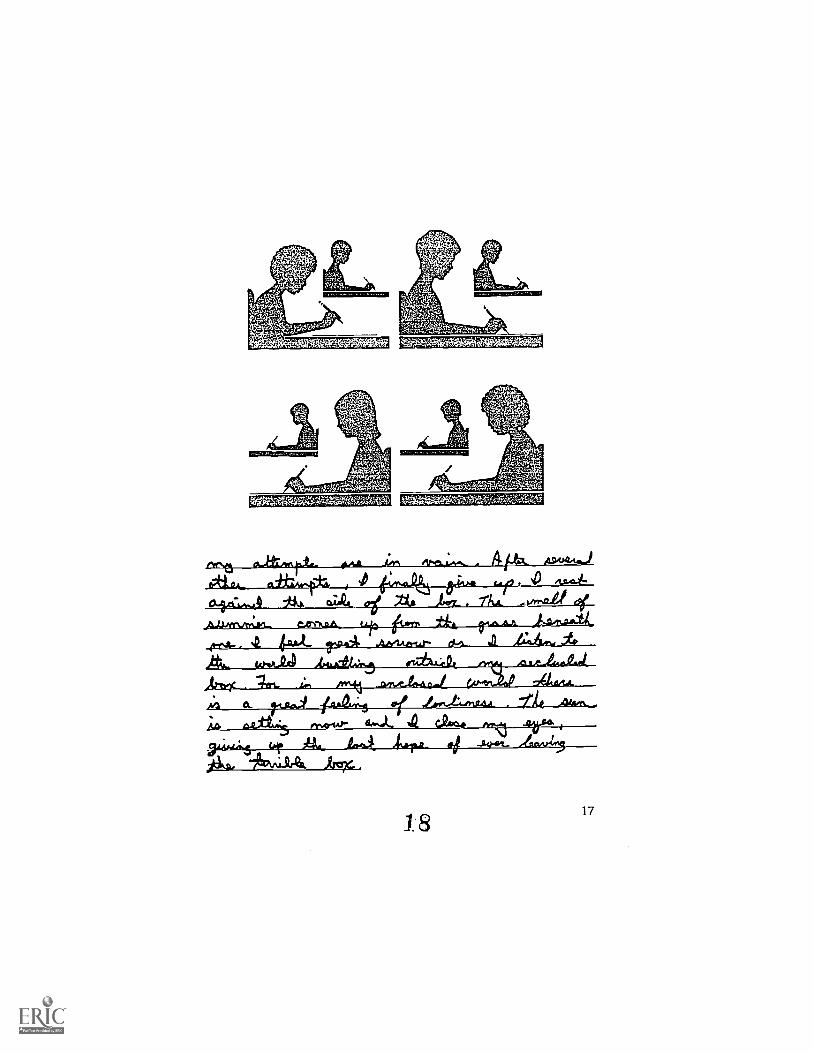
shown a picture of a large box that had a hole in it and an eye peekingthrough the opening. They were then asked to imagine themselves inthe picture and to describe the scene and how they felt about what wasgoing on around them. They were encouraged to make their descrip-tion "lively and interesting." Students were given about 16 minutes tocomplete the assignment.
Approximately 2,000 students at each age level completed this taskas part of NAEP's 1984 wilting assessment. For the detailed analysis ofadherence to the conventions of written English, nationally representa-tive probability subsamples were drawn from the total national sample.In order to have reasonable precision in comparisons between Blackstudents and White students, the Black students were subsampled at ahigher rate. The sample sizes used for analysis in this report are 418 atage 9, 452 at age 13, and 461 at age 17.* Results for these papersprovide good estimates of national levels of performance, as well asaccurate contrasts between subgroups defined by gender and race(Black and White students).
In addition to measures of overall quality, each writing sample wasanalyzed for a variety of aspects of spelling, word choice, punctuation,and syntax. Experienced Enalish teachers, thoroughly trained in scor-ing students' adherence to conventions of grammar and usage, identi-fied these features by coding each sentence type and error on thepapers. The analyzed papers (both the original text and accompanyingcodes) were then entered into a computer-readable database, fromwhich the measures discussed in the present report were derived.Details for these scores are provided in the appendix to this report.
Overall Quality of the Essays
Table 2.1 summarizes the evaluations of the overall quality of theessays, based on ratings of how successful students were in accom-plishing the task that was set (primary trait) and of their overall fluency(holistic). In evaluating task accomplishment at all three age levels,NAEP rated papers according to how well students were able to createan imaginaiy situation based on the picture that they were given.
'Some students subsampled wrote nonratable papers that had to be excluded from theanalysis of writing conventions.
10 11

The ratings of task accomplishment show a steady increase inperformance across the three ages, with the proportion of papers ratedminimal or better rising from 44 percent at age 9 to 71 percent at age17 and the proportion of good papers (those rated as adequate orbetter) rising from 5 percent at age 9 to 22 percent at age 17. Sub-groups also show similar patterns of growth across the age groups,though White students tended to perform better thrsn Black studentsand females better than males.
Two Views of Overall Quality forthe Hole-in-the-Box Writing Task
TABLE 2.1
(Subsample of Papers Analyzed for Conventions)
AGE 9
Task Accomplishment
Percentage Percentage
Minimal or Better Adequate
Papers Papers
{Primary Trait} {Primary Trait}2, 3 & 4 3 & 4
Overall Fluency
Percentage
Mean Better PapersPapers
{ Holistic4, 5 & 6
Nation 43.8% 5.3% 2.8 25.7%
Black 42.8 1.0 2.3 14 0
White 43.8 5.9 2.8 27.8
Male 39.9 0.3 2.6 23.2
Female 47.7 10.2 2.9 28.2
AGE 13
Nation 64.1 19.5 3.0 36.5
Black 50.9 6.6 2.3 18.4
White 66.4 21.3 3.1 39.0
Male 57.3 13.2 2.7 30.4
Female 71.0 25.9 3.3 42.3
AGE 17
Nation 71.4 21.6 3.5 48.5
Black 62.2 6.9 2.6 52.9
White 72.5 23.5 3.6 51.5
Male 64.5 17.9 3.1 36.7
Female 78.9 25.7 3.8 60.9
12 111

Ratngs of fluency were based on readers general impression ofeach writing sample, including such features as content, style, organiza-tion, and mechanics. In assessing fluency, each age group was judgedseparately.* This procedure attenuates or lessens the differencesamong the three age groups, but accentuates the differences amongsubgroups at each age. The patterns of subgroup differences in fluencyare similar to those for the measure of task accomplishment, with Whitestudents and females scoring higher than Black students and males,respectively.
To give a sense of the quality of writing that resulted, the followingexamples illustrate the poorer papers (rated 1, 2, or 3 on the holisticscale of overall fluency) and the better papers (rated 4, 5, or 6) at eachof the three age levels. The samples reflect the extent to which thegrowth' that takes place from age 9 to age 17 is multidimensional,involving content, length, diversity of vocabulary, spelling, syntax, andcontrol of other conventions.
Samples of Student Writing9-Year-Olds
Poor Paper (Rated 2 in Overall Fluency)
/ 1 IAS 40 .. a __,a dot
I .ILWIL.R.IlifirMI.rO.A./ .. IP. ...t
;114iMIEF . ..4 ... . la- 0 ..A .1 .
i
Ilf 41,1 .1101111111 Ilitinglti . ....1411.CM11,141MIP.A1-WillillYWIPAMJ4LW.4.
,01J
The purpose of this evaluation was to detect changes in writing performance for eachage level across time on each task. Thus, papers written in response to a particular taskby 9.year-olds (or 13.year-olds or 17-year-olds) as part 0 the writing assessmentsacross time including that taskwere randomly mixed together and rated relative to eachother. This comparative process enabled NAEP to report trends in writing performancewithin each age group across time; the trends are reported in Writing Trends Across theDecade. The differences in levels of performance noted from younger to older agegroups are a result of the readers' own internal standards.
1 312

Good Paper (Rated 5 in Overall Fluency)
A/1/6-A,LekiniltitzeFILIAL,Able
'SIP 1_ 4 tam4 .ifirt: 1-.01MBSIN I fri
I MEM& .0 1. A INIINAINNISPI
PA . _ . JA ILA
6 / MIZOIRMATAIMMITTI ARV1
13
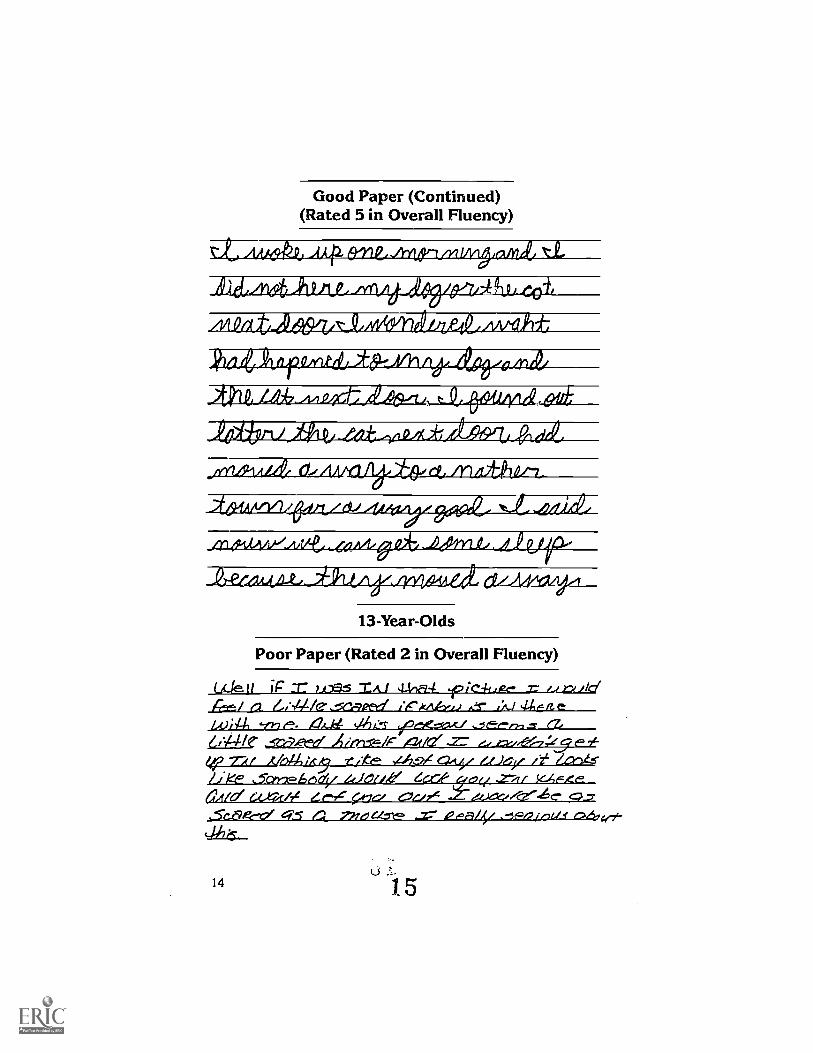
Good Paper (Continued)(Rated 5 in Overall Fluency)
A .A:4? .1 0 444 Aa4a Id 44 St
JhatietileszoLLA
..2tZLL62-44sta-att_LpfizyiLaith___
aál/114 _401 &d4 4 A a.
13-Year-Olds
Poor Paper (Rated 2 in Overall Fluency)
-AO
61.741e.itp 77/ .(7644 Lti9 .ejitt° LAOrz CoAy /1J6/ /Z1' Za-i.1-s
ke ,5ctr66.51/ GeJezie Ce..6.9oqa4/0' Gi-c /7e G. ere ez....tez./e7"".6c-
SeLiteed (*.q. .72faciz-e= ,-se=yzioas c).654e-1-
4dhirw-
4/7111/0...-712ref liekAAZ.L.) IJ 4.4en.e
14 1 5

Good Paper (Rated 5 in Overall Fluency)
knk, 4o w, OA) i+ ;4 Lour.,.6cmtAnhiii3 6ipiniar 4-6 0.0 Oaf, iiv Vaud r -lake look5 ai5 feu werE34trigmil__ ayvi *3 9E1- oat.60-/-
OP , i could ii6EJ ybot- jas4 fiaiprzykkf, e54-rue,i0rE, /5
4211- (pa. 0 floe, whefed (felt) Cak)sbc, cdok
7Atr, haNt. cii,t5 hE, cztvcrP 8rEalL ih1e. (J.5ext )tbr ailEMOVIbit)6., EiMEr ME, World 1.6onA4if_lq 10 cvu E.024, Whitif. ((Dor irk.) 1'Y
th't) ExpJ00;o0 oPyOd
IA L A A°. A
cou 63cea of. ;llusiniojczductiraA5 make6 rci fike. et_ 9104
(A5c,
1615

17-Year-Olds
Poor Paper (Rated 2 in Overall Fluency)
i.. .11 t f- ..A.-f i . AI il .
,/1 i I //I. ...nillairaffir /0 / / /:./.11ifilinrigir.021=r5M..11 1a rA /I /I 1 ha . MIIIMIIIMIF.PAI.11/.1a rx .k
4_1 . . ltr co ,ZPAAMIMVMOWlfdrr,.Aee7 AAVFA IW i,.. .4. ,MNIFAVOINIW/ &L..t A 0.1111MAMIIMP5M021117 A ..
/AI / ,iftellIW-IIIMMITW.. 41M,04.4.rwrormormwe. ...
Good Paper (Rated 5 in Overall Fluency)
cruk.41 /um-
at V.
,
. ThL 4b1c 4.4
cAo.ytrok_ o1._ :a PILL_ a4._
0.Atetio.41 AA.
14-tn-U 04*.t-QA.
1 6
WAYANSWOO.F4M; COM'
rtf10. OJtent 0111 -Let A/1Z v9OSS4Angt.)
.I0.
"et; "rj 'CI 1114 L if Ai IL.. 41 I -
tut ra4, ASIAlti.yr r)-4__ 44.464
AL wvt.0.4 4,4.0124;06 othi:. 0,
7,04,4-41.4.12.; . -t4
oA:-A.Ls wr AL L-4 itAlso 4-Atkargs.
1817

General Characteristicsof Students' Writing
As children gain control of written English, they should be able to usea growing number of words in a growing number of sentences, withrelatively greater ease and fewer errors. Analyses of these characteris-tics in actual student writing indicate that such was the case. Table 2.2presents the means (and their standard errors estimated by the jack-knife procedure) for each of the descriptive characteristics analyzed,and also presents percentiles to show how these characteristics weredistributed across the populations of 9-, 13-, and 17-year olds. Forexample, the 25th percentile for number of words per paper estimatesthe number of words that will be exceeded by 75 percent of thepopulation and not exceeded by 25 percent of the population. Thesepercentiles were computed separately for each characteristic.
Between the ages of 9 and 17, students wrote increasingly longerand more complex papers. On average, at age 17, they wrote morewords (104 as compared with 54), longer words (3.8 as compared with3.6 letters per word), more sentences (7.8 as compared with 4.7), andmore words per sentence (15.5 as compared with 13.5).
Although the older students wrote more, they had a markedlyreduced rate of errors; the rate of errors of all types dropped from anestimated 17 errors per hundred words at age 9 to fewer than 8 errorsper hundred words at age 17. And since the assessment time waslimited, providing little opportunity for rereading and revising what hadbeen written, there is reason to believe that the error rate would beconsiderably smaller if students were given more time to look for andcorrect their own errors.
The distribution of errors across papers at each age indicates thatmost students made some errors, and it seems reasonable to expectsome errors in first.draft writing. Even though a few papers at each agecontained no errors at all, three quarters of the papers written by theoldest age group had 3 or more errors. Although some errors are likelyto be unavoidable in papers written with little or no time for reflectionand revision, the frequency of such errors diminishes with age, aschildren internalize particular conventions of written English.
18 19

General Characteristicsof Papers for the Nation
TABLE 2.2
Mean*
Number of Words
25t h
Percentiles50th 75t h 90th
Age 9 53.6 (3.1) 24.9 41.1 68.9 112.2
Age 13 84.7 (3.6) 37.8 65.2 111.9 173.1
Age 17 103.5 (4.7) 47.8 80.2 146.0 208.9
Word Length (Number of Letters per tic
Age 9 3.6 (.02) 3.5 3.8 4.0
Age 13 3.7 (.02) 3.7 3.9 4.1
Age 17 3.8 (.02) au 3.8 4.0 4.2
Number of Sentences
Age 9 4.7 (0.2) 2.0 4.0 6.0 9.0
Age 13 6.9 (0.4) 3.0 5.0 8.0 14.0
Age 17 7.8 (0.5) 3.0 6.0 10.0 18.0
Number of Words per Sentence
Age 9 13.5 (0.6) 8.0 10.4 15.4 24.0
Age 13 14.1 (0.4) 10.1 12.5 16.5 20.3
Age 17 15.5 (0.4) 10.5 14.0 17.6 232
Total Number of Errors
Age 9 7.3 (0.5) 3.0 5.0 9.0 17.0
Age 13 6.7 (0.3) 2.0 5.0 9.0 15.0
Age 17 6.3 (0.3) 2.0 5.0 8.0 14.0
Number of Errors per 100 Words
Age 9 17.2 (1.6) 7.1 12.2 22.2 33.4
. Age 13 10.0 (0.8) 4.0 7.2 12.4 21.0
Age 17 7.6 (0.4) 2.9 5.8 10.0 15.8
'Standard errors are presented in parentheses. it can be said with 95 percentcertainty that the average for the population of interest Is in the interval of theestimated average +2 standard errors.
19
20

rammavorzam
Good and Poor Writers
,
Are poor writers less proficient than good writers in the overallcharacteristics measured? NAEP identified better writers on two sepa-rate measures of achievementon their ability to write sufficiently wellto accomplish the task for which their assigned writing was intended(primary trait scoring) and on the general fluency of their writing (holisticscoring). In turn, it is possible to relate these ratings of good and poorperformance to other general characteristics of student writing.
These analyses are summarized in Table 2.3. Sentence length wassimilar for good and poor writers, but the total number of words andsentences they wrote, and the relative number of errors they made,differed significantly. The better writers wrote longer papers and madefewer errors per 100 words. Though their rate of errors per 100 wordswas lower, the better writers actually averaged more total errors perpaper, because they wrote so much. At age 17, the better writers alsoused somewhat longer words, suggesting that they were using a moresophisticated vocabulary.
20 21

General Characteristics forGood and Poor Papers (Averages)
TABLE 2.3
Task Accomplishment
Good Papers Poor PapersTrait} Trait}
Overall Fluency
Good Papers Poor Papers
Holistic{Primary3 & 4
{Primary1 & 2
{Holistic
4,5 &6 1, 2 & 3
Number of Words
Age 9 133.9 (12.6) 49.1 (2.6)* 97.1 (7.1) 38.8 (2.3)*
Age 13 165.3 (12.5) 65.2 (2.4) 143.5 (7.8) 51.3 (2.2)*
Age 17 192.8 (7.4) 78.8 (39)* 155.7 (6.3) 54.9 (2.8)*
Word Length (Number of Letters per Word)
Age 9 3.6 (.05) 3.6 (.02) 3.6 (.03) 3.6 (.03)
Age 13 3.7 (.03) 3.7 (.02) 3.8 (.02) 3.6 (.02)*
Age 17 3.9 (.03) 3.8 (.02)* 3.9 (.02) 3.7 (.02)*
Number of Sentences
Age 9 9.9 (1.5) 4.4 (0.2) 8.8 (0.6) 3.3 (0.2)*
Age 13 13.5 (1.4) 5.3 (0.3)* 12.0 (0.9) 4.0 (0.2)*
Age 17 14.5 (0.8) 6.0 (0.4)* 12.0 (0.6) 3.9 (0.3)*
Number of Words per Sentence
Age 9 15.7 (1.7) 13.4 (0.7) 12.9 (0.9) 13.8 (0.8)
Age 13 13.7 (0.8) 14.2 (0.4) 13.6 (0.6) 14.4 (0.5)
Age 17 15.4 (0.6) 15.5 (0.6) 15.1 (0.5) 15.8 (0.7)
Total Number of Errors
Age 9 13.0 (3.2) 7.0 (0.5) 9.3 (1.0) 6.7 (0.6)*
Age 13 9.2 (0.9) 6.1 (0.4)* 9.1 (0.8) 5.3 (0.3)
Age 17 9.2 (0.9) 5.5 (0.4) 7.7 (0.5) 5.0 (0.3)*
Number of Errors per 100 words
Age 9 9.1 (2.0) 17.6 (1.7)* 9.0 (0.6) 19.8 (2.1)*
Age 13 5.9 (0.6) 11.0 (0.9)* 6.7 (0.6) 11.7 (1.2)*
Age 17 4.9 (Q,4) 8.4 (0.5)* 5.1 (0.3) 9.9 (0.7)*
'Statistically significant difference between good and poor papers at the .05level based on the Jackknifed standard error of the difference. (Standard errorsof the means are presented In parentheses.)
21

Differences in Subgroup Performance
Although Black students tend to perform consistently lower thantheir White age-mates in writing proficiency, it is interesting to see if, andwhere, these differences manifest themselves at the word and sentencelevels.* A comparison of the overall characteristics of the two studentgroups indicates a variety of similarities as well as some differences (seeTable 2.4).
At each a.cie level, both Black and White students wrote words ofsimilar length. However, while White 9.year.olds wrote papers that wereonly slightly longer than those of Black 9.year.olds (55 as comparedwith 48 words), at age 13 the White students wrote significantly longerpapers than their Black age-mates (87 versus 68 words). At age 17,White students averaged 108 words per paper, compared with only 71for Black students at the same age.
Although Black students tended to write shorter papers, their errorrates at ages 9 and 13 were similar to those for White students. At age17, however, the Black students' papers included a significantly greaternumber of errors than did the papers of their White age-mates (11errors per 100 words as compared with 7 errors per 100 words).
Comparisons can also be made between the overall writing charac .teristics of males and females. As was shown in Table 2.1, the boys'papers were not rated as highly on overall quality as were the girls'papers. It is interesting, then, to compare other characteristics of theirwriting, to see where differences manifest themselves.
Table 2.4 indicates that at all ages, girls wrote significantly longerpapers and made fewer errors per 100 words. Boys, however, tended towrite somewhat longer sentences than did girls.
The sample size was insufficient to permit reliable estimates for Hispanic, Asian-American, or other subgroups defined by race or ethnicity.
222

General Characteristics of Papersfor Race and Gender (Averages)
TABLE 2.4
Race
Black
Number of Words
White Male
Gender
Female
Age 9 48.4 (5.9) 55.2 (3.9) 44.9 (2.8) 62.0 (4.7)*
Age 13 67.9 (7.1) 86.8 (4.0)* 70.3 (3.6) 99.3 (7.5)*
Age 17 71.0 (4.3) 108.0 (5.4)* 86.3 (4.6) 121.4 (9.0)*
Word Length
Age 9 3.6 (.05) 3.6 (.03) 3.6 (.04) 3.6 (.03)
Age 13 3.7 (.03) 3.7 (.02) 3.7 (.02) 3.7 (.03)
Age 17 3.8 (.03) 3.8 (.02) 3.8 (.03) 3.8 (.03)
Number of Sentences
Age 9 3.7 (0.4) 5.0 (0.3)* 4.1 (0.3) 5.3 (0.4)*
Age 13 4.7 (0.5) 7.2 (0.4)* 5.4 (0.3) 8.4 (0.8)*
Age 17 4.9 (0.4) 8.3 (0.5)* 6.5 (0.4) 9.2 (0.8)*
Number of Words per Sentence
Age 9 14.6 (0.9) 13.0 (0.8) 13.9 (1.0) 13.1 (0.6)
Age 13 17.1 (1.5) 13.4 (0.4)* 15.1 (0.8) 13.1 (0.5)*
Age 17 16.8 (0.8) 15.0 (0.5) 15.7 (0.6) 15.2 (0.7)
Total Number of Errors
Age 9 9.0 (1.7) 7.1 (0.7) 6.2 (0.4) 8.4 (0.9)*
Age 13 7.3 (0.7) 6.6 (0.4) 6.6 (0.6) 6.8 (0.5)
Age 17 6.1 (0.5) 6.2 (0.4) 6.1 (0.5) 6.5 (0.5)
Number of Errors per 100 Words
Age 9 19.5 (1.7) 17.1 (2.3) 19.2 (2.4) 15.2 (1.2)*
Age 13 11.4 (0.8) 9.6 (0.9) 11.9 (1.4) 8.0 (0.5)*
Age 17 10.5 (0.7) 7.2 (0.4)* 8.9 (0.7) 6.3 (0.4)*
'Statistically significant difference between papers written by Black and Whitestudents or males and females at the .05 level based on the jackknifed stan-dard error of the difference. (Standard errors of the means are presented inparentheses.)
?et23

Summary
The analyses of the general characteristics of the writing of thenation's 9-, 13-, and 17-year.olds reflect the greater control that olderstudents have gained in the word and sentencelevel conventions ofwritten English. There are differences in performance among thevarious subgroups, and while all children make some errors when theywrite, their improved control of the conventions of writing at older agelevels is evident both within and across subgroups.
In general, papers given poorer evaluations tended to be shorter andto contain more errors than papers that were rated more highly. Thiswas true when good papers were rated in terms of their success inaccomplishing the task as well as when they were rated in terms ofoverall fluency. Similarly, boys tended to write shorter papers and tomake a higher proportion of errors in their writhg than did girls. On theother hand, while Black students' papers tended to be shorter thanthose of their White age-mates, at ages 9 and 13 they made approxi-mately the same proportion of errors; only at age 17 did White studentsmake fewer errors per 100 words than their Black peers.
Simply knowing that certain groups of students make more errorsthan others is not helpful to those of us interested in issues of teachingand learning; the nature of those errors must be identified. The follow-ing chapters will examine the kinds of errors students make.
24 25

Chapter
Control of Conventions
y n this section, we will examine students' control of sentence struc-
i ture and of word-level conventions such as spelling, capitalization,
and punctuation.
Sentence Structure
Students' control of syntax is reflected in the types of sentence
constructions they use in the course of their writing, as well as in the
problems that may surface in the sentences they create. To examine
this, each sentence was categorized as simple, compound, complex,
run-on, or fragment
Table 3.1 displays the results for the nation. The mean percentage
of complex sentences shows a substantial increase across the age
levels, rising from an average of 25 percent of each student's sentences
at age 9 to 43 percent at 17. Conversely, the average proportion ofsentence fragments and run-ons decreases across the same age range,
particularly between ages 9 and 13. The percentile scores for run-ons
and fragments suggest, however, that these are relatively isolated
problemsa student either has trouble with one or the other of these
constructions, using it frequently, or has no trouble at all. Thus even at
age 9, 50 percent of the students had no run-on sentences and 75percent included no fragments in their writing.
2 625

Use of Sentence Typesfor the Nation
TABLE 3.1
Mean*
Percentage Simple Sentences
25thPercentiles
50th 75th 90th
Age 9 43.8 (1.9) 0.0 46.2 66.7 100.0Age 13 40.1 (1.6) 14.3 42.9 61.5 80.0Age 17 37.5 (1.4) 16.7 37.5 55.6 75.0
Percentage Compound Sentences
Age 9 8.2 (1.1) 0.0 0.0 0.0 33.3Age 13 7.7 (0.8) 0.0 0.0 11.1 25.0Age 17 7.8 (0.7) 0.0 0.0 12.5 27.3
Percentage Complex Sentences
Age 9 25.1 (1.4) 0.0 16.7 50.0 66.7Age 13 37.5 (1.4) 14.3 33.3 50.0 100.0Age 17 43.1 (1.4) 24.2 39.3 62.5 100.0
Percentage Run-on Sentences
Age 9 15.8 (1.6) 0.0 0.0 25.0 50.0Age 13 10.5 (1.1) 0.0 0.0 14.3 30.0Age 17 8.0 (0.9) 0.0 0.0 4.5 25.0
Percentage Fragments
Age 9 7.0 (1.1) 0.0 0.0 0.0 25.0Age 13 3.6 (0.6) 0.0 0.0 0.0 11.1
Age 17 3.6 (0.8) 0.0 0.0 0.0 10.0
'Standard errors are presented in parentheses. It can be said with 95 percentcertainty that the average for the population of interest Is in the interval ofthe estimated average ±2 standard errors.
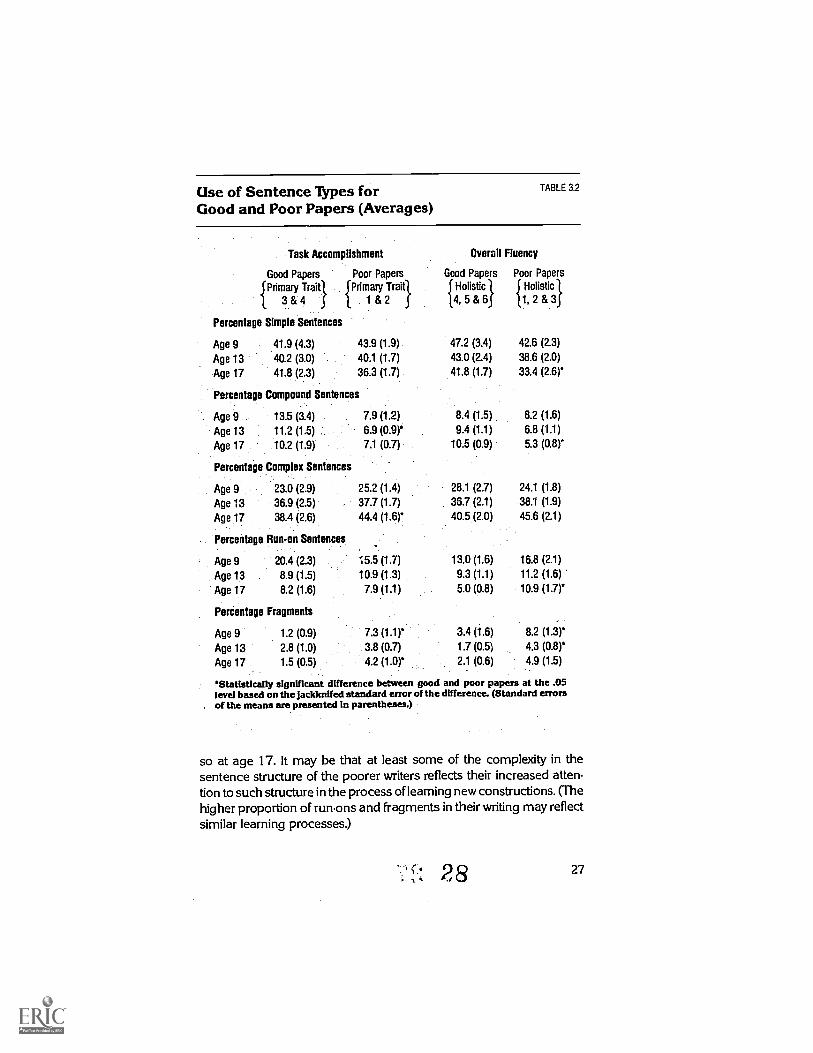
Interestir.ly, the decrease in the proporlion of simple and com-pound sentences across the age levels is relatively small. Indeed, whenuse of sentence types is compared with the overall ratins given to thepapers (Table 3.2), the better papers seem to use a somewhat greaterproportion of simple sentences than do the poor papers-significantly
26 27
Use of Sentence Types forGood and Poor Papers (Averages)
TABLE 3.2
Task Accomplishment
Good Papers Poor Papers
{Primary Trait} {Primary Trait}3&4 1&2
Percentage Simple Sentences
Overall Fluency
Good Papers Poor Papers
{ Holistic } { Holistic}4, 5 & 6 1, 2 & 3
Age 9 41.9 (4.3) 43.9 (1.9) 47.2 (3.4) 42.6 (2.3)
Age 13 40.2 (3.0) 40.1 (1.7) 43.0 (2.4) 38.6 (2.0)
Age 17 41.8 (2.3) 36.3 (1.7) 41.8 (1.7) 33.4 (2.6)*
Percentage Compound Sentences
Age 9 13.5 (3.4) 7.9 (1.2) 8.4 (1.5) 8.2 (1.6)
Age 13 11.2 (1.5) 6.9 (0.9)* 9.4 (1.1) 6.8 (1.1)
Age 17 10.2 (1.9) 7.1 (0.7) 10.5 (0.9) 5.3 (0.8)
Percentage Complex Sentences
Age 9 23.0 (2.9) 25.2 (1.4) 28.1 (2.7) 24.1 (1.8)
Age 13 36.9 (2.5) 37.7 (1.7) 36.7 (2.1) 38.1 (1.9)
Age 17 38.4 (2.6) 44.4 (1.6)* 40.5 (2.0) 45.6 (2.1)
Percentage Run-on Sentences-
Age 9 20.4 (2.3) 5.5 (1.7) 13.0 (1.6) 16.8 (2.1)
Age 13 8.9 (1.5) 10.9 (1.3) 9.3 (1.1) 11.2 (1.6)
Age 17 8.2 (1.6) 7.9 (1.1) 5.0 (0.8) 10.9 (1.7)*
Percentage Fragments
Age 9 1.2 (0.9) 7.3 (1.1) 3.4 (1.6) 8.2 (1.3)*
Age 13 2.8 (1.0) 3.8 (0.7) 1.7 (0.5) 4.3 (0.8)*
Age 17 1.5 (0.5) 4.2 (1.0)* 2.1 (0.6) 4.9 (1.5)
'Statistically significant difference between good and poor papers at the .05level based on the jackknifed standard error of the difference. (Standard errorsof the means are presented In parentheses.)
so at age 17. It may be that at least some of the complexity in thesentence structure of the poorer writers reflects their increased atten-tion to such structure in the process of learning new constructions. (Thehigher proportion of runons and fragments in their writing may reflectsimilar learning processes.)
(. 28 27

Results from an analysis of the proportion of sentences with agree-ment errors or awkward constructions are consistent with such aninterpretation (Table 3.3). At age 9, students had agreement errorsin an average of 11 percent of the sentences that they wrotethoughthese were concentrated in the writing of a small proportion of thestudents. Seventy-five percent of the 9-year-olds had no problems withagreement at all, while the 10 percent with the most problems hadagreement errors in one-third of their sentences. At age 17, the aver-age percentage of sentences with agreement errors dropped to 6percent, but the 10 percent of the students with the most problems haddifficulty in one-fifth of their sentences. Clearly, some small percent-age of students could use concentrated help in understanding theseconventions.
The average proportion of awkward sentences v)ins constant,
Errors in Sentence Typesfor the Nation
TABLE 3.3
PercentilesMean 25th 50th
Percentage Sentences with Agreement Errors
Age 9 103 (1.9) OA
Age 13 6.1 (0.9) 0.0
Age 17 6.1 (1A) 0.0
Percentage Awkward Sentences
Age 9 203 (13)Age 13 18.1 (1.2)
Age 17 20.4 (1.7)
0.0
OA
0.0
0.0
0.0
0.0
0.0
8.3
10.0
75th 90th
0.0 3330.0 25.0
ao 20.0
33.3 50.0
25.0 50.0
28.6 60.0
°Standard errors are presented in parentheses. It can be said with 95 percentcertainty, that the average for the population of Interest is In the interval of theestimated average ±2 standard errors.
28 29

however, at between 18 and 20 percent at all three ages-thoughagain about half of the papers did not include such errors.
Both agreement errors and awkward sentences were closely related
to the overall success of the writing, with good papers having a signifi-
cantly lower proportion of errors in sentence structure at all three ages
(Table 3.4).
Some sentence-level errors may be a normal feature of the kind of
first-draft writing required in the assessment. The better papers at all
three ages had a relatively constant proportion of such errors across the
three age groups assessed. Agreement errors were quite rare (averag-
ing between 2 and 3 percent of the sentences written), but on average
between 8 and 13 percent of the sentences of the better writers were
rated as "awkward" at all three ages.
Errors in Sentence Structurefor Good and Poor Papers (Averages)
TABLE 3.4
Task Accomplishment Overall Fluency
Good Papers Poor Papers
{Primary Trait} {Primary Trailt3 & 4 1 & 2
Percontage Sentences with Agreement Errors
Good Papers
Holistic{4,5 &6
Poor Papers{ Holistic1,2& 3
Age 9 1.5 (1.1) 11.3 (2.0)* 1.6 (0.7) 13.7 (2.5)*
Age 13 2.0 (0.5) 7.1 tor 3.6 (0.8) 7.6 (1.1)*
Age 17 2.9 (0.7) 6.9 (1.3)* 3.3 (0.5) 8.6 (2.1)*
Percentage Awkward Sentences
Age 9 8.4 (3.9) 21.0 (1.7)* 12.7 (1.8) 23.1 (1.8)*
Age 13 9.6 (1.6) 20.2 (1.4) 12.9 (1.6) 21.2 (1.6)*
Age 17 13.2 (1.6) 22.4 (1.9)* 13.9 (1.5) 26.5 (2.7)*
'Statistically significant difference between good and peer papers at the .05level based on the Jackknifed standard error of the difference. (Staniard errorsof the means are presented In parentheses.)
3 029

Differences in Subgroup Performance
Tables 3.5 and 3.6 display the sentence data for subgroups de:finedby race and sex. Males and females use similar proportions of eac:-?sentence type at each of the thre" age levels, except that females seem
Use of Sentence Typesfor Race and Gender (Averages)
TABLE 3.5
RaceBlack
Percentage Simple Sentences
White . MaleGender
Female
Age 9 41.4 (4.0) 44.9 (2.4) 44.9 (3.2) 42.8 (2.5)Age 13 32.4 (2.9) 41.6 (1.9)* 38.3 (2.6) 42.0 (2.1)Age 17 30.9 (2.0) 40.0 (1.6) 36.6 (2.1) 38.4 (1.7)
Percentage Compound Sentences
Age 9 8.0 (2.2) 9.0 (1.7) 8.2 (1.5) 8.2 (1.6)Age 13 4.7 (0.8) 8.1 (0.9)* 8.1 (1.5) 7.4 (1.0)Age 17 _5.7 (0.9) 8.1 (0.7) 6.5 (0.9) 9.2 (1.3)
Percentage Complex Sentences
Age 9 26.1 (2.7) 233 (1.9) 20.9 (2.4) 291 (23)Age 13 45.3 (3.7) 36.9 (1.5) 38.1 (2.9) 37.0 (24)Age 17 50.0 (2.3) 41.3 (1.6)* 43.7 (2.3) 42.4 (2.2)
Percentage Run-on Sentences
Age 9 14.8Age 13 132Age 17 96
Percentage Fragments ..
(2.3) 15.2 (2.4) 163 (2.6) 15.3 (1.8)
(2.4) 94 (13) 11.7 (2.0) aa (13)(1.8) 6.9 (1.0) 88 (1.8) 7.1 (1A)
Age 9 8.7 (1.9) 7.5 (1.6) 9.8 (1.9) 4.3 (0.8)Age 13 4.1 (0.9) 3.7 (a7) 3.4 (1L) (07)Age 17 3.8 (a9) 3.8 (1.1) 4.4 (1.5) 2.9 (a7)
30
%caustically significant difference between papers written by White and Blackstudents or males and females at the .05 level based on the Jackknifed stan-dard error of the difference. (Standard errors of the means are presented inparentheses.)
31
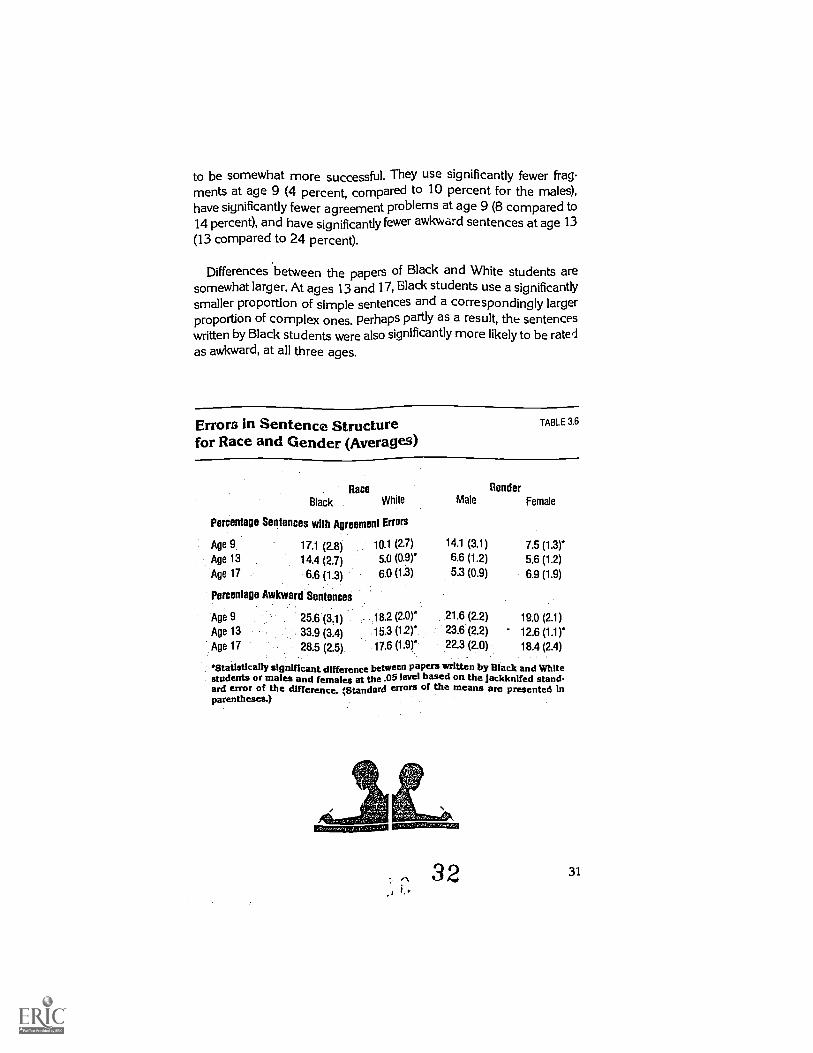
to be somewhat more successful. They use significantly fewer frag-ments at age 9 (4 percent, compared to 10 percent for the males),have significantly fewer agreement problems at age 9 (8 compared to14 percent), and have significantly fewer awkward sentences at age 13(13 compared to 24 percent).
Differences between the papers of Black and White students aresomewhat larger. At ages 13 and 17, Black students use a significantlysmaller proportion of simple sentences and a correspondingly largerproportion of complex ones. Perhaps partly as a result, the sentenceswritten hy Black students were also significantly more likely to be ratedas awkward, at all three ages.
Errors in Sentence Structurefor Race and Gender (Averages)
TABLE 3.6
RaceBlack White
Percentage Sentences with Agreement Errors
MaleGender
Female
Age 9 17.1 (2.8) 10.1 (2.7) 14.1 (3.1) 7.5 (1.3).
Age 13 14.4 (2.7) 5.0 (0.9r 6.6 (1.2) 5.6 (1.2)
Age 17 . 6.6 (1.3) 6.0 (13) 5.3 (0.9) 6.9 (1.9)
Percentage Awkward Sentences
Age 9 25.6 (3.1) 18.2 (2.0) 21.6 (2.2) 19.0 (2.1)
Age 13 33.9 (3.4) 16.3 (1.2) 23.6 (2.2) 12.6 (1.1)Age 17 28.5 (2.5) 17.6 (1.9) 22.3 (2.0) 18.4 (2.4)
Statistically significant difference between papers written by Black and Whitestudents or males and females at the .05 level based on the Jackknifed stand-ard error of the differenc e. fifiandard errors of the means are presented Inparentheses.)
7 3 2 31

Control of Word-Level Conventions
Students' problems in controlling word-level conventions of writtenEnglish are reflected in errors in spelling, capitalization, and wordchoice. Data for these measures are summarized in Table 3.7. Spellingperformance improved markedly between ages 9 and 17. Nine-year-olds misspelled 8 percent of the words they used, and 75 percent of thestudents at this age averaged 2 or more misspellings out of every 100words they wrote. The worst spellers at age 9 misspelled 20 percent ormore of the words they wrote. By age 17, the average percent ofmisspelled words had been reduced to 2, and 50 percent of thestudents averaged about 1 percent or fewer spelling errors. Rates forthe worst spellers were also reduced, to 7 percent at the 90th percentile.
Errors in word choice and capitalization were rare at all ages. Even atage 9, 75 percent of the students made no word-choice errc rs and 75percent made no errors in capitalization. Unlike spelling errors, whichseemed to pile up in the writing of some students, the proportion of
32 33

Word-Level Errorsfor the Nation
TABLE 3.7
Meao
Percentage rsspelled Words
25thPercentiles
50th 75th 90th
Age 9 8.0 (0.7) 1.9 5.0 11.1 20.0
Age 13 3.4 (0.4) 0.0 1.9 4.4 9.0
Age 17 _4 (0.2) 0.0 1.2 3.2 6.5
Percentagb aord-choice Errors
Age 9 0.4 (.05) 0.0 0.0 0.0 1.3
Age 13 0.5 (.06) 0.0 0.0 0.0 1.8
Age 17 0.5 (.06) 0.0 0.0 0.4 1.5
Percentage Capitalization Errors1
Age 9 1.2 (.36) 0.0 0.0 0.0 2.8
Age 13 0.3 (.04) 0.0 0.0 0.0 1.8
Age 17 0.3 (.05) 0.0 0.0 0.0 0.7
'Standard errors are presented in parentheses. It can be said with 95 percentcertainty that the average for the population of interest Is in the Interval of theestimated average +2 standard errors.
word-choice and capitalization errors remained low even in the papersthat had the highest incidence of such problems.
When the students' word-level errors were related to writing achieve-ment (as reflected both in task accomplishment and overall fluency),
the findings were as expected; poor papers contained more word-levelerrors than did good papers (Table 3.8). At all three ages, the lower-rated papers contained significantly more spelling, word-choice, andcapitalization errors.
It is also not surprising to note that these kinds of errors seemed tohave a slightly greater effect on readers' overall impression of papers(reflected in the holistic score for general fluency) than on their judg-m..tnt of specific task accomplishment (based on primary trait scores).Judging a paper in terms of its ability to comply with a specifically statedtask helps focus the reader's attention on particular organizational and
3 4 33

informational features that are likely to be realized beyond the sentencelevelat the paragraph level and above.
Even so, the better the students were at communicating in writing,the fewer word-level errors they made. This supports the notion thatseveral aspects of control of written language tend to develop inconcert. Also, readers expect written language to adhere to conven.tional forms, and when writing differs from those expectations, it is likelythat communication problems will arise.
Word-Level Errors forGood and Poor Papers (Averages)
TABLE 3.8
Task Accomplishment
Good Papers Poor Papers{Prim ariTralt} {Primlaray 2Trait}34
Percentage Misspelled Words
Overall Fluency
Good Papers Poor Papers{ Holistic 1 { Holistic
4, 5 & 6 1,2& 3}
Age 9 43 (12) 8.2 (0.o) 3.4 (03) 95 (0.9)1Age 13 1.7 .13) 3.8 (0.5)* 2.0 (0.3) 4.3 (0.6)Age 17 13 (02) 2.7 (03) 14 (01) 3.4 (a4)
Percentage Word-choice Errors
Age 9 0.2 (.10) 0.4 (.06) 02 (.06) 04 co7rAge 13 03 (08) 05 (.07) 03 (.07) 06 (08)*Age 17 03 (05) 05 (07)* 03 (.04) 06 0 or
Percentage Capitalization Errors
Age 9 0.4 (.20) 1.2 (.38) 0.4 (.10) 1.5 (47)*
Age 13 0.2 (.06) 0.4 (.06) 0.2 (.04) 0.4 (.07)*Age 17 0.2 (.06) 04 (.07) 02 (.03) 05 clor
'Statistically significant difference between good and poor papers at the .05level based on the Jackknifed standard error of the difference. (Standard errorsof the means are presented in parentheses.)
34

Differences in Subgroup Performance
Substantial improvements in adherence to the conventions of writtenlanguage, as reflected particularly in accurate spelling and capitaliza.tion, occurred between ages 9 and 13, with some continued improve.ment in spelling at age 17. Girls were significantly better spellers thanboys at all three ages (Table 3.9), with spelling proficiency improvingfor both groups between 9 and 17.
Word-Level Errorsfor Race and Gender (Averages)
TABLE 3.9
RaceBlack
Percentage Misspelled Wortit
White Male
Gender
Female
Age 9 8.1 (0.9) 8.3 (1.0) 8.9 (0.7) 7.3 (0.8)*
Age 13 3.7 (0.5) 3.2 (0.4) 4.2 (0.6) 2.6 (0.3)*
Age 17 3.4 (0.4) 2.3 (0.2)* 3.0 (0.4) 1.8 (0.2)
Percentage Word-choice Errors
Age 9 0.6 (.12) 0.3 (.07)* 0.3 (.07) 0.4 (.09)
Age 13 0.8 (.13) 0.4 (08)* 0.6 (.11) 0.4 (.05)
Age 17 0.8 (.10) 0.4 (.06) 0.6 (.10) 0.3 (.05)
Percentage Capitalization Errors
Age 9 1.4 (.33) 1.2 (.50) 1.7 (.68) 0.7 (.12)
Age 13 0.4 (.09) 0.3 (.05) 0.4 (.08) 0.3 (.06)
Age 17 03 (09) 0.4 (07) 04 (06) 03 (09)
*statistically significant difference between papers written by Black and Whitestudents or males and females at the .05 level based on the jackknifed stan-dard error of the difference. (Standard errors of the means are presented Inparentheses.)
3 635

Black students and White students showed relatively similar controlof word-level conventions of written English. Proportions of spellingerrors were similar at the younger ages, and although they differedsignificantly in the proportion of such errors at age 17, the totals werelow for both groups (3 percent for Black, and 2 percent for Whitestudents). Black studrr all three age groups also tended to makemore word-choice e ..)an did their White age-mates, though againthe proportions were very low.
On average, spelling, word usage, and capitalization were not majorproblems. The younger students did have noticeable difficulty with theirspelling, but by age 13 the percentage of misspelled words was quitelow and many students made no spelling mistakes at all. That someerrors continued at all ages is to be expected, given the first-draft andtimed nature of the task, and the fact that some errors are likely to resultfrom the continuing growth in vocabulary reflectedin the measures ofword length, discussed earlier.
Poorer writers tended to have more difficulty selecting appropriatewords than did better writers, but trk. incidence of word-choke errorswas quite low, even for the poorer performing writers. Nine-year-olds,somewhat understandably, do not have a complete grasp of capitaliza-tion rules, but these seem to have been learned by age 13. In general,by the middle school years most students appeared to have developedcontrol, if not mastery, of spelling, word use, and capitalization.
Learning to Punctuate
Punctuation was analyzed in terms of the particular punctuationmarks that students used correctly or incorrectly, as well as in terms ofthe marks that should have been used when punctuation was omitted.Overall error rates are summarized in Table 3.10.
Even at age 9, 25 percent of the students made no errors in punctu-ation, and 50 percent averaged 1.5 or fewer errors per 100 words.Students who made errors in punctuation, however, tended to makequite a few of them. The 25 percent of the papers with the mostpunctuation errors at age 9 included at least 4.1 errors per 100 words,while the 10 percent most error-prone papers had more than 9 errorsper 100 words. Rates of punctuation errors dropped steadily across thethree age groups, from a mean of 3.4 at age 9 to 2.0 at age 17.
36 37

Overall Errors inPunctuation for the Nation
TABLE 3.10
Mean* 25th
Total Punctuation Errors per 100 Words
Percentiles50th 75th 90th
Age 9 3.4 (0.4) 0.0 1.5 4.1 9.1
Age 13 2.8 (0.3) 0.0 1.8 3.6 5.9
Age 17 2.0 (0.1) 0.0 1.2 2.8 5.1
Punctuation Omitted per 100 Words
Age 9 3.2 (0.4) 0.0 1.2 3.7 9.1
Age 13 2.5 (0.3) 0.0 1.5 3.1 5.4
Age 17 1.6 (0.1) 0.0 0.6 2.2 4.5
Wrong Punctuation per 100 Words
Age 9 0.2 (.04) 0.0 0.0 0.0 0.5
Age 13 0.3 (.04) 0.0 . 0.0 0.0 1.3
Age 17 0.4 (.05) U.0 0.0 0.5 1.5
*Standard errors are presented In parentheses. It can be said with 95 percentcertainty that the average for the population of interest is in the interval of theestimated average ± 2 standard errors.
Much of the improvement in punctuation reflected changes in themost poorly punctuated papers, since the majority of students at allthree ages made very few punctuation errors. About 10 percent at eachage, however, made numerous errors; for this 10 percent with the worstpunctuation problems, the rate of errors per 100 words decreased from9 or more at age 9 to 5 or more at age 17.
In genetal, students were much more likely to omit a punctuationmark than they were to use a particular mark incorrectly. Rates ofpunctuation errors were higher in the poorer papers (Table 3.11), aswell as in the papers from the younger age groups. As with spellingerrors, rates of errors in punctuation were similar for Black students andWhite students at the two younger ages (Table 3.12), though at age 17the rates for Black students were slightly higher than for White students(2.6 compared to 1.9 per 100 words).
38 37

Overall Errors in Punctuation forGood and Poor Papers (Averages)
TABLE 3.11
Task Accomplishment Overall Fluency
Good Papers Poor Papers Good Papers Poor Papers
{Primari4Tralt} {Primlarsy, 2Traiti. Holistic { Holistic5& 6 1, 2 & 3
Total Punctuation Errors per 100 Words
Age 9
Age 13
Age 17
2.3 (0.5)
2.1 (0.2)
1.6 (0.2)
3.4 (0.5)
3.0 (0.4)*
2.1 (0.1)*
Punctuation Omitted per 100 Words
Age 9 2.2 (0.5)
Age 13 1.6 (0.2)
Age 17 1.1 (0.2)
3.2 (0.5)*
2.7 (0.4)
1.7 (0.1)*
Wrong Punctuation per 100 Words
Age 9 0.1 (.07)
Age 13 0.5 (.11)
Age 17 0.5 (.09)
0.2 (.04)
0.3 (.04)
0.4 (.06)
2.6 (0.5) 3.7 (0.5)
2.2 (0.3) 3.0 (0.5)
1.6 (0.1) 2.3 (0.2)*
2.3 (0.5) 3.5 (0.5)
1.8 (0.3) 2.8 (0.5)
1.2 (0.1) 2.0 (0.2)*
0.3 (.06) 0.2 (.05)
0.4 (.05) 0.3 (.06)
0.5 (.08) 0.4 (.07)
*Statistically significant difference between good and poor papers at the .05level based on the Jackknifed standard error of the difference. (Standard errorsof the means are presented in parentheses.)
3938

Overall Errors in Punctuationfor Race and Gender (Averages)
TABLE 3.12
Race?lack White
Total Punctuation Erns gee 100 Words
Male
Gender
Female
Age 9 4.4 (0.4) 3.2 (0.6) 3.4 (0.6) 3.3 (0.4)Age 13 2.6 (0.3) 2.8 (0.4) 3.2 (0.6) 2.4 (0.2)Age 17 2.6 (0.3) 1.9 (0.1)* 2.3 (0.2) 1.7 (0.2)*
Punctuation Omitted pur 100 Words
Age 9 4.0 (0.4) 3.1 (0.6) 32 (0.7) 3.2 (0.5)Age 13 2.4 0.3) 2.5 (0.4) 2.9 (0.6) 2.1 (0.2)Age 17 2? j02) 1.5 (0.1)* 1.9 (0.2) 1.3 (0.1)*
Wrong Punctuatioa por 100 Words
Age 9 0.4 (.11) 0.2 (.05) 0.2 (.07) 0.2 (.05)Age 13 a3 (.08) 0.3 (.05) 0.3 (.05) 0.3 (.06)Age 17 0.4 (.09) 0.4 (.05) 0.5 (.10) 0.4 (.06)
*Statistically significant difference between papers written by Black and Whitestudents or males and females at the .05 level based on the Jackknifed stan-dard error of the difference. (Standard errors of the means are presented inparentheses.) .
The frequency and accuracy of use of particular types of punctuationare summarized in Table 3.13. As one might expect, the most fre-quently used punctuation marks were those used to delimit sentenceboundaries. Nine-year-olds used an average of 8 such marks for every100 words of text, a ratio that remained fairly constant across ages. (Aslight decrease in the use Of end marks at the older ages reflects theincrease in sentence length, which leads to a need for slightly fewer endmarks.) Nine-year-olds' papers reflected some difficulties in sentencepunctuation, with such errors in 19 percent of their sentences. Ingeneral, however, these errors were concentrated in particularpapers.Although 50 percent of the papers at age 9 had no errors in markingsentence boundaries, 25 percent of the 9-year-olds had such problemsin one-fourth or more of their sentences, and 10 percent had difficultywith two-thirds or more of the sentences they wrote. Such errors wereconcentrated in the lower rated papers (Table 3.14); the more highly
4 039

rated papers at all three ages on average had end-mark errors in nomore tha n 11 percent of their sentences. By age 17 such difficulties hadbeen greatly reduced, in the poorer as well as the better papers.
Types off Punctuation and Errorsin Punctuation for the Nation
TABLE 3.13
Mean* 25th
End-marks Used per 100 Words
Percentiles50th 75th 90th
Age 9 8.0 (0.3) 4.3 7.7 10.9 14.3
Age 13 7.6 (0.2) 5.1 7.0 9.7 12.3
Age 17 7.4 (0.2) 5.3 7.0 9.0 11.1
'..:mas and Dashes Used per 100 Words
Age 9 12 (0.3) 0.0 0.0 0.9 3.5
Age 13 1.9 (0.1) 0.0 0.9 3.0 52
Age 17 2.9 (0.2) 0.0 2.1 4.5 6.7
Other Punctuation Used per 100 Words
Age 9 1.8 (0.2) 0.0 0.0 2.5 4.9
Age 13 2.2 (0.2) 0.0 1.4 3.2 6.3
Age 17 2.4 (0.2) 0.0 1.6 3.5 6.1
Percentage of Sentences with End-mark Errors
Age 9 18.8 (2.1) 0.0 0.0 25.0 66.7
Age 13 14.1 (1.4) 0.0 0.0 20.0 50.0
Age 17 8.7 (0.8) 0.0 0.0 7.4 33.3
Comma and Dash Errors per 100 Words
Age 9 0.9 (.11) 0.0 0.0 1.2 3.3
Age 13 1.1 (.08) 0.0 0.0 1.7 3.1
Age 17 1.0 (.06) 0.0 0.0 1.8 2.9
Other Punctuation Errors per 100 Words
Age 9 0.6 (.12) 0.0 0.0 0.0 1.9
Age 13 0.1 (.10) 0.0 0.0 0.0 1.4
Age 17 0.5 (.07) 0.0 0.0 0.0 1.6
40
*Standard errors are presented in parentheses. ft can be said with 95 percentcertainty that the average for the population of interest is in the Interval of theestimated average ±2 standard errors.
41

Types of Punctuation and Errors TABLE 3.14
in Punctuation for Good and Poklz: ts (Averages)
Task Accomplishment
Good Papers Poor Papers
Primary Trait} {Primary Trait{3 & 4 1 & 2
End-marks Used per 100 Words
Overall Fluency
Good Papers Poor Papers
Holistic} { Holistic}{4, 5 & 6 1, 2 & 3
Age 9 7.7 (1.0) 8.0 (0.3) 9.0 (0.5) 7.6 (0.4)*
Age 13 8.1 (0.6) (0.3) 8.3 (0.4) 7.3 (0.3)*
Age 17 7.3 (0.3) 7.4 (0.2) 7.5 (0.3) 7.3 (0.3)
Commas and Dashes Used per 100 Words
Age 9 2.2 (0.5) 1.1 (0.3) 1.4 (0.3) 1.1 (0.4)
Age 13 2.4 (0.3) 1.8 (02) 2.6 (0.2) 1.5 (0.21'
Age 17 4,3 (0.4) 2.5 (0.2) 3.6 (0.3) 2.2 (0.2)*
Other Punctuation Used per 100 Words
Age 9 32 (0.5) 1.7 (Oil" 2.2 (0.3) 1.6 (0.3)
Age 13 2.9 (0.3) 2.1 (02) 2.4 (0.2) 2.2 (0.2)
Age 17 av (0.4) 2.3 (0.2) 2.7 (0.3) 2.1 (0.3)
Percentage of Sentences with End-mark Errors
Age 9 11.2 (4.7) 192 (2.2) 10.4 (2.3) 21.7 (2.8)
Age 13 9.0 (1.9) 15.3 (1.6) 7.7 (1.0) 17.5 (2.1)*
Age 17 8,0 (1.7) 8.9 (0.9) 6.1 (1.0) 11.1 (1.4)*
Comma 'and Dash Errors per 100 Words
Age 9 1.1 (.30) 0.9 (.12) 1.2 (.20) 0.8 (.12)
Age 13 1.51 (.1 8) 1.1 (.08) 1.2 (.14) 1.1 (.11)
Age 17 1.1 (.13) 1.0 (.09) 1.1 (.08) 0.9 (.12)
Other Punclualion Errors per 100 Words
Age 9 0.8 (.33) 0.6 (.12) 0.e (.30) 0.5 (.12)
Age 13 0.5 (.13) 0.4 (.12) 0.7 (.20) 0.4 (.09)
Age 17 0.5 (.09) 0.5 (.08) 0.4 (.06) 0.6 (.14)
'Statistically significant difference between pod and poor papers at the .05level based on the Jackknifed standard error of the difference. (Standard errorsof the means are presented. is ?arentheses.)
42 41

Commas and dashes, which are the most commonly used indicatorsof internal sentence structure, were relatively rare at all three ages,although they did increase from 1.2 per 100 words at age 9 to 2.9 per100 words by age 17. Papers that were highly rated made somewhatmore use of these punctuation marks, particularly among the older agegroups. Errors in the use of commas and dashes were infrequent,however, occurring on the average only once per 100 words; 50percent of the papers at all three ages contained no errors in the use ofcommas or dashes. Error rates for these punctuation marks wereconstant across ages and across good and poor papers.
The use of other punctuation (including colons, semicolons, andapostrophes) showed only a slight increase across the ages (from 1.8per 100 words at age 9 to 2.4 at age 17), with little difference betweenbetter and poorer papers, and with few errors in the way these punctu-ation marlfs were used. Students simply did not tend to use very muchinternal sentence punctuation.
Subgroup Differencesin Punctuation Errors
Differences in punctuation errors for subgroups defined by race andgender are summarized in Table 3.15. Patterns of punctuation useand rates of errors were very similar across subgroups. Females madeslightly fewer punctuation errors overall than did males at acir, 17, andalso made significantly more errors in the use of commas and dashesat age 9. Black students used significantly fewer end marks than didWhite students at ages 13 and 17 (7 versus 8 per 100 words) and usedsignificantly fewer commas and dashes at age 17 (2 versus 3 per 100words). The magnitude of these differences, however, remained verysmall.
42 43

Types of Punctuationand Errors in Punctuationfor Race and Gender (Averages)
TABLE 3.15
Race
Black White
End-marks Used per 100 Words
Male
GenderFemale
Age 9 7.6 (0.7) 8.3 (0.4) 7.9 (0.5) 8.1 (0.3)
Age 13 6.6 (0.3) 7.9 (0.3)* 7.2 (0.3) 8.1 (0.3)
Age 17 6.5 (0.2) 7.6 (0.3) 7.4 (0.4) 7.4 (0.2)
Commas and Dashes Used per 100 Words
Age 9 0.7 (0.2) 1.4 (0.4) 1.2 (0.6) 1.3 (0.2)
Age 13 1.5 (0.2) 2.0 (0.1) 1.6 (02) 2.2 (0.2)
Age 17 2.3 (0.2) 3.0 (0.2)* 2.7 (0.4) 3.1 (0.3)
Other Punctuation Used per 100 Words
Age 9 1.7 (0.3) 1.9 (0.3) 1.3 (0.3) 2.2 (0.3)
Age 13 2.5 (0.4) 2.3 (0.2) 2.1 (0.2) 2.3 (02)
Age 17 2.1 (02) 2.4 (0.3) 2.1 (0.3) 2.7 (0.3)
Percentage of Sentences with End-mark Errors
Age 9 29.3 (3.5) 16.8 (3.0)* 20.3 (3.4) 17.3 (2.1)
Age 13 15.9 (2.5) 13.2 (1.6) 15.9 (2.1) 12.3 (1.7)
Age 17 14.7 (2.1) 7.5 (1.1)* 10.2 (1.3) 7.2 (12)
Comma and Dash Errors per 100 Words
Age 9 1.3 (.18) 0.8 (.15) 0.6 (.12) 12 (.17)*
Age 13 1.2 (.20) 1.1 (.09) 1.1 (.11) 12 (.13)
Age 17 1.2 (.18) 1.1 (.07) 1.1 (.12) 0.9 (.10)
Other Punctuation Errors per 100 Words
Age 9 1.0 (.32) 0.5 (.13) 0.4 (.09) 0.8 (.23)
Age 13 0.4 (.10) 0.5 (.11) 0.5 (.17) 0.4 (.09)
Age 17 0.4 (.11) 0.5 (.08) 0.7 (.13) 0.3 (.06)
'Statistically significant difference between papers written by slack and Whitestudents or males and females at the .05 level based on the Jackknifed start-
, dard error of the difference. (Standard errors of the means are presented Inparentheses.)
43
Trends Over Time
Are students improving in their ability to use the conventions ofwritten Engfish? NAEP has examined patterns of errors in students'writing in each of the assessments since 1969.* However, becauseerror rates are influenced by the particular topics students are assigned,as well as by the amounts of time they are allotted to complete theirwriting, directly comparable scores are not available over time. Evenso, the range and the nature of the errors in the writing collected inthe 1984 assessment are roughly comparable to results obtained inearlier assessments. Overall, the data suggest that there have been nodramatic changes over timefor better or for worsein control of theconventions of written English.
Reflections
Both the educational community and the general public are con-cerned about how well the nation's students are learning to control theconventions of written language. Error-free spelling, syntax, punctua-tion, and usage are considered one of the marks of a properly educatedperson. Results of these analyses should provide some comfort tothose concerned with such issuesstudents are indeed learning tocontrol the conventions of written English.
Findings from the analyses indicate that as they progress throughschool, students become more proficient users of written language atboth the sentence and the word level. Across the ages, there is a steadyincrease in the proportion of complex sentences that students write,and their papers include increasingly fewer fragments and run.onsentences. The papers of the 17-year-olds reflect their ability to usesimple and complex sentences selectively.
Students also demonstrate control of written English at the wordlevel. Across the ages, spelling improves markedly, and students at all
Writing Achievement, 1969-79; Results from the Third National Writing Assessments,Volumes I, II, and III (Repott Nos. 10-W.01, -02, and -03). Denver, CO: National Assess-ment of Educational Progress, Education Commission of the States, 1980.
4445
ages make few errors in word choice or capitalization. Punctuationerrors seem to directly reflect the learning that is taking place. Studentsdo not use punctuation marks with which they are unfamiliar, but whenthey are learning a particular mark, they use it frequently, perhaps in anattempt to understand better its appropriate (and inappropriate) uses.
In all, the results of these analyses are encouraging. Students arelearning the conventions that they need for their writing. Findings of theparticular analyses suggest, however, that learning writing conventionsis an individual process, with particular skills being learned and prac-ticed by particular children at particular times. There is no consistentprofile of the types of mistakes a poor writer will make, for example.Hence, asking an entire class to focus on a particular convention ofwritten English seems unnecessary, even inappropriate. Instead,instruction may be more effective if it treats students as individuallanguage learners, with the teacher relying on each student's ownwritten papers for information about what that student knows and is inthe midst of learning. With this knowledge, instruction in particular skillscan be targeted toward the students who most need it and toward thekinds of help each student needs most.
4 6
45

Appendix
NAEP Sentence Types and Mechanics:Scoring Guide Outline
I. Sentence Types
1. SimpleA sentence that con-tains a subject and a verb. Itmay also have an object, sub-ject complement, phrase,appositive, nominative abso-lute or verbal. Also, a wordgroup used in dialogue, foremphasis, or as an exclama-tion that is not an independentclause.
2. CompoundA sentence con-taining two or more simplesentences joined by somethingother than a comma.
3. Complex (and compound-complex)A sentence thatcontains at least one indepen-dent clause and one depen-dent clause.
Sentence types with punctua-tion errors were not classifiedin the above categories.
4. Run-on Sentence
46
a. FusedA sentence con-taining two or more inde-pendent clauses with nopunctuation or conjunctionseparating them.
b. On and onA sentenceconsisting of four or more
4 7
independent clauses strungtogether with conjunctions.
c. Comma spliceA sentencecontaining two or moreindependent clauses sepa-rated by a comma instead ofa semicolon or a coordinat-ing conjunction.
5. FragmentA word group,other than an independentclause, wrftten and punctuatedas a sentence.
II. Faulty SentenceConstruction
(These scores are in additionto the sentence types.)
1. Agreement ErrorA sen-tence where at least one of thefollowing is present: subject/verb do not agree, pronoun/antecedent do not agree, noun/modifier do not agree, subject/object pronoun is misused, orverb tense shifts.
2. Awkward Sentence (The awk-ward categories are listed inorder of category precedence,since only one score was givento a sentence.)
a. Faulty parallelismA par-allel construction that is

semantically or structurallydysfunctionaL
b. Unclear pronoun referenceA pronoun's antecedentis unclear.
c. Illogical constructionFaulty modification or adangling modifier or a func-tionally misarranged or mis-proportioned sentence.
d. Other dysfunctionsA sen-tence containing an omittedor extra word or a split con-struction that definitelydetracts from readability.
III. Punctuation Errors
Every error of commission anderror of omission was coded forcommas, dashes, quotationmarks, semicolons, apostrophes,and end marks. The most informalrules of usage were used, with thewriter receiving the benefit of anydoubt.
IV. Word-Level Conventions
1. Word ChoiceThe writerneeds a word that is differentfrom the one written. This cate-gory also includes attempts at
a ,,erb, adjective, or adverbfoim tW: is nonexistent orunacceptable.
2. SpellingIn addition to amisspelling, this categoryincludes word-division errors atthe end of a line, two wordswritten as one, one word writtenas two, superfluous plurals,;,nd groups of distinguishable,etters that do not make a legit-imate word.
CapitalizationA word isgiven a capitalization errorscore if the first word in a sen-tence is not capitalized, if aproper noun or adjective withina sentence is not capitalized,and if the pronoun "I" is notcapitalized.
The mechanics scoring wasdesigned to allow the writer asmuch flexibility as possible underexisting conventions of correctwriting; consequently, any timetwo authorities on mechanics dis-agreed, the more informal inter-pretation was used.
Because the papers were enteredinto a computer-readable data-base, the number of words perpaper, number of words per sen-tence, and number of letters perword were tabulated by computer.
4 847

Acknowledgments
This report represents the culmination of effort by many experienced and knowledge-able peoplestaff and consultants who contributed their ideas, time, and energy to thedevelopment, conduct, and analysis of NAEP's 1983-84 writing assessment Some,because of particularly significant contributions to the work underlying this report, arespecifically thanked below.
The analyses were designed by Ina Mullis and Eugene Johnson. Anne Campbell andWendy Littlefair directed the open-ended scoring; John Barone developed the innovativecomputerized system to conduct the analyses; and Norma Norris supemised the dataentry and conducted the analyses.
Special thanks for the production of this report are due to the many reviewers whosuggested improvements and to Beverly Cisney, who provided the excellent word-processing skills essential to the project; Kent Ashworth, who coordinated productionefforts; Jack Weaver, who designed the report; and Peter Stremic, who managed thecomplex printing tasks.
WESTAT, Inc. was responsible for most of the sampling and data-collection activities.
Finally and most importantly, NAEP is grateful for the contributions of students andschool administrators, who cooperated so generously.
9076404. S57P10 249382. Printed in U.S.A.
4 9