Grain Truck and Ocean Rate Advisory Report, 2nd quarter 2021
9
Grain Truck and Ocean Rate Advisory Second Quarter 2021 (April, May, June) Published August 2021 A quarterly publicaon of the Agricultural Markeng Service Transportaon Services Division www.ams.usda.gov/services/transportaon-analysis
Transcript of Grain Truck and Ocean Rate Advisory Report, 2nd quarter 2021
Grain Truck and Ocean Rate Advisory
Second Quarter 2021 (April, May, June) Published August 2021
A quarterly publication of the Agricultural Marketing Service Transportation Services Division
www.ams.usda.gov/services/transportation-analysis
2
Grain Truck and Ocean Rate Advisory
Preface
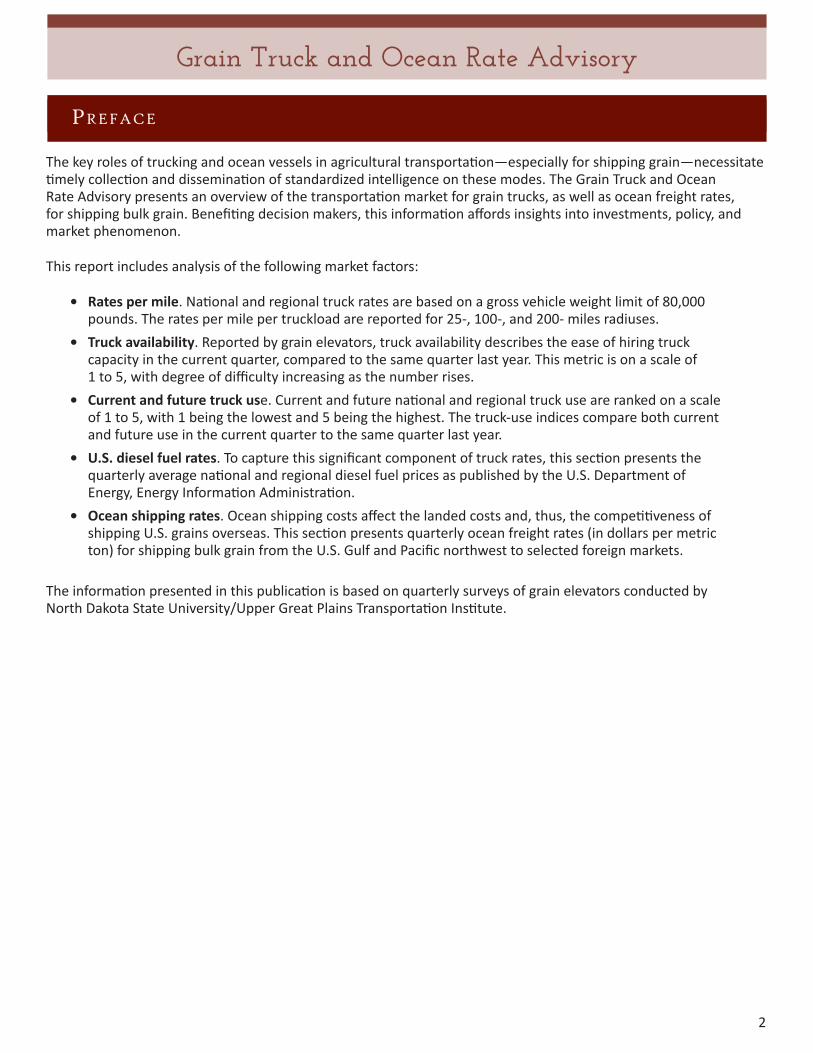
The key roles of trucking and ocean vessels in agricultural transportation—especially for shipping grain—necessitate timely collection and dissemination of standardized intelligence on these modes. The Grain Truck and Ocean Rate Advisory presents an overview of the transportation market for grain trucks, as well as ocean freight rates, for shipping bulk grain. Benefiting decision makers, this information affords insights into investments, policy, and market phenomenon.
This report includes analysis of the following market factors:
• Rates per mile. National and regional truck rates are based on a gross vehicle weight limit of 80,000 pounds. The rates per mile per truckload are reported for 25-, 100-, and 200- miles radiuses.
• Truck availability. Reported by grain elevators, truck availability describes the ease of hiring truck capacity in the current quarter, compared to the same quarter last year. This metric is on a scale of 1 to 5, with degree of difficulty increasing as the number rises.
• Current and future truck use. Current and future national and regional truck use are ranked on a scale of 1 to 5, with 1 being the lowest and 5 being the highest. The truck-use indices compare both current and future use in the current quarter to the same quarter last year.
• U.S. diesel fuel rates. To capture this significant component of truck rates, this section presents the quarterly average national and regional diesel fuel prices as published by the U.S. Department of Energy, Energy Information Administration.
• Ocean shipping rates. Ocean shipping costs affect the landed costs and, thus, the competitiveness of shipping U.S. grains overseas. This section presents quarterly ocean freight rates (in dollars per metric ton) for shipping bulk grain from the U.S. Gulf and Pacific northwest to selected foreign markets.
The information presented in this publication is based on quarterly surveys of grain elevators conducted by North Dakota State University/Upper Great Plains Transportation Institute.

3
Grain Truck and Ocean Rate Advisory
truck advisory
Table 1. U.S. grain truck market, 2nd quarter 202125 miles 100 miles 200 miles Truck availability Truck use Future truck use
1Rate per mile, per truckload
Quarterly index*
1 = Very easy to
5 = Very difficult
1 = Much lower to
5 = Much higher
National average2 4.98 3.54 3.53 2.60 3.29 3.00North Central 4.97 3.49 3.49 2.67 3.42 2.75East NA NA NA 1.50 3.25 3.75South Central 5.19 3.49 3.49 3.00 3.25 3.25West 5.51 NA NA 2.00 4.00 2.00Rocky Mountain 4.32 3.87 NA 3.00 2.50 3.50
1 Rates are based on trucks with 80,000-pound (lb) gross vehicle weight limit, and are quoted in U.S. dollars. 2 National average is based on rates received from various States, but not every State is represented. *Current and future truck use indices are based on comparison to the same quarter last year.Note: NA = not available because of low or no response rate.Source: USDA, Agricultural Marketing Service.
Figure 1. U.S. Grain Truck Market, 2nd quarter 2021
Average rate: $4.06Availability index: 3.00Fuel price: $2.99
Average rate: NA Availability index: 1.50Fuel price: $3.19
Average rate1: $3.98 Availability index: 2.67Fuel price: $3.15
Average rate: $4.10Availability index: 3.00Fuel price: $3.33
Average rate: $5.51Availability index: 2.00Fuel price: $3.73
1 Average rate per loaded mile, based on truck rates for trips of 25, 100, and 200 miles. Note: Fuel prices are a quarterly average (unit per gallon). Source: Fuel price data are from U.S. Department of Energy, Energy Information Administration, and availability index data are from USDA, Agricultural Marketing Service.
The truck advisory presents an overview of the transportation market for grain trucks, including national and regional truck rates, truck availability, truck usage, and diesel fuel prices.

4
Grain Truck and Ocean Rate Advisory
truck use
Current truck use 1 = Much lower to 5 = Much higher
Future truck use 1 = Much lower to 5 = Much higher
2020 1st qtr. 2nd qtr. 3rd qtr. 4th qtr. 1st qtr. 2nd qtr. 3rd qtr. 4th qtr.National 3.20 3.50 3.18 3.46 2.80 3.36 3.45 3.15North Central 3.30 3.50 3.50 3.00 2.80 3.38 3.50 3.50East NA NA NA NA NA NA NA NASouth Central 3.00 3.00 2.74 4.00 3.00 3.00 3.33 3.00West 3.00 3.00 4.20 3.50 2.50 3.00 4.22 2.50Rocky Mountain NA 3.50 3.50 3.00 NA 3.00 3.00 3.50
2021 1st qtr. 2nd qtr. 3rd qtr. 4th qtr. 1st. qtr. 2nd qtr. 3rd qtr. 4th qtr.National 3.30 3.29 3.20 3.00North Central 3.10 3.42 3.00 2.75East 4.00 3.25 3.00 3.75South Central 3.00 3.25 3.00 3.25West 4.00 4.00 3.00 2.00Rocky Mountain NA 2.50 NA 3.50
*Current and future truck use indices are based on comparison to the same quarter last year. Note: qtr. = quarter; NA = not available. Source: USDA, Agricultural Marketing Service
Table 2. Regional truck use index*
Figure 2. National truck usage, 2nd quarter 2021
Note: Q = quarter; Nat. = national; avg. = average; N. = north; S. = south; NA = not available. Source: USDA, Agricultural Marketing Service.
1
2
3
4
5
Q1 Q2 Q3 Q4 Q1 Q2 Q3 Q4 Q1 Q2 Q3 Q4 Q1 Q2 Q3 Q4 Q1 Q2 Q3 Q4 Q1 Q2
2016 2017 2018 2019 2020 2021
National North Central South Central West East
Inde
x val
ue1
= M
uch
low
er t
o 5
= M
uch
high
er
2nd quarter 2021 % change from: Nat. avg. N. Central S. Central West EastLast quarter 0 10 8 0 -19Last year -6 -2 8 33 -19
Truck use indices represent current and future national and regional truck use.

5
Grain Truck and Ocean Rate Advisory
Table 3. Quarterly national truck availability index
Region 1 = Very easy 5 = Very difficult Current quarter as % change from
2nd qtr. 2021
Previous qtr.Same qtr. last year
Previous qtr.Same qtr. last year
National 2.60 2.20 2.50 18 4North Central 2.67 2.30 2.50 16 7East 1.50 3.00 1.50 -50 0South Central 3.00 2.00 4.00 50 -25West 2.00 3.00 2.00 -33 0
Note: qtr. = quarter; NA = not available. Source: USDA, Agricultural Marketing Service.
Figure 3. National truck availability
Note: Q = quarter; Nat. = national; avg. = average; N. = north; S. = south; NA = not available. Source: USDA, Agricultural Marketing Service.
0.00
0.50
1.00
1.50
2.00
2.50
3.00
3.50
4.00
4.50
Q1 Q2 Q3 Q4 Q1 Q2 Q3 Q4 Q1 Q2 Q3 Q4 Q1 Q2 Q3 Q4 Q1 Q2 Q3 Q4 Q1 Q2
2016 2017 2018 2019 2020 2021
Inde
x va
lue
1 =
Very
eas
y to
5 =
Ver
y di
ffic
ult
National North Central South Central
West East
2nd quarter 2021 % change from: Nat. avg. N. Central S. Central West EastLast quarter 18 16 50 -33 -50Last year 4 7 -25 0 0
truck availability
The truck availability index tracks the trends in perceived ease of hiring a truck as reported by grain elevators.
6
Grain Truck and Ocean Rate Advisory
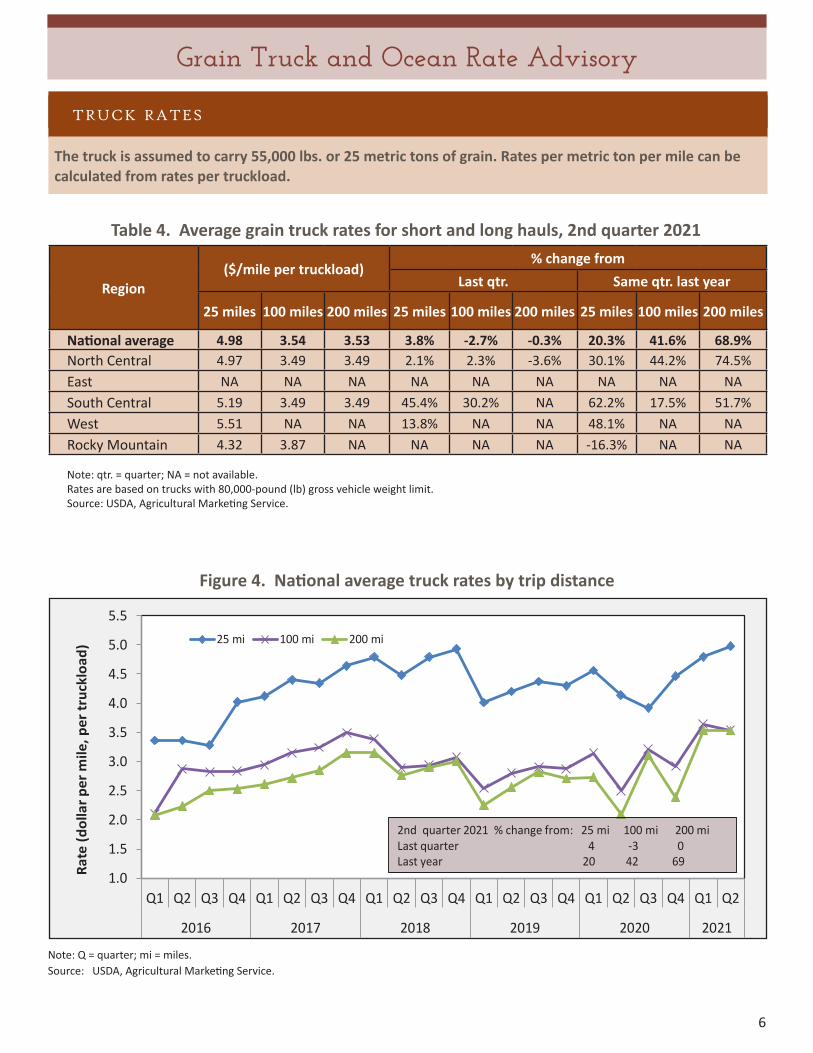
Table 4. Average grain truck rates for short and long hauls, 2nd quarter 2021
Region($/mile per truckload)
% change fromLast qtr. Same qtr. last year
25 miles 100 miles 200 miles 25 miles 100 miles 200 miles 25 miles 100 miles 200 miles
National average 4.98 3.54 3.53 3.8% -2.7% -0.3% 20.3% 41.6% 68.9%North Central 4.97 3.49 3.49 2.1% 2.3% -3.6% 30.1% 44.2% 74.5%East NA NA NA NA NA NA NA NA NASouth Central 5.19 3.49 3.49 45.4% 30.2% NA 62.2% 17.5% 51.7%West 5.51 NA NA 13.8% NA NA 48.1% NA NARocky Mountain 4.32 3.87 NA NA NA NA -16.3% NA NA
Note: qtr. = quarter; NA = not available.Rates are based on trucks with 80,000-pound (lb) gross vehicle weight limit.Source: USDA, Agricultural Marketing Service.
Figure 4. National average truck rates by trip distance
Note: Q = quarter; mi = miles. Source: USDA, Agricultural Marketing Service.
1.0
1.5
2.0
2.5
3.0
3.5
4.0
4.5
5.0
5.5
Q1 Q2 Q3 Q4 Q1 Q2 Q3 Q4 Q1 Q2 Q3 Q4 Q1 Q2 Q3 Q4 Q1 Q2 Q3 Q4 Q1 Q2
2016 2017 2018 2019 2020 2021
Rate
(dol
lar p
er m
ile, p
er tr
uckl
oad)
25 mi 100 mi 200 mi
2nd quarter 2021 % change from: 25 mi 100 mi 200 mi Last quarter 4 -3 0 Last year 20 42 69
truck rates
The truck is assumed to carry 55,000 lbs. or 25 metric tons of grain. Rates per metric ton per mile can be calculated from rates per truckload.
7
Grain Truck and Ocean Rate Advisory
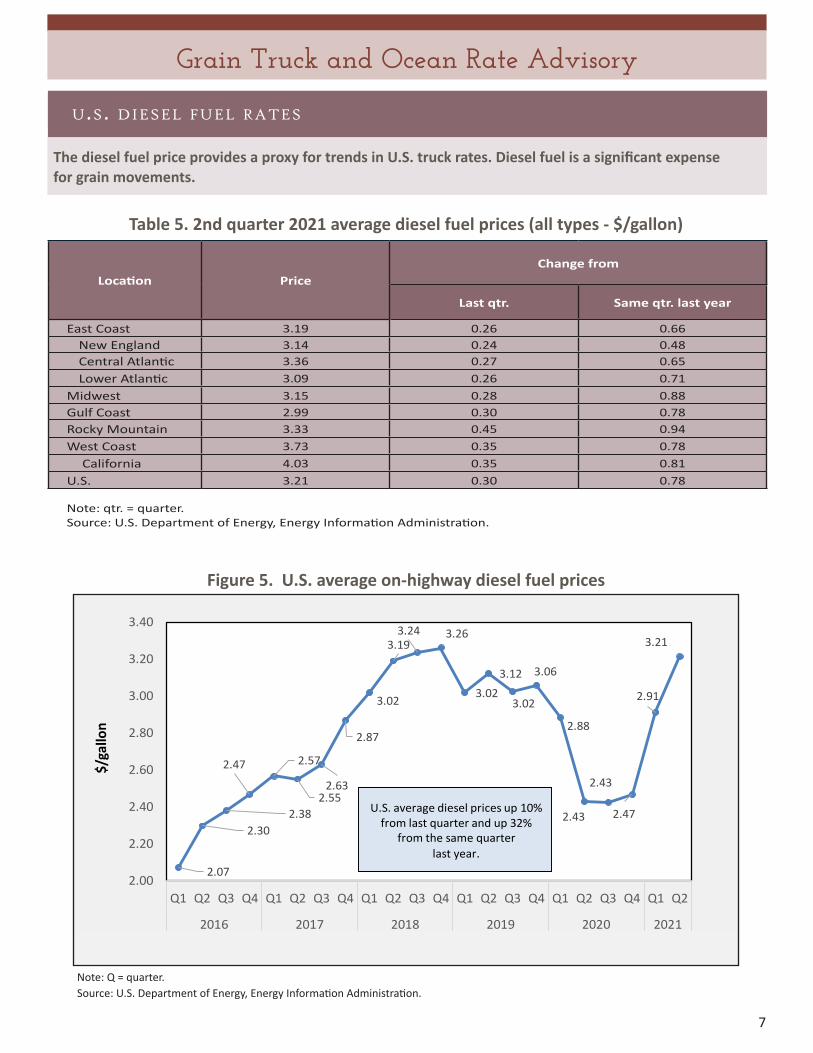
Figure 5. U.S. average on-highway diesel fuel prices
2.07
2.302.38
2.47 2.57
2.552.63
2.87
3.02
3.193.24 3.26
3.023.12
3.02
3.06
2.88
2.43
2.43
2.47
2.91
3.21
2.00
2.20
2.40
2.60
2.80
3.00
3.20
3.40
Q1 Q2 Q3 Q4 Q1 Q2 Q3 Q4 Q1 Q2 Q3 Q4 Q1 Q2 Q3 Q4 Q1 Q2 Q3 Q4 Q1 Q2
2016 2017 2018 2019 2020 2021
$/ga
llon
U.S. average diesel prices up 10%from last quarter and up 32%
from the same quarter last year.
Note: Q = quarter. Source: U.S. Department of Energy, Energy Information Administration.
Table 5. 2nd quarter 2021 average diesel fuel prices (all types - $/gallon)
Location PriceChange from
Last qtr. Same qtr. last year
East Coast 3.19 0.26 0.66New England 3.14 0.24 0.48Central Atlantic 3.36 0.27 0.65Lower Atlantic 3.09 0.26 0.71
Midwest 3.15 0.28 0.88Gulf Coast 2.99 0.30 0.78Rocky Mountain 3.33 0.45 0.94West Coast 3.73 0.35 0.78
California 4.03 0.35 0.81U.S. 3.21 0.30 0.78
Note: qtr. = quarter. Source: U.S. Department of Energy, Energy Information Administration.
u.s. diesel fuel rates
The diesel fuel price provides a proxy for trends in U.S. truck rates. Diesel fuel is a significant expense for grain movements.

8
Grain Truck and Ocean Rate Advisory
U.S. Gulf to
Country1st qtr.2020
2nd qtr.2020
3rd qtr.2020
4th qtr. 2020
Avg.1st qtr.2021
2nd qtr.2021
3rd qtr.2021
4th qtr.2021
Avg.
Japan 43.38 36.33 42.99 42.11 41.20 52.19 65.94 59.07Rotterdam 14.82 13.18 19.41 19.02 16.61 19.75 23.19 21.47China 41.98 35.40 42.14 40.79 40.08 50.88 64.88 57.88Mexico 13.64 12.41 14.39 14.43 13.72 19.19 23.75 21.47
Colombia: Atlantic Ports (East) 18.85 17.96 19.76 19.97 19.14 27.23 36.15 31.69Colombia: Pacific Ports (West) 27.11 27.55 30.34 30.94 28.99 38.50 48.25 43.38
Table 6. Ocean shipping rates for bulk grain ($/metric ton)
PNW to
Country1st qtr.2020
2nd qtr.2020
3rd qtr.2020
4th qtr.2020
Avg.1st qtr.2021
2nd qtr.2021
3rd qtr.2021
4th qtr.2021
Avg.
Japan 23.10 18.94 23.05 23.40 22.12 29.85 38.34 34.10China 22.28 18.20 22.37 22.65 21.38 28.60 37.60 33.10
Note: qtr. = quarter; avg. = average; PNW = Pacific Northwest.Source: O’Neil Commodity Consulting.
Figure 6. Grain vessel rates and spread, U.S. to Japan
Note: Q = quarter; PNW = Pacific Northwest; Spread is the diffierence between the U.S. Gulf-to-Japan and PNW-to-Japan ocean freight rates. Source: O’Neil Commodity Consulting.
0
10
20
30
40
50
60
70
Q1 Q2 Q3 Q4 Q1 Q2 Q3 Q4 Q1 Q2 Q3 Q4 Q1 Q2 Q3 Q4 Q1 Q2 Q3 Q4 Q1 Q2
2016 2017 2018 2019 2020 2021
U.S
. $/m
etric
ton
SpreadU.S. Gulf to JapanPNW to Japan
2nd quarter 2021 ocean rates % change from: U.S. Gulf PNW SpreadLast quarter 26 28 24 Last year 82 102 59
ocean rates
Quarterly ocean freight rates for shipping bulk grain from the U.S. Gulf and Pacific Northwest to selected foreign markets in dollars per metric ton.

9
Grain Truck and Ocean Rate Advisory
Surajudeen Olowolayemo, Economist E-mail: [email protected]
April Taylor, Economist E-mail: [email protected] 202.720.7880
Subscription Information:Subscription Information:
Please sign up to receive regular email announcements of the latest issue of Grain Truck and Ocean Rate Advisory by entering your email address at the following link and selecting “Transportation” under the Publications, Data, and Reports section. https://public.govdelivery.com/accounts/USDAAMS/subscriber/new?topic_id=USDAAMS_177
Related WebsitesRelated Websites
• Grain Transportation Report• Mexico Transport Cost Indicator Report• Brazil Soybean Transportation Indicator• Agricultural Refrigerated Truck Quarterly
Preferred Citation:
U.S. Department of Agriculture, Agricultural Marketing Service. Grain Truck and Ocean Rate Advisory. August 2021. Web. <http://dx.doi.org/10.9752/TS265.08-2021>
Photo Credit: USDA
USDA is an equal opportunity provider, employer, and lender.
For assistance with accessibility issues related to this document, please email [email protected].
contacts and links