Brian schnick. BASIC CONCEPTS IN SAMPLING Advantages of Sampling Sampling Error Sampling Procedure.
RESEARCH REVIEW No. 50
GRAIN SAMPLING METHODS TO ACHIEVE CONSUMER
CONFIDENCE AND FOOD SAFETY
JULY 2003 Price £4.00
1
RESEARCH REVIEW No. 50
GRAIN SAMPLING METHODS TO ACHIEVE CONSUMER
CONFIDENCE AND FOOD SAFETY
by
D ARMITAGE
Central Science Laboratory, DEFRA, Sand Hutton, York YO41 1LZ
This is the final report of a 4-month review that started in December 2002 with a grant of £14,797 from HGCA (Project No 2912). The Home-Grown Cereals Authority (HGCA) has provided funding for this project but has not conducted the research or written this report. While the authors have worked on the best information available to them, neither HGCA nor the authors shall in any event be liable for any loss, damage or injury howsoever suffered directly or indirectly in relation to the report or the research on which it is based. Reference herein to trade names and proprietary products without stating that they are protected does not imply that they may be regarded as unprotected and thus free for general use. No endorsement of named products is intended nor is it any criticism implied of other alternative, but unnamed, products.
2
Contents
Abstract 3
Introduction 4
Approaches 5
Sample / Sampling definitions 5
1. Background to sampling 6
2. Genetically Modified Organisms (GMOs) 11
3. Mycotoxins 15
4. Micro-organisms 22
5. Heavy metals 24
6. Agrochemical residues (including storage pesticides) 26
7. Pests (including mites) 28
Overview and recommendations 34
3
ABSTRACT
Grain is sampled for one, possibly, two reasons:
• to determine the average quality based on a representative sample
• to detect contaminants. This information may trigger rejection of a load or determine whether the
levels of a contaminant in a bulk exceed a regulatory threshold.
This review examined published sampling regimes for a number of contaminants that now, or in the future,
may affect food safety. These were: genetically modified organisms, mycotoxins, micro-organisms, heavy
metals, agrochemical residues and arthropod pests.
A common, ISO 13690-based approach using 5-11 samples from 15-500t is used for some contaminants.
This is reasonable when the contaminant (analyte) is homogeneously distributed, although sample size and
number of samples/tonne are often poorly defined, standards used may have no scientific basis and there are
rarely validation details. Sampling regimes for insects and in particular, mycotoxins, which are
heterogeneously distributed, are very demanding.
An EU directive recommends taking 100 samples of 100g from 50-1500t for regulatory purposes for
mycotoxin determination. Live insect contamination is best estimated using traps but the regulatory
mycotoxin sampling may be adaptable for sampling insects and would also apply to dead insects.
It is recommended that the ISO-based sampling method be validated experimentally for a variety of analytes
since it is widely cited and convenient to use. However, its effectiveness is unclear. A simplified method of
sampling for mycotoxins should be developed that will give results comparable to the regulatory sampling.
This would demonstrate ‘due diligence’ and avoid costs associated with the ‘regulatory’ sampling protocols.
(If such a method proved ‘substantially equivalent’ to the regulatory sampling, it could be used for regulatory
processes if there were cost savings). The pattern of mixing grain during outloading has considerable
influence on the distribution of analytes. It therefore affects the sampling regime and merits study.
4
INTRODUCTION
The primary aim of the HGCA ‘Grain Sampling and Analysis Project’ (GSAP) is to develop and validate
sampling protocols that are designed to test end-user specification requirements. The analytical
harmonisation element of the project also focuses on these tests. Although these approaches should assist
both seller and buyer of grain, they do not directly address consumer confidence and food safety. These
concerns are currently driven by legislation and consumer pressure groups.
Because of these concerns and the way in which minor contaminants are distributed in raw agricultural
products it is generally necessary to sample differently to obtain representative samples for a range of
contaminants. Further homogenisation and sub-sampling is required to provide a meaningful analysts’
sample and the size of the sub-sample may vary with the analyte contaminant.
The main contaminants include:
Genetically modified organisms
Mycotoxins of field and storage origin
Micro-organisms
Heavy metals
Agrochemical residues (including storage pesticides)
Pests (including mites).
This desk study reviews relevant sampling protocols published in the UK and elsewhere. It analyses their
scientific basis and comments on their validation, where any exist. The review concentrates on cereals
(wheat, barley etc.) but, where appropriate (e.g. with GM oilseeds), reference is made to other commodities.
Where there are similarities between sampling requirements (based on sound science) for various analytes,
their appropriateness with other analytes is considered. The aim is to identify as few sampling protocols as
possible to deliver robust test data for the analytes considered. In addition, the potential and relevance of
existing ‘quality’ sampling protocols to food safety testing is considered.
The review focusses on sampling in permanent storage situations, e.g. farm or co-operative storage (both flat
and bin storage) and intake at buyers’ premises, where appropriate, defining lot size. Sampling of vessels is
also considered to ensure coverage of conditions affecting imports and exports. Attention is also paid to the
appropriateness of specifications for blending (homogenisation) and sub-sampling, to provide an analyst’s
sample.
5
The review’s purpose is to recommend practical sampling procedures for surveillance testing of any or all
the items listed. It also highlights areas where further information and experimentation is needed to develop
or validate new protocols.
APPROACHES
This review commenced with a survey of BSI and ISO standards applying to grain sampling. Meetings with
CSL experts in mycotoxins, GMOs, residues and pests produced much background material and provided
valuable insights into protocols under development, as well as published information. Additional documents
and information were sought using web searches which enabled access to many documents, e.g. EU
directives and CODEX. Where information was particularly lacking, such as sampling to detect
bacteriological contamination, conventional library literature reviews were conducted.
Most methodologies (e.g. CODEX, ISO) do not reference the sources or science behind protocols and rarely
the expert committees, who agree them, so it is difficult to evaluate the appropriateness of
recommendations.
SAMPLE / SAMPLING DEFINITIONS
Lot- An identified amount of grain (offered by an applicant for inspection). An identified quantity of material
having characteristics presumed to be relatively uniform. This presumption may not be so for all the
analytes covered by this review
Increment-. A quantity of material taken at one time from a single point in a lot. Also known as ‘primary
sample’.
Composite sample- A single sample composed of small portions taken from throughout a lot. Also known as
bulk sample. A quantity of material obtained by combining and mixing all increments in the same lot.
Reduced sample- A representative part of the bulk sample obtained by the process of reduction in such a
manner that the mass or volume approximates to the laboratory samples. Also known as ‘submitted sample’.
Laboratory sample- A sample representative of the quality and condition of the lot, obtained by reduction of
the bulk sample and intended for analysis or other examination. Also known as ‘working sample’.
6
1. BACKGROUND TO SAMPLING
Grain is sampled for one, possibly, two reasons:
• to determine the average quality based on a representative sample
• to detect contaminants. This information may trigger rejection of a load or determine whether the
levels of a contaminant in a bulk exceed a regulatory threshold.
The sampling regime adopted will depend on the aim. For instance, if a representative sample is required
then a random or systematic sampling plan may be most appropriate but if the presence of an undesired
quality such as a pest, for which there is no tolerance, is to be established, then the sampling plan will need
to concentrate on the most likely position for the particular analyte.
Many standard reference works on sampling make no mention that different analytes may require different
sampling regimes. Examples of these are the GIPSA (Grain Inspection, Packers and Stockyards
Administration) Grain inspection handbook1.1 and the often quoted ISO 950, now superseded by ISO 13690
1.2.
This review aims to identify one or more approaches to taking a representative sample for the analytes listed
in the introduction.
Sampling protocols
GIPSA1.1, United States Department of Agriculture (USDA) discusses the mechanics of sampling and gives
sampling plans for barges, trucks, hopper cars but which would apply equally to similar sized static bins. It
suggests an acceptable sampling ration of 1250 g from 5,000 bushels (ca. 146t of wheat) of grain and that
when containers contain inferior portions (e.g. musty, sour or heating) three separate samples must be drawn
(one from the inferior portion, one from the entire lot and one from the remainder of the lot) producing a
minimum of 2kg. The purpose of the sampling so described, whether for regulatory or market requirements,
is not discussed.
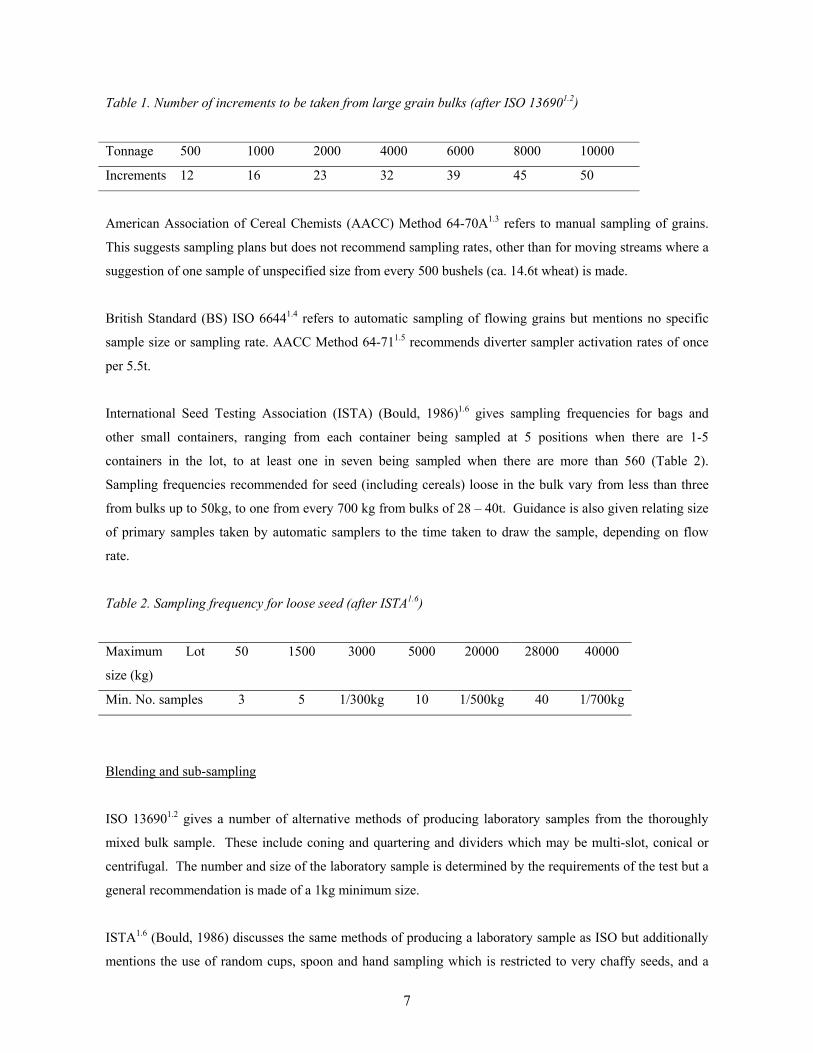
International Standards Organisation (ISO) 136901.2 covers sampling of cereals from bags, from wagons,
lorries, barges or ships and from silos, bins and warehouses. This suggests patterns of sampling (indicating
position of sampling columns) from lorries etc., taking a minimum of 5 - 11 samples throughout the whole
depth of the lot from lots varying from 15 – 500t (Table 1). It suggests a similar pattern should be used when
sampling bulk grain. It recommends determining the number of increments by dividing the square root of the
tonnage by two and rounding to the nearest whole number. Thus 12 samples would be taken from a 500t lot
and 50 from 10,000t.
7
Table 1. Number of increments to be taken from large grain bulks (after ISO 136901.2)
Tonnage 500 1000 2000 4000 6000 8000 10000
Increments 12 16 23 32 39 45 50
American Association of Cereal Chemists (AACC) Method 64-70A1.3 refers to manual sampling of grains.
This suggests sampling plans but does not recommend sampling rates, other than for moving streams where a
suggestion of one sample of unspecified size from every 500 bushels (ca. 14.6t wheat) is made.
British Standard (BS) ISO 66441.4 refers to automatic sampling of flowing grains but mentions no specific
sample size or sampling rate. AACC Method 64-711.5 recommends diverter sampler activation rates of once
per 5.5t.
International Seed Testing Association (ISTA) (Bould, 1986)1.6 gives sampling frequencies for bags and
other small containers, ranging from each container being sampled at 5 positions when there are 1-5
containers in the lot, to at least one in seven being sampled when there are more than 560 (Table 2).
Sampling frequencies recommended for seed (including cereals) loose in the bulk vary from less than three
from bulks up to 50kg, to one from every 700 kg from bulks of 28 – 40t. Guidance is also given relating size
of primary samples taken by automatic samplers to the time taken to draw the sample, depending on flow
rate.
Table 2. Sampling frequency for loose seed (after ISTA1.6)
Maximum Lot
size (kg)
50 1500 3000 5000 20000 28000 40000
Min. No. samples 3 5 1/300kg 10 1/500kg 40 1/700kg
Blending and sub-sampling
ISO 136901.2 gives a number of alternative methods of producing laboratory samples from the thoroughly
mixed bulk sample. These include coning and quartering and dividers which may be multi-slot, conical or
centrifugal. The number and size of the laboratory sample is determined by the requirements of the test but a
general recommendation is made of a 1kg minimum size.
ISTA1.6 (Bould, 1986) discusses the same methods of producing a laboratory sample as ISO but additionally
mentions the use of random cups, spoon and hand sampling which is restricted to very chaffy seeds, and a
8
rotary divider (for cleaner samples). ISTA also discusses the production of working samples, based on the
number of seeds and thus on a pure seed content. This will affect certain parameters of the sample since the
admixture component has a higher pesticide content and a more numerous microbiological component
(Armitage et al., 19961.7).
Validation / Principles
The Codex Alimentarius Commission was created to develop food standards, guidelines and codes of
practice under the Joint FAO/WHO Food Standards Programme. It publishes guidelines for sampling plans
for food tested for compliance with particular Codex commodity standards (Codex, 20031.8). This lists 13
ISO standards which form the basis of the procedures discussed. It covers selection of sampling plans
including those for the inspection of bulk material but the scope does not cover control of non-homogenous
goods.
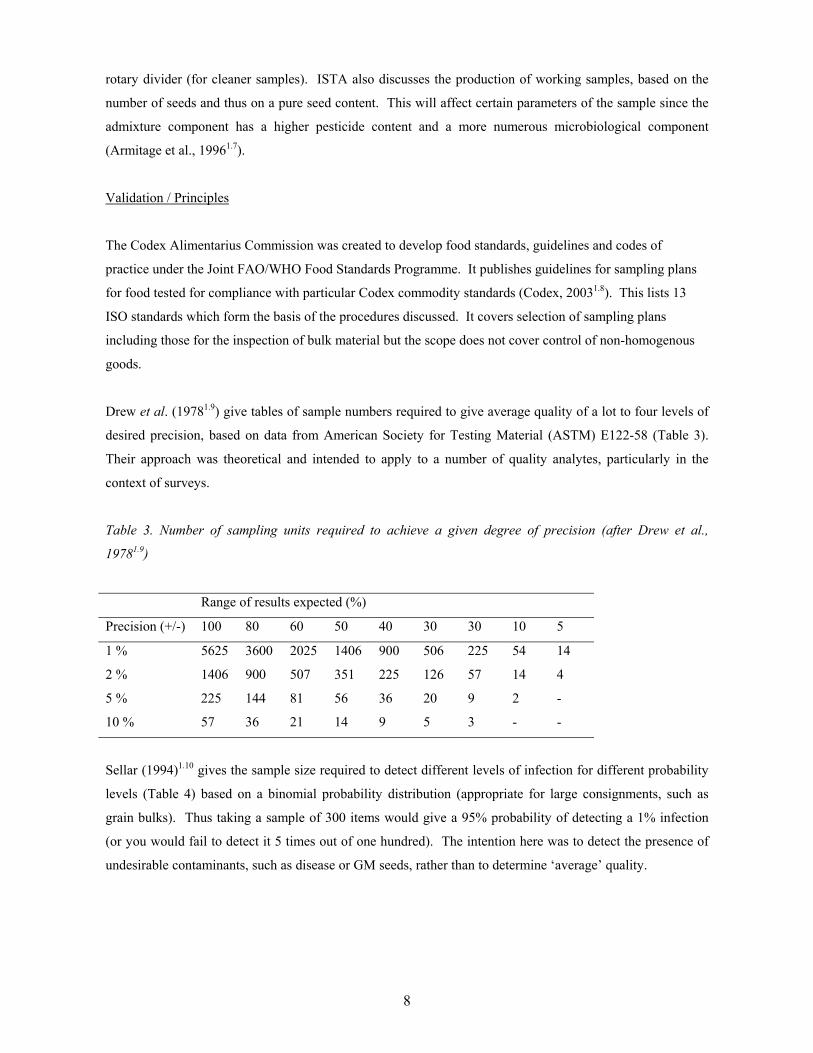
Drew et al. (19781.9) give tables of sample numbers required to give average quality of a lot to four levels of
desired precision, based on data from American Society for Testing Material (ASTM) E122-58 (Table 3).
Their approach was theoretical and intended to apply to a number of quality analytes, particularly in the
context of surveys.
Table 3. Number of sampling units required to achieve a given degree of precision (after Drew et al.,
19781.9)
Range of results expected (%)
Precision (+/-) 100 80 60 50 40 30 30 10 5
1 % 5625 3600 2025 1406 900 506 225 54 14
2 % 1406 900 507 351 225 126 57 14 4
5 % 225 144 81 56 36 20 9 2 -
10 % 57 36 21 14 9 5 3 - -
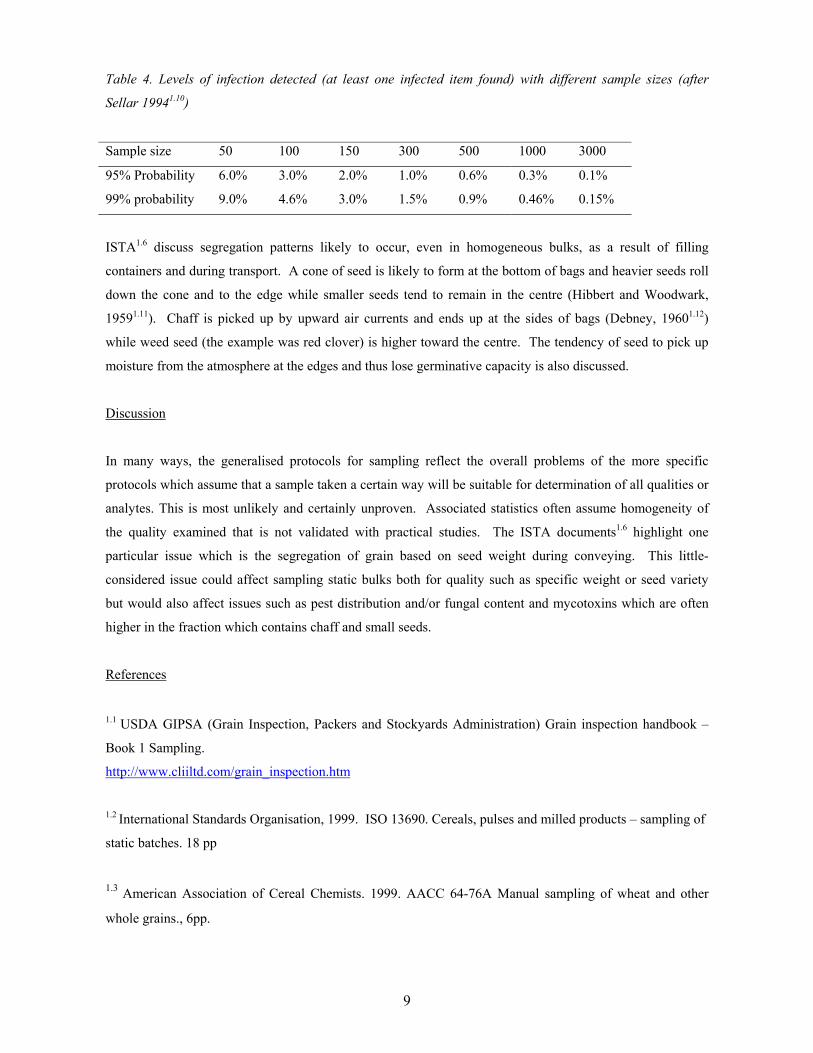
Sellar (1994)1.10 gives the sample size required to detect different levels of infection for different probability
levels (Table 4) based on a binomial probability distribution (appropriate for large consignments, such as
grain bulks). Thus taking a sample of 300 items would give a 95% probability of detecting a 1% infection
(or you would fail to detect it 5 times out of one hundred). The intention here was to detect the presence of
undesirable contaminants, such as disease or GM seeds, rather than to determine ‘average’ quality.
9
Table 4. Levels of infection detected (at least one infected item found) with different sample sizes (after
Sellar 19941.10)
Sample size 50 100 150 300 500 1000 3000
95% Probability 6.0% 3.0% 2.0% 1.0% 0.6% 0.3% 0.1%
99% probability 9.0% 4.6% 3.0% 1.5% 0.9% 0.46% 0.15%
ISTA1.6 discuss segregation patterns likely to occur, even in homogeneous bulks, as a result of filling
containers and during transport. A cone of seed is likely to form at the bottom of bags and heavier seeds roll
down the cone and to the edge while smaller seeds tend to remain in the centre (Hibbert and Woodwark,
19591.11). Chaff is picked up by upward air currents and ends up at the sides of bags (Debney, 19601.12)
while weed seed (the example was red clover) is higher toward the centre. The tendency of seed to pick up
moisture from the atmosphere at the edges and thus lose germinative capacity is also discussed.
Discussion
In many ways, the generalised protocols for sampling reflect the overall problems of the more specific
protocols which assume that a sample taken a certain way will be suitable for determination of all qualities or
analytes. This is most unlikely and certainly unproven. Associated statistics often assume homogeneity of
the quality examined that is not validated with practical studies. The ISTA documents1.6 highlight one
particular issue which is the segregation of grain based on seed weight during conveying. This little-
considered issue could affect sampling static bulks both for quality such as specific weight or seed variety
but would also affect issues such as pest distribution and/or fungal content and mycotoxins which are often
higher in the fraction which contains chaff and small seeds.
References
1.1 USDA GIPSA (Grain Inspection, Packers and Stockyards Administration) Grain inspection handbook –
Book 1 Sampling.
http://www.cliiltd.com/grain_inspection.htm
1.2 International Standards Organisation, 1999. ISO 13690. Cereals, pulses and milled products – sampling of
static batches. 18 pp
1.3 American Association of Cereal Chemists. 1999. AACC 64-76A Manual sampling of wheat and other
whole grains., 6pp.
10
1.4 British Standards BS ISO 6644. 2002. Flowing cereals and milled cereal products – Automatic sampling
by mechanical means. 9pp
1.5 American Association of Cereal Chemists 1999. AACC 64-71 Mechanical sampling of dry, free-flowing
granular material., 3pp.
http://www.aaccnet.org/ApprovedMethods/toc.htm 1.6 Bould, A (Ed.) 1986. Handbook on seed sampling. 1986. 61 pp International Seed Testing Association,
Zurich, Switzerland.
1.7 Armitage, D.M., Cook, D.A. and Duckett, C. 1996 The use of an aspirated sieve to remove insects, mites
and pesticides from grain. Crop Prot. 15, 675-680.
1.8 Codex Alimentarius Commission. 2003 ALINORM 03/23 Report of the 24 th session of the CODEX
Committee on methods of analysis and sampling. Appendix IV Proposed draft general guidelines on
sampling (at step 5 of the procedure). Joint FAO/WHO Food Standards Programme, 32-101.
1.9 Drew, B.A., Granovsky, T.A. and Lindblad, C.J. 1978. Representative sampling, interpretation of results,
accuracy and reliability. Chapter 4 pp 45-76 In: Post-harvest grain loss assessment methods Eds Harris, K.L.
and Lindblad, C.J. American Association of Cereal Chemists, 193 pp.
1.10 Sellar, P. 1994. Sampling to detect the presence of a quarantine organism. Central Science Laboratory,
York 3pp.
1.11 Hibbert, D. and Woodwark, W. 1959. The sampling of sugar beet seed contained in sacks. 22nd Winter
Congress, Institute o International de Recherches Betteravieres. Brussels, 1957.
1.12 Debney, E.W. 1960. Dynamic sampling spears in the United Kingdom. Proc. Int. Seed Testing. Ass. 34,
73-95.
11
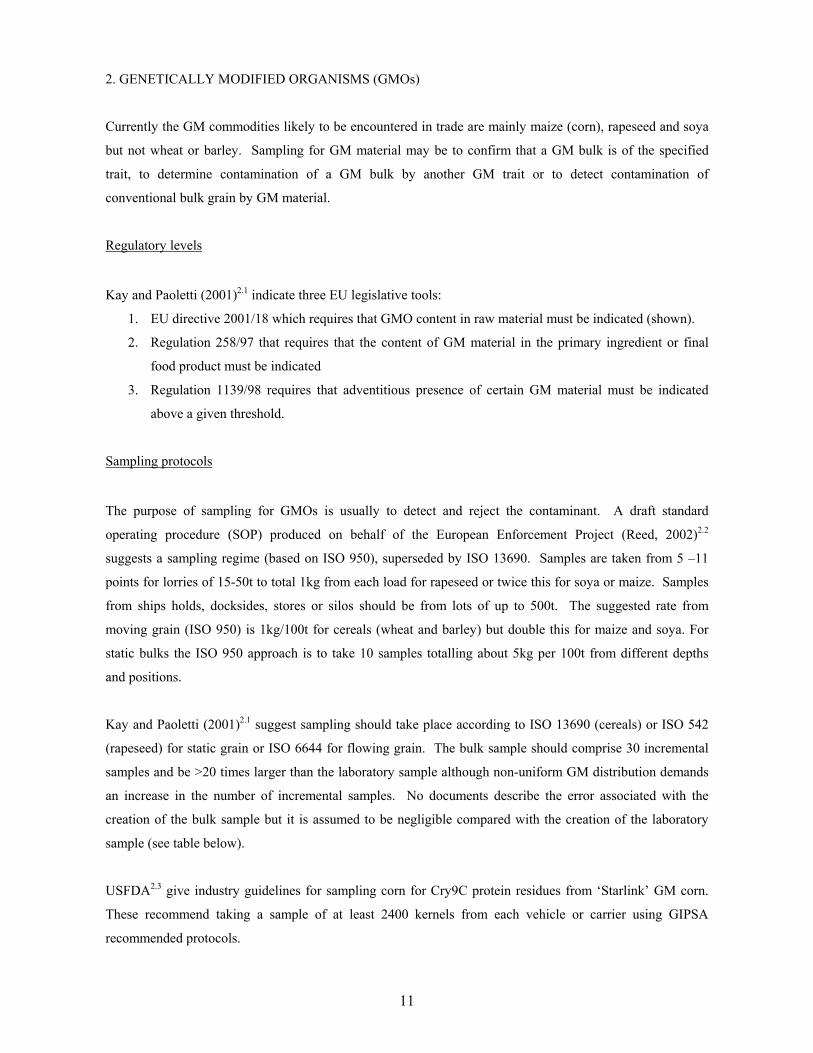
2. GENETICALLY MODIFIED ORGANISMS (GMOs)
Currently the GM commodities likely to be encountered in trade are mainly maize (corn), rapeseed and soya
but not wheat or barley. Sampling for GM material may be to confirm that a GM bulk is of the specified
trait, to determine contamination of a GM bulk by another GM trait or to detect contamination of
conventional bulk grain by GM material.
Regulatory levels
Kay and Paoletti (2001)2.1 indicate three EU legislative tools:
1. EU directive 2001/18 which requires that GMO content in raw material must be indicated (shown).
2. Regulation 258/97 that requires that the content of GM material in the primary ingredient or final
food product must be indicated
3. Regulation 1139/98 requires that adventitious presence of certain GM material must be indicated
above a given threshold.
Sampling protocols
The purpose of sampling for GMOs is usually to detect and reject the contaminant. A draft standard
operating procedure (SOP) produced on behalf of the European Enforcement Project (Reed, 2002)2.2
suggests a sampling regime (based on ISO 950), superseded by ISO 13690. Samples are taken from 5 –11
points for lorries of 15-50t to total 1kg from each load for rapeseed or twice this for soya or maize. Samples
from ships holds, docksides, stores or silos should be from lots of up to 500t. The suggested rate from
moving grain (ISO 950) is 1kg/100t for cereals (wheat and barley) but double this for maize and soya. For
static bulks the ISO 950 approach is to take 10 samples totalling about 5kg per 100t from different depths
and positions.
Kay and Paoletti (2001)2.1 suggest sampling should take place according to ISO 13690 (cereals) or ISO 542
(rapeseed) for static grain or ISO 6644 for flowing grain. The bulk sample should comprise 30 incremental
samples and be >20 times larger than the laboratory sample although non-uniform GM distribution demands
an increase in the number of incremental samples. No documents describe the error associated with the
creation of the bulk sample but it is assumed to be negligible compared with the creation of the laboratory
sample (see table below).
USFDA2.3 give industry guidelines for sampling corn for Cry9C protein residues from ‘Starlink’ GM corn.
These recommend taking a sample of at least 2400 kernels from each vehicle or carrier using GIPSA
recommended protocols.
12
Blending and sub-sampling
The European draft SOP2.2 suggests a working sub-sample of a minimum 3000 seeds prepared to ISTA
methods.
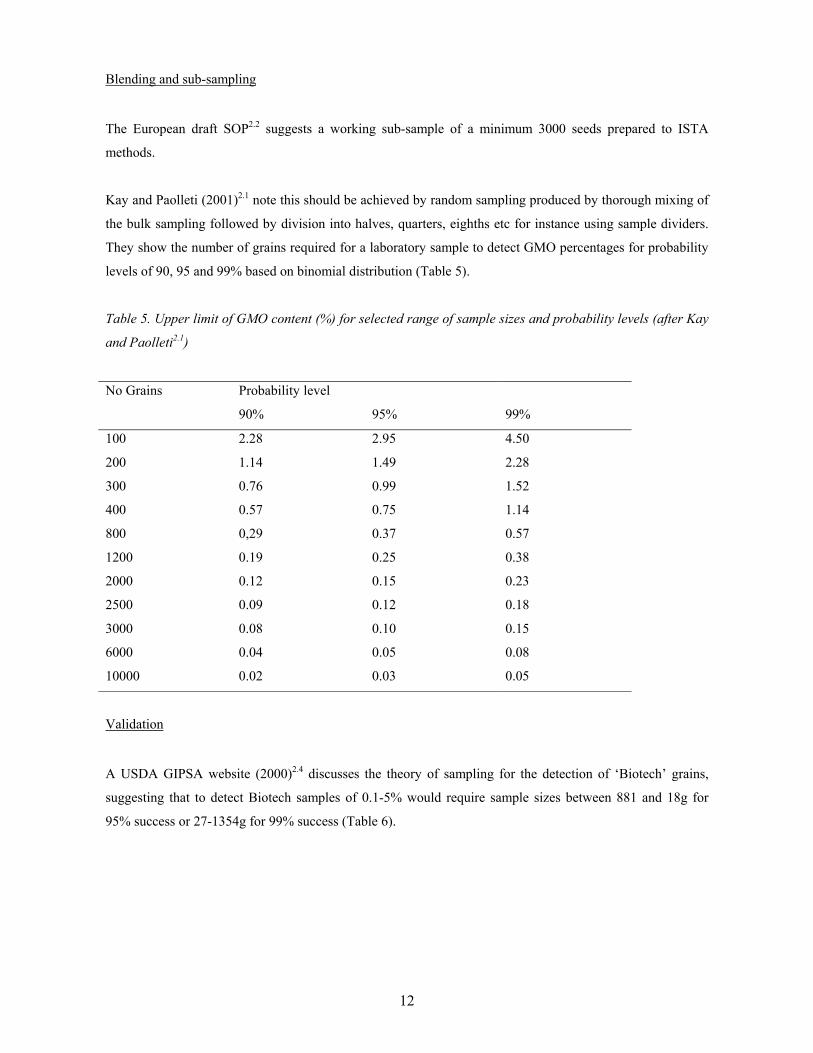
Kay and Paolleti (2001)2.1 note this should be achieved by random sampling produced by thorough mixing of
the bulk sampling followed by division into halves, quarters, eighths etc for instance using sample dividers.
They show the number of grains required for a laboratory sample to detect GMO percentages for probability
levels of 90, 95 and 99% based on binomial distribution (Table 5).
Table 5. Upper limit of GMO content (%) for selected range of sample sizes and probability levels (after Kay
and Paolleti2.1)
No Grains Probability level
90%
95%
99%
100 2.28 2.95 4.50
200 1.14 1.49 2.28
300 0.76 0.99 1.52
400 0.57 0.75 1.14
800 0,29 0.37 0.57
1200 0.19 0.25 0.38
2000 0.12 0.15 0.23
2500 0.09 0.12 0.18
3000 0.08 0.10 0.15
6000 0.04 0.05 0.08
10000 0.02 0.03 0.05
Validation
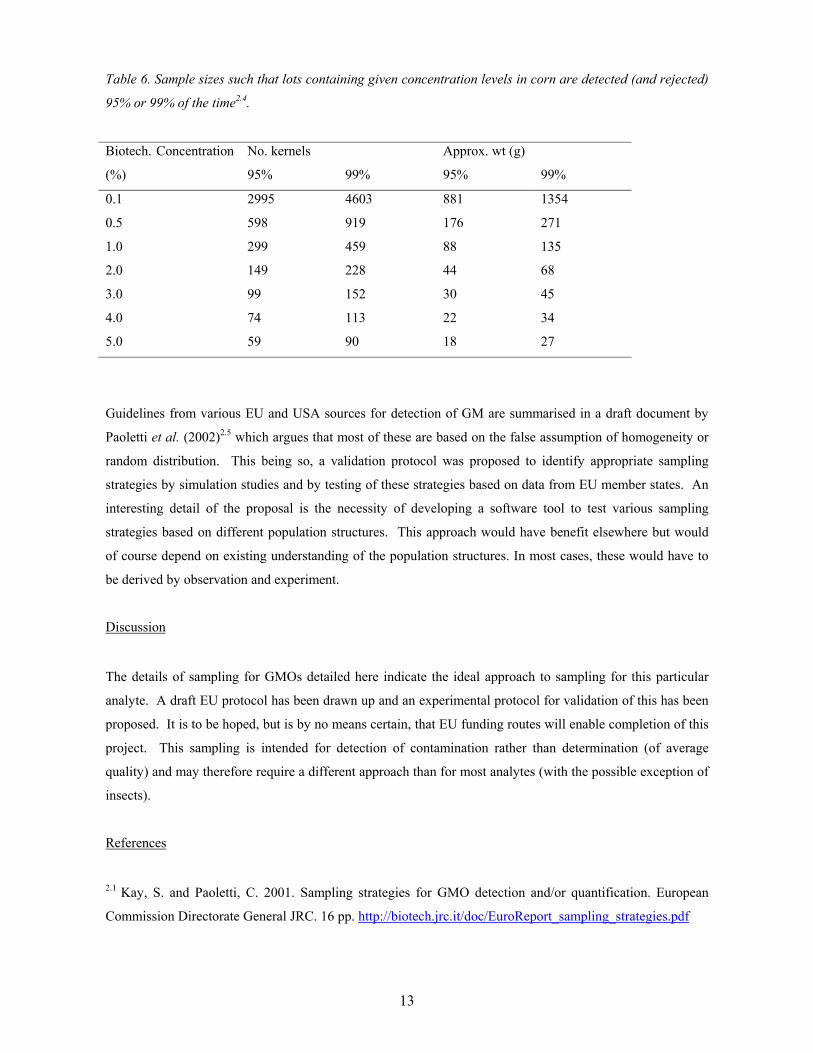
A USDA GIPSA website (2000)2.4 discusses the theory of sampling for the detection of ‘Biotech’ grains,
suggesting that to detect Biotech samples of 0.1-5% would require sample sizes between 881 and 18g for
95% success or 27-1354g for 99% success (Table 6).
13
Table 6. Sample sizes such that lots containing given concentration levels in corn are detected (and rejected)
95% or 99% of the time2.4.
Biotech. Concentration
(%)
No. kernels
95%
99%
Approx. wt (g)
95%
99%
0.1 2995 4603 881 1354
0.5 598 919 176 271
1.0 299 459 88 135
2.0 149 228 44 68
3.0 99 152 30 45
4.0 74 113 22 34
5.0 59 90 18 27
Guidelines from various EU and USA sources for detection of GM are summarised in a draft document by
Paoletti et al. (2002)2.5 which argues that most of these are based on the false assumption of homogeneity or
random distribution. This being so, a validation protocol was proposed to identify appropriate sampling
strategies by simulation studies and by testing of these strategies based on data from EU member states. An
interesting detail of the proposal is the necessity of developing a software tool to test various sampling
strategies based on different population structures. This approach would have benefit elsewhere but would
of course depend on existing understanding of the population structures. In most cases, these would have to
be derived by observation and experiment.
Discussion
The details of sampling for GMOs detailed here indicate the ideal approach to sampling for this particular
analyte. A draft EU protocol has been drawn up and an experimental protocol for validation of this has been
proposed. It is to be hoped, but is by no means certain, that EU funding routes will enable completion of this
project. This sampling is intended for detection of contamination rather than determination (of average
quality) and may therefore require a different approach than for most analytes (with the possible exception of
insects).
References
2.1 Kay, S. and Paoletti, C. 2001. Sampling strategies for GMO detection and/or quantification. European
Commission Directorate General JRC. 16 pp. http://biotech.jrc.it/doc/EuroReport_sampling_strategies.pdf
14
2.2 Reed, P. 2002. Protocol for bulk grain sampling and testing for GM presence. Draft SOP produced on
behalf of European Enforcement Project. CSL, York, UK. 8pp
2.3 Anon, 2001. FDA recommendations for sampling and testing yellow corn and dry-milled yellow corn
shipments intended for human food use for Cry9C protein residues USFDA, Centre for Food Safety and
applied nutrition, 8pp
http://vm.cfsan.fda.gov/~dms/starguid.html
2.4 Anon, 2000. Sampling for the detection of Biotech grains.
http://www.usda.gov/gipsa/biotech/sample1.htm
2.5 Paoletti, C., Donatelli, M., Kay, S., van den Ede G. 2002. Simulating kernel lot sampling; the effect of
heterogeneity on the detection of GMO contaminations. Seed Science and Technology.
http://biotech.jrc.it/doc/SeedScienceAndTechnology.pdf
15
3. MYCOTOXINS
Mycotoxins are fungal metabolites produced to give certain species of fungi competitive advantage over
others. Unfortunately some have been proven to have ill effects on human health and also genotoxic
carcinogens. Their production is usually related to certain moisture and temperature conditions, related to
the growth requirements of different species. Mycotoxins in cereals have two origins, either being formed in
the field during the growth or in store. The former include fumonisins, trichothecenes (e.g. deoxynivalenol)
and zearalenone and are derived from Fusarium spp. Although there is conflicting opinion, it is generally
accepted that these are not usually produced in storage, except perhaps during advanced decay. (However,
propionic acid treatment of damp grain may select for Fusarium spp. according to Burrell et. al, 1983 3.1.)
During storage, different fungi predominate and the main concerns then centre on toxins produce by the
relatively xerophilic fungal genera that prefer lower moisture contents; Aspergillus (Eurotium) and
Penicillium which may produce aflatoxins and ochratoxins respectively. It is the latter group that are
currently of greatest concern in the UK since temperatures and moisture contents here do not favour the
former. It is generally considered (eg Cahagnier et al, in press 3.2) that the mycotoxins are formed during
mycelial growth and may be related to ergosterol production. It has also been noted that ochratoxin A
production rarely occurs when colony counts, which are mainly conidial, are below 1,000 per g (Olsen,
National Food Administration, Sweden, personal communication).
The origin of mycotoxin formation will naturally have an effect on the sampling process. It may be assumed
that field mycotoxins may be mixed in transport and during conveying as the grain goes into store and
therefore may be relatively homogeneous. On the other hand, storage mycotoxins are likely to be locally
distributed and will only be formed when the grain is stored for some time above the threshold for growth of
the mycotoxin-producing fungi. This is only likely to occur on un-dried grain during harvest backlogs and
during the ambient-air drying process when grain at the top of the bin remains close to its original moisture
content until the drying front passes through. In this case, the mycotoxins will be primarily at the top of the
bin (or floor store) if the grain is not ‘turned’ after drying.
Regulatory levels
A CSL internal database lists current regulatory levels of numerous mycotoxins on specified commodities
and will be widely available soon.
(CSL intranet:- http://devserva/tracey/mycotoxins/)
EU regulatory levels for the storage mycotoxins are quite simple:
4µg/kg total aflatoxins of which aflatoxin B1 must not exceed 2µg/kg in cereals (including buckwheat,
Fagopyrum sp.), with the exception of maize, to be subjected to a sorting, or other physical treatment before
their human consumption or their use as an ingredient in foodstuffs (Commission Regulation (EC) No.
466/2001)3.3.
16
5µg/kg ochratoxin A (OA) in raw cereal grains (including raw rice and buckwheat) (Commission Regulation
(EC) No. 472/2002)3.4 (amending Commission regulation (EC) No 466/2001)
However, harmonised EU regulatory levels do not currently exist for the field mycotoxins. For other
individual countries they vary widely depending on consumer (e.g. infants, adults, animal species) and
commodity.
Sampling protocols
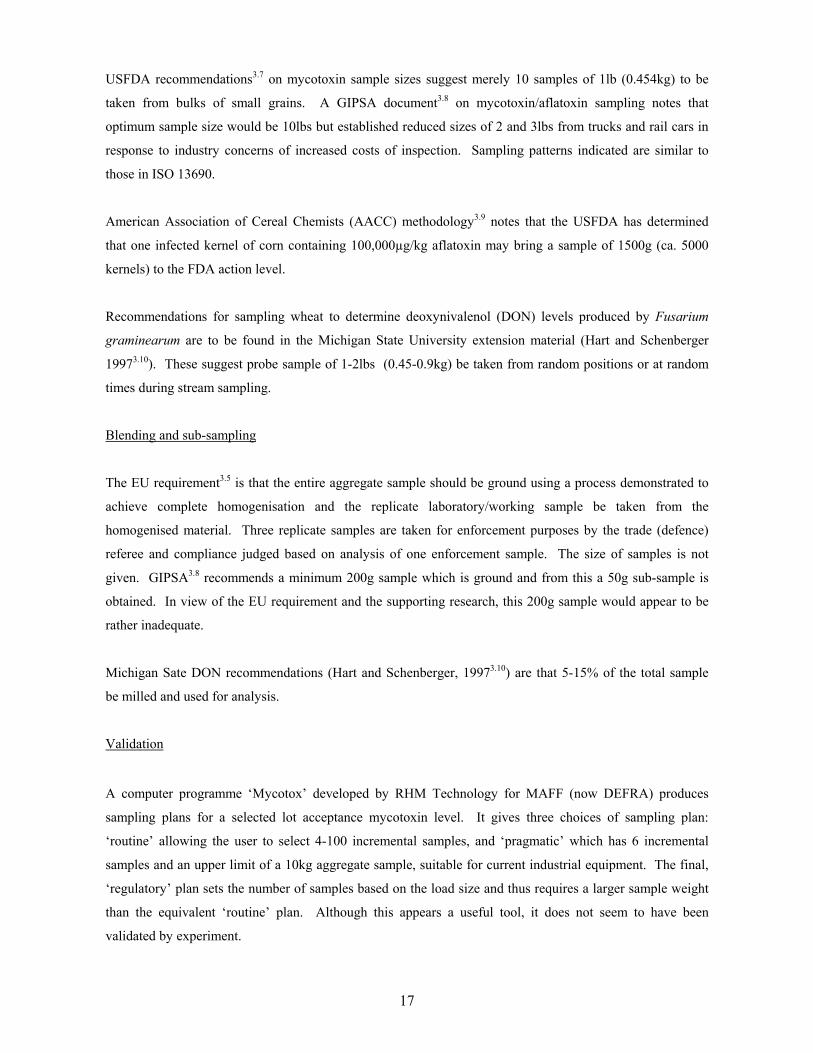
For OA, EU Commission directive 2002/26/EC3.5 recommends 100 samples of 100g be taken from bulks
between 50 and 1500t resulting in aggregate samples of 10kg (Table 7). Similar guidelines are laid down for
sampling for aflatoxins3.6.
The sampling and analysis directives which accompany the regulations are addressed to enforcement
agencies (i.e. local authorities and port health authorities) to enable them to enforce the regulations
adequately. These agencies are required to use these sampling regimes but there is no direct requirement for
others to do so. How others ensure that the commodities they produce and sell comply with the regulations
is a matter for them to determine and to provide evidence of in their due diligence defence if an official
control sample finds them wanting. The official sampling regime is onerous and the directives state that it is
acceptable as a defence if an alternative sampling regime is used that can be shown to be "substantially
equivalent" to the official one.
Table7. No. of incremental samples to be taken for OA determination depending on lot size (after CD
2002/26/EC.3.5)
Lot wt (t) Wt or no of sub-
lots
No of
incremental
samples
Aggregate
sample weight
(kg)
≥ 1500 500 t 100 10
>300 <1500 3 sub-lots 100 10
≥ 50 ≤ 300 100 t 100 10
>20- <50 100 10
>10-≤ 20 60 6
>3 - ≤10 40 4
>1 -≤ 3 20 2
≤ 1 10 1
17
USFDA recommendations3.7 on mycotoxin sample sizes suggest merely 10 samples of 1lb (0.454kg) to be
taken from bulks of small grains. A GIPSA document3.8 on mycotoxin/aflatoxin sampling notes that
optimum sample size would be 10lbs but established reduced sizes of 2 and 3lbs from trucks and rail cars in
response to industry concerns of increased costs of inspection. Sampling patterns indicated are similar to
those in ISO 13690.
American Association of Cereal Chemists (AACC) methodology3.9 notes that the USFDA has determined
that one infected kernel of corn containing 100,000µg/kg aflatoxin may bring a sample of 1500g (ca. 5000
kernels) to the FDA action level.
Recommendations for sampling wheat to determine deoxynivalenol (DON) levels produced by Fusarium
graminearum are to be found in the Michigan State University extension material (Hart and Schenberger
19973.10). These suggest probe sample of 1-2lbs (0.45-0.9kg) be taken from random positions or at random
times during stream sampling.
Blending and sub-sampling
The EU requirement3.5 is that the entire aggregate sample should be ground using a process demonstrated to
achieve complete homogenisation and the replicate laboratory/working sample be taken from the
homogenised material. Three replicate samples are taken for enforcement purposes by the trade (defence)
referee and compliance judged based on analysis of one enforcement sample. The size of samples is not
given. GIPSA3.8 recommends a minimum 200g sample which is ground and from this a 50g sub-sample is
obtained. In view of the EU requirement and the supporting research, this 200g sample would appear to be
rather inadequate.
Michigan Sate DON recommendations (Hart and Schenberger, 19973.10) are that 5-15% of the total sample
be milled and used for analysis.
Validation
A computer programme ‘Mycotox’ developed by RHM Technology for MAFF (now DEFRA) produces
sampling plans for a selected lot acceptance mycotoxin level. It gives three choices of sampling plan:
‘routine’ allowing the user to select 4-100 incremental samples, and ‘pragmatic’ which has 6 incremental
samples and an upper limit of a 10kg aggregate sample, suitable for current industrial equipment. The final,
‘regulatory’ plan sets the number of samples based on the load size and thus requires a larger sample weight
than the equivalent ‘routine’ plan. Although this appears a useful tool, it does not seem to have been
validated by experiment.
18
A critical study (Wilson et al., 19993.11) compared the suitability of four aflatoxin sampling plans to detect
OA by sampling coffee and wheat. These were the USDA plan, the Dutch code of practice and the UK plan
for groundnuts and the EC plan for aflatoxin. Only the EC sampling plan for aflatoxins, based on taking 20-
100 incremental samples of 30g, depending on lot size, produced representative samples for OA in wheat.
Coker et al (1998)3.12 validated sampling plans for aflatoxin B1 in animal feedstuffs but noted that this was
based on a reasonably homogeneous distribution of the toxin and should not be applied to whole
commodities where a highly skewed distribution pattern was to be expected. They assessed 10 sampling
plans based on 1-8 composite samples each comprising 10 or 20 25g incremental samples. The coefficient of
variation for aflatoxin B1 varied between 4.0 and 12.5%.
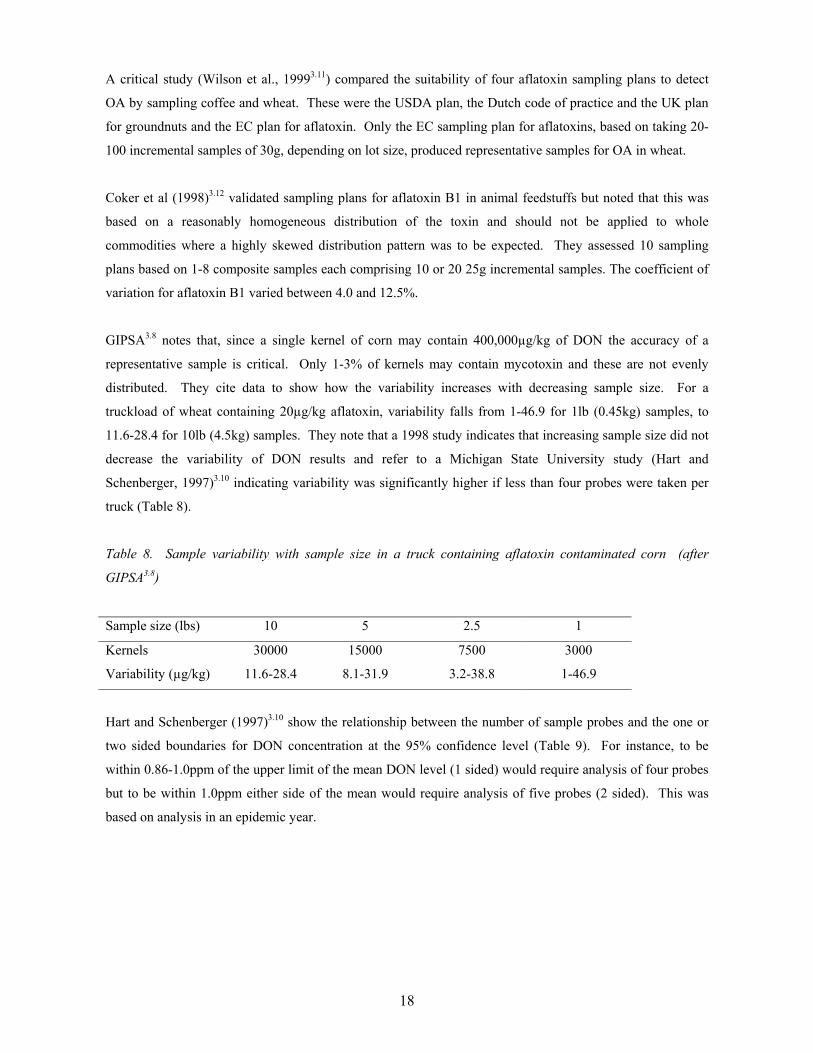
GIPSA3.8 notes that, since a single kernel of corn may contain 400,000µg/kg of DON the accuracy of a
representative sample is critical. Only 1-3% of kernels may contain mycotoxin and these are not evenly
distributed. They cite data to show how the variability increases with decreasing sample size. For a
truckload of wheat containing 20µg/kg aflatoxin, variability falls from 1-46.9 for 1lb (0.45kg) samples, to
11.6-28.4 for 10lb (4.5kg) samples. They note that a 1998 study indicates that increasing sample size did not
decrease the variability of DON results and refer to a Michigan State University study (Hart and
Schenberger, 1997)3.10 indicating variability was significantly higher if less than four probes were taken per
truck (Table 8).
Table 8. Sample variability with sample size in a truck containing aflatoxin contaminated corn (after
GIPSA3.8)
Sample size (lbs) 10 5 2.5 1
Kernels 30000 15000 7500 3000
Variability (µg/kg) 11.6-28.4 8.1-31.9 3.2-38.8 1-46.9
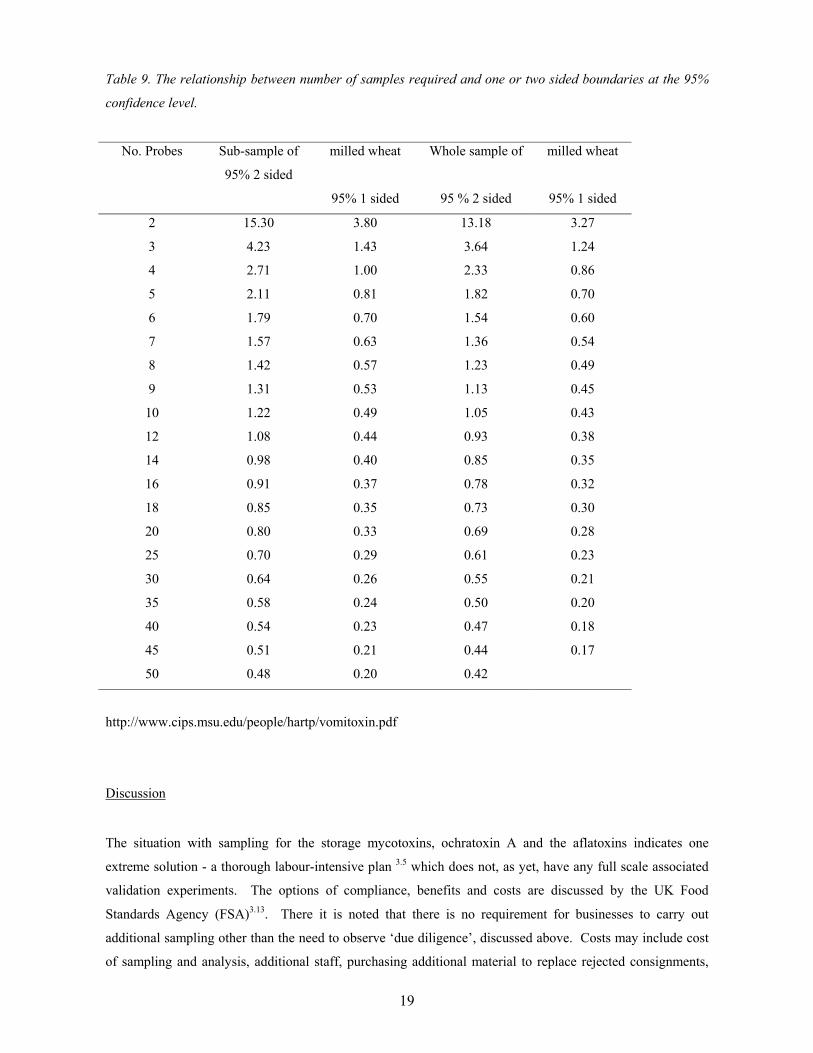
Hart and Schenberger (1997)3.10 show the relationship between the number of sample probes and the one or
two sided boundaries for DON concentration at the 95% confidence level (Table 9). For instance, to be
within 0.86-1.0ppm of the upper limit of the mean DON level (1 sided) would require analysis of four probes
but to be within 1.0ppm either side of the mean would require analysis of five probes (2 sided). This was
based on analysis in an epidemic year.
19
Table 9. The relationship between number of samples required and one or two sided boundaries at the 95%
confidence level.
No. Probes Sub-sample of
95% 2 sided
milled wheat
95% 1 sided
Whole sample of
95 % 2 sided
milled wheat
95% 1 sided
2 15.30 3.80 13.18 3.27
3 4.23 1.43 3.64 1.24
4 2.71 1.00 2.33 0.86
5 2.11 0.81 1.82 0.70
6 1.79 0.70 1.54 0.60
7 1.57 0.63 1.36 0.54
8 1.42 0.57 1.23 0.49
9 1.31 0.53 1.13 0.45
10 1.22 0.49 1.05 0.43
12 1.08 0.44 0.93 0.38
14 0.98 0.40 0.85 0.35
16 0.91 0.37 0.78 0.32
18 0.85 0.35 0.73 0.30
20 0.80 0.33 0.69 0.28
25 0.70 0.29 0.61 0.23
30 0.64 0.26 0.55 0.21
35 0.58 0.24 0.50 0.20
40 0.54 0.23 0.47 0.18
45 0.51 0.21 0.44 0.17
50 0.48 0.20 0.42
http://www.cips.msu.edu/people/hartp/vomitoxin.pdf
Discussion
The situation with sampling for the storage mycotoxins, ochratoxin A and the aflatoxins indicates one
extreme solution - a thorough labour-intensive plan 3.5 which does not, as yet, have any full scale associated
validation experiments. The options of compliance, benefits and costs are discussed by the UK Food
Standards Agency (FSA)3.13. There it is noted that there is no requirement for businesses to carry out
additional sampling other than the need to observe ‘due diligence’, discussed above. Costs may include cost
of sampling and analysis, additional staff, purchasing additional material to replace rejected consignments,
20
price premiums to cover cost of rejections, additional port charges. An example shows re-occurring costs of
£2-3,000 for a typical miller. However, in view of these costs, it may be worthwhile considering the
necessity of such intensive sampling of bulks of grain that have been harvested below the critical moisture
content for storage mycotoxin production. Some difficulties in sampling are indicated above. The
homogeneity of toxins in animal feedstuffs, presumably a result of mixing and formulation, are not reflected
by the distribution in the raw products such as grain. If experience with the field mycotoxin, DON is
anything to go by, storage mycotoxins are likely to originate in one or two individual, possible dead or
weakened grains which makes them very difficult to detect when sampling static bulks. The origin of
storage mycotoxins has still not been decisively located but since they depend on relatively high moisture
contents, there are only two likely situations where they can occur. The first is in harvest backlogs where
damp grain is left for some time before being passed through a hot-air dryer, the other is during ambient-air
drying when a drying front passes through the grain from the bottom up and thus the highest mycotoxin risk
will be found in un-dried grain toward the top of the bulk. Both situations will require a different sampling
regime since in the first case, the highest level is likely to occur in the centre of the heating bulk of damp
grain and in the second, highest toxin levels will occur toward the surface of the grain bulk. It could be
argued that, while looking for likely areas of OA occurrence may be a health safeguard, it will be counter to
producing a representative sample. The question to be resolved is whether sampling in this context should
be detection or determination.
References
3.1 Burrell, N.J., Kozakiewicz, Z., Armitage, D.M. and Clarke, J.H. 1973. Some experiments on the treatment
of damp maize with propionic acid. Ann. Technol. Agric. 22, 595-603.
3.2 Cahagnier,B., Jacobsen, J. and Fleurat-Lessard, F. In Press. Des moisisures aux mycotoxines ;
signification ecophysiologique de marqueurs biochemiques de croissance fongique et prevision des durees de
conservation sans risqué de deterioration. . In: Stored Malting Barley: Mastership of Sanitary and
Technological Quality by an Expert System (Final restitution meeting of EU Project FAIR97-3648
"QualiGrain", Reims May 2001) F. Fleurat-Lessard, A. Ndiaye and J.D. Knight (Eds) INRA Paris, France
3.3Anon, 2001. Commission Directive (EC) No 466/2001 of 8 March 2001 setting maximum levels for
certain contaminants in foodstuffs. . Official Journal of the European Communities. L 77, 1-18.
3.4Anon, 2002. Commission regulation (EC) No 472/2002 of 12 March 2002 amending regulation (EC) No
466/2001 setting maximum levels for certain contaminants in foodstuffs. . Official Journal of the European
Communities. L75, 18-20.
21
3.5Anon, 2002. Commission directive 2002/26/EC of 13 March 2002 laying down the sampling methods and
methods of analysis for the official control of the levels of ochratoxin A in foodstuffs. Official Journal of the
European Communities. L75, 38 – 43.
3.6 Anon 1998. Commission Directive 98/53/EC of 16 July 1998 laying down the sampling methods and the
methods of analysis for the official control of the levels for certain contaminants in foodstuffs. Official
Journal of the European Communities. L201, 93-101.
3.7 Anon, Chapter 4- Chart 6 Mycotoxin sample sizes. Investigations Operations manual USFDA Office of
regulatory affairs.
http://www.fda.gov.ora/inspect_ref/iom/exhibits/ch4chart_6.html.
3.8 Anon. Grain fungal diseases and mycotoxin reference. Chapter 4 pp 24-30 sampling.
http://www.usda.gov/gipsa/pubs/mycobook.pdf
3.9 American Association of Cereal Chemists. AACC Method 45-01. Sampling grain for mycotoxins, 1 p
3.10 Hart, P. and Schenberger, 1997. How to sample wheat to accurately determine vomitoxin levels.
Extension Bulletin E-2630, Michigan Sate University.
http:/msue/msu/edu/msue/imp/modlab/26309701.html
3.11 Wilson, P.H., Langton, S. and Berereton, P. 1999. Critical study to develop a sampling plan for
mycotoxins in cereals and similar particulate commodities. Report FD 97/105, 53 pp. Central Science
Laboratory, Norwich, UK.
3.12 Coker, R., Nagler, M.J., Defize, P., Derksen, G., Bucholz, H., Putzka, H.A., Hoogland, H. and Roos, A.,
1998. Report. EUR 18542 The development of sampling plans for the determination of Aflatoxin B1 in
animal feedstuffs. EN. Final report Contract no. MAT1-CT94-009. BCR information. Chemical Analysis.
European Commission, Luxembourg.
3.13 Food Standards Agency. The contaminants in Food (England) Regulations 2002 (Maximum levels for
ochratoxin A in foodstuffs) Regulatory Impact Assessment.
http:/www.food.gov.uk/foodindustry/regulation/ria/71631
22
4. MICRO-ORGANISMS
This term covers both fungi and bacteria. Neither will grow under normal storage conditions; the former
requires a minimum rh of 65% while bacteria require over 90% rh to flourish. The main sources of
contamination from bacteria are from vertebrate faeces or from soil contamination of the grain and grain
store, for instance from soil picked up during harvesting and the tyres of vehicles that drive into the grain
store during loading or unloading.
Regulatory levels
In the UK, MAFF (now DEFRA) in the codes of practice for salmonella relating to feedstuffs4.1, note that
MAFF, the storekeeper, vendor and purchaser are notified of isolation of salmonella, the occurrence should
be investigated and curative procedures instituted. The codes of practice note that the Zoonoses order of
1989 requires that all isolations of salmonella from feedstuffs and ingredients be reported to MAFF.
Many intake inspection procedures, particularly of cereals for human consumption, e.g. the malting and
milling industries, reject samples with rodent or bird droppings, presumably because of the assumption of
bacterial contamination.
Sampling protocols
The salmonella codes of practice4.1 refer to microbiological monitoring of raw materials in the production of
feedstuffs. In the case of storage, handling and transport of raw materials for feedstuffs, owners of raw
material entering stores (other than intervention or on-farm) should collect aggregate samples over a period
of one month or less. For imports, this sampling occurs where the cargo discharges. The frequency should
vary in accordance with the risk factor. For products despatched from stores, it mentions that on each day
material is despatched, at least one sample should be taken for aggregation and that these aggregate samples
should contain no more than 40 incremental samples collected over a one month period.
The USFDA in their Salmonella Sampling Plan4.2 categorises whole grain as a food item that would normally
be subjected to a process lethal to Salmonella between sampling and consumption. It suggests taking 15 sub-
samples of at least 100g based on their categorisation of commodities but it is clear from the comments (e.g.
‘The usual sub-sample is a consumer size container of a product) that their main concern is grain as human
food. It comments additionally that ‘more than one sub-sample may be collected from large institutional or
bulk containers when the number of sub-samples required exceeds the number of containers in the lot’ (see
definitions).
23
The International Commission on Microbiological Specifications for foods4.3 also comment on sampling
plans for cereals and cereal products. This discusses field and storage fungi, Salmonellae and Bacillus
cereus as potential contaminants but despite the title do not discuss any details of sampling cereals for these
contaminants.
Blending and sub-sampling
Nothing found
Validation
Nothing found
Discussion
Only the Salmonella code of practice contains sampling recommendations appropriate to cereal storage. The
description of a single sample of unknown size to be taken for aggregation into a monthly composite seems
unlikely to be adequate in view of the need to investigate the occurrence of Salmonella, not least because it
will not be possible to identify the source (e.g. bin within the store).
References
4.1 Anon 1995. Codes of practice for the control of salmonella During the storage, handling and transport of
raw materials intended for incorporation into, or direct use as animal feedingstuffs. MAFF publications,
London.19 pp.
4.2 Anon, Chapter 4- Chart 1 Salmonella sampling plan. Investigations Operations manual USFDA Office of
regulatory affairs.
http://www.fda.gov.ora/inspect_ref/iom/exhibits/ch4chart_1.html.
4.3 Anon 1986. Sampling plans for cereals and cereal products. In: Microorganisms in Foods 2. Sampling for
microbiological analysis: principles and specific applications. 2nd. Ed. International Commission on
microbiological specifications for foods.
24
5. HEAVY METALS
Heavy metals in soil may be of natural occurrence or via fertilisers, sewage or manure application or even
atmospheric deposition. In recent years, contamination of soil has increased due to the application of bio-
solids and this can lead to uptake by the growing crops and transmission into the human food chain through
consumption of cereals and their products.
Regulatory levels
A draft EU regulation has proposed concentration limits of 0.2mg/kg for lead and cadmium in wheat and
lead in barley but only 0.1mg/kg for cadmium in barley.
Sampling protocols
EU Commission directive 2001/22/EC5.1 lays down sampling methods (and methods of analysis) for the
official control of levels of lead, cadmium, mercury and 3-MCPD in foodstuffs. It states that 3, 5 or 10
incremental samples should be taken from lots of <50kg, 50-500kg and > 500kg. It also mentions that
sampling should take place at the point where the commodity enters the food chain so it is clear, once again,
that the procedure is not directly applicable to cereals in storage or in transit.
Blending and sub-sampling
If the lot consists of individual packages, then the directive recommends that one incremental sample should
be taken where there are 1-25 packages or units in the lot and above this, about 5% should be taken. The
incremental samples should be bulked to form the aggregate sample which should be at least 1kg (unless
where not practical, e.g. where only one package has been sampled). It suggests laboratory samples should
be large enough for at least duplicate analysis. However, no guidance is given on how to produce the
laboratory sample.
Validation
Nothing found.
Discussion
This appears to be an area where there has been very little work and only one sampling protocol was found.
Heavy metals in grain depend on uptake by the growing crop. Therefore, one can reasonably assume
homogeneous distribution of heavy metals in stored grain in any one bulk since it will usually represent a
25
single variety grown in one or more fields that have been treated in a similar way. In some cases only
selected field may have been treated with bio-solids and here it is clearly of value to follow HGCA sampling
protocols5.2. to ensure crops from known fields are sorted into defined bins, or bays in a flat store. However,
a study to confirm the normal range of heavy metals in a bulk of stored grain and this may be required.
References
5.1 Anon., 2001. Commission directive 2001/22/EC of 8 March 2001 laying down the sampling methods and
methods of analysis for the official control of the levels of lead, cadmium, mercury and 3-MCPD in
foodstuffs. Official Journal of the European Communities L77/14 –21.
5.2 Home Grown Cereals Authority. 2003. Grain sampling – a farmer’s guide. 24 pp HGCA, London.
26
6. AGROCHEMICAL RESIDUES (INCLUDING STORAGE PESTICIDES)
The commonest encountered residues on cereal grains tend to be chlormequat and pirimiphos-methyl (Anon,
1999)6,1. The former is a plant growth regulator (gibberellin biosynthesis inhibitor) that shortens and
strengthens cereal stems, thus reducing ‘lodging’. The latter is an OP pesticide commonly applied in-store as
a fabric treatment or admixed directly onto the grain as an admixture protectant against infestation.
Diatomaceous earths (DEs) are beginning to be used as a replacement for OP dusts as a top-dressing for
stored grain and the recommended levels of application are similar to the levels permitted for their addition
as food additives.
Regulatory levels
The maximum residue levels (MRLs) are as follows:
5 ppm for pirimiphos-methyl, 2 ppm for chlormequat
These MRLs are laid down in UK statutory instruments 6.2, 6.3 and EU legislation 6.4.
Sampling protocols
The Codex Alimentarius6.5 suggests sampling procedures should follow ISO 950 recommendations and
includes a table suggesting only 1 primary sample is required from a well-mixed or homogeneous bulk and
that 3, 5 and 10 samples should be taken respectively from lots of < 50, 50-500 and > 500kg. It also suggests
that the minimum size of a laboratory sample should be 1kg.
The USFDA recommendations6.6 are that five to ten 0.9kg sub-samples making up a total sample size of 4.5-
9kg should be taken from lot sizes between 12 or less and over 190 (cases, crates, boxes etc).
Blending and sub-sampling
Nothing found.
Validation
Nothing found.
Discussion
Where an entire bulk has been admixed with a storage pesticide or where a bulk originates from a field
which has been treated before harvest with a pesticide, herbicide or other chemical agent, it is reasonable to
27
expect the distribution of such a chemical agent to be homogeneous. The ‘grain passport system’ whereby
paperwork indicating pesticide treatments accompanies loads of grain should also guard against multiple
treatments and uneven distribution. Therefore, in these circumstances the sample guidance highlighted here
may well be appropriate.
However, it is often suggested that treatment of the bin fabric may lead to local contamination of cereals
close to the bin wall (although mixing may occur during outloading and conveying). Similarly, top-dressing
of stored grain with OP dust formulations has become part of an integrated pest management regime based
on cooling and drying. While OP dusts are no longer available on the market, top-dressing still remains an
option e.g. by spraying with an emulsifiable concentrate as the last tonne goes into a silo or by raking in a
diatomaceous earth dust. (Although this may need a label amendment). Where fabric treatments or top-
dressing is used specific sampling regimes may be required. However, this is an area that does not appear to
have been addressed.
References
6.1Anon, 1999. Annual report of the working party on pesticide residues. Suppl. To Pesticides Monitor 1999.
MAFF, PSD, HSE.
6.2 Statutory Instrument No 1767. The Pesticides (Maximum Levels in Crops, Food and Feeding Stuffs)
(England and Wales) (Amendment) Regulations 2002 and The Pesticides (Maximum Levels in Crops, Food
and Feeding Stuffs) (Scotland) Amendment Regulations 2002 (Statutory Instrument No 271
6.3 Statutory Instrument No 2723. The Pesticides (Maximum Levels in Crops, Food and Feeding Stuffs)
(England and Wales) (Amendment)(No.2) Regulations 2002 and The Pesticides (Maximum Residue Levels
in Crops, Food and Feeding Stuffs) (Scotland) amendment (No. 2) Regulations 2002 (Statutory Instrument
No 489)
6.4 Informal coordination of MRLs established in directives 76/895/EEC, 86/362/EEC and 90/642/EEC
5058.VI/98: http://europa.eu.int/comm/food/fs/ph_ps/pest/09-99-2.pdf
6.5 Anon 2000. Recommended methods of sampling for the determination of pesticide residues for the
compliance with MRLs. Pesticide residues in food. Methods of analysis and sampling 2nd Ed. Codex
Alimentarrius 2A, 1, 21pp. Joint FAO / WHO food standards programme. Rome, Italy.
6.6 Anon, Chapter 4- Chart 3 pesticide samples. Investigations Operations manual USFDA Office of
regulatory affairs.
http://www.fda.gov.ora/inspect_ref/iom/exhibits/ch4chart_3.html
28
7. PESTS (INCLUDING MITES).
Insects and mites are of importance because of the direct damage they cause to grain. They are able to
transmit disease organisms including mycotoxigenic fungi, due to their allergenic properties and because of
their ability to increase rapidly under favourable conditions and to survive for long periods under
unfavourable conditions. However, being mobile, they present a different challenge to other contaminants
and sampling regimes need to take that into account and/or exploit their mobility. For this reason, there are
two sampling procedures usually applied to insects. Grain samples can be taken and sieved to remove the
arthropods, alternatively a variety of patented traps are available to sample over an extended period. As this
document is intended to investigate a common sampling procedure for all analytes, the trapping aspect will
only be lightly touched on here. An added complication concerns ‘hidden infestations’ of the non-mobile
stages of species such as the grain weevil, Sitophilus granarius (L.) that complete their development inside
the grain. Clearly these will not be detected by traps since they are not mobile and samples will need to be
incubated to allow them to complete their development to adult. Alternatively, a rapid detection method such
as egg-plug staining, x-ray or acoustic detection can be employed.
Regulatory levels
In the UK and most of Europe as well as Australia, there is no tolerance of live insects in trade. However, in
the USA, the permitted threshold is 2 insects/kg. Thresholds for mites vary and informal limits for many
petfoods are below 10/kg and for Intervention, below 250/kg.
Sampling protocols
The UK SOP for the phytosanitary certification of grain for export7.1 requires that 3kg of grain be taken from
each lorry from at least 3 dispersed points and from different depths (unless an automatic core sampler is
used). Whilst loading from silo/store to ship, 4kg of grain must be collected every 10 minutes from the grain
stream.
ISO 6639/27.2 deals with sampling for determination of hidden insect infestation. For grain flowing at rates
of up to 100t/h, sampled lots should be 1–5t with increments of 1kg/t from a point there the grain is in free-
fall. (This is because samples from conveyer belts are deemed less representative than those taken from
points of free fall).
For sampling from static bulks, it notes insects are sought only in regions where they most commonly occur,
which is near the surface, outlet spouts and ventilation and aeration openings and at shallow depths of 2-3m
(for weevils). When the air temperature is above 15°C, surface layers 100 mm deep are sampled taking an
29
increment of 1 kg for every tonne of surface grain using a hand scoop and when the air temperature is below
15°C, a layer 250mm deep is sampled. In the former case, the number of increments is calculated by
multiplying the bulk density by the surface area and dividing by 1,000 and in the latter case the division
factor is by 400. It is also suggested that increments of 1kg be taken from the bottom of the bin by running
grain from the outlet. For sampling beneath the surface, it merely states that increments of 1kg should be
taken ‘at regular intervals’. This is clearly an example of ‘focused sampling’ – aimed at detection rather than
determination.
Guidance on the detection of live invertebrate infestation by trapping is given in draft ISO 60027.3. However,
this does not define trap spacing in the context of bulk grain, merely recommending probe traps be placed in
pairs; in the top 10-30cm of grain and at 200cm depth. This contrasts with manufacturers’ recommendations
for pitfall cone traps which recommend pairs be used at the surface and at 8-15cm in a 5-6m grid.
Blending and sub-sampling
ISO 6639/27.2 states that unless increments are submitted as laboratory samples, they should be combined
and mixed and reduced as suggested by ISO 950 to provide a laboratory sample of no less than 1kg.
Validation
Wilkin (1991)7.4 showed that even a sampling rate of 4kg /20t, four times the industry (ISO) norm there was
only a 50% chance of detecting insect with a single sample even with 5 insects/kg. In this case, the insects
were evenly distributed while in practice, this is only sometimes the case, so even these estimates are likely
to be optimistic.
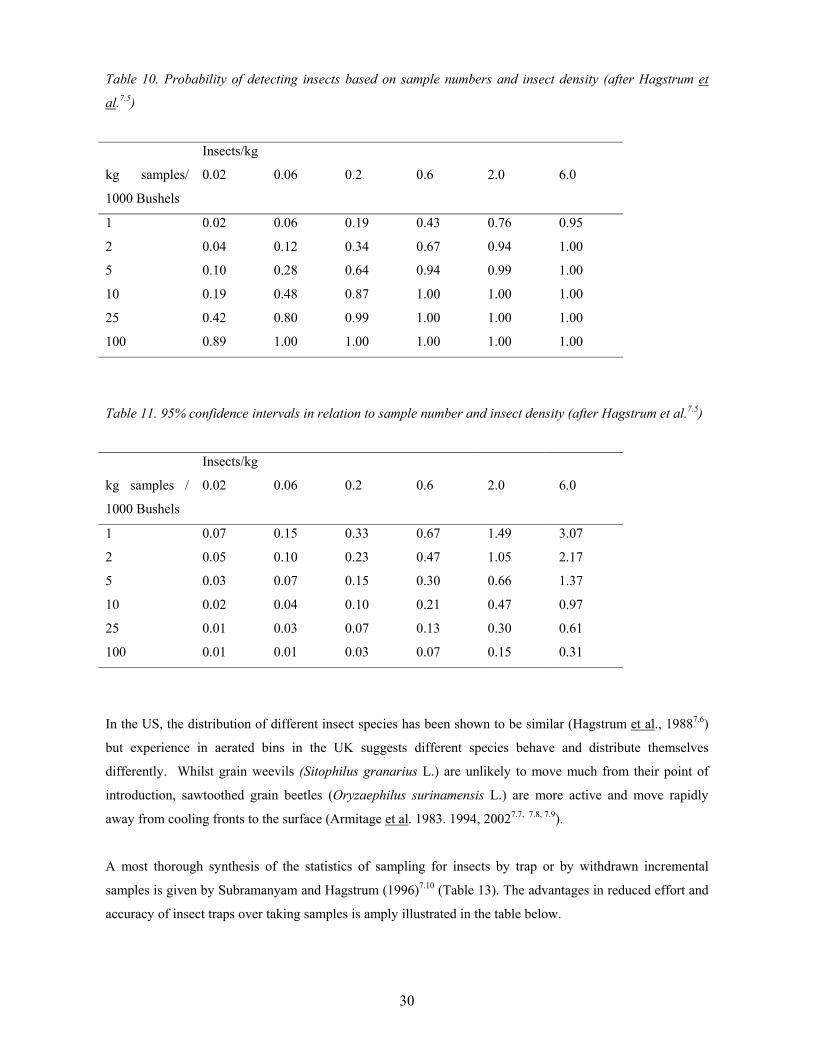
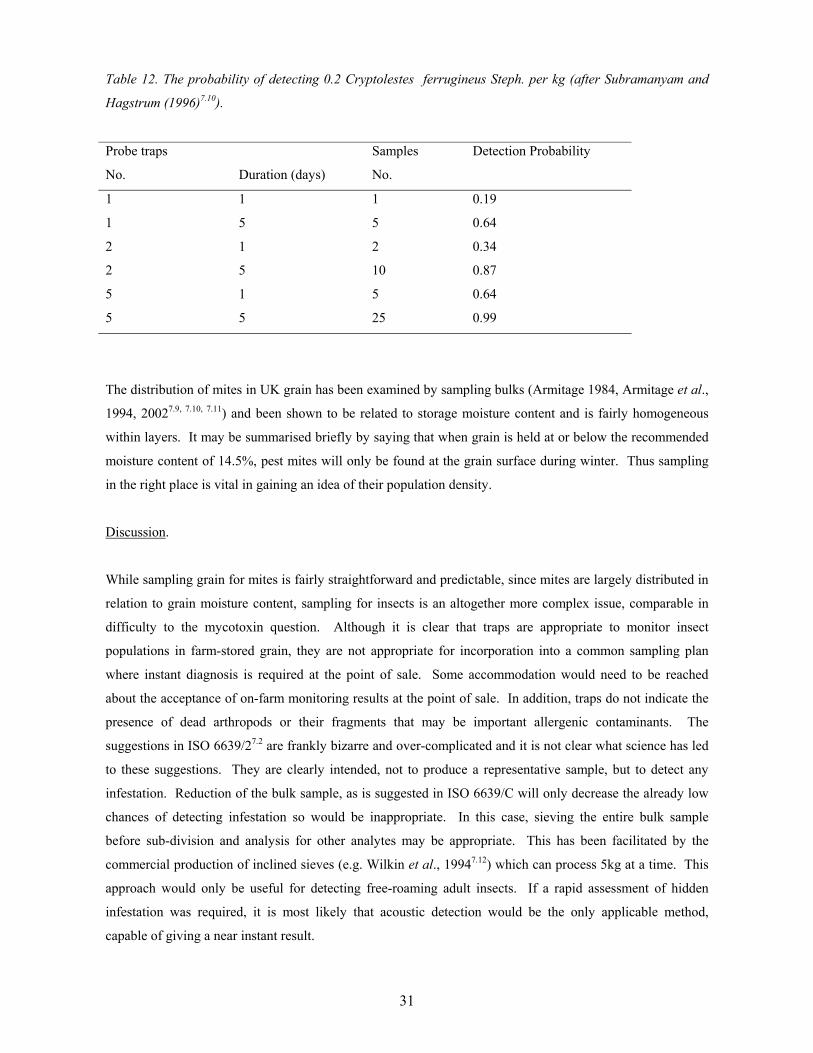
Hagstrum et al. (no date)7.5 give tables to show the probability (at 95% level) of catching insects at different
densities, in relation to the number of 1kg samples taken per 1000 bushels (ca 29t wheat) (Table 10). In the
same publication they also give the number of samples needed to estimate populations to an accuracy of +/-
the value of the mean (Table 11).
30
Table 10. Probability of detecting insects based on sample numbers and insect density (after Hagstrum et
al.7.5)
Insects/kg
kg samples/
1000 Bushels
0.02 0.06 0.2 0.6 2.0 6.0
1 0.02 0.06 0.19 0.43 0.76 0.95
2 0.04 0.12 0.34 0.67 0.94 1.00
5 0.10 0.28 0.64 0.94 0.99 1.00
10 0.19 0.48 0.87 1.00 1.00 1.00
25 0.42 0.80 0.99 1.00 1.00 1.00
100 0.89 1.00 1.00 1.00 1.00 1.00
Table 11. 95% confidence intervals in relation to sample number and insect density (after Hagstrum et al.7.5)
Insects/kg
kg samples /
1000 Bushels
0.02 0.06 0.2 0.6 2.0 6.0
1 0.07 0.15 0.33 0.67 1.49 3.07
2 0.05 0.10 0.23 0.47 1.05 2.17
5 0.03 0.07 0.15 0.30 0.66 1.37
10 0.02 0.04 0.10 0.21 0.47 0.97
25 0.01 0.03 0.07 0.13 0.30 0.61
100 0.01 0.01 0.03 0.07 0.15 0.31
In the US, the distribution of different insect species has been shown to be similar (Hagstrum et al., 19887.6)
but experience in aerated bins in the UK suggests different species behave and distribute themselves
differently. Whilst grain weevils (Sitophilus granarius L.) are unlikely to move much from their point of
introduction, sawtoothed grain beetles (Oryzaephilus surinamensis L.) are more active and move rapidly
away from cooling fronts to the surface (Armitage et al. 1983. 1994, 20027.7, 7.8, 7.9).
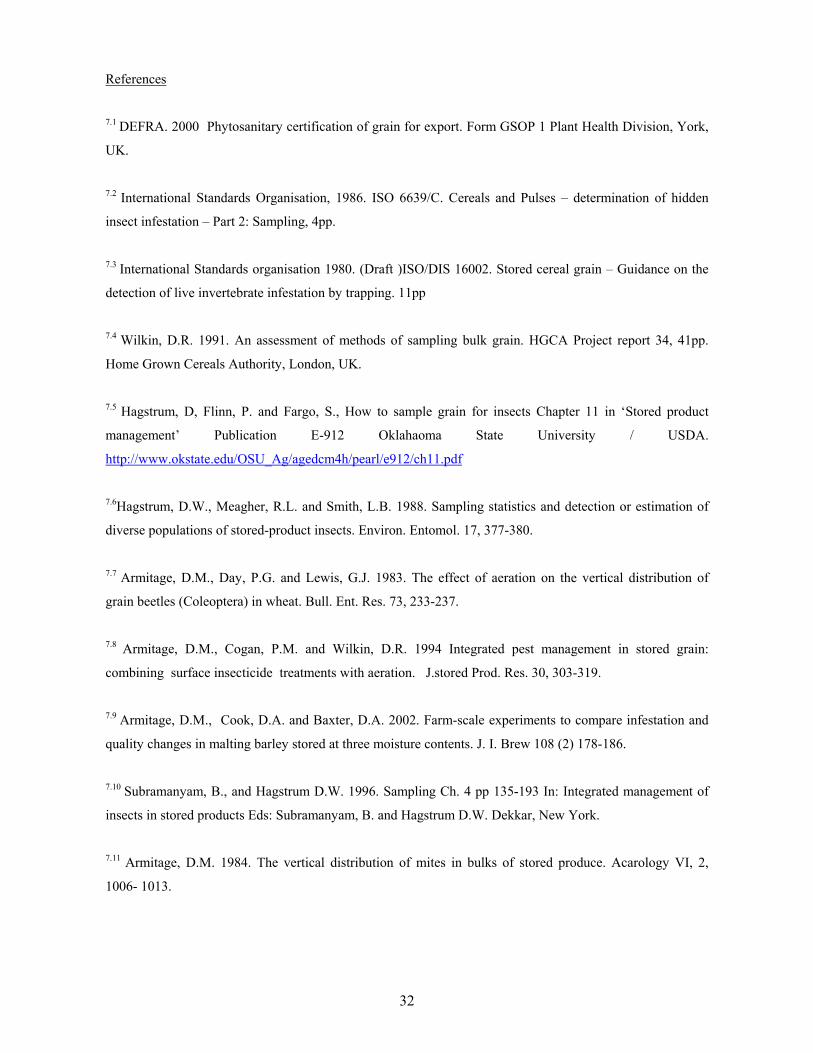
A most thorough synthesis of the statistics of sampling for insects by trap or by withdrawn incremental
samples is given by Subramanyam and Hagstrum (1996)7.10 (Table 13). The advantages in reduced effort and
accuracy of insect traps over taking samples is amply illustrated in the table below.
31
Table 12. The probability of detecting 0.2 Cryptolestes ferrugineus Steph. per kg (after Subramanyam and
Hagstrum (1996)7.10).
Probe traps
No.
Duration (days)
Samples
No.
Detection Probability
1 1 1 0.19
1 5 5 0.64
2 1 2 0.34
2 5 10 0.87
5 1 5 0.64
5 5 25 0.99
The distribution of mites in UK grain has been examined by sampling bulks (Armitage 1984, Armitage et al.,
1994, 20027.9, 7.10, 7.11) and been shown to be related to storage moisture content and is fairly homogeneous
within layers. It may be summarised briefly by saying that when grain is held at or below the recommended
moisture content of 14.5%, pest mites will only be found at the grain surface during winter. Thus sampling
in the right place is vital in gaining an idea of their population density.
Discussion.
While sampling grain for mites is fairly straightforward and predictable, since mites are largely distributed in
relation to grain moisture content, sampling for insects is an altogether more complex issue, comparable in
difficulty to the mycotoxin question. Although it is clear that traps are appropriate to monitor insect
populations in farm-stored grain, they are not appropriate for incorporation into a common sampling plan
where instant diagnosis is required at the point of sale. Some accommodation would need to be reached
about the acceptance of on-farm monitoring results at the point of sale. In addition, traps do not indicate the
presence of dead arthropods or their fragments that may be important allergenic contaminants. The
suggestions in ISO 6639/27.2 are frankly bizarre and over-complicated and it is not clear what science has led
to these suggestions. They are clearly intended, not to produce a representative sample, but to detect any
infestation. Reduction of the bulk sample, as is suggested in ISO 6639/C will only decrease the already low
chances of detecting infestation so would be inappropriate. In this case, sieving the entire bulk sample
before sub-division and analysis for other analytes may be appropriate. This has been facilitated by the
commercial production of inclined sieves (e.g. Wilkin et al., 19947.12) which can process 5kg at a time. This
approach would only be useful for detecting free-roaming adult insects. If a rapid assessment of hidden
infestation was required, it is most likely that acoustic detection would be the only applicable method,
capable of giving a near instant result.
32
References
7.1 DEFRA. 2000 Phytosanitary certification of grain for export. Form GSOP 1 Plant Health Division, York,
UK.
7.2 International Standards Organisation, 1986. ISO 6639/C. Cereals and Pulses – determination of hidden
insect infestation – Part 2: Sampling, 4pp.
7.3 International Standards organisation 1980. (Draft )ISO/DIS 16002. Stored cereal grain – Guidance on the
detection of live invertebrate infestation by trapping. 11pp
7.4 Wilkin, D.R. 1991. An assessment of methods of sampling bulk grain. HGCA Project report 34, 41pp.
Home Grown Cereals Authority, London, UK.
7.5 Hagstrum, D, Flinn, P. and Fargo, S., How to sample grain for insects Chapter 11 in ‘Stored product
management’ Publication E-912 Oklahaoma State University / USDA.
http://www.okstate.edu/OSU_Ag/agedcm4h/pearl/e912/ch11.pdf
7.6Hagstrum, D.W., Meagher, R.L. and Smith, L.B. 1988. Sampling statistics and detection or estimation of
diverse populations of stored-product insects. Environ. Entomol. 17, 377-380.
7.7 Armitage, D.M., Day, P.G. and Lewis, G.J. 1983. The effect of aeration on the vertical distribution of
grain beetles (Coleoptera) in wheat. Bull. Ent. Res. 73, 233-237.
7.8 Armitage, D.M., Cogan, P.M. and Wilkin, D.R. 1994 Integrated pest management in stored grain:
combining surface insecticide treatments with aeration. J.stored Prod. Res. 30, 303-319.
7.9 Armitage, D.M., Cook, D.A. and Baxter, D.A. 2002. Farm-scale experiments to compare infestation and
quality changes in malting barley stored at three moisture contents. J. I. Brew 108 (2) 178-186.
7.10 Subramanyam, B., and Hagstrum D.W. 1996. Sampling Ch. 4 pp 135-193 In: Integrated management of
insects in stored products Eds: Subramanyam, B. and Hagstrum D.W. Dekkar, New York.
7.11 Armitage, D.M. 1984. The vertical distribution of mites in bulks of stored produce. Acarology VI, 2,
1006- 1013.
33
7.12 Wilkin, D.R., Catchpole, D and Catchpole, S. 1994. The detection of insects in grain during transit. – an
assessment of the problem and the development of a practical solution. Proc. 6th. Int. Working Conf. Stored-
Prod. Prot. 1, 463-469.
34
OVERVIEW AND RECOMMENDATIONS
UK industry would benefit from a single validated sampling protocol for all the analytes discussed, which
would ensure representative results from analysed laboratory samples. However, it is clear that the
distribution of each analyte is different; some are heterogeneous, others homogeneous and others unknown
or the opinion thereof held by different authorities is contradictory. In addition this report shows the purpose
of sampling to vary. Some samples are taken for detection (GMO, Salmonella, insects) while in most cases
the aim is for determination to gain a representative sample that predicts average quality.
Not all analytes have formal sampling protocols and even where protocols exist, these have rarely been
validated by experiment. The number of samples required by sampling protocol varies by analyte and there
is little consistency in defining size of samples and in expressing the sampling frequency in a consistent way
(e.g. number and size of samples per unit of bulk) or even using SI units (see Table 13).
Specific recommendations for heavy metal sampling, for GM and for pesticide residues are ISO-based and
although as yet unvalidated may prove to be largely appropriate. However, it is clear that sampling for the
very heterogeneous biological analytes, e.g. arthropods and fungi and their metabolites, mycotoxins require
more detailed protocols and sampling regimes.
One approach to a ‘one size fits all’ solution, would be to adopt the most rigorous regulatory sampling
requirement, which is undoubtedly that for storage mycotoxins, and divide the resulting bulk sample to
provide the necessary laboratory samples for other analytes. (In the case of insects, there would be
considerable advantage in examining the entire bulked sample, for instance by passing it over an inclined
sieve).
However, before such an approach is adopted, it would be highly desirable to simplify the statutory sampling
plan for storage mycotoxins which has the potential of considerable extra costs for industry. Design of such
a plan would depend on a greater understanding of mycotoxin formation during drying or storage of damp
grain, than currently exists. Anecdotal information received from ‘Euromalt’ suggests so far that only the
EU regulatory sampling for mycotoxins reliably detects the regulatory mycotoxin level but there is a definite
need to find a simplified sampling regime that is substantially equivalent to the regulatory procedure and
thus demonstrate ‘due diligence’.
Another approach would be to adopt the ISO standard for those analytes that are likely to be homogeneous -
pesticides, heavy metals, GMOs, mites, microbial contamination. Sampling for OA could be carried out at a
lesser frequency to demonstrate due diligence. Should surveys by FSA, DEFRA etc. show the inadequacies
of this approach, a greater frequency of OA sampling would be required.
35
HGCA sampling recommendations are to take a sample from 1kg from each trailer (or 1kg/t from driers) and
make a composite sample to represent every 50t. This does not specify a rate of sampling per tonne since a
trailer can be anything up to 20t. This has been shown to be adequate for determining market quality but
needs to be validated to see if it is also suitable for determination of homogeneously distributed analytes such
as pesticides, or heavy metals or to see if it can be adapted for heterogeneous analytes such as mycotoxins.
However, adopting any of these approaches would first require experimental validation and testing of the
applicability to practice by sampling from farm and commercial stores. The first approach would require
estimation of the size of sub-sample to be taken for each analyte.
Finally, the pattern of mixing of grain during unloading of bins or floor stores has considerable influence on
the distribution of analytes and ultimately therefore upon the sampling regime. For instance, during the
unloading of hopper-bottom bins, the grain empties as a column above the bin centre and grain from the
surface is some of the earliest to be discharged. In view of the importance of the grain surface as a primary
source of some contaminants such as mycotoxins and arthropods, due to the fluctuating moisture contents
there, it is easy to see that by failing to sample this, earliest discharging grain, one might also miss the prime
source of these contaminants. Equally, this pattern of discharge suggests only limited mixing of the surface
grain might occur. Since this factor has such an important effect on the assumed and actual distribution of
analytes, it requires its own experimental study.
ACKNOWLEDGEMENTS
This report was compiled with the guidance of several CSL experts in their fields; Christine Henry and
James Blackburn (GMOs), Susan MacDonald (Mycotoxins), John Chambers (insects and mites) and Stuart
Reynolds (Pesticides). Thanks are also due to Ken Wildey and Simon Hook, HGCA for helpful discussions.
36
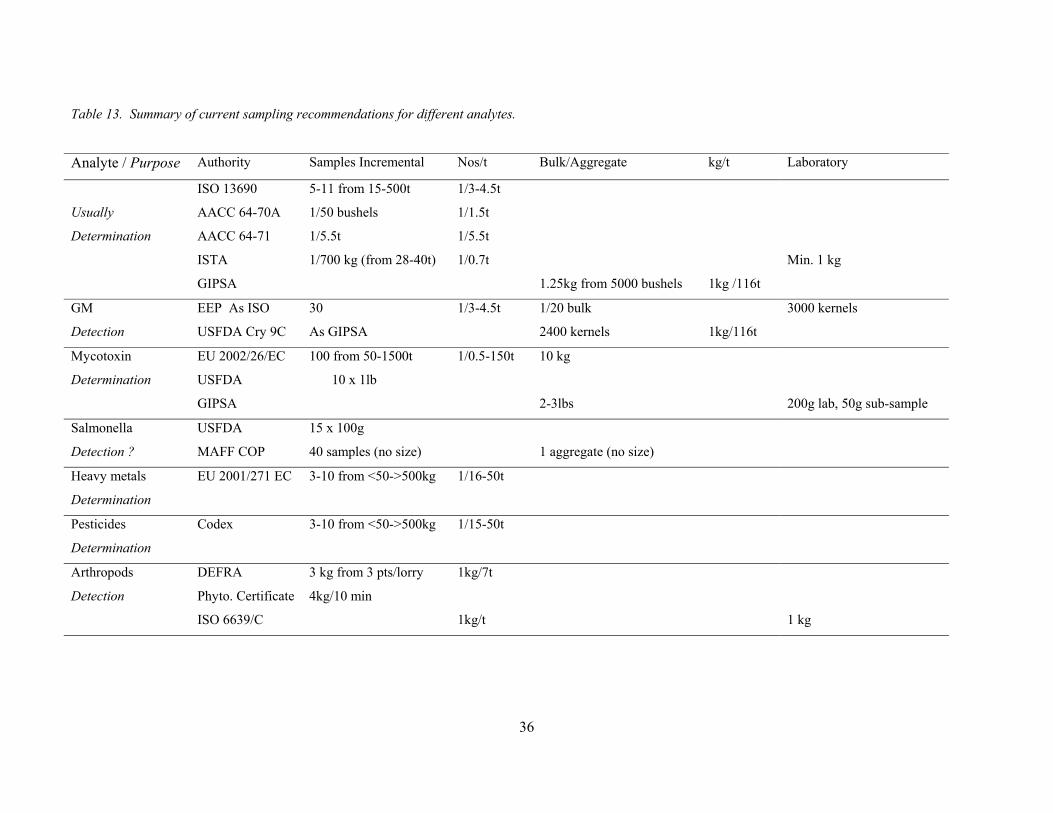
Table 13. Summary of current sampling recommendations for different analytes.
Analyte / Purpose Authority Samples Incremental Nos/t Bulk/Aggregate kg/t Laboratory
Usually
Determination
ISO 13690
AACC 64-70A
AACC 64-71
ISTA
GIPSA
5-11 from 15-500t
1/50 bushels
1/5.5t
1/700 kg (from 28-40t)
1/3-4.5t
1/1.5t
1/5.5t
1/0.7t
1.25kg from 5000 bushels
1kg /116t
Min. 1 kg
GM
Detection
EEP As ISO
USFDA Cry 9C
30
As GIPSA
1/3-4.5t 1/20 bulk
2400 kernels
1kg/116t
3000 kernels
Mycotoxin
Determination
EU 2002/26/EC
USFDA
GIPSA
100 from 50-1500t
10 x 1lb
1/0.5-150t 10 kg
2-3lbs
200g lab, 50g sub-sample
Salmonella
Detection ?
USFDA
MAFF COP
15 x 100g
40 samples (no size)
1 aggregate (no size)
Heavy metals
Determination
EU 2001/271 EC 3-10 from <50->500kg 1/16-50t
Pesticides
Determination
Codex 3-10 from <50->500kg 1/15-50t
Arthropods
Detection
DEFRA
Phyto. Certificate
ISO 6639/C
3 kg from 3 pts/lorry
4kg/10 min
1kg/7t
1kg/t
1 kg