Grain Milling Industryindustry.eeaa.gov.eg/publications/Grain.pdf · The self-monitoring manual for...
76
Transcript of Grain Milling Industryindustry.eeaa.gov.eg/publications/Grain.pdf · The self-monitoring manual for...
Grain Milling Industry
Self-Monitoring Manual
Table of Contents
1. Introduction 5 1.1 Preface 6 1.1.1 Project Objectives 6 1.1.2 Organization of the Manual 6 1.2 Introduction to the Grain Milling Industry 7 1.2.1 Egyptian SIC Code for the Grain Milling Industry 7 1.2.2 Industry Size Distribution 7
2. Description of Industry 8 2.1 Raw Materials, products and Utilities 8 2.2 Processing Lines 8 2.2.1 Dry Cleaning Using Cylinder or Disc Millers 8 2.2.2 Wet Cleaning Using Cylinder or Disc Millers 13 2.2.3 Wet Cleaning Using Stone Millers 15 2.3 Service Units 17 2.3.1 Laboratories 17 2.3.2 Workshops and Garage 17 2.3.3 Storage Facilities 17 2.3.4 Wastewater Treatment Plants 17 2.3.5 Solid Waste Processing and Handling 18 2.3.6 Restaurant, Washrooms and Housing Complex 18 2.4 Emissions, Effluents and Solid Wastes 20 2.4.1 Air Emissions 20 2.4.2 Effluents 22 2.4.3 Solid Wastes 22 2.4.4 Noise 22 2.5 Characteristics of the Milling Industry 23
3. Environmental and Health Impacts of Pollutants 24
3.1 Impacts of Air Emissions 24 3.2 Impacts of Effluents 24 3.3 Environmental Impact of Solid Wastes 24 3.4 Health Impact of Noise 24
4. Egyptian Laws and Regulations 25 4.1 Concerning Air Emissions 25 4.2 Concerning Effluents 25 4.3 Concerning Solid Wastes 27 4.4 Concerning Work Environment 27
4.5 Concerning Hazardous Materials and Wastes 28 4.6 Concerning the Environmental Register 28
5. Pollution Abatement Measures 29
5.1 Air Pollution 29 5.2 Water Pollution Abatement Measures 30 5.3 Abatement Measures for Solid Wastes Pollution 30
6. Environmental self-monitoring 31 6.1 Benefits of SM 31
2
6.2 Scope and objectives of SM 31 6.3 Self-monitoring and Environmental Management Systems (EMS) 32 6.3.1 Environmental Management Systems (EMS) 32 6.3.2 Link between self-monitoring and (EMS) 34 6.3.3 SM link to pollution prevention and cleaner production 36 6.4 Regulatory aspects 38 6.4.1 SM and environmental register 38 6.4.2. SM and inspection 38
7. Planning of SM 40 7.1 Assessment of existing monitoring capacity 42 7.2 Identification of key parameters 42 7.3 General data required 43 7.4 Data collection, manipulation and reporting 43 7.5 Criteria for selecting monitoring method 44 7.5.1 Direct or indirect measurement 44 7.5.2 Mass balance 46 7.5.3 Emission factor 47 7.5.4 Engineering calculations 47
8. Monitoring of raw materials, utilities and products 48 8.1 Raw materials and chemicals 48 8.2 Utilities 48 8.3 Products 49
9. Operation control 50 9.1 Monitoring process parameters 50 9.2 Planned maintenance 53
10. Environmental monitoring 55 10.1 Emission to air 55 10.2 Effluents (wastewater) 56 10.3 Monitoring of solid waste 60
11. Data collection, processing and usage 61 11.1 Data collection and processing 61 11.2 Using SM outputs 61 11.2.1 Techniques for summarizing and illustrating data 61 11.2.2 Environmental register 63 11.2.3 Reporting 63 11. 2.4 Internal auditing and conclusions on results 63 11.2.5 Feedback and decision making 63 11.2.6 Using outputs in public relations 64
Annex A Data collection and processing 65 Annex B Register for environmental conditions 69 Annex C References 76
3
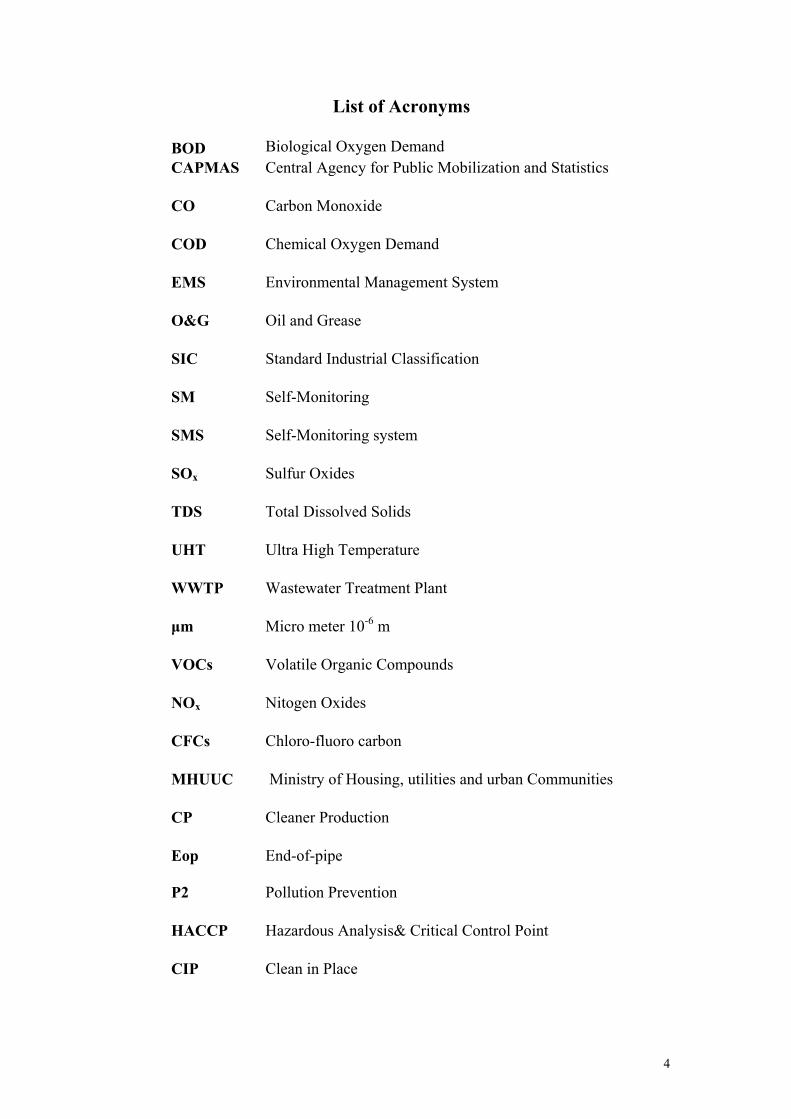
List of Acronyms
BOD Biological Oxygen DemandCAPMAS Central Agency for Public Mobilization and Statistics
CO Carbon Monoxide
COD Chemical Oxygen Demand
EMS Environmental Management System
O&G Oil and Grease
SIC Standard Industrial Classification
SM Self-Monitoring
SMS Self-Monitoring system
SOx Sulfur Oxides
TDS Total Dissolved Solids
UHT Ultra High Temperature
WWTP Wastewater Treatment Plant
µm Micro meter 10-6 m
VOCs Volatile Organic Compounds
NOx Nitogen Oxides
CFCs Chloro-fluoro carbon
MHUUC Ministry of Housing, utilities and urban Communities
CP Cleaner Production
Eop End-of-pipe
P2 Pollution Prevention
HACCP Hazardous Analysis& Critical Control Point
CIP Clean in Place
4
1. INTRODUCTION
The Egyptian Pollution Abatement Project (EPAP) sponsored by EEAA has assigned Finish and Egyptian consultants for the task of developing Sector specific inspection and monitoring guidelines. This task is based on a previous collaboration between FINIDA and EPAP that resulted in the development of four Inspection Guidelines: • Fundamentals and Background Manual that provides basic information
about air pollution, wastewater characteristics, solid waste, hazardous materials and wastes and work environment. • Guidelines for Inspectorate Management that discusses the strategy,
objectives and tasks of the inspectorate management. • Guidelines for Team Leaders that identifies the team leader
responsibilities and tasks. • Guidelines for Inspectors that presents a methodology for performing all
types of inspection. Tasks during the various phases of planning, performing field inspection, report preparation and follow-up are discussed. Several checklists are included.
The three guidelines were later summarized into one that will be referred to as The General Inspection Manual GIM (EPAP, 2002), which was developed, covering aspects common to all industrial sectors. On the other hand, EPAP realized the need to introduce the concept of self-monitoring, as it provides useful information to the plant’s management on the production efficiency as well as the environmental status. Self-monitoring should cover, as a minimum, the monitoring of the releases to the environment including emissions to air, wastewater, solid waste and hazardous waste. A comprehensive self-monitoring plan may cover process parameters that would affect the environmental impacts. Such plan would assist the management to identify sources of waste, prevent pollution at the source, reduce emissions, and achieve economic benefits. Therefore, a Self-Monitoring Guidebook was also developed to present the industrial community, the consultants, and government officials with the general principles and both managerial and technical aspects to be followed for self-monitoring. The textile industry was chosen as a case study for implementing and testing the manual and a self-monitoring manual for this industry was developed.
5
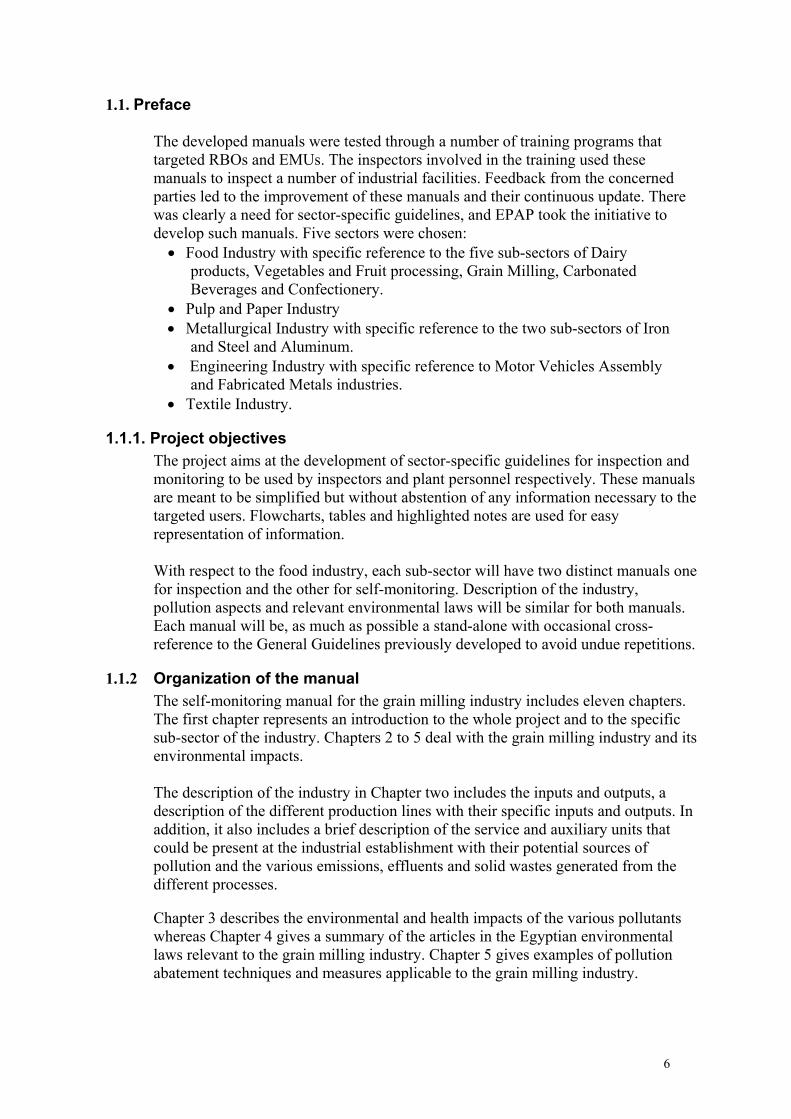
1.1. Preface
The developed manuals were tested through a number of training programs that targeted RBOs and EMUs. The inspectors involved in the training used these manuals to inspect a number of industrial facilities. Feedback from the concerned parties led to the improvement of these manuals and their continuous update. There was clearly a need for sector-specific guidelines, and EPAP took the initiative to develop such manuals. Five sectors were chosen: • Food Industry with specific reference to the five sub-sectors of Dairy
products, Vegetables and Fruit processing, Grain Milling, Carbonated Beverages and Confectionery.
• Pulp and Paper Industry • Metallurgical Industry with specific reference to the two sub-sectors of Iron
and Steel and Aluminum. • Engineering Industry with specific reference to Motor Vehicles Assembly
and Fabricated Metals industries. • Textile Industry.
1.1.1. Project objectives The project aims at the development of sector-specific guidelines for inspection and monitoring to be used by inspectors and plant personnel respectively. These manuals are meant to be simplified but without abstention of any information necessary to the targeted users. Flowcharts, tables and highlighted notes are used for easy representation of information.
With respect to the food industry, each sub-sector will have two distinct manuals one for inspection and the other for self-monitoring. Description of the industry, pollution aspects and relevant environmental laws will be similar for both manuals. Each manual will be, as much as possible a stand-alone with occasional cross-reference to the General Guidelines previously developed to avoid undue repetitions.
1.1.2 Organization of the manual The self-monitoring manual for the grain milling industry includes eleven chapters. The first chapter represents an introduction to the whole project and to the specific sub-sector of the industry. Chapters 2 to 5 deal with the grain milling industry and its environmental impacts.
The description of the industry in Chapter two includes the inputs and outputs, a description of the different production lines with their specific inputs and outputs. In addition, it also includes a brief description of the service and auxiliary units that could be present at the industrial establishment with their potential sources of pollution and the various emissions, effluents and solid wastes generated from the different processes.
Chapter 3 describes the environmental and health impacts of the various pollutants whereas Chapter 4 gives a summary of the articles in the Egyptian environmental laws relevant to the grain milling industry. Chapter 5 gives examples of pollution abatement techniques and measures applicable to the grain milling industry.
6
The information and steps needed to establish of a self-monitoring system are detailed in chapter 6-11 inclusive. A reasonably detailed introduction to the definition, objectives, benefits of self-monitoring are presented in Chapter 6, in addition to the link between self-monitoring and each of environmental management system and cleaner production. Chapter 7 deals with the aspects of planning of self-monitoring. Monitoring of raw materials is discussed in Chapter 8, while operation control aspects are discussed in Chapter 9. Environmental monitoring is described in Chapter 10. Chapter 11 is dealing with data collection, data processing and data usage. It is worth mentioning that there will be a frequent need of referring to other sources of information in order to plan, implement, and operate an effective and sustainable self-monitoring system. Therefore, references pertinent to subject matter will be mentioned. In addition, need may arise, in some instances where plant personnel are advised to call for external consultation in order to establish a proper, effective, and sustainable self-monitoring system.
1.2 Introduction to the Grain Milling Industry. Grain milling is a large industry in Egypt. This industry produces:
• Wheat flour, bran and semolina. • Corn flour and corn meal
Grain is the only raw material used in this industry. The major processes in this industry are performed continuously and are not subject to seasonal variation. Air pollution is a major environmental problem and wastewater characteristics can be violating the relevant laws for certain processes.
1.2.1 Egyptian SIC Code for the Grain Milling Industry The Standard Industrial Classification (SIC) code for the food industry is 15. There is no sub-sector specific to grain milling. The sub-sector code 153 includes grain milling, starch and animal fodder.
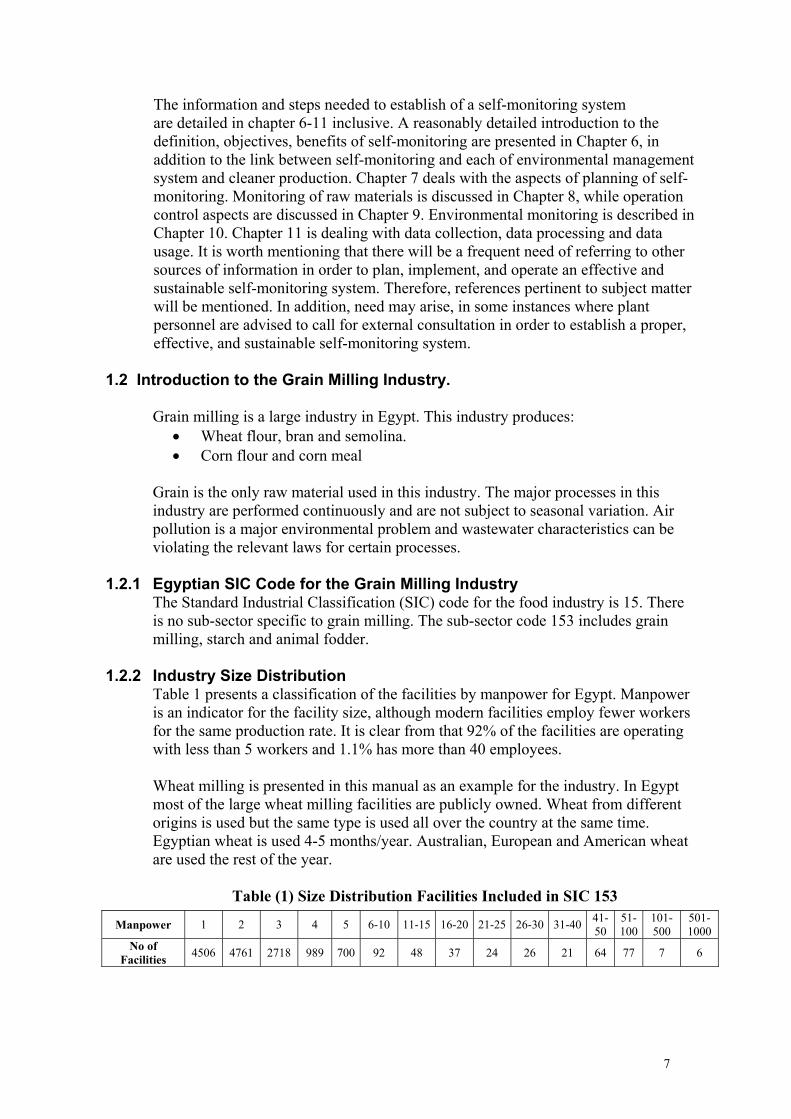
1.2.2 Industry Size Distribution
Table 1 presents a classification of the facilities by manpower for Egypt. Manpower is an indicator for the facility size, although modern facilities employ fewer workers for the same production rate. It is clear from that 92% of the facilities are operating with less than 5 workers and 1.1% has more than 40 employees. Wheat milling is presented in this manual as an example for the industry. In Egypt most of the large wheat milling facilities are publicly owned. Wheat from different origins is used but the same type is used all over the country at the same time. Egyptian wheat is used 4-5 months/year. Australian, European and American wheat are used the rest of the year.
Table (1) Size Distribution Facilities Included in SIC 153
Manpower 1 2 3 4 5 6-10 11-15 16-20 21-25 26-30 31-40 41-50
51-100
101-500
501-1000
No of Facilities 4506 4761 2718 989 700 92 48 37 24 26 21 64 77 7 6
7
2. DESCRIPTION OF THE INDUSTRY
The milling plants are characterized by unit operations that involve changes to the physical properties of the grains through cleaning and size reduction. The production process in these plants can be divided into three general processing lines: 1. Dry cleaning using cylinder or disc millers. 2. Wet cleaning using cylinder or disc millers. 3. Wet cleaning using stone millers. The products from each process are usually the same. The main differences between these lines are the use of different techniques in cleaning and milling processes. Stone milling is an older wet technology that is still applied in many facilities. All the lines process wheat through 4 stages: • Grain testing, receiving and storage. • Grain cleaning and preparation. • Grain milling and sieving. • Product packaging.
2.1 Raw Materials, products and Utilities.
Wheat is the only raw material used in this industry. Flour is the main product and bran and semolina are by-products. Each kilogram of wheat produces 72-82 % of flour, 10-13.5 % of fine bran, 9-14 % of coarse bran and 0.5-1 % semolina. Water is used in cleaning (wet process), tempering and conditioning processes. It may be supplied from public water lines, wells or canal water. The type of water will dictate the type of pretreatment. Chemicals such as alcohols are used in the lab for quality control and analysis but in small amounts. Detergents are used for cleaning purposes. Lube oil is used in the garage and workshops. The larger milling facilities have their own pumping stations for gas oil (solar) used as fuel for their trucks. Different types of packaging materials are used (textile or plastic bags). Large facilities can also include a housing complex generating domestic wastewater. Note: Defining the inputs and outputs helps predict the expected pollutants.
2.2 Processing Lines
Table 2 presents the different processing lines and service units that can be present in a facility. Note: Knowledge of the processes involved allows the prediction of pollution hazards and expected violations and helps determine possibilities for implementing cleaner technology.
8
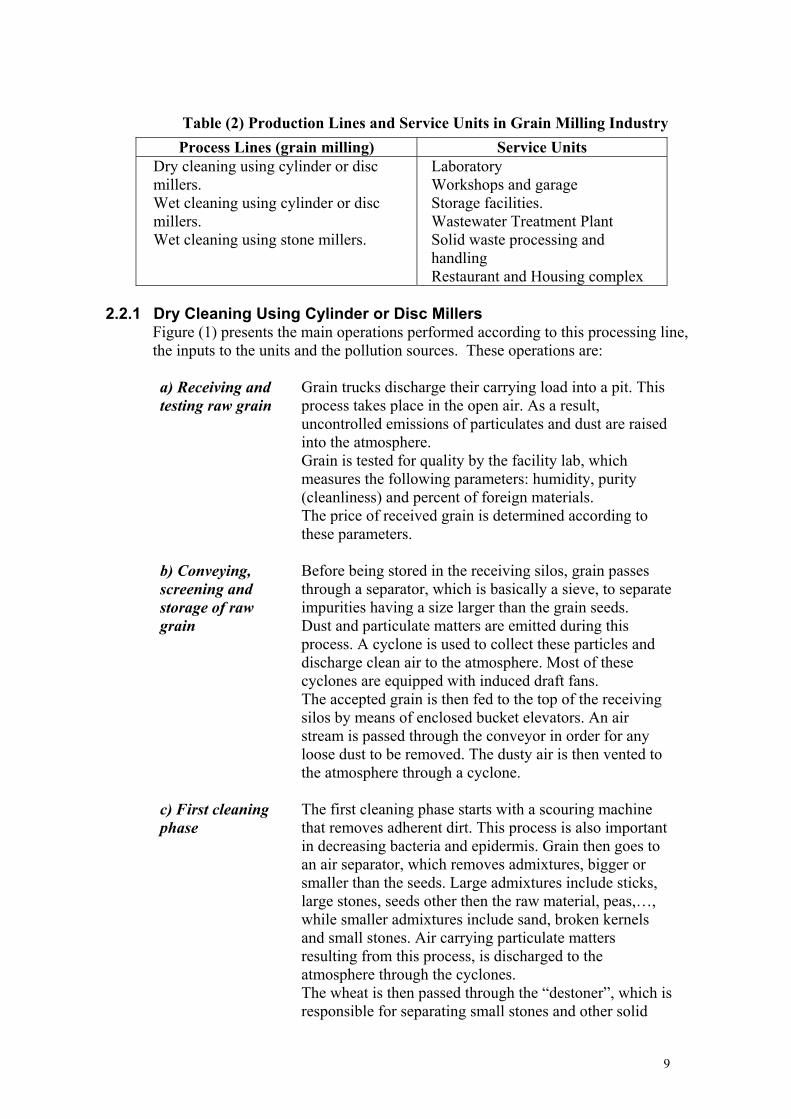
Table (2) Production Lines and Service Units in Grain Milling Industry Process Lines (grain milling) Service Units
Dry cleaning using cylinder or disc millers. Wet cleaning using cylinder or disc millers. Wet cleaning using stone millers.
Laboratory Workshops and garage Storage facilities. Wastewater Treatment Plant Solid waste processing and handling Restaurant and Housing complex
2.2.1 Dry Cleaning Using Cylinder or Disc Millers
Figure (1) presents the main operations performed according to this processing line, the inputs to the units and the pollution sources. These operations are:
a) Receiving and testing raw grain
Grain trucks discharge their carrying load into a pit. This process takes place in the open air. As a result, uncontrolled emissions of particulates and dust are raised into the atmosphere. Grain is tested for quality by the facility lab, which measures the following parameters: humidity, purity (cleanliness) and percent of foreign materials. The price of received grain is determined according to these parameters.
b) Conveying, screening and storage of raw grain
Before being stored in the receiving silos, grain passes through a separator, which is basically a sieve, to separate impurities having a size larger than the grain seeds. Dust and particulate matters are emitted during this process. A cyclone is used to collect these particles and discharge clean air to the atmosphere. Most of these cyclones are equipped with induced draft fans. The accepted grain is then fed to the top of the receiving silos by means of enclosed bucket elevators. An air stream is passed through the conveyor in order for any loose dust to be removed. The dusty air is then vented to the atmosphere through a cyclone.
c) First cleaning phase
The first cleaning phase starts with a scouring machine that removes adherent dirt. This process is also important in decreasing bacteria and epidermis. Grain then goes to an air separator, which removes admixtures, bigger or smaller than the seeds. Large admixtures include sticks, large stones, seeds other then the raw material, peas,…, while smaller admixtures include sand, broken kernels and small stones. Air carrying particulate matters resulting from this process, is discharged to the atmosphere through the cyclones. The wheat is then passed through the “destoner”, which is responsible for separating small stones and other solid
9
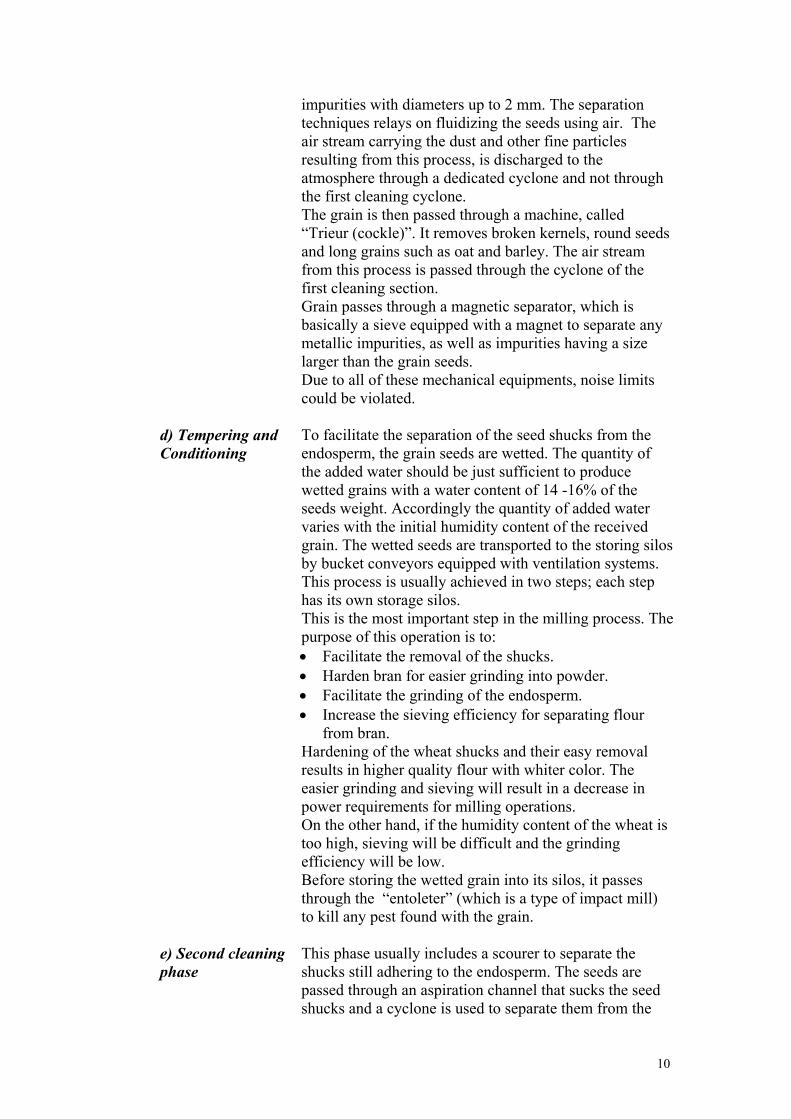
impurities with diameters up to 2 mm. The separation techniques relays on fluidizing the seeds using air. The air stream carrying the dust and other fine particles resulting from this process, is discharged to the atmosphere through a dedicated cyclone and not through the first cleaning cyclone. The grain is then passed through a machine, called “Trieur (cockle)”. It removes broken kernels, round seeds and long grains such as oat and barley. The air stream from this process is passed through the cyclone of the first cleaning section. Grain passes through a magnetic separator, which is basically a sieve equipped with a magnet to separate any metallic impurities, as well as impurities having a size larger than the grain seeds. Due to all of these mechanical equipments, noise limits could be violated.
d) Tempering and Conditioning
To facilitate the separation of the seed shucks from the endosperm, the grain seeds are wetted. The quantity of the added water should be just sufficient to produce wetted grains with a water content of 14 -16% of the seeds weight. Accordingly the quantity of added water varies with the initial humidity content of the received grain. The wetted seeds are transported to the storing silos by bucket conveyors equipped with ventilation systems. This process is usually achieved in two steps; each step has its own storage silos. This is the most important step in the milling process. The purpose of this operation is to: • Facilitate the removal of the shucks. • Harden bran for easier grinding into powder. • Facilitate the grinding of the endosperm. • Increase the sieving efficiency for separating flour
from bran. Hardening of the wheat shucks and their easy removal results in higher quality flour with whiter color. The easier grinding and sieving will result in a decrease in power requirements for milling operations. On the other hand, if the humidity content of the wheat is too high, sieving will be difficult and the grinding efficiency will be low. Before storing the wetted grain into its silos, it passes through the “entoleter” (which is a type of impact mill) to kill any pest found with the grain.
e) Second cleaning phase
This phase usually includes a scourer to separate the shucks still adhering to the endosperm. The seeds are passed through an aspiration channel that sucks the seed shucks and a cyclone is used to separate them from the
10
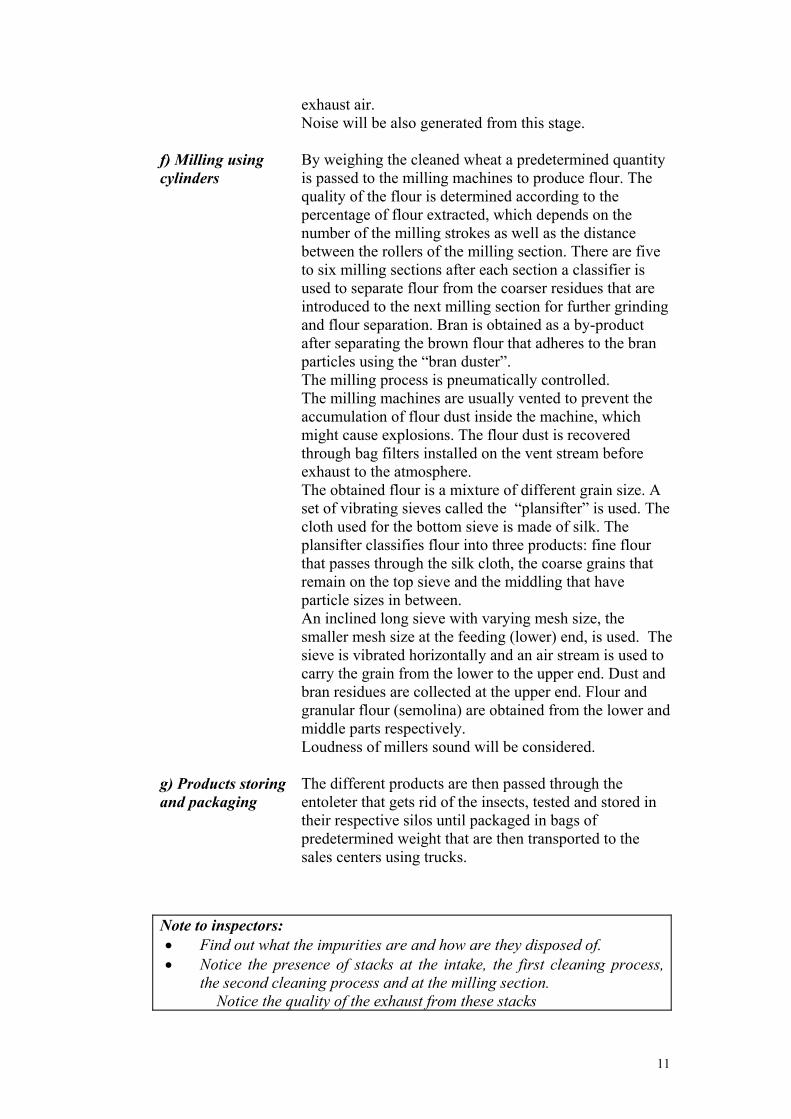
exhaust air. Noise will be also generated from this stage.
f) Milling using cylinders
By weighing the cleaned wheat a predetermined quantity is passed to the milling machines to produce flour. The quality of the flour is determined according to the percentage of flour extracted, which depends on the number of the milling strokes as well as the distance between the rollers of the milling section. There are five to six milling sections after each section a classifier is used to separate flour from the coarser residues that are introduced to the next milling section for further grinding and flour separation. Bran is obtained as a by-product after separating the brown flour that adheres to the bran particles using the “bran duster”. The milling process is pneumatically controlled. The milling machines are usually vented to prevent the accumulation of flour dust inside the machine, which might cause explosions. The flour dust is recovered through bag filters installed on the vent stream before exhaust to the atmosphere. The obtained flour is a mixture of different grain size. A set of vibrating sieves called the “plansifter” is used. The cloth used for the bottom sieve is made of silk. The plansifter classifies flour into three products: fine flour that passes through the silk cloth, the coarse grains that remain on the top sieve and the middling that have particle sizes in between. An inclined long sieve with varying mesh size, the smaller mesh size at the feeding (lower) end, is used. The sieve is vibrated horizontally and an air stream is used to carry the grain from the lower to the upper end. Dust and bran residues are collected at the upper end. Flour and granular flour (semolina) are obtained from the lower and middle parts respectively. Loudness of millers sound will be considered.
g) Products storing and packaging
The different products are then passed through the entoleter that gets rid of the insects, tested and stored in their respective silos until packaged in bags of predetermined weight that are then transported to the sales centers using trucks.
Note to inspectors: • Find out what the impurities are and how are they disposed of. • Notice the presence of stacks at the intake, the first cleaning process,
the second cleaning process and at the milling section. Notice the quality of the exhaust from these stacks
11
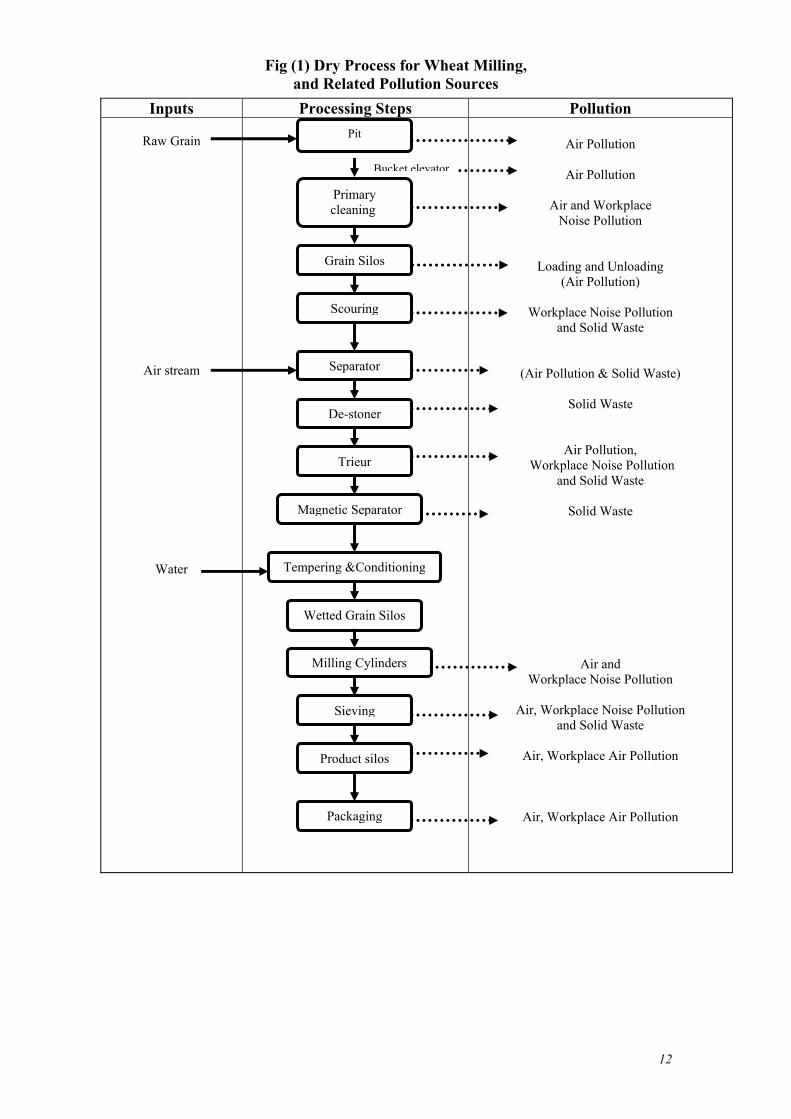
Fig (1) Dry Process for Wheat Milling, and Related Pollution Sources
Inputs Processing Steps Pollution
Raw Grain
Air stream
Water
Air Pollution
Air Pollution
Air and Workplace
Noise Pollution
Loading and Unloading
(Air Pollution)
Workplace Noise Pollution and Solid Waste
(Air Pollution & Solid Waste)
Solid Waste
Air Pollution, Workplace Noise Pollution
and Solid Waste
Solid Waste
Air and Workplace Noise Pollution
Air, Workplace Noise Pollution
and Solid Waste
Air, Workplace Air Pollution
Air, Workplace Air Pollution
c
Pit
Bucket elevator
Primary leaning
Grain Silos
Scouring
Separator
De-stoner
Trieur
Magnetic Separator
Tempering &Conditioning
Wetted Grain Silos
Milling Cylinders
Sieving
Product silos
Packaging
12
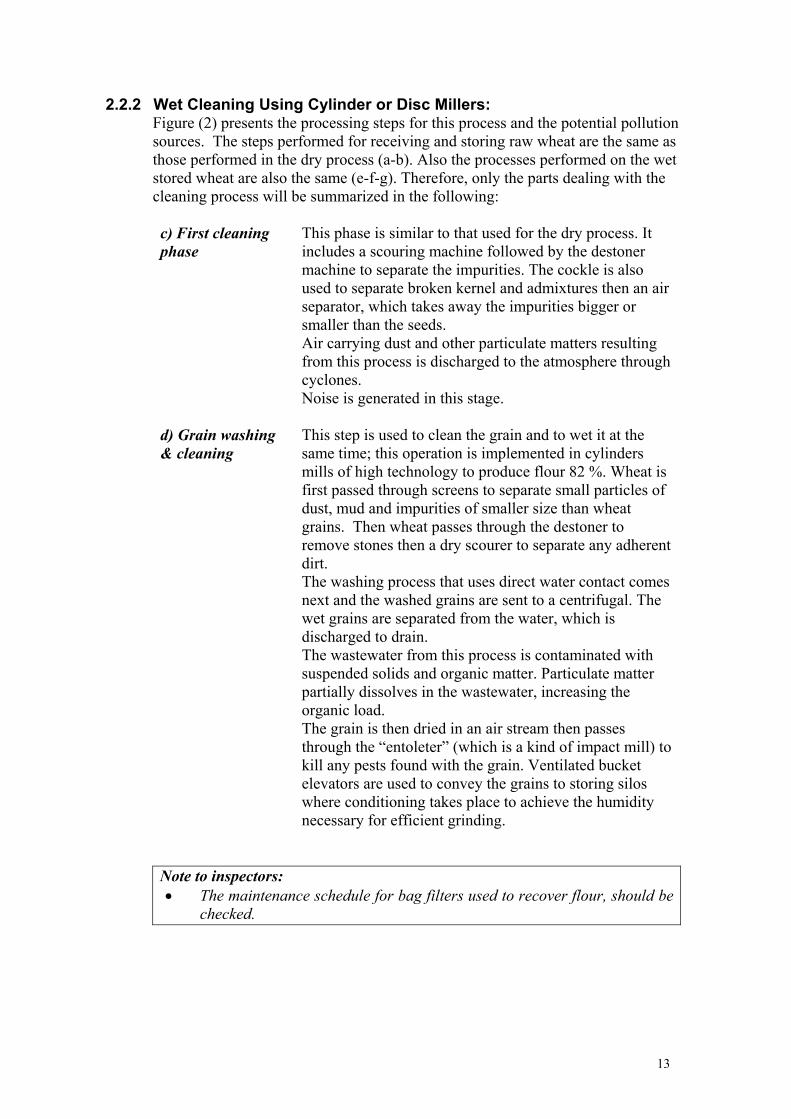
2.2.2 Wet Cleaning Using Cylinder or Disc Millers: Figure (2) presents the processing steps for this process and the potential pollution sources. The steps performed for receiving and storing raw wheat are the same as those performed in the dry process (a-b). Also the processes performed on the wet stored wheat are also the same (e-f-g). Therefore, only the parts dealing with the cleaning process will be summarized in the following:
c) First cleaning phase
This phase is similar to that used for the dry process. It includes a scouring machine followed by the destoner machine to separate the impurities. The cockle is also used to separate broken kernel and admixtures then an air separator, which takes away the impurities bigger or smaller than the seeds. Air carrying dust and other particulate matters resulting from this process is discharged to the atmosphere through cyclones. Noise is generated in this stage.
d) Grain washing & cleaning
This step is used to clean the grain and to wet it at the same time; this operation is implemented in cylinders mills of high technology to produce flour 82 %. Wheat is first passed through screens to separate small particles of dust, mud and impurities of smaller size than wheat grains. Then wheat passes through the destoner to remove stones then a dry scourer to separate any adherent dirt. The washing process that uses direct water contact comes next and the washed grains are sent to a centrifugal. The wet grains are separated from the water, which is discharged to drain. The wastewater from this process is contaminated with suspended solids and organic matter. Particulate matter partially dissolves in the wastewater, increasing the organic load. The grain is then dried in an air stream then passes through the “entoleter” (which is a kind of impact mill) to kill any pests found with the grain. Ventilated bucket elevators are used to convey the grains to storing silos where conditioning takes place to achieve the humidity necessary for efficient grinding.
Note to inspectors: • The maintenance schedule for bag filters used to recover flour, should be
checked.
13
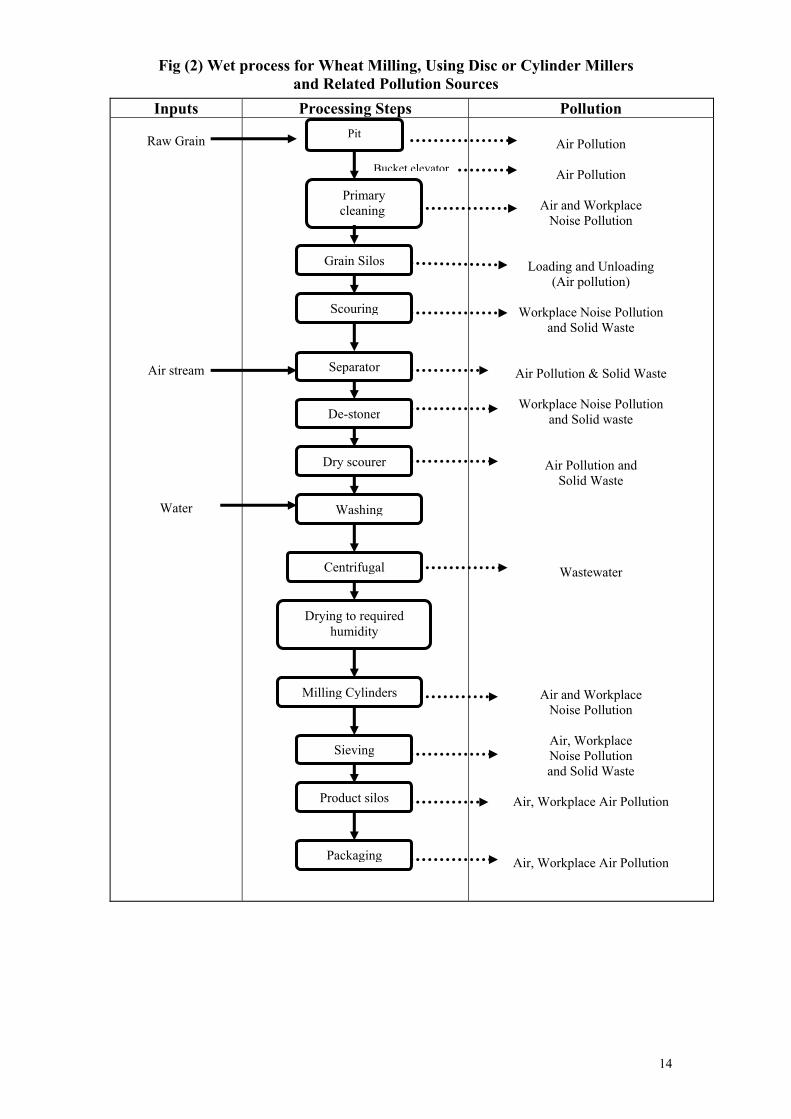
Fig (2) Wet process for Wheat Milling, Using Disc or Cylinder Millers and Related Pollution Sources
Inputs Processing Steps Pollution
Raw Grain
Air stream
Water
Air Pollution
Air Pollution
Air and Workplace
Noise Pollution
Loading and Unloading
(Air pollution)
Workplace Noise Pollution and Solid Waste
Air Pollution & Solid Waste
Workplace Noise Pollution and Solid waste
Air Pollution and Solid Waste
Wastewater
Air and Workplace
Noise Pollution
Air, Workplace Noise Pollution and Solid Waste
Air, Workplace Air Pollution
Air, Workplace Air Pollution
14
Pit
Bucket elevator
Primary cleaning
Grain Silos
Scouring
Separator
De-stoner
Dry scourer
Washing
Centrifugal
Drying to required humidity
Milling Cylinders
Sieving
Product silos
Packaging
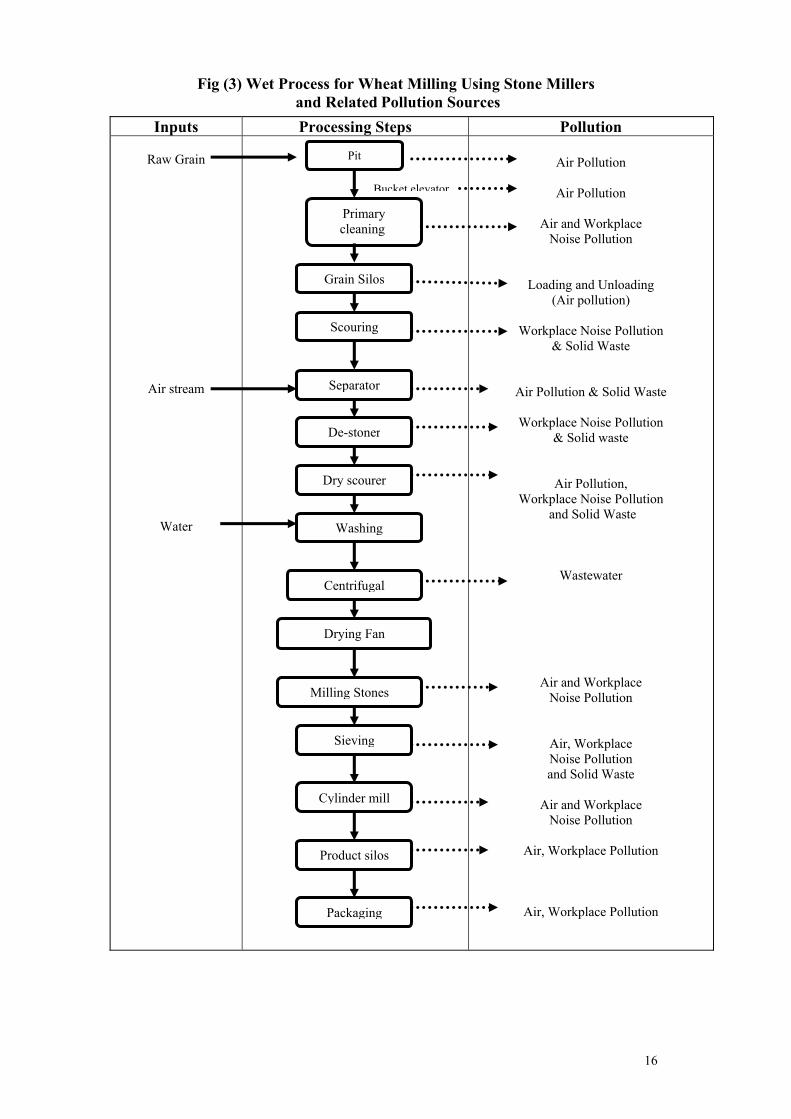
2.2.3 Wet Cleaning Using Stone Millers: Figure (3) presents the processing steps for this process line, related raw materials and potential pollution sources. The steps are almost the same as for the wet cleaning process using cylinder or disc millers. However, the technology is older and consequently the pollution load is higher than for the other two processes. Less sophisticated equipment are used in these facilities. Steps a and b for receiving and storing raw wheat are the same as well as the final packaging step. Depending on the size and the level of modernization, facilities can be lacking some of the processes.
c) First grain cleaning
The grain from silos passes through screens and scourer to separate impurities and foreign materials. The aspiration channel separates wheat shucks from the grains. Dust and other particulate matters resulted from this process are discharged to the atmosphere through the cyclones. Noise is also generated here.
d) Grain washing & cleaning
This step is used to clean the grain and to wet it at the same time. The washing process takes place with direct water contact. Sieves are used to separate the washed grain from water. The wastewater from this process is contaminated with suspended solids and organic matter. Particulate matter in the air partially dissolves in the wastewater, increasing the organic load. The wetted seeds are transported using a bucket conveyor to storing silos.
e) Second washing process
The grain from wetted grain silos undergoes a second washing process before being fed to the stone millers.
f) Milling using stone millers
By weighing the cleaned wetted grain a predetermined quantity is passed to the milling stones. Theses millers include two large hard stones made of carborandum or quartz. Feed enters the mill through a center hole in one of the stones. It is distributed between the stone faces and ground while working its way to the periphery. A type of hammer mill is then used to obtain finer grains. The product is passed through silk sieves to separate flour. The coarse grains are recycled to a cylinder mill. Further sieving separates bran from flour. Stone millers will generate noise.
Note: • Check if an air vent is passed through the bucket elevators at the receiving station . • Check the presence of a stack and cyclone at the intake. • Larger amounts of wastewater will be generated as compared to the wet cleaning using cylinder or disc millers.
15
16
Fig (3) Wet Process for Wheat Milling Using Stone Millers
and Related Pollution Sources Inputs Processing Steps Pollution
Raw Grain
Air stream
Water
Air Pollution
Air Pollution
Air and Workplace
Noise Pollution
Loading and Unloading
(Air pollution)
Workplace Noise Pollution & Solid Waste
Air Pollution & Solid Waste
Workplace Noise Pollution & Solid waste
Air Pollution, Workplace Noise Pollution
and Solid Waste
Wastewater
Air and Workplace Noise Pollution
Air, Workplace Noise Pollution and Solid Waste
Air and Workplace
Noise Pollution
Air, Workplace Pollution
Air, Workplace Pollution
Cylinder mill
Bucket elevator
Packaging
Product silos
Sieving
Milling Stones
Drying Fan
Centrifugal
Washing
Dry scourer
De-stoner
Separator
Scouring
Grain Silos
Primary cleaning
Pit
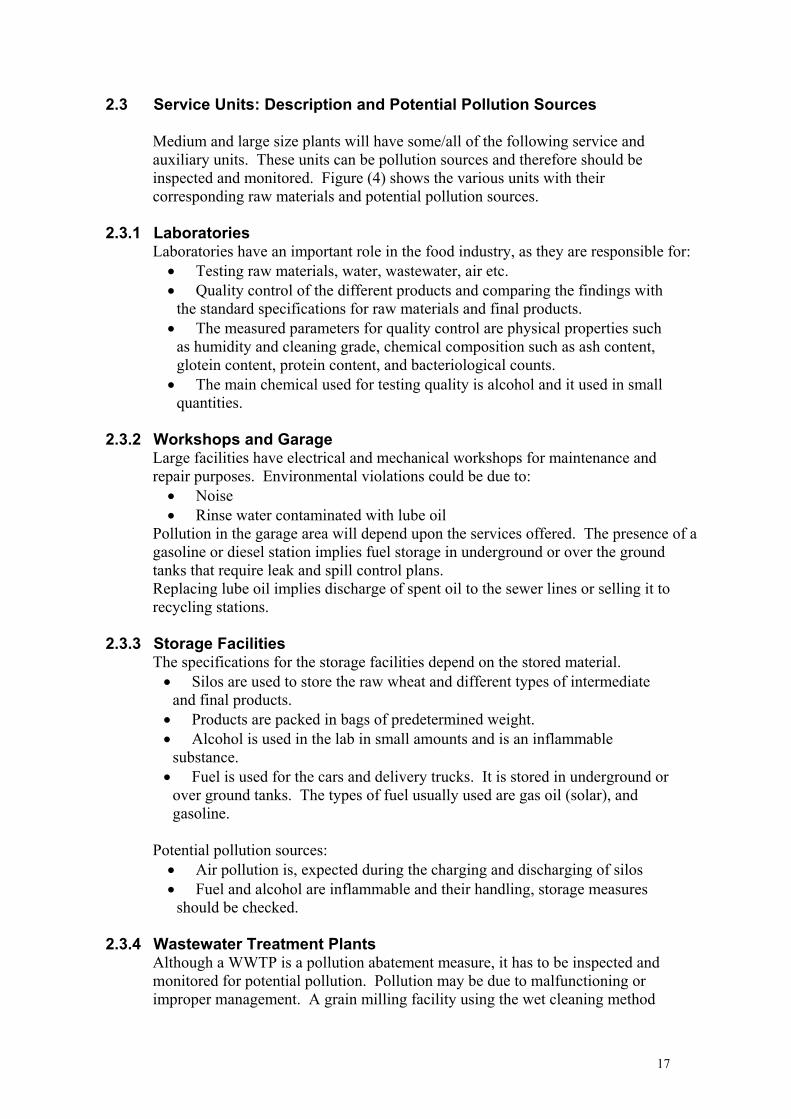
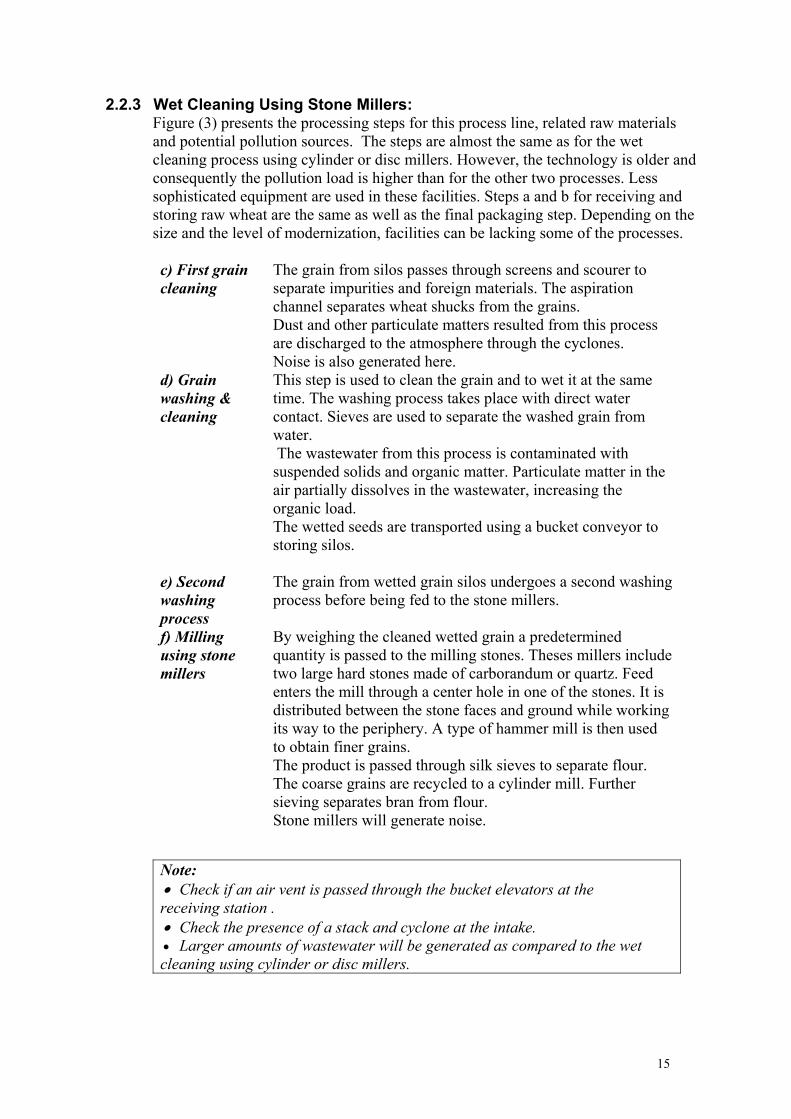
2.3 Service Units: Description and Potential Pollution Sources
Medium and large size plants will have some/all of the following service and auxiliary units. These units can be pollution sources and therefore should be inspected and monitored. Figure (4) shows the various units with their corresponding raw materials and potential pollution sources.
2.3.1 Laboratories
Laboratories have an important role in the food industry, as they are responsible for: • Testing raw materials, water, wastewater, air etc. • Quality control of the different products and comparing the findings with
the standard specifications for raw materials and final products. • The measured parameters for quality control are physical properties such
as humidity and cleaning grade, chemical composition such as ash content, glotein content, protein content, and bacteriological counts. • The main chemical used for testing quality is alcohol and it used in small
quantities.
2.3.2 Workshops and Garage Large facilities have electrical and mechanical workshops for maintenance and repair purposes. Environmental violations could be due to: • Noise • Rinse water contaminated with lube oil
Pollution in the garage area will depend upon the services offered. The presence of a gasoline or diesel station implies fuel storage in underground or over the ground tanks that require leak and spill control plans. Replacing lube oil implies discharge of spent oil to the sewer lines or selling it to recycling stations.
2.3.3 Storage Facilities
The specifications for the storage facilities depend on the stored material. • Silos are used to store the raw wheat and different types of intermediate
and final products. • Products are packed in bags of predetermined weight. • Alcohol is used in the lab in small amounts and is an inflammable
substance. • Fuel is used for the cars and delivery trucks. It is stored in underground or
over ground tanks. The types of fuel usually used are gas oil (solar), and gasoline.
Potential pollution sources: • Air pollution is, expected during the charging and discharging of silos • Fuel and alcohol are inflammable and their handling, storage measures
should be checked.
2.3.4 Wastewater Treatment Plants Although a WWTP is a pollution abatement measure, it has to be inspected and monitored for potential pollution. Pollution may be due to malfunctioning or improper management. A grain milling facility using the wet cleaning method
17
discharges wastewater, which is high in organic load, and total suspended solids. From time to time peak load will be discharged. The potential pollution sources are: • Sludge which represents a solid waste problem • Treated water could represent a water pollution problem if not complying
with relevant environment laws. 2.3.5 Solid Waste Processing and Handling
Many of the larger facilities have a pneumatic collection system that collects solid wastes from the different cyclones and feeds it to a crusher than to crushed waste silos. This operation can give rise to air emissions.
2.3.6 Restaurants, Washrooms and Housing Complex
The units will generate domestic wastewater as well as domestic solid waste (garbage).
18
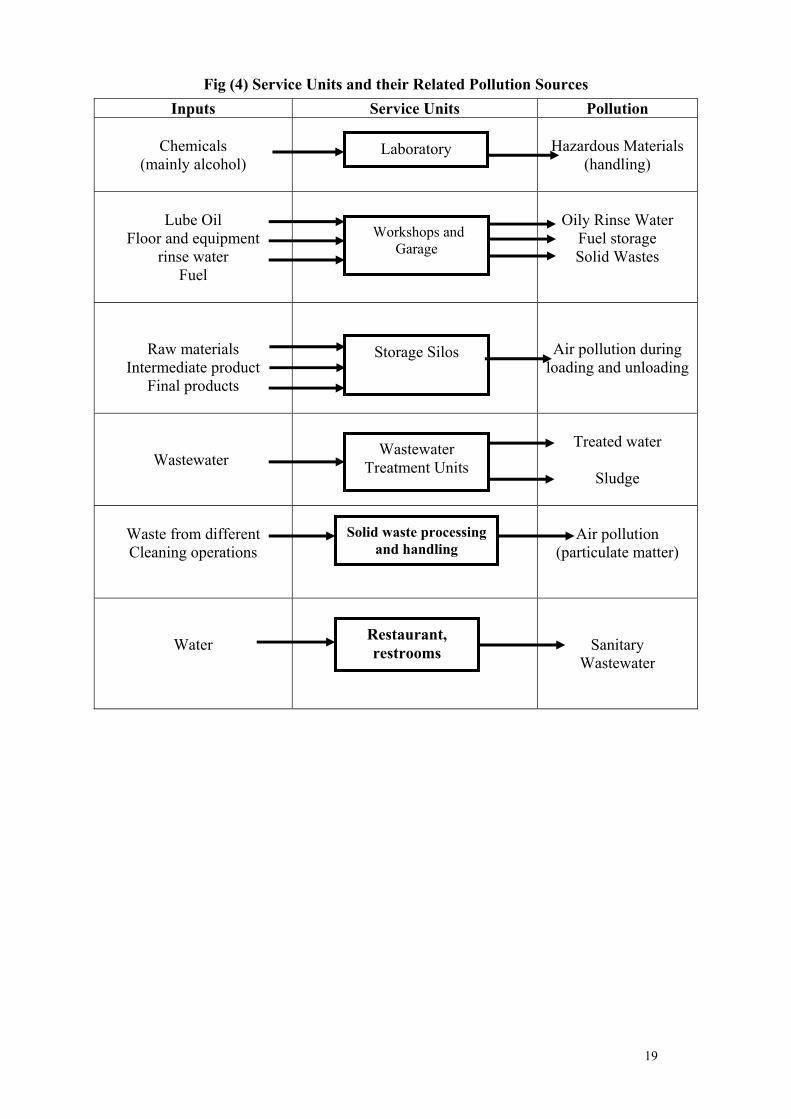
Fig (4) Service Units and their Related Pollution Sources Inputs Service Units Pollution
Chemicals
(mainly alcohol)
Hazardous Materials
(handling)
Lube Oil
Floor and equipment rinse water
Fuel
Oily Rinse Water
Fuel storage Solid Wastes
Raw materials Intermediate product
Final products
Air pollution during loading and unloading
Wastewater
Treated water
Sludge
Waste from different Cleaning operations
Air pollution
(particulate matter)
Water
Sanitary Wastewater
Laboratory
Workshops and Garage
Storage Silos
Wastewater Treatment Units
Solid waste processing and handling
Restaurant, restrooms
19
2.4 Emissions, Effluents and Solid Wastes Table (3) summarizes the major polluting processes, their outputs and the violating parameters.
2.4.1 Air Emissions
The milling industry generates dust and fine particles (flour, bran impurities) that cause air pollution. The expected violating parameter is the total suspended particulate matters, (PM10). The major pollution load results from various sources: • Emissions due to unloading in the pit and the malfunctioning of the
cyclone at intake • Defective enclosure of the bucket elevators and other conveying devices. • The various sets of sieves throughout the operation. • The inefficiency of the cyclones at the first cleaning and second cleaning
phases. • The inefficiency of the cyclone at milling section will generate flour
particles. • Pneumatic handling and collection of the solid waste from the various
cleaning operations.
20
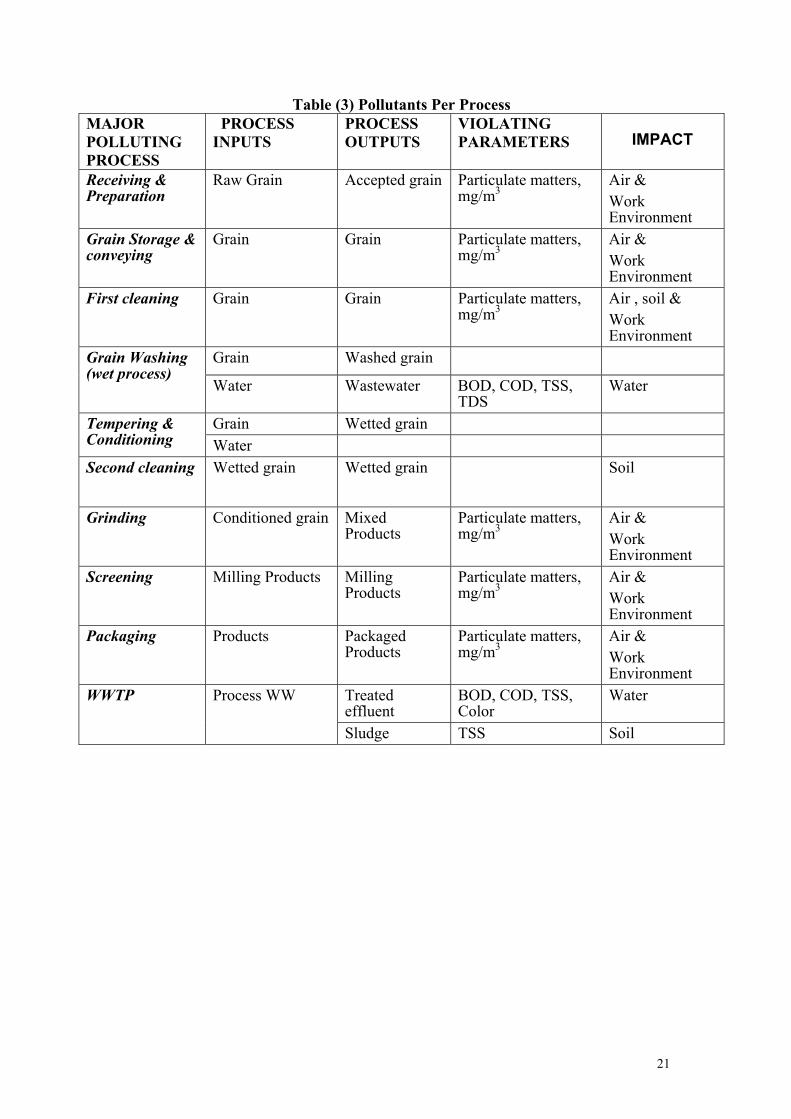
Table (3) Pollutants Per Process MAJOR POLLUTING PROCESS
PROCESS INPUTS
PROCESS OUTPUTS
VIOLATING PARAMETERS IMPACT
Receiving & Preparation
Raw Grain Accepted grain Particulate matters, mg/m3
Air &Work Environment
Grain Storage & conveying
Grain Grain Particulate matters, mg/m3
Air & Work Environment
First cleaning Grain Grain Particulate matters, mg/m3
Air , soil &Work Environment
Grain Washed grainGrain Washing (wet process)
Water Wastewater BOD, COD, TSS, TDS
Water
Grain Wetted grain Tempering & Conditioning WaterSecond cleaning Wetted grain Wetted grain Soil
Grinding Conditioned grain Mixed Products
Particulate matters, mg/m3
Air &Work Environment
Screening Milling Products Milling Products
Particulate matters, mg/m3
Air &Work Environment
Packaging Products Packaged Products
Particulate matters, mg/m3
Air &Work Environment
Treated effluent
BOD, COD, TSS, Color
WaterWWTP Process WW
Sludge TSS Soil
21
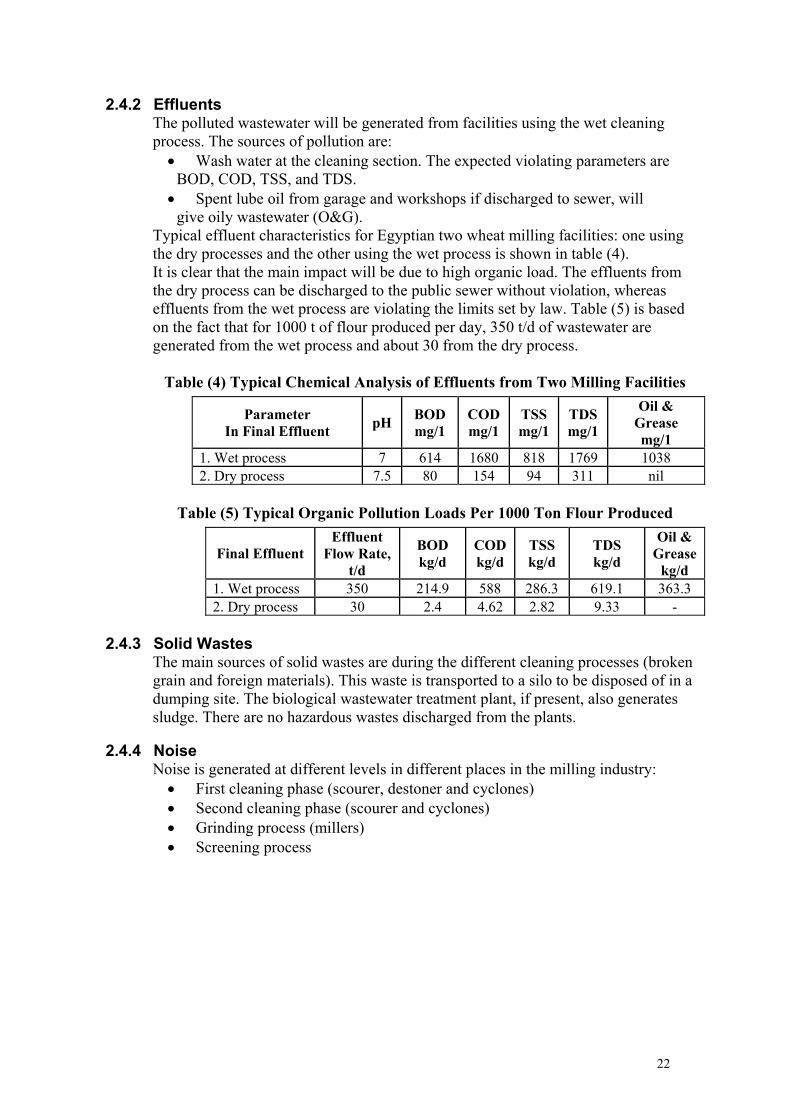
2.4.2 Effluents The polluted wastewater will be generated from facilities using the wet cleaning process. The sources of pollution are: • Wash water at the cleaning section. The expected violating parameters are
BOD, COD, TSS, and TDS. • Spent lube oil from garage and workshops if discharged to sewer, will
give oily wastewater (O&G). Typical effluent characteristics for Egyptian two wheat milling facilities: one using the dry processes and the other using the wet process is shown in table (4). It is clear that the main impact will be due to high organic load. The effluents from the dry process can be discharged to the public sewer without violation, whereas effluents from the wet process are violating the limits set by law. Table (5) is based on the fact that for 1000 t of flour produced per day, 350 t/d of wastewater are generated from the wet process and about 30 from the dry process.
Table (4) Typical Chemical Analysis of Effluents from Two Milling Facilities
Parameter In Final Effluent pH BOD
mg/1 COD mg/1
TSS mg/1
TDS mg/1
Oil & Grease mg/1
1. Wet process 7 614 1680 818 1769 1038 2. Dry process 7.5 80 154 94 311 nil
Table (5) Typical Organic Pollution Loads Per 1000 Ton Flour Produced
Final Effluent Effluent
Flow Rate, t/d
BOD kg/d
CODkg/d
TSS kg/d
TDS kg/d
Oil & Grease
kg/d 1. Wet process 350 214.9 588 286.3 619.1 363.3 2. Dry process 30 2.4 4.62 2.82 9.33 -
2.4.3 Solid Wastes
The main sources of solid wastes are during the different cleaning processes (broken grain and foreign materials). This waste is transported to a silo to be disposed of in a dumping site. The biological wastewater treatment plant, if present, also generates sludge. There are no hazardous wastes discharged from the plants.
2.4.4 Noise Noise is generated at different levels in different places in the milling industry: • First cleaning phase (scourer, destoner and cyclones) • Second cleaning phase (scourer and cyclones) • Grinding process (millers) • Screening process
22

2.5 Characteristics of the Milling Industry Proper inspection and monitoring of the grain milling industry should take into consideration the following aspects: • Production lines are operated on a continuous basis. • Wastewater is generated only if the wet cleaning process is used. • The major pollution impact is on air. Ambient and work environment
limits could be violated. • Air pollution loads depend on the type of equipment used, the installation
of pollution abatement devices and varies with the type of wheat used. American and European wheat is cleaner than Australian and Egyptian wheat. The last two types will therefore generate more pollution.
23
3. Environmental and Health Impacts of Pollutants 3.1 Impact of Air Emissions
Particulate matters Recent epidemiological evidence suggests that much of the health damage caused by exposure to particulates is associated with particulate matters smaller than 10µm (PM10). These particles penetrate most deeply into the lungs, causing a large spectrum of illnesses (e.g. asthma attack, cough, bronchitis
3.2 Impact of Effluents
Spent lube oil from garage and workshops could be a cause for concern if discharged into the sewer system. The organic material in wastewater stimulates the growth of bacteria and fungi naturally present in water, which then consume dissolved oxygen. The environmental impact of the wastewater depends on the receiving water body. The Ministry of Irrigation has set limits for the pollutants in the wastewater discharged into agriculture canals and drains as well as the Nile river for their detrimental effect on agriculture (Decree 8/1983). The parameters of relevance to the milling industry are BOD, COD, TSS, SS, Oil & grease. Discharge of polluted wastewater high in BOD into lakes and sea can cause eutrification and adversely impact bio-diversity.
3.3 Environmental Impact of Solid Wastes Solid waste is mainly impurities present with wheat such as dust and foreign food grains. It is collected and stored in silos for further disposal sites. Some smaller facilities accumulates the waste is piles until removed to dumping sites. These piles can cause air pollution since they are in a very fine state. Scrap from the garage and workshops is collected and sold. No impacts are expected. Sludge from the wastewater treatment plant should be dried before disposal to landfills.
3.4 Health Impact of Noise
Exceeding the limits set by the law for noise level and the exposure period may result in loss of hearing.
24
4. Egyptian Laws and Regulations There are a number of laws and regulations that address the different environmental violations. The following are the laws applicable to the grain milling industry.
4.1 Concerning Air Emissions
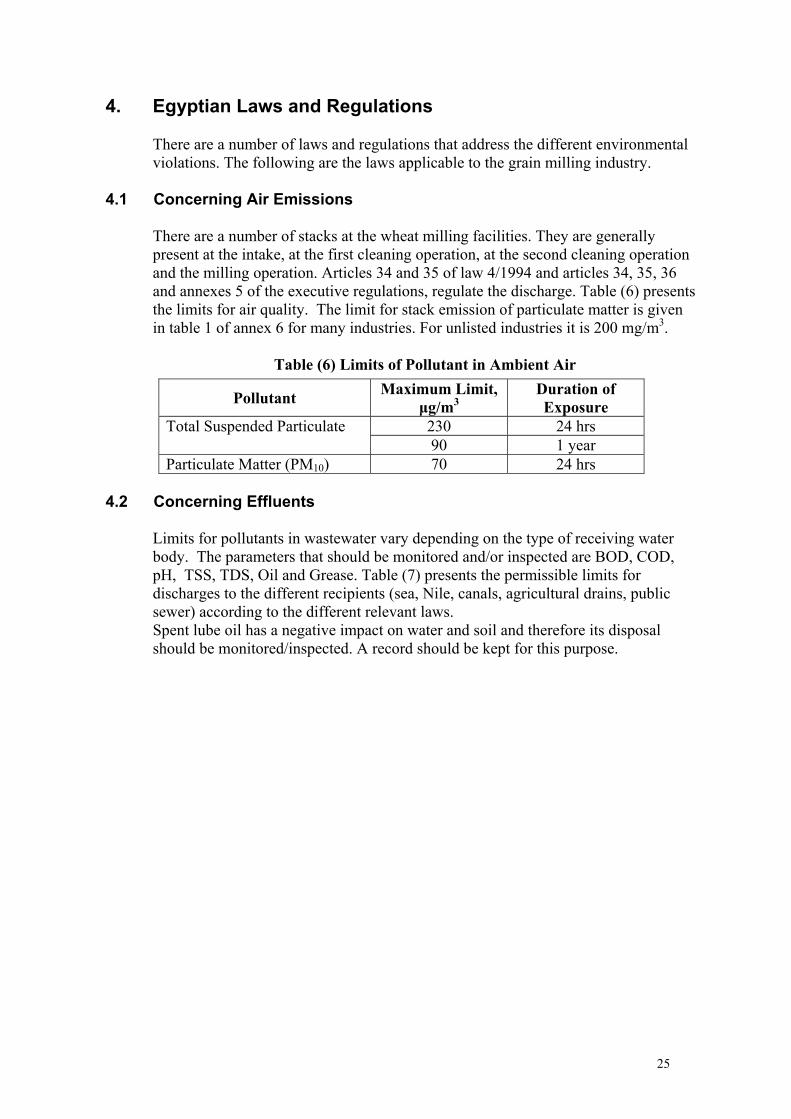
There are a number of stacks at the wheat milling facilities. They are generally present at the intake, at the first cleaning operation, at the second cleaning operation and the milling operation. Articles 34 and 35 of law 4/1994 and articles 34, 35, 36 and annexes 5 of the executive regulations, regulate the discharge. Table (6) presents the limits for air quality. The limit for stack emission of particulate matter is given in table 1 of annex 6 for many industries. For unlisted industries it is 200 mg/m3.
Table (6) Limits of Pollutant in Ambient Air
Pollutant Maximum Limit, µg/m3
Duration of Exposure
230 24 hrs Total Suspended Particulate 90 1 year
Particulate Matter (PM10) 70 24 hrs 4.2 Concerning Effluents
Limits for pollutants in wastewater vary depending on the type of receiving water body. The parameters that should be monitored and/or inspected are BOD, COD, pH, TSS, TDS, Oil and Grease. Table (7) presents the permissible limits for discharges to the different recipients (sea, Nile, canals, agricultural drains, public sewer) according to the different relevant laws. Spent lube oil has a negative impact on water and soil and therefore its disposal should be monitored/inspected. A record should be kept for this purpose.
25
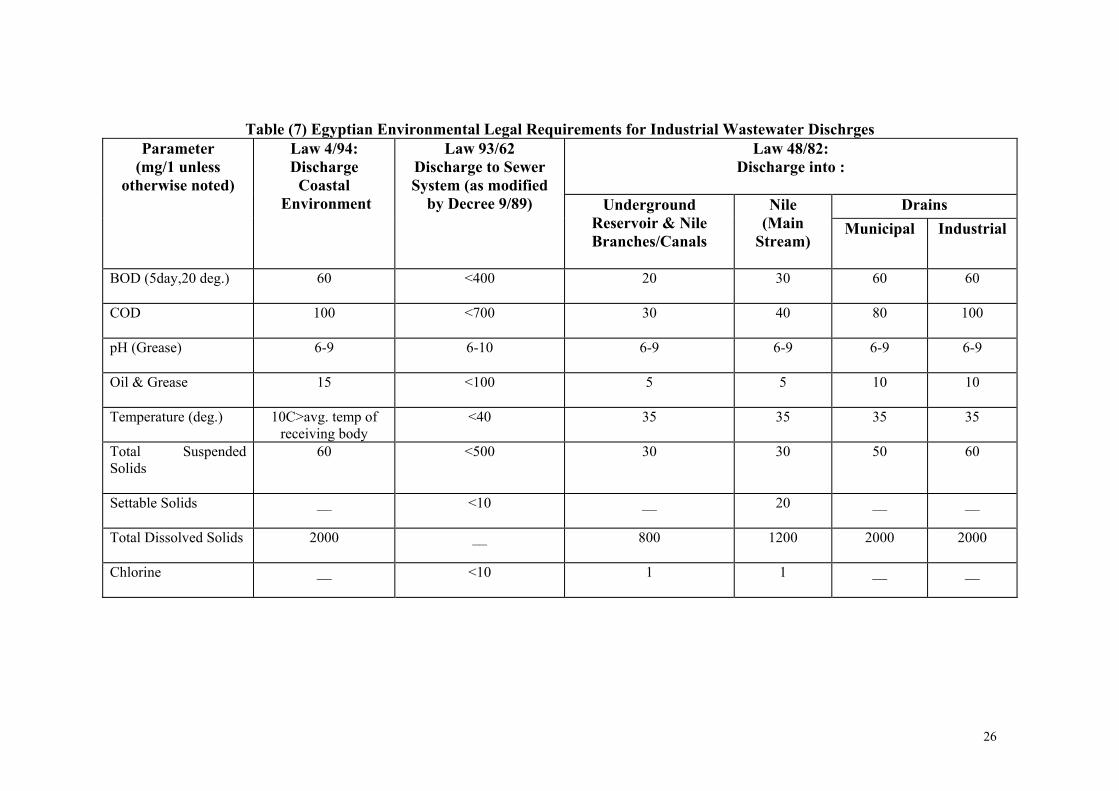
Table (7) Egyptian Environmental Legal Requirements for Industrial Wastewater Dischrges Law 48/82:
Discharge into :
Drains
Parameter (mg/1 unless
otherwise noted)
Law 4/94: Discharge
Coastal Environment
Law 93/62 Discharge to Sewer System (as modified
by Decree 9/89) Underground Reservoir & Nile Branches/Canals
Nile (Main
Stream) Municipal Industrial
BOD (5day,20 deg.)
60 <400 20 30 60 60
COD
100 <700 30 40 80 100
pH (Grease)
6-9 6-10 6-9 6-9 6-9 6-9
Oil & Grease
15 <100 5 5 10 10
Temperature (deg.)
10C>avg. temp of receiving body
<40 35 35 35 35
Total Suspended Solids
60 <500 30 30 50 60
Settable Solids
__ <10 __ 20 __ __
Total Dissolved Solids
2000 __ 800 1200 2000 2000
Chlorine
__ <10 1 1 __ __
26
4.3 Concerning Solid Wastes
A number of laws address solid waste management. The following laws apply to scrap and sludge from the WWTP: • Law 38/1967, which addresses public cleanliness, regulates the
collection and disposal of solid wastes from houses, public places, commercial and industrial establishments. • Ministry of Housing, Utilities and Urban Communities (MHUUC)
decree No. 134 of 1968, which provides guidelines from domestic and industrial sources, including specifications for collection, transportation, composting, incineration and land disposal. • Law 31/1976, which amended law 38/1967 • Law 43/1979, the Law of Local administration, which provided that
city councils are responsible for “physical and social infrastructure”, effectively delegating responsibility for infrastructure functions. • Law 4/1994, article 37 of the law and 38 of its executive regulations
regulates the incineration of solid waste. 4.4 Concerning Work Environment
Two types of violations of work environment regulations, are encountered: Noise: Due to the mechanical nature of the operations that take place in the milling industry, noise is generated at different levels in different places. Usually noise limits are only slightly exceeded at the different operations. Near heavy machinery: noise is regulated by article 42 of Law 4/1994, article 44 of the executive regulations and table 1, and annex 7. Tables 2 and 3 of annex 7 regulate exposure period.
Workplace Air Quality • The maximum permissible limit for the concentration of total
suspended particulate matter in workplace is 10 mg/m3. Particulate matter causing suffocation (PM10) is limited to 5 mg/m3. • Ventilation is regulated by article 45 of Law 4/1994 and article 47
of the executive regulations. • Work environment conditions are addressed in Law 137/1981 for
Labor, Minister of Housing Decree 380/1983, Minister of Industry Decree 380/1982
Workplace Safety Providing fire-fighting equipment is essential at the millers. The presence of fine flour particles in contact with the hot milling surface can generate a fire.
27
4.5 Concerning Hazardous Materials and Wastes
Law 4/1994 introduced the control of hazardous materials and wastes. The grain milling industry does not generate any hazardous wastes. The hazardous chemicals used in the lab and the fuel for the boilers, fall under the provisions of Law 4/1994. Articles 29 and 33 of the law makes it mandatory for those who produce or handle dangerous materials in gaseous, liquid or solid form, to take precautions to ensure that no environmental damage shall occur. Articles 25, 31 and 32 of the executive regulations (decree 338/1995) specify the necessary precautions for handling hazardous materials. Storing of fuel for the boilers is covered by the Law 4 as hazardous material There is no explicit articles in Law 4/1994 or in decree 338/1995 (executive regulations), regarding holding a register for the hazardous materials; article 33 is concerned with hazardous wastes. However, keeping the register for the hazardous materials is implicit in article 25 of the executive regulations regarding the application for a license.
4.6 Concerning the Environmental Register
Article 22 of Law 4/1994 states that the owner of the establishment shall keep a register showing the impact of the establishment activity on the environment. Article 17 and Annex 3 of the executive regulations specify the type of data recorded in the register.
The emergency response plan is also part of the environmental register as stated in part 4.5.
28
5. Pollution Abatement Measures This section deals with pollution abatement in the three media air, water and soil. Three types of interventions will be considered:
• In-plant modifications, which are changes that are performed in the plant to reduce pollutant concentrations in streams through recovery of materials, segregation and/or integration of streams, reducing the flow rate of the wastewater streams that need further treatment to reduce the hold-up of the required WWTP. • In-Process modifications, which are changes performed on the
process such as the introduction of newer technology, substitution of a hazardous raw material, performing process optimization and control. • End-of-pipe (EoP) measures, which involve treatment of the
pollutant or its separation for further disposal. Whereas in-plant and in-process modifications usually have an economic return on investment, end-of-pipe measures will be performed for the sole purpose of compliance with the laws without economic
Egyptian Environmental Laws do not require water and energy conservation measures. These measures have been considered in this manual since resource depletion and hence conservation is a worldwide-recognized environmental issue that could be implemented in Egypt in the near future. Water conservation measures can lead to higher concentrations of pollutants in the effluent Both energy and water conservation measures will provide both financial and economic benefits. The term Cleaner Production (CP) refers to the same concepts of pollution reduction through in-process, in-plant and resource conservation, in contradistinction to end-of-pipe treatment. In many cases, the adoption of CP can eliminate the need for (EoP) treatment. The following CP and EoP measures have been identified for the grain milling industry.
5.1 Air Pollution
In-plant modifications
• Install suction equipment in the buildings to collect and dispose of the accumulated dust and flour to improve workplace conditions.
• Repair and maintain all enclosures of conveying equipment.
• Repair and replace all bags that receive the cyclone dust.
• Tuning the fans that generate induced draft in the stacks. Increasing the fan loading increases the air flow rate for the same weight of emitted dust and therefore dust concentration decreases.
• Addition of dust collection systems. Bag filters are usually recommended for Egyptian milling industry for their lower price ease of maintenance and operation.
29
30
5.2 Water Pollution Abatement Measures
In-process modifications
Replace the wet process by the dry process eliminates the need for a wastewater treatment plant.
End-of-pipe treatment
Because of the typically high content of suspended solids, COD and BOD in the grain milling industry waste-streams, end-of-pipe treatment frequently involves settling tanks and biological treatment.
5.3 Abatement Measures for Solid Waste Pollution
Dust and flour particles
Installation of a pneumatic system to collect waste from the various cyclones and dust collecting equipment to be stored in silos for subsequent disposal into disposal sites.
Scrap Scrap is collected and sold.
Sludge Effluent treatment processes generate solids. On average 70-80% of the original carbon is converted to solids. Raw sludge is saturated with bound water, should be de-watered and disposed of in sanitary landfills.
6. ENVIRONMENTAL SELF-MONITORING
Self-Monitoring (SM) is a process that primarily relates to measurements of process inputs, releases and environmental pollution levels, as well as process conditions (operation controls) that are directly related to the monitored emissions. Self – monitoring is necessary for the plant to improve its economic performance by identifying the sources of wastes in raw materials, water, and energy that represent the main sources of pollution. Thus, the plant would be able to implement pollution prevention techniques that could reduce production costs and minimize compliance costs, which should lead to improved economic and environmental performance of the plant.
In addition, self-monitoring may include reporting of the results to the pertinent authorities. Monitoring can be carried out by the industrial establishment, or on its behalf, and paid for by the industrial establishment. The information obtained from the sampling component of the monitoring system must be recorded and the results reported to the appropriate internal and external decision-makers.
6.1 Benefits of SM
In general, the benefits of self-monitoring results to the operators include:
• Raising their awareness about the process performance and efficiency • Having them ready for inspection by authorities. • Providing inspectors with more reliable data to verify the single
unrepresentative samples and/or measurements • Raising their awareness about impact of pollutants • Implementing corrective actions if non-compliance occurs. • Deciding on raw materials, additives, fuels, and investment strategies. • Identifying trends in plant performance and setting alarms. • Improving process efficiency.
These benefits are generated through implementing an integrated environmental self-monitoring plan that comprises:
• Emission monitoring, which covers releases to air, wastewater, and solid and
hazardous waste as well as regulated working conditions • Monitoring of process parameters (operation controls) that are directly related
to the releases; such as temperature, pressure, and humidity. In addition, process conditions such as shutdowns, maintenance operations, and spills need to be also monitored, linked to emissions, and reported.
6.2 Scope and Objectives of SM As previously indicated, environmental self-monitoring comprises the monitoring of environmental releases (emissions) as well as the monitoring of process parameters (operation controls) that affect the environmental impact of the facility. The objectives of each type are separately detailed as follows:
31
a) Emissions self-monitoring The basic objective of self-monitoring is to monitor compliance with environmental regulations. As the inventory for hazardous materials and wastes is mandatory with procedures for handling and storage as regulated by law 4/1994, self-monitoring should assist in covering this area. The objectives of emission monitoring may go beyond monitoring compliance; i.e. to assist improving environmental performance. In other words, monitoring of emissions at the process level is necessary to minimize emissions at the source through pollution abatement and prevention measures. While Egyptian regulations consider only concentration of the pollutants, self-monitoring may include pollution loads as well as the environmental impact on the receiving media. These data are required to assess the improvement of the environmental performance.
b) Process self-monitoring (operation control)
In most industrial facilities monitoring of process operations already exists. Some process operation controls should be monitored for improved environmental benefits. The main objectives of process self-monitoring (operation control) is:
• Optimization of process operation by controlling the operating conditions • Minimization of losses • Planned maintenance and repair as opposed to emergency maintenance and
shutdown • Minimization of cost through conservation of energy and water
6.3 SM and Environmental Management Systems (EMS)
Aside from the regulatory aspects, SM has shown to be a necessary tool for the plant to manage its releases, control its environmental impacts and improve its environmental performance. Such achievements represent the main objectives of the Environmental Management Systems (EMS), which in turn constitute a requirement for internal monitoring, checking and implementing the corrective actions. In addition, EMS encourages the industrial plants to adopt Cleaner Production, (CP), and Pollution Prevention, (P2), measures as the main tools for continual improvement. This can be achieved only by implementing a comprehensive and effective SM plan.
The following sections highlight the concept of EMS, link to SM and link between SM and cleaner production.
6.3.1 Environmental Management Systems (EMS)
An Environmental Management System (EMS) is a framework that helps a company achieve its environmental goals through consistent control of its operations. The EMS itself does not dictate a level of environmental performance of the company; each company tailors its EMS to its specific business goals. Compliance with environmental laws and regulations has become a major goal that has to be attained with minimum cost. This is the minimum level for environmental performance to be achieved through the EMS. In general, an EMS comprises five phases leading to continual improvement; commitment and policy, planning, implementation,
32
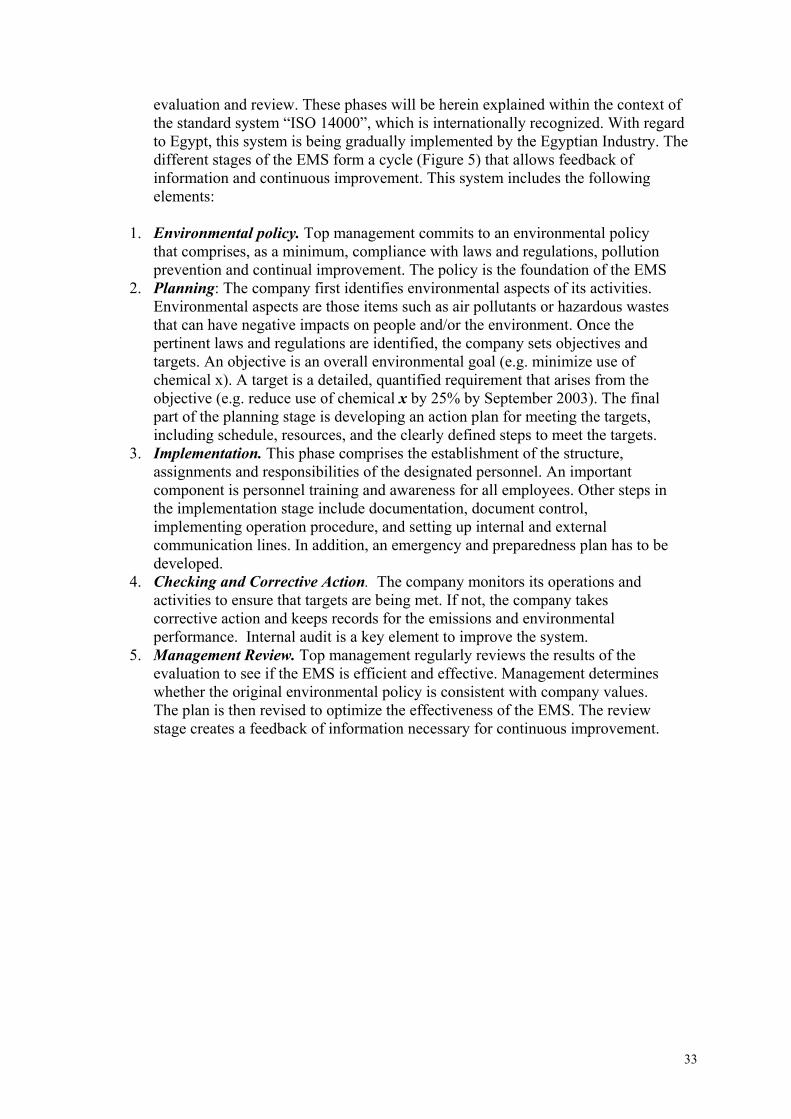
evaluation and review. These phases will be herein explained within the context of the standard system “ISO 14000”, which is internationally recognized. With regard to Egypt, this system is being gradually implemented by the Egyptian Industry. The different stages of the EMS form a cycle (Figure 5) that allows feedback of information and continuous improvement. This system includes the following elements:
1. Environmental policy. Top management commits to an environmental policy
that comprises, as a minimum, compliance with laws and regulations, pollution prevention and continual improvement. The policy is the foundation of the EMS
2. Planning: The company first identifies environmental aspects of its activities. Environmental aspects are those items such as air pollutants or hazardous wastes that can have negative impacts on people and/or the environment. Once the pertinent laws and regulations are identified, the company sets objectives and targets. An objective is an overall environmental goal (e.g. minimize use of chemical x). A target is a detailed, quantified requirement that arises from the objective (e.g. reduce use of chemical x by 25% by September 2003). The final part of the planning stage is developing an action plan for meeting the targets, including schedule, resources, and the clearly defined steps to meet the targets.
3. Implementation. This phase comprises the establishment of the structure, assignments and responsibilities of the designated personnel. An important component is personnel training and awareness for all employees. Other steps in the implementation stage include documentation, document control, implementing operation procedure, and setting up internal and external communication lines. In addition, an emergency and preparedness plan has to be developed.
4. Checking and Corrective Action. The company monitors its operations and activities to ensure that targets are being met. If not, the company takes corrective action and keeps records for the emissions and environmental performance. Internal audit is a key element to improve the system.
5. Management Review. Top management regularly reviews the results of the evaluation to see if the EMS is efficient and effective. Management determines whether the original environmental policy is consistent with company values. The plan is then revised to optimize the effectiveness of the EMS. The review stage creates a feedback of information necessary for continuous improvement.
33
Figure (5) Phases of EMS cycle (ISO 14000)
Continuous Improvement
Checking and
Corrective Action
Implementatio
n
Management
Review
Planning
Environmental Policy
6.3.2 Link between self-monitoring and (EMS) As previously explained, an EMS e.g. ISO 14000, comprises 5 stages: environmental policy, planning, implementation, checking and corrective actions. By analogy, the self-monitoring system (SMS) can be looked at using the same concept. Taking into consideration the definition, concept and principles of self-monitoring, as stated in the “Guide Book on Self Monitoring”, the elements of SMS can be rearranged as follows:
Commitment: In general, an effective self-monitoring requires that the management of the plant be committed to environmental compliance, as a minimum. However, this commitment will be an integrated part of the environmental policy in the EMS, if exists. Planning: The planning of the SM is mainly based on objective (s) that have been set. For a basic SMS, the objective would be monitoring of regulated parameters to assist in achieving regulatory compliance; e.g. end-of-pipe emissions and discharges. In an advanced SMS, the objectives may include monitoring of operation controls as well as emissions and wastes at the source, to help in implementing pollution prevention and cleaner production measures. In all cases, the objectives of self-monitoring should be in line with the objectives of EMS, if exists. In such case, the self-monitoring plan can be part of the EMS plan and includes:
• Description of the regulatory limits for compliance • Brief description of the actual situation (existing monitoring activities,
devices, equipment, resources,..). • Objectives and targets with time frame for implementation.
34
• Identification of parameters monitored, location of monitoring points and preparation of a self-monitoring schedule. • Description of methods and procedures used for sampling, analyses,
measurements, calculations, recording and data manipulation. • Description of tasks • Training program
Implementation: The implementation of SM means that the tools and mechanisms for collecting the relevant data are functioning. On the other hand, the implementation phase in EMS means that the environmental performance of the plant is improving. The implementation of SM results in large amount of data that need representation, interpretation and reporting in order to be useful as tools for decision making for corrective actions. The decision making requires knowledge about the status of: • Emissions as compared to limits set by law. • Toxic and hazardous releases: concentration, handling procedures and
transfers. • Maintenance and repair. • Percentage losses of raw materials, products and utilities. • Process operating parameters.
Evaluation: Evaluation of the self-monitoring plan through regular auditing will allow its continuous improvement. Evaluation should include all aspects of the plan (training, meeting targets, reliability of data, efficiency of devices,…etc). On the other hand, the evaluation of the EMS involves checking and taking corrective actions of all system components, including the monitoring activities.
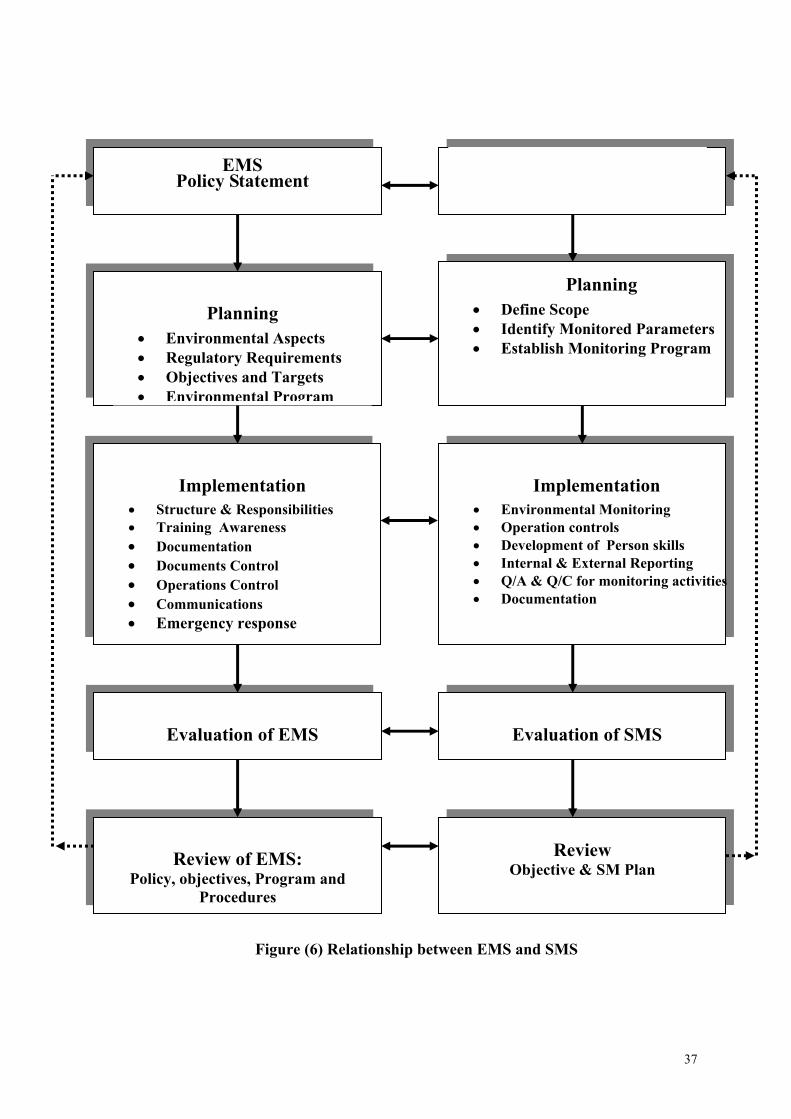
Review: On the basis of the evaluation of the monitoring plan, a review can be made of the monitoring objectives and targets. In case of EMS, the management review covers all the involved procedures, including monitoring activities. It is clear from the above explanation that self-monitoring is an integral part of any EMS. More specifically, self-monitoring is the tool for the evaluation function of an EMS. Figure (6) illustrates relationship and interaction among the main elements of EMS and SMS.
35
6.3.3 SM Link to Pollution Prevention and cleaner production
Growing understanding that escaping raw materials, chemicals and products constitute major pollution sources, industry has opted to implement pollution prevention measures at the source. These measures include in-plant and in-process modifications as well as resource conservation (minimization of water and energy consumption). The implementation of these measures will decrease the end-of-pipe treatment cost. However, plant management will have to undertake a cost-benefit analysis to determine which measures are economically viable.
Self-monitoring is the tool that helps undertake these analyses by providing the necessary data and information about process inputs and outputs as well as the framework for performing the required tasks. The introduction of emission monitoring for the purpose of improved environmental performance through the application of cleaner technology widens the objectives of the plant EMS beyond compliance with relevant laws and should be met with economic incentives from the part of the competent authorities.
36
EMS Policy Statement
• Envi• Regu• Obje• Envi
Im• Structu• Trainin• Docum• Docum• Operat• Comm• Emerg
Policy
1. y StatementSMS
Management Commitment Polic
Planning • Define Scope • Identify Monitored Parameters • Establish Monitoring Program
Planning ronmental Aspects latory Requirements ctives and Targets ronmental Program
plementation re & Responsibilities g Awareness entation ents Control ions Control unications ency response
S
Implementation • Environmental Monitoring • Operation controls • Development of Person skills • Internal & External Reporting • Q/A & Q/C for monitoring activities • Documentation
S
Evaluation of EMReview Objective & SM Plan
Review of EMS: , objectives, Program and
Procedures
Figure (6) Relationship between EMS and SMS
Evaluation of SM
37
6.4 Regulatory Aspects
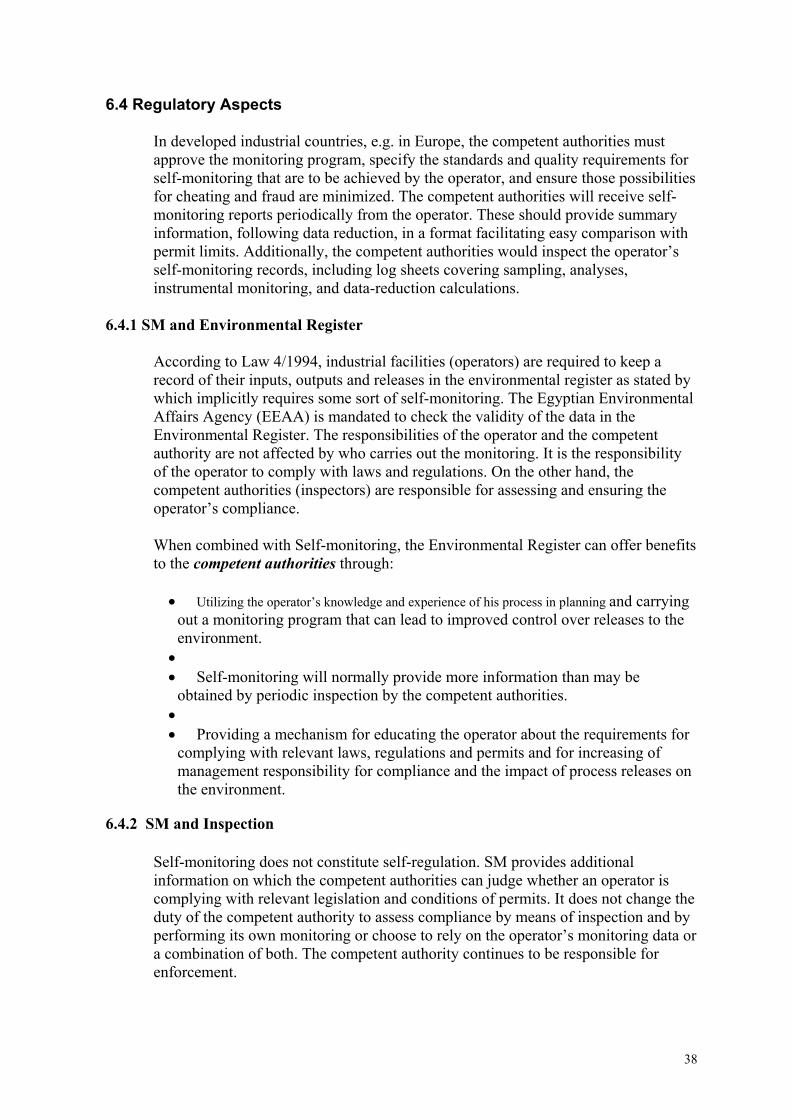
In developed industrial countries, e.g. in Europe, the competent authorities must approve the monitoring program, specify the standards and quality requirements for self-monitoring that are to be achieved by the operator, and ensure those possibilities for cheating and fraud are minimized. The competent authorities will receive self-monitoring reports periodically from the operator. These should provide summary information, following data reduction, in a format facilitating easy comparison with permit limits. Additionally, the competent authorities would inspect the operator’s self-monitoring records, including log sheets covering sampling, analyses, instrumental monitoring, and data-reduction calculations.
6.4.1 SM and Environmental Register
According to Law 4/1994, industrial facilities (operators) are required to keep a record of their inputs, outputs and releases in the environmental register as stated by which implicitly requires some sort of self-monitoring. The Egyptian Environmental Affairs Agency (EEAA) is mandated to check the validity of the data in the Environmental Register. The responsibilities of the operator and the competent authority are not affected by who carries out the monitoring. It is the responsibility of the operator to comply with laws and regulations. On the other hand, the competent authorities (inspectors) are responsible for assessing and ensuring the operator’s compliance.
When combined with Self-monitoring, the Environmental Register can offer benefits to the competent authorities through: • Utilizing the operator’s knowledge and experience of his process in planning and carrying
out a monitoring program that can lead to improved control over releases to the environment. • • Self-monitoring will normally provide more information than may be
obtained by periodic inspection by the competent authorities. • • Providing a mechanism for educating the operator about the requirements for
complying with relevant laws, regulations and permits and for increasing of management responsibility for compliance and the impact of process releases on the environment.
6.4.2 SM and Inspection
Self-monitoring does not constitute self-regulation. SM provides additional information on which the competent authorities can judge whether an operator is complying with relevant legislation and conditions of permits. It does not change the duty of the competent authority to assess compliance by means of inspection and by performing its own monitoring or choose to rely on the operator’s monitoring data or a combination of both. The competent authority continues to be responsible for enforcement.
38
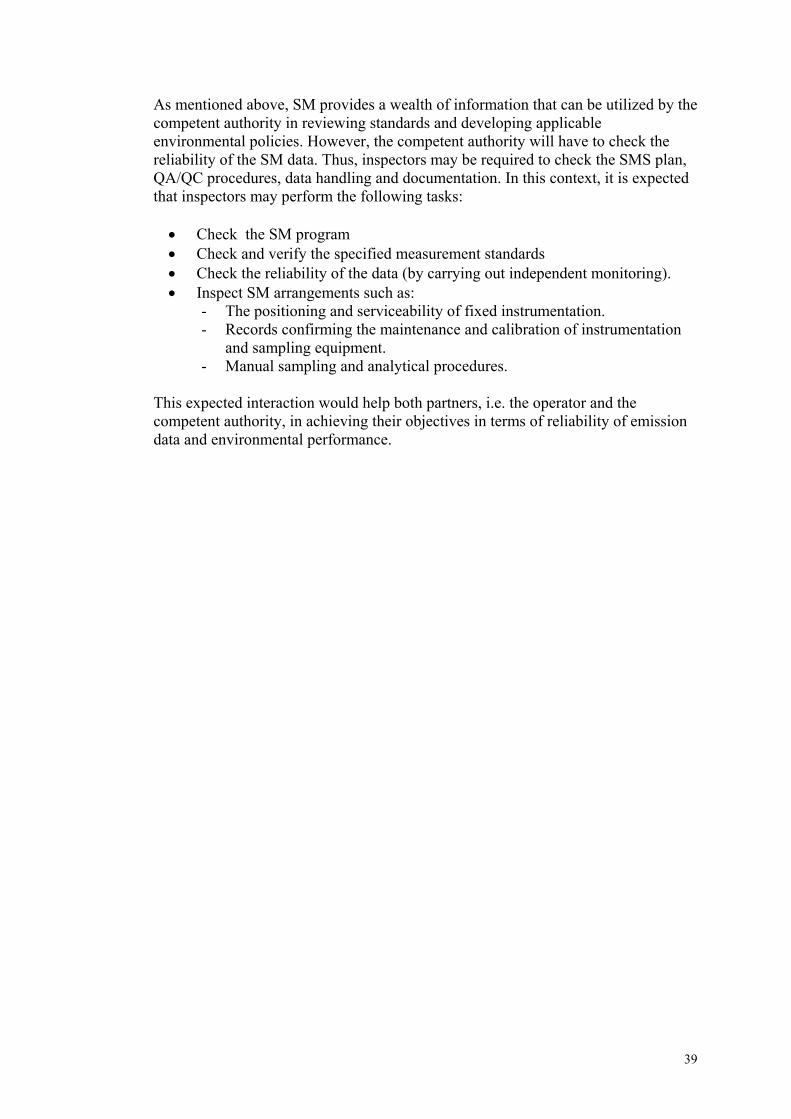
As mentioned above, SM provides a wealth of information that can be utilized by the competent authority in reviewing standards and developing applicable environmental policies. However, the competent authority will have to check the reliability of the SM data. Thus, inspectors may be required to check the SMS plan, QA/QC procedures, data handling and documentation. In this context, it is expected that inspectors may perform the following tasks:
• Check the SM program • Check and verify the specified measurement standards • Check the reliability of the data (by carrying out independent monitoring). • Inspect SM arrangements such as:
- The positioning and serviceability of fixed instrumentation. - Records confirming the maintenance and calibration of instrumentation
and sampling equipment. - Manual sampling and analytical procedures.
This expected interaction would help both partners, i.e. the operator and the competent authority, in achieving their objectives in terms of reliability of emission data and environmental performance.
39
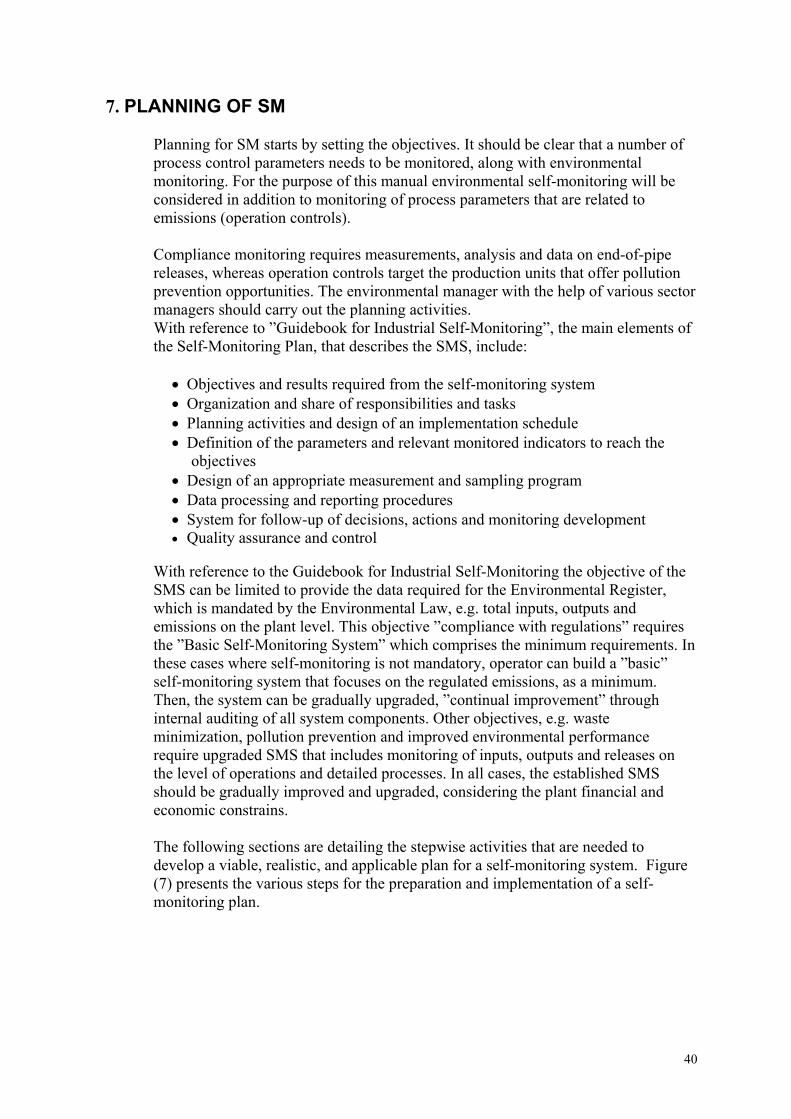
7. PLANNING OF SM
Planning for SM starts by setting the objectives. It should be clear that a number of process control parameters needs to be monitored, along with environmental monitoring. For the purpose of this manual environmental self-monitoring will be considered in addition to monitoring of process parameters that are related to emissions (operation controls). Compliance monitoring requires measurements, analysis and data on end-of-pipe releases, whereas operation controls target the production units that offer pollution prevention opportunities. The environmental manager with the help of various sector managers should carry out the planning activities. With reference to ”Guidebook for Industrial Self-Monitoring”, the main elements of the Self-Monitoring Plan, that describes the SMS, include:
• Objectives and results required from the self-monitoring system • Organization and share of responsibilities and tasks • Planning activities and design of an implementation schedule • Definition of the parameters and relevant monitored indicators to reach the
objectives • Design of an appropriate measurement and sampling program • Data processing and reporting procedures • System for follow-up of decisions, actions and monitoring development • Quality assurance and control
With reference to the Guidebook for Industrial Self-Monitoring the objective of the SMS can be limited to provide the data required for the Environmental Register, which is mandated by the Environmental Law, e.g. total inputs, outputs and emissions on the plant level. This objective ”compliance with regulations” requires the ”Basic Self-Monitoring System” which comprises the minimum requirements. In these cases where self-monitoring is not mandatory, operator can build a ”basic” self-monitoring system that focuses on the regulated emissions, as a minimum. Then, the system can be gradually upgraded, ”continual improvement” through internal auditing of all system components. Other objectives, e.g. waste minimization, pollution prevention and improved environmental performance require upgraded SMS that includes monitoring of inputs, outputs and releases on the level of operations and detailed processes. In all cases, the established SMS should be gradually improved and upgraded, considering the plant financial and economic constrains. The following sections are detailing the stepwise activities that are needed to develop a viable, realistic, and applicable plan for a self-monitoring system. Figure (7) presents the various steps for the preparation and implementation of a self-monitoring plan.
40
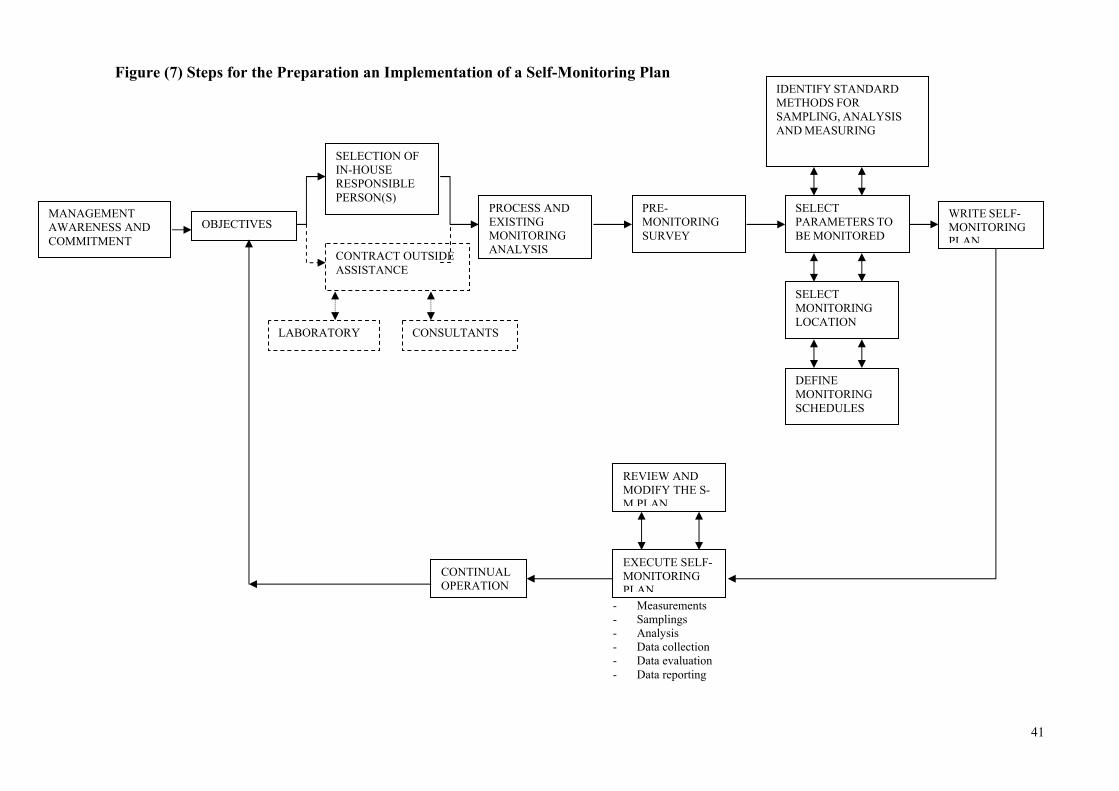
Figure (7) Steps for the Preparation an Implementation of a Self-Monitoring Plan
WRITE SELF-MONITORING PLAN
OBJECTIVES
CONTINUAL OPERATION
REVIEW AND MODIFY THE S-M PLAN
EXECUTE SELF-MONITORING PLAN
- Measurements - Samplings - Analysis - Data collection - Data evaluation - Data reporting
IDENTIFY STANDARD METHODS FOR SAMPLING, ANALYSIS AND MEASURING
DEFINE MONITORING SCHEDULES
SELECT MONITORING LOCATION
SELECT PARAMETERS TO BE MONITORED
PRE-MONITORING SURVEY
PROCESS AND EXISTING MONITORING ANALYSIS
CONSULTANTS LABORATORY
CONTRACT OUTSIDE ASSISTANCE
SELECTION OF IN-HOUSE RESPONSIBLE PERSON(S)
MANAGEMENT AWARENESS AND COMMITMENT
41
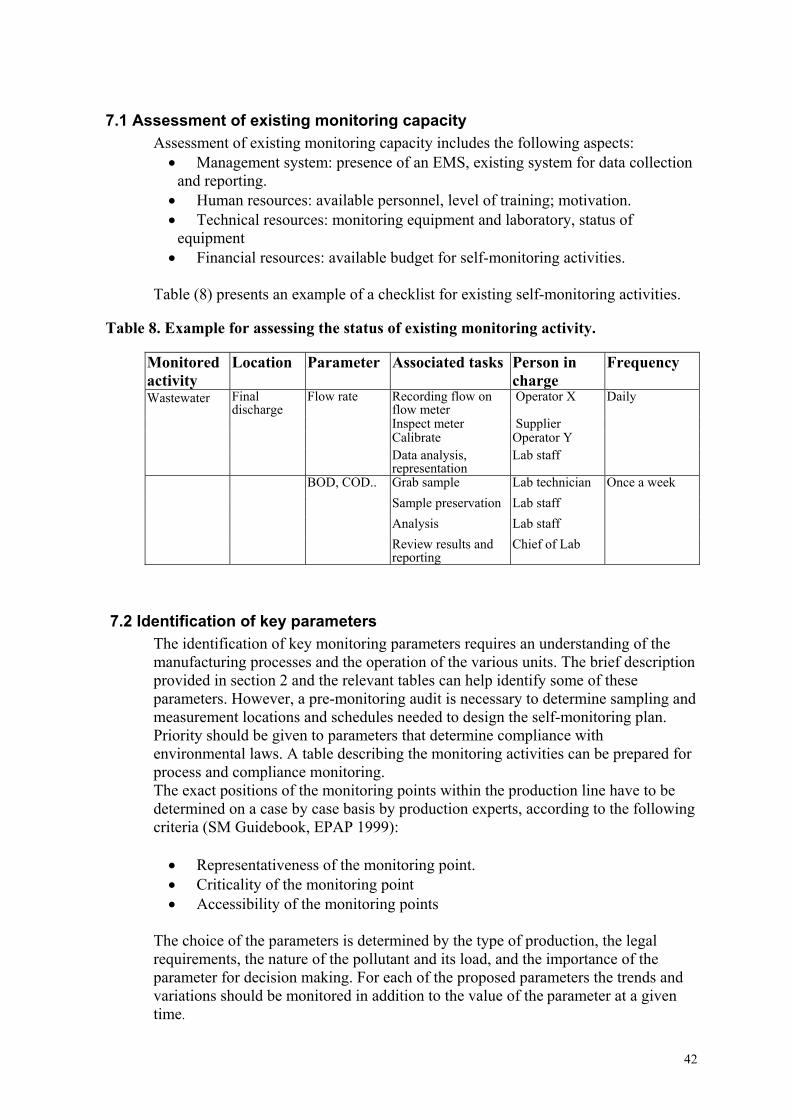
7.1 Assessment of existing monitoring capacity Assessment of existing monitoring capacity includes the following aspects: • Management system: presence of an EMS, existing system for data collection
and reporting. • Human resources: available personnel, level of training; motivation. • Technical resources: monitoring equipment and laboratory, status of
equipment • Financial resources: available budget for self-monitoring activities.
Table (8) presents an example of a checklist for existing self-monitoring activities. Table 8. Example for assessing the status of existing monitoring activity.
Monitored activity
Location Parameter Associated tasks Person in charge
Frequency
Recording flow on flow meter
Operator X
Inspect meter Supplier Calibrate Operator Y
Wastewater Final discharge
Flow rate
Data analysis, representation
Lab staff
Daily
Grab sample Lab technician Sample preservation Lab staff Analysis Lab staff
BOD, COD..
Review results and reporting
Chief of Lab
Once a week
7.2 Identification of key parameters The identification of key monitoring parameters requires an understanding of the manufacturing processes and the operation of the various units. The brief description provided in section 2 and the relevant tables can help identify some of these parameters. However, a pre-monitoring audit is necessary to determine sampling and measurement locations and schedules needed to design the self-monitoring plan. Priority should be given to parameters that determine compliance with environmental laws. A table describing the monitoring activities can be prepared for process and compliance monitoring. The exact positions of the monitoring points within the production line have to be determined on a case by case basis by production experts, according to the following criteria (SM Guidebook, EPAP 1999): • Representativeness of the monitoring point. • Criticality of the monitoring point • Accessibility of the monitoring points
The choice of the parameters is determined by the type of production, the legal requirements, the nature of the pollutant and its load, and the importance of the parameter for decision making. For each of the proposed parameters the trends and variations should be monitored in addition to the value of the parameter at a given time.
42
7.3 General data required When assessing the performance of the operation and its impacts on the environment, some basic information is needed to put the monitoring data into the context of interpretation. Such information is about: • Identification: Name, address, plant location, name of owner, manager and
head of environmental department. • Inputs name, type and amount: Raw materials, chemicals, fuels, water, steam,
and electricity. • Technology: Description of process, applied technology, operating conditions
(temperature, pressure), maximum capacity, operating capacity during monitoring. • Outputs name, type and rate: Products, by-products • Abatement techniques: Air pollution prevention, wastewater treatment, solid
waste management, noise abatement • Emissions and their sources: receiving media, pollutant type, concentration
and load, pollutant impact. • Existing EMS system, analyses and measurement results, relevant
environmental laws and allowable pollutant levels. • Assessment of legislative and regulatory requirements.
7.4 Data collection, manipulation and reporting Data collection and analysis should be carefully planned according to the following principles: • Base the analysis on trends over a long period to take into consideration the
shock loads that characterize the milling industry. • Determine the causes and degree of variability of a parameter. A dramatic
change of a low-variability parameter may be interpreted as a sign of anomaly of the process. This will require an investigation to find the potential source of the problem and take the right corrective action. • Study the correlation between different parameters. The cause of variation for
a highly variable parameter may be correlated to another parameter. A considerable amount of data may be generated by the operator carrying out self-monitoring especially when continuous monitoring instrumentation is used. Data reduction is necessary to calculate time-averaged means, percentile values and the like. When compliance data are recorded in the environmental register the relevant calculations for data reduction should be specified. Measured values are used to form half-hourly mean values for each successive half-hour to generate frequency distribution. For each calendar day a daily mean value, related to the daily operating time, is calculated from the half-hourly mean values and kept on file. Measurement results should be kept in the environmental register for at least 10 years (Article 22 of law 4/1994 and 17 of its executive regulations). An annual report is prepared on the outcome of the measurements including information on: • Measurement planning • The outcome of each individual measure • Measurement methods used
43
• Operating conditions that are important for the assessment of individual data and measurement results.
7.5 Criteria for selecting monitoring method. The choice of monitoring method used to determine the value of the parameter depends on the specific features of the process, the emission sources, the physical state and properties of the sample and the nature of emissions from the operation. The latter can be classified as:
Normal emissions
Occur during normal operation and normal process and abatement technique conditions .
Diffused and fugitive emissions
These are emissions from a certain process but from scattered points such as emissions from ventilation ducts, barrels, and scattered small stores. The diffuse emissions are calculated/estimated by monitoring the source periodically and assessing the long-term emission from the measurement results or by mass balance calculations.
Exceptional emissions
Exceptional emissions refer to varying input or process conditions, start-ups, shutdowns, by-pass of a process for malfunctioning and accidental causes. The emissions can differ from those of normal operation in their volume and/or concentration. These emissions can be multiple compared to normal emissions. It can be impossible to measure the concentration or volume of the exceptional emissions as the measuring device is calibrated according to the normal operating conditions. Estimation techniques should then be performed.
There are four basic methods that may be used to develop estimates: • Direct or indirect measurement • Mass balance • Emission factors • Engineering calculations
7.5.1. Direct or indirect measurement a) Direct measurements: Using monitoring data or direct measurements are usually the best method for developing chemical release and/or other waste-management activity quality estimates. Data may have also been collected for the facility through an occupational health and safety assessment. If only a small number of direct measurement data is available or if the monitoring data are not based on a representative sample, another estimation method should be used to give a more accurate result.
Note : Treatment Efficiencies Supplier data on treatment efficiencies often represent ideal operating conditions, should be adjusted to account for downtime and process upsets during the year that would result in lower efficiencies. Efficiencies reported by supplier are often general and may not apply to specific chemicals. For example, an incinerator or flare may be 99.99% efficient in destroying organic chemicals, but will have 0% efficiency in destroying metals.
44
For successful measurements the following considerations should be satisfied: • The frequency of measurement and sampling must cover temporal variations
of the process and specifically the period during which harm occurs. • Continuous monitoring is suitable for large emission sources, such as stacks
and wastewater canals except in cases where high temperature or corrosive substances are involved. At smaller sites the cost of continuous monitoring is weighed against the value of the monitoring results and the possibility of obtaining representative results from periodic measurements. • Utilization rate (percentage of continuous monitoring time to total operation
time) should be known when performing continuous monitoring. • The process conditions must be specified when monitoring takes place (e.g.
start-up, shutdown, production rate, operating production lines, and failure of abatement equipment).
b) Indirect measurements: These are performed through surrogate parameters. Surrogate parameters are variables that can be closely related to conventional direct measurements of pollutant releases or impacts and which may therefore be monitored and used instead of direct values for some practical purposes. Surrogates are commonly used in operation control as they give an early warning of possible abnormal conditions or emissions. Surrogates may provide a relative measurement rather than an absolute value and may only be valid for a restricted range of process conditions. On the other hand, surrogates can provide more continuous information than direct measurements. It is also often cost-effective as it allows more discharge positions to be monitored for the same resources. The advantages and disadvantages of surrogate parameters are summarized in Table (9). A surrogate can be used for compliance monitoring purposes if all the following conditions are met: • It is closely and consistently related to a required direct value (e.g. fuel sulfur
vs. directly measured SO2, relationship between opacity and particulate concentration, condenser temperature and VOC emissions). • It is regularly calibrated against the direct value. • It is cheaper or easier to monitor than the direct value, or gives more frequent
information • Its value can be related to specific limits • The process conditions where it is measured matches the conditions where
direct measurements are required. • Any extra uncertainty due to use of surrogate is not significant for regulatory
decisions or process management.
45
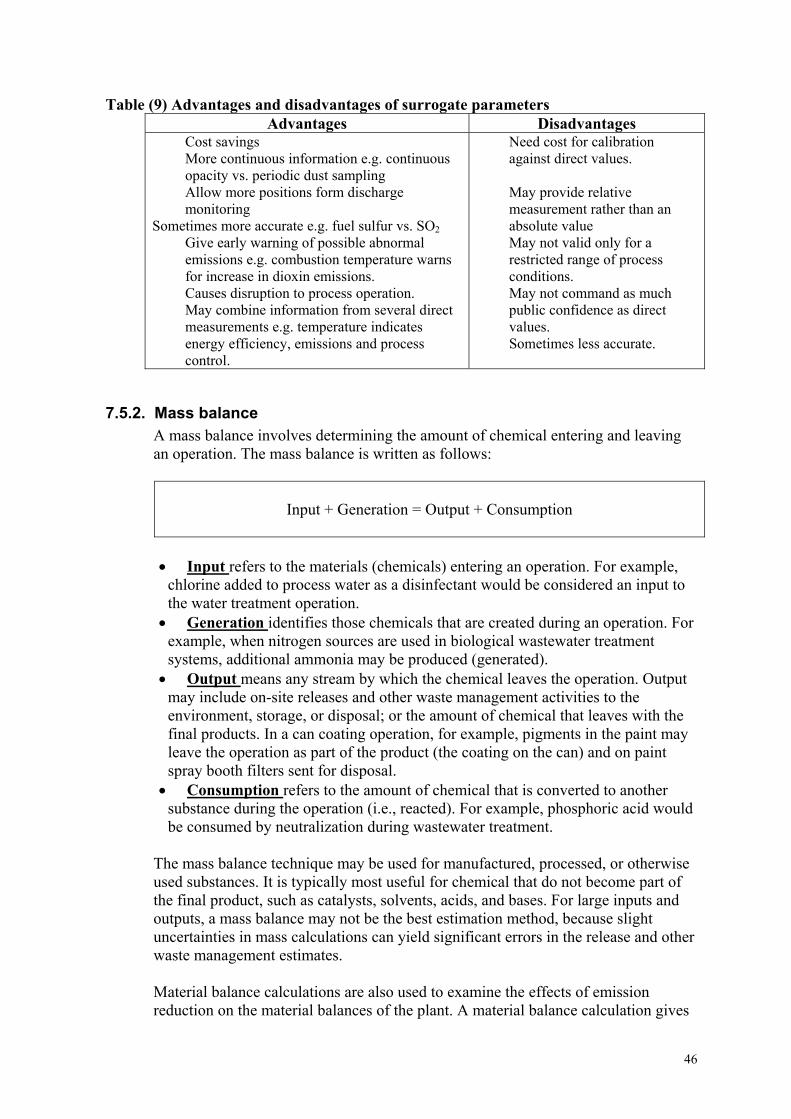
Table (9) Advantages and disadvantages of surrogate parameters Advantages Disadvantages
� Cost savings � More continuous information e.g. continuous
opacity vs. periodic dust sampling � Allow more positions form discharge
monitoring Sometimes more accurate e.g. fuel sulfur vs. SO2
� Give early warning of possible abnormal emissions e.g. combustion temperature warns for increase in dioxin emissions.
� Causes disruption to process operation. � May combine information from several direct
measurements e.g. temperature indicates energy efficiency, emissions and process control.
� Need cost for calibration against direct values.
� May provide relative
measurement rather than an absolute value
� May not valid only for a restricted range of process conditions.
� May not command as much public confidence as direct values.
� Sometimes less accurate.
7.5.2. Mass balance A mass balance involves determining the amount of chemical entering and leaving an operation. The mass balance is written as follows:
Input + Generation = Output + Consumption
• Input refers to the materials (chemicals) entering an operation. For example,
chlorine added to process water as a disinfectant would be considered an input to the water treatment operation. • Generation identifies those chemicals that are created during an operation. For
example, when nitrogen sources are used in biological wastewater treatment systems, additional ammonia may be produced (generated). • Output means any stream by which the chemical leaves the operation. Output
may include on-site releases and other waste management activities to the environment, storage, or disposal; or the amount of chemical that leaves with the final products. In a can coating operation, for example, pigments in the paint may leave the operation as part of the product (the coating on the can) and on paint spray booth filters sent for disposal. • Consumption refers to the amount of chemical that is converted to another
substance during the operation (i.e., reacted). For example, phosphoric acid would be consumed by neutralization during wastewater treatment.
The mass balance technique may be used for manufactured, processed, or otherwise used substances. It is typically most useful for chemical that do not become part of the final product, such as catalysts, solvents, acids, and bases. For large inputs and outputs, a mass balance may not be the best estimation method, because slight uncertainties in mass calculations can yield significant errors in the release and other waste management estimates.
Material balance calculations are also used to examine the effects of emission reduction on the material balances of the plant. A material balance calculation gives
46
an impression of the magnitude of the emission of a specific substance but can not show neither accurate emission amounts, nor their division between emissions into the air, water discharges or solid wastes. Material balance calculations are often based on evaluated process flows and concentrations. Calculating a reliable average emission level for a factory means long term monitoring of the processes and statistical examination.
7.5.3. Emission factors An emission factor is a representative value that attempts to relate the quantity of an emission released with an associated activity. These factors are usually expressed as the weight of emission released divided by a unit weight, volume, distance, or duration of the activity (e.g. kg of emission released per kg of product). Emission factors have been developed for many different industries and activities. Emission factors depend on the technology used, raw materials and pollution control devices. Emission factors can be obtained from industrial database e.g. DSS (available at EEAA).
Note Sources of information on emission factors should be carefully evaluated and the conditions for using the factors reviewed to determine if it is applicable to the situation at the facility.
7.5.4. Engineering calculations. Engineering calculations are assumptions and/or judgements used to estimate quantities of listed chemicals released or managed. The quantities are estimated by using physical and chemical properties and relationships (e.g. Raoult’s law, Ideal gas law) or by modifying an emission factor to reflect the chemical properties of the toxic chemical in question. Engineering calculations rely on the process parameters; thorough knowledge of the operation is required to complete these calculations. Engineering calculations can also include computer models. Several computer models are available for estimating emissions from landfills, wastewater treatment, water treatment and other processes.
47
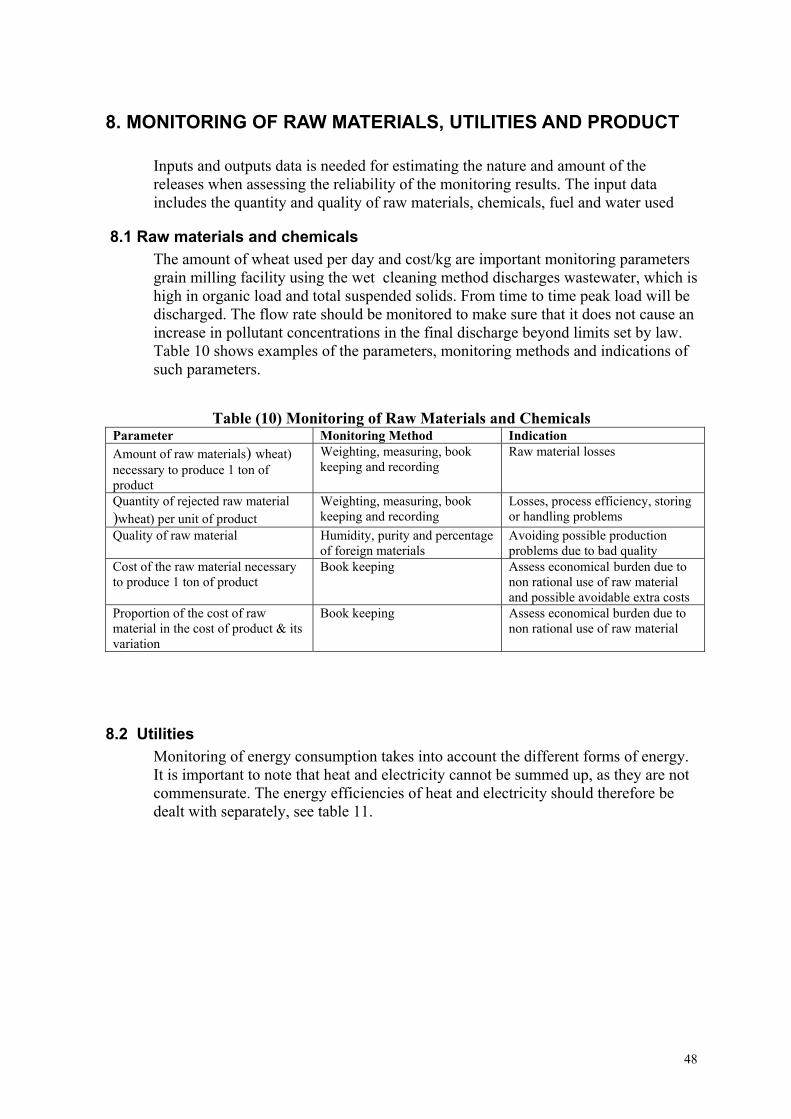
8. MONITORING OF RAW MATERIALS, UTILITIES AND PRODUCT
Inputs and outputs data is needed for estimating the nature and amount of the releases when assessing the reliability of the monitoring results. The input data includes the quantity and quality of raw materials, chemicals, fuel and water used
8.1 Raw materials and chemicals The amount of wheat used per day and cost/kg are important monitoring parameters grain milling facility using the wet cleaning method discharges wastewater, which is high in organic load and total suspended solids. From time to time peak load will be discharged. The flow rate should be monitored to make sure that it does not cause an increase in pollutant concentrations in the final discharge beyond limits set by law. Table 10 shows examples of the parameters, monitoring methods and indications of such parameters.
Table (10) Monitoring of Raw Materials and Chemicals Parameter Monitoring Method Indication Amount of raw materials) wheat) necessary to produce 1 ton of product
Weighting, measuring, book keeping and recording
Raw material losses
Quantity of rejected raw material )wheat) per unit of product
Weighting, measuring, book keeping and recording
Losses, process efficiency, storing or handling problems
Quality of raw material Humidity, purity and percentage of foreign materials
Avoiding possible production problems due to bad quality
Cost of the raw material necessary to produce 1 ton of product
Book keeping Assess economical burden due to non rational use of raw material and possible avoidable extra costs
Proportion of the cost of raw material in the cost of product & its variation
Book keeping Assess economical burden due to non rational use of raw material
8.2 Utilities Monitoring of energy consumption takes into account the different forms of energy. It is important to note that heat and electricity cannot be summed up, as they are not commensurate. The energy efficiencies of heat and electricity should therefore be dealt with separately, see table 11.
48
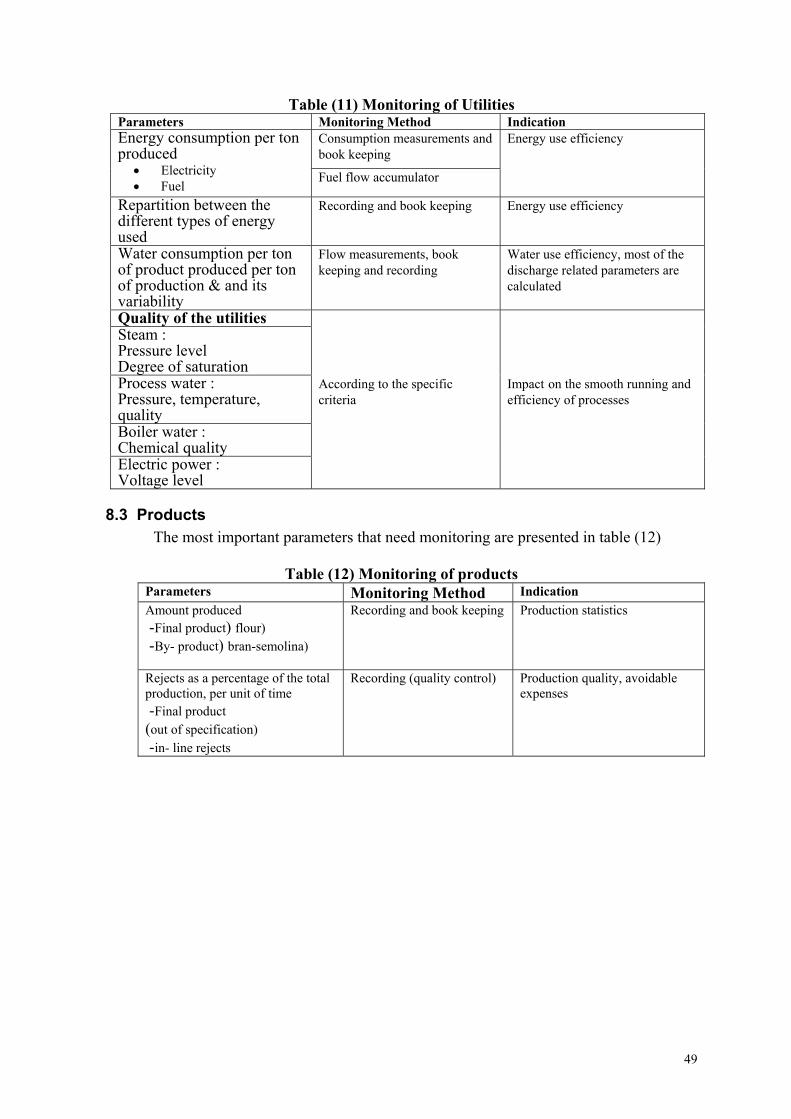
Table (11) Monitoring of Utilities Parameters Monitoring Method Indication
Consumption measurements and book keeping
Energy consumption per ton produced
• Electricity • Fuel
Fuel flow accumulator
Energy use efficiency
Repartition between the different types of energy used
Recording and book keeping Energy use efficiency
Water consumption per ton of product produced per ton of production & and its variability
Flow measurements, book keeping and recording
Water use efficiency, most of the discharge related parameters are calculated
Quality of the utilities Steam : Pressure level Degree of saturation
Process water : Pressure, temperature, quality
According to the specific criteria
Impact on the smooth running and efficiency of processes
Boiler water : Chemical quality
Electric power : Voltage level
8.3 Products The most important parameters that need monitoring are presented in table (12)
Table (12) Monitoring of products Parameters Monitoring Method Indication Amount produced - Final product) flour) - By- product) bran-semolina)
Recording and book keeping Production statistics
Rejects as a percentage of the total production, per unit of time - Final product (out of specification) - in- line rejects
Recording (quality control)
Production quality, avoidable expenses
49

9. OPERATION CONTROL
Processes should be operated at the optimum operating conditions to ensure the highest yield and productivity as well as product quality. Operation control deals with the control and monitoring of key parameters that affect environmental performance. These key parameters are monitored to minimize losses and therefore pollution. Planned maintenance is also important to minimize pollution and improve environmental performance.
9.1 Monitoring process parameters Table (13) presents the major processes in each production line and the parameters that should be monitored to minimize losses, maximizing productivity and predict maintenance needs.
50
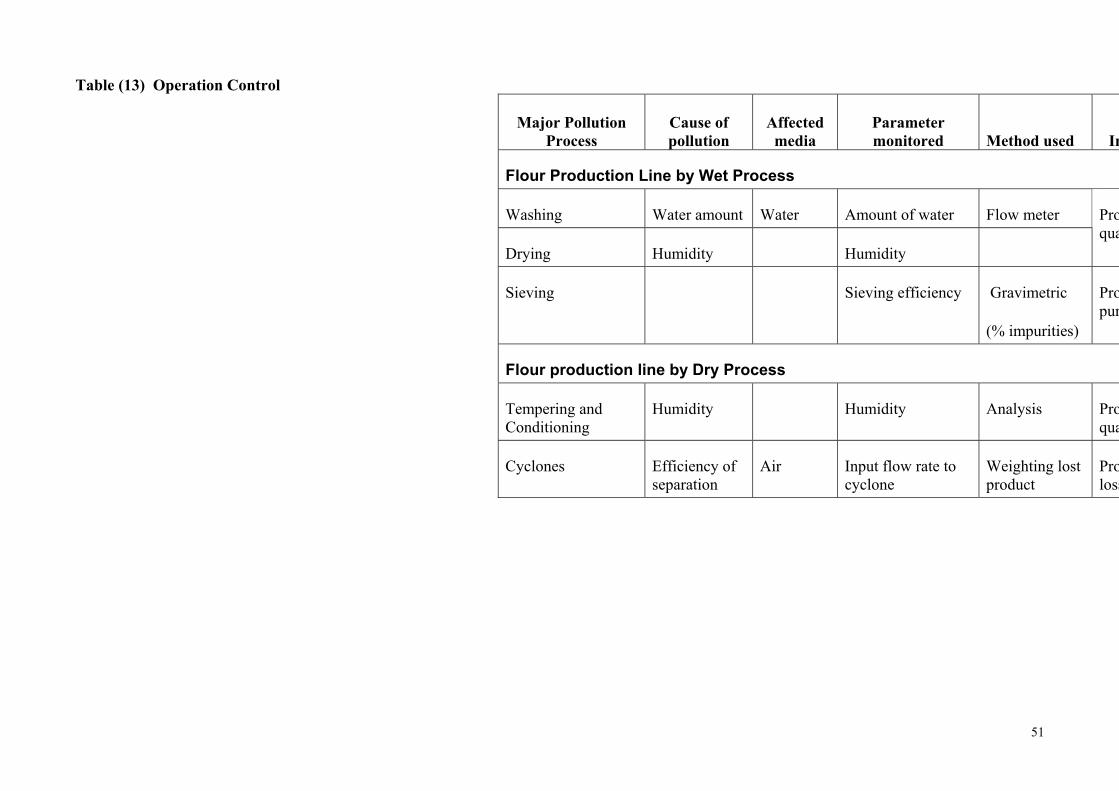
Table (13) Operation Control
In Method used Parameter monitored
Affected media
Cause of pollution
Major Pollution Process
Flour Production Line by Wet Process
Flow meter Amount of water Water Water amount Washing Proqua
Humidity Humidity Drying
Propur
Gravimetric
(% impurities)
Sieving efficiency Sieving
Flour production line by Dry Process
Proqua
Analysis Humidity Humidity Tempering and Conditioning
Proloss
Weighting lost product
Input flow rate to cyclone
Air Efficiency of separation
Cyclones
51
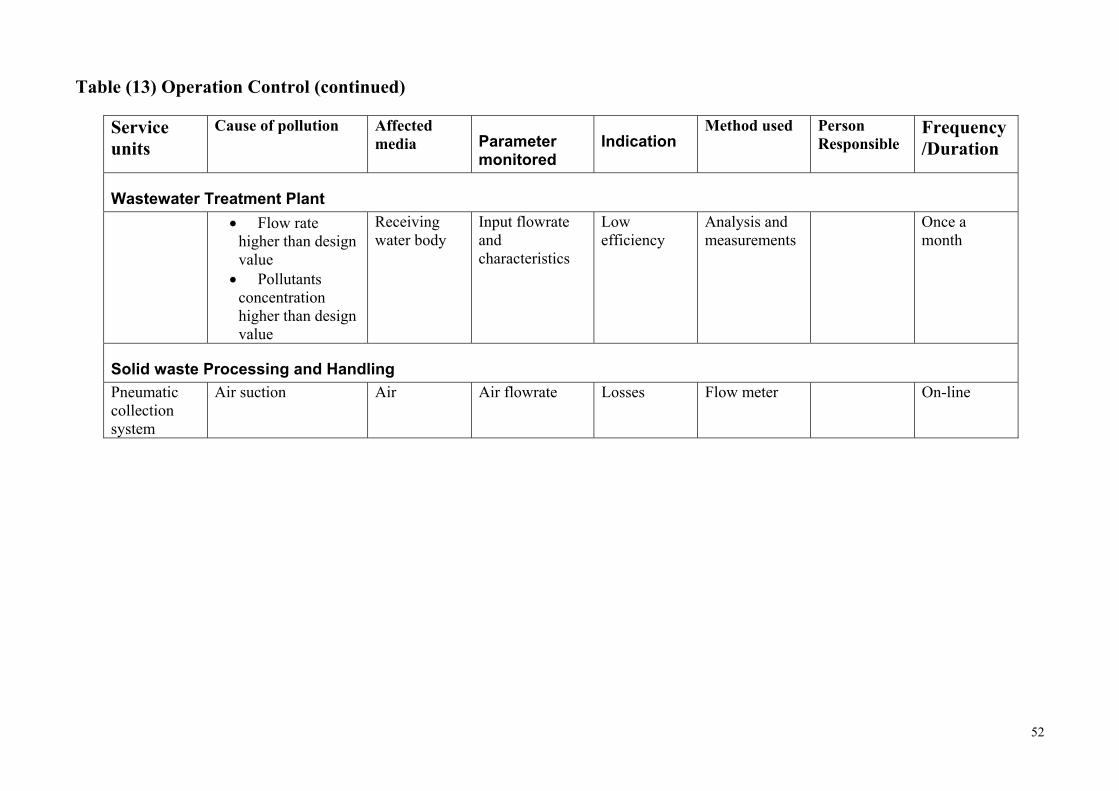
Table (13) Operation Control (continued)
Service units
Cause of pollution Affected media Parameter
monitored Indication
Method used Person Responsible
Frequency /Duration
Wastewater Treatment Plant • Flow rate
higher than design value • Pollutants
concentration higher than design value
Receiving water body
Input flowrate and characteristics
Low efficiency
Analysis and measurements
Once amonth
Solid waste Processing and Handling Pneumatic collection system
Air suction Air Air flowrate Losses Flow meter On-line
52
9.2 Planned maintenance
Maintenance can be classified broadly into planned and emergency maintenance. Various types of planned activities (preventive, predictive) are undertaken with the basic objective of avoiding the need for emergency (breakdown) maintenance and the corresponding loss of plant profitability. The cost of an unscheduled breakdown resulting in loss of production can be substantial, and the cost of repairs may also be considerably higher than the cost of routine, planned maintenance of the equipment. A preventive maintenance program must include the following basic elements: • Inventory of equipment with detailed design and operating parameters. The
operating parameters are monitored as indicators for predictive maintenance. • A record of failure rate and causes • Evaluation of condition of equipment using the following criteria:
- Maintenance cost per unit of product - Downtime due to maintenance - Percent of planned maintenance hours as compared with emergency
maintenance • Determination of corrective actions.
It is clear from the above paragraph that maintenance is a pollution prevention measure as it increases the efficiency of the unit, minimizes water consumption by preventing leaks, helps conserve energy through proper maintenance of electric and mechanical equipment as well as insulation of steam pipes. Table (14) includes examples of the parameters that can be monitored. The following are examples of typical maintenance procedures for some service units operated in chemical plants:
Compressors and refrigeration systems
Routine checking should include: • Testing for leaks • Checking refrigerant charge • Checking oil level and lubrication
Boilers, steam lines, heaters and dryers
There are many items to be checked to prevent explosion, such as checking operating procedures, detection of flame failure, detection of unburned combustibles. With respect to energy conservation, the maintenance of steam traps, steam valves and insulation of steam lines is important. The following parameters should be monitored: • Water level in the boiler • Water quality to prevent the build up of scales that reduce
heat transfer rates • Temperature of metal, gas and water • Pressure • Fuel to air ratio • Check the fuel supply for leaks • Check air supply for leaks • Check the flue gas temperature.
53
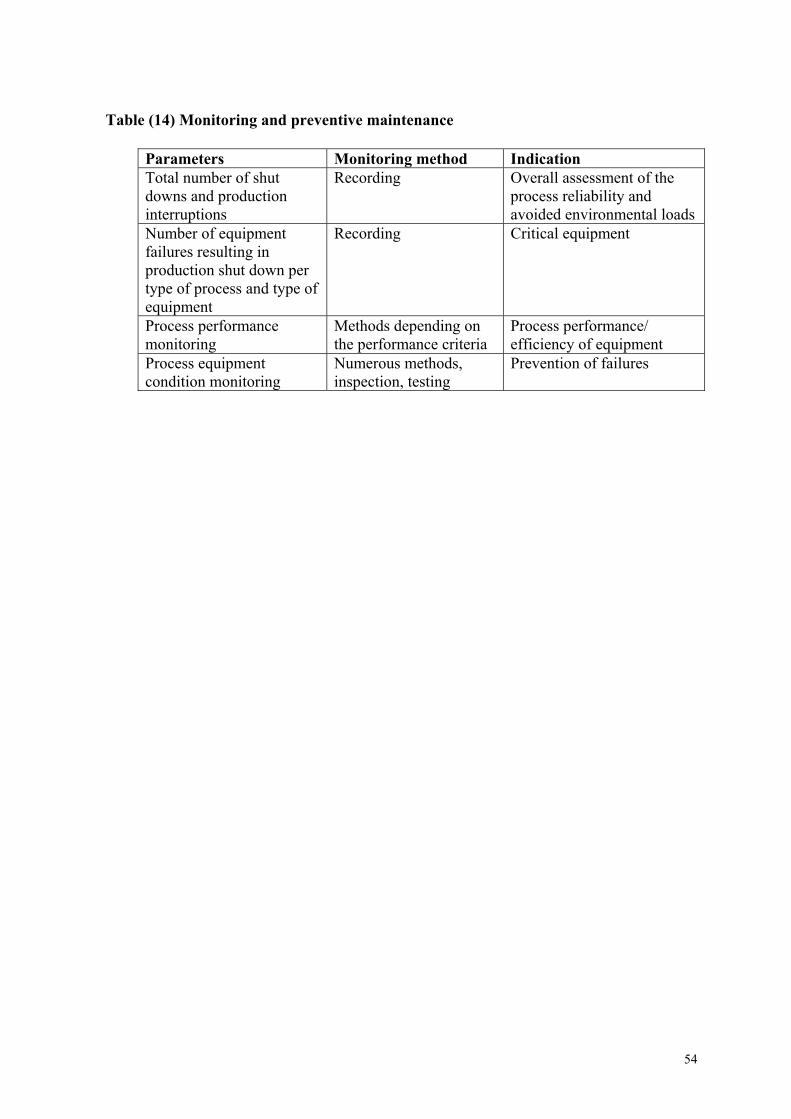
Table (14) Monitoring and preventive maintenance
Parameters Monitoring method Indication Total number of shut downs and production interruptions
Recording Overall assessment of the process reliability and avoided environmental loads
Number of equipment failures resulting in production shut down per type of process and type of equipment
Recording Critical equipment
Process performance monitoring
Methods depending on the performance criteria
Process performance/ efficiency of equipment
Process equipment condition monitoring
Numerous methods, inspection, testing
Prevention of failures
54
10. ENVIRONMENTAL MONITORING
Environmental monitoring covers emissions to air, effluent and solid and hazardous waste. Section 4 presents the various law and regulations that apply to emissions, effluents and wastes from the Milling industry. Expected pollutants and hazardous releases from the industry are specified in section 2.4, Table (4). For each production line related pollution aspects are identified in section 2.2, Figures 2 -4. The pollution aspects of service units are presented in section 2.3 and Figure 4. The output from the measurements and analysis of the parameters are recorded in the environmental register of the facility. Table (15) presents the compliance monitoring activities for the different aspects of pollution as per environmental laws. Monitoring of pollutants and releases requires careful consideration of the techniques being used because of the expected effect on the interpretation and hence, the reliability of the collected data. The common techniques used in environmental monitoring will be explained in next section.
10.1 Emission to air Air emissions can be measured either on periodical or continuous basis. Periodical measurements: Periodical measurements give the state of emissions over the chosen sampling time. Quantities needed in every emission calculation, such as volume flow, oxygen content and humidity of the fume, are determined by periodical measurements. Periodical measurement results are also used as a support for converting the continuous concentration measurement results into annual emissions. Periodical measurements are carried out as manual single measurements or as short period continuous measurements by the plant itself or by an exterior measurer. Periodical emission measurements are carried out annually for the following emission components: NOx,SO2, CO,CO2, Cl and particles. In all cases, it should be noted that regular maintenance, control and calibration are needed to obtain an acceptable measurement accuracy level.
Continuous measurements: The continuous measurements describe the temporal variation of the concentrations of the emission components during the operation. General requirements for continuous monitoring systems are that the sampling locations should be representative and that the monitoring equipment should be suitable for the concentrations to be monitored in the prevailing circumstances. The emission control data system should preferably be part of the process control system Sulfur dioxide, TRS, particles, carbon oxide are generally measured continuously. Emission calculation: Differences between the different calculation methods can cause mistakes when comparing the environmental loads of different plants. Material balance calculations are used to complete emission measurements in order to get an impression of the reliability of the measurement results as well as to create a general view of the total emission level of each component. The amount of diffuse emissions that can not be recorded by emission measurements can be substantial.
55
10.2 Effluents (wastewater) The regulations set the limits for the concentrations of specific pollutants of in wastewater when discharged to a recipient body. For monitoring purposes, the discharge values for specific substances or parameters are mostly expressed as total amounts per unit time. In some cases these values are given as specific amounts per ton of product or as purification efficiencies. Limit values are set for a large number of parameters such as COD/BOD5, TSS, phosphorus and nitrogen. Monitored control parameters: Typical wastewater control parameters include the following:
� Wastewater flow (Q), m3/d � Total suspended solids (TSS), mg/l � Temperature, ˚C � Chemical oxygen demand (CODCr) � Biological oxygen demand (BOD5) � Total nitrogen (N), mg/l � pH � Conductivity, mS/m
Flow measurement: Measuring of the total wastewater flow is required for the operation of the wastewater treatment plant. There have been no provisions on the procedures or the accuracy of a flow measurement, but installation of automatic composite samplers (preferable flow dependent) can be used. Wastewater flow is usually measured with venture measurement equipment, but also magnetic and ultrasonic methods are used. Measurement equipment is maintained several times a year and the measurement system is calibrated regularly. Regular maintenance, control and calibration are needed to obtain an acceptable measurement accuracy level. The structure of the measurement system, a possible mounting fault or a false choice for measurement area can cause errors. Other sources of error or factors disturbing the measurement are dirt deposition and temperature variations. Evaluation of the total error is extremely difficult, as it must include all these factors. Sampling: Well realized sampling is essential for determining of wastewater discharges. There are general instructions for wastewater sampling. However, industry-specific problems such as variation of the wastewater quality or flow rate have to be solved on case-by-case basis.
56
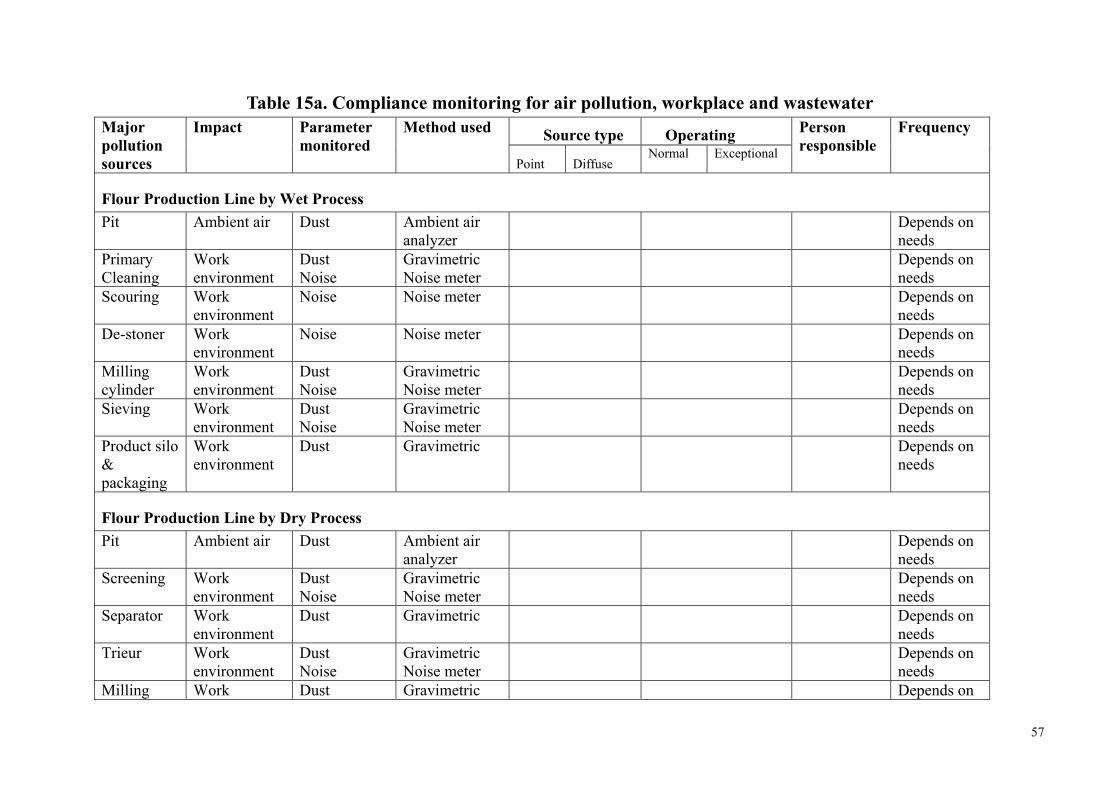
Table 15a. Compliance monitoring for air pollution, workplace and wastewater Source type Operating Major
pollution sources
Impact Parametermonitored
Method used
Point
DiffuseNormal Exceptional
Person responsible
Frequency
Flour Production Line by Wet ProcessPit Ambient air Dust Ambient air
analyzer Depends on
needs Primary Cleaning
Work environment
Dust Noise
Gravimetric Noise meter
Depends onneeds
Scouring Workenvironment
Noise Noise meter Depends on needs
De-stoner Workenvironment
Noise Noise meter Depends on needs
Milling cylinder
Work environment
Dust Noise
Gravimetric Noise meter
Depends onneeds
Sieving Workenvironment
Dust Noise
Gravimetric Noise meter
Depends onneeds
Product silo & packaging
Work environment
Dust Gravimetric Depends onneeds
Flour Production Line by Dry ProcessPit Ambient air Dust Ambient air
analyzer Depends on
needs Screening Work
environment Dust Noise
Gravimetric Noise meter
Depends onneeds
Separator Workenvironment
Dust Gravimetric Depends onneeds
Trieur Workenvironment
Dust Noise
Gravimetric Noise meter
Depends onneeds
Milling Work Dust Gravimetric Depends on
57
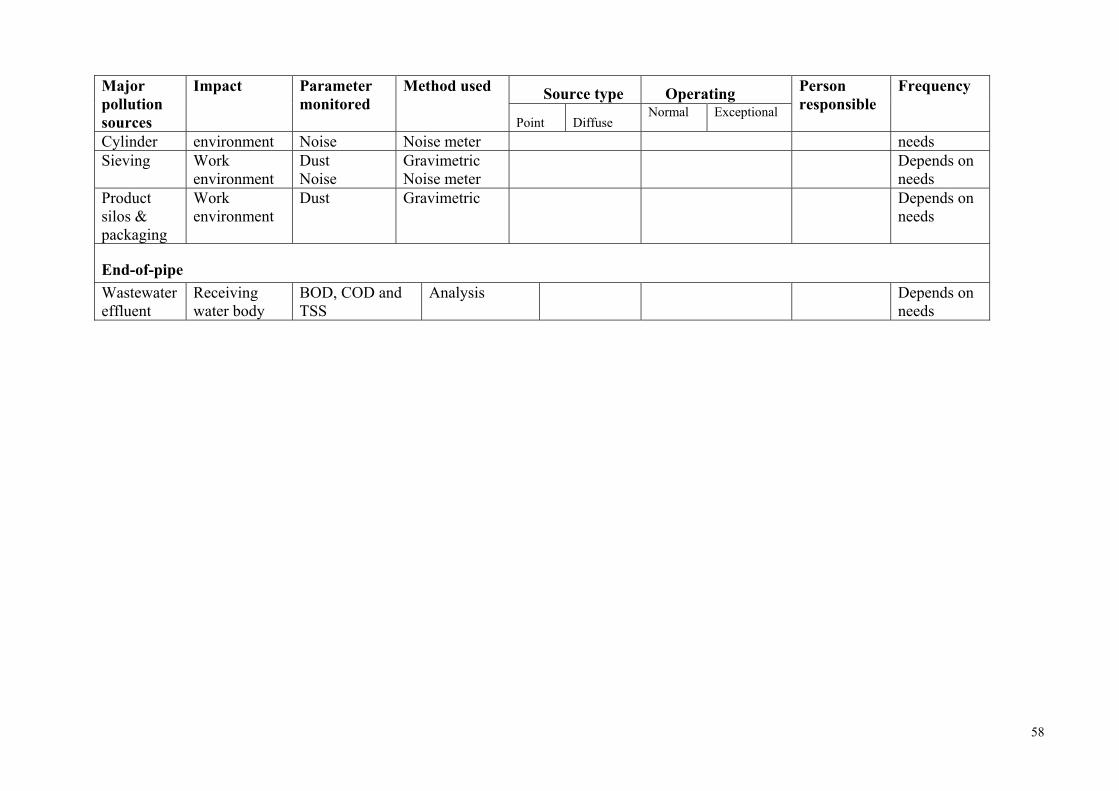
Source type Operating Major pollution sources
Impact
Parametermonitored
Method used
Point DiffuseNormal Exceptional
Person responsible
Frequency
Cylinder environment Noise Noise meter needsSieving Work
environment Dust
Noise Gravimetric Noise meter
Depends onneeds
Product silos & packaging
Work environment
Dust Gravimetric
Depends onneeds
End-of-pipeWastewater effluent
Receiving water body
BOD, COD and TSS
Analysis Depends onneeds
58
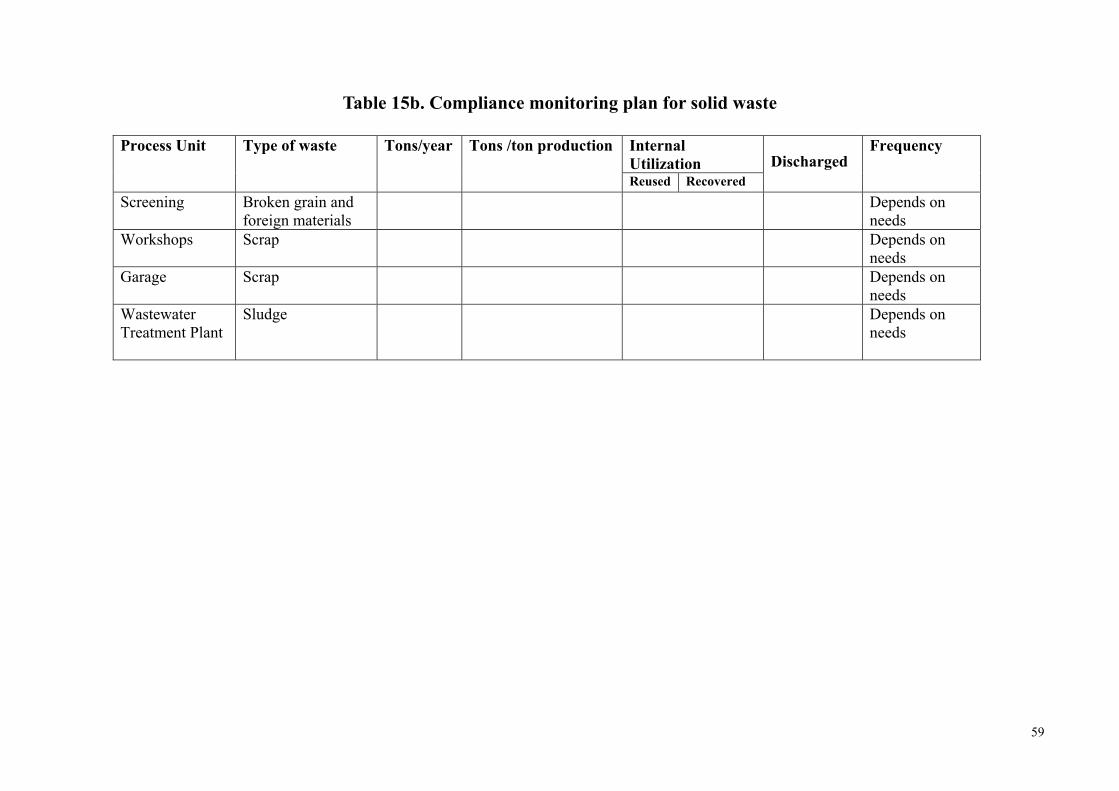
Table 15b. Compliance monitoring plan for solid waste
Internal Utilization
Process Unit
Type of waste Tons/year Tons /ton production
Reused Recovered Discharged
Frequency
Screening
Broken grain and foreign materials
Depends on needs
Workshops
Scrap Depends on needs
Garage
Scrap Depends on needs
Wastewater Treatment Plant
Sludge Depends on needs
59
Samples are either single grab samples, composite samples, or composite samples in proportion to the flow. A single grab sample reveals the composition of the wastewater at the sampling time. With several single samples it is possible to follow the wastewater load peaks, quality variation and the variation range of the significant parameters. A composite sample reveals the average composition over a chosen period. A 24-hour composite sample is normally taken in proportion to the flow so that the sampler is controlled by flow meter. Sampling period and sample size should be considered on case-by-case basis depending on the analyses used and on the issues affecting the reliability of sampling and analyses. Samples for wastewater analysis are mostly taken over 24 hours, 5-7 days a week. In some cases samples are frozen and combined to cover a longer period. Samples for COD and suspended solid determination are taken daily or continuously and analyzed daily. Samples for BOD and nutrient determination are usually taken weekly. pH and conductivity are usually measured continuously.
Analyses: A specific analysis program may be needed for each plant. The program usually covers a wide range of measurements and analyses, as predetermined in the self-monitoring plan. The measurements and analyses should be carried out according to the standards recommended by the authorities.
10
It is important to mention that in year 2000, EEAA/Central Laboratories developed a document detailing all the standard sampling and analysis techniques for wastewater.
Calculations: Wastewater discharges are calculated and reported as specified in the monitoring plan. Discharges are often calculated as below:
Discharge per day The arithmetic mean value of the daily samples taken during one month divided by the number of sampling days
Discharge per month Daily discharge multiplied by calendar days Discharge per year Sum of the values of monthly discharges
The efficiency of biological wastewater treatment is also controlled by calculating the reduction of organic matter (BOD, COD) between untreated wastewater before primary sedimentation and treated wastewater after secondary clarification. A typical wastewater discharge monitoring report includes e.g. monthly mean values and variations for discharges at the monitoring points before and after the treatment, applicable limit values and also some production information.
.3 Monitoring of solid waste The properties of solid wastes that are generated, especially when they are utilized or taken to a landfill, have to be investigated. The general principles in landfill operation are that the composition, leachability, long term behavior and the properties of the waste. The approval for using a landfill for a specific waste is based on the origin and the properties of the waste. The evaluation of the waste is based on the following: � The composition of the waste � The organic content and degradation properties of the waste, � The content and leachability of harmful compounds, and � The ecotoxicological effects of the waste and the landfill waters
60
11. DATA COLLECTION, PROCESSING AND USAGE
The general objective for the self-monitoring system is to produce data that is representative, repeatable, reliable, compatible and comparable. These characteristics are dependent on the applied measures for quality control and quality assurance throughout the data production chain i.e. volume determination, sampling, sample pretreatment, treatment and analysis, data processing and reporting.
11.1 Data collection and processing
The different parts of the monitoring system of a plant include diverse factors affecting the reliability and comparability of the emission data. These factors have to be taken into consideration in sampling, sample treatment and analysis as well as in processing and reporting of the data. Requirements for the whole data production chain should be set in the monitoring program. In addition, implementation of the relevant measures for quality control and quality assurance is extremely important in obtaining maximum reliability, repeatability and comparability. The aspects and parameters that are involved in data collection and processing are explained in the Annex A. Figure (8) shows the main aspects and parameters that affect the effectiveness of SM in terms of reliability, repeatability and comparability.
11.2 Using SM outputs
The implementation of the self-monitoring plan will basically result in three outputs: • Data and information about the facility • Preparing the environmental register as required by law. • Reports describing results of the self-monitoring and problems faced during
implementation • Feed back and decision making
11.2.1 Techniques for summarizing and illustrating data
It is best practice to record process and environmental information in a detailed archive or database. It can then be related easily to the monitoring results and used to evaluate, compare and manage aspects of process performance such as: • the rate of release of pollutants compared to production • the rate of generation of waste compared to production • the rate of consumption of energy and/or materials compared to production • the impacts on environmental receptors compared to production or to their
sensitivity • the overall resource efficiency of the process, i.e. production compared to
inputs or raw materials and energy, and outputs of pollutants and waste There are many techniques used in the interpretation of results (e.g. statistical analysis of the measurement results, reduction of operating conditions to normal conditions when monitoring gaseous emissions).
61
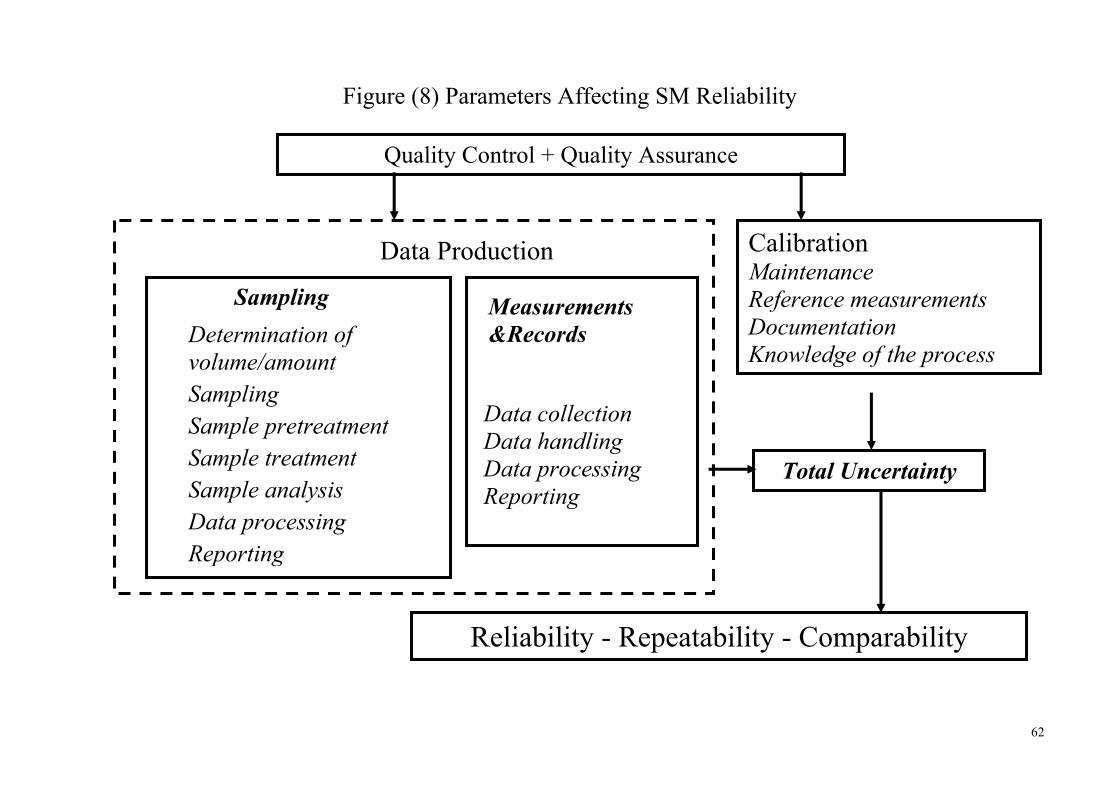
F
SamplingDetermination ofvolume/amount Sampling Sample pretreatmSample treatmenSample analysis Data processing Reporting
igure (8
Data
ent t
Qua
) Parameters Affecting S
Data collection Data handling Data processing Reporting
Production
Measurements &Records
Reliability - Rep
lity Control + Quality As
M Reliability
62
Total Uncertainty
Calibration Maintenance Reference measurements Documentation Knowledge of the process
eatability - Comparability
surance
11.2.2. Environmental register Only monitoring data related to compliance will be included in the environmental register. Description of the measuring and/or analytical techniques used should be reported as well as the location of sampling and measuring. EEAA/EPAP prepared a detailed description of the environmental register, based on the requirements of law 4/1994, see Annex B. The competent authorities could request the inspection of the measuring devices to check their operability and the maintenance record for these devices. The procedures for taking samples could also be checked by the inspector. The inspectors check whether the facility has provided information that is relevant and of sufficient quality. To assess compliance, a simple numerical or statistical comparison between the measurements, their uncertainty and the limit value is performed. According to Law 4/1994, compliance self-monitoring data should be recorded and kept for a minimum of 10 years.
11.2.3. Reporting Description of the reporting scheme, its content, recipient and purpose should be included in the self-monitoring plan. A monitoring report is a uniform presentation of data over a fixed period. An annual monitoring report that provides information of the past calendar year is always required. Shorter period reports are required for significant polluters. The conditions of the process and equipment as well as location of monitoring points should be specified. Reporting can be: • Internal to inform management and raise the environmental awareness of the
facility personnel. It should include problems met during the implementation of the SM plan to be used in decision making. • External for the competent authority based on the environmental register,
establishments are required to report on environmental violations.
11.2.4. Internal auditing and conclusions on results The data obtained must be compared regularly with the objectives written down in the monitoring program to check that they are being met.
11.2.5. Feedback and decision making Feedback on the assessment of compliance based on the monitoring results should include all parties involved with the monitoring activities. The participants should make the necessary improvements and corrections to the next monitoring program. In those parts of the monitoring program where compliance is met, possible reduction in frequency of monitoring can be considered and instead move resources to parts that need more accurate monitoring, e.g. borderline or non-compliance situations. Feedback should include all parts of the monitoring program, process, product control, maintenance, environmental management and occupational safety. Detailed requirements should be set for the improvements needed and a date fixed for their implementation.
63
11.2.6. Using outputs in public relations The monitoring data is refined and distributed to the end users such as national and international reporting, research and statistical purposes, citizens, and the media. The citizens have the right to present complaints about the health or environmental impacts caused by the operation these complaints are directed to the permitting and supervising authority. Monitoring data is needed e.g. in national research and statistics, for planning and evaluation purposes, by national group organizations and the media.
64
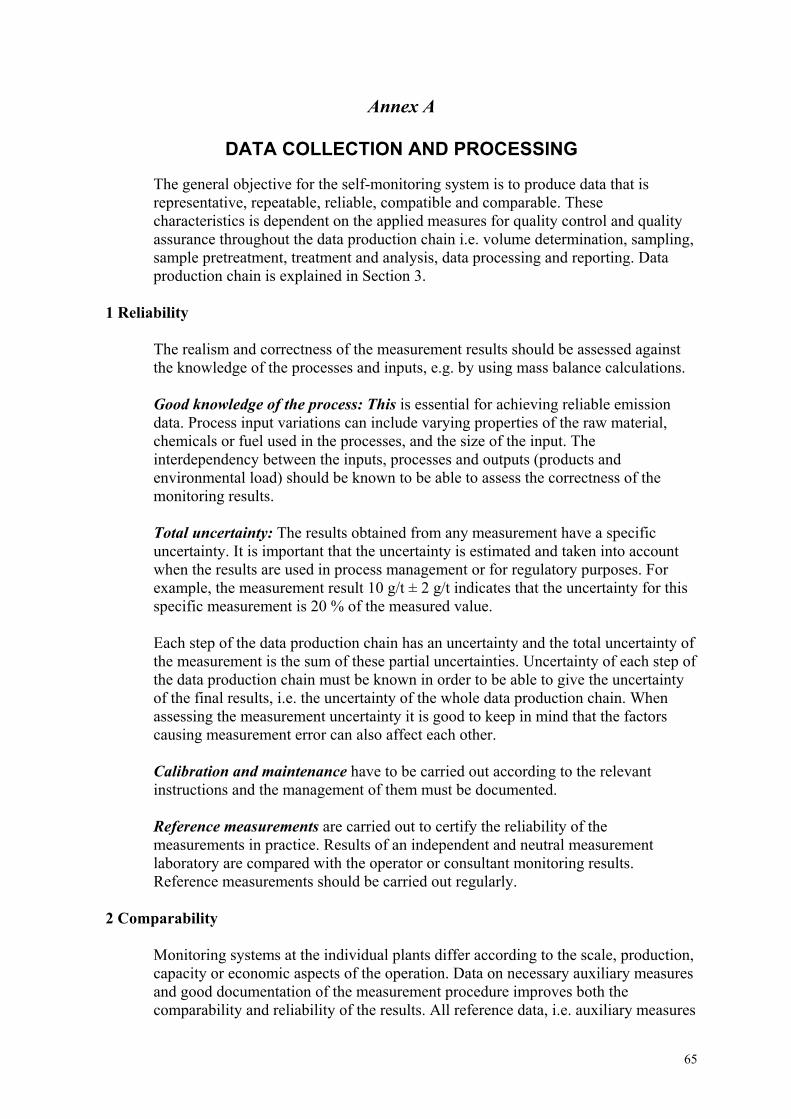
Annex A
DATA COLLECTION AND PROCESSING
The general objective for the self-monitoring system is to produce data that is representative, repeatable, reliable, compatible and comparable. These characteristics is dependent on the applied measures for quality control and quality assurance throughout the data production chain i.e. volume determination, sampling, sample pretreatment, treatment and analysis, data processing and reporting. Data production chain is explained in Section 3.
1 Reliability
The realism and correctness of the measurement results should be assessed against the knowledge of the processes and inputs, e.g. by using mass balance calculations. Good knowledge of the process: This is essential for achieving reliable emission data. Process input variations can include varying properties of the raw material, chemicals or fuel used in the processes, and the size of the input. The interdependency between the inputs, processes and outputs (products and environmental load) should be known to be able to assess the correctness of the monitoring results. Total uncertainty: The results obtained from any measurement have a specific uncertainty. It is important that the uncertainty is estimated and taken into account when the results are used in process management or for regulatory purposes. For example, the measurement result 10 g/t ± 2 g/t indicates that the uncertainty for this specific measurement is 20 % of the measured value.
Each step of the data production chain has an uncertainty and the total uncertainty of the measurement is the sum of these partial uncertainties. Uncertainty of each step of the data production chain must be known in order to be able to give the uncertainty of the final results, i.e. the uncertainty of the whole data production chain. When assessing the measurement uncertainty it is good to keep in mind that the factors causing measurement error can also affect each other. Calibration and maintenance have to be carried out according to the relevant instructions and the management of them must be documented. Reference measurements are carried out to certify the reliability of the measurements in practice. Results of an independent and neutral measurement laboratory are compared with the operator or consultant monitoring results. Reference measurements should be carried out regularly.
2 Comparability
Monitoring systems at the individual plants differ according to the scale, production, capacity or economic aspects of the operation. Data on necessary auxiliary measures and good documentation of the measurement procedure improves both the comparability and reliability of the results. All reference data, i.e. auxiliary measures
65
and reference data (inputs and outputs) should be clearly defined in the monitoring program or permit according to the nationally and internationally used standards and guidelines.
3 Data Production Chain
The different parts of the monitoring system of a plant include diverse factors affecting the reliability and comparability of the emission data. These factors have to be taken into consideration in sampling, sample treatment and analysis as well as in processing and reporting of the data. Requirements for the whole data production chain should be set in the monitoring program. Data Production Chain: The data production chain includes the following phases: • Determination of volume/amount • Sampling • Sample pretreatment • Sample treatment • Sample analysis • Data processing • Reporting
Determination of volume/amount: The accuracy of determination of the volume of the release has a substantial impact on magnitude of the total emissions. Variations in the volume measurement results can be caused either by variations in the flow of the emission or in the accuracy of the measurement. Measurement of volume flow or amount of the emission can be continuous, periodic or single.
Sampling: Continuous emission analysis includes sampling, sample pretreatment, sample treatment and analysis. Variations in the process or emission treatment affect also the quantity and quality of the sample. Both sampling conditions and the sampling point must be representative. Measurement of emission concentration can be continuous, periodic or single. The sample must be representative in relation to the measurement point, emission flow/amount, sampling period and time period. Sample pretreatment: Sample pretreatment includes all treatment of the sample before it is taken to the laboratory. The need for sample pretreatment is determined by the needs to protect the substance to be determined from any changes before analysis. Usually the appropriate pretreatment method is presented in the standards. Sample treatment: Sample treatment includes operations in the laboratory before analysis, such as dilution, concentration, pH adjustment, adding of reagents. Sample treatment is usually carried out according to standards or specific method instructions. The treatment methods used should be documented. Sample analysis: Sample analysis includes physical, chemical or biological determination of the parameter. Figures presented in emission reporting are not always comparable, without describing the analysis methods used.
66
Data processing: The calculation methods for the emission data are process specific and their function is to give as true load data for the specific process as possible. The correspondences of the equations to the reality must be checked from time to time and automatically in cases of any changes having an impact on them. The following general rules for emission calculation need to be determined and used nationally to harmonize the methods: • calculation methods for the peak of an hour, calendar day, monthly/annual
means • amount of emission data needed for calculation of the annual mean of the
emission • exceeding times, i.e. percentage of time of the exceptional emissions of the
total operation time • utilization rate for the continuous measurements, i.e. percentage of time
during which the measurement system has not been available of the total operation time • calculation formulas used for data conversion into reference conditions • conversion factors used for data conversion between different units • calculation methods for total emissions over a certain period
Reporting: Data reporting should include sufficient data on the parameters, pollutants and other measures that are defined in the monitoring plan. The data to be reported should be presented in the form required with all the additional information and documentation. A monitoring report is a uniform presentation of the emission data over a fixed period. An annual monitoring report-providing information of the past calendar year is always required. In case of large industrial sites, shorter period reports are demanded (a monthly report or a report over 3, 4 or 6 months). Emission data must be presented in a form easy to compare with the given emission limits. The following data is needed for reporting: • The emission parameters and pollutants are reported with all the relevant the
reference parameters, auxiliary measures and uncertainties expressed as required in the monitoring program in one or more of the following forms:
- Specific emissions (ton / ton of production): used for assessing performance
or efficiency - Total emissions (t/ year) : used for assessing the environmental load - Concentration (mg / m3, PPM, % O2): used for e.g. operation control - Flow rate (m/s): used for e.g. velocity/rate for flue gas/effluent - Residence time (s): used e.g. for assessing completeness of combustion - Temperature (0C): requirements for controlling certain exhaust pollutants. - Heat (W): thermal stress in the recipient - The exceptional and diffuse emissions are included in the total emissions of
the period.
67
• Operation control data should be available to the authority. • Utilization rate of the measurement system is expressed e.g. as percentage of
the process operation time. • Documentation of the reference measurements.
4 Quality control and quality assurance
Quality control is a system of routine technical activities to measure and control the quality of monitoring data as it is being produced. QC includes e.g. checking of equipment, methods and procedures, and that the monitoring system is regularly calibrated and maintained. The relevant instruments personnel and analytical laboratories should be certified under recognized schemes. Quality assurance includes a system of reviewing the implementation of the quality system by personnel not directly involved in the monitoring process. QA reviews verify that the quality objectives are met and ensures that the monitoring carried out represents the best available results. Guidelines for the below listed factors help to harmonize the practical factors at site level. The monitoring plan can determine the listed factors even in details. If the plant or the laboratory uses a sub-supplier in any step of the data production chain, the competence of the sub-supplier has to be checked, too. Quality system work involves the following processes: Data production chain Maintenance and calibration Certification and Accreditation
68
Annex B
REGISTER OF ENVIRONMENTAL CONDITION
General Information: • Name: • Address: • Contact Person: • Position: • Time Period covered by the current data:
General Description of the facility:
• Industrial Sector: • Actual Production: • Production Capacity: • Products: • Capital Investment: • Annual Turnover: • Number of Employees: • Year of Start of Operations: • Major Renovations:
Location:
• The location of the plant shown on a map describing also neighboring areas.
• Layout describing the location of the building, unit processes, storage areas and other parts of the plants of wastewater and air emission points to be shown on the layout.
• The maps should also show types of the surrounding and sensitive areas (Hospitals, Schools, Settlements, Parks).
Raw Materials:
• Use of raw materials & auxiliary materials (ton/year) • Opening times for processes shall be reported as follows:
1. Annual average operating time (days/year or hour/year) 2. Weekly operating time and operating days per week 3. Daily operating time and shifts per day 4. Possible daily or seasonal variations
• Maximum amounts of each kept in storage • Describe storage area • Danger substance:
69
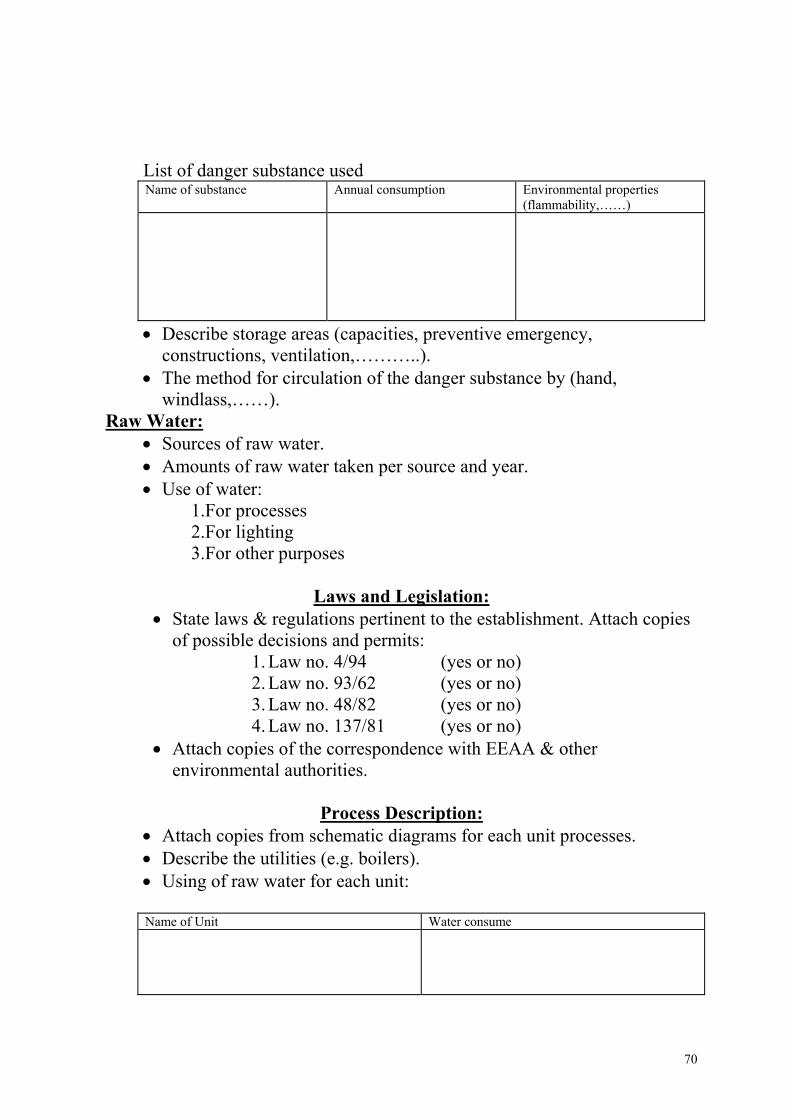
List of danger substance used Name of substance Annual consumption Environmental properties
(flammability,……)
• Describe storage areas (capacities, preventive emergency, constructions, ventilation,………..).
• The method for circulation of the danger substance by (hand, windlass,……).
Raw Water: • Sources of raw water. • Amounts of raw water taken per source and year. • Use of water:
1.For processes 2.For lighting 3.For other purposes
Laws and Legislation:
• State laws & regulations pertinent to the establishment. Attach copies of possible decisions and permits:
1. Law no. 4/94 (yes or no) 2. Law no. 93/62 (yes or no) 3. Law no. 48/82 (yes or no) 4. Law no. 137/81 (yes or no)
• Attach copies of the correspondence with EEAA & other environmental authorities.
Process Description:
• Attach copies from schematic diagrams for each unit processes. • Describe the utilities (e.g. boilers). • Using of raw water for each unit:
Name of Unit Water consume
70
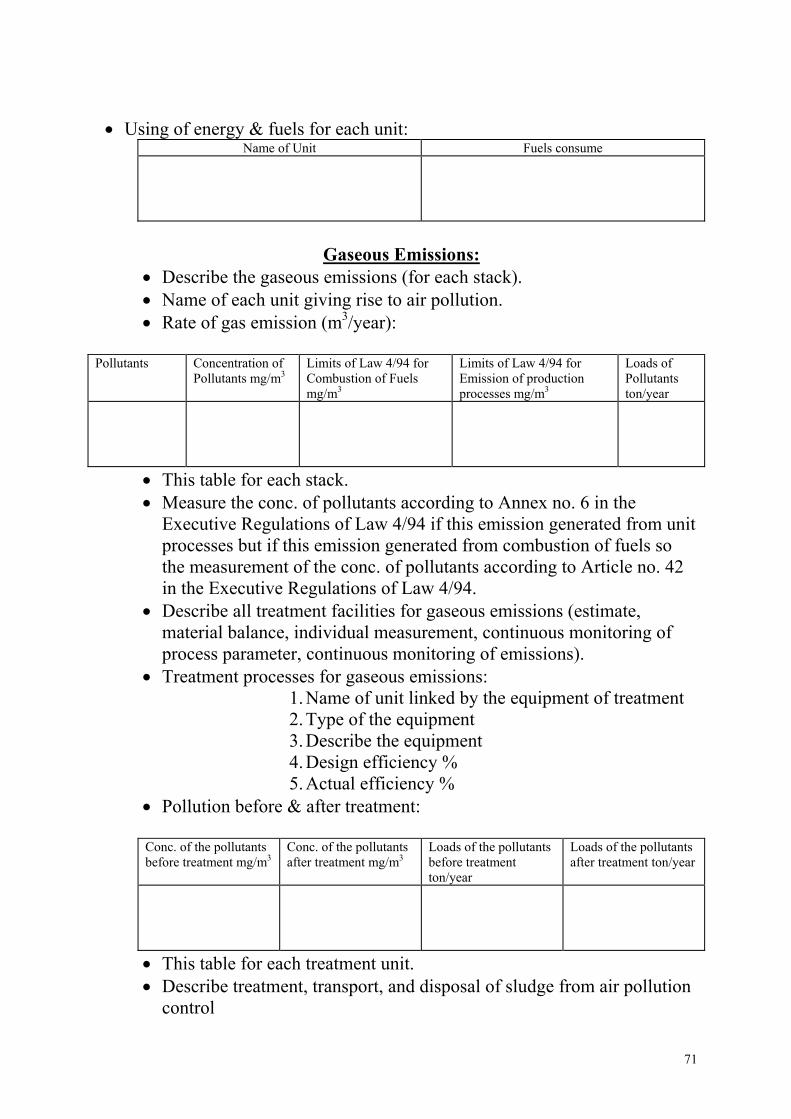
• Using of energy & fuels for each unit:
Name of Unit Fuels consume
Gaseous Emissions:
• Describe the gaseous emissions (for each stack). • Name of each unit giving rise to air pollution. • Rate of gas emission (m3/year):
Pollutants Concentration of Pollutants mg/m3
Limits of Law 4/94 for Combustion of Fuels mg/m3
Limits of Law 4/94 for Emission of production processes mg/m3
Loads of Pollutants ton/year
• This table for each stack. • Measure the conc. of pollutants according to Annex no. 6 in the
Executive Regulations of Law 4/94 if this emission generated from unit processes but if this emission generated from combustion of fuels so the measurement of the conc. of pollutants according to Article no. 42 in the Executive Regulations of Law 4/94.
• Describe all treatment facilities for gaseous emissions (estimate, material balance, individual measurement, continuous monitoring of process parameter, continuous monitoring of emissions).
• Treatment processes for gaseous emissions: 1. Name of unit linked by the equipment of treatment 2. Type of the equipment 3. Describe the equipment 4. Design efficiency % 5. Actual efficiency %
• Pollution before & after treatment:
Conc. of the pollutants before treatment mg/m3
Conc. of the pollutants after treatment mg/m3
Loads of the pollutants before treatment ton/year
Loads of the pollutants after treatment ton/year
• This table for each treatment unit. • Describe treatment, transport, and disposal of sludge from air pollution
control
71
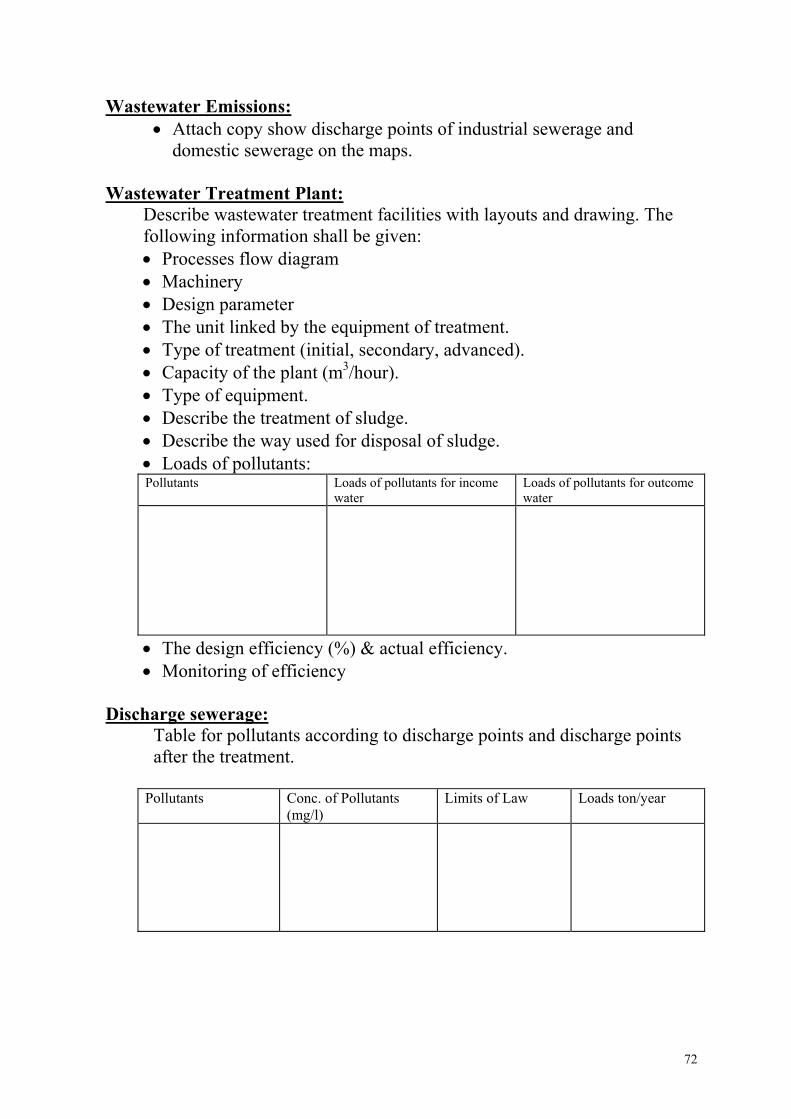
Wastewater Emissions: • Attach copy show discharge points of industrial sewerage and
domestic sewerage on the maps. Wastewater Treatment Plant:
Describe wastewater treatment facilities with layouts and drawing. The following information shall be given: • Processes flow diagram • Machinery • Design parameter • The unit linked by the equipment of treatment. • Type of treatment (initial, secondary, advanced). • Capacity of the plant (m3/hour). • Type of equipment. • Describe the treatment of sludge. • Describe the way used for disposal of sludge. • Loads of pollutants: Pollutants Loads of pollutants for income
water Loads of pollutants for outcome water
• The design efficiency (%) & actual efficiency. • Monitoring of efficiency
Discharge sewerage:
Table for pollutants according to discharge points and discharge points after the treatment.
Pollutants Conc. of Pollutants
(mg/l) Limits of Law Loads ton/year
72
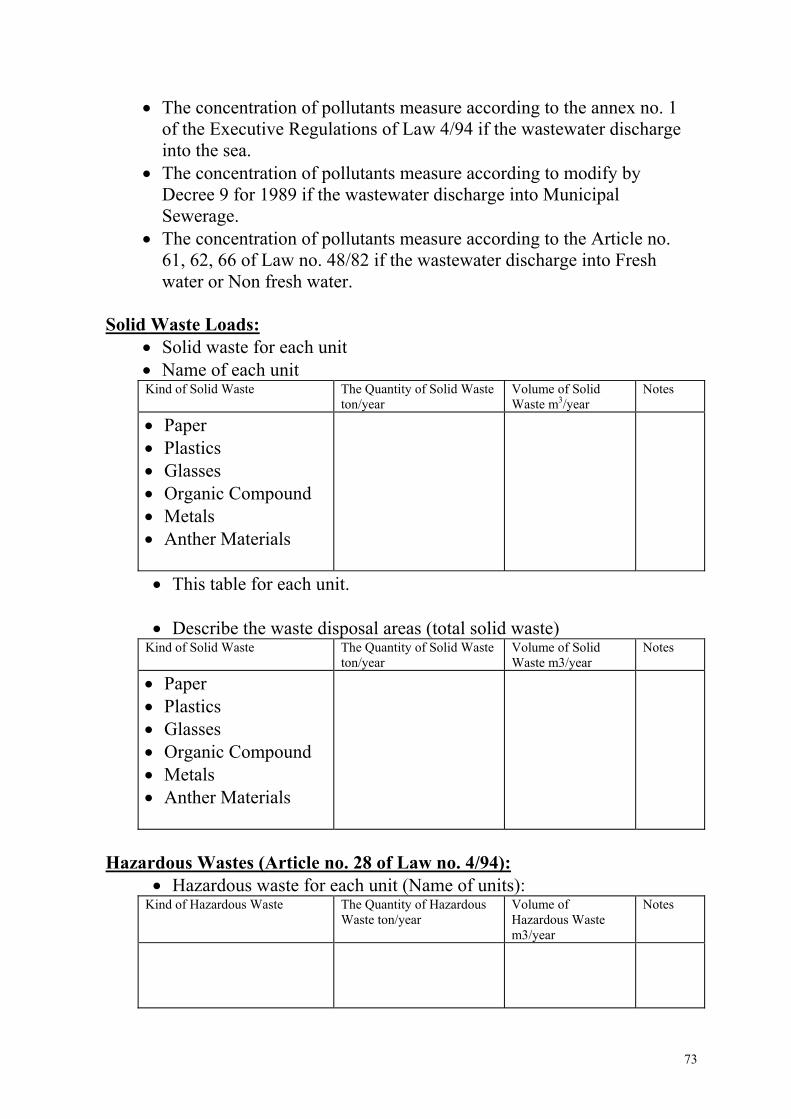
• The concentration of pollutants measure according to the annex no. 1 of the Executive Regulations of Law 4/94 if the wastewater discharge into the sea.
• The concentration of pollutants measure according to modify by Decree 9 for 1989 if the wastewater discharge into Municipal Sewerage.
• The concentration of pollutants measure according to the Article no. 61, 62, 66 of Law no. 48/82 if the wastewater discharge into Fresh water or Non fresh water.
Solid Waste Loads:
• Solid waste for each unit • Name of each unit Kind of Solid Waste The Quantity of Solid Waste
ton/year Volume of Solid Waste m3/year
Notes
• Paper • Plastics • Glasses • Organic Compound • Metals • Anther Materials
• This table for each unit.
• Describe the waste disposal areas (total solid waste) Kind of Solid Waste The Quantity of Solid Waste
ton/year Volume of Solid Waste m3/year
Notes
• Paper • Plastics • Glasses • Organic Compound • Metals • Anther Materials
Hazardous Wastes (Article no. 28 of Law no. 4/94):
• Hazardous waste for each unit (Name of units): Kind of Hazardous Waste The Quantity of Hazardous
Waste ton/year Volume of Hazardous Waste m3/year
Notes
73
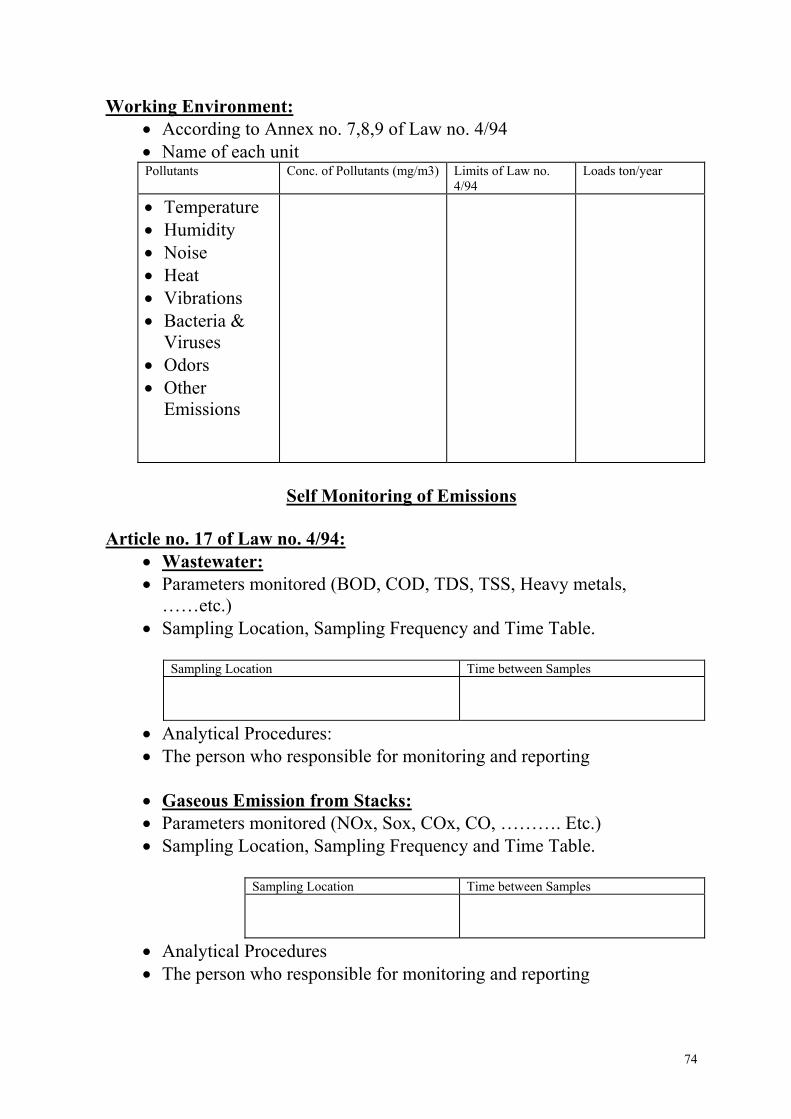
Working Environment: • According to Annex no. 7,8,9 of Law no. 4/94 • Name of each unit Pollutants Conc. of Pollutants (mg/m3) Limits of Law no.
4/94 Loads ton/year
• Temperature • Humidity • Noise • Heat • Vibrations • Bacteria &
Viruses • Odors • Other
Emissions
Self Monitoring of Emissions
Article no. 17 of Law no. 4/94:
• Wastewater: • Parameters monitored (BOD, COD, TDS, TSS, Heavy metals,
……etc.) • Sampling Location, Sampling Frequency and Time Table.
Sampling Location Time between Samples
• Analytical Procedures: • The person who responsible for monitoring and reporting
• Gaseous Emission from Stacks: • Parameters monitored (NOx, Sox, COx, CO, ………. Etc.) • Sampling Location, Sampling Frequency and Time Table.
Sampling Location Time between Samples
• Analytical Procedures • The person who responsible for monitoring and reporting
74
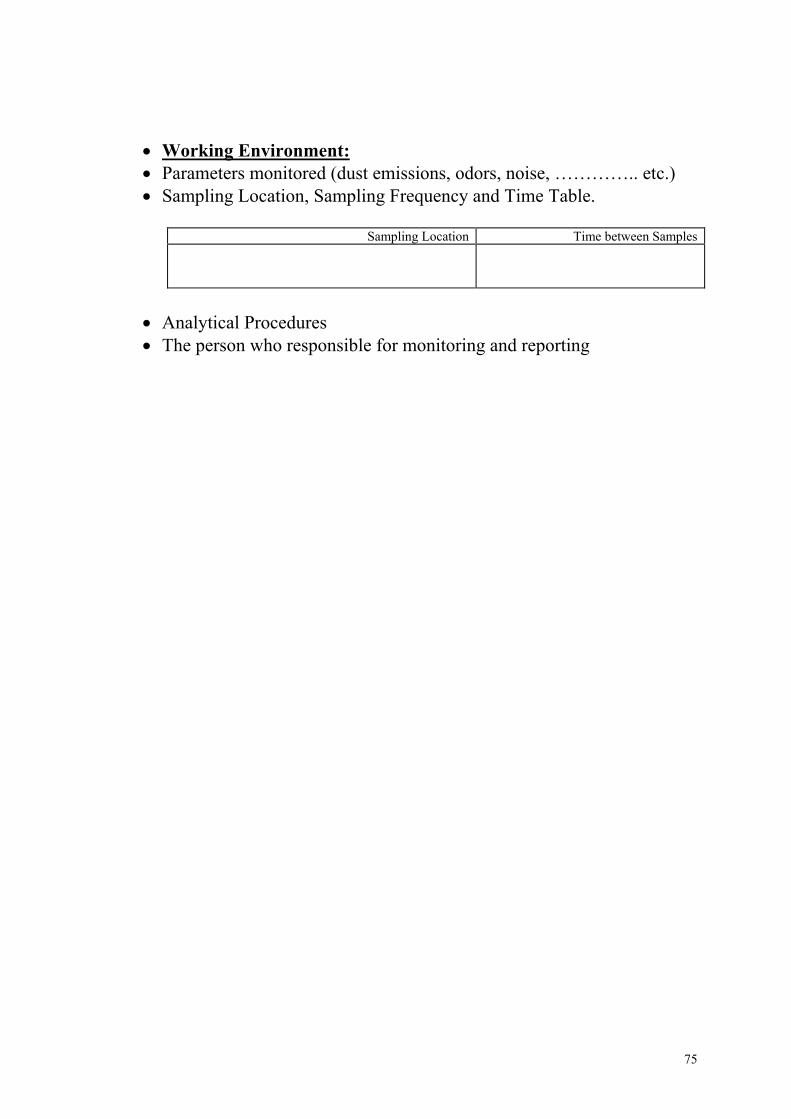
• Working Environment: • Parameters monitored (dust emissions, odors, noise, ………….. etc.) • Sampling Location, Sampling Frequency and Time Table.
Sampling Location Time between Samples
• Analytical Procedures • The person who responsible for monitoring and reporting
75
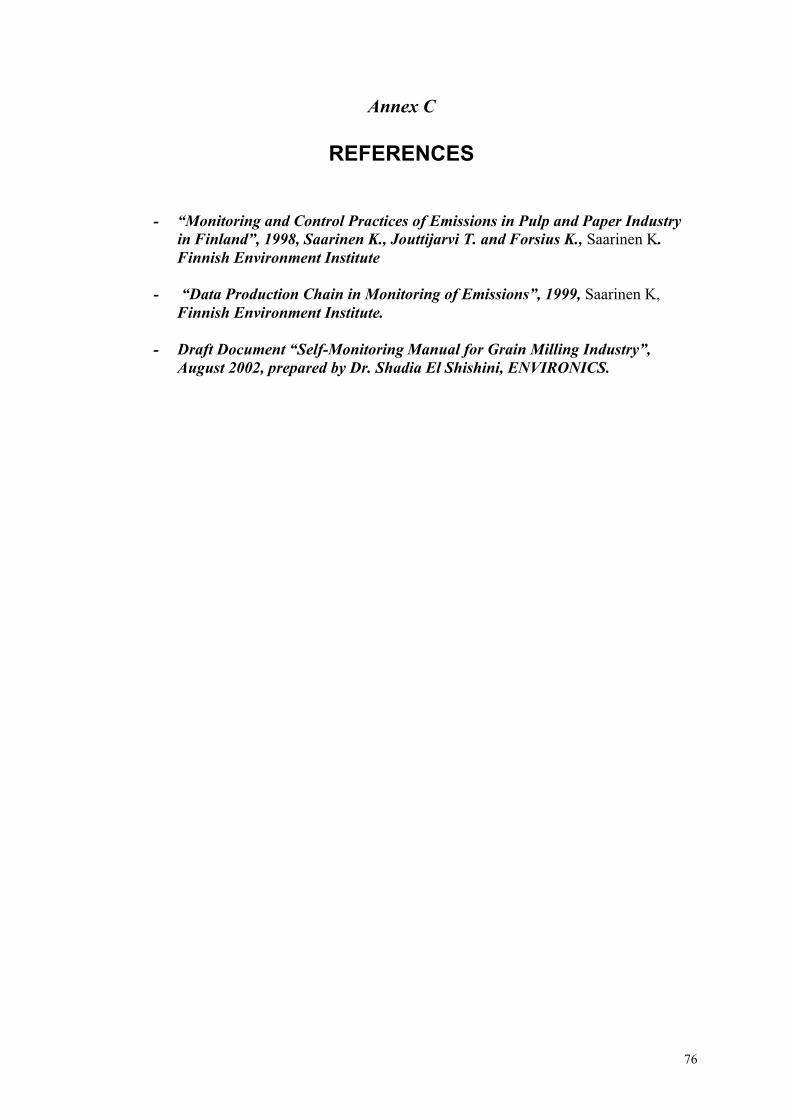
76
Annex C
REFERENCES
- “Monitoring and Control Practices of Emissions in Pulp and Paper Industry
in Finland”, 1998, Saarinen K., Jouttijarvi T. and Forsius K., Saarinen K. Finnish Environment Institute
- “Data Production Chain in Monitoring of Emissions”, 1999, Saarinen K,
Finnish Environment Institute. - Draft Document “Self-Monitoring Manual for Grain Milling Industry”,
August 2002, prepared by Dr. Shadia El Shishini, ENVIRONICS.