GRAIL: GNSS Introduction in the RAIL sector · 1.2 31/07/2007 All Incorporates GSA reviewer...
27
Project funded by the European GNSS Supervisory Authority 6FP 2 nd Call. Area 1A: User Segment, User Community Contract: GJU/05/2409/CTR/GRAIL GRAIL: GNSS Introduction in the RAIL sector Cost Benefit Analysis Issue 1.0 Date 08/08/2007 Number of pages 27 Classification Public Document Reference Project Work package Partner Nature Number GRAIL WP7 ESY DEL 01 Partner reference (optional) 2005496-01 Responsible Name/Company Signature Date Author B Jenkins / ESYS 31/07/07 WP Leader MJ García Prieto / TIFSA 31/07/07 Project coordinator Alvaro Urech / TIFSA 31/07/07 GSA Project Officer Stefano Scarda 31/07/07
Transcript of GRAIL: GNSS Introduction in the RAIL sector · 1.2 31/07/2007 All Incorporates GSA reviewer...

Project funded by the European GNSS Supervisory Authority 6FP 2nd Call. Area 1A: User Segment, User Community
Contract: GJU/05/2409/CTR/GRAIL
GRAIL: GNSS Introduction in the RAIL sector
Cost Benefit Analysis
Issue 1.0 Date 08/08/2007
Number of pages 27 Classification Public
Document Reference
Project Work package Partner Nature Number
GRAIL WP7 ESY DEL 01
Partner reference (optional)
2005496-01
Responsible Name/Company Signature Date
Author B Jenkins / ESYS 31/07/07
WP Leader MJ García Prieto / TIFSA 31/07/07
Project coordinator Alvaro Urech / TIFSA 31/07/07
GSA Project Officer Stefano Scarda 31/07/07

Ref: GRAIL-WP7-ESY-DEL-711
Issue: 1.0 Date: 08/08/07
Cost Benefit Analysis
Class: Public Page 2 / 27
GRAIL: GNSS Introduction in the RAIL sector GSA Contract Number: GJU/05/2409/CTR/GRAIL
DOCUMENT CHANGE LOG
Issue Date Affected Sections Comments
0.1 07/06/2007 All First draft
1.0 15/06/2007 All Review by coordinator
1.1 18/06/2007 All Includes single GNSS UT option
1.2 31/07/2007 All Incorporates GSA reviewer comments
1.0 08/08/2007 All First approved version
DOCUMENT DISTRIBUTION
To/cc Organisation Name
To GSA Stefano Scarda
To INECO Alvaro Urech
To TIFSA Mª José García
To ANSALDO-CSEE Celso Prados
To ALSTOM Michel Rousseau
To SIEMENS Klaus Jaschke
To DIMETRONIC Beatriz Muñoz
To THALES RSS Karl Brocke
To BOMBARDIER Georg Mandelka
To THALES ALENIA SPACE Lucio Foglia
To CEDEX Daniel Molina
To RSSB Martyn Thomas
To DLR Michael Meyer zu Hoerste
To ADIF Javier Vicente
To Deimos Space Antonio Fernández
To ESSP Umberto Guida
To ESYS Bryan Jenkins
To IIASL Frans von der Dunk
To Indra Espacio Carlos Álvarez
To NSL William Roberts

Ref: GRAIL-WP7-ESY-DEL-711
Issue: 1.0 Date: 08/08/07
Cost Benefit Analysis
Class: Public Page 3 / 27
GRAIL: GNSS Introduction in the RAIL sector GSA Contract Number: GJU/05/2409/CTR/GRAIL
TABLE OF CONTENTS
1 INTRODUCTION......................................................................................................... 5 1.1 Purpose ........................................................................................................................5 1.2 Intended audience / Classification................................................................................ 5 1.3 Associated documentation ........................................................................................... 5 1.4 Abbreviations and Acronyms........................................................................................ 5
2 THE CBA SCENARIO................................................................................................. 7 2.1 The Enhanced Odometry application definition............................................................ 7 2.2 The scenario for the CBA ........................................................................................... 10
3 CBA ASSUMPTIONS................................................................................................ 12 3.1 Baseline information and assumptions ....................................................................... 12
4 COST BENEFIT ANALYSIS - APPROACH .............................................................. 14 4.1 General ....................................................................................................................... 14 4.2 Costs ..........................................................................................................................14 4.2.1 Operating company ............................................................................................. 14 4.2.2 Infrastructure company........................................................................................ 15
4.3 Benefits.......................................................................................................................16 4.3.1 Operating company ............................................................................................. 16 4.3.2 Infrastructure company........................................................................................ 16
5 COST BENEFIT ANALYSIS – RESULTS ................................................................. 17 5.1 Costs ..........................................................................................................................17 5.2 Benefits.......................................................................................................................18 5.3 Net Present Value ...................................................................................................... 19 5.4 Results of single UT option......................................................................................... 20
6 CONCLUSIONS........................................................................................................ 21 APPENDIX 1- DETAILS OF RAIL NETWORK AND TRAINS..................................................... 22
Company structure ............................................................................................................... 22 Train details .......................................................................................................................... 22 Details of Madrid Lleida line ................................................................................................. 23 Signalling system details ......................................................................................................23
APPENDIX 2 - COST BENEFIT ANNUALISED RESULTS........................................................ 24

Ref: GRAIL-WP7-ESY-DEL-711
Issue: 1.0 Date: 08/08/07
Cost Benefit Analysis
Class: Public Page 4 / 27
GRAIL: GNSS Introduction in the RAIL sector GSA Contract Number: GJU/05/2409/CTR/GRAIL
LIST OF TABLES
Table 2-1 Schedule for introduction of trains .................................................................................. 10 Table 2-2 Modification schedule .................................................................................................... 11 Table 5-1 Range of NPV values .................................................................................................... 19 Table 5-2 Range of NPV values for single UT option .................................................................... 20 Table App2-1 Operating company costs........................................................................................ 24 Table App2-2 Infrastructure costs.................................................................................................. 25 Table App2-3 Total costs ............................................................................................................... 25 Table App2-4 Operating company benefits ................................................................................... 26 Table App2-5 Infrastructure company benefits .............................................................................. 26 Table App2-6 Total benefits........................................................................................................... 27 Table App2-7 Net benefits and Net Present Values (NPV) ........................................................... 27
LIST OF FIGURES
Figure 2-1 Context level diagram of the Enhanced Odometry system ............................................. 9 Figure 2-2: Data flow between GNSS subsystem and on board ETCS. ........................................... 9 Figure 2-3 Interface between GNSS User Terminal and the ETCS system ................................... 10 Figure 5-1 Annualised costs for operating company....................................................................... 17 Figure 5-2 Make up of costs for most likely case........................................................................... 18 Figure 5-3 Operating company benefits.......................................................................................... 18 Figure 5-4 Annualised net benefits ................................................................................................. 19 Figure 5-5: Annualised net benefits for single UT option ............................................................... 20

Ref: GRAIL-WP7-ESY-DEL-711
Issue: 1.0 Date: 08/08/07
Cost Benefit Analysis
Class: Public Page 5 / 27
GRAIL: GNSS Introduction in the RAIL sector GSA Contract Number: GJU/05/2409/CTR/GRAIL
1 INTRODUCTION
1.1 Purpose
This Cost Benefit Analysis (CBA) is the first iteration of the CBA based on the Enhanced Odometry technology defined in Work Package 3 and applied to a high speed rail network in Spain. It is the first CBA deliverable from Work Package 7.1. A second and final iteration will be produced at the end of the project.
1.2 Intended audience / Classification
The final iteration of this document is intended as a guide for the use of rail operators, rail infrastructure companies and equipment suppliers considering the use of GNSS technology as an integral part of the ERTMS/ETCS system on their trains. Consequently, it is intended for public consumption.
1.3 Associated documentation
[1] GRAIL Contract: GJU/05/2409/CTR/GRAIL
[2] GRAIL Consortium Agreement
[3] Project Management Plan (GRAIL-WP0-INE-DEL-01) Issue 0.2
[4] Project Handbook (GRAIL-WP0-INE-DEL-02) Issue 0.2
[5] GNSS Subsystem Requirement Specification for Enhanced Odometry Application (GRAIL-WP3-TIF-DEL-3.1.1) Issue 0.b
1.4 Abbreviations and Acronyms
BTM Balise Transmission Module
CBA Cost Benefit Analysis
COTS Commercial Off-The-Shelf
EGNOS European Geostationary Navigation Overlay Service
EO Enhanced Odometry
ERTMS European Rail Traffic Management System
ETCS European Train Control System
GNSS Global Navigation Satellite Systems
GSA GNSS Supervisory Authority
GJU Galileo Joint Undertaking
LE Local Element
LRBG Last Relevant Balise Group
NPV Net Present Value
PVHT Position, Velocity, Heading, Time
SIS Signal In Space
SQ Safety Qualifier
Ref: GRAIL-WP7-ESY-DEL-711
Issue: 1.0 Date: 08/08/07
Cost Benefit Analysis
Class: Public Page 6 / 27
GRAIL: GNSS Introduction in the RAIL sector GSA Contract Number: GJU/05/2409/CTR/GRAIL
SoL Safety of Life
TAS-I Thales Alenia Space - Italy
TBD To Be Defined
TTA Time To Alarm
UT (GNSS) User Terminal
UTC Coordinated Universal Time
WP Work Package
WPL Work Package Leader

Ref: GRAIL-WP7-ESY-DEL-711
Issue: 1.0 Date: 08/08/07
Cost Benefit Analysis
Class: Public Page 7 / 27
GRAIL: GNSS Introduction in the RAIL sector GSA Contract Number: GJU/05/2409/CTR/GRAIL
2 THE CBA SCENARIO
2.1 The Enhanced Odometry application definition
This description of the Enhanced Odometry (EO) application is taken from the GNSS Subsystem Requirement Specification for Enhanced Odometry Application produced in GRAIL WP 3 [5]. This is the technology that is the subject of this iteration of the CBA.
A number of train protection systems rely on speed control at singular, precise locations along the track (end of sections, points, stations, etc). Therefore, trains must be equipped with odometers to provide a continuous measure of train distance travelled and speed. One of the systems more widely used is to calculate the train speed and distance from the number of turns of a train wheel with corrective mechanisms for adjusting for slide and slip errors.
In ERTMS, train protection is based on the knowledge of train position with respect to a precise location in front of the train and the ability to apply the brakes in time to avoid an impact. The train position at any time is measured with respect to distance travelled from fixed balises located at known positions on the track. An odometer is commonly used to measure the distance travelled from the last balise and hence identify its current position.
An odometer is the name of the equipment that determines the location of a train (related to a reference point) and its speed. In the ETCS, the usual practice consists of a tachometer attached to an axle or traction component and whose errors are reset periodically by a Eurobalise, whose location is known with a given tolerance (±5m + 5%). Other sensors may also be used, e.g. Doppler radar.
The main modules that make up the train location function in ETCS are:
Eurobalise
Provides the identity of the reference point (i.e. its position) and messages to the train when passing over it that contain system data for the purpose of odometry.
Balise Transmission Module (BTM)
Reads Eurobalise information and provides to the Odometry on board macro-function the identity of the last reference point through an internal ETCS interface (not openly specified). The BTM also passes the system information onto the ETCS kernel (balise messages). This interface is also not openly specified.
Odometry macro-function
Taking into account the information of the reference point provided by the BTM and the train movement information (position and speed), it computes the distance travelled from the last reference point and calculates the confidence interval of the measurement. It reports the Location data to the ETCS kernel through an internal interface (not openly specified). The Location data consists of:
• Current Last Relevant Balise Group (LRBG)
• D_LRBG: distance between the LRBG and the estimated front end of the train
• Confidence interval related to the distance travelled from reference point
• Current speed
• Direction of movement
• Standstill detection.

Ref: GRAIL-WP7-ESY-DEL-711
Issue: 1.0 Date: 08/08/07
Cost Benefit Analysis
Class: Public Page 8 / 27
GRAIL: GNSS Introduction in the RAIL sector GSA Contract Number: GJU/05/2409/CTR/GRAIL
The direction of the movement of the train is determined from reading the position of each balise inside the balise group. If the number is increasing, the direction of movement is the nominal direction. Otherwise, it is the reverse direction.
ETCS Kernel
Provides to the Odometry macro-function the calibration of the Odometry by means of the linking information (the linking information contains the identity and distance to the next Balise Group).
The current coordination system is the longitudinal distance travelled along the track from a given reference point. The Identity of the LRBG is transmitted to the ETCS kernel via Euroradio or Eurobalise. The kernel determines the actual Position from this information and the distance travelled from the last reference balise group.
The aim of the additional GNSS subsystem is to support the odometry with accurate position and speed. Enhanced ETCS Odometry could be used as a substitute for or a complement to the current odometer sensors (tachometers, INS, Doppler radar etc.) in the ETCS odometry.
The expected improvements of the Enhanced ETCS odometry are the overall improvement of Train Location accuracy (reduction in safety distances and tolerances – to be demonstrated). Operational benefits may derive from the increase of the location confidence. These could be to:
• Reduce safety distances between trains and therefore
• Increase the operational train density (with respect to a moving block or low cost ETCS solution)
• Increase the distance between the track balises - when the balises only have the function of odometry correction.
• Improve the availability (by overcoming drawback of existing sensors)
Cost reduction:
• A reduction of the onboard equipment cost with identical performances (as long as the GNSS Enhanced Odometry is cheaper than the current odometric systems).
• The possibility to have a train location characterized by an error independent of the travelled distance. This could have a possible impact on trackside equipment, e.g. a reduction in the number of balises.
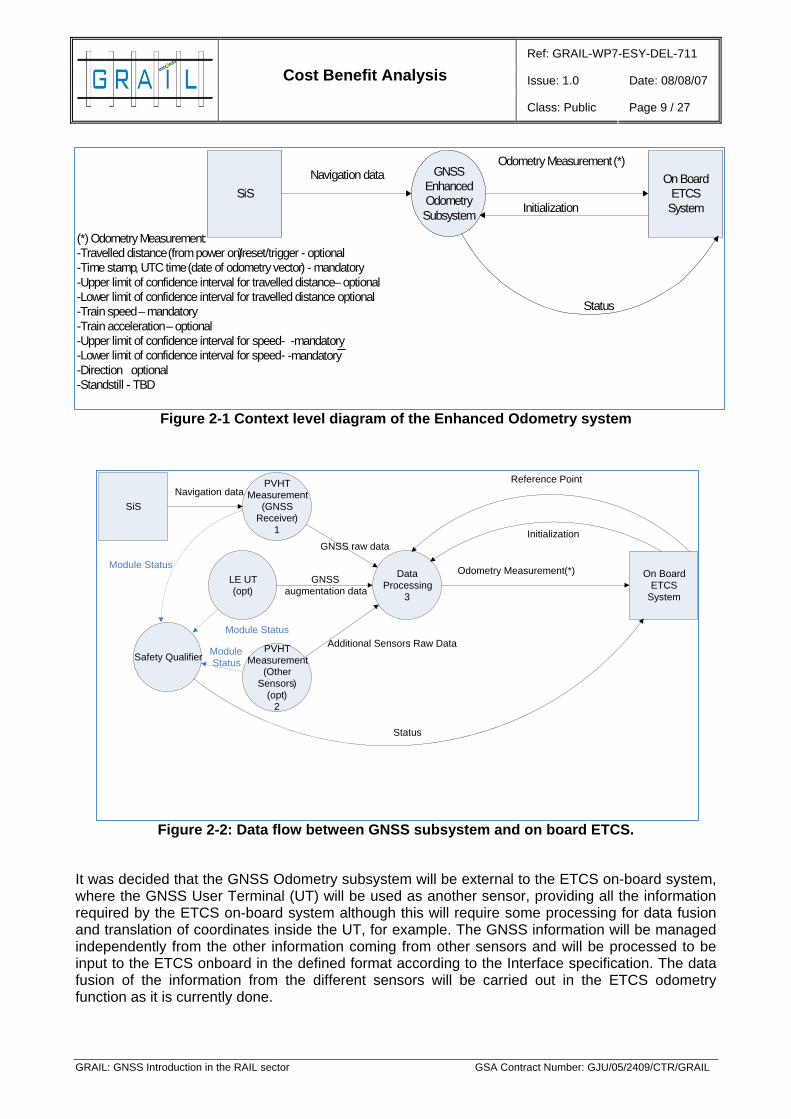
The data flow diagrams for the Enhanced Odometry system are shown below. The context level diagram, Figure 2-1, shows the allocation of the functions, the interactions and the information flow between the existing on board ETCS system and the proposed GNSS subsystem, listing the data exchanged and the functions involved. It should be noted that the GNSS system output provides train speed and distance travelled rather than position, a more common GNSS output in other applications. A more detailed, Level 1 view of the interfaces is shown in Figure 2-2.
Ref: GRAIL-WP7-ESY-DEL-711
Issue: 1.0 Date: 08/08/07
Cost Benefit Analysis
Class: Public Page 9 / 27
GRAIL: GNSS Introduction in the RAIL sector GSA Contract Number: GJU/05/2409/CTR/GRAIL
Figure 2-1 Context level diagram of the Enhanced Odometry system
Figure 2-2: Data flow between GNSS subsystem and on board ETCS.
It was decided that the GNSS Odometry subsystem will be external to the ETCS on-board system, where the GNSS User Terminal (UT) will be used as another sensor, providing all the information required by the ETCS on-board system although this will require some processing for data fusion and translation of coordinates inside the UT, for example. The GNSS information will be managed independently from the other information coming from other sensors and will be processed to be input to the ETCS onboard in the defined format according to the Interface specification. The data fusion of the information from the different sensors will be carried out in the ETCS odometry function as it is currently done.
PVHT Measurement
( GNSS Receiver )
1
Data Processing
3
PVHT Measurement
( Other Sensors )
( opt ) 2
SiS
On Board ETCS
System
Navigation data
GNSS raw data
Odometry Measurement (*)
Level 1
Additional Sensors: Raw DataSafety Qualifier
LE UT (opt )
Module Status
Module Status Module Status
Reference Point
Initialization
Status
GNSS augmentation data
GNSS Enhanced OdometrySubsystem
SiS On Board
ETCS System
Navigation data
Context
Initialization
Odometry Measurement (*)
Status
(*) Odometry Measurement : - Travelled distance ( from power on/reset/trigger - optional) - - Time stamp , UTC time ( date of odometry vector ) - mandatory - Upper limit of confidence interval for travelled distance – optional- Lower limit of confidence interval for travelled distance- optional- Train speed – mandatory - Train acceleration – optional - Upper limit of confidence interval for speed - -mandatory- Lower limit of confidence interval for speed - -mandatory- Direction optional - Standstill - TBD
Ref: GRAIL-WP7-ESY-DEL-711
Issue: 1.0 Date: 08/08/07
Cost Benefit Analysis
Class: Public Page 10 / 27
GRAIL: GNSS Introduction in the RAIL sector GSA Contract Number: GJU/05/2409/CTR/GRAIL
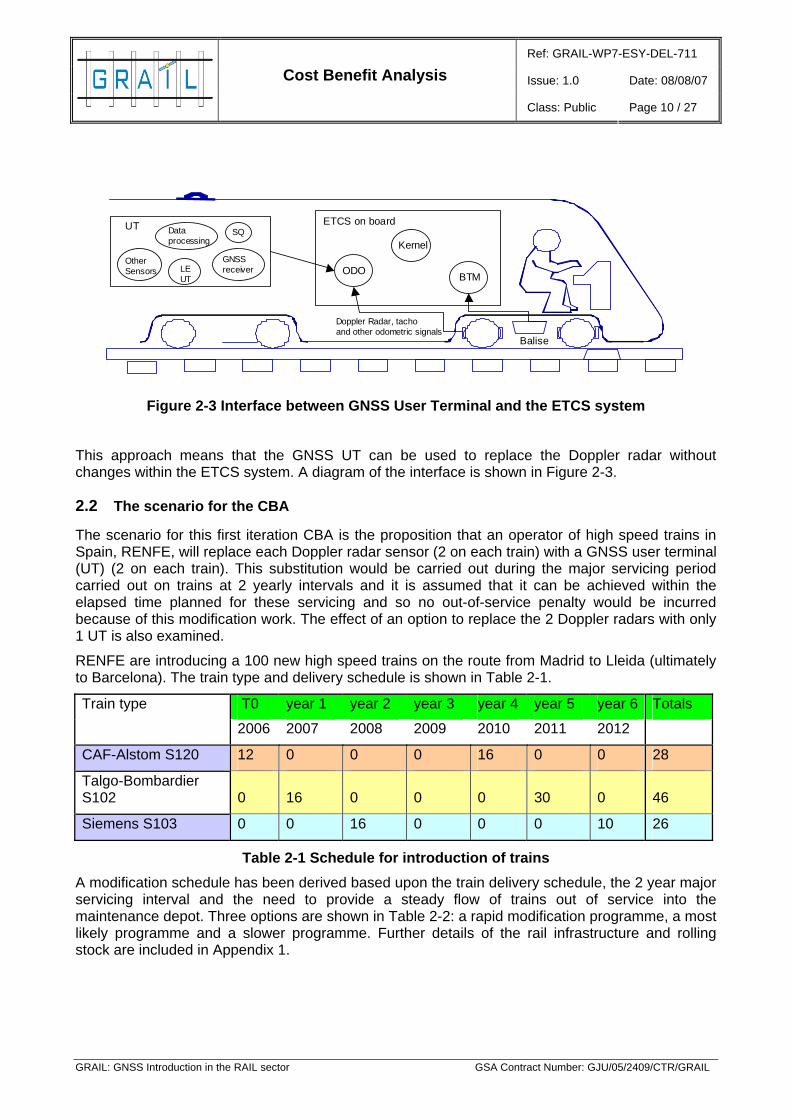
Figure 2-3 Interface between GNSS User Terminal and the ETCS system
This approach means that the GNSS UT can be used to replace the Doppler radar without changes within the ETCS system. A diagram of the interface is shown in Figure 2-3.
2.2 The scenario for the CBA
The scenario for this first iteration CBA is the proposition that an operator of high speed trains in Spain, RENFE, will replace each Doppler radar sensor (2 on each train) with a GNSS user terminal (UT) (2 on each train). This substitution would be carried out during the major servicing period carried out on trains at 2 yearly intervals and it is assumed that it can be achieved within the elapsed time planned for these servicing and so no out-of-service penalty would be incurred because of this modification work. The effect of an option to replace the 2 Doppler radars with only 1 UT is also examined.
RENFE are introducing a 100 new high speed trains on the route from Madrid to Lleida (ultimately to Barcelona). The train type and delivery schedule is shown in Table 2-1.
Train type T0 year 1 year 2 year 3 year 4 year 5 year 6 Totals
2006 2007 2008 2009 2010 2011 2012
CAF-Alstom S120 12 0 0 0 16 0 0 28
Talgo-Bombardier S102 0 16 0 0 0 30 0 46
Siemens S103 0 0 16 0 0 0 10 26
Table 2-1 Schedule for introduction of trains A modification schedule has been derived based upon the train delivery schedule, the 2 year major servicing interval and the need to provide a steady flow of trains out of service into the maintenance depot. Three options are shown in Table 2-2: a rapid modification programme, a most likely programme and a slower programme. Further details of the rail infrastructure and rolling stock are included in Appendix 1.
ETCS on board
Balise
BTMODO
Kernel
UT
GNSSreceiver
OtherSensors
Dataprocessing
LE UT
Doppler Radar, tacho and other odometric signals
SQ

Ref: GRAIL-WP7-ESY-DEL-711
Issue: 1.0 Date: 08/08/07
Cost Benefit Analysis
Class: Public Page 11 / 27
GRAIL: GNSS Introduction in the RAIL sector GSA Contract Number: GJU/05/2409/CTR/GRAIL
year 2 year 3 year 4 year 5 year 6 year 7 year 8 year 9 Totals
2008 2009 2010 2011 2012 2013 2014 2015
High 12 16 16 0 16 30 10 0 100
Most likely 12 16 16 0 16 30 10 0 100
Low 8 9 12 13 13 14 15 16 100
Table 2-2 Modification schedule

Ref: GRAIL-WP7-ESY-DEL-711
Issue: 1.0 Date: 08/08/07
Cost Benefit Analysis
Class: Public Page 12 / 27
GRAIL: GNSS Introduction in the RAIL sector GSA Contract Number: GJU/05/2409/CTR/GRAIL
3 CBA ASSUMPTIONS
This is a CBA of a proposed programme to introduce GNSS user terminals that do not currently exist. It is based upon a real rail network and a real rail operator to provide a practical scenario baseline; however, in order to carry out the CBA, a number of assumptions have been made. They are listed and explained below.
3.1 Baseline information and assumptions
1) The CBA will be based on the modification of 100 high speed trains being introduced on to the Madrid-Lleida line to replace the existing Doppler radars with GNSS user terminals.
2) This line has a full complement of balises (2,036) that are required to enable ERTMS/ETCS operation by trains at Levels 1 and Level 2.
3) In this first iteration, no balises are to be removed (or switched off and left in situ) because there is still a need to provide a capability for ERTMS Level 1 trains (that need all balises)
4) Time zero for the CBA is 2006 and the period of the analysis is 15 years. This covers the period in which trains are being modified and extends 6 years into the steady state period after all trains have been modified.
5) The GNSS user terminal meets rail safety standards and can be used in lieu of Doppler radars.
6) The GNSS service to be used is the EGNOS SoL service (i.e. with differential correction and 6s integrity alarm). This is considered acceptable because the GNSS terminal is used to calibrate the odometer output between balises (to adjust for any odometer inaccuracies due to wheel slip).
7) In view of the minimum impact of a GNSS failure, it is assumed for the most likely and low cases that no Service Guarantee contract is taken up with the EGNOS operator, i.e. there is no GNSS operating charge. A charge is included for the high case, however.
8) Assumption is that a 6 sec TTA (provided by EGNOS) is sufficient for enhanced odometry where the GNSS terminal is used to correct the odometer reading of distance travelled since the last balise.
9) Trains are modified by replacing each Doppler radar with a GNSS UT (there are 2 of each per train) during scheduled servicing planned 2 years after a train is delivered, i.e. modification does not incur additional downtime and loss of passenger revenue.
10) An effect of an option to replace the 2 Doppler radars with only 1 UT is also considered.
11) Train major servicings take up to 1 month to carry out. A fleet of 100 trains with a between servicing period of 2 years generates 50 servicings per year i.e. 4.2 servicings per month steady state.
12) The GNSS user terminal is designed to meet the GRAIL WP 3 specification and will include an inertial navigation system to provide acceptable availability in the presence of GNSS signal obscuration (trees, buildings, tunnels etc).
13) As the driver controls and operation of the train is unchanged, no driver or crew training costs are incurred.
14) The Doppler radars replaced by the GNSS user terminals are sold at 25% of their purchase price soon after the modification
15) A Discount Rate of 5% is used in the Net Present Value (NPV) calculation, although the effect of higher vales of discount rate is also examined. This recognises that the importance
Ref: GRAIL-WP7-ESY-DEL-711
Issue: 1.0 Date: 08/08/07
Cost Benefit Analysis
Class: Public Page 13 / 27
GRAIL: GNSS Introduction in the RAIL sector GSA Contract Number: GJU/05/2409/CTR/GRAIL
and perceived values of costs and benefits is reduced the further into the future they occur. Note that this is quite separate to the effect of inflation which is ignored in the CBA.
16) All monetary values are at 2006 levels.
17) Trains from the same series will be modified at the same time.
18) Train maintenance operations scheduled: every 2 years (approximately after 1 million km of train operations) an important maintenance intervention takes place. We assume that the Doppler Radar could be replaced by the Enhanced Odometry subsystem based on GNSS during this operation.
19) In this first iteration we have considered no replacement of the balises (fixed balises) at all. This is because in the Madrid-Lleida line, the configuration of the signalling equipment is ETCS Level 2 (L2 and ETCS Level1 (L1) as a back up system. Therefore, no balises can be removed (in L1 all the balises are needed).

Ref: GRAIL-WP7-ESY-DEL-711
Issue: 1.0 Date: 08/08/07
Cost Benefit Analysis
Class: Public Page 14 / 27
GRAIL: GNSS Introduction in the RAIL sector GSA Contract Number: GJU/05/2409/CTR/GRAIL
4 COST BENEFIT ANALYSIS - APPROACH
4.1 General
A particular characteristic of this CBA is that costs and benefits are incurred by 2 organisations. The rail operating company, RENFE in this case, incurs the cost of modifying the trains and the costs of supporting the new GNSS user terminals in service. However, the major benefits from the introduction of the GNSS Enhanced Odometry system will arise from the reduction of balises and so will be realised by the track infrastructure company, ADIF, who is responsible for installing and maintaining the balises. Consequently, it would be necessary for ADIF to share their benefits with RENFE in order to justify RENFE’s costs. This could be achieved through a reduction in the operating fee paid by RENFE to ADIF for the use of the track, but the CBA needs to recognise the need for this internal adjustment.
Most values of costs and benefits are included in 3 values (high, most likely and low) so that a sensitivity analysis can be carried out on the effect of different values.
The approach used and steps in the process are as follows:
• Identify and record the assumptions used in the analysis (as in section 3)
• Identify each cost that contributes to the introduction of the Enhanced Odometry system separating costs for the operating system and the infrastructure companies. These costs are annualised (i.e. the total costs under each category are presented for each year of the analysis)
• Identify each benefit that contributes to the introduction of the Enhanced Odometry system separating benefits for the operating system and the infrastructure companies. These benefits are annualised and monetised (i.e. the total benefits under each category are presented for each year of the analysis and in €values)
• The costs and benefits are totalled for the operating company and infrastructure company separately for each year
• The costs for each year are subtracted from the benefits for each year to provide a net yearly benefit for the operating company and infrastructure company
• The net benefits from the operating company and infrastructure company are added to provide the total net benefits for each year
• The total net benefits for each year are discounted at an agreed discount rate (5% is assumed) and added to provide the NPV.
Details of the costs and benefits used in the analysis are described below.
4.2 Costs
The following costs are included.
4.2.1 Operating company
High, most likely and low values for the operating company costs are recorded for each year under the following headings:
Installation costs per year – the estimated modification costs calculated each year according to the number of trains modified in the year and based upon estimates of the cost of modifying a single train. The range of values represent low, most likely and high estimates derived from the

Ref: GRAIL-WP7-ESY-DEL-711
Issue: 1.0 Date: 08/08/07
Cost Benefit Analysis
Class: Public Page 15 / 27
GRAIL: GNSS Introduction in the RAIL sector GSA Contract Number: GJU/05/2409/CTR/GRAIL
cost of a single modification. It is assumed that the form, fit and function of the UT is designed to facilitate an easy replacement of the Doppler radars by the UTs. Additionally the UT antennae have to be installed in a pre-designated and tested location. The baseline estimate assumes 2 Doppler radars are replaced by 2 UTs, but an option to install only 1 UT is also considered. Installation estimates are based on the following assumptions:
Labour rate - €200/hr
Time taken for most likely case – 5 days
Time taken for Low case – 3 days
Time taken for high case – 10 days
Single UT option installation costs are assumed to be 60% of the twin UT installation cost.
Equipment procurement costs per year – the annualised procurement costs are calculated by taking the estimated price of GNSS user terminals (provided by Thales Alenia Space -Italy) and multiplying by the number of trains being modified in each year. The range of values represent a most likely estimate for a Level 1 safety certified UT (€35k), a low value based upon a Commercial Off The Shelf un-certified design (€16k) and a high value representing a fully certified design (€47k).
Equipment maintenance costs per year – the annual maintenance costs are based upon the population of GNSS user terminals in each year (max 200) and a maintenance fee based upon a percentage of the supply price per year. Apparently this is a more common practice used by the equipment suppliers rather than making a charge for each equipment when it fails. The percentages used are: 3%, 5% and 10% respectively for the low, most likely and high cases. These are applied each year to the value of the equipment population as it builds up during the modification reaching a maximum steady state of 200 UTs (2 per train). The single UT option assumes maintenance contract costs at 60% of the baseline twin UT costs.
Training costs per year – This is the cost of training drivers and crews each year resulting from the introduction of the GNSS user terminals. However, because the GNSS UT simulates the behaviour of the Doppler radar, the behaviour of the train and ETCS is unchanged as far as the driver and crew are concerned and so the training costs for this iteration are zero.
4.2.2 Infrastructure company
High, most likely and low values for the infrastructure company costs are recorded for each year under the following headings:
GNSS service charges – this is the annual cost of the GNSS service used. It is assumed for the most likely and low cases that for the Enhanced Odometry installation the free EGNOS Safety of Life service will be used and, because the impact of GNSS failure is minimal, that no Service Guarantee charge will be paid. This service is assumed to provide a 95% accuracy of better than 3 m (H) and with a Time to Alarm of 6 seconds. It has been assumed that the GNSS service charges where they apply would be the responsibility of the Infrastructure company. However, the high case assumes an annual service guarantee charge of €50k throughout the period. However, that is an estimate for illustrative purpose only and is not based upon any guidance from the EGNOS operator. For future iterations it should be noted that there is little guidance on the likely costs of GNSS services for safety critical applications.
Loss of revenue from the operating company – this cost is the reduction in the operating charges normally paid to the infrastructure company by the operating company for the use of the track. This is to compensate for the fact that the operating company, receives little or no benefit from the introduction of the enhanced Odometry system, but incurs most of the charges. On the other hand, the infrastructure company receives benefits from the reduction in balise acquisition and maintenance charges without having to pay for the enhanced Odometry introduction. In this

Ref: GRAIL-WP7-ESY-DEL-711
Issue: 1.0 Date: 08/08/07
Cost Benefit Analysis
Class: Public Page 16 / 27
GRAIL: GNSS Introduction in the RAIL sector GSA Contract Number: GJU/05/2409/CTR/GRAIL
case, because there are no benefits, there is no adjustment in operating charge and hence this cost category is zero. Put another way, the infrastructure company is offering a slightly reduced standard of infrastructure (fewer balises) and hence its charges are reduced. As this represents a reduction in its income, it represents a cost arising directly form the introduction of the enhanced Odometry system by the operating company.
4.3 Benefits
4.3.1 Operating company
High, most likely and low values for the operating company benefits are recorded for each year under the following headings:
Reduction in operating payments to the infrastructure company (for the use of the track) – this is an important benefit that is passed on to the operating company by the infrastructure company. It is a share of the benefits from the reduction of balise maintenance and acquisition. In this first iteration, no balises can be removed and so there is no benefit from this source.
Operational benefits due to increased capacity of network – this is a result of decreased headway between trains that can be accommodated by the improved accuracy of the ETCS. However, as the Madrid-Lleida line is exploited on the basis of fixed blocks, these potential operating benefits do not apply for this iteration.
4.3.2 Infrastructure company
High, most likely and low values for the infrastructure company benefits are recorded under the following headings:
Reduction in balise maintenance – it is hoped that, using enhanced odometry, the number of fixed balises needed on a given track can be reduced so reducing the maintenance cost. This would be achieved by simply ignoring some balises (i.e. it would not be cost effective to go out and physically remove them). However, the serviceability of a balise is normally confirmed when a train passes over it (i.e. if the information provided is not complete and correct, it is self evidently unserviceable) and scheduled maintenance (i.e. at prescribed intervals even if the balises are still serviceable) is not sensible for devices with a random failure mode. However, for this case, trains with ETCS Level 1 are operating on this line and they need all balises. Consequently until Level 1 operation is removed, no reduction in balises is allowable and hence there is no benefit from this source.
Savings in balise acquisition – If one is starting with a balise-free track, then assuming no ETCS Level 1 trains will be operating on the track, the number of balises that have to be bought and installed will be lower than that without the enhanced Odometry system. In this iteration of the CBA, the balises have already been installed and so no benefit will arise from this source.

Ref: GRAIL-WP7-ESY-DEL-711
Issue: 1.0 Date: 08/08/07
Cost Benefit Analysis
Class: Public Page 17 / 27
GRAIL: GNSS Introduction in the RAIL sector GSA Contract Number: GJU/05/2409/CTR/GRAIL
5 COST BENEFIT ANALYSIS – RESULTS
This first iteration of the GRAIL CBA needs to be regarded as the establishment of a CBA framework with agreed assumptions rather than an opportunity to prove that the Enhanced Odometry installation using GNSS will provide an overall benefit for the rail network in the case study. However, as will be seen later, there are some conditions where enhanced Odometry might provide a net overall benefit.
The full annualised cost and benefit results tables are reproduced in Appendix 2 (from the master Excel spreadsheet).
The effect of installing only 1 UT is shown at the end of the section under the heading “Results of single UT option”.
5.1 Costs
The range of annualised (not cumulative) operating costs for the operating company are shown in Figure 5-1. The peaks and troughs in the high and most likely values are caused by the modification schedule. The low values are smoother because the modification programme, being slower, gives rise to a more regular schedule. The y axis values are €k. The total costs throughout the period are €15.967m €9.637m and €4.132m respectively for the high, most likely and low cases.
Figure 5-1 Annualised costs for operating company
The breakdown of costs is shown, for the most liklely case,in Figure 5-2. This shows that the procurement costs of the programme are the largest; however, the maintence costs, while lower, continue past the procurement and modification stages throughout the life of the system

Ref: GRAIL-WP7-ESY-DEL-711
Issue: 1.0 Date: 08/08/07
Cost Benefit Analysis
Class: Public Page 18 / 27
GRAIL: GNSS Introduction in the RAIL sector GSA Contract Number: GJU/05/2409/CTR/GRAIL
Figure 5-2 Make up of costs for most likely case
The annualised values of operating company costs are shown in Table App2-1 of Appendix 2.
The only cost borne by the infrastructure company is the GNSS service guarantee charge of €50k per year that has been assumed for the high case. This totals €800k throughout the period.
The annualised costs for the infrastructure company and the total costs are shown in Table App2-2 and Table App2-3 of Appendix 2.
5.2 Benefits
The operating company benefits in this iteration arise only from the sale of the removed Doppler radars units at 25% of their purchase value. (NB. The purchase values, ex supplier, are estimated as €3k, €4k and €5k respectively for the low, most likely and high cases.)
Figure 5-3 Operating company benefits
The total benefits throughout the period amount to €150k, €200k and €250k respectively. Any benefits from improved operating performance cannot be realised in this iteration.
Ref: GRAIL-WP7-ESY-DEL-711
Issue: 1.0 Date: 08/08/07
Cost Benefit Analysis
Class: Public Page 19 / 27
GRAIL: GNSS Introduction in the RAIL sector GSA Contract Number: GJU/05/2409/CTR/GRAIL
Annualised benefits are shown in Table App2-4, Table App2-5 and Table App2-6 of Appendix 2.
There are no benefits for the infrastructure company in this iteration because no balises can be removed.
5.3 Net Present Value
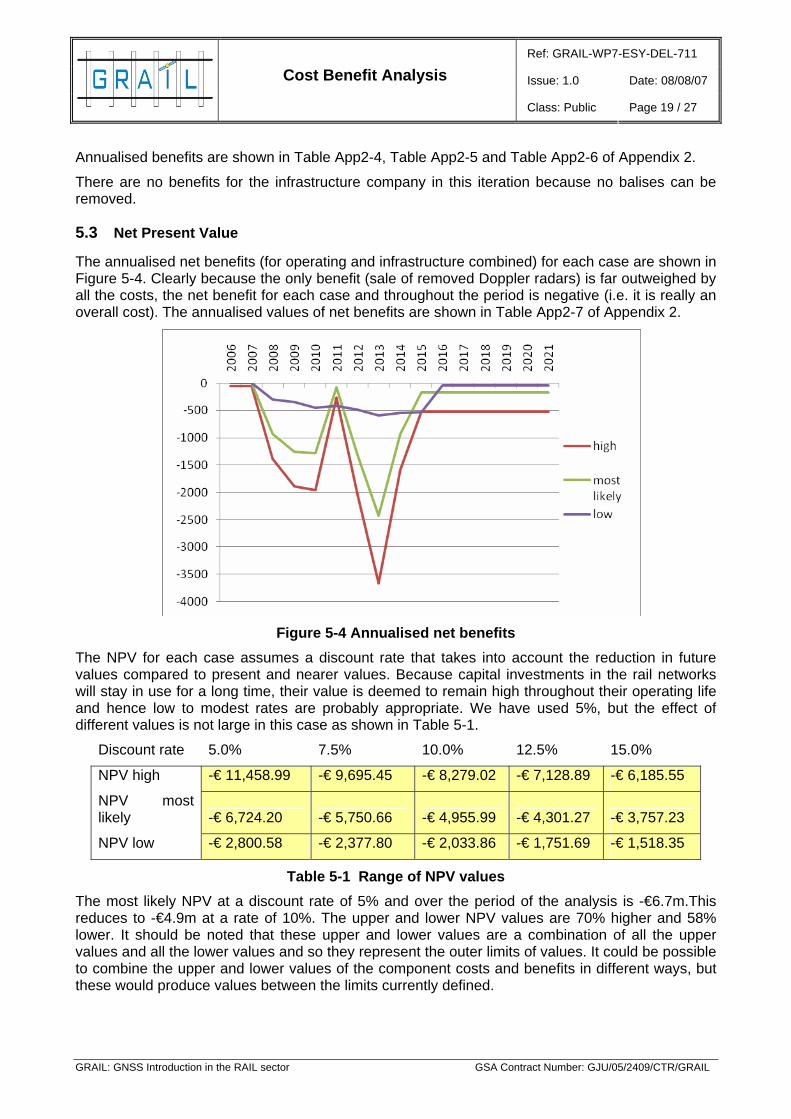
The annualised net benefits (for operating and infrastructure combined) for each case are shown in Figure 5-4. Clearly because the only benefit (sale of removed Doppler radars) is far outweighed by all the costs, the net benefit for each case and throughout the period is negative (i.e. it is really an overall cost). The annualised values of net benefits are shown in Table App2-7 of Appendix 2.
Figure 5-4 Annualised net benefits
The NPV for each case assumes a discount rate that takes into account the reduction in future values compared to present and nearer values. Because capital investments in the rail networks will stay in use for a long time, their value is deemed to remain high throughout their operating life and hence low to modest rates are probably appropriate. We have used 5%, but the effect of different values is not large in this case as shown in Table 5-1.
Discount rate 5.0% 7.5% 10.0% 12.5% 15.0%
NPV high -€ 11,458.99 -€ 9,695.45 -€ 8,279.02 -€ 7,128.89 -€ 6,185.55
NPV most likely -€ 6,724.20 -€ 5,750.66 -€ 4,955.99 -€ 4,301.27 -€ 3,757.23
NPV low -€ 2,800.58 -€ 2,377.80 -€ 2,033.86 -€ 1,751.69 -€ 1,518.35
Table 5-1 Range of NPV values The most likely NPV at a discount rate of 5% and over the period of the analysis is -€6.7m.This reduces to -€4.9m at a rate of 10%. The upper and lower NPV values are 70% higher and 58% lower. It should be noted that these upper and lower values are a combination of all the upper values and all the lower values and so they represent the outer limits of values. It could be possible to combine the upper and lower values of the component costs and benefits in different ways, but these would produce values between the limits currently defined.

Ref: GRAIL-WP7-ESY-DEL-711
Issue: 1.0 Date: 08/08/07
Cost Benefit Analysis
Class: Public Page 20 / 27
GRAIL: GNSS Introduction in the RAIL sector GSA Contract Number: GJU/05/2409/CTR/GRAIL
5.4 Results of single UT option
The annualised net benefits for this option (for operating and infrastructure combined) are shown in Figure 5-5. The net benefit for each case and throughout the period is still negative (i.e. it is really an overall cost), but because the UT costs (procurement, installation and maintenance) are reduced compared with the 2 UT baseline, the magnitude of the costs for the 3 cases is reduced by approximately a half.
Figure 5-5: Annualised net benefits for single UT option
Discount rate 5.0% 7.5% 10.0% 12.5% 15.0% NPV high -€ 6,320.60 -€ 5,329.65 -€ 4,538.10 -€ 3,898.56 -€ 3,376.38
NPV most likely -€ 3,455.85 -€ 2,947.56 -€ 2,534.25 -€ 2,194.91 -€ 1,913.80NPV NPV low -€ 1,408.18 -€ 1,193.99 -€ 1,020.14 -€ 877.77 -€ 760.25
Table 5-2 Range of NPV values for single UT option
The most likely NPV for the single UT option at a discount rate of 5% and over the period of the analysis is -€3.45m. This compares with -€6.7m for the 2 UT baseline case. This reduces to -€2.5m using a discount rate of 10%.
-2500
-2000
-1500
-1000
-500
0
2006
2007
2008
2009
2010
2011
2012
2013
2014
2015
2016
2017
2018
2019
2020
2021
high
most likely

Ref: GRAIL-WP7-ESY-DEL-711
Issue: 1.0 Date: 08/08/07
Cost Benefit Analysis
Class: Public Page 21 / 27
GRAIL: GNSS Introduction in the RAIL sector GSA Contract Number: GJU/05/2409/CTR/GRAIL
6 CONCLUSIONS
The net benefit of replacing the existing Doppler radars with GNSS user terminals used for enhanced Odometry within the scenario defined is negative. The range of NPVs is from -€2.8M to -€11.46M with a most likely value of -€6.7M. (These values reduce to -€1.4m to -€6.3m with a most likely value of -€3.45m for the single UT option).
The main costs are due to the procurement of the 200 GNSS UTs; installation and maintenance costs are much smaller in comparison. The potential benefits that could arise from reducing the number of fixed balises (hence saving on their maintenance), or even better of not installing them in the first place (on new track) are not available due to the scenario defined for this first iteration.
However, the estimated cost of the GNSS UT is considerably higher than the Doppler radars it replaces (€16K, €35K, €47K for the UT versus €3K, €4K, €5K for the Doppler respectively for low, most likely and higher values) and so considerable benefits would be required to offset this.
As an example the most likely NPV (currently -€6.7M) just becomes positive (+€1.9K) if the cost of buying and installing 1143 balises could be saved (assuming the low, most likely and higher prices of buying and installing balises is €3K, €7K and €11K) (for the 2 UT baseline case). Note that the Madrid Lleida line currently has 2036 balises. Whether it would be feasible to effectively reduce the number of balises in some specific scenarios (only pure L2 or Level 3 (L3) exploitation) would need to be confirmed by the railway sector. Alternatively, reducing the price of the UT would be helpful, but for the moment the prospect of large enough production orders does not seem likely. On the other hand, Doppler radar technology is used in police radar speed guns and increasingly in collision warning systems on high end cars giving plenty of scope for large production discounts.
While the use of the EGNOS Safety of Life service (i.e. the open positioning and integrity signals) seems reasonable for Enhanced Odometry, it is not clear whether the cost of a service guarantee contract should be ignored as we have assumed. The use of GNSS as the major position/ velocity sensor in more advanced ETCS configurations (not considered in GRAIL) would probably require a shorter Time to Alarm than that provided by EGNOS (6s). This implies a regional/ local augmentation system, the cost of which would need to be included in the overall system cost. It would also carry an operating charge over and above any service guarantee.
The most beneficial use of Enhanced Odometry would be under the following conditions:
• As an initial fit (rather than a replacement of a Doppler radar that has already been purchased)
• On a rail network where no balises are already installed (so facilitating the minimum outlay on balises in certain scenarios)
• Where operating benefits (i.e. reduced headway) can be achieved
• Using the cheapest (but acceptable) source of GNSS user terminal (UT)
• Accepting the use of a non-certified (and hence cheaper) UT for Enhanced Odometry
• Replacing the 2 Doppler radars with only 1 UT.

Ref: GRAIL-WP7-ESY-DEL-711
Issue: 1.0 Date: 08/08/07
Cost Benefit Analysis
Class: Public Page 22 / 27
GRAIL: GNSS Introduction in the RAIL sector GSA Contract Number: GJU/05/2409/CTR/GRAIL
APPENDIX 1- DETAILS OF RAIL NETWORK AND TRAINS
Company structure
Railway Operator: RENFE
Infrastructure Manager: ADIF
Train details
Type S102: Supplied by Talgo-Bombardier
Max Speed: 330 km/h
Length: 200 m
Number of wagons: 12
Max Weight per Axle: less than 17 Tn
Seats: 316
Number on network: 16 units (+ 30 new expected)
Type S120: Supplied by CAF-Alstom
Max Speed: 250 km/h
Length: 107.26 m
Max Weight per Axle: less than 16.2 Tn
Seats: 238
Number on network: 12 units (+16 new expected)
Type S103: Supplied by Siemens
Max Speed: 350 km/h
Length: 200 m
Number of wagons: 8
Max Weight per Axle: less than 15 Tn
Seats: 404
Number on network: 16 units (not in service jet+10 new expected)
Acquisition costs: 24,350 M€/unit
Train service frequencies on this line:
current headway: 5min (ALVIA 10:25h - Regional Express 10:30h)
Ref: GRAIL-WP7-ESY-DEL-711
Issue: 1.0 Date: 08/08/07
Cost Benefit Analysis
Class: Public Page 23 / 27
GRAIL: GNSS Introduction in the RAIL sector GSA Contract Number: GJU/05/2409/CTR/GRAIL
headway with ASFA: 8min
target headway for ERTMS Level 1: 5min 30sec (27.5Km at a max. speed of 300km/h)
target headway for ERTMS Level 2: 2 min 30sec
Details of Madrid Lleida line
MAD-LLE is a high speed unique line, double track with two-way working (either direction working tracks)
Line length: 44,9673m
International gauge: 1,435 mm (UIC)
Tunnels length: 2,424m
Stations length: 7,389.38m
Number of travellers: 618,283 (November 2005)
Fixed balises: 2036
Switchable balises: 1250
162 balises in tunnels and stations (cannot be removed)
Construction cost of the line Madrid-Lleida (inaugurated in 2003) was 4.5M€, aprox. 9.41M€/km double track
Trackside Maintenance is in charge of CSEE-Transport
Signalling system details
ERTMS (L0, L1 and L2) and ASFA (Anuncio de Señales y Frenado Automático)
S102: Supplier Talgo-Bombardier, ETCS onbard equipment SIEMENS, 2 Doppler Radars (DEUTA DRS05a)
S120: Suppplier CAF-ALSTOM, ETCS on board equipment CSEE Transport, 2 Doppler Radars
S103: Supplier SIEMENS, ETCS on board equipment SIEMENS, 2 Doppler Radars (DEUTA DRS05a)
GSM-R: Number of BTS (Base Transmission Station): 137

Ref: GRAIL-WP7-ESY-DEL-711
Issue: 1.0 Date: 08/08/07
Cost Benefit Analysis
Class: Public Page 24 / 27
GRAIL: GNSS Introduction in the RAIL sector GSA Contract Number: GJU/05/2409/CTR/GRAIL
APPENDIX 2 - COST BENEFIT ANNUALISED RESULTS
year 1 year 2 year 3 year 4 year 5 year 6 year 7 year 8 year 9 year 10 year 11 year 12 year 13 year 14 year 15
2006 2007 2008 2009 2010 2011 2012 2013 2014 2015 2016 2017 2018 2019 2020 2021
sensitivity
Cost borne by
High g 15 0 0 180 240 240 0 240 450 150 0 0 0 0 0 0 0Most likely h 7.5 0 0 90 120 120 0 120 225 75 0 0 0 0 0 0 0Low i 4.5 0 0 54 72 72 0 72 135 45 0 0 0 0 0 0 0
High j 47 0 0 1128 1504 1504 0 1504 2820 940 0 0 0 0 0 0 0Most likely k 35 0 0 840 1120 1120 0 1120 2100 700 0 0 0 0 0 0 0Low l 16 0 0 256 288 384 416 416 448 480 512 0 0 0 0 0 0
High m 4.7 0 0 56.4 131.6 206.8 206.8 282 423 470 470 470 470 470 470 470 470Most likely n 1.75 0 0 21 49 77 77 105 157.5 175 175 175 175 175 175 175 175Low o 0.48 0 0 3.84 8.16 13.92 20.16 26.4 33.12 40.32 48 48 48 48 48 48 48
High p 0 0 0 0 0 0 0 0 0 0 0 0 0 0 0 0Most likely q 0 0 0 0 0 0 0 0 0 0 0 0 0 0 0 0Low r 0 0 0 0 0 0 0 0 0 0 0 0 0 0 0 0
High s 0 0 1364.4 1875.6 1950.8 206.8 2026 3693 1560 470 470 470 470 470 470 470Most likely t h+k+n+q 0 0 951 1289 1317 77 1345 2482.5 950 175 175 175 175 175 175 175Low u 0 0 313.84 368.16 469.92 436.16 514.4 616.12 565.32 560 48 48 48 48 48 48
Total costs to operating company per year
Operating company
Operating company costs
Costs
Installation costs per train (K€)
EO terminal costs per train (K€)
Equipment procurement costs per year
Maintenance cost per year (%age of supply
cost)
Equipment maintenance costs per year
No training required Training costs per year
Operating company
Operating company
Operating companyInstallation costs per year
Table App2-1 Operating company costs

Ref: GRAIL-WP7-ESY-DEL-711
Issue: 1.0 Date: 08/08/07
Cost Benefit Analysis
Class: Public Page 25 / 27
GRAIL: GNSS Introduction in the RAIL sector GSA Contract Number: GJU/05/2409/CTR/GRAIL
year 1 year 2 year 3 year 4 year 5 year 6 year 7 year 8 year 9 year 10 year 11 year 12 year 13 year 14 year 15
2006 2007 2008 2009 2010 2011 2012 2013 2014 2015 2016 2017 2018 2019 2020 2021
sensitivity
Cost borne by
High v 50 50 50 50 50 50 50 50 50 50 50 50 50 50 50 50 50Most likely w 0 0 0 0 0 0 0 0 0 0 0 0 0 0 0 0 0Low x 0 0 0 0 0 0 0 0 0 0 0 0 0 0 0 0 0
High y 0 0 0 0 0 0 0 0 0 0 0 0 0 0 0 0 0Most likely z 0 0 0 0 0 0 0 0 0 0 0 0 0 0 0 0 0Low aa 0 0 0 0 0 0 0 0 0 0 0 0 0 0 0 0 0
High bb v+y 50 50 50 50 50 50 50 50 50 50 50 50 50 50 50 50Most likely cc w+z 0 0 0 0 0 0 0 0 0 0 0 0 0 0 0 0Low dd x+aa 0 0 0 0 0 0 0 0 0 0 0 0 0 0 0 0
Costs
There is no reduction (there are no benefits to
share)
Reduction in revenue (fees) from operating company Infrastructure company
GNSS operation charges per year (K€)
For most likely case we have assumed the use of EGNOS without any Service contract.
Infrastructure company costs
Infrastructure company
Total costs to infrastructure company per year
Table App2-2 Infrastructure costs
High ee s+bb 50 50 1414.4 1925.6 2000.8 256.8 2076 3743 1610 520 520 520 520 520 520 520Most likely ff t+cc 0 0 951 1289 1317 77 1345 2482.5 950 175 175 175 175 175 175 175Low gg u+dd 0 0 313.84 368.16 469.92 436.16 514.4 616.12 565.32 560 48 48 48 48 48 48
Total cost to Infrastructure and operating company
Total cost from all sources
Table App2-3 Total costs

Ref: GRAIL-WP7-ESY-DEL-711
Issue: 1.0 Date: 08/08/07
Cost Benefit Analysis
Class: Public Page 26 / 27
GRAIL: GNSS Introduction in the RAIL sector GSA Contract Number: GJU/05/2409/CTR/GRAIL
year 1 year 2 year 3 year 4 year 5 year 6 year 7 year 8 year 9 year 10 year 11 year 12 year 13 year 14 year 15
2006 2007 2008 2009 2010 2011 2012 2013 2014 2015 2016 2017 2018 2019 2020 2021
Benefit received by
High hh 0 0 0 0 0 0 0 0 0 0 0 0 0 0 0 0 0Most likely ii 0 0 0 0 0 0 0 0 0 0 0 0 0 0 0 0 0
Low jj 0 0 0 0 0 0 0 0 0 0 0 0 0 0 0 0 0
High kk 0 0 0 0 0 0 0 0 0 0 0 0 0 0 0 0Most likely ll 0 0 0 0 0 0 0 0 0 0 0 0 0 0 0 0Low mm 0 0 0 0 0 0 0 0 0 0 0 0 0 0 0 0
High kk2 5 0 0 30 40 40 0 40 75 25 0 0 0 0 0 0 0Most likely ll2 4 0 0 24 32 32 0 32 60 20 0 0 0 0 0 0 0Low mm2 3 0 0 12 13.5 18 19.5 19.5 21 22.5 24 0 0 0 0 0 0
High nn hh+kk 0 0 30 40 40 0 40 75 25 0 0 0 0 0 0 0Most likely oo ii+ll 0 0 24 32 32 0 32 60 20 0 0 0 0 0 0 0Low pp jj+mm 0 0 12 13.5 18 19.5 19.5 21 22.5 24 0 0 0 0 0 0
Total benefits to operating company per year
Benefits
Reduction in operating fee to infrastructure
company
Not applicable in this iteration because the infrastructure
company has not received the benefit of reduced balise costs
Operational benefits due to increased capacity of
network
Not applicable for enhanced odometry
Operating company
Operating company
Operating company benefits
Sale of replaced Doppler radarsIncome from sale of
surplus Doppler radars @ 25% cost
Operating company
Table App2-4 Operating company benefits
Benefit received by
High qq 0 0 0 0 0 0 0 0 0 0 0 0 0 0 0 0 0Most likely rr 0 0 0 0 0 0 0 0 0 0 0 0 0 0 0 0 0
Low ss 0 0 0 0 0 0 0 0 0 0 0 0 0 0 0 0 0
High tt 0 0 0 0 0 0 0 0 0 0 0 0 0 0 0 0 0Most likely uu 0 0 0 0 0 0 0 0 0 0 0 0 0 0 0 0 0
Low vv 0 0 0 0 0 0 0 0 0 0 0 0 0 0 0 0 0
High ww 0 0 0 0 0 0 0 0 0 0 0 0 0 0 0 0Most likely xx rr+uu 0 0 0 0 0 0 0 0 0 0 0 0 0 0 0 0Low yy 0 0 0 0 0 0 0 0 0 0 0 0 0 0 0 0
This cannot be applied in this iteration because the full density
of balises already exists.
Reduction in maintenance of balises
(K€) per year
For this iteration balises cannot be removed because of Level 1
trains on the same track
Saving in acquisition of balises (K€) per year
Infrastructure company benefits
Benefits
Infrastructure company
Infrastructure company
Total benefits to infrastructure company per year
Table App2-5 Infrastructure company benefits

Ref: GRAIL-WP7-ESY-DEL-711
Issue: 1.0 Date: 08/08/07
Cost Benefit Analysis
Class: Public Page 27 / 27
GRAIL: GNSS Introduction in the RAIL sector GSA Contract Number: GJU/05/2409/CTR/GRAIL
year 1 year 2 year 3 year 4 year 5 year 6 year 7 year 8 year 9 year 10 year 11 year 12 year 13 year 14 year 15
2006 2007 2008 2009 2010 2011 2012 2013 2014 2015 2016 2017 2018 2019 2020 2021
High zz 0 0 30 40 40 0 40 75 25 0 0 0 0 0 0 0Most likely aaa oo+xx 0 0 24 32 32 0 32 60 20 0 0 0 0 0 0 0Low bbb 0 0 12 13.5 18 19.5 19.5 21 22.5 24 0 0 0 0 0 0
Total benefits from all sources
Total benefits to Infrastructure and operating company
Table App2-6 Total benefits
High ccc 0 0 -1334.4 -1835.6 -1910.8 -206.8 -1986 -3618 -1535 -470 -470 -470 -470 -470 -470 -470Most likely ddd 0 0 -927 -1257 -1285 -77 -1313 -2422.5 -930 -175 -175 -175 -175 -175 -175 -175Low eee 0 0 -301.84 -354.66 -451.92 -416.66 -494.9 -595.12 -542.82 -536 -48 -48 -48 -48 -48 -48
High fff -50 -50 -50 -50 -50 -50 -50 -50 -50 -50 -50 -50 -50 -50 -50 -50Most likely ggg 0 0 0 0 0 0 0 0 0 0 0 0 0 0 0 0Low hhh 0 0 0 0 0 0 0 0 0 0 0 0 0 0 0 0
High iii -50 -50 -1384.4 -1885.6 -1960.8 -256.8 -2036 -3668 -1585 -520 -520 -520 -520 -520 -520 -520Most likely jjj 0 0 -927 -1257 -1285 -77 -1313 -2422.5 -930 -175 -175 -175 -175 -175 -175 -175Low kkk 0 0 -301.84 -354.66 -451.92 -416.66 -494.9 -595.12 -542.82 -536 -48 -48 -48 -48 -48 -48
-£11,458.99 -£9,695.45 -£8,279.02 -£7,128.89 -£6,185.55-£6,724.20 -£5,750.66 -£4,955.99 -£4,301.27 -£3,757.23-£2,800.58 -£2,377.80 -£2,033.86 -£1,751.69 -£1,518.35
Discount rate 5.0% 7.5% 10.0% 12.5% 15.0%
NPV
Total Net benefits per year (infrastructure & operating)
Total Net benefits per year infrastructure
Net benefits per year operating company
Net benefits
Table App2-7 Net benefits and Net Present Values (NPV)
END OF DOCUMENT