Graduate School of Economics, Kyushu University 6 … School of Economics, Kyushu University 6-19-1,...
29
1 Institutional investors, corporate social responsibility, and stock price performance Elizabeth Motta Graduate School of Economics, Kyushu University 6-19-1, Hakozaki, Higashiku Fukuoka 812-8581 JAPAN Konari Uchida * Faculty of Economics, Kyushu University 6-19-1, Hakozaki, Higashiku Fukuoka 812-8581 JAPAN Abstract The launch of the United Nations Global Compact Principles for Responsible Investment (PRI) in 2006 prompted the Japanese government to emphasize corporate social responsibility (CSR) in investment policies and put pressure on institutional investors to monitor environmental and social performance. We find that institutional ownership is positively related to the probability of improved social performance as measured by CSR ratings in the environment category for Japanese firms. Conversely, we find that these ownership variables are not significantly related to the likelihood of improved social performance as measured by ratings for social engagement, corporate governance, or employee relations. Improved ratings in the environment category do not generate excess stock returns in the period following the PRI launch. These results suggest that soft law aimed at institutional investors can enhance responsible business practices without destroying shareholder value, and that national government initiatives are an effective supplement to guidelines established by international organizations. We provide evidence of the influence of shareholder preference on CSR, and further contribute to the debate on the relation between corporate social and financial performance, in a research setting less vulnerable to endogeneity and reverse causality problems than other similar studies. Keywords: Corporate social responsibility; institutional ownership; shareholder preference; United Nations Global Compact Principles for Responsible Investment; stock price performance * Corresponding author. Faculty of Economics, Kyushu University 6-19-1, Hakozaki, Higashiku, Fukuoka 812-8581 JAPAN. Tel.: +81-92-642-2463 E-mail: [email protected]
-
Upload
nguyenmien -
Category
Documents
-
view
220 -
download
2
Transcript of Graduate School of Economics, Kyushu University 6 … School of Economics, Kyushu University 6-19-1,...
1
Institutional investors, corporate social responsibility, and stock price performance
Elizabeth Motta
Graduate School of Economics, Kyushu University
6-19-1, Hakozaki, Higashiku Fukuoka 812-8581 JAPAN
Konari Uchida*
Faculty of Economics, Kyushu University
6-19-1, Hakozaki, Higashiku Fukuoka 812-8581 JAPAN
Abstract
The launch of the United Nations Global Compact Principles for Responsible
Investment (PRI) in 2006 prompted the Japanese government to emphasize corporate
social responsibility (CSR) in investment policies and put pressure on institutional
investors to monitor environmental and social performance. We find that institutional
ownership is positively related to the probability of improved social performance as
measured by CSR ratings in the environment category for Japanese firms. Conversely,
we find that these ownership variables are not significantly related to the likelihood of
improved social performance as measured by ratings for social engagement, corporate
governance, or employee relations. Improved ratings in the environment category do not
generate excess stock returns in the period following the PRI launch. These results
suggest that soft law aimed at institutional investors can enhance responsible business
practices without destroying shareholder value, and that national government initiatives
are an effective supplement to guidelines established by international organizations. We
provide evidence of the influence of shareholder preference on CSR, and further
contribute to the debate on the relation between corporate social and financial
performance, in a research setting less vulnerable to endogeneity and reverse causality
problems than other similar studies.
Keywords: Corporate social responsibility; institutional ownership; shareholder
preference; United Nations Global Compact Principles for Responsible Investment;
stock price performance
* Corresponding author. Faculty of Economics, Kyushu University 6-19-1, Hakozaki, Higashiku,
Fukuoka 812-8581 JAPAN. Tel.: +81-92-642-2463 E-mail: [email protected]

2
1. Introduction
This paper attempts to investigate the effects of soft law aimed at institutional investors
in advancing corporate social performance (CSP). 1 Growing public awareness of
environmental and social issues, such as climate change and human rights, has led to a
heightened demand for financial mechanisms that enhance responsible business practice. In
2006, the United Nations Global Compact officially launched the Principles for
Responsible Investment (PRI), requiring institutional investors to introduce social and
environmental issues into their ownership policies and decision-making. Early studies
found a positive correlation between institutional ownership and social performance and
good governance (Coffey and Fryxell, 1991; Graves and Waddock, 1994; Cox et al., 2004),
but have not yet examined whether initiatives that set global standards for institutional
investors can effectively improve CSP in investee companies.
One branch of CSR research analyzes how stakeholders affect CSP and indicates that
shareholders, as one of the most influential stakeholders, have a significant influence on
CSP. Large institutional investors such as CalPERS have recently started to demonstrate a
commitment to CSR by investing in socially responsible companies and we therefore
expect the preference of shareholders, specifically large institutional investors, to have a
strong influence on CSP. Empirical studies that examine how institutional ownership affects
CSP may be subject to endogeneity problems and reverse causality problems, and therefore
have not reached a definitive conclusion on the direction of relation due to these concerns.
The launch of the PRI is an exogenous event that increased institutional investor preference
for CSR policies. By investigating the relation between institutional ownership and CSP
after the launch of the PRI, we reduce the endogeneity and reverse causality concerns
inherent in CSR research.
We further contribute to the long-held debate on the relation between CSP and
corporate financial performance (CFP) in our analysis. Friedman’s (1962) pragmatic
assertion that “few trends could so thoroughly undermine the very foundations of our free
society as the acceptance by corporate officials of a social responsibility other than to make
as much money for their stockholders as possible,” is frequently cited as the main
theoretical argument against CSR (Teraji, 2009; Schaefer, 2008). CSR proponents argue
1 CSP is a term commonly used to describe the extent of a company’s responsiveness to social policy and
their effectiveness in implementing policy, and is likewise adopted in this study.
3
that socially responsible activities generate substantial advantages such as goodwill and
new market opportunities (Guenster et al., 2011), and firms that ignore CSR destroy
long-run shareholder value due to loss of reputation and litigation risk. Existing empirical
research on how CSP affects CFP is likely subject to endogeneity and reverse causality
concerns. We view the shift in CSR ratings after the launch of the PRI, an exogenous event
for investee firms, as attributable to changes in institutional shareholder preference for CSR
activities. We also reexamine the CSP-CFP relation by investigating the characteristics of
stock returns for companies that improved CSR ratings after the launch of the PRI.
We choose to analyze the relation between institutional ownership and CSP in Japanese
firms because of the effective role that the Japanese government plays in introducing policy
change. The PRI covers all aspects of CSR including environmental protection, social
engagement, corporate governance, and human rights. We consider the role of the Japanese
government (Ministry of Environment) in diffusing the PRI to institutional investors with
specific emphasis on the environmental protection aspect of CSR.2 We are therefore able to
distinguish between improved CSP caused by changes in institutional investor preference
and improved CSP caused by omitted variables. Analyzing Japanese data allows us to
examine the role that national government actions play in promoting soft law initiated by
international organizations to improve business practices.
The results of our analysis indicate a positive relationship between institutional
ownership and the probability of improved ratings in the environmental protection category.
In contrast, institutional ownership has no significant impact on the likelihood of improved
ratings in the categories of social engagement, corporate governance, or employee relations.
We find no significant excess stock returns for firms that improve ratings for environmental
protection. These results suggest that the PRI improves business practices, at least to a
certain degree, without harming shareholder wealth.
We contribute to the literature by providing evidence that shareholder preference can
serve as an effective tool for international organizations to promote social business
practices. The results suggest that national government measures play an important role in
fostering initiatives put forth by international organizations to strengthen CSP. In addition
to policy implications, we demonstrate the importance of shareholder preference as a
determinant of CSP in a research setting less subject to endogeneity and reverse causality
concerns. We also contribute to long-held debates on the CSP-CFP relation with analyses
2 See UN Global Compact PRI website: http://www.unpri.org/
4
that mitigate methodological problems.
This paper proceeds as follows: The next section reviews related research in the field of
CSR. Section 3 provides an overview of the exogenous event used in this study and
presents the main hypothesis. Section 4 provides an overview of the sample period, data
sources, and detailed descriptions of the variables used in the analyses. Section 5 provides
the results and a detailed discussion about possible implications. The last section offers
concluding remarks.
2. Literature review
2.1. Determinants of corporate social behavior and performance
The PRI focuses on shareholder preference as the main driver of CSR, and existing
research in this field uses the stakeholder approach to explain the motivation for CSR (Van
der Laan et al., 2008; Renneboog et al., 2008). Freeman (1984) was one of the first to
establish the concept of the stakeholder as, “groups, organizations, or persons affected by
the actions of a firm.” Stakeholders can be subdivided into primary stakeholders
(employees, customers, and suppliers) and secondary stakeholders (local communities and
local legislative government) based on their proximity to a firm’s business activities (Jensen,
2001; Clarkson, 1995; Hillman and Kleim, 2001). Dhaliwal et al. (2014) and Van der Laan
et al. (2008) use company relations with primary stakeholders (e.g. employees) to explain
driving factors of CSP and argue that propagating relationships with key stakeholder groups
leads to long-term competitive advantages and improved CFP. Cheng et al. (2014), argue
that the ability of a firm to satisfy multiple stakeholder groups has also been found to
decrease the risk of financial decline.
An extension of stakeholder theory by Mitchell et al. (1997) proposes that, in addition
to being classified by their proximity to a firm’s business transactions, stakeholders can be
divided based on the distribution of three key attributes: power, legitimacy, and urgency.
High salience stakeholders are those that have the power to reward or punish a company
based on its response to their claims. The rules used to subdivide stakeholders can also be
applied to shareholders in terms of power, legitimacy, and urgency (Jensen, 2001; Barnea
and Rubin, 2010). Mitchell et al. (1997) indicate that shareholders possess the power to
make urgent and legitimate claims, and therefore have the greatest influence over firm
actions and decision-making processes. We interpret this as an indicator that shareholder
5
preference significantly affects CSP.
The PRI highlights the role of institutional investors, a group of shareholders with large
shareholdings and influence over firm decision-making, to advocate behaviors that improve
CSP. Previous studies in corporate finance provide evidence that institutional investors
monitor management and influence governance structures of investee firms (Aggarwal et
al., 2011; Demiralp et al., 2011; Hartzell and Starks, 2003; Helwege et al., 2012; Shinozaki
et al., 2015). However, no definitive conclusion has been reached on the direction or
existence of a relation between institutional ownership and CSP. Assuming that the
correlation between CSP and CFP is negative (positive), the presence of institutional
investors with large shareholdings should lead to a reduction (increase) in CSR measures.
Barnea and Rubin (2010) find a negative correlation between CSR expenditure and
ownership of insiders (large blockholders and managers) but no correlation between CSP
and institutional investors.
Recently, large institutional investors such as CalPERS, have started to publicize
policies that promote CSR, and actively invest in socially responsible companies. Graves
and Waddock (1994) find that institutional investors are favorably inclined toward
companies with higher CSP when other factors are held constant and provide evidence of a
positive correlation between improved CSP and institutional investment. Coffey and
Fryxell (1991) examine the influence of institutional investors and find a positive relation
between the percentage of institutional ownership and CSP when CSP is measured by
representation of women on a board of directors. Cox et al. (2004) find that long-term
institutional investment is positively related to CSP in a study that investigates the pattern
of institutional shareholdings in the UK and their relationship to socially responsible
behaviors.
2.2 The relation between corporate social and financial performance
Pava and Krausz (1996) provide a comprehensive review of papers published from
1972 to 1992 on the direct effects of CSP on CFP and indicate an overall insignificant or
positive relation. Ruf et al. (2001) argue that changes in CSR ratings that occurred from
1991 to 1992 are positively related to sales growth from 1991 to 1993. Al-Tuwaijri et al.
(2004) adopt a simultaneous regression approach to examine the links between corporate
environmental disclosure, environmental performance, and CFP and find that
environmental performance has a positive effect on CFP. Renneboog et al. (2008) also
6
argue that CSR creates long-term shareholder value. Fisher-Vanden and Thorburn (2011),
however, find that companies that announce enrollment in the EPA’s Climate Leaders
program, a project that targets reductions in greenhouse gas emissions, have significantly
negative stock returns. McWilliams and Siegel (2001) suggest that a threshold level of
engagement in CSR activities exists beyond which CSR is no longer beneficial. Jensen
(2001) proposes an “enlightened stakeholder theory” that specifies that firms should seek to
maximize long-term final market value.
Researchers have also examined whether CSP affects factors that are related to firm
value. Suto and Takehara (2013) suggest a positive correlation between CSP and CFP in
Japanese firms, and support the CSR risk-reduction hypothesis, which maintains that firms
can reduce risk through CSR. El Ghoul et al. (2011) also indicate a positive correlation
through evidence that the cost of equity capital is lower for high CSP firms than low CSP
firms due to the relative size of a firm’s investor base and perceived risk.
3. Research design and hypothesis
Recent increased demand for voluntary public disclosure of firm investments and
activities has prompted initiatives by international organizations such as the United Nations
Environmental Programme Finance Initiative (UNEP FI), Global Reporting Initiative (GRI)
and the United Nations Global Compact. The Global Compact was launched in 2000 with
the intention of increasing corporate awareness and effectiveness in environment, social,
and governance (ESG) issues.3 This paper focuses on the Global Compact Principles for
Responsible Investment (PRI), developed by UN Secretary General Kofi Annan and a
group of the world’s largest institutional investors in 2005, and officially launched in 2006.4
The PRI highlights the role of key institutional investors in ESG issues and emphasizes
“active ownership,” that advises investors to use their rights acquired through shareholdings,
and influence gained through visibility, to encourage companies to improve management
systems, ESG performance, and reporting (Aust, 2013).
This paper investigates the effects of the PRI on CSP in Japanese companies. Although
some researchers find a positive correlation between institutional ownership and CSP
(Coffey and Fryxell, 1991; Graves and Waddock, 1994; Cox et al., 2004), few studies
3 See UN Global Compact PRI website: http://www.unpri.org/ 4 As of 2014, the UN Global Compact had a total of 7,000 corporate signatories in 135 countries.
7
examine the effects of soft law established by international organizations on CSR through
shareholder preference. This research will help create an empirical foundation for the
construction of socially beneficial economic policy. Our results provide evidence on the
relation between shareholder preference and CSP by mitigating the endogeneity problems
that may lead to biased findings. A typical example of an endogeneity problem is that
omitted (or unobservable) factors associated with CSR activities (e.g., firm reputation or
social scrutiny) generate misleading results that show a correlation between the other
variables under consideration.
CSR researchers utilize a variety of techniques to mitigate reverse causality problems
including: analysis of change-and-change relations (Ruf et al., 2001), the simultaneous
regression approach (Al-Tuwaijri et al., 2004), and event studies (Fisher-Vanden and
Thorburn, 2011). This paper takes advantage of an exogenous shock that affects
institutional investor preference and captures the pure effects of shareholder preference for
CSR through changes in CSR ratings. Our analysis reduces endogeneity problems as we
can assume that other firm characteristics (including unobserved) are unaffected by the
exogenous shock. We also mitigate reverse causality concerns, as it would be extremely
difficult for firms to change their ownership structures in anticipation of an exogenous
shock. Following current methods in corporate governance research that simulate
quasi-experimental research settings by adopting regulation changes (Black and Kim, 2012;
Chhaochharia and Grinstein, 2007; Dahya and McConnell, 2007), we similarly simulate a
quasi-experimental setting by adopting an exogenous shock to address endogeneity
problems.
By creating an international discussion on ESG issues, the launch and distribution of
the PRI generated a succession of national initiatives that work toward promoting CSR
activities outlined in the PRI framework. Typical examples of actions categorized as CSR
include voluntary community outreach, charitable donations, education promotion,
environmental stewardship, and fair treatment of employees by an individual firm (Lin-Hi
and Müller, 2013; Orlitzky and Benjamin, 2001). A unique characteristic of the
dissemination of the PRI in Japan is the special focus on the environmental attribute of
CSR. After the introduction of the PRI in early 2006, the Ministry of Environment set up
the Round Table Conference on the Environment and Finance to discuss the role of
businesses in protecting the environment. In May, the Development Bank of Japan (DBJ)
held the PRI Press Conference in Tokyo further contributing to the increase in information
8
transparency regarding effective means of advocating CSR after the PRI launch. In July, the
Ministry of Environment created the report, “Expanding the Flow of Environmentally
Conscious Money,” that outlines practical ways for businesses to combine “environmental
power” and “financial power.”5 In August, the Minister of the Environment and the
Financial Services Minister led discussions about CSR with private investors, corporate
representatives, and security industry insiders at the Symposium on the Environment and
Finance.6 The focus on the environmental protection attribute of CSR enables us to
examine whether national governmental measures play a role in furthering initiatives by
international organizations to increase CSR activities. Based on the aforementioned
discussion, this paper tests the following hypothesis:
Hypothesis 1: Firms with higher percentages of ownership by institutional investors
improved CSR ratings, especially in terms of environmental protection, following the
launch of the UN Global Compact PRI and the Ministry of Environment Roundtables.
Contingent on proving Hypothesis 1, that a relation exists between institutional
ownership and improved ratings in the environmental protection category, this study
examines whether or not improvements in CSP are conducted at the expense of shareholder
wealth. A possible alternative explanation for a relation between shareholders and financial
performance is that firms with high institutional ownership sacrifice minority shareholder
wealth in order to increase CSP for private interests. In this case, firms that improved CSR
ratings would experience significantly negative stock returns. In contrast, if CSR
improvements do not harm minority shareholder wealth, there should be no significant
excess stock return. The second hypothesis takes the former view into account:
Hypothesis 2: Firms that improved CSR ratings in environmental protection following the
PRI and the Japanese Ministry of Environment Roundtables experience negative excess
returns.
Although a vast body of CSR literature examines the link between CSP and CFP, the
analysis used in earlier studies may be subject to endogeneity and reverse causality issues.
5 See UN Global Compact PRI website: http://www.unpri.org/ 6 The symposium was sponsored by the Project for Dissemination of Securities Knowledge, and supported by
the Ministry of Environment, the Japanese Bankers Association, and the Financial Services Agency.
9
This study investigates whether stock prices are adversely affected by improved CSR
ratings induced by an exogenous shock, the PRI and Japanese Ministry of Environment
Roundtables. Our analysis contributes to the literature by examining the CSP-CFP relation
and reduces endogeneity problems inherent in CSR research.
4. Sample selection and data
We use CSR ratings data for Japanese firms obtained from the Toyo Keizai CSR
database as a proxy for CSP. Companies listed in the Toyo Keizai CSR database are rated
on performance in four categories: environment, social engagement, corporate governance,
and employee relations. The subdivision of CSR ratings into four categories allows us to
examine the role that the national government plays in promoting CSR and determine if the
government favors a specific category. Toyo Keizai scores performance in each of the four
categories based on a five-score rating system: AAA represents the best performance, AA,
A, B represent levels of possible improvement, C represents the worst performance, and –
represents unreported ratings and therefore cannot be interpreted. All available ratings from
2007 to 2012 were collected and used in the empirical analysis.7 Examples of firms with
high CSR ratings (AAA in all attributes) include internationally reputable companies such
as the food additive provider Ajinomoto, the beer company Kirin Holdings Co., Ltd., and
the automobile maker Toyota Motor Corporation.
Financial data for Japanese firms was collected from the Nikkei NEEDS Financial
Quest database. Corporate governance data, including institutional ownership, was
collected from the Nikkei NEEDS Cges database. This data was merged with the Toyo
Keizai CSR rating data, and unlisted companies in the Toyo Keizai CSR database were
eliminated from the analysis due to unavailable financial data. Companies that were not
rated by Toyo Keizai for all three (five) years in the sample period were also eliminated
from the final dataset.
We hypothesize that institutional investors pressure investee companies to increase CSR
activities, especially environmental protection measures, after an exogenous shock in 2006:
the launch of the PRI and the Japanese Ministry of Environment Roundtables. Assuming
7 The first Toyo Keizai CSR database book was published in 2006. The four rating categories were
established and made available starting from the year 2006. The basic categories have remained the same for
all years data is available but the grading criteria used to rate each category has increased in detail notably
since 2006.
10
that effective CSP improvement takes time, this study designates 2007 as the starting year
of the investigation, and 2007 (year t) CSR data is available in the 2008 (year t + 1) version
of the data book.8 Since drastic changes in CSR ratings (e.g. from B to AA) are relatively
rare, a binary variable (D_IMPROVE) is employed as the main variable to indicate firms
that improve CSR ratings over the three- (five-) year period from 2007 to 2010 (2012)
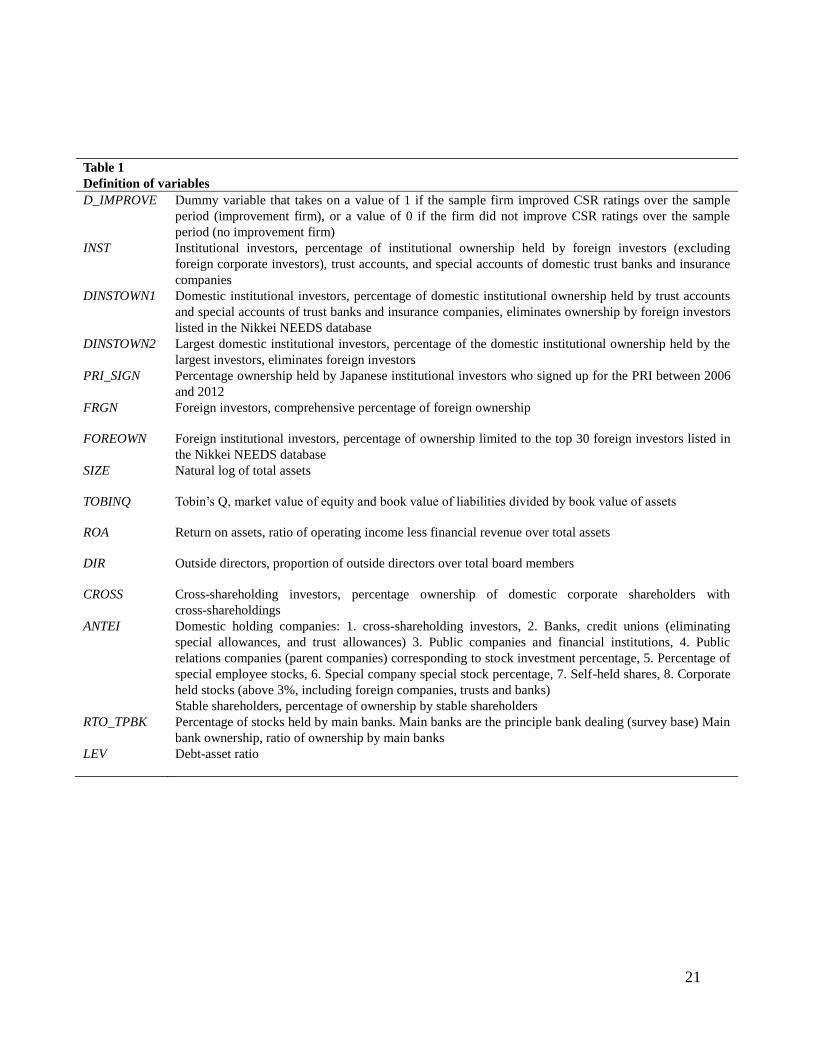
rather than the magnitude of the rating change (see Table 1 for definitions of variables).9
D_IMPROVE takes on a value of 1 if the firm is an improvement firm and a value of 0 if
the firm is a no improvement firm. Separately, improvement firms are those that improve
ratings over the three- (five-) year period from 2007 to 2010 (2012) and no improvement
firms are those that experience a decline in, or have stable CSR ratings over the three (five)
year period. Since this study focuses on whether the PRI and Japanese Ministry of
Environment increase CSR monitoring by institutional investors that leads to improved
CSR, negative shifts from B to C or stable ratings such as C to C are equally considered no
improvement firms. Companies are deleted from the analysis when ratings for the three-
(five-) year sample period or institutional ownership data are unavailable.
[Insert Table 1 about here]
Table 2 reports summary statistics for environment ratings of sample firms obtained
from the Toyo Keizai CSR database. Of the 471 sample firms in the three-year period from
2007 to 2010, 108 firms (23%) improved environment ratings, and 363 firms (77%) did not
improve environment ratings. Of the 443 sample firms over the five-year period from 2007
to 2012, 107 firms (24%) improved environment ratings and 336 firms (76%) did not
improve. The other CSR categories show similar proportions of improvement and no
improvement firms, with around 20 percent of sample companies improving ratings in each
of the CSR attributes. The five-year sample similarly shows a higher frequency of rating
improvements, of around 25% of sample companies, in all attributes.
[Insert Table 2 about here]
Logit regressions using D_IMPROVE are used to test Hypothesis 1, that there is a
positive relation between institutional ownership and improved CSR environment ratings.
The key independent variable is the percentage ownership by institutional investors (INST)
in year 2007. Data for INST is available in the Nikkei NEEDS Cges database and defined
as ownership held by corporations, foreign investors (excluding foreign corporations), trust
8 Toyo Keizai distributes surveys in July of each year and receives responses by September. 9 D_IMPROVE is tested for all four CSR attributes in this study.
11
accounts, and special accounts of domestic insurance companies. INST does not include
ownership by domestic banks and self-accounts of domestic trust banks and insurance
companies that historically were the main holders of cross-shareholdings and the source of
entrenchment problems (Shinozaki et al., 2015).
We create three additional variables using data from institutional ownership.
DINSTOWN specifies the percentage of ownership held exclusively by domestic
institutional investors, and DINSTOWN2 further specifies the percentage of ownership
held by the largest domestic institutional investors. The variable PRI_SIGN identifies
domestic institutional investors who signed up for the PRI between 2006 and 2012. In
mid-2006, four large domestic institutional investors became the first Japanese signatories
to the PRI: Sumitomo Trust & Banking Co., Mitsubishi UFJ Trust & Banking, Daiwa Asset
Management, and Sompo Japan. By using the Nikkei NEEDS Large Shareholder Database,
we compute the percentage ownership held by the founding and succeeding PRI signatories
as well as the affected subsidiaries for each of the sample companies. Using information
available on the PRI website and company websites, we designate the year that each
investor signed up to the initiative and determine ownership starting from that year.
Table 3 reports results of the univariate analysis of ownership variables for
improvement and no improvement companies. In general, we find that improvement firms
have significantly higher values for all ownership variables in both the three- and five-year
sample periods. The summary statistics can be interpreted as firms with high institutional
ownership being more likely to make a general effort to improve CSR than those with low
institutional ownership after the implementation of the PRI and the Ministry of
Environment Roundtables. The possibility that firm characteristics such as size, the degree
of social scrutiny, and corporate culture affect both institutional ownership and CSR ratings
cannot be ruled out.
[Insert Table 3 about here]
The logit regression used in our analysis includes several control variables for
observable firm characteristics. To control for the size effect, that larger firms tend to have
better CSP (Ioannou and Serafeim, 2012; Barnea and Rubin, 2010), firm size is measured
by the natural logarithm of total assets. To account for the possibility that entrenched
(incentivized) managers spend more (less) on CSR activities, we control for ownership by
cross-shareholding investors (directors) (Aggarwal et al., 2011; Morck and Nakamura,
1999; Cespa and Cestone, 2007). We also control for the influence of outside directors on a
12
board of directors to encourage (discourage) CSR activities (Barnea and Rubin, 2010;
Erhemjamts et al., 2012; Murphy and Schlegelmilch, 2013, Dhaliwal et al., 2011).
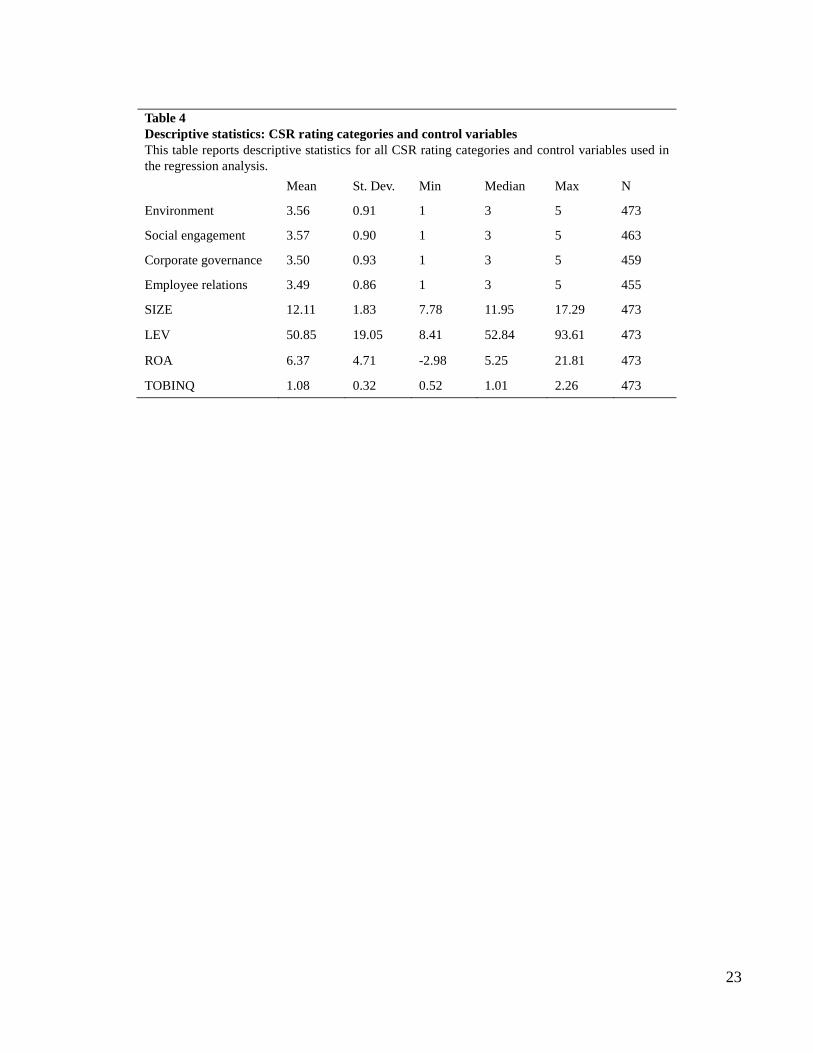
Table 4 presents descriptive statistics for the control variables used in the regression
analysis. For comparison, Table 4 includes statistics for social engagement, corporate
governance, and employee relations ratings to demonstrate the similarity in distribution
across all four categories.
[Insert Table 4 about here]
In order to contribute to the prevailing discussion in CSR literature regarding CSP and
CFP, this study uses the CAPM, Fama-French 3-factor model, and the
Fama-French-Carhart 4-factor model (Fama and French, 1992; Carhart, 1997; Bauer et al.,
2005), to test the effects of improved CSP on stock price performance. We implement
calendar-time portfolio regressions for monthly stock returns of sample companies in the
period from April 2007 to March 2010 (March 2011) to compare excess return (alpha)
between improvement and no improvement groups. We acquired stock return data from the
Nikkei NEEDS Portfolio Master database, and Fama and French Factor data from Kenneth
R. French’s online data library.10
5. Empirical results
5.1 Institutional ownership and improved CSR ratings
We adopt D_IMPROVE as the dependent variable in the logit regression analysis to
examine whether or not institutional ownership is associated with positive shifts in CSR
ratings after controlling for various factors. Specifically, the following model is estimated:
Pr D_ IMPROVE =1( ) =g0 +g1(INSTorDINSTOWNorDINSTOWN2)i,2007 + gkControlk,2007
k
å +ei
The coefficient of INST (DINSTOWN or DINSTOWN2) can be interpreted as the
effect of a high percentage of institutional ownership on the probability of a positive shift in
CSR ratings. Table 5 reports logit regression results for changes in the environment rating.
Consistent with Hypothesis 1, that the PRI and the report by the Japanese Ministry of
Environment led institutional investors to push for improved CSR, the results indicate a
positive and significant coefficient of INST, DINSTOWN and DINSTOWN2 suggesting
that firms with higher institutional ownership in 2007 are more likely to improve
10 The file was created using the Nov. 2015 Bloomberg database.
13
environment ratings in the three- and five-year sample periods starting in 2007.
We find that INST, DINSTOWN, and DINSTOWN2 are positive and significant for
both the three- and five-year sample. These results indicate that higher percentages of
domestic institutional investors lead to the incorporation of national governmental measures
in investee companies’ CSR policies, and subsequently leads to a rise in environment
ratings in both periods. Hypothesis 1 predicts that the positive relation between ratings
changes and institutional ownership is evident specifically for the environment rating.
Consistent with this hypothesis, regressions for other CSR categories (unreported) show
insignificant coefficients of ownership variables. Also, FRGN is significant for the
three-year sample period which may be interpreted as foreign investors supporting the PRI
and pushing company policy to improve environmental protection measures in the
short-run.
[Insert Table 5 about here]
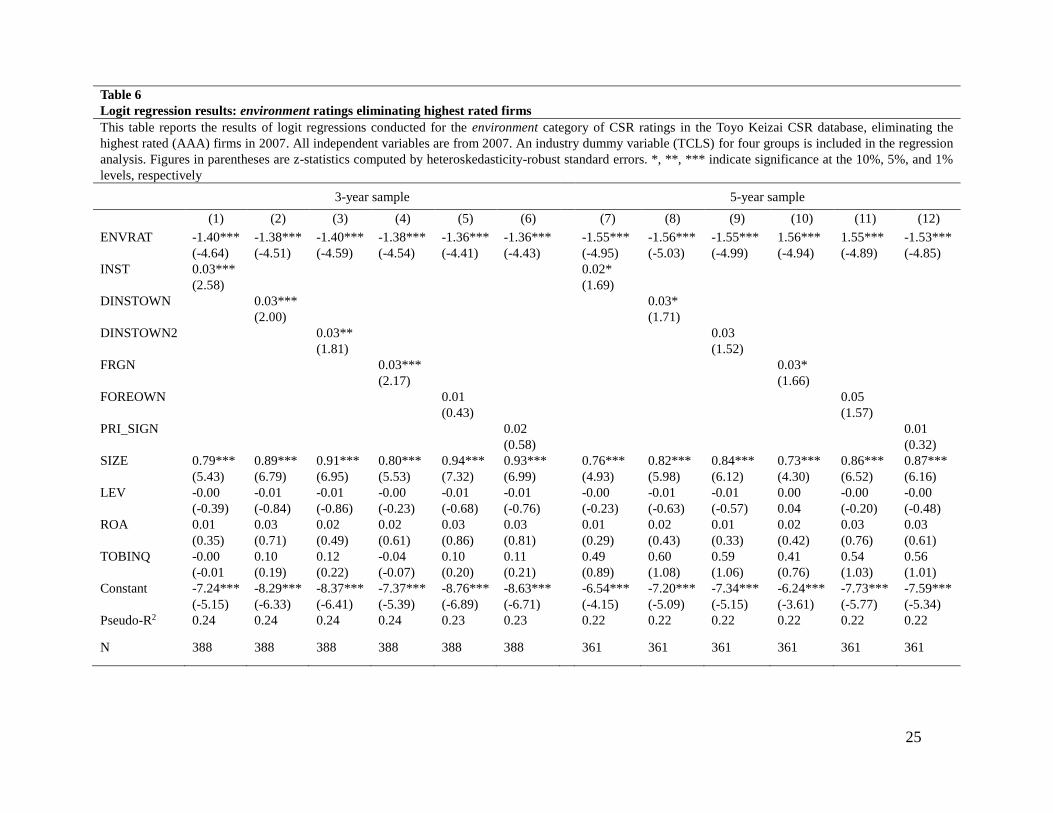
As a robustness check of the positive relation found between INST, DINSTOWN, and
DINSTOWN2 and environment ratings, we eliminate companies with the highest rating of
AAA in environment in 2007. Table 6 provides regression results for the sample,
eliminating companies with ratings of AAA in 2007 in this category. The relation between
INST, DINSTOWN, DINSTOWN2 and improvements in environment ratings remain
significant and positive in the three-year sample period and marginally significant in the
five-year period. The weakened relation between the ownership variables and the
probability of an improved rating may be attributable to the disproportionate elimination of
firms from the no improvement group. Since the only movement that firms with AAA
ratings in 2007 may experience is a decline, these firms were eliminated from the no
improvement group.
[Insert Table 6 about here]
The results of our analysis indicate a significant relation between institutional
ownership and changes in environment ratings. A potential criticism of our finding is that
firms with specific (unobserved) characteristics generally follow social norms (improve
CSR ratings), and these firms also had high institutional ownership during the period under
investigation. Indeed, the variable SIZE, which may proxy for the degree of social scrutiny,
consistently has a positive and significant coefficient. We stress that insignificant
coefficients of ownership variables for other CSR categories rule out the endogeneity
concern. The collective results suggest that soft law initiated by international organizations
14
(the PRI) fosters good business practices and that national government initiatives play a
significant role in disseminating soft law.
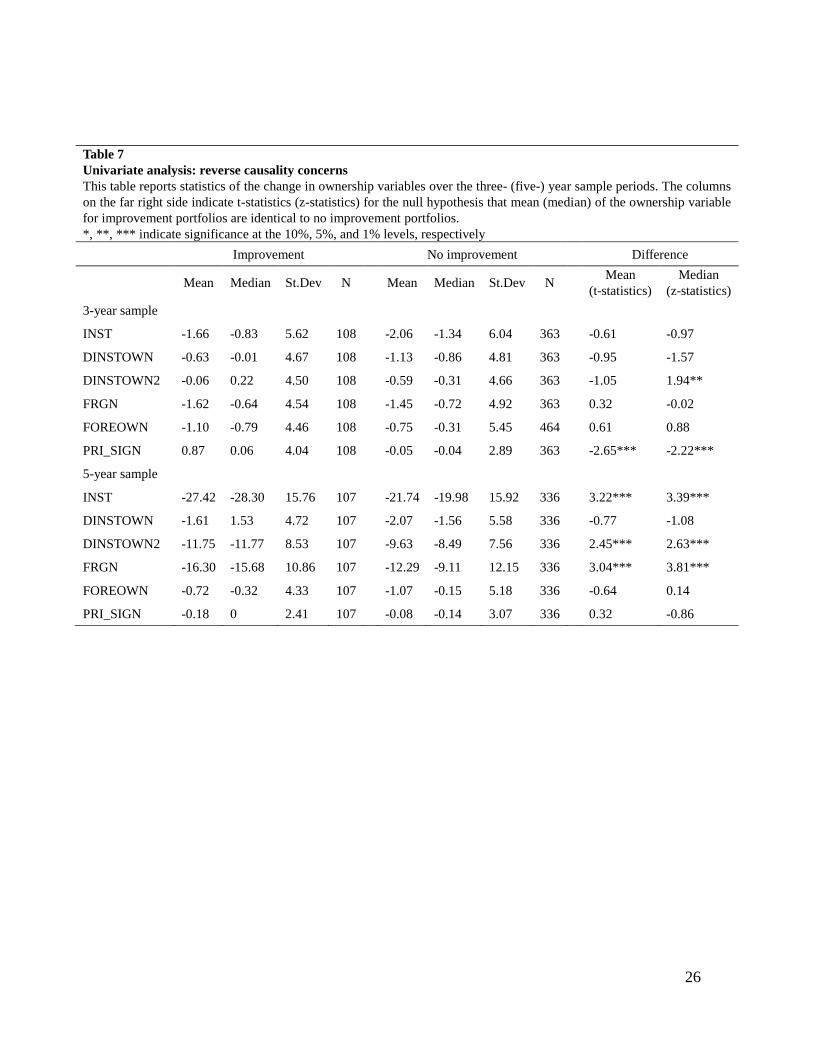
To mitigate reverse causality concerns, we conduct further univariate analysis on the
change in the ownership variables over the three- and five-year sample periods. The results
are reported in Table 7. We find that the ownership variables are higher for improvement
firms than no improvement firms. Differences in means and medians of DINSTOWN and
FOREOWN are not significant for either the three- or five-year sample periods indicating
no possibility that an increase in percentage ownership by domestic institutional investors
or the top foreign investors simply coincided with environment rating improvements. INST,
DINSTOWN2, and FRGN are not significant in the three-year sample period but show
positive and significant differences in means and medians over the five-year sample period.
We do not expect that this correlation significantly affects the results of our analysis.
[Insert Table 7 about here]
5.2 CSR improvement and stock price performance
The second objective of this study is to determine if improved CSP, derived from the
PRI and Japanese Ministry of Environment, destroys shareholder wealth (Hypothesis 2).
The results of the logit regressions in the former section suggest that firms with high INST,
DINSTOWN, and DINSTOWN2 in 2007 are likely to improve CSR environment ratings
over the three- (five-) year period from 2007. This section investigates the effects of
movements in environment ratings on shareholder wealth. Although numerous studies
examine the relation between CSP and CFP, it is extremely difficult to avoid reverse
causality and endogeneity problems (Waddock and Graves, 1997). Given that improved
CSR ratings originate from an exogenous shock, this study effectively avoids endogeneity
problems that may be inherent in CSR research (Dhaliwal et al., 2011; Erhemjamts et al.,
2012; Becchetti et al., 2012; Waddock and Graves, 1997).
Our analysis investigates stock returns of the improvement firm portfolio and the no
improvement firm portfolio for environment ratings. In order to test Hypothesis 2, that
improved CSR environment ratings lead to negative excess returns, we estimate the Fama
and French 3-factor and Fama-French-Carhart 4-Factor models with monthly stock returns
for the three- (five-) year sample period starting in April 2008.11 This analysis controls for
characteristics specific to ethical companies, such as firm size, that may affect stock returns
11 For most Japanese companies, the accounting year ends in March (accounting year 2007 ends in March
2008). Since we found changes in environment ratings from year 2007 to 2010 (2012), we analyze stock
returns in the corresponding period.
15
(Galema, 2008). We employ equally-weighted portfolios to compute portfolio returns.
The estimation results for environment ratings are presented in Table 8. The fact that
there are no significant coefficients of alpha for improvement portfolios suggests that
improved environment ratings following the PRI and Japanese Ministry of Environment
Roundtables do not adversely affect firm value. In conjunction with the former results, this
finding indicates that the PRI and Japanese Ministry of Environment improved CSP
without destroying shareholder wealth. We stress that this research contributes to the
literature by discussing the CSP-CFP link in a research setting that substantially mitigates
endogeneity problems.
[Insert Table 8 about here]
Table 8 indicates that the improvement portfolio for environment has a significantly
larger coefficient of market risk premium (RM – Rf) than the no improvement portfolio.
These results may signify that representative companies, that are strongly correlated to
market returns, are likely to improve environment ratings. The coefficients of HML derived
from the estimation are smaller for the improvement portfolio than for the no improvement
portfolio indicating that firms with low book-to-market ratios are likely to enhance CSR
activities during the period under analysis.
As an additional robustness check, this study further investigates the change in
operating performance, using industry-adjusted ROA (operating income over assets) as a
proxy for the three (five) year sample period starting in 2007. No significant difference in
the change of industry-adjusted ROA between improvement and no improvement firms are
found in the unreported results.
6. Conclusion
Increasing public awareness of environmental and social issues has created the need for
investigation into the effectiveness of soft law on investor behavior. We therefore
investigate the effects of the PRI, that urges institutional investors to introduce ESG issues
into ownership policy and decision-making, and the ultimate effects on CSP. We focus our
study on Japanese companies and ratings related to environmental protection in order to
examine the effectiveness of the Japanese Government’s Ministry of Environment in
disseminating the PRI through domestic institutional investors. This research setting
enables us to examine the role of national government support in promoting social business

16
practice and implementing soft law initiated by international organizations.
We find that institutional ownership and ownership by PRI signatories are positively
related to the probability of improved environment ratings in both the three- and five-year
sample periods starting in 2007. However, we find no significant relation between the
ownership variables and the probability of improved ratings in other CSR attributes (social
engagement, corporate governance and employee relations). These results suggest that soft
law geared toward investor behavior can improve business practice, at least to a certain
degree, through shareholder preference. This further suggests that national government
initiatives play an important role in fostering the dissemination of soft law launched by
international organizations. Finally, we find no evidence of negative effects on shareholder
wealth due to improved environment ratings stemming from the PRI.
In addition to providing policy implications for the effectiveness of soft law on
investors, we make several important contributions to the existing CSR literature. Previous
studies show significant correlations between institutional ownership and CSR (Coffey and
Fryxell, 1991; Graves and Waddock, 1994; Cox et al., 2004) but it is extremely difficult to
effectively address endogeneity issues. By taking advantage of an exogenous event for
institutional investors and investee firms, we provide evidence of the significant influence
that institutional shareholders have on CSR, and substantially mitigate endogeneity
problems. The results also suggest that shareholder preference is an important determinant
of CSP. Although the long-standing debate on the CSP-CFP relationship remains
inconclusive (Pava and Krausz, 1996; Ruf et al., 2001; Al-Tuwaijri et al., 2004; Renneboog,
et al., 2008; Fisher-Vanden and Thorburn, 2011), our findings indicate that CSP does not
affect CFP in a research setting less subject to endogeneity and reverse causality concerns.
17
References
Aggarwal, R., I, Erel, M. Ferreira, and P. Matos (2011). “Does governance travel around the world? Evidence from institutional investors.” Journal of Financial Economics 100, 154-81. Al-Tuwaijri, S.A., T.E. Christensen, and K.E. Hughes (2004), “The Relations Among Environmental Disclosure, Environmental Performance, and Economic Performance: A Simultaneous Equations Approach,” Accounting, Organizations and Society 29 (5-6), 447-472. Aust, D.N. (2013), “Enhancing Shareholder Value by Improving Sustainability Performance.” Corporate Finance Review 17 (6), 11-15. Barnea, A. and A. Rubin (2010), “Corporate Social Responsibility as a Conflict between Shareholders.” Journal of Business Ethics 97, 71-86. Bauer, R., K. Koedijik, R. Otten (2005), “International Evidence on Ethical Mutual Fund Performance and Investment Style.” Journal of Banking and Finance 29, 1751-67. Becchetti, L., R. Ciciretti, I. Hasan and N. Kobeissi (2012), “Corporate Social Responsibility and Shareholder’s Value.” Journal of Business Research 65, 1628-1635. Black, B. and W. Kim (2012), “The Effect of Board Structure on Firm Value: A Multiple Identification Strategies Approach Using Korean Data.” Journal of Financial Economics 104, 203-26. Carhart, M. (1997), “On Persistence of Mutual Fund Performance.” Journal of Finance 52, 57-82. Cespa, G., and G. Cestone (2007), “Corporate Social Responsibility and Managerial Entrenchment.” ECGI Working Paper Series in Finance. Cheng, B., I. Ioannu, and G. Serafim (2014), “Corporate Social Responsibility and Access to Finance.” Strategic Management Journal 35, 1-23. Chhaochharia, V. and Y. Grinstein (2007), “Corporate Governance and Firm Value: The Impact of the 2002 Governance Rules. Journal of Finance 62, 1789-1825. Clarkson, M.B.E. (1995), “A Stakeholder Framework for Analyzing and Evaluating Corporate Social Performance.” Academy of Management Review 20, 92-117. Coffey, B.S. and G.E. Fryxell (1991), “Institutional Ownership of Stock and Dimensions of Corporate Social Performance: An Empirical Examination.” Journal of Business Ethics 10, 437-44. Cox, P., S. Brammer, and A. Millington (2004), “An Empirical Examination of Institutional Investor Preferences for Corporate Social Performance.” Journal of Business Ethics 52, 27-43.

18
Dahya, J. and J. J. McConnell (2007), “Board Composition, Corporate Performance, and the Cadbury Committee Recommendation.” Journal of Financial and Quantitative Analysis 42, 535-64. Demiralp , I., D. Ranjan, F. P. Schlingemann, and V. Subramaniam (2011), “Are there monitoring benefits to institutional ownership? Evidence from seasoned equity offerings.” Journal of Corporate Finance 17, 1340-59. Dhaliwal, D.S., O.Z. Li, A. Tsang, and Y.G. Yang (2011), “Voluntary Nonfinancial Disclosure and the Cost of Equity Capital: The Initiation of Corporate Social Responsibility Reporting.” The Accounting Review 86 (1) 59-100. Dhaliwal, D.S., O.Z. Li, A. Tsang, and Y.G. Yang (2014), “Corporate Social Responsibility Disclosure and the Cost of Equity Capital: The Roles of Stakeholder Orientation and Financial Transparency.” Journal of Accounting and Public Policy 33, 328-55. El Ghoul, S., O. Guedhami, C.C.Y. Kwok, and D.R. Mishra (2011), “Does Corporate Social Responsibility Affect the Cost of Capital?” Journal of Banking & Finance 35, 2388-406. Erhemjamts, O., Q. Li, and A. Venkateswaran (2012), “Corporate Social Responsibility and Its Impact on Firms’ Investment Policy, Organizational Structure, and Performance.” Journal of Business Ethics 118, 395-412. Fama, E.F. and K.R. French (1992), “The Cross-Section of Expected Stock Returns.” The Journal of Finance 47, 427-65. Fisher-Vanden, K., and K.S. Thorburn (2011), “Voluntary Corporate Environmental Initiatives and Shareholder Wealth.” Journal of Environmental Economics and Management 62, 430-45. Freeman, R.E. (1984), Strategic Management: A Stakeholder Perspective. Pitman: Boston, MA. Friedman, M. (1962), Capitalism and Freedom. The University of Chicago Press: Chicago, IL. Guenster, N., R. Bauer, J. Derwall, K. Koedijk (2011), “The Economic Value of Corporate Eco-Efficiency.” European Financial Management 17, 679-704. Galema, R., A. Plantinga, and B. Scholtens (2008), “The Stocks at Stake: Return and Risk in Socially Responsible Investment.” Journal of Banking & Finance 32, 2646-54. Graves, S.B., Waddock, S.A. (1994), “Institutional Owners and Corporate Social Performance. Academy of Management Journal 37 (4), 1034-46. Hartzell, J.C. and L.T. Starks (2003), “Institutional Investors and Executive Compensation.” Journal of Finance 58 (6), 2351-74. Helwege, J., V. J. Intintoli, and A. Zhang (2012), “Voting with their feet or activism? Institutional investors’ impacts on CEO turnover.” Journal of Corporate Finance 18, 22-37.

19
Hillman, A.J. and G.D. Kleim (2001), “Shareholder Value, Stakeholder Management and Social Issues: What’s the Bottom Line?” Strategic Management Journal 22, 125-39. Ioannou I., and G. Serafeim (2012), “What Drives Corporate Social Performance? The Role of Nation-Level Institutions.” Journal of International Business Studies 43 (9), 834-64. Jensen, M.C. (2001), “Value Maximisation, Stakeholder Theory, and the Corporate Objective Function.” European Financial Management 7, 297-317. Jensen, M.C. and W.H. Meckling (1978), “Theory of the Firm: Managerial Behavior, Agency Costs and Ownership Structure.” Journal of Financial Economics 3, 305-60. Lin-Hi, N. and K. Müller (2013), “The CSR Bottom Line: Preventing Corporate Social Irresponsibility.” Journal of Business Research 66, 1928-36. McWilliams, A. and D. Siegel (2001), “Corporate Social Responsibility: A Theory of the Firm Perspective.” The Academy of Management Review 26 (1), 117-27. Mitchell, R.K., B.R. Agle, and D.J. Wood (1997), “Toward a Theory of Stakeholder Identification and Salience: Defining the Principle of Who and What Really Counts.” Academy of Management Review 22 (4), 853-86. Morck, R. and M. Nakamura (1999), “Banks and Corporate Control in Japan.” The Journal of Finance 74 (1), 319-39. Murphy, P.E. and B.B. Schlegelmilch (2013), “Corporate Social Responsibility and Corporate Social Irresponsibility: Introduction to a Special Topic Section.” Journal of Business Research 66, 1807-13. Orlitzky, M. and J.D. Benjamin (2001), “Corporate Social Performance and Firm Risk: A Meta-Analytic Review.” Business and Society 40, 369-92. Pava, M.L. and J. Krausz (1996), “The Association Between Corporate Social Responsibility and Financial Performance: The Paradox of Social Cost.” Journal of Business Ethics 15 (3), 321-57. Renneboog, L., J.T. Horst, and C. Zhang (2008), “Socially Responsible Investments: Institutional Aspects, Performance and Investor Behavior.” Journal of Banking & Finance 32, 1723-42. Ruf et al. (2001), “An Empirical Investigation of the Relationship Between Change in Corporate Social Performance and Financial Performance: A Stakeholder Theory Perspective. Journal of Business Ethics, 32 (2), 143-156. Schaefer, B.P. (2008), “Shareholders and Social Responsibility,” Journal of Business Ethics 81, 297-312. Shinozaki, S., H. Moriyasu, and K. Uchida (2015), “Shareholder Composition and Managerial Compensation.” Journal of Financial and Quantitative Analysis, forthcoming.
20
Suto, M. and H. Takehara (2013), “The Impact of Corporate Social Performance on Financial Performance: Evidence from Japan.” Working Paper, Waseda University. Teraji, S. (2009), “A Model of Corporate Social Performance: Social Satisfaction and Moral Conduct.” Journal of Socio-Economics 38, 926-34. Van der Laan, G., H. Van Ees, and A. Van Witteloostuijn (2008), “Corporate Social and Financial Performance: An Extended Stakeholder Theory, and Empirical Test with Accounting Measures.” Journal of Business Ethics 79, 299-310. Uchida, K. (2011), “Does Corporate Board Downsizing Increase Shareholder value? Evidence from Japan.” International Review of Economics and Finance 20, 562-73. Waddock, S. A. and S.B. Graves (1997), “The Corporate Social Performance–Financial Performance Link.” Strategic Management Journal 18 (4), 303-19.
21
Table 1
Definition of variables
D_IMPROVE Dummy variable that takes on a value of 1 if the sample firm improved CSR ratings over the sample
period (improvement firm), or a value of 0 if the firm did not improve CSR ratings over the sample
period (no improvement firm)
INST Institutional investors, percentage of institutional ownership held by foreign investors (excluding
foreign corporate investors), trust accounts, and special accounts of domestic trust banks and insurance
companies
DINSTOWN1 Domestic institutional investors, percentage of domestic institutional ownership held by trust accounts
and special accounts of trust banks and insurance companies, eliminates ownership by foreign investors
listed in the Nikkei NEEDS database
DINSTOWN2 Largest domestic institutional investors, percentage of the domestic institutional ownership held by the
largest investors, eliminates foreign investors
PRI_SIGN Percentage ownership held by Japanese institutional investors who signed up for the PRI between 2006
and 2012
FRGN Foreign investors, comprehensive percentage of foreign ownership
FOREOWN Foreign institutional investors, percentage of ownership limited to the top 30 foreign investors listed in
the Nikkei NEEDS database
SIZE Natural log of total assets
TOBINQ Tobin’s Q, market value of equity and book value of liabilities divided by book value of assets
ROA Return on assets, ratio of operating income less financial revenue over total assets
DIR Outside directors, proportion of outside directors over total board members
CROSS Cross-shareholding investors, percentage ownership of domestic corporate shareholders with
cross-shareholdings
ANTEI Domestic holding companies: 1. cross-shareholding investors, 2. Banks, credit unions (eliminating
special allowances, and trust allowances) 3. Public companies and financial institutions, 4. Public
relations companies (parent companies) corresponding to stock investment percentage, 5. Percentage of
special employee stocks, 6. Special company special stock percentage, 7. Self-held shares, 8. Corporate
held stocks (above 3%, including foreign companies, trusts and banks)
Stable shareholders, percentage of ownership by stable shareholders
RTO_TPBK Percentage of stocks held by main banks. Main banks are the principle bank dealing (survey base) Main
bank ownership, ratio of ownership by main banks
LEV Debt-asset ratio

22
Table 2
Sample statistics: environment ratings
This table shows the number and percentage of sample firms that improved (did not improve) CSR environment
ratings over the three- and five-year sample periods.
Improvement No improvement Total
3-year sample 108
(23%)
363
(77%)
471
5-year sample 107
(24%)
336
(76%)
443
Table 3
Univariate analysis: ownership variables and environment ratings change
This table reports statistics of ownership variables in 2007 for the sample of Japanese firms over the three- (five-) year
sample periods. The columns on the far right side indicate t-statistics (z-statistics) for the null hypothesis that mean
(median) of the ownership variable for improvement portfolios are identical to no improvement portfolios.
*, **, *** indicate significance at the 10%, 5%, and 1% levels, respectively
Improvement No improvement Difference
Mean Median St.Dev N Mean Median St.Dev N Mean
(t-statistics)
Median
(z-statistics)
3-year sample
INST 33.11 33.31 14.99 108 23.90 21.87 17.52 363 -4.96*** -5.13***
DINSTOWN 18.95 17.59 11.06 108 14.55 13.27 9.56 363 -4.05*** -3.93***
DINSTOWN2 12.50 12.64 6.95 108 9.43 8.10 7.86 363 -3.65*** -4.34***
FRGN 20.89 21.18 11.39 108 14.94 11.66 13.47 363 -4.17*** -5.08***
FOREOWN 5.12 4.25 4.49 108 4.33 3.04 5.91 363 -1.29 -2.88***
5-year sample
INST 32.72 32.20 16.51 107 25.07 23.84 17.11 336 -4.06*** -4.10***
DINSTOWN 18.40 18.03 9.81 107 15.10 14.31 9.19 336 -3.19*** -3.12***
DINSTOWN2 12.56 17.24 7.99 107 9.85 8.65 7.60 336 -3.17*** -3.27***
FRGN 20.93 20.03 12.33 107 15.57 12.52 13.29 336 -3.69*** -4.24***
FOREOWN 5.50 6.41 4.23 107 4.28 3.09 5.36 336 -1.94 -2.61***
23
Table 4
Descriptive statistics: CSR rating categories and control variables
This table reports descriptive statistics for all CSR rating categories and control variables used in
the regression analysis.
Mean St. Dev. Min Median Max N
Environment 3.56 0.91 1 3 5 473
Social engagement 3.57 0.90 1 3 5 463
Corporate governance 3.50 0.93 1 3 5 459
Employee relations 3.49 0.86 1 3 5 455
SIZE 12.11 1.83 7.78 11.95 17.29 473
LEV 50.85 19.05 8.41 52.84 93.61 473
ROA 6.37 4.71 -2.98 5.25 21.81 473
TOBINQ 1.08 0.32 0.52 1.01 2.26 473

24
Table 5
Logit regression results: environment ratings
This table reports the results of logit regressions conducted for the environment category of CSR ratings in the Toyo Keizai CSR database. All independent
variables are from 2007. An industry dummy variable (TCLS) for four groups is included in the regression analysis. Figures in parentheses are z-statistics
computed by heteroskedasticity-robust standard errors. *, **, *** indicate significance at the 10%, 5%, and 1% levels, respectively
3-year sample 5-year sample
(1) (2) (3) (4) (5) (6) (7) (8) (9) (10) (11) (12)
ENVRAT -1.95***
(-6.94)
-1.94***
(-6.88)
-1.94***
(-6.92)
-1.94***
(-6.88)
-1.92***
(-6.80)
-1.91***
(6.79)
-2.09***
(-7.23)
-2.10***
(-7.36)
-2.09***
(-7.32)
-2.10***
(-7.28)
-2.08***
(-7.25)
-2.06***
(-7.20)
INST 0.03***
(3.10)
0.02***
(2.12)
DINSTOWN 0.038***
(2.48)
0.04***
(2.13)
DINSTOWN2 0.05***
(2.51)
0.04***
(2.03)
FRGN 0.02**
(1.85)
0.03
(1.56)
FOREOWN -0.01
(-0.48)
0.03
(0.78)
PRI_SIGN 0.04
(1.00)
0.03
(0.67)
SIZE 0.72***
(4.95)
0.83***
(6.31)
0.86***
(6.53)
0.78***
(5.39)
0.91***
(6.85)
0.87***
(6.59)
0.72***
(4.90)
0.80***
(6.03)
0.82***
(6.17)
0.73***
(4.60)
0.84***
(6.13)
0.84***
(6.24)
LEV -0.00
(-0.34)
-0.01
(-0.96)
-0.01
(-0.91)
-0.00
(-0.38)
-0.01
(-0.82)
-0.01
(-0.80)
-0.00
(-0.13)
-0.01
(-0.66)
-0.00
(-0.57)
-0.00
(-0.01)
-0.00
(-0.34)
-0.00
(-0.47)
ROA 0.02
(-0.04)
0.03
(0.78)
0.02
(0.58)
0.03
(0.88)
0.04
(1.06)
0.04
(0.95)
0.02
(0.41)
0.02
(0.57)
0.02
(0.44)
0.03
(0.66)
0.03
(0.81)
0.03
(0.75)
TOBINQ -0.02
(-0.04)
0.10
(0.19)
0.12
(0.22)
0.02
(0.03)
0.12
(0.24)
0.11
(0.22)
0.45
(0.84)
0.56
(1.06)
0.57
(1.06)
0.41
(0.82)
0.57
(1.09)
0.54
(1.03)
Constant -4.88***
(-4.10)
-5.99***
(-5.55)
-6.15***
(-5.71)
-5.39***
(-4.55)
-6.55***
(-6.22)
-6.28***
(-5.94)
-4.54***
(-3.34)
-5.36***
(-4.38)
-5.52***
(-4.50)
-4.58***
(-3.00)
-5.66***
(-4.67)
-5.64***
(-4.66)
Pseudo-R2 0.25 0.25 0.25 0.24 0.24 0.24 0.25 0.26 0.25 0.25 0.25 0.25
N 471 471 471 471 471 471 443 443 443 443 443 443
25
Table 6
Logit regression results: environment ratings eliminating highest rated firms
This table reports the results of logit regressions conducted for the environment category of CSR ratings in the Toyo Keizai CSR database, eliminating the
highest rated (AAA) firms in 2007. All independent variables are from 2007. An industry dummy variable (TCLS) for four groups is included in the regression
analysis. Figures in parentheses are z-statistics computed by heteroskedasticity-robust standard errors. *, **, *** indicate significance at the 10%, 5%, and 1%
levels, respectively
3-year sample 5-year sample
(1) (2) (3) (4) (5) (6) (7) (8) (9) (10) (11) (12)
ENVRAT -1.40***
(-4.64)
-1.38***
(-4.51)
-1.40***
(-4.59)
-1.38***
(-4.54)
-1.36***
(-4.41)
-1.36***
(-4.43)
-1.55***
(-4.95)
-1.56***
(-5.03)
-1.55***
(-4.99)
1.56***
(-4.94)
1.55***
(-4.89)
-1.53***
(-4.85)
INST 0.03***
(2.58)
0.02*
(1.69)
DINSTOWN 0.03***
(2.00)
0.03*
(1.71)
DINSTOWN2 0.03**
(1.81)
0.03
(1.52)
FRGN 0.03***
(2.17)
0.03*
(1.66)
FOREOWN 0.01
(0.43)
0.05
(1.57)
PRI_SIGN 0.02
(0.58)
0.01
(0.32)
SIZE 0.79***
(5.43)
0.89***
(6.79)
0.91***
(6.95)
0.80***
(5.53)
0.94***
(7.32)
0.93***
(6.99)
0.76***
(4.93)
0.82***
(5.98)
0.84***
(6.12)
0.73***
(4.30)
0.86***
(6.52)
0.87***
(6.16)
LEV -0.00
(-0.39)
-0.01
(-0.84)
-0.01
(-0.86)
-0.00
(-0.23)
-0.01
(-0.68)
-0.01
(-0.76)
-0.00
(-0.23)
-0.01
(-0.63)
-0.01
(-0.57)
0.00
0.04
-0.00
(-0.20)
-0.00
(-0.48)
ROA 0.01
(0.35)
0.03
(0.71)
0.02
(0.49)
0.02
(0.61)
0.03
(0.86)
0.03
(0.81)
0.01
(0.29)
0.02
(0.43)
0.01
(0.33)
0.02
(0.42)
0.03
(0.76)
0.03
(0.61)
TOBINQ -0.00
(-0.01
0.10
(0.19)
0.12
(0.22)
-0.04
(-0.07)
0.10
(0.20)
0.11
(0.21)
0.49
(0.89)
0.60
(1.08)
0.59
(1.06)
0.41
(0.76)
0.54
(1.03)
0.56
(1.01)
Constant -7.24***
(-5.15)
-8.29***
(-6.33)
-8.37***
(-6.41)
-7.37***
(-5.39)
-8.76***
(-6.89)
-8.63***
(-6.71)
-6.54***
(-4.15)
-7.20***
(-5.09)
-7.34***
(-5.15)
-6.24***
(-3.61)
-7.73***
(-5.77)
-7.59***
(-5.34)
Pseudo-R2 0.24 0.24 0.24 0.24 0.23 0.23 0.22 0.22 0.22 0.22 0.22 0.22
N 388 388 388 388 388 388 361 361 361 361 361 361
26
Table 7
Univariate analysis: reverse causality concerns
This table reports statistics of the change in ownership variables over the three- (five-) year sample periods. The columns
on the far right side indicate t-statistics (z-statistics) for the null hypothesis that mean (median) of the ownership variable
for improvement portfolios are identical to no improvement portfolios.
*, **, *** indicate significance at the 10%, 5%, and 1% levels, respectively
Improvement No improvement Difference
Mean Median St.Dev N Mean Median St.Dev N Mean
(t-statistics)
Median
(z-statistics)
3-year sample
INST -1.66 -0.83 5.62 108 -2.06 -1.34 6.04 363 -0.61 -0.97
DINSTOWN -0.63 -0.01 4.67 108 -1.13 -0.86 4.81 363 -0.95 -1.57
DINSTOWN2 -0.06 0.22 4.50 108 -0.59 -0.31 4.66 363 -1.05 1.94**
FRGN -1.62 -0.64 4.54 108 -1.45 -0.72 4.92 363 0.32 -0.02
FOREOWN -1.10 -0.79 4.46 108 -0.75 -0.31 5.45 464 0.61 0.88
PRI_SIGN 0.87 0.06 4.04 108 -0.05 -0.04 2.89 363 -2.65*** -2.22***
5-year sample
INST -27.42 -28.30 15.76 107 -21.74 -19.98 15.92 336 3.22*** 3.39***
DINSTOWN -1.61 1.53 4.72 107 -2.07 -1.56 5.58 336 -0.77 -1.08
DINSTOWN2 -11.75 -11.77 8.53 107 -9.63 -8.49 7.56 336 2.45*** 2.63***
FRGN -16.30 -15.68 10.86 107 -12.29 -9.11 12.15 336 3.04*** 3.81***
FOREOWN -0.72 -0.32 4.33 107 -1.07 -0.15 5.18 336 -0.64 0.14
PRI_SIGN -0.18 0 2.41 107 -0.08 -0.14 3.07 336 0.32 -0.86

27
Table 8
Calendar-time portfolio regression for environment ratings
This table reports calendar-time portfolio regression results using the Fama-French-Carhart 4-factor
model: April 2008 to March 2011 for the three-year sample and April 2008 to March 2013 for the
five-year sample. Improvement portfolios consist of firms that improve environment ratings over the
three- (five-) year period from 2007 and no improvement portfolios consist of firms that have stable or
declining ratings over the three- (five-) year sample period. Value-weighted returns are used for portfolio
return. The figures in parentheses are t-statistics.
*, **, *** indicate significance at the 10%, 5%, and 1% levels, respectively.
4-factor model
3-year sample, Apr. 2008 – Mar. 2011
Alpha RM - Rf SMB HML WML R-squared
Improvement -0.00
(-0.58)
0.95***
(8.49)
-0.41
(-1.69)
0.44
(1.68)
-0.06
(-0.41)
0.75 36
No Improvement -0.00
(-0.70)
0.84***
(7.79)
-0.57**
(-2.50)
0.59**
(2.37)
-0.11
(-0.77)
0.74 36
Difference 0.00
(0.19)
0.12**
(2.20)
0.17
(1.46)
-0.15
(-1.22)
0.05
(0.51)
0.11 36
5-year sample, Apr. 2008 – Mar. 2013
Improvement -0.00
(-0.42)
1.05***
(10.12)
-0.47***
(-2.42)
0.19
(0.86)
0.00
(0.01)
0.70 60
No Improvement -0.00
(-1.23)
0.87***
(9.96)
-0.50***
(-3.08)
0.33*
(1.80)
-0.07
(-0.63)
0.71 60
Difference 0.00
(1.25
0.18***
(3.55)
0.03
(0.35)
-0.14
(-1.32)
0.07
(1.09)
0.17 60

28
APPENDIX
United Nations Global Compact Principles for Responsible Investing
Human Rights
Principle 1 Businesses should support and respect the protection of internationally proclaimed
human rights.
Principle 2 Businesses should make sure they are not complicit in human rights abuses.
Labour
Principle 3 Businesses should uphold the freedom of association and the effective recognition
of the right to collective bargaining.
Principle 4 Businesses should uphold the elimination of all forms of forced and compulsory
labour.
Principle 5 Businesses should uphold the effective abolition of child labour.
Principle 6 Businesses should uphold the elimination of discrimination in respect of
employment and occupation.
Environment
Principle 7 Businesses should support a precautionary approach to environmental challenges.
Principle 8 Businesses should undertake initiatives to promote greater environmental
responsibility.
Principle 9 Businesses should encourage the development and diffusion of environmentally
friendly technologies.
Anti-Corruption
Principle 10 Businesses should work against corruption in all its forms, including extortion and
bribery.

29