Graduate Enrollment and Degrees
83
Graduate Enrollment and Degrees: 2010 to 2020
Transcript of Graduate Enrollment and Degrees

Graduate Enrollmentand Degrees:2010 to 2020
Graduate Enrollment and Degrees: 2010 to 2020
Enyu ZhouJanet Gao
October 2021
The CGS/GRE Survey of Graduate Enrollment and Degrees is jointly sponsored by:

ii Council of Graduate Schools
The CGS/GRE Survey of Graduate Enrollment and Degrees is jointly sponsored by the Council of Graduate Schools (CGS) and the Graduate Record Examinations (GRE) Board. For more information about the survey or the survey reports, please contact:
Suggested citation:Zhou, E., & Gao, J. (2021). Graduate enrollment and degrees: 2010 to 2020. Washington, DC: Council of Graduate Schools.
Copyright © 2021 Council of Graduate Schools, Washington, DC
ALL RIGHTS RESERVED. No part of this work covered by the copyright herein may be reproduced or used in any form by any means—graphic, electronic, or mechanical including photocopying, recording, taping, Web distribution, or information storage and retrieval systems—without the written permission of the Council of Graduate Schools, One Dupont Circle NW, Suite 230, Washington, DC 20036-1146.
Printed in the United States
Council of Graduate SchoolsOne Dupont Circle NW, Suite 230Washington, DC 20036-1146 www.cgsnet.org
Enyu Zhou(202) [email protected]
Graduate Record Examinations Program Educational Testing Service Rosedale Road Princeton, NJ 08541-6000 www.ets.org/gre
Dawn S. Piancentino(609) [email protected]

iiiGraduate Enrollment and Degrees: 2010 to 2020 iiiGraduate Enrollment and Degrees: 2010 to 2020
Quick TakesThe CGS/GRE Survey of Graduate Enrollment and Degrees is a leading source of information on master’s and doctoral program applications, enrollment, and degrees conferred in the United States. This report highlights findings from Fall 2020 and includes detailed data tables. Below are key points from this year’s survey, which shed light on the applications, enrollment, and degrees conferred in U.S. graduate schools at the onset of the COVID-19 pandemic.
Applications for admission. Applications for admission to graduate school between Fall 2019 and Fall 2020 increased substantially (7.3%) (Table C.1).
• The rise in applications appears to be driven by Doctoral Universities with Very High Research Activities, or R1 institutions (8.1%).
• There were moderate increases in applications to Doctoral Universities with High Research Activities (R2), Doctoral or Professional Universities (D/PU), and Master’s Colleges and Universities (4.5%, 5.6% and 2.8%, respectively).
• By degree levels, graduate applications for master’s degree programs increased substantially (9.6%).
First-time enrollment. First-time enrollment increased by 1.8% overall between Fall 2019 and Fall 2020; however, changes varied greatly by broad fields of study (Table C.7).
• First-time graduate enrollment increased in business by 16%, in biological and agricultural sciences by 9.1%, and by 8.0% in health sciences.
• First-time enrollment in mathematics and computer sciences and engineering declined substantially (-16.6% and -15.8%, respectively), reflecting the overall decrease in international graduate student first-time enrollment.
Total enrollment. Between Fall 2019 and Fall 2020, total graduate enrollment increased by 2.5% (Table C.14). The growth of total graduate enrollment was driven by the increase of domestic students (6.1%). At the same time, the total enrollment of international graduate students decreased (-9.7%, Table C.19).
Other insights on enrollment include:
• Degree levels & institution types. There was a 3.8% decrease in first-time doctoral enrollment between Fall 2019 and Fall 2020 (Table C.12). Over the academic year, total graduate enrollment increased 3.3% at public institutions and 1.0% at private, not-for-profit institutions (Table C.14).
• Underrepresented minorities. There were healthy increases in first-time enrollment among underrepresented minorities for the past year. First-time graduate enrollment of American Indian/Alaska Native students increased 8.8%, Black/African American students increased 16.0%, and Latinx students1 increased 20.4% between Fall 2019 and Fall 2020 (Table C.5).
1 The term Hispanic/Latino is used as one of the citizenship and racial/ethnicity categories in the survey instrument (Appendix F). The term Latinx is used in the body of the report when referring to Hispanic/Latino population.

iv Council of Graduate Schoolsiv Council of Graduate Schools
• International students.2 Unsurprisingly given the COVID-19 pandemic, we saw a large decrease (-37.4%) in international graduate first-time enrollment between Fall 2019 and Fall 2020. The decline in international first-time enrollment was across all fields of study, engineering (-47.9%), mathematics and computer sciences (-46.4%) and physical and earth sciences (-42.0%), which have large shares of international graduate students, were particularly hard hit (Tables C.9).
• Domestic students. By contrast, domestic first-time graduate enrollment grew by 12.9% between Fall 2019 and Fall 2020. Increases were largest in business (29.2%), mathematics and computer sciences (20.1%), and biological and agricultural sciences (18.4%) (Table C.9).
• Part-time students. First-time enrollment of part-time graduates saw a 13.5% increase between Fall 2019 and Fall 2020, while full-time graduate enrollment decreased by 3.7%. The growth in first-time, part-time graduate enrollment was largest in business (30.3%), biological and agricultural sciences (30.0%), and engineering (26.7%) (Table C.8).
• Women. Overall, institutions participating in the GE&D Survey reported a 4.6% increase in the first-time graduate enrollment of women between Fall 2019 and Fall 2020 (Table C.6). Women first-time graduate students increased both at the master’s degree and certificate level (5.2%) and at the doctoral level (1.2%) (Table C.12 and Table C.13).
Graduate-level certificates awarded. Over the past year, the number of graduate-level certificates awarded increased by 20.7%. The number of graduate-level certificates awarded has grown over the last five- and ten-year periods. Between Fall 2015 and Fall 2020, the number of graduate-level certificates awarded increased 10.0%, and between Fall 2010 and Fall 2020, the number of graduate-level certificates awarded increased 9.5% (Table C.25).
Degrees awarded. The number of master’s degrees awarded by institutions participating in the survey remained flat (0.2%) between academic years 2018-19 and 2019-20 (Table C.29). The number of doctoral degrees awarded decreased by 0.7% (Table C.30).
2 The term Temporary Residents is used as one of the citizenship and racial/ethnicity categories in the survey instrument (Appendix F). The term International Student was used in the body of the report when referring to the Temporary Resident population.

vGraduate Enrollment and Degrees: 2010 to 2020
ContentsList of Figures vi
Introduction viiAbout the CGS/GRE Survey of Graduate Enrollment and Degrees viiAcknowledgments viii
Graduate Applications, Enrollment, and Degrees: Fall 2020 1Graduate Applications 1First-time Graduate Enrollment 2Total Graduate Enrollment 4Graduate Certificates and Degrees 5
Trends in Graduate Applications, Enrollment, and Degrees: 2010 to 2020 6Graduate Applications 6First-time Graduate Enrollment 7Total Graduate Enrollment 8Graduate Certificates and Degrees 9
Appendices A. Definitions A1B. Data Tables for Graduate Applications, First-Time Enrollment, B1
and Total Enrollment, Fall 2020; and Degrees Conferred, 2019-20
C. Data Tables for Trends in Graduate Applications, First-Time Enrollment, C1
Total Enrollment; and Degrees Conferred, 2010 to 2020
D. Taxonomy of Fields of Study D1E. List of Institutions Participating in the Fall 2020 Survey E1F. Survey Instrument F1

vi Council of Graduate Schools
List of FiguresFigure 1. Graduate Application Acceptance Rates by Carnegie Classification 1
and Degree Level, Fall 2020
Figure 2. First-time Graduate Enrollment by Broad Field of Study and 2 Attendance Status, Fall 2020
Figure 3. First-time Graduate Enrollment by Broad Field of Study 3 and Citizenship, Fall 2020
Figure 4. U.S. Citizen and Permanent Resident First-time Enrollment 3 by Race/Ethnicity, Fall 2020
Figure 5. Total Graduate Enrollment by Broad Field of Study and 4 Degree Level, Fall 2020
Figure 6. Changes in Graduate Applications by Degree Level, 6 Fall 2010 to Fall 2020
Figure 7. Trends in First-time Graduate Enrollment by Broad Field of Study, 8 Fall 2010 to Fall 2020
Figure 8. Percentage Shares in Total Graduate Enrollment of U.S. Citizens and 9 Permanent residents by Selected Race/Ethnicity, Fall 2010 to Fall 2020
Figure 9. Trends in Graduate Degrees Awarded by Degree Level, Fall 2010 to Fall 2020 9
viiGraduate Enrollment and Degrees: 2010 to 2020
Introduction
The COVID-19 pandemic, and its economic impact, as well as ongoing racist violence continue to impact graduate education in the United States. On March 13, 2020, the U.S. declared a national health emergency in response to the COVID-19 pandemic.3
Responding to the COVID-19 emergency, many higher education institutions in the U.S. changed modes of instruction to ensure the safety and health of students, faculty, and staff, by expanding hybrid and fully virtual courses and services.
In May 2020, CGS fielded the Survey on the Impact of the Coronavirus Disease 2019 (COVID-19) Pandemic on Graduate Education and found that many graduate deans (or equivalent) at CGS member institutions felt pessimistic about the outlook for Fall 2020 enrollment.4 Also, in the recent NAGAP/CGS Survey of Graduate Enrollment Professionals many graduate enrollment management professionals reported that more prospective students raised concerns about the affordability of graduate education, the value of graduate education, and the increase in the number of student deferrals since the pandemic began.5 Early indicators from other national data collection efforts found that graduate enrollment had slightly increased in Spring 2021.6 The total number of international students declined in the 2019/2020 academic year.7
The Fall 2020 CGS/GRE Survey of Graduate Enrollment and Degrees Report provides a national view of graduate enrollment trends from the past five- and ten-years. By providing an annual
examination of trends in graduate applications, enrollment, and degrees by broad field of study, degree level, and demographics, this report is essential for understanding how the pandemic has impacted the U.S. graduate education enterprise.
ABOUT THE CGS/GRE SURVEY OF GRADUATE ENROLLMENT AND DEGREESThe CGS/GRE Survey of Graduate Enrollment and Degrees is jointly sponsored by the Council of Graduate Schools (CGS) and the Graduate Record Examinations (GRE) Program. Conducted annually since 1986, the survey is designed to provide information about applications for admission to graduate school, graduate student enrollment, and graduate degrees and certificates conferred.
The CGS/GRE Survey of Graduate Enrollment and Degrees is the only national survey that collects data on first-time and total graduate enrollment across all fields of master’s and research doctorate programs in the United States. It is also the only source of data on first-time and total graduate enrollment by degree level (master’s/certificates versus research doctorate) and the only national survey that collects data on applications to graduate school by broad field of study.
The 2020 CGS/GRE Survey of Graduate Enrollment and Degrees was launched in November 2020 and sent to the U.S.-based institutions that were members of the Council of Graduate Schools or one of the four regional graduate school associations—
3 White House. (2020). Proclamation on Declaring a National Emergency Concerning the Novel Coronavirus Disease (COVID-19) Outbreak. https://trumpwhitehouse.archives.gov/presidential-actions/proclamation-declaring-national-emergency-concerning-novel-coronavirus-disease-covid-19-outbreak/
4 Okahana, H. (2020). The Impact of COVID-19 on Graduate Education. https://cgsnet.org/impact-covid-19-graduate-education5 Gao, J. (2021). Impact of COVID-19 on Graduate Education Access: Selected Results from the 2020 NAGAP/CGS Survey of
Graduate Enrollment Professionals. https://cgsnet.org/cgs-research-brief-impact-covid-19-graduate-education-access-selected-results-2020-nagapcgs-survey
6 National Student Clearinghouse Research Center. (2021). Spring 2021 Current Term Enrollment Estimates. https://nscresearchcenter.org/current-term-enrollment-estimates/
7 Open Doors. (2020). The Open Doors 2020 Report on International Educational Exchange. https://opendoorsdata.org/annual-release/

viii Council of Graduate Schools
the Conference of Southern Graduate Schools (CSGS), the Midwestern Association of Graduate Schools (MAGS), the Northeastern Association of Graduate Schools (NAGS), and the Western Association of Graduate Schools (WAGS). This year’s survey was sent to a total of 763 colleges and universities, and useable responses were received from 558 institutions, for an overall response rate of 73.1%.
ACKNOWLEDGMENTS
This report would not have been possible without the valuable contributions of many organizations and individuals. We would like to express our appreciation to ETS and the GRE program for ensuring the quality of the survey and the continuity of data. We particularly want to thank Alberto Acereda for his support of this effort, Dawn Piacentino for her overall direction of the project at ETS, and Cindy Briggman for coordination of the data collection effort.
We thank CGS President Suzanne Ortega for her insights and guidance for the project. Also, many thanks to Julia Kent and the CGS Communications Team, especially Katherine Hazelrigg for assistance in preparation of the final report, its release, and media relations and to Matthew Linton for preparing its digital publication. Last, and most importantly, special thanks to the graduate deans, institutional researchers, and other staff at the colleges and universities who completed the CGS/GRE Survey of Graduate Enrollment and Degrees this and every year. We are incredibly grateful for the time and effort they, and others, gave to the survey project and report.

1Graduate Enrollment and Degrees: 2010 to 2020
Graduate Applications, Enrollment, and Degrees: Fall 2020
More than 1.7 million graduate students were enrolled in graduate certificate, master’s, or doctoral programs in Fall 2020 at the 558 U.S. graduate schools participating in the 2020 CGS/GRE Survey of Graduate Enrollment and Degrees. To provide an overview of recent shifts in graduate enrollment during the COVID-19 pandemic, this section will highlight the state of graduate applications for admission for Fall 2020, first-time and total enrollment in Fall 2020, and graduate degrees and certificates conferred in the 2019-20 academic year.
GRADUATE APPLICATIONS
Interest in pursuing graduate education remains high amid the global pandemic. Institutions responding to the 2020 CGS/GRE Survey of Graduate Enrollment and Degrees received approximately 2.1 million applications for admission to graduate programs beginning in Fall 2020. The figure includes the more than 1.3 million applications for Fall 2020 received by public institutions and the 833,571 graduate applications for admission to private, not-for-profit institutions. About 68.0% or 1,472,964 of the applications received by institutions responding to the survey were for master’s/other programs. Even among Doctoral Universities with Very High Research Activities (R1), 63.0% of applications received were for master’s/other programs (Table B.1).
In Fall 2020, acceptance rates were higher for both doctoral programs and master’s/other programs compared to Fall 2019. Acceptance rates for doctoral programs have traditionally been lower than acceptance rates for master’s/other programs, and results from the 2020 survey were consistent with this pattern. Overall, 22.3% of doctoral applicants and 55.7% of master’s/other applicants were accepted for admission. Private, not-for-profit institutions generally have lower acceptance rates than public institutions. Doctoral programs at private, not-for-profit R1 institutions were the
most selective, accepting 12.5% of applications received. Master’s/other programs at these universities were also more selective with an overall acceptance rate of 45.7% (Table B.1 and Figure 1).
By broad field of study, the largest number of total doctoral applications for Fall 2020 were in the social and behavioral sciences (105,198), engineering (86,117), and biological and agricultural sciences (84,998). These three broad fields alone accounted for 40.7% of all doctoral applications for which the intended field of study was known in Fall 2020. The broad field of social and behavioral sciences had the lowest aggregated doctoral application acceptance rate (13.5%) of all broad fields. For master’s/other applications, the broad field of business received the largest number of applications (252,103), followed by mathematics and computer sciences (205,272). In terms of master’s acceptance rates, arts and humanities (42.1%) reported the lowest aggregated application acceptance rate, followed by mathematics and computer sciences (43.4%), physical and earth sciences (49.6%), biological and agricultural sciences (52.4%), and engineering (52.9%) (Table B.2).
22.3%
19.7%
36.6%
50.8%
43.4%
18.7%
55.7%
50.6%
67.3%
64.3%
67.9%
42.2%
Total
Doctoral: Very High Research
Doctoral: High Research
Doctoral/Professional Universities
Master's Colleges and Universities
Other
Doctoral Master's/Other
Figure 1. Graduate Application Acceptance Rates by Carnegie Classification and Degree Level, Fall 2020
Source: 2020 CGS/GRE Survey of Graduate Enrollment and Degrees, Table B.1

2 Council of Graduate Schools
FIRST-TIME GRADUATE ENROLLMENT A total of 509,999 graduate students enrolled for the first time in graduate certificate, education specialist, master’s, or research doctoral programs in Fall 2020 at the institutions responding to the CGS/GRE Survey of Graduate Enrollment and Degrees. Tables B.3 to B.11 provide additional details regarding first-time graduate enrollment for Fall 2020.
Consistent with previous survey cycles, business (87,045), education (75,083), and health sciences (67,126) were the three largest broad fields for first-time graduate enrollment in Fall 2020. These three broad fields collectively represented 45% of first-time graduate enrollments (Table B.4).
At those institutions responding the survey, 60.8% of first-time graduate students were women, though the proportion of women varies by institutional type (Table B.3). Institutions responding to the survey also reported that while women constitute more than three quarters of first-time graduate enrollment in fields of public administration and services (79.5%), health sciences (79.3%), and education (76.8%) in Fall 2020, they comprised much smaller portions of first-time enrollment in the fields of engineering (29.3%), mathematics and computer sciences (33.6%), and physical and earth sciences (44.3%) (Table B.4).
As institutions changed mode of instruction and offered virtual or hybrid learning options, many delivered courses in modular or part-time formats. More opportunities for students who were place bound and not able to pursue graduate education in person may have become available. In Fall 2020, 37.5% of first-time graduate students were part-time students, compared to 33.7% of part-time students in Fall 2019. Among the three largest broad fields for first-time graduate enrollment, 40.1% of business, 55.4% of education, and 35.2% of health sciences first-time enrollment were part-time students (Table B.4 and Figure 2).
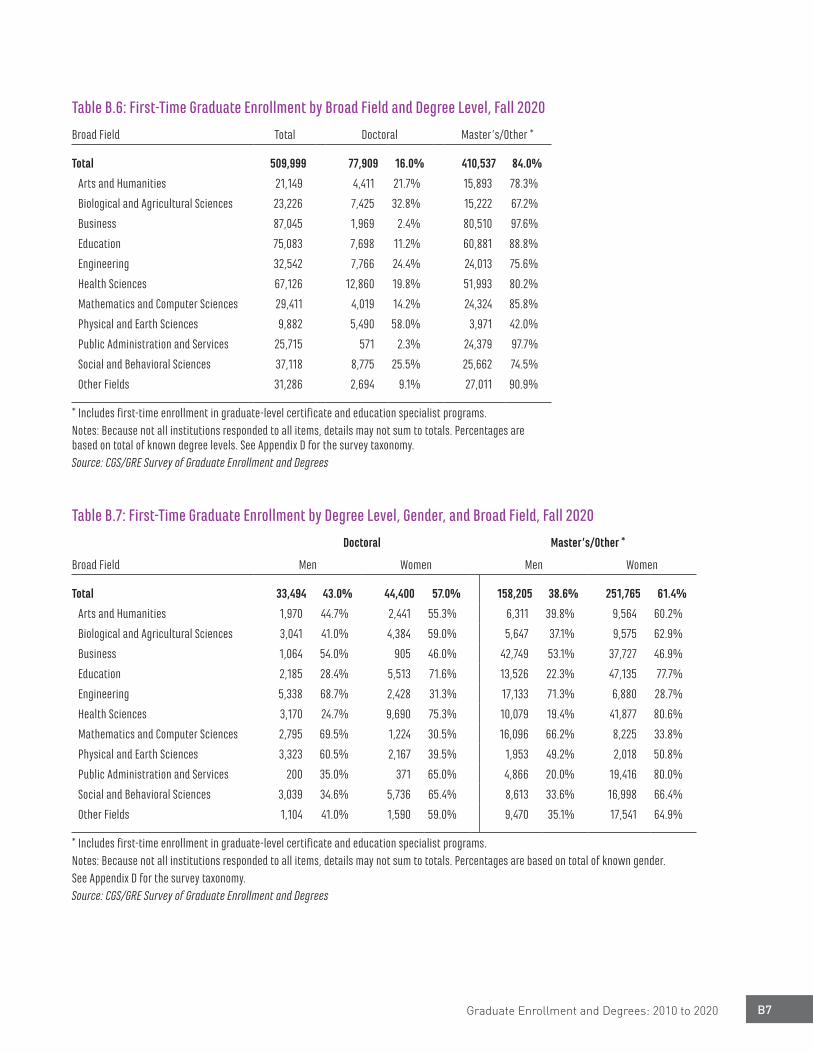
The large majority (84.0%) of first-time graduate students in Fall 2020 were enrolled in programs leading to a master’s degree or a graduate certificate. In the broad fields of public administration and services (97.7%), business (97.6%), “other fields” (90.9%),8 education (88.8%), and mathematics and computer sciences (85.8%), the shares of master’s/other enrollees were very high. By contrast, the majority (58.0%) of first-time graduate enrollment in physical and earth sciences were in doctoral programs (Table B.6).
Over one third (34.4%) of all first-time master’s/other students were enrolled in business (80,510) and education (60,881). At the doctoral level, the broad fields of health sciences (12,860), social and behavioral sciences (8,775), education (7,698), and engineering (7,766) were the largest, accounting for about one-half (47.6%) of all first-time doctoral students (Table B.6).
In Fall 2020, women comprised a larger share of first-time enrollees at the master’s and graduate certificate level (61.4%) than at the doctoral level (57.0%). Although women comprise the majority of first-time graduate students overall, they were underrepresented at the master’s level in engineering (28.7%), mathematics and computer sciences (33.8%), and business (46.9%). Moreover, men comprised a majority of doctoral first-time enrollees in engineering (68.7%), mathematics and computer sciences (69.5%), and physical and earth sciences (60.5%) (Table B.7).
0 20,000 40,000 60,000 80,000 100,000
Physical & Earth Sci
Arts & Humanities
Biological & Ag Sci
Public Admin & Svcs
Math & Comp Sci
Other Fields
Engineering
Social & Behav Sci
Health Sciences
Education
Business
Full-Time Part-Time
Figure 2. First-time Graduate Enrollment by Broad Field of Study and Attendance Status, Fall 2020
Source: 2020 CGS/GRE Survey of Graduate Enrollment and Degrees, Table B.4
8 The “other fields” category included the fields of Architecture and Environmental Design, Communications and Journalism, Family and Consumer Sciences, Library and Archival Sciences, and Religion and Theology (For more details, see Appendix D).

3Graduate Enrollment and Degrees: 2010 to 2020
Unsurprisingly, given the pandemic’s impact on international travel, U.S. citizens and permanent residents constituted a larger majority of first-time graduate enrollees than in recent years. Specifically, among first-time graduate enrollees in Fall 2020 for whom citizenship was known, 87.4% were U.S. citizens or permanent residents. The share of first-time domestic enrollment has gradually increased over the past five years: Fall 2019 (80.0%), Fall 2018 (80.2%), Fall 2017 (79.7%), Fall 2016 (78.9%), and Fall 2015 (78.0%)9 (Table B. 8). Domestic students comprised the largest share of first-time graduate students in public administration and services (97.4%), followed closely by education (96.7%) and health sciences (96.2%) (Table B.9).
In contrast, the share of first-time international enrollment (12.6%) declined substantially, compared to Fall 2019 (20.0%).10 The share of international students among first-time graduate students was higher at private, not-for-profit universities (17.9%) than at public universities (10.6%). The share of international students among first-time graduate students was the largest at R1 institutions (18.2%, Table B.8). International students comprised the largest share of first-time graduate students in mathematics and computer sciences (35.8%), followed closely by engineering (33.1%, Table B.9 and Figure 3). Women continued to be underrepresented among international students compared to domestic students. While 62.7% of first-time graduate enrollees who were U.S. citizens and permanent residents were women, only 47.3% of first-time graduate enrollees who were international students were women (Table B.10).
The share of underrepresented minorities (URM) among U.S. citizens and permanent residents increased more than one percentage point from the previous year.11 In Fall 2020, approximately 25.9% of all first-time U.S. citizens and permanent resident enrollees were URM students, including American Indian/Alaska Native (0.5%), Black/
African American (12.3%), Native Hawaiian/Other Pacific Islander (0.2%), and Latinx (13.0%, Table B.11 and Figure 4).
There are proportionally more domestic students of color in some fields, such as social and behavioral sciences and education. In other fields, however,
& Permanent Residentsl Students s & Permanent Residentsl Students
40,000 60,000 80,000 100,000
Business
Education
Health Sciences
Social & Behav Sci
Engineering
Other Fields
Math & Comp Sci
Public Admin & Svcs
Biological & Ag Sci
Arts & Humanities
Physical & Earth Sci
20,000
International StudentsU.S. Citizens & Permanent Residents
0
Figure 3. First-time Graduate Enrollment by Broad Field of Study and Citizenship, Fall 2020
Source: 2020 CGS/GRE Survey of Graduate Enrollment and Degrees, Table B.9
Latinx13.0%
American Indian/Alaska
Native0.5%
Asian8.0%
Black/African American
12.3%
Native Hawaiian/Other Pacific Islander
0.2%
White58.3%
Two or More Races3.3%
Race/Ethnicity Unknown
4.5%
Figure 4. U.S. Citizen and Permanent Resident First-time Graduate Enrollment by Race/Ethnicity, Fall 2020
Source: 2020 CGS/GRE urvey of Graduate Enrollment & Degrees, Table B.11
9 Data for the share of first-time domestic enrollment in Fall 2015, Fall 2016, Fall 2017, Fall 2018 and Fall 2019 can be found in previous editions of the Graduate Enrollment and Degrees report, which are available on the Council of Graduate Schools’ website.
10 Data for the share of first-time international enrollment in Fall 2019 can be found in previous editions of the Graduate Enrollment and Degrees report, which are available on the Council of Graduate Schools’ website.
11 Data for the share of first-time underrepresented minorities (URM) among U.S. citizens and permanent residents can be found in the previous year’s Graduate Enrollment and Degrees report, Fall 2019, which is available on the Council of Graduate Schools’ website.

4 Council of Graduate Schools
the representation of traditionally underserved students of color remained relatively low. American Indian/Alaska Native, Black/African American, Latinx, and Native Hawaiian/Other Pacific Islander first-time graduate students remain particularly underrepresented in science, engineering, technology, and mathematics (STEM) fields.
URM enrollment across broad fields of study was not monolithic, however, and showed significant variation across fields. For example, only 4.4% of U.S. citizens and permanent resident students enrolled for the first time in physical and earth sciences and 6.2% in engineering were Black/African American students. While only 3.4% of first-time students in education were Asian, they constituted a relatively large share of U.S. citizens and permanent residents enrolled for the first time in mathematics and computer sciences (21.0%) and engineering (14.8%) fields (Table B.11).
TOTAL GRADUATE ENROLLMENT
Institutions responding to the CGS/GRE survey (N=558) enrolled more than 1.7 million graduate students in Fall 2020. Complete details of total enrollment findings by institution type, gender, attendance status, broad field, degree level, citizenship, and race/ethnicity appear in Tables B.12 to B.20.
Across all institutions that participated in this survey, 43.4% of graduate students were enrolled part-time. The share of part-time students among
all graduate students was the greatest at public Doctoral or Professional Universities (D/PU) with 66.2% of graduate students enrolled part-time. Similarly, 60.3% of graduate students at public master’s colleges and universities were enrolled part-time in Fall 2020 (Table B.12).
There were similarities and differences across broad fields of study between graduate students enrolled part-time and full-time in their programs. The three largest broad fields of study - education, business, and health sciences - were also the fields with the largest proportions of part-time graduate students. More than six out of ten (63.8%) graduate students in education, about one-half in business (53.0%), and 43.0% in health sciences were enrolled part-time. By contrast, physical and earth sciences (16.8%), biological and agricultural sciences (25.9%), engineering (32.5%), and social and behavioral sciences (34.3%) had smaller proportions of graduate students enrolled part-time in their programs (Table B.13). Among graduate students in Fall 2020, men were more likely to be enrolled full time than women (59.2% and 54.9% respectively) (Table B.14).
Nearly three quarters (72.9%) of the total graduate enrollment at institutions participating in this year’s survey was in master’s programs, while 27.1% was in doctoral programs. Graduate enrollment in business (95.0%) and public administration and services (93.0%) was heavily concentrated in master’s/other programs. Across STEM fields, too, graduate enrollment was predominantly at the master’s level. However, the majority of graduate enrollment in physical and earth sciences (75.9%) and biological and agri-cultural sciences (53.4%) was at the doctoral level (Table B.15 and Figure 5).
International graduate students constituted 16.2% of total enrollment in Fall 2020, compared with U.S. citizens and permanent residents, who constituted 83.8%. At R1 institutions, the share of international students was 24.1% (Table B.17). The percentage of international students was particularly high in engineering (44.8%), mathe-matics and computer sciences (43.8%), and physical and earth sciences (32.5%) (Table B.18).
er *
0 50,000 100,000 150,000 200,000 250,000 300,000
Physical & Earth Sci
Public Admin & Svcs
Arts & Humanities
Biological & Ag Sci
Other Fields
Math & Comp Sci
Social & Behav Sci
Engineering
Health Sciences
Business
Education
Doctoral Master's/Other *
Figure 5. Total Graduate Enrollment by Broad Field of Study and Degree Level, Fall 2020
Source: 2020 CGS/GRE Survey of Graduate Enrollment and Degrees, Table B.15

5Graduate Enrollment and Degrees: 2010 to 2020
Among U.S. citizens and permanent residents, Black/African American students were particularly underrepresented in several fields. While they constituted 12.8% of U.S. citizens and permanent resident graduate students overall, they accounted for only 3.8% of physical and earth sciences enrollees. Similarly, they were grossly under-represented in engineering (6.2%), biological and agricultural sciences (6.6%), and arts and humanities (6.5%) (Table B.20).
GRADUATE CERTIFICATES AND DEGREES CONFERREDInstitutions responding to the CGS/GRE Survey of Graduate Enrollment and Degrees (N=558) awarded a total of 659,834 graduate certificates and degrees in the academic year 2019-20 (July 1, 2019 through June 30, 2020). Tables B.21 to B.25 provide the details.
The large majority (533,002 or 80.8%) of degrees awarded in 2019-20 were master’s degrees, followed by doctoral degrees (76,111 or 11.5%) and graduate certificates (50,721 or 7.7%). By field of study, health sciences accounted for the largest number of doctoral degrees awarded in 2019-20, with 21.9% of the total, followed by engineering (14.0%), education (12.3%), biological and agricultural sciences (11.5%), and social and behavioral sciences (11.2%) (Table B.22).
At the master’s degree level, business and education had the largest numbers of degrees awarded, accounting for 21.4% and 18.8%, respectively. More than nine out of ten degree recipients in business (93.1%) and public administration and services (92.5%) were awarded master’s degrees. Of the broad fields in this report, education (29.6%), business (12.6%), and health sciences (13.4%) had large shares of certificates awarded by institutions participating in this survey during 2019-20 (Table B.22).
Consistent with recent trends, women earned the majority of graduate degrees and certificates awarded by participating institutions in the recent GE&D survey. Women earned 62.1% of graduate certificates awarded in 2019-20, 60.1% of master’s degrees, and 53.1% of doctorates. The majority of graduate degrees and certificates awarded to
women were in education, health sciences, public administration and services, and social and behavioral sciences. However, in many STEM fields, men still earned the majority of graduate degrees and certificates. Men earned about three-fourths of master’s degrees (72.2%) and doctoral degrees (75.1%) in engineering. Similarly, 64.5% of master’s degrees and 74.2% of doctoral degrees in mathematics and computer sciences were earned by men (Tables B.23, B.24, and B.25).

6 Council of Graduate Schools
Institutions responding to the CGS/GRE Survey of Graduate Enrollment and Degrees reported a significant increase in applications for admission and an increase in first-time graduate enrollment (7.3% and 1.8%, respectively) between Fall 2019 and Fall 2020. This section presents one-year comparisons; five- and ten-year average annual changes; and selected trends in graduate applications, first-time and total enrollment, and degrees conferred from universities that reported at all periods. The findings are presented by broad field, degree level, institution type, 2018 Carnegie Classification, attendance status, gender, race/ethnicity, and citizenship status.
TRENDS IN GRADUATE APPLICATIONS
Between Fall 2019 and Fall 2020, applications for admission to U.S. graduate schools increased by 7.3% at the institutions that responded to the CGS/GRE Survey of Graduate Enrollment and Degrees in both 2019 and 2020. Tables C.1 to C.3 offer detailed information about trends in graduate applications. Public institution application counts increased 6.1%, and private, not-for-profit appli-cations increased by 9.2%. This is a significant increase when compared to the last ten years. In
the decade between Fall 2010 and Fall 2020, graduate applications grew at an average annual rate of 2.5%.
There were some differences by Carnegie Classification. The number of applications for admission to graduate school increased significantly at Very High Research Doctoral Universities (R1, 8.1%) and Other Institutions (16.1%) between Fall 2019 and Fall 2020. At the same time, High Research Doctoral Universities (R2) and Doctoral/Professional Universities (D/PU) reported smaller increases in application (4.5% and 5.6%, respectively). Master’s Colleges and Universities also reported smaller increases (2.8%) in applications between Fall 2019 and Fall 2020 (Tables B.1, C.1).
All broad fields of study saw one-year increases in graduate applications between Fall 2019 and Fall 2020. In particular, applications for admission increased significantly in biological and agricultural sciences (15.0%), mathematics and computer sciences (11.5%), and business (17.3%). Other fields, including public administration and services (3.6%) and social and behavioral sciences (8.9%), saw one-year increases as well. Although graduate appli-cations saw increases (2.0%) over the last five years, the broad field of engineering saw a decline by 3.0%. Overall, institutions received more graduate applications in Fall 2020 than a decade ago in all fields except for arts and humanities (-2.1% annually over the last ten years) and education (-0.2%) (Table C.2).
Applications for admission increased for doctoral programs (2.8%) and master’s/other programs (9.6%) between Fall 2019 and Fall 2020. This marks a shift from Fall 2019, when applications for admission at the master’s level declined slightly (-1.2%). The five-year average annual rate of change was 1.9% at the doctoral level and 2.1% at the master’s level between Fall 2015 and Fall 2020 (Figure 6). At the doctoral level, biological and
Trends in Graduate Applications, Enrollment, and Degrees: 2010 to 2020
2020
Change, 2015 to 2020
Change, 2010 to 2020
2.8%
9.6%
7.3%
1.9% 2.1% 2.0%0.9%
3.4%2.5%
Doctoral Master's/Other Total
% Change, 2019 to 2020 Average Annual % Change, 2015 to 2020
Average Annual % Change, 2010 to 2020
Figure 6. Changes in Graduate Applications by Degree Level, Fall 2010 to Fall 2020
Note: Master’s/Other includes applications to graduate-level certificate and education specialist programs.
Source: 2020 CGS/GRE Survey of Graduate Enrollment and Degrees, Table C.1

7Graduate Enrollment and Degrees: 2010 to 2020
agricultural sciences (11.1%) had the largest one-year increase of all broad fields of study. This was a higher rate of increase when compared to the five-year average annual rate of change (6.4%). At the master’s/other level, biological and agricultural sciences (22.3%) reported the highest one-year increase, followed by business (19.1%) and social and behavioral sciences (16.3%, Table C.3).
During the pandemic, many higher education institutions explored new recruitment and admission strategies, such as dropping standardized testing requirements, offering deferred admission options, and extending application deadlines.12
These approaches provided more flexibility in the application process and may well account for the increased number of graduate applications.
TRENDS IN FIRST-TIME GRADUATE ENROLLMENT
Despite its negative impact on international enrollment, the pandemic was actually accompanied by a first-time enrollment increase. First-time graduate enrollment increased 1.8% between Fall 2019 and Fall 2020 at the institutions that responded to both the 2019 and 2020 CGS/GRE Surveys of Graduate Enrollment and Degrees. Public institutions saw growth in first-time enrollment (3.0%) between Fall 2019 and Fall 2020, while there was a slight decline in first-time enrollment at private, not-for-profit institutions (-0.7%). By Basic Carnegie Classification, first-time graduate enrollment rose by 6.5% at D/PU institutions, 5.6% at R2 institutions, and 4.9% at master’s colleges and universities over the one year. R1 institutions saw their first-time graduate enrollment decrease slightly by 0.7% (Table C.4).
International students have faced obstacles over the past year due to the global pandemic and accompanying travel restrictions. Not surprising, the first-time international graduate student enrollment decreased significantly (-37.4%) between Fall 2019 and Fall 2020. Moreover, the ten-year average annual change rates became negative (-0.8%) for the first time in five years, meaning that the participating institutions saw fewer first-time international graduate students than in Fall 2010. First-time graduate enrollment,
however, reported a large increase (12.9%) among U.S. citizens and permanent residents between Fall 2019 and Fall 2020, which was much larger than the prior-year’s increase (2.2%). Over the past five years, the first-time enrollment of U.S. citizens and permanent resident graduate students rose on average by 4.9% annually (Table C.5).
Among U.S. citizens and permanent resident graduate students, first-time enrollment increased 1.7% among Native Hawaiians/Other Pacific Islanders between Fall 2019 and Fall 2020. Notably, the first-time enrollment also increased by 20.4% among Latinx students, 16.0% among Black/African American students, and 16.7% among Asian students between Fall 2019 and Fall 2020. Moreover, American Indian/Alaska Native students saw an 8.8% increase, a faster rate of growth than the prior cycle (3.5%). Although the baseline enrollment number is small, the increased first-time enrollment of underrepresented minority students is encouraging. From 2010 to 2020, the average annual growth rate for first-time graduate enrollment increased by 9.2% among Latinx, 5.4% among Black/African Americans, 6.3% among Asians/Pacific Islanders, and 0.8% among American Indian/Alaska Natives (Table C.5).
Women saw an increase (4.6%) in first-time graduate enrollment, while men saw a slight decrease (-2.1%) between Fall 2019 and Fall 2020. Among international students, first-time graduate enrollment decreased by 39.7% for men and 34.4% for women between Fall 2019 and Fall 2020. By comparison, among U.S. citizens and permanent residents, there was a 12.8% increase in first-time enrollment among men between Fall 2019 and Fall 2020, compared with a 12.9% increase among women (Table C.6).
In terms of field of study, arts and humanities reported a decrease in first-time graduate enrollment. The one-year change in first-time graduate enrollment in arts and humanities was -5.6%, compared to -2.0% between Fall 2018 and Fall 2019. Enrollment in fields with large shares of international graduate students was hit hardest by the pandemic. Mathematics and computer sciences (-16.6%) reported the largest one-year decline in
12 Martel, M., & Baer, J. (2021). COVID 19 Effects on US Higher Education Campuses Report 4. Institute of International Education.

8 Council of Graduate Schools
first-time graduate enrollment between Fall 2019 and Fall 2020, followed by engineering (-15.8%) (Table C.7).
Still, other fields saw significant growth in first-time enrollment. First-time graduate enrollment in business increased by 16.0%, biological and agricultural sciences increased by 9.1%, health sciences increased by 8.0%, and public adminis-tration and services increased by 6.5% between Fall 2019 and Fall 2020 (Table C.7). In the decade spanning 2010 to 2020, increases in first-time enrollments have been particularly strong in the fields of business and health sciences (Figure 7). For more detailed information about changes and trends in first-time graduate enrollment, see Tables C.4 through C.13.
TRENDS IN TOTAL GRADUATE ENROLLMENT
Total graduate enrollment increased 2.5% between Fall 2019 and Fall 2020 at the institutions responding to the CGS/GRE Survey of Graduate Enrollment and Degrees for both 2019 and 2020. Tables C.14 through C.23 provide detailed information about changes and trends in total graduate enrollment. Over the one-year period, total graduate enrollment increased 3.3% at public institutions and 1.0% at private, not-for-profit institutions. Total graduate enrollment increased by 1.2% between Fall 2015 and Fall 2020 and increased 0.5% during the ten-year period between Fall 2010 and Fall 2020 (Table C.14).
Between Fall 2019 and Fall 2020, the total graduate enrollment of U.S. citizens and permanent residents increased by 6.1%. Total enrollment of domestic students reflects trends of multiple preceding years. However, total enrollment for international graduate students experienced a large decline (-9.7%) (Table C.15). Total enrollment increased by 0.5% among men, and by 4.0% among women between Fall 2019 and Fall 2020. The growth of domestic total enrollment was greater for women (6.9%) than for men (4.9%, Table C.16).
By fields of study, although there were large changes of first-time graduate enrollment in some fields, the changes of total graduate enrollment across fields were much smaller over the past year. The largest one-year decline in total graduate enrollment by broad field of study between Fall 2019 and Fall 2020 was in engineering (-3.0%). There were also decreases in the broad fields of arts and humanities (-2.2%). While those two fields reported the largest one-year decreases, business (8.1%), health sciences (5.0%), public administration and services (4.1%), and biological and agricultural sciences (4.8%) saw increases in total enrollment between 2019 and 2020. That growth offset the declines seen in other fields (Table C.17).
Similar to the trends of first-time graduate enrollment among underrepresented students of colors, there were healthy increases in total graduate enrollment among these groups. Between Fall 2019 and Fall 2020, total enrollment increased by 11.3% among Latinx, 9.6% among Asian/Pacific Islanders, 8.1% among Black/African Americans, 2.3% among American Indian/Alaskan Natives, and 2.3 % among Native Hawaiians/Other Pacific Islanders. Total graduate enrollment among Whites increased by 4.2%. While the Latinx total graduate enrollment grew on average by 6.6% annually over the last ten years, the total enrollment of Black/African American students grew only by 1.4% each year on average. Furthermore, the total graduate enrollment of American Indian/Alaska Native students declined on average by 2.2% annually between Fall 2010 and Fall 2020 (Table C.20). Despite growth in the past decade, the overall share of underrepresented minorities in total graduate enrollment among U.S. citizens and permanent residents remains disproportionally low. While the representation of Hispanic/Latinx graduate
65,000
55,000
45,000
35,000
25,000
15,000
5,0002010 2011 2012 2013 2014 2015 2016 2017 2018 2019 2020
Business
Health Sciences
Education
Engineering
Social & Behav Sci.
Math & Computer Sci.
Other Fields
Public Admin & Svcs
Biological & Ag. Sci.
Arts & Humanities
Physical & Earth Sci.
Figure 7. Trends in First-time Graduate Enrollment by Broad Field of Study, Fall 2010 to Fall 2020
Note: Trends were developed based upon institutions that provided data for all years 2010 to 2020; therefore, the numbers of first-time enrollments do not match data in the tables.
Source: CGS/GRE Survey of Graduate Enrollment and Degrees

9Graduate Enrollment and Degrees: 2010 to 2020
students grew, the relative shares of Black/African American students grew at a much slower rate (Figure 8).
TRENDS IN GRADUATE DEGREES
The pandemic is impacting the number of degrees awarded at both master’s and doctoral level. The number of master’s degrees awarded increased by 0.2%, while the number of doctoral degrees awarded decreased by 0.7% between 2018-19 and 2019-20 at institutions responding to the 2020 CGS/GRE Survey of Graduate Enrollment and Degrees. Between 2014-15 and 2019-20, increases in master’s degree production (1.8%) were higher than for doctoral degree production (1.1%). Over the ten-year period between 2009-10 and 2019-20, the average annual change in the number of graduate certificates awarded was 9.5% (Table C.25). Since more master’s degrees are awarded than doctoral degrees and graduate certificates, the total number of master’s degrees earned continues to far exceed the number of doctoral degrees and graduate-level certificates conferred (Figure 9). Further details on changes and trends in graduate certificates and degrees awarded can be found in Tables C.24 through C.30.
Graduate-level certificates awarded. Notably, there was a large increase in the number of graduate certificates awarded (20.7%) between 2018-19 and 2019-20. In the five-years spanning 2015 to 2020, the average annual change in the number of graduate certificates awarded was 10.0%. Some types of institutions saw more robust growth in graduate certificates awarded over the past year than others. For example, the number of graduate certificates awarded rose by 28.2% at Doctoral Universities with Very High Research Activity between 2018-19 and 2019-20. The average annual rates of increase for graduate certificates awarded was 16.6% for Doctoral Universities with High Research Activity and 15.4% for Master’s Colleges and Universities (Table C.25). However, it should be noted that there are far fewer graduate certificates conferred than master’s or doctoral degrees.
Doctoral degrees awarded. Although the number of doctoral degrees awarded decreased slightly over the past year (-0.7%), doctoral degree production
still grew on average 1.1% annually over the past five-year between 2014-15 and 2019-20 and on average by 2.9% annually over the ten-year period between 2009-10 and 2019-20. The larger five- and ten-year annual percentage changes of doctoral degree production were partly due to that the base rates of doctoral degrees awarded were lower. Over the one-year period between 2018-19 and 2019-20, doctoral degree production increased at private, not-for-profit institutions and decreased at public institutions (2.4% and -2.0%, respectively). In the decade spanning 2009-10 to 2019-20, doctoral degree production increased by 2.7% at public institutions and 2.8% at private, not-for-profit institutions (Table C.24).
0.0%
2.0%
4.0%
6.0%
8.0%
10.0%
12.0%
14.0%
2010 2012 2014 2016 2018 2020
American Indian/
Latinx
Black/
Asian/
Other/
African American
Pacific Islander
Unknown
Alaska Native
Figure 8. Percentage Shares in Total Graduate Enrollment of U.S. Citizens and Permanent residents by Selected Race/Ethnicity, Fall 2010 to Fall 2020
Note: Trends were developed based upon institutions that provided data for all years 2010 to 2020; the numbers of first-time enrollments do not match data in the tables.
Source: CGS/GRE Survey of Graduate Enrollment and Degrees
0
100,000
200,000
300,000
400,000
2010 2012 2014 2016 2018 2020
Certificate
Doctorate
Master's
Figure 9. Trends in Graduate Degrees Awarded by Degree Level, Fall 2010 to Fall 2020
Note: Trends were developed based upon institutions that provided data for all years 2010 to 2020; therefore, the numbers of total degrees awarded do not match data in the tables.
Source: CGS/GRE Survey of Graduate Enrollment and Degrees

10 Council of Graduate Schools
At the doctoral level, between 2018-19 and 2019-20, the number of degrees awarded decreased in eight broad fields, including business (-11.6%), public administration and services (-7.3%), physical and earth sciences (-4.8%), arts and humanities (-3.2%), and engineering (-0.8%). The number of doctorates earned by women in business (-17.5%) and public administration and services (-15.0%) also significantly decreased (Table C.30).
Master’s degrees awarded. There was a 0.2% increase in master’s degree production between 2018-19 and 2019-20, which is lower than the 5-year and 10-year annual average increase. The average annual percent change for master’s degree production at public institutions increased between the five- and ten-year intervals (2.3% and 2.1%, respectively) (Table C.24).
The 0.2% increase in degrees awarded at the master’s level between 2018-19 and 2019-20 included increases in seven broad fields of study and decreases in four others. The largest one-year increases in master’s degree production were in mathematics and computer sciences (10.3%), while engineering reported the largest declines in master’s degree production (-6.3%). The number of master’s degree earned by women in mathematics and computer sciences sizably increased (13.7%) over the past year (Table C.29).

A1Graduate Enrollment and Degrees: 2010 to 2020
The CGS/GRE Survey of Graduate Enrollment and Degrees collects data on four aspects of graduate education:
Applications—Includes the number of completed applications for admission to U.S. graduate schools for the Fall term, the number of those applications accepted for admission, and the number of applications not accepted. Data are collected by fine field and degree level (master’s and ‘other’ vs. doctoral). The application data excludes individuals who applied as transfers or for readmission at the same institution.
First-Time Enrollment—Includes the number of students enrolled for the first time in graduate certificate, education specialist, master’s, or doctoral programs for the Fall term. Data are collected by fine field, degree level (master’s and ‘other’ vs. doctoral), gender, race/ethnicity, citizenship, and enrollment status (full-time/part-time).
Total Enrollment—Includes the total number of students enrolled (first-time and continuing students) in graduate certificate, education special-ist, master’s, or doctoral programs for the Fall term. Data are collected by fine field, degree level (master’s and ‘other’ vs. doctoral), gender, race/ethnicity, citizenship, and enrollment status (full-time/part-time).
Degrees—Includes the number of master’s and doctoral degrees and post-baccalaureate and post-master’s certificates awarded in the U.S. in a given academic year (July 1 through June 30). Degree data are collected by fine field, degree level (grad-uate certificate, master’s, and doctoral), and gender. The survey does not collect degree data by race/ethnicity or citizenship.
For both first-time and total enrollment, master’s and ‘other’ enrollment is defined as the number of students enrolled in programs specifically leading
to the master’s degree and other non-doctoral programs, such as graduate certificate programs and education specialist programs. Graduate certif-icates are awards that require the completion of an organized program of study generally equivalent to 15-18 credit hours beyond the bachelor’s degree. Education specialist programs are generally equi-valent to 30-45 credit hours beyond the master’s degree. Doctoral enrollment is defined as the number of students enrolled in programs leading directly to the doctoral degree as well as the total number of students enrolled in doctoral programs where a master’s degree is earned en route to the doctoral degree.
Full-time enrollment includes students enrolled for credit in graduate degree programs who are engaged full time in training activities in their field; these activities may include any appropriate combination of study, teaching, and research, depending on the responding institution’s own policy. Part-time enrollment includes students enrolled in graduate degree programs who are not pursuing graduate work full-time as defined above.
The survey collects the total data for each institution for the categories and variables listed above, as well as data for up to 51 individual fields of study. This report groups the data from the 51 fine fields of study into 11 broad fields. A special online report, Graduate Enrollment and Degrees by Fine Field, presents the fine field data for first-time enrollment, total enrollment, and degrees awarded and is available exclusively to CGS member institutions at www.cgsnet.org.
The survey excludes students applying to, enrolled in, or graduating from the following comprehensive list of first-professional programs: Chiropractic (D.C. or D.C.M.), Dentistry (D.D.S. or D.M.D.), Law (LL.B., J.D.), Medicine (M.D.), Optometry (O.D.), Osteopathic Medicine (D.O.), Pharmacy (Pharm.D.), Podiatry (D.P.M., D.P., or Pod.D.), Theology (M.Div.,
APPENDIX ADefinitions

A2 Council of Graduate Schools
M.H.L., B.D., or Ordination), and Veterinary Medicine (D.V.M.). Data for all other graduate-level programs are collected, including programs in other professional fields such as health sciences and business.
The racial/ethnic data included in this report are collected from institutional records based on graduate students’ self-reports. Accordingly, the number of students in any given racial/ethnic category is subject to individual interpretation on the part of students as they complete registration forms. The citizenship and race/ethnicity categories are defined as follows:
Temporary Resident/Non-Resident Alien (International Student)—A person who is not a citizen, national, or permanent resident of the U.S., and who is in the country on a visa or temporary basis and does not have the right to remain indefinitely.
Hispanic/Latino (Latinx)—A U.S. citizen or permanent resident of Cuban, Mexican, Puerto Rican, South or Central American, or other Spanish culture or origin, regardless of race.
American Indian/Alaska Native—A U.S. citizen or permanent resident having origins in any of the original peoples of North and South America (including Central America) who maintains cultural identification through tribal affiliation or community recognition.
Asian—A U.S. citizen or permanent resident having origins in any of the original peoples of the Far East, Southeast Asia, or the Indian subcontinent, including, for example, Cambodia, China, India, Japan, Malaysia, Pakistan, the Philippines, South Korea, Thailand, and Vietnam.
Black/African American—A U.S. citizen or perm-anent resident having origins in any of the black racial groups of Africa (except those of Hispanic origin).
Native Hawaiian/Other Pacific Islander—A U.S. citizen, permanent resident, or national having origins in any of the original peoples of Hawaii, Guam, Samoa, or other Pacific islands.
White—A U.S. citizen or permanent resident having origins in any of the original peoples of Europe, North Africa, or the Middle East (except those of Hispanic origin).
Two or More Races—A U.S. citizen or permanent resident having origins in any two or more of the following race categories: American Indian/Alaska Native, Asian, Black/African American, Native Hawaiian/Other Pacific Islander, or White.
Race/Ethnicity Unknown—Includes U.S. citizens and permanent residents whose race/ethnicity is not known.
Citizenship Unknown—Includes individuals whose citizenship is not known.
Two significant changes to the race/ethnicity categories occurred starting with the 2010 data collection cycle. The first change divided the previous Asian/Pacific Islander category into two separate categories: Asian and Native Hawaiian/Other Pacific Islander. The second change split the previous Other/Unknown category into three separate categories: Two or More Races, Race/Ethnicity Unknown, and Citizenship Unknown. The findings regarding the current academic year are based on the new race/ethnicity categories. Readers of this report should not directly compare the figures in this report to those that appeared in editions of this report issued prior to 2010. Findings regarding changes and trends are aggregated to correspond with the earlier definitions of Asian/Pacific Islander and Other/Unknown, to permit a comparable examination.
In some sections of this report, data are presented by Carnegie Classification based on the 2018 Carnegie Classification of Institutions of Higher Education, using the “basic” classification. The 33 “basic” classification categories are aggregated to five categories in this report as follows:
R1: Doctoral Universities – Very High Research Activity—Universities with very high research activity that award at least 20 doctorates per year.
R2: Doctoral Universities – High Research Activity—Universities with High Research activity that award at least 20 doctorates per year.

A3Graduate Enrollment and Degrees: 2010 to 2020
D/PU: Doctoral/Professional Universities —Universities with below 20 research/scholarship doc-toral degrees that awarded at least 30 professional practice doctoral degrees in at least 2 programs.
Master’s Colleges and Universities—Institutions that award at least 50 master’s degrees and fewer than 20 doctorates per year.
Other—Includes baccalaureate institutions award-ing fewer than 50 master’s degrees or 20 doctorates per year, as well as institutions awarding graduate degrees where a high concentration of degrees is in a single field or set of related fields (e.g., theological seminaries, medical schools, health profession schools, schools of engineering, etc.).
Since the institutions responding to the survey differ slightly from year-to-year, the trend data are limited to only those institutions that responded to the CGS/GRE Survey of Graduate Enrollment and Degrees in those years being compared.
One-year Comparisons—One-year comparisons, which are reported as percentages, are based on data collected from only those institutions that responded to both the 2019 and 2020 surveys.
Five-year Average Annual Changes—Five-year average annual changes, which are reported as percentages, are based on data collected from only those institutions that responded to both the 2015 and 2020 surveys.
Ten-year Average Annual Changes— Ten-year average annual changes, which are reported as percentages, are based on data collected from only those institutions that responded to both the 2010 and 2020 surveys.
Trend Lines—Trend lines were constructed using data collected from only those institutions that responded to all surveys from 2010 through 2020.
OTHER NOTESIn some cases, survey respondents were unable to provide data for one or more categories or variables. Thus, not all tables and figures in this report include data from all 558 institutions that responded to the 2020 CGS/GRE Survey of Graduate Enrollment and Degrees. Data were not imputed for missing fields or for non-responding institutions. Also, while the reporting guidelines and definitions of degree programs have not changed between 2010 and 2020, the interpretation of these guidelines and definitions by individual institutions may have changed due to various reasons. Some of the extreme outliers were reviewed and verified; however, data submitted by institutions were used for analysis without imputation.
Due to the small numbers of for-profit institutions providing data on graduate applications and first-time graduate enrollment, their data are suppressed from this report. The total graduate enrollment and graduate certificates and degrees awarded for for-profit institutions are reported in this report; however, given the small number of institutions participating in this survey, the data may not be representative of all for-profit institutions in the U.S.

A4 Council of Graduate Schools
ABOUT THE AUTHORSGraduate Enrollment & Degrees: 2010 to 2020 is a report of the Council of Graduate Schools and was prepared under the direction of Hironao Okahana (until September 10, 2021) by:
Enyu ZhouSenior AnalystCouncil of Graduate Schools
Janet Gao Research and Program AssociateCouncil of Graduate Schools
THE 2021 CGS COMMITTEE ON RESEARCH AND INFORMATION SERVICESAmanda C. Bryant-FriedrichWayne State University – Committee Chair
Joshua BarkerUniversity of Toronto
Brian CarolanSacred Heart University
Elaine FreyCalifornia State University, Fullerton
Devon JensenUniversity of Central Florida
Scott LanyonUniversity of Minnesota
Craig OgilvieMontana State University
Amanda L. OstrekoUniversity of Kansas
Jennifer TeitleUniversity of Iowa
Tammi Vacha-HaaseBoise State University
Dana WilliamsHoward University
The cover design and layout of this report was done by Laura Muncy of LetterSpace Creative, LLC.

B1Graduate Enrollment and Degrees: 2010 to 2020
Table B.1 Applications for Admission to Graduate School by Institution Type, B3 Carnegie Classification, and Degree Level, Fall 2020
Table B.2 Applications for Admission to Graduate School by Broad Field and Degree Level, B4 Fall 2020
Table B.3 First-Time Graduate Enrollment by Institution Type, Carnegie Classification, B5 Gender, and Attendance Status, Fall 2020
Table B.4 First-Time Graduate Enrollment by Broad Field, Gender, and Attendance Status, B6 Fall 2020
Table B.5 First-Time Graduate Enrollment by Gender, Attendance Status, and Broad Field, B6 Fall 2020
Table B.6 First-Time Graduate Enrollment by Broad Field and Degree Level, Fall 2020 B7
Table B.7 First-Time Graduate Enrollment by Degree Level, Gender, and Broad Field, Fall 2020 B7
Table B.8 First-Time Graduate Enrollment by Institution Type, Carnegie Classification, B8 and Citizenship, Fall 2020
Table B.9 First-Time Graduate Enrollment by Broad Field and Citizenship, Fall 2020 B8
Table B.10 First-Time Graduate Enrollment by Citizenship, Race/Ethnicity, and Gender, B9 Fall 2020
Table B.11 First-Time Graduate Enrollment by Broad Field and Race/Ethnicity, Fall 2020 B10 (U.S. Citizens and Permanent Residents Only)
Table B.12 Total Graduate Enrollment by Institution Type, Carnegie Classification, Gender, B11 and Attendance Status, Fall 2020
Table B.13 Total Graduate Enrollment by Broad Field, Gender, and Attendance Status, Fall 2020 B12
Table B.14 Total Graduate Enrollment by Gender, Attendance Status, and Broad Field, Fall 2020 B12
Table B.15 Total Graduate Enrollment by Broad Field and Degree Level, Fall 2020 B13
Table B.16 Total Graduate Enrollment by Degree Level, Gender, and Broad Field, Fall 2020 B13
APPENDIX BData Tables for Graduate Applications, First-Time Enrollment, Total Enrollment, Fall 2020, and Degrees Conferred, 2019-20

B2 Council of Graduate Schools
Table B.17 Total Graduate Enrollment by Institution Type, Carnegie Classification, B14 and Citizenship, Fall 2020
Table B.18 Total Graduate Enrollment by Broad Field and Citizenship, Fall 2020 B14
Table B.19 Total Graduate Enrollment by Citizenship, Race/Ethnicity, and Gender, Fall 2020 B15
Table B.20 Total Graduate Enrollment by Broad Field and Race/Ethnicity, Fall 2020 B16 (U.S. Citizens and Permanent Residents Only)
Table B.21 Graduate Degrees and Certificates Awarded by Degree Level, B17 Carnegie Classification, and Institution Type, 2019-20
Table B.22 Graduate Degrees and Certificates Awarded by Degree Level and Broad Field, B18 2019-20
Table B.23 Graduate Certificates Awarded by Broad Field and Gender, 2019-20 B18
Table B.24 Master’s Degrees Awarded by Broad Field and Gender, 2019-20 B19
Table B.25 Doctoral Degrees Awarded by Broad Field and Gender, 2019-20 B19

B3Graduate Enrollment and Degrees: 2010 to 2020
Table B.1: Applications for Admission to Graduate School by Institution Type, Carnegie Classification, and Degree Level, Fall 2020
Doctoral Master’s/Other * Total
Carnegie Classification and Institution Type **
Total Accepted Applications
Total Accepted Applications
Total Accepted Applications
Total 678,451 151,123 22.3% 1,472,964 819,746 55.7% 2,153,116 972,247 45.2%
Public 400,949 105,946 26.4% 917,819 529,549 57.7% 1,319,513 636,175 48.2%
Private, not-for-profit 277,470 45,155 16.3% 555,145 290,197 52.3% 833,571 336,050 40.3%
Private, for-profit S S S S S S
Doctoral: Very High Research 572,385 112,476 19.7% 968,245 489,499 50.6% 1,540,630 601,975 39.1%
Public 340,027 83,331 24.5% 618,171 329,515 53.3% 958,198 412,846 43.1%
Private, not-for-profit 232,358 29,145 12.5% 350,074 159,984 45.7% 582,432 189,129 32.5%
Private, for-profit N/A N/A N/A N/A N/A N/A
Doctoral: High Research 59,988 21,928 36.6% 233,520 157,149 67.3% 293,508 179,077 61.0%
Public 36,461 14,829 40.7% 141,698 96,058 67.8% 178,159 110,887 62.2%
Private, not-for-profit 23,527 7,099 30.2% 91,822 61,091 66.5% 115,349 68,190 59.1%
Private, for-profit N/A N/A N/A N/A N/A N/A
Doctoral/Professional Universities 16,722 8,493 50.8% 93,143 59,923 64.3% 109,865 68,416 62.3%
Public 5,709 2,585 45.3% 36,193 24,566 67.9% 41,902 27,151 64.8%
Private, not-for-profit 11,013 5,908 53.6% 56,950 35,357 62.1% 67,963 41,265 60.7%
Private, for-profit S S S S S S
Master’s Colleges and Universities 11,123 4,824 43.4% 147,695 100,355 67.9% 160,519 106,557 66.4%
Public 4,796 2,415 50.4% 110,055 74,530 67.7% 115,596 77,625 67.2%
Private, not-for-profit 6,295 2,387 37.9% 37,640 25,825 68.6% 44,891 28,910 64.4%
Private, for-profit N/A N/A N/A N/A N/A N/A
Other 18,233 3,402 18.7% 30,361 12,820 42.2% 48,594 16,222 33.4%
Public 13,956 2,786 20.0% 11,702 4,880 41.7% 25,658 7,666 29.9%
Private, not-for-profit 4,277 616 14.4% 18,659 7,940 42.6% 22,936 8,556 37.3%
Private, for-profit N/A N/A N/A N/A N/A N/A
* Includes applications to graduate-level certificate and education specialist programs. ** See Appendix A for information about the Carnegie Classification system. Notes: Because not all institutions responded to all items, details may not sum to totals. N/A = Not applicable. S = Suppressed due to small number of institutional respondents in this category.Source: CGS/GRE Survey of Graduate Enrollment and Degrees

B4 Council of Graduate Schools
Table B.2: Applications for Admission to Graduate School by Broad Field and Degree Level, Fall 2020
Doctoral Master’s/Other * Total
Broad Field Total Accepted Applications
Total Accepted Applications
Total Accepted Applications
Total 678,451 151,123 22.3% 1,472,964 819,746 55.7% 2,153,116 972,247 45.2%
Arts and Humanities 50,132 9,214 18.4% 73,355 30,863 42.1% 123,487 40,107 32.5%
Biological and Agricultural Sciences 84,998 14,335 16.9% 51,030 26,748 52.4% 136,028 41,083 30.2%
Business 21,254 2,988 14.1% 252,103 151,514 60.1% 273,550 154,692 56.5%
Education 23,489 11,215 47.7% 110,023 79,556 72.3% 133,632 91,153 68.2%
Engineering 86,117 22,824 26.5% 148,098 78,353 52.9% 234,215 101,177 43.2%
Health Sciences 72,481 22,030 30.4% 157,242 79,214 50.4% 229,953 101,487 44.1%
Mathematics and Computer Sciences 62,092 11,950 19.2% 205,272 89,014 43.4% 267,364 100,967 37.8%
Physical and Earth Sciences 63,997 16,274 25.4% 15,350 7,606 49.6% 79,347 23,880 30.1%
Public Administration and Services 3,220 1,014 31.5% 53,295 38,146 71.6% 56,641 39,420 69.6%
Social and Behavioral Sciences 105,198 14,241 13.5% 82,080 50,060 61.0% 187,565 64,570 34.4%
Other Fields 18,918 5,071 26.8% 90,911 56,419 62.1% 109,829 61,490 56.0%
* Includes applications to graduate-level certificate and education specialist programs.Notes: Because not all institutions responded to all items, details may not sum to totals. See Appendix D for the survey taxonomy.Source: CGS/GRE Survey of Graduate Enrollment and Degrees

B5Graduate Enrollment and Degrees: 2010 to 2020
Table B.3: First-Time Graduate Enrollment by Institution Type, Carnegie Classification, Gender, and Attendance Status, Fall 2020
Carnegie Classification and Institution Type *
Total Men Women Full-Time Part-Time
Total 509,999 195,128 39.2% 303,146 60.8% 316,997 62.5% 189,937 37.5%
Public 335,547 132,303 39.7% 200,625 60.3% 203,717 61.2% 129,211 38.8%
Private, not-for-profit 152,719 59,032 38.7% 93,392 61.3% 103,592 68.0% 48,681 32.0%
Private, for-profit S S S S S
Doctoral: Very High Research 254,620 112,319 44.6% 139,682 55.4% 177,667 70.5% 74,334 29.5%
Public 187,026 81,628 44.3% 102,779 55.7% 126,778 68.7% 57,629 31.3%
Private, not-for-profit 67,594 30,691 45.4% 36,903 54.6% 50,889 75.3% 16,705 24.7%
Private, for-profit N/A N/A N/A N/A N/A
Doctoral: High Research 92,213 33,957 36.8% 58,256 63.2% 53,904 58.5% 38,309 41.5%
Public 64,767 24,007 37.1% 40,760 62.9% 35,574 54.9% 29,193 45.1%
Private, not-for-profit 27,446 9,950 36.3% 17,496 63.7% 18,330 66.8% 9,116 33.2%
Private, for-profit N/A N/A N/A N/A N/A
Doctoral/Professional Universities 63,703 15,344 28.0% 39,375 72.0% 32,301 50.8% 31,229 49.2%
Public 18,100 5,320 29.4% 12,780 70.6% 7,861 43.4% 10,239 56.6%
Private, not-for-profit 28,657 8,457 29.7% 20,027 70.3% 17,045 59.8% 11,439 40.2%
Private, for-profit S S S S S
Master’s Colleges and Universities 87,032 29,037 33.4% 57,873 66.6% 44,370 51.1% 42,389 48.9%
Public 60,260 19,685 32.7% 40,575 67.3% 30,236 50.2% 30,024 49.8%
Private, not-for-profit 24,760 8,112 32.9% 16,526 67.1% 14,111 57.6% 10,376 42.4%
Private, for-profit N/A N/A N/A N/A N/A
Other 11,382 4,129 36.3% 7,253 63.7% 7,866 69.1% 3,516 30.9%
Public 5,394 1,663 30.8% 3,731 69.2% 3,268 60.6% 2,126 39.4%
Private, not-for-profit 4,262 1,822 42.7% 2,440 57.3% 3,217 75.5% 1,045 24.5%
Private, for-profit N/A N/A N/A N/A N/A
* See Appendix A about the Carnegie Classification system.Notes: Because not all institutions responded to all items, details may not sum to totals. Percentages are based on total of known gender or attendance status. N/A = Not applicable. S = Suppressed due to small number of institutional respondents in this category.Source: CGS/GRE Survey of Graduate Enrollment and Degrees

B6 Council of Graduate Schools
Table B.4: First-Time Graduate Enrollment by Broad Field, Gender, and Attendance Status, Fall 2020
Broad Field Total Men Women Full-Time Part-Time
Total 509,999 195,128 39.2% 303,146 60.8% 316,997 62.5% 189,937 37.5%
Arts and Humanities 21,149 8,658 41.0% 12,480 59.0% 16,357 77.3% 4,792 22.7%
Biological and Agricultural Sciences 23,226 8,954 38.6% 14,272 61.4% 18,740 80.7% 4,486 19.3%
Business 87,045 44,780 53.1% 39,518 46.9% 52,156 59.9% 34,950 40.1%
Education 75,083 16,618 23.2% 55,027 76.8% 33,468 44.6% 41,530 55.4%
Engineering 32,542 23,009 70.7% 9,533 29.3% 23,138 71.1% 9,404 28.9%
Health Sciences 67,126 13,885 20.7% 53,241 79.3% 43,515 64.8% 23,611 35.2%
Mathematics and Computer Sciences 29,411 19,342 66.4% 9,808 33.6% 17,337 58.9% 12,074 41.1%
Physical and Earth Sciences 9,882 5,501 55.7% 4,381 44.3% 8,601 87.0% 1,281 13.0%
Public Administration and Services 25,715 5,254 20.5% 20,321 79.5% 18,029 70.1% 7,686 29.9%
Social and Behavioral Sciences 37,118 11,984 34.1% 23,118 65.9% 26,306 70.8% 10,846 29.2%
Other Fields 31,286 11,011 35.4% 20,066 64.6% 19,374 61.9% 11,912 38.1%
Notes: Because not all institutions responded to all items, details may not sum to totals. Percentages are based on total of known gender or attendance status. See Appendix D for the survey taxonomy.Source: CGS/GRE Survey of Graduate Enrollment and Degrees
Table B.5: First-Time Graduate Enrollment by Gender, Attendance Status, and Broad Field, Fall 2020
Men Women
Broad Field Full-Time Part-Time Full-Time Part-Time
Total 126,842 65.0% 68,203 35.0% 186,890 61.7% 116,035 38.3%
Arts and Humanities 6,785 78.4% 1,873 21.6% 9,572 76.7% 2,908 23.3%
Biological and Agricultural Sciences 7,258 81.1% 1,696 18.9% 11,482 80.5% 2,790 19.5%
Business 27,915 62.3% 16,880 37.7% 23,272 58.8% 16,292 41.2%
Education 7,736 46.6% 8,868 53.4% 24,270 44.2% 30,667 55.8%
Engineering 16,151 70.2% 6,858 29.8% 6,987 73.3% 2,546 26.7%
Health Sciences 9,617 69.3% 4,268 30.7% 33,898 63.7% 19,343 36.3%
Mathematics and Computer Sciences 11,201 57.9% 8,141 42.1% 6,041 61.6% 3,767 38.4%
Physical and Earth Sciences 4,856 88.3% 645 11.7% 3,745 85.5% 636 14.5%
Public Administration and Services 3,500 66.6% 1,754 33.4% 14,479 71.3% 5,842 28.7%
Social and Behavioral Sciences 8,762 73.0% 3,236 27.0% 17,019 73.6% 6,119 26.4%
Other Fields 7,126 64.7% 3,885 35.3% 12,171 60.7% 7,895 39.3%
Notes: Because not all institutions responded to all items, details may not sum to totals. Percentages are based on total of known attendance status. See Appendix D for the survey taxonomy.Source: CGS/GRE Survey of Graduate Enrollment and Degrees
B7Graduate Enrollment and Degrees: 2010 to 2020
Table B.6: First-Time Graduate Enrollment by Broad Field and Degree Level, Fall 2020
Broad Field Total Doctoral Master’s/Other *
Total 509,999 77,909 16.0% 410,537 84.0%
Arts and Humanities 21,149 4,411 21.7% 15,893 78.3%
Biological and Agricultural Sciences 23,226 7,425 32.8% 15,222 67.2%
Business 87,045 1,969 2.4% 80,510 97.6%
Education 75,083 7,698 11.2% 60,881 88.8%
Engineering 32,542 7,766 24.4% 24,013 75.6%
Health Sciences 67,126 12,860 19.8% 51,993 80.2%
Mathematics and Computer Sciences 29,411 4,019 14.2% 24,324 85.8%
Physical and Earth Sciences 9,882 5,490 58.0% 3,971 42.0%
Public Administration and Services 25,715 571 2.3% 24,379 97.7%
Social and Behavioral Sciences 37,118 8,775 25.5% 25,662 74.5%
Other Fields 31,286 2,694 9.1% 27,011 90.9%
* Includes first-time enrollment in graduate-level certificate and education specialist programs.Notes: Because not all institutions responded to all items, details may not sum to totals. Percentages are based on total of known degree levels. See Appendix D for the survey taxonomy.Source: CGS/GRE Survey of Graduate Enrollment and Degrees
Table B.7: First-Time Graduate Enrollment by Degree Level, Gender, and Broad Field, Fall 2020
Doctoral Master’s/Other *
Broad Field Men Women Men Women
Total 33,494 43.0% 44,400 57.0% 158,205 38.6% 251,765 61.4%
Arts and Humanities 1,970 44.7% 2,441 55.3% 6,311 39.8% 9,564 60.2%
Biological and Agricultural Sciences 3,041 41.0% 4,384 59.0% 5,647 37.1% 9,575 62.9%
Business 1,064 54.0% 905 46.0% 42,749 53.1% 37,727 46.9%
Education 2,185 28.4% 5,513 71.6% 13,526 22.3% 47,135 77.7%
Engineering 5,338 68.7% 2,428 31.3% 17,133 71.3% 6,880 28.7%
Health Sciences 3,170 24.7% 9,690 75.3% 10,079 19.4% 41,877 80.6%
Mathematics and Computer Sciences 2,795 69.5% 1,224 30.5% 16,096 66.2% 8,225 33.8%
Physical and Earth Sciences 3,323 60.5% 2,167 39.5% 1,953 49.2% 2,018 50.8%
Public Administration and Services 200 35.0% 371 65.0% 4,866 20.0% 19,416 80.0%
Social and Behavioral Sciences 3,039 34.6% 5,736 65.4% 8,613 33.6% 16,998 66.4%
Other Fields 1,104 41.0% 1,590 59.0% 9,470 35.1% 17,541 64.9%
* Includes first-time enrollment in graduate-level certificate and education specialist programs.Notes: Because not all institutions responded to all items, details may not sum to totals. Percentages are based on total of known gender.See Appendix D for the survey taxonomy.Source: CGS/GRE Survey of Graduate Enrollment and Degrees

B8 Council of Graduate Schools
Table B.8: First-Time Graduate Enrollment by Institution Type, Carnegie Classification, and Citizenship, Fall 2020
Institution Type and Carnegie Classification *
Total U.S. Citizens and Permanent Residents
Temporary Residents
Total 509,999 435,191 87.4% 62,814 12.6%
Institution Type
Public 335,547 296,986 89.4% 35,138 10.6%
Private, not-for-profit 152,719 124,356 82.1% 27,128 17.9%
Private, for-profit S S S
Carnegie Classification *
Doctoral: Very High Research 254,620 207,036 81.8% 46,026 18.2%
Doctoral: High Research 92,213 84,092 91.0% 8,298 9.0%
Doctoral/Professional Universities 63,703 52,977 95.5% 2,494 4.5%
Master's Colleges and Universities 87,032 80,453 95.0% 4,221 5.0%
Other 11,477 9,687 84.6% 1,767 15.4%
* See Appendix A for information about the Carnegie Classification system. Notes: Because not all institutions responded to all items, details may not sum to totals. Percentages are based on total of known citizenship. S = Suppressed due to a small number of institutional respondents in this category.Source: CGS/GRE Survey of Graduate Enrollment and Degrees
Table B.9: First-Time Graduate Enrollment by Broad Field and Citizenship, Fall 2020
Broad Field Total U.S. Citizens and Permanent Residents
Temporary Residents
Total 509,999 435,191 87.4% 62,814 12.6%
Arts and Humanities 21,149 17,931 86.0% 2,925 14.0%
Biological and Agricultural Sciences 23,226 19,573 86.8% 2,981 13.2%
Business 87,045 72,739 86.6% 11,297 13.4%
Education 75,083 69,804 96.7% 2,378 3.3%
Engineering 32,542 21,362 66.9% 10,586 33.1%
Health Sciences 67,126 63,308 96.2% 2,471 3.8%
Mathematics and Computer Sciences 29,411 18,351 64.2% 10,248 35.8%
Physical and Earth Sciences 9,882 7,720 79.4% 2,007 20.6%
Public Administration and Services 25,715 24,906 97.4% 667 2.6%
Social and Behavioral Sciences 37,118 30,995 87.6% 4,381 12.4%
Other Fields 31,286 27,148 87.8% 3,773 12.2%
Notes: Because not all institutions responded to all items, details may not sum to totals. Percentages are based on total of known citizenship. See Appendix D for the survey taxonomy.Source: CGS/GRE Survey of Graduate Enrollment and Degrees

B9Graduate Enrollment and Degrees: 2010 to 2020
Table B.10: First-Time Graduate Enrollment by Citizenship, Race/Ethnicity, and Gender, Fall 2020
Citizenship and Race/Ethnicity Total Men Women
Total 509,999 195,128 39.2% 303,146 60.8%
U.S. Citizens and Permanent Residents 435,191 160,401 37.3% 270,071 62.7%
Hispanic/Latino 56,587 20,038 35.6% 36,307 64.4%
Non-Hispanic:
American Indian/Alaska Native 2,038 676 33.9% 1,320 66.1%
Asian 35,008 15,290 43.8% 19,630 56.2%
Black/African American 53,754 16,058 30.6% 36,394 69.4%
Native Hawaiian/ Other Pacific Islander
666 251 38.8% 396 61.2%
White 254,402 95,563 37.9% 156,639 62.1%
Two or More Races 14,406 5,324 37.4% 8,906 62.6%
Race/Ethnicity Unknown 19,466 7,524 40.0% 11,292 60.0%
Temporary Residents 62,814 33,077 52.7% 29,693 47.3%
Citizenship Unknown 5,630 115 25.7% 333 74.3%
Notes: Because not all institutions responded to all items, details may not sum to totals. Percentages are based on total of known gender within each citizenship and race/ethnicity category. See Appendix A for a description of each citizenship and race/ethnicity category.Source: CGS/GRE Survey of Graduate Enrollment and Degrees

B10 Council of Graduate Schools
Table B.11: First-Time Graduate Enrollment by Broad Field and Race/Ethnicity, Fall 2020 (U.S. Citizens and Permanent Residents Only)
Broad Field Hispanic/Latino American Indian/ Alaska Native
Asian Black/ African American
Total 56,587 13.0% 2,038 0.5% 35,008 8.0% 53,754 12.3%
Arts and Humanities 2,312 12.9% 87 0.5% 842 4.7% 1,357 7.6%
Biological and Agricultural Sciences 2,476 12.6% 92 0.5% 2,023 10.3% 1,664 8.5%
Business 8,900 12.2% 264 0.4% 7,296 10.0% 9,157 12.6%
Education 9,237 13.1% 403 0.6% 2,387 3.4% 10,252 14.6%
Engineering 2,618 12.3% 78 0.4% 3,169 14.8% 1,319 6.2%
Health Sciences 7,403 11.7% 283 0.4% 5,209 8.2% 8,105 12.8%
Mathematics and Computer Sciences 1,952 10.6% 46 0.3% 3,846 21.0% 1,902 10.4%
Physical and Earth Sciences 893 11.6% 26 0.3% 607 7.9% 343 4.4%
Public Administration and Services 3,918 15.7% 176 0.7% 869 3.5% 4,338 17.4%
Social and Behavioral Sciences 4,834 15.5% 176 0.6% 1,808 5.8% 3,951 12.7%
Other Fields 3,587 13.2% 226 0.8% 1,347 5.0% 3,166 11.7%
Broad Field Native Hawaiian/ Other Pacific Islander
White Two or More Races Race/ Ethnicity Unknown
Total 666 0.2% 254,402 58.3% 14,406 3.3% 19,466 4.5%
Arts and Humanities 25 0.1% 11,823 65.9% 741 4.1% 744 4.1%
Biological and Agricultural Sciences 25 0.1% 11,714 59.8% 755 3.9% 827 4.2%
Business 163 0.2% 41,554 57.0% 2,188 3.0% 3,417 4.7%
Education 137 0.2% 42,619 60.5% 1,965 2.8% 3,441 4.9%
Engineering 31 0.1% 12,572 58.9% 800 3.7% 775 3.6%
Health Sciences 107 0.2% 37,477 59.1% 1,912 3.0% 2,899 4.6%
Mathematics and Computer Sciences 28 0.2% 8,958 48.8% 626 3.4% 993 5.4%
Physical and Earth Sciences 11 0.1% 5,271 68.3% 319 4.1% 250 3.2%
Public Administration and Services 51 0.2% 13,817 55.4% 864 3.5% 918 3.7%
Social and Behavioral Sciences 56 0.2% 17,724 56.8% 1,291 4.1% 1,365 4.4%
Other Fields 37 0.1% 16,431 60.5% 955 3.5% 1,396 5.1%
Notes: This table only includes U.S. citizens and permanent residents. See Table B.9 for first-time enrollment by broad field for temporary residents. Because not all institutions responded to all items, details may not sum to totals. Percentages are based on total of known race/ethnicity. See Appendix A for a description of each race/ethnicity category. See Appendix D for the survey taxonomy.Source: CGS/GRE Survey of Graduate Enrollment and Degrees

B11Graduate Enrollment and Degrees: 2010 to 2020
Table B.12: Total Graduate Enrollment by Institution Type, Carnegie Classification, Gender, and Attendance Status, Fall 2020
Carnegie Classification and Institution Type *
Total Men Women Full-Time Part-Time
Total 1,737,532 688,267 40.3% 1,021,366 59.7% 975,190 56.6% 748,234 43.4%
Public 1,152,978 473,565 41.5% 666,524 58.5% 618,554 54.2% 521,858 45.8%
Private, not-for-profit 504,980 199,597 39.9% 301,085 60.1% 308,454 61.3% 194,984 38.7%
Private, for-profit S S S S S
Doctoral: Very High Research 869,003 405,169 47.2% 454,097 52.8% 562,115 65.4% 297,151 34.6%
Public 656,859 303,105 46.8% 344,017 53.2% 408,095 63.1% 239,027 36.9%
Private, not-for-profit 212,144 102,064 48.1% 110,080 51.9% 154,020 72.6% 58,124 27.4%
Private, for-profit N/A N/A N/A N/A N/A
Doctoral: High Research 313,691 117,083 37.9% 191,630 62.1% 159,535 50.9% 154,156 49.1%
Public 222,187 83,422 38.1% 135,613 61.9% 102,580 46.2% 119,607 53.8%
Private, not-for-profit 91,504 33,661 37.5% 56,017 62.5% 56,955 62.2% 34,549 37.8%
Private, for-profit N/A N/A N/A N/A N/A
Doctoral/Professional Universities 219,042 54,609 26.4% 151,928 73.6% 95,659 44.4% 120,027 55.6%
Public 65,450 18,094 27.6% 47,356 72.4% 21,190 33.8% 41,431 66.2%
Private, not-for-profit 97,943 27,961 29.1% 68,189 70.9% 49,096 50.4% 48,320 49.6%
Private, for-profit S S S S S
Master’s Colleges and Universities 281,562 93,513 33.3% 187,370 66.7% 115,261 41.1% 165,286 58.9%
Public 190,089 62,923 33.1% 127,166 66.9% 75,396 39.7% 114,693 60.3%
Private, not-for-profit 91,473 30,590 33.7% 60,204 66.3% 39,865 44.1% 50,593 55.9%
Private, for-profit S S S S S
Other 50,950 16,872 33.1% 34,078 66.9% 40,089 78.7% 10,861 21.3%
Public 18,393 6,021 32.7% 12,372 67.3% 11,293 61.4% 7,100 38.6%
Private, not-for-profit 11,916 5,321 44.7% 6,595 55.3% 8,518 71.5% 3,398 28.5%
Private, for-profit N/A N/A N/A N/A N/A
* See Appendix A for information about the Carnegie Classification system. Notes: Because not all institutions responded to all items, details may not sum to totals. Percentages are based on total of known gender or attendance status. N/A = Not applicable. S = Suppressed due to small number of institutional respondents in this category.Source: CGS/GRE Survey of Graduate Enrollment and Degrees

B12 Council of Graduate Schools
Table B.13: Total Graduate Enrollment by Broad Field, Gender, and Attendance Status, Fall 2020
Broad Field Total Men Women Full-Time Part-Time
Total 1,737,532 688,267 40.3% 1,021,366 59.7% 975,190 56.6% 748,234 43.4%
Arts and Humanities 83,796 36,207 43.2% 47,578 56.8% 55,450 66.2% 28,346 33.8%
Biological and Agricultural Sciences 90,229 37,790 41.9% 52,426 58.1% 66,843 74.1% 23,386 25.9%
Business 251,301 131,136 53.5% 114,089 46.5% 117,035 47.0% 131,727 53.0%
Education 265,312 62,038 23.8% 198,341 76.2% 95,712 36.2% 168,737 63.8%
Engineering 133,242 96,315 72.3% 36,929 27.7% 89,885 67.5% 43,362 32.5%
Health Sciences 235,965 49,231 20.9% 186,734 79.1% 134,587 57.0% 101,378 43.0%
Mathematics and Computer Sciences 115,192 77,656 68.0% 36,547 32.0% 61,272 53.5% 53,241 46.5%
Physical and Earth Sciences 48,166 29,054 60.3% 19,112 39.7% 40,096 83.2% 8,070 16.8%
Public Administration and Services 74,231 15,549 21.0% 58,515 79.0% 45,661 61.5% 28,570 38.5%
Social and Behavioral Sciences 121,539 42,088 35.5% 76,402 64.5% 79,514 65.7% 41,466 34.3%
Other Fields 106,678 41,558 39.1% 64,856 60.9% 51,162 48.0% 55,516 52.0%
Notes: Because not all institutions responded to all items, details may not sum to totals. Percentages are based on total of known gender or attendance status. See Appendix D for the survey taxonomy.Source: CGS/GRE Survey of Graduate Enrollment and Degrees
Table B.14: Total Graduate Enrollment by Gender, Attendance Status, and Broad Field, Fall 2020
Men Women
Broad Field Full-Time Part-Time Full-Time Part-Time
Total 406,770 59.2% 280,358 40.8% 560,111 54.9% 459,229 45.1%
Arts and Humanities 23,825 65.8% 12,382 34.2% 31,625 66.5% 15,953 33.5%
Biological and Agricultural Sciences 28,192 74.6% 9,598 25.4% 38,651 73.7% 13,775 26.3%
Business 62,204 47.4% 68,982 52.6% 53,345 46.7% 60,871 53.3%
Education 22,621 36.5% 39,389 63.5% 70,952 35.8% 127,233 64.2%
Engineering 64,231 66.7% 32,087 33.3% 25,654 69.5% 11,275 30.5%
Health Sciences 30,996 63.0% 18,235 37.0% 103,591 55.5% 83,143 44.5%
Mathematics and Computer Sciences 40,408 52.0% 37,248 48.0% 20,724 56.7% 15,823 43.3%
Physical and Earth Sciences 24,468 84.2% 4,586 15.8% 15,628 81.8% 3,484 18.2%
Public Administration and Services 8,480 54.5% 7,069 45.5% 37,111 63.4% 21,404 36.6%
Social and Behavioral Sciences 27,788 66.0% 14,338 34.0% 50,968 66.6% 25,514 33.4%
Other Fields 19,610 47.2% 21,948 52.8% 31,424 48.5% 33,432 51.5%
Notes: Because not all institutions responded to all items, details may not sum to totals. Percentages are based on total of known attendance status. See Appendix D for the survey taxonomy.Source: CGS/GRE Survey of Graduate Enrollment and Degrees

B13Graduate Enrollment and Degrees: 2010 to 2020
Table B.15: Total Graduate Enrollment by Broad Field and Degree Level, Fall 2020
Broad Field Total Doctoral Master’s/Other *
Total 1,737,532 457,312 27.1% 1,229,461 72.9%
Arts and Humanities 83,796 31,315 38.8% 49,395 61.2%
Biological and Agricultural Sciences 90,229 47,012 53.4% 40,961 46.6%
Business 251,301 12,102 5.0% 228,226 95.0%
Education 265,312 50,235 20.4% 196,034 79.6%
Engineering 133,242 57,139 43.8% 73,327 56.2%
Health Sciences 235,965 60,473 26.6% 166,772 73.4%
Mathematics and Computer Sciences 115,192 25,138 22.4% 87,238 77.6%
Physical and Earth Sciences 48,166 35,234 75.9% 11,199 24.1%
Public Administration and Services 74,231 5,050 7.0% 67,134 93.0%
Social and Behavioral Sciences 121,539 48,841 41.8% 67,941 58.2%
Other Fields 106,678 14,855 14.6% 86,895 85.4%
* Includes total enrollment in graduate-level certificate and education specialist programs.Notes: Because not all institutions responded to all items, details may not sum to totals. Percentages are based on total of known degree levels. See Appendix D for the survey taxonomy.Source: CGS/GRE Survey of Graduate Enrollment and Degrees
Table B.16: Total Graduate Enrollment by Degree Level, Gender, and Broad Field, Fall 2020Doctoral Master’s/Other *
Broad Field Men Women Men Women
Total 211,764 46.5% 244,045 53.5% 465,876 38.1% 756,004 61.9%
Arts and Humanities 14,404 46.0% 16,911 54.0% 20,376 41.3% 28,956 58.7%
Biological and Agricultural Sciences 20,849 44.3% 26,163 55.7% 15,850 38.7% 25,111 61.3%
Business 6,143 52.0% 5,679 48.0% 120,897 53.6% 104,815 46.4%
Education 14,623 29.1% 35,542 70.9% 43,023 22.1% 151,785 77.9%
Engineering 41,300 72.3% 15,839 27.7% 53,007 72.3% 20,320 27.7%
Health Sciences 16,035 26.5% 44,438 73.5% 30,858 18.5% 135,766 81.5%
Mathematics and Computer Sciences 18,035 71.9% 7,033 28.1% 58,167 67.1% 28,456 32.9%
Physical and Earth Sciences 22,236 63.1% 12,998 36.9% 5,836 52.1% 5,363 47.9%
Public Administration and Services 1,523 30.2% 3,527 69.8% 13,453 20.1% 53,364 79.9%
Social and Behavioral Sciences 18,025 37.0% 30,746 63.0% 22,904 34.1% 44,264 65.9%
Other Fields 6,608 44.5% 8,247 55.5% 33,259 38.3% 53,636 61.7%
* Includes total enrollment in graduate-level certificate and education specialist programs.Notes: Because not all institutions responded to all items, details may not sum to totals. Percentages are based on total of known gender. See Appendix D for the survey taxonomy.Source: CGS/GRE Survey of Graduate Enrollment and Degrees

B14 Council of Graduate Schools
Table B.17: Total Graduate Enrollment by Institution Type, Carnegie Classification, and Citizenship, Fall 2020
Institution Type and Carnegie Classification *
Total U.S. Citizens and Permanent Residents
Temporary Residents
Total 1,737,532 1,443,643 83.8% 279,114 16.2%
Institution Type
Public 1,152,978 956,282 84.1% 181,390 15.9%
Private, not-for-profit 504,980 407,614 80.9% 96,218 19.1%
Private, for-profit S S S
Carnegie Classification *
Doctoral: Very High Research 869,003 655,482 75.9% 207,564 24.1%
Doctoral: High Research 313,691 275,204 87.6% 39,110 12.4%
Doctoral/Professional Universities 219,042 195,288 95.5% 9,280 4.5%
Master’s Colleges and Universities 281,562 270,102 94.2% 16,592 5.8%
Other 51,303 44,657 87.2% 6,547 12.8%
* See Appendix A for information about the Carnegie Classification system. S = Suppressed due to small number of institutional respondents in this category.Notes: Because not all institutions responded to all items, details may not sum to totals. Percentages are based on total of known citizenship.Source: CGS/GRE Survey of Graduate Enrollment and Degrees
Table B.18: Total Graduate Enrollment by Broad Field and Citizenship, Fall 2020
Broad Field Total U.S. Citizens and Permanent Residents
Temporary Residents
Total 1,737,532 1,443,643 83.8% 279,114 16.2%
Arts and Humanities 83,796 68,864 83.4% 13,675 16.6%
Biological and Agricultural Sciences 90,229 70,749 80.7% 16,969 19.3%
Business 251,301 210,973 86.8% 32,201 13.2%
Education 265,312 248,521 96.5% 9,079 3.5%
Engineering 133,242 72,112 55.2% 58,513 44.8%
Health Sciences 235,965 221,100 95.8% 9,808 4.2%
Mathematics and Computer Sciences 115,192 62,813 56.2% 48,877 43.8%
Physical and Earth Sciences 48,166 32,024 67.5% 15,417 32.5%
Public Administration and Services 74,231 71,521 97.0% 2,181 3.0%
Social and Behavioral Sciences 121,539 99,532 85.0% 17,591 15.0%
Other Fields 106,678 91,842 87.0% 13,664 13.0%
Notes: Because not all institutions responded to all items, details may not sum to totals. Percentages are based on total of known citizenship. See Appendix D for the survey taxonomy.Source: CGS/GRE Survey of Graduate Enrollment and Degrees

B15Graduate Enrollment and Degrees: 2010 to 2020
Table B.19: Total Graduate Enrollment by Citizenship, Race/Ethnicity, and Gender, Fall 2020
Citizenship and Race/Ethnicity Total Men Women
Total 1,737,532 688,267 40.3% 1,021,366 59.7%
U.S. Citizens and Permanent Residents 1,443,643 534,714 37.3% 898,558 62.7%
Hispanic/Latino 173,829 62,077 36.0% 110,564 64.0%
Non-Hispanic:
American Indian/Alaska Native 6,849 2,212 32.5% 4,594 67.5%
Asian 105,756 46,588 44.2% 58,739 55.8%
Black/African American 185,116 54,140 29.5% 129,350 70.5%
Native Hawaiian/ Other Pacific Islander
2,544 978 38.9% 1,535 61.1%
White 855,386 324,887 38.2% 524,786 61.8%
Two or More Races 44,808 16,522 37.1% 27,966 62.9%
Race/Ethnicity Unknown 72,324 28,198 39.5% 43,105 60.5%
Temporary Residents 279,114 158,790 56.9% 120,062 43.1%
Citizenship Unknown 9,052 707 32.5% 1,471 67.5%
Notes: Because not all institutions responded to all items, details may not sum to totals. Percentages are based on total of known gender within each citizenship and race/ethnicity category. See Appendix A for a description of each citizenship and race/ethnicity category. See Appendix D for the survey taxonomy.Source: CGS/GRE Survey of Graduate Enrollment and Degrees

B16 Council of Graduate Schools
Table B.20: Total Graduate Enrollment by Broad Field and Race/Ethnicity, Fall 2020 (U.S. Citizens and Permanent Residents Only)
Broad Field Hispanic/Latino American Indian/ Alaska Native
Asian Black/ African American
Total 173,829 12.0% 6,849 0.5% 105,756 7.3% 185,116 12.8%
Arts and Humanities 8,137 11.8% 395 0.6% 3,115 4.5% 4,477 6.5%
Biological and Agricultural Sciences 7,964 11.3% 327 0.5% 6,544 9.2% 4,690 6.6%
Business 24,218 11.5% 824 0.4% 19,374 9.2% 28,647 13.5%
Education 31,127 12.4% 1,509 0.6% 7,769 3.1% 36,783 14.7%
Engineering 8,181 11.3% 236 0.3% 9,627 13.4% 4,435 6.2%
Health Sciences 22,355 10.1% 887 0.4% 17,734 8.0% 29,627 13.4%
Mathematics and Computer Sciences 6,231 9.9% 149 0.2% 11,488 18.3% 6,645 10.6%
Physical and Earth Sciences 3,346 10.4% 107 0.3% 2,445 7.6% 1,224 3.8%
Public Administration and Services 10,496 14.7% 501 0.7% 2,257 3.2% 14,532 20.3%
Social and Behavioral Sciences 14,032 14.0% 622 0.6% 5,422 5.4% 13,373 13.3%
Other Fields 11,066 12.0% 657 0.7% 4,153 4.5% 10,890 11.9%
Broad Field Native Hawaiian/ Other Pacific Islander
White Two or More Races Race/ Ethnicity Unknown
Total 2,544 0.2% 855,386 59.1% 44,808 3.1% 72,324 5.0%
Arts and Humanities 123 0.2% 46,741 67.9% 2,637 3.8% 3,239 4.7%
Biological and Agricultural Sciences 116 0.2% 45,575 64.4% 2,677 3.8% 2,859 4.0%
Business 627 0.3% 120,695 57.1% 5,944 2.8% 11,119 5.3%
Education 532 0.2% 155,446 62.1% 6,323 2.5% 10,786 4.3%
Engineering 131 0.2% 43,967 61.0% 2,603 3.6% 2,932 4.1%
Health Sciences 456 0.2% 132,674 60.0% 6,028 2.7% 11,539 5.2%
Mathematics and Computer Sciences 125 0.2% 32,720 52.1% 2,076 3.3% 3,379 5.4%
Physical and Earth Sciences 64 0.2% 22,552 70.4% 1,151 3.6% 1,135 3.5%
Public Administration and Services 130 0.2% 38,618 53.9% 2,339 3.3% 2,761 3.9%
Social and Behavioral Sciences 178 0.2% 58,135 58.0% 3,804 3.8% 4,662 4.7%
Other Fields 184 0.2% 56,896 62.0% 3,015 3.3% 4,975 5.4%
Notes: This table only includes U.S. citizens and permanent residents. See Table B.18 for total enrollment by broad field for temporary residents. Because not all institutions responded to all items, details may not sum to totals. Percentages are based on total of known race/ethnicity. See Appendix A for a description of each race/ethnicity category. See Appendix D for the survey taxonomy.Source: CGS/GRE Survey of Graduate Enrollment and Degrees

B17Graduate Enrollment and Degrees: 2010 to 2020
Table B.21: Graduate Degrees and Certificates Awarded by Degree Level, Carnegie Classification, and Institution Type, 2019-20
Carnegie Classification and Institution Type *
Doctoral Degrees Master’s Degrees Certificates
Total 76,111 100.0% 533,002 100.0% 50,721 100.0%
Public 50,432 66.7% 346,933 65.2% 36,593 72.3%
Private, not-for-profit 22,519 29.8% 169,038 31.8% 12,293 24.3%
Private, for-profit S S S
Doctoral: Highest Research 49,150 64.7% 260,644 49.0% 24,553 48.5%
Public 37,431 76.2% 190,522 73.1% 20,669 84.2%
Private, not-for-profit 11,719 23.8% 70,122 26.9% 3,884 15.8%
Private, for-profit N/A N/A N/A
Doctoral: Very High Research 12,726 16.7% 97,548 18.3% 10,228 20.2%
Public 8,337 65.5% 67,811 69.5% 8,058 78.8%
Private, not-for-profit 4,389 34.5% 29,737 30.5% 2,170 21.2%
Private, for-profit N/A N/A N/A
Doctoral/Professional Universities 8,286 10.9% 59,172 11.1% 5,479 10.8%
Public 1,712 20.7% 18,178 30.7% 2,324 42.4%
Private, not-for-profit 4,320 52.1% 30,941 52.3% 2,347 42.8%
Private, for-profit S S S
Master’s Colleges and Universities 3,436 4.5% 100,604 18.9% 8,599 17.0%
Public 1,702 49.5% 66,102 65.7% 5,173 60.2%
Private, not-for-profit 1,734 50.5% 34,502 34.3% 3,426 39.8%
Private, for-profit S S S
Other 2,403 3.2% 14,120 2.7% 1,742 3.4%
Public 1,250 63.8% 4,320 30.8% 369 21.2%
Private, not-for-profit 357 18.2% 3,736 26.6% 466 26.8%
Private, for-profit N/A N/A N/A
* See Appendix A for information about the Carnegie Classification system. Notes: Percentages for Carnegie classifications are the percent of all degrees awarded at that level by institutions with that Carnegie classification. Percentages for institution types are the percent of degrees awarded at that level by institutions with that Carnegie classification. N/A = Not applicable. S = Suppressed due to small number of institutional respondents in this category. Because not all institutions responded to all items, details may not sum to totals.Source: CGS/GRE Survey of Graduate Enrollment and Degrees

B18 Council of Graduate Schools
Table B.22: Graduate Degrees and Certificates Awarded by Degree Level and Broad Field, 2019-20
Broad Field Doctoral Degrees Master’s Degrees Certificates
Total 76,111 100.0% 533,002 100.0% 50,721 100.0%
Arts and Humanities 4,688 7.2% 20,541 4.5% 1,234 3.0%
Biological and Agricultural Sciences 7,483 11.5% 17,491 3.8% 1,062 2.6%
Business 2,217 3.4% 98,572 21.4% 5,094 12.6%
Education 7,966 12.3% 86,437 18.8% 12,000 29.6%
Engineering 9,095 14.0% 38,005 8.2% 4,861 12.0%
Health Sciences 14,231 21.9% 62,015 13.5% 5,422 13.4%
Mathematics and Computer Sciences 3,245 5.0% 37,014 8.0% 1,953 4.8%
Physical and Earth Sciences 5,050 7.8% 6,355 1.4% 523 1.3%
Public Administration and Services 1,302 2.0% 27,850 6.0% 948 2.3%
Social and Behavioral Sciences 7,277 11.2% 30,653 6.7% 2,736 6.8%
Other Fields 2,367 3.6% 35,992 7.8% 4,679 11.5%
Notes: Because not all institutions responded to all items, details may not sum to totals. Percentages are based on total of known broad fields. See Appendix D for the survey taxonomy.Source: CGS/GRE Survey of Graduate Enrollment and Degrees
Table B.23: Graduate Certificates Awarded by Broad Field and Gender, 2019-20
Broad Field Total Men Women
Total 50,721 18,849 37.9% 30,946 62.1%
Arts and Humanities 1,234 514 41.7% 720 58.3%
Biological and Agricultural Sciences 1,062 390 36.7% 672 63.3%
Business 5,094 2,447 48.4% 2,614 51.6%
Education 12,000 2,543 21.2% 9,437 78.8%
Engineering 4,861 3,298 67.8% 1,563 32.2%
Health Sciences 5,422 1,031 19.0% 4,391 81.0%
Mathematics and Computer Sciences 1,953 1,201 61.5% 752 38.5%
Physical and Earth Sciences 523 294 56.2% 229 43.8%
Public Administration and Services 948 239 25.2% 709 74.8%
Social and Behavioral Sciences 2,736 1,031 37.4% 1,728 62.6%
Other Fields 4,679 1,746 37.3% 2,933 62.7%
Notes: Because not all institutions responded to all items, details may not sum to totals. Percentages are based on total of known gender. See Appendix D for the survey taxonomy.Source: CGS/GRE Survey of Graduate Enrollment and Degrees

B19Graduate Enrollment and Degrees: 2010 to 2020
Table B.24: Master’s Degrees Awarded by Broad Field and Gender, 2019-20
Broad Field Total Men Women
Total 533,002 210,290 39.9% 317,290 60.1%
Arts and Humanities 20,541 8,738 42.5% 11,803 57.5%
Biological and Agricultural Sciences 17,491 7,169 41.0% 10,319 59.0%
Business 98,572 53,322 54.2% 45,132 45.8%
Education 86,437 19,087 22.2% 67,069 77.8%
Engineering 38,005 27,435 72.2% 10,570 27.8%
Health Sciences 62,015 11,914 19.2% 50,101 80.8%
Mathematics and Computer Sciences 37,014 23,856 64.5% 13,141 35.5%
Physical and Earth Sciences 6,355 3,659 57.6% 2,696 42.4%
Public Administration and Services 27,850 5,496 19.7% 22,345 80.3%
Social and Behavioral Sciences 30,653 11,282 36.9% 19,305 63.1%
Other Fields 35,992 14,734 41.0% 21,246 59.0%
Notes: Because not all institutions responded to all items, details may not sum to totals. Percentages are based on total of known gender. See Appendix D for the survey taxonomy.Source: CGS/GRE Survey of Graduate Enrollment and Degrees
Table B.25: Doctoral Degrees Awarded by Broad Field and Gender, 2019-20
Broad Field Total Men Women
Total 76,111 35,368 46.9% 40,037 53.1%
Arts and Humanities 4,688 2,261 48.2% 2,427 51.8%
Biological and Agricultural Sciences 7,483 3,454 46.2% 4,029 53.8%
Business 2,217 1,144 53.3% 1,002 46.7%
Education 7,966 2,521 32.2% 5,316 67.8%
Engineering 9,095 6,813 75.1% 2,261 24.9%
Health Sciences 14,231 4,068 28.6% 10,163 71.4%
Mathematics and Computer Sciences 3,245 2,404 74.2% 835 25.8%
Physical and Earth Sciences 5,050 3,285 65.0% 1,765 35.0%
Public Administration and Services 1,302 308 23.8% 987 76.2%
Social and Behavioral Sciences 7,277 2,821 38.8% 4,459 61.3%
Other Fields 2,367 1,086 46.1% 1,271 53.9%
Notes: Because not all institutions responded to all items, details may not sum to totals. Percentages are based on total of known gender. See Appendix D for the survey taxonomy.Source: CGS/GRE Survey of Graduate Enrollment and Degrees

B20 Council of Graduate Schools
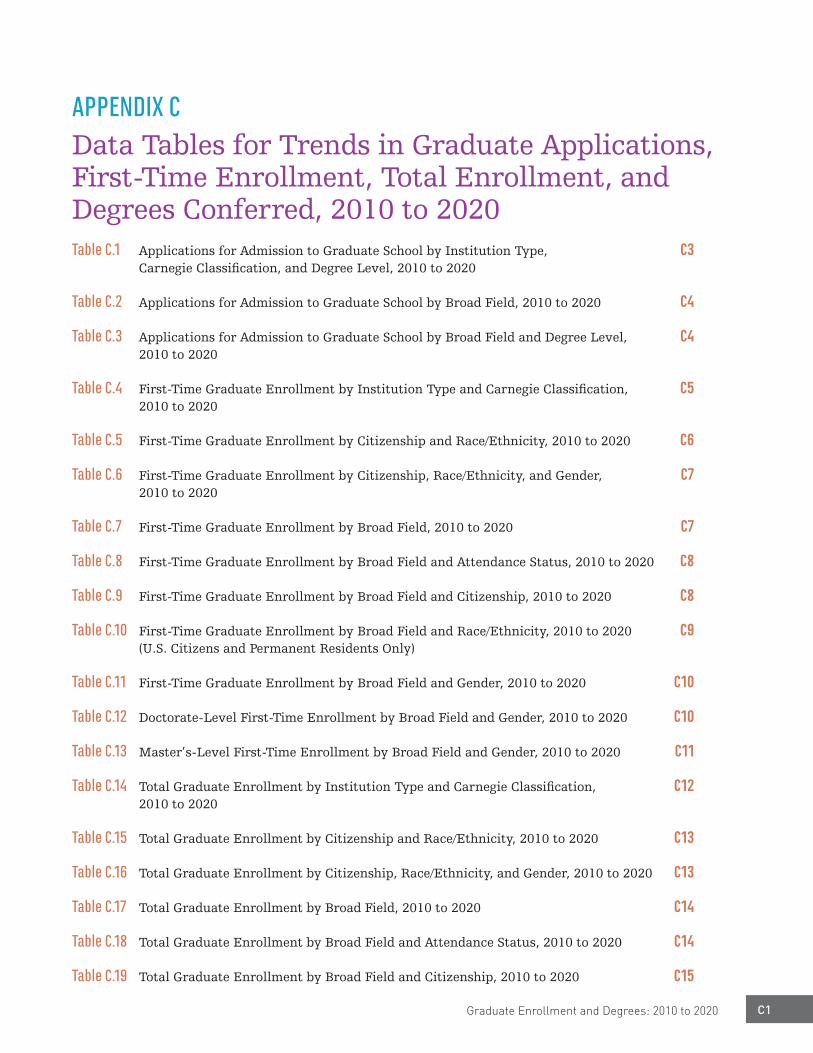
C1Graduate Enrollment and Degrees: 2010 to 2020
Table C.1 Applications for Admission to Graduate School by Institution Type, C3 Carnegie Classification, and Degree Level, 2010 to 2020
Table C.2 Applications for Admission to Graduate School by Broad Field, 2010 to 2020 C4
Table C.3 Applications for Admission to Graduate School by Broad Field and Degree Level, C4 2010 to 2020
Table C.4 First-Time Graduate Enrollment by Institution Type and Carnegie Classification, C5 2010 to 2020
Table C.5 First-Time Graduate Enrollment by Citizenship and Race/Ethnicity, 2010 to 2020 C6
Table C.6 First-Time Graduate Enrollment by Citizenship, Race/Ethnicity, and Gender, C7 2010 to 2020
Table C.7 First-Time Graduate Enrollment by Broad Field, 2010 to 2020 C7
Table C.8 First-Time Graduate Enrollment by Broad Field and Attendance Status, 2010 to 2020 C8
Table C.9 First-Time Graduate Enrollment by Broad Field and Citizenship, 2010 to 2020 C8
Table C.10 First-Time Graduate Enrollment by Broad Field and Race/Ethnicity, 2010 to 2020 C9 (U.S. Citizens and Permanent Residents Only)
Table C.11 First-Time Graduate Enrollment by Broad Field and Gender, 2010 to 2020 C10
Table C.12 Doctorate-Level First-Time Enrollment by Broad Field and Gender, 2010 to 2020 C10
Table C.13 Master’s-Level First-Time Enrollment by Broad Field and Gender, 2010 to 2020 C11
Table C.14 Total Graduate Enrollment by Institution Type and Carnegie Classification, C12 2010 to 2020
Table C.15 Total Graduate Enrollment by Citizenship and Race/Ethnicity, 2010 to 2020 C13
Table C.16 Total Graduate Enrollment by Citizenship, Race/Ethnicity, and Gender, 2010 to 2020 C13
Table C.17 Total Graduate Enrollment by Broad Field, 2010 to 2020 C14
Table C.18 Total Graduate Enrollment by Broad Field and Attendance Status, 2010 to 2020 C14
Table C.19 Total Graduate Enrollment by Broad Field and Citizenship, 2010 to 2020 C15
APPENDIX C Data Tables for Trends in Graduate Applications, First-Time Enrollment, Total Enrollment, and Degrees Conferred, 2010 to 2020

C2 Council of Graduate Schools
Table C.20 Total Graduate Enrollment by Broad Field and Race/Ethnicity, 2010 to 2020 C16 (U.S. Citizens and Permanent Residents Only)
Table C.21 Total Graduate Enrollment by Broad Field and Gender, 2010 to 2020 C17
Table C.22 Doctorate-Level Total Enrollment by Broad Field and Gender, 2010 to 2020 C17
Table C.23 Master’s-Level Total Enrollment by Broad Field and Gender, 2010 to 2020 C18
Table C.24 Graduate Degrees and Certificates Awarded by Degree Level and Institution Type, C19 2009-10 to 2019-20
Table C.25 Graduate Degrees and Certificates Awarded by Degree Level and C20 Carnegie Classification, 2009-10 to 2019-20
Table C.26 Graduate Degrees and Certificates Awarded by Degree Level, Institution Type, C21 and Gender, 2009-10 to 2019-20
Table C.27 Graduate Degrees and Certificates Awarded by Degree Level, C22 Carnegie Classification, and Gender, 2009-10 to 2019-20
Table C.28 Graduate-Level Certificates Awarded by Broad Field and Gender, 2009-10 to 2019-20 C23
Table C.29 Master’s Degrees Awarded by Broad Field and Gender, 2009-10 to 2019-20 C23
Table C.30 Doctoral Degrees Awarded by Broad Field and Gender, 2009-10 to 2019-20 C24

C3Graduate Enrollment and Degrees: 2010 to 2020
Table C.1: Applications for Admission to Graduate School by Institution Type, Carnegie Classification, and Degree Level, 2010 to 2020
Institution Type, Carnegie Classification, and Degree Level
% Change, 2019 to 2020
Average Annual % Change,
2015 to 2020
Average Annual % Change,
2010 to 2020
Total 7.3% 2.0% 2.5%
Institution Type
Public 6.1% 0.6% 1.7%
Private, not-for-profit 9.2% 4.5% 4.2%
Private, for-profit S N/A N/A
Carnegie Classification *
Doctoral: Very High Research 8.1% 2.7% 2.6%
Doctoral: High Research 4.5% 0.3% 1.5%
Doctoral/Professional Universities 5.6% 1.5% 4.4%
Master’s Colleges and Universities 2.8% -1.3% 1.4%
Other 16.1% 6.3% 5.4%
Degree Level
Doctoral 2.8% 1.9% 0.9%
Master’s/Other ** 9.6% 2.1% 3.4%
* See Appendix A for information about the Carnegie Classification system.** Includes applications to graduate-level certificate and education specialist programs.Notes: Group sizes for each annual change analysis (1, 5, and 10-year) were determined based on only those institutions that submitted data at both current and reference years.N/A = Not available. S = Suppressed due to small number of institutional respondents in this category. Not all respondents provided applications data by level.Source: CGS/GRE Survey of Graduate Enrollment and Degrees

C4 Council of Graduate Schools
Table C.2: Applications for Admission to Graduate School by Broad Field, 2010 to 2020
Broad Field % Change, 2019 to 2020
Average Annual % Change,
2015 to 2020
Average Annual % Change,
2010 to 2020
Total 7.3% 2.0% 2.5%
Arts and Humanities 1.9% -1.7% -2.1%
Biological and Agricultural Sciences 15.0% 5.7% 3.5%
Business 17.3% 4.6% 3.0%
Education 5.7% 1.0% -0.2%
Engineering 1.8% -3.0% 1.6%
Health Sciences 2.3% 0.1% 4.1%
Mathematics and Computer Sciences 11.5% 7.4% 16.6%
Physical and Earth Sciences 4.0% 1.6% 1.5%
Public Administration and Services 3.6% -0.3% 0.2%
Social and Behavioral Sciences 8.9% 1.2% 0.2%
Other Fields 11.3% 3.3% 0.8%
Notes: See Appendix D for the survey taxonomy.Group sizes for each annual change analysis (1, 5, and 10-year) were determined based on only those insti-tutions that submitted data at both current and reference years.Source: CGS/GRE Survey of Graduate Enrollment and Degrees
Table C.3: Applications for Admission to Graduate School by Broad Field and Degree Level, 2010 to 2020
Doctoral Master’s/Other *
Broad Field % Change, 2019 to 2020
Average Annual % Change,
2015 to 2020
Average Annual % Change,
2010 to 2020
% Change, 2019 to 2020
Average Annual % Change,
2015 to 2020
Average Annual % Change,
2010 to 2020
Total 2.8% 1.9% 0.9% 9.6% 2.1% 3.4%
Arts and Humanities 4.2% -1.3% -2.1% 0.3% -2.0% -2.1%
Biological and Agricultural Sciences 11.1% 6.4% 3.4% 22.3% 4.6% 3.7%
Business -1.3% 1.8% -1.4% 19.1% 4.9% 3.6%
Education -7.2% -1.0% 0.3% 9.0% 1.5% -0.2%
Engineering -0.5% -0.3% 0.1% 3.1% -4.2% 2.9%
Health Sciences 0.3% 0.4% 3.7% 3.0% 0.0% 4.3%
Mathematics and Computer Sciences 4.7% 7.0% 5.1% 13.8% 7.5% 25.4%
Physical and Earth Sciences 3.1% 2.5% 2.2% 8.3% -1.7% -0.9%
Public Administration and Services -8.6% 2.1% -0.7% 4.6% -0.4% 0.3%
Social and Behavioral Sciences 3.7% -0.4% -0.6% 16.3% 3.6% 1.5%
Other Fields -1.0% 1.5% 0.8% 14.0% 3.7% 0.8%
* Includes applications to graduate-level certificate and education specialist programs. Notes: Group sizes for each annual change analysis (1, 5, and 10-year) were determined based on only those institutions that submitted data at both current and reference years.See Appendix D for the survey taxonomy.Source: CGS/GRE Survey of Graduate Enrollment and Degrees

C5Graduate Enrollment and Degrees: 2010 to 2020
Table C.4: First-Time Graduate Enrollment by Institution Type and Carnegie Classification, 2010 to 2020
Carnegie Classification and Institution Type * % Change, 2019 to 2020
Average Annual % Change,
2015 to 2020
Average Annual % Change,
2010 to 2020
Total 1.8% 1.7% 1.8%
Public 3.0% 2.0% 2.1%
Private, not-for-profit -0.7% 1.6% 1.3%
Private, for-profit N/A S S
Doctoral: Very High Research -0.7% 2.0% 2.3%
Public 0.1% 1.7% 2.2%
Private, not-for-profit -3.1% 2.9% 2.6%
Private, for-profit N/A N/A N/A
Doctoral: High Research 5.6% 1.1% 1.3%
Public 5.8% 1.2% 1.6%
Private, not-for-profit 4.9% 0.7% 0.6%
Private, for-profit N/A N/A N/A
Doctoral/Professional Universities 6.5% 0.9% 1.1%
Public 10.6% 5.4% 4.2%
Private, not-for-profit 4.1% 0.7% 0.5%
Private, for-profit N/A S S
Master’s Colleges and Universities 4.9% 1.7% 1.3%
Public 8.6% 2.7% 1.9%
Private, not-for-profit -5.2% -1.1% -0.2%
Private, for-profit N/A N/A N/A
Other -1.9% 3.8% 2.6%
Public 2.0% 4.1% 3.8%
Private, not-for-profit -6.7% 3.4% 1.1%
Private, for-profit N/A N/A N/A
* See Appendix A for information about the Carnegie Classification system. Notes: Group sizes for each annual change analysis (1, 5, and 10-year) were determined based on only those institutions that submitted data at both current and reference years.N/A = Not available. S = Suppressed due to small number of institutional respondents in this category.Because not all institutions responded to all items, details may not sum to totals.Source: CGS/GRE Survey of Graduate Enrollment and Degrees

C6 Council of Graduate Schools
Table C.5: First-Time Graduate Enrollment by Citizenship and Race/Ethnicity, 2010 to 2020
Citizenship and Race/Ethnicity % Change, 2019 to 2020
Average Annual % Change,
2015 to 2020
Average Annual % Change,
2010 to 2020
Total 1.8% 1.7% 1.8%
U.S. Citizens and Permanent Residents 12.9% 4.9% 2.7%
American Indian/Alaska Native 8.8% 2.9% 0.8%
Asian/Pacific Islander * 16.7% 9.7% 6.3%
Asian 17.1% 9.9% N/A
Native Hawaiians/Other Pacific Islanders 1.7% 1.3% N/A
Black/African American 16.0% 6.1% 5.4%
Hispanic/Latino 20.4% 12.9% 9.2%
White 10.1% 2.9% 1.1%
Temporary Residents -37.4% -7.7% -0.8%
Other/Unknown ** 8.8% 0.9% -1.2%
** Includes U.S. citizens and permanent residents of two or more races, U.S. citizens and permanent residents whose race/ethnicity is not known and individuals whose citizenship is not known.Notes: Group sizes for each annual change analysis (1, 5, and 10-year) were determined based on only those institutions that submitted data at both current and reference years.N/A=Not available. Ten-year trend data are unavailable for Asian and Native Hawaiians/ Other Pacific Islanders. See Appendix A for a description of each citizenship and race/ethnicity category.Source: CGS/GRE Survey of Graduate Enrollment and Degrees

C7Graduate Enrollment and Degrees: 2010 to 2020
Table C.6: First-Time Graduate Enrollment by Citizenship, Race/Ethnicity, and Gender, 2010 to 2020
Men Women
Citizenship and Race/Ethnicity % Change, 2019 to 2020
Average Annual % Change,
2015 to 2020
Average Annual % Change,
2010 to 2020
% Change, 2019 to 2020
Average Annual % Change,
2015 to 2020
Average Annual % Change,
2010 to 2020
Total -2.1% -0.3% 0.9% 4.6% 3.3% 2.5%
U.S. Citizens and Permanent Residents 12.8% 3.9% 2.0% 12.9% 5.5% 3.1%
American Indian/Alaska Native 11.0% 1.5% -0.3% 7.3% 3.5% 1.5%
Asian/Pacific Islander * 16.4% 9.1% 5.4% 16.8% 10.3% 7.1%
Asian 16.9% 9.3% N/A 17.0% 10.5% N/A
Native Hawaiians/Other Pacific Islanders -6.9% 0.4% N/A 8.1% 2.0% N/A
Black/African American 16.4% 5.9% 5.5% 15.9% 6.2% 5.4%
Hispanic/Latino 20.6% 11.3% 8.5% 20.3% 13.8% 9.6%
White 10.0% 1.9% 0.5% 10.1% 3.6% 1.5%
Temporary Residents -39.7% -8.9% -1.5% -34.4% -6.1% 0.2%
Other/Unknown ** 9.7% 0.1% -1.8% 8.3% 1.4% -0.8%
** Includes U.S. citizens and permanent residents of two or more races, U.S. citizens and permanent residents whose race/ethnicity is not known and individuals whose citizenship is not known.Notes: Group sizes for each annual change analysis (1, 5, and 10-year) were determined based on only those institutions that submitted data at both current and reference years.N/A=Not available. Ten-year trend data are unavailable for Asian and Native Hawaiians/Other Pacific Islanders. See Appendix A for a description of each citizenship and race/ethnicity category.Source: CGS/GRE Survey of Graduate Enrollment and Degrees
Table C.7: First-Time Graduate Enrollment by Broad Field, 2010 to 2020
Broad Field % Change, 2019 to 2020
Average Annual % Change,
2015 to 2020
Average Annual % Change,
2010 to 2020
Total 1.8% 1.7% 1.8%
Arts and Humanities -5.6% -2.1% -2.1%
Biological and Agricultural Sciences 9.1% 4.1% 2.4%
Business 16.0% 6.1% 4.1%
Education 7.7% 1.6% -0.4%
Engineering -15.8% -3.9% 0.0%
Health Sciences 8.0% 3.5% 5.2%
Mathematics and Computer Sciences -16.6% -0.6% 6.8%
Physical and Earth Sciences -7.7% -1.5% -0.7%
Public Administration and Services 6.5% 1.6% 1.6%
Social and Behavioral Sciences 3.1% 2.0% 0.2%
Other Fields -3.0% 1.2% -0.3%
Notes: See Appendix D for the survey taxonomy.Group sizes for each annual change analysis (1, 5, and 10-year) were determined based on only those insti-tutions that submitted data at both current and reference years.Source: CGS/GRE Survey of Graduate Enrollment and Degrees

C8 Council of Graduate Schools
Table C.8: First-Time Graduate Enrollment by Broad Field and Attendance Status, 2010 to 2020
Full-Time Part-Time
Broad Field % Change, 2019 to 2020
Average Annual % Change,
2015 to 2020
Average Annual % Change,
2010 to 2020
% Change, 2019 to 2020
Average Annual % Change,
2015 to 2020
Average Annual % Change,
2010 to 2020
Total -3.7% -0.1% 1.0% 13.5% 5.9% 3.7%
Arts and Humanities -8.8% -2.7% -2.1% 8.4% 0.4% -1.9%
Biological and Agricultural Sciences 5.1% 2.7% 1.9% 30.0% 13.2% 5.5%
Business 8.7% 3.8% 2.8% 30.3% 11.0% 7.1%
Education 8.1% 1.2% -1.6% 7.3% 1.8% 1.0%
Engineering -26.2% -6.5% -1.0% 26.7% 9.4% 4.4%
Health Sciences 5.1% 1.9% 4.5% 14.2% 6.8% 6.4%
Mathematics and Computer Sciences -31.2% -5.2% 3.4% 22.4% 15.9% 18.0%
Physical and Earth Sciences -10.0% -1.8% -0.7% 11.8% 2.0% -0.8%
Public Administration and Services 7.5% 0.9% 1.3% 4.0% 3.6% 2.4%
Social and Behavioral Sciences -1.6% 0.3% -0.6% 19.8% 8.6% 3.6%
Other Fields -4.3% 0.5% -0.3% -0.5% 2.7% -0.2%
Notes: See Appendix D for the survey taxonomy.Group sizes for each annual change analysis (1, 5, and 10-year) were determined based on only those institutions that submitted data at both current and reference years.Source: CGS/GRE Survey of Graduate Enrollment and Degrees
Table C.9: First-Time Graduate Enrollment by Broad Field and Citizenship, 2010 to 2020
U.S. Citizens and Permanent Residents Temporary Residents
Broad Field % Change, 2019 to 2020
Average Annual % Change,
2015 to 2020
Average Annual % Change,
2010 to 2020
% Change, 2019 to 2020
Average Annual % Change,
2015 to 2020
Average Annual % Change,
2010 to 2020
Total 12.9% 4.9% 2.7% -37.4% -7.7% -0.8%
Arts and Humanities -0.3% -1.3% -1.9% -29.4% -5.2% -0.5%
Biological and Agricultural Sciences 18.4% 6.2% 3.7% -27.4% -4.3% -1.3%
Business 29.2% 10.0% 6.1% -31.0% -5.9% -1.3%
Education 9.4% 2.1% -0.1% -24.0% -4.0% -0.2%
Engineering 14.6% 6.3% 2.7% -47.9% -11.7% -2.8%
Health Sciences 10.1% 4.0% 5.7% -19.4% -3.7% 0.4%
Mathematics and Computer Sciences 20.1% 15.2% 11.2% -46.4% -9.4% 3.3%
Physical and Earth Sciences 7.0% 1.8% 1.0% -42.0% -8.7% -3.9%
Public Administration and Services 8.3% 2.1% 2.0% -31.1% -7.2% -3.2%
Social and Behavioral Sciences 10.5% 3.2% 0.5% -29.1% -3.3% -0.2%
Other Fields 6.4% 3.2% -0.1% -36.7% -6.2% 0.1%
Notes: See Appendix D for the survey taxonomy.Group sizes for each annual change analysis (1, 5, and 10-year) were determined based on only those institutions that submitted data at both current and reference years.Source: CGS/GRE Survey of Graduate Enrollment and Degrees

C9Graduate Enrollment and Degrees: 2010 to 2020
Table C.10: First-Time Graduate Enrollment by Broad Field and Race/Ethnicity, 2010 to 2020 (U.S. Citizens and Permanent Residents Only)
Broad Field % Change, ‘19 – ‘20
Avg. Annual % Change, ‘15 – ‘20
Avg. Annual % Change, ‘10 – ‘20
% Change, ‘19 – ‘20
Avg. Annual % Change, ‘15 – ‘20
Avg. Annual % Change, ‘10 – ‘20
% Change, ‘19 – ‘20
Avg. Annual % Change, ‘15 – ‘20
Avg. Annual % Change, ‘10 – ‘20
American Indian/Alaska Native Asian/Pacific Islander * Asian
Total 8.8% 2.9% 0.8% 5.1% 9.7% 6.3% 17.1% 9.9% 6.7%
Arts & Humanities -28.4% -4.2% -3.4% -1.7% 1.3% -0.2% -3.6% 1.8% 0.1%
Bio. & Agric. Sci. 18.9% 6.0% 3.6% 5.9% 8.6% 5.5% 18.6% 8.5% 5.8%
Business 8.7% 8.6% 1.3% 5.1% 15.1% 7.6% 34.2% 15.1% 7.9%
Education 15.2% 6.9% 0.4% -3.4% 4.2% 1.3% 12.3% 4.5% 1.9%
Engineering 20.3% 5.7% 9.1% 10.1% 8.0% 3.4% 13.3% 8.0% 3.7%
Health Sciences 16.0% 2.5% 2.1% 2.1% 6.4% 9.7% 13.5% 5.9% 9.8%
Math & Comp. Sci. 81.8% 4.5% 9.4% 16.2% 30.9% 28.9% 28.3% 31.4% 29.5%
Physical & Earth Sci. -4.0% -0.8% -4.1% -4.4% 5.6% 3.8% 20.6% 5.6% 4.0%
Public Admin. & Svcs. -8.2% -2.7% -0.1% 9.0% 4.3% 2.2% 4.2% 4.3% 2.3%
Social & Behav. Sci. -2.9% -3.1% -2.3% 2.3% 7.3% 2.5% 14.4% 7.3% 2.8%
Other Fields 23.4% 7.8% 2.0% 8.2% 3.3% 1.5% 7.9% 3.6% 1.7%
Native Hawaiians/ Other Pacific Islanders Black/African American Hispanic/Latino
Total 1.7% 1.3% -2.0% 16.0% 6.1% 5.4% 20.4% 12.9% 9.2%
Arts & Humanities -28.0% -9.7% -5.9% 3.1% 3.3% 3.5% 6.0% 4.6% 3.1%
Bio. & Agric. Sci. 43.7% 15.4% -3.8% 35.1% 15.0% 10.3% 31.6% 16.0% 15.2%
Business 35.1% 17.9% -2.2% 33.0% 10.4% 10.9% 37.6% 19.3% 11.1%
Education -11.2% -0.9% -4.4% 23.9% 4.7% 2.9% 10.1% 7.5% 2.8%
Engineering 11.5% 6.0% -6.2% 21.1% 8.0% 3.4% 24.5% 15.3% 9.7%
Health Sciences 19.1% 2.8% 1.2% 19.6% 7.5% 9.3% 26.4% 17.7% 21.4%
Math & Comp. Sci. 11.8% -1.1% 0.6% 30.8% 12.5% 13.4% 28.6% 22.7% 14.0%
Physical & Earth Sci. 25.0% 5.7% -3.1% 5.9% 10.8% 2.7% 18.9% 10.2% 17.1%
Public Admin. & Svcs. 27.0% 4.1% 0.9% 7.8% 0.9% 3.2% 15.0% 6.6% 8.9%
Social & Behav. Sci. 50.0% 4.4% -3.5% 10.7% 2.4% 2.2% 18.2% 9.7% 3.9%
Other Fields -29.5% -4.2% -2.3% -14.4% 3.1% 2.2% 9.6% 13.1% 6.8%
White
Total 10.1% 2.9% 1.1% * Includes Asians and Native Hawaiians/Other Pacific IslandersNotes: See Appendix D for the survey taxonomy.See Appendix A for a description of each race/ethnicity category.Group sizes for each annual change analysis (1, 5, and 10-year) were determined based on only those institutions that submitted data at both current and reference years.N/A=Not available. Ten-year trend data are unavailable for Asian and Native Hawaiians/Other Pacific Islanders.Source: CGS/GRE Survey of Graduate Enrollment and Degrees
Arts & Humanities -1.3% -2.6% -2.8%
Bio. & Agric. Sci. 14.3% 3.7% 1.9%
Business 26.1% 7.8% 4.6%
Education 6.3% 0.6% -1.1%
Engineering 12.4% 4.5% 1.6%
Health Sciences 5.2% 1.6% 3.5%
Math & Comp. Sci. 13.6% 10.2% 7.0%
Physical & Earth Sci. 4.0% 0.2% -0.2%
Public Admin. & Svcs. 7.1% 1.3% 0.7%
Social & Behav. Sci. 8.2% 1.8% -0.5%
Other Fields 10.2% 1.7% -1.3%

C10 Council of Graduate Schools
Table C.11: First-Time Graduate Enrollment by Broad Field and Gender, 2010 to 2020
Men Women
Broad Field % Change, 2019 to 2020
Average Annual % Change,
2015 to 2020
Average Annual % Change,
2010 to 2020
% Change, 2019 to 2020
Average Annual % Change,
2015 to 2020
Average Annual % Change,
2010 to 2020
Total -2.1% -0.3% 0.9% 4.6% 3.3% 2.5%
Arts and Humanities -8.0% -3.2% -2.4% -3.8% -1.2% -1.8%
Biological and Agricultural Sciences 4.5% 0.4% 0.4% 12.2% 7.2% 4.0%
Business 16.2% 5.0% 3.1% 15.7% 7.6% 5.6%
Education 5.0% -0.1% -1.1% 8.5% 2.1% -0.1%
Engineering -16.3% -4.8% -0.6% -14.6% -1.1% 2.3%
Health Sciences 9.0% 1.2% 4.9% 7.7% 4.1% 5.2%
Mathematics and Computer Sciences -15.8% -1.0% 6.0% -18.2% 0.2% 9.0%
Physical and Earth Sciences -12.9% -3.3% -1.6% -0.2% 1.4% 0.9%
Public Administration and Services 9.1% 0.2% 0.9% 5.8% 2.0% 1.8%
Social and Behavioral Sciences 0.9% 0.0% -1.2% 4.4% 3.2% 1.1%
Other Fields -7.0% -0.9% -1.0% -0.6% 2.6% 0.2%
Notes: See Appendix D for the survey taxonomy.Group sizes for each annual change analysis (1, 5, and 10-year) were determined based on only those institutions that submitted data at both current and reference years.Source: CGS/GRE Survey of Graduate Enrollment and Degrees
Table C.12: Doctorate-Level First-Time Graduate Enrollment by Broad Field and Gender, 2010 to 2020
Total Men Women
Broad Field % Change, 2019 to
2020
Average Annual
% Change, 2015 to
2020
Average Annual
% Change, 2010 to
2020
% Change, 2019 to
2020
Average Annual
% Change, 2015 to
2020
Average Annual
% Change, 2010 to
2020
% Change, 2019 to
2020
Average Annual
% Change, 2015 to
2020
Average Annual
% Change, 2010 to
2020
Total -3.8% 1.3% 1.5% -9.7% -1.3% -0.1% 1.2% 3.7% 3.0%
Arts and Humanities -9.0% -2.4% -1.6% -13.4% -4.1% -2.1% -5.0% -0.7% -1.1%
Biological and Agricultural Sciences -1.2% 1.6% 0.7% -4.7% -1.1% -0.9% 1.3% 4.0% 2.1%
Business 6.4% -1.6% -0.6% 8.3% -2.2% -0.9% 4.1% -0.7% -0.3%
Education 11.8% 2.6% 0.9% 6.4% -0.6% 0.0% 14.2% 4.2% 1.3%
Engineering -13.1% -0.8% 0.4% -14.1% -2.2% -0.4% -10.8% 3.3% 2.8%
Health Sciences 8.3% 2.9% 6.7% 4.9% -1.4% 5.0% 9.4% 4.6% 7.2%
Mathematics and Computer Sciences -15.3% 1.7% 1.6% -17.4% 0.2% 0.6% -10.0% 6.1% 4.5%
Physical and Earth Sciences -13.4% -2.2% -0.6% -16.6% -3.3% -1.4% -8.0% -0.2% 0.9%
Public Administration and Services 6.0% -5.2% -2.3% 16.5% -5.0% -2.1% 0.9% -5.3% -2.4%
Social and Behavioral Sciences -5.0% -1.6% -1.4% -7.7% -3.9% -2.9% -3.3% 0.2% -0.2%
Other Fields 8.4% 1.3% 0.6% -0.2% -2.4% -0.9% 15.1% 4.6% 1.9%
Notes: See Appendix D for the survey taxonomy.Group sizes for each annual change analysis (1, 5, and 10-year) were determined based on only those institutions that submitted data at both current and reference years.Source: CGS/GRE Survey of Graduate Enrollment and Degrees

C11Graduate Enrollment and Degrees: 2010 to 2020
Table C.13: Master’s-Level First-Time Graduate Enrollment by Broad Field and Gender, 2010 to 2020
Total Men Women
Broad Field % Change, 2019 to
2020
Average Annual
% Change, 2015 to
2020
Average Annual
% Change, 2010 to
2020
% Change, 2019 to
2020
Average Annual
% Change, 2015 to
2020
Average Annual
% Change, 2010 to
2020
% Change, 2019 to
2020
Average Annual
% Change, 2015 to
2020
Average Annual
% Change, 2010 to
2020
Total 2.8% 1.8% 1.9% -0.7% -0.1% 1.2% 5.2% 3.2% 2.4%
Arts and Humanities -4.5% -2.0% -2.2% -6.2% -2.9% -2.5% -3.5% -1.4% -2.0%
Biological and Agricultural Sciences 15.1% 5.7% 3.6% 10.4% 1.4% 1.4% 18.1% 9.0% 5.3%
Business 16.1% 6.3% 4.3% 16.3% 5.1% 3.2% 16.0% 7.8% 5.9%
Education 7.1% 1.4% -0.5% 4.7% -0.1% -1.3% 7.7% 1.8% -0.3%
Engineering -16.8% -4.8% -0.1% -17.1% -5.6% -0.8% -15.9% -2.4% 2.1%
Health Sciences 7.9% 3.7% 4.9% 10.5% 2.2% 4.8% 7.3% 4.1% 4.9%
Mathematics and Computer Sciences -16.8% -1.0% 8.4% -15.4% -1.2% 7.7% -19.3% -0.5% 9.9%
Physical and Earth Sciences 1.9% -0.3% -0.8% -5.5% -3.2% -2.1% 10.1% 3.5% 0.9%
Public Administration and Services 6.5% 1.9% 1.9% 8.6% 0.6% 1.1% 6.0% 2.3% 2.1%
Social and Behavioral Sciences 5.8% 3.2% 0.7% 3.9% 1.7% -0.6% 6.7% 4.2% 1.4%
Other Fields -4.0% 1.2% -0.3% -7.7% -0.8% -1.1% -1.8% 2.5% 0.1%
Notes: See Appendix D for the survey taxonomy.Group sizes for each annual change analysis (1, 5, and 10-year) were determined based on only those institutions that submitted data at both current and reference years.Source: CGS/GRE Survey of Graduate Enrollment and Degrees

C12 Council of Graduate Schools
Table C.14: Total Graduate Enrollment by Institution Type and Carnegie Classification, 2010 to 2020
Carnegie Classification and Institution Type *
% Change, 2019 to 2020
Average Annual % Change,
2015 to 2020
Average Annual % Change,
2010 to 2020
Total 2.5% 1.2% 0.5%
Public 3.3% 1.7% 1.0%
Private, not-for-profit 1.0% 1.2% 0.7%
Private, for-profit S S S
Doctoral: Very High Research 2.1% 2.3% 1.7%
Public 2.7% 2.1% 1.5%
Private, not-for-profit 0.3% 2.9% 2.3%
Private, for-profit N/A N/A N/A
Doctoral: High Research 2.7% 0.0% -0.2%
Public 2.7% 0.4% 0.1%
Private, not-for-profit 2.7% -0.9% -1.0%
Private, for-profit N/A N/A N/A
Doctoral/Professional Universities 4.7% 1.1% 1.3%
Public 8.0% 3.2% 2.2%
Private, not-for-profit 2.6% 0.8% 0.8%
Private, for-profit S S S
Master’s Colleges and Universities 3.5% 0.7% -0.3%
Public 5.5% 1.3% 0.0%
Private, not-for-profit -1.8% -0.8% -0.9%
Private, for-profit N/A N/A N/A
Other -2.1% -4.6% -5.5%
Public 0.7% 2.3% 1.6%
Private, not-for-profit 4.1% 3.4% -0.2%
Private, for-profit N/A N/A N/A
* See Appendix A for information about the Carnegie Classification system. Notes: Group sizes for each annual change analysis (1, 5, and 10-year) were determined based on only those institutions that submitted data at both current and reference years.N/A = Not available. S = Suppressed due to small number of institutional respondents in this category.Not all respondents provided applications data by level.Source: CGS/GRE Survey of Graduate Enrollment and Degrees

C13Graduate Enrollment and Degrees: 2010 to 2020
Table C.15: Total Graduate Enrollment by Citizenship and Race/Ethnicity, 2010 to 2020
Citizenship and Race/Ethnicity % Change, 2019 to 2020
Average Annual % Change,
2015 to 2020
Average Annual % Change,
2010 to 2020
Total 2.5% 1.2% 0.5%
U.S. Citizens and Permanent Residents 6.1% 2.4% 0.6%
American Indian/Alaska Native 2.3% -0.2% -2.2%
Asian/Pacific Islander * 9.6% 6.2% 3.9%
Asian 9.8% 6.3% 4.3%
Native Hawaiians/Other Pacific Islanders 2.3% 0.3% -2.7%
Black/African American 8.1% 3.0% 1.4%
Hispanic/Latino 11.3% 8.4% 6.6%
White 4.2% 1.0% -0.5%
Temporary Residents -9.7% -2.0% 1.8%
Other/Unknown ** 1.4% -1.5% -2.6%
** Includes U.S. citizens and permanent residents of two or more races, U.S. citizens and permanent residents whose race/ethnicity is not known, and individuals whose citizenship is not known.Notes: Group sizes for each annual change analysis (1, 5, and 10-year) were determined based on only those institutions that submitted data at both current and reference years.See Appendix A for a description of each citizenship and race/ethnicity category.Source: CGS/GRE Survey of Graduate Enrollment and Degrees
Table C.16: Total Graduate Enrollment by Citizenship, Race/Ethnicity, and and Gender, 2010 to 2020
Men Women
Citizenship and Race/Ethnicity % Change, 2019 to 2020
Average Annual % Change,
2015 to 2020
Average Annual % Change,
2010 to 2020
% Change, 2019 to 2020
Average Annual % Change,
2015 to 2020
Average Annual % Change,
2010 to 2020
Total 0.5% -0.1% 0.2% 4.0% 2.2% 0.7%
U.S. Citizens and Permanent Residents 4.9% 1.3% 0.2% 6.9% 3.1% 0.8%
American Indian/Alaska Native -1.2% -1.7% -3.0% 4.2% 0.6% -1.8%
Asian/Pacific Islander * 9.1% 5.6% 3.5% 9.8% 6.6% 4.3%
Asian 9.2% 5.8% 3.8% 10.0% 6.7% 4.7%
Native Hawaiians/Other Pacific Islanders 3.1% -0.7% -3.0% 1.8% 1.0% -2.5%
Black/African American 7.1% 2.6% 1.8% 8.5% 3.2% 1.2%
Hispanic/Latino 10.7% 7.0% 6.2% 11.6% 9.2% 6.9%
White 2.8% -0.2% -0.9% 5.2% 1.8% -0.3%
Temporary Residents -10.4% -2.7% 1.5% -8.7% -1.0% 2.2%
Other/Unknown ** 1.1% -2.6% -3.1% 1.4% -0.8% -2.3%
** Includes U.S. citizens and permanent residents of two or more races, U.S. citizens and permanent residents whose race/ethnicity is not known, and individuals whose citizenship is not known.Notes: Group sizes for each annual change analysis (1, 5, and 10-year) were determined based on only those institutions that submitted data at both current and reference years.See Appendix A for a description of each citizenship and race/ethnicity category.Source: CGS/GRE Survey of Graduate Enrollment and Degrees

C14 Council of Graduate Schools
Table C.17: Total Graduate Enrollment by Broad Field, 2010 to 2020
Broad Field % Change, 2019 to 2020
Average Annual % Change,
2015 to 2020
Average Annual % Change,
2010 to 2020
Total 2.5% 1.2% 0.5%
Arts and Humanities -2.2% -1.9% -2.1%
Biological and Agricultural Sciences 4.8% 2.5% 1.5%
Business 8.1% 4.3% 2.2%
Education 3.1% 0.2% -1.9%
Engineering -3.0% -0.7% 1.1%
Health Sciences 5.0% 3.4% 5.2%
Mathematics and Computer Sciences 1.9% 4.5% 8.6%
Physical and Earth Sciences 0.2% 0.1% 0.3%
Public Administration and Services 4.1% 1.6% 1.8%
Social and Behavioral Sciences 1.7% 0.3% -0.4%
Other Fields 1.9% 2.3% -0.3%
Notes: See Appendix D for the survey taxonomy.Group sizes for each annual change analysis (1, 5, and 10-year) were determined based on only those insti-tutions that submitted data at both current and reference years.Source: CGS/GRE Survey of Graduate Enrollment and Degrees
Table C.18: Total Graduate Enrollment by Broad Field and Attendance Status, 2010 to 2020
Full-Time Part-Time
Broad Field % Change, 2019 to 2020
Average Annual % Change,
2015 to 2020
Average Annual % Change,
2010 to 2020
% Change, 2019 to 2020
Average Annual % Change,
2015 to 2020
Average Annual % Change,
2010 to 2020
Total 0.1% 0.0% 0.1% 6.0% 3.2% 1.1%
Arts and Humanities -3.3% -2.2% -1.9% 0.7% -1.4% -2.6%
Biological and Agricultural Sciences 3.4% 1.8% 1.3% 10.2% 4.9% 2.2%
Business 4.9% 2.4% 1.5% 11.6% 6.6% 3.2%
Education 5.5% -0.9% -2.8% 1.8% 0.8% -1.2%
Engineering -7.7% -2.1% 0.9% 8.7% 3.2% 1.5%
Health Sciences 3.3% 2.1% 4.3% 7.7% 5.3% 6.3%
Mathematics and Computer Sciences -6.1% 0.3% 5.9% 14.3% 13.0% 13.8%
Physical and Earth Sciences -0.9% -0.1% 0.6% 6.5% 1.3% -0.9%
Public Administration and Services 3.2% 0.9% 1.4% 5.7% 3.0% 2.4%
Social and Behavioral Sciences 0.1% -0.3% -0.7% 5.4% 1.7% -0.1%
Other Fields 0.1% 1.2% -0.3% 4.0% 3.7% -0.3%
Notes: See Appendix D for the survey taxonomy.Group sizes for each annual change analysis (1, 5, and 10-year) were determined based on only those institutions that submitted data at both current and reference years.Source: CGS/GRE Survey of Graduate Enrollment and Degrees

C15Graduate Enrollment and Degrees: 2010 to 2020
Table C.19: Total Graduate Enrollment by Broad Field and Citizenship, 2010 to 2020
U.S. Citizens and Permanent Residents Temporary Residents
Broad Field % Change, 2019 to 2020
Average Annual % Change,
2015 to 2020
Average Annual % Change,
2010 to 2020
% Change, 2019 to 2020
Average Annual % Change,
2015 to 2020
Average Annual % Change,
2010 to 2020
Total 6.1% 2.4% 0.6% -9.7% -2.0% 1.8%
Arts and Humanities -0.9% -2.2% -2.3% -6.7% -0.4% 1.1%
Biological and Agricultural Sciences 7.2% 3.3% 2.1% -2.7% -0.3% 0.1%
Business 13.4% 6.2% 3.1% -13.1% -2.9% 0.1%
Education 3.7% 0.4% -1.7% -7.2% -1.8% -0.4%
Engineering 6.5% 3.5% 1.6% -13.5% -4.6% 1.1%
Health Sciences 6.5% 3.6% 5.4% -5.6% -0.9% 1.1%
Mathematics and Computer Sciences 13.4% 10.9% 8.7% -8.9% -0.5% 9.4%
Physical and Earth Sciences 3.2% 0.6% 0.7% -6.2% -0.9% 0.3%
Public Administration and Services 4.9% 2.0% 2.0% -9.4% -4.4% -1.3%
Social and Behavioral Sciences 4.0% 0.4% -0.6% -6.4% 0.9% 1.2%
Other Fields 4.9% 2.8% -0.6% -10.5% -0.4% 3.2%
Notes: See Appendix D for the survey taxonomy.Group sizes for each annual change analysis (1, 5, and 10-year) were determined based on only those institutions that submitted data at both current and reference years.Source: CGS/GRE Survey of Graduate Enrollment and Degrees

C16 Council of Graduate Schools
Table C.20: Total Graduate Enrollment by Broad Field and Race/Ethnicity, 2010 to 2020 (U.S. Citizens and Permanent Residents Only)
Broad Field % Change, ‘19 – ‘20
Avg. Annual % Change, ‘15 – ‘20
Avg. Annual % Change, ‘10 – ‘20
% Change, ‘19 – ‘20
Avg. Annual % Change, ‘15 – ‘20
Avg. Annual % Change, ‘10 – ‘20
% Change, ‘19 – ‘20
Avg. Annual % Change, ‘15 – ‘20
Avg. Annual % Change, ‘10 – ‘20
American Indian/Alaska Native Asian/Pacific Islander * Asian
Total 2.3% -0.2% -2.2% 9.6% 6.2% 3.9% 9.8% 6.3% 4.3%
Arts & Humanities -5.8% -3.7% -4.3% 0.0% 0.6% -0.4% 0.1% 0.9% -0.2%
Bio. & Agric. Sci. 4.0% 2.6% -0.7% 12.0% 6.1% 4.4% 11.7% 6.1% 4.7%
Business 5.2% 3.3% -0.8% 16.9% 10.7% 4.3% 17.0% 10.6% 4.4%
Education 9.4% -0.1% -2.6% 1.9% 1.6% 0.4% 2.0% 1.4% 0.6%
Engineering 6.9% 1.9% -1.1% 7.6% 4.7% 2.2% 7.4% 4.8% 2.5%
Health Sciences 2.4% -0.9% -0.8% 10.6% 6.3% 9.3% 11.0% 6.0% 9.5%
Math & Comp. Sci. 14.0% 5.2% 0.9% 19.2% 24.3% 21.7% 19.4% 24.5% 22.5%
Physical & Earth Sci. -10.6% -4.7% -4.0% 8.4% 3.5% 3.7% 7.4% 3.4% 3.9%
Public Admin. & Svcs. -2.0% -2.8% -1.7% 4.1% 3.2% 1.3% 3.7% 3.4% 1.5%
Social & Behav. Sci. -4.6% -2.4% -3.1% 8.4% 2.0% 0.8% 8.5% 2.1% 1.1%
Other Fields 0.0% 0.0% -3.6% 0.0% 0.0% 0.3% 4.1% 3.9% 1.1%
Native Hawaiians/ Other Pacific Islanders Black/African American Hispanic/Latino
Total 2.3% 0.3% -2.7% 8.1% 3.0% 1.4% 11.3% 8.4% 6.6%
Arts & Humanities -3.7% -6.1% -3.9% 5.4% 2.2% 0.4% 2.4% 2.3% 2.6%
Bio. & Agric. Sci. 29.7% 9.1% -3.7% 14.9% 7.1% 4.8% 15.4% 12.5% 11.8%
Business 11.7% 11.3% -0.6% 16.3% 5.0% 4.7% 18.6% 13.2% 10.3%
Education 0.8% 4.3% -2.1% 11.9% 1.8% -0.4% 6.2% 4.6% 2.6%
Engineering 21.8% -0.4% -6.3% 12.0% 4.0% 2.2% 14.5% 9.9% 8.3%
Health Sciences 5.4% 6.2% 3.0% 11.3% 7.1% 9.9% 17.2% 14.2% 18.1%
Math & Comp. Sci. -8.0% 2.8% -3.6% 17.3% 9.4% 10.7% 20.5% 17.6% 16.3%
Physical & Earth Sci. 80.0% 5.9% -2.4% 5.3% 4.7% 0.3% 12.8% 10.6% 12.3%
Public Admin. & Svcs. 12.8% -0.7% -1.3% 2.6% 2.1% 4.1% 11.9% 6.8% 9.1%
Social & Behav. Sci. 3.7% -0.5% -4.7% 4.0% 1.5% 0.4% 9.3% 5.6% 4.5%
Other Fields 7.3% 2.4% 0.2% 0.0% 0.0% 0.4% 11.7% 13.5% 8.1%
White
Total 4.2% 1.0% -0.5% * Includes Asians and Native Hawaiians/Other Pacific IslandersNotes: See Appendix D for the survey taxonomy.See Appendix A for a description of each race/ethnicity category.Group sizes for each annual change analysis (1, 5, and 10-year) were determined based on only those institutions that submitted data at both current and reference years.N/A=Not available. Ten-year trend data are unavailable for Asian and Native Hawaiians/Other Pacific Islanders.Source: CGS/GRE Survey of Graduate Enrollment and Degrees
Arts & Humanities -2.0% -3.2% -3.0%
Bio. & Agric. Sci. 4.6% 1.6% 0.8%
Business 11.3% 4.8% 1.9%
Education 1.6% -0.7% -2.6%
Engineering 4.4% 2.3% 0.7%
Health Sciences 3.5% 1.6% 3.3%
Math & Comp. Sci. 9.5% 7.1% 5.3%
Physical & Earth Sci. 1.3% -0.7% -0.2%
Public Admin. & Svcs. 3.9% 1.0% 0.4%
Social & Behav. Sci. 2.5% -0.9% -1.5%
Other Fields 4.7% 1.1% -1.8%
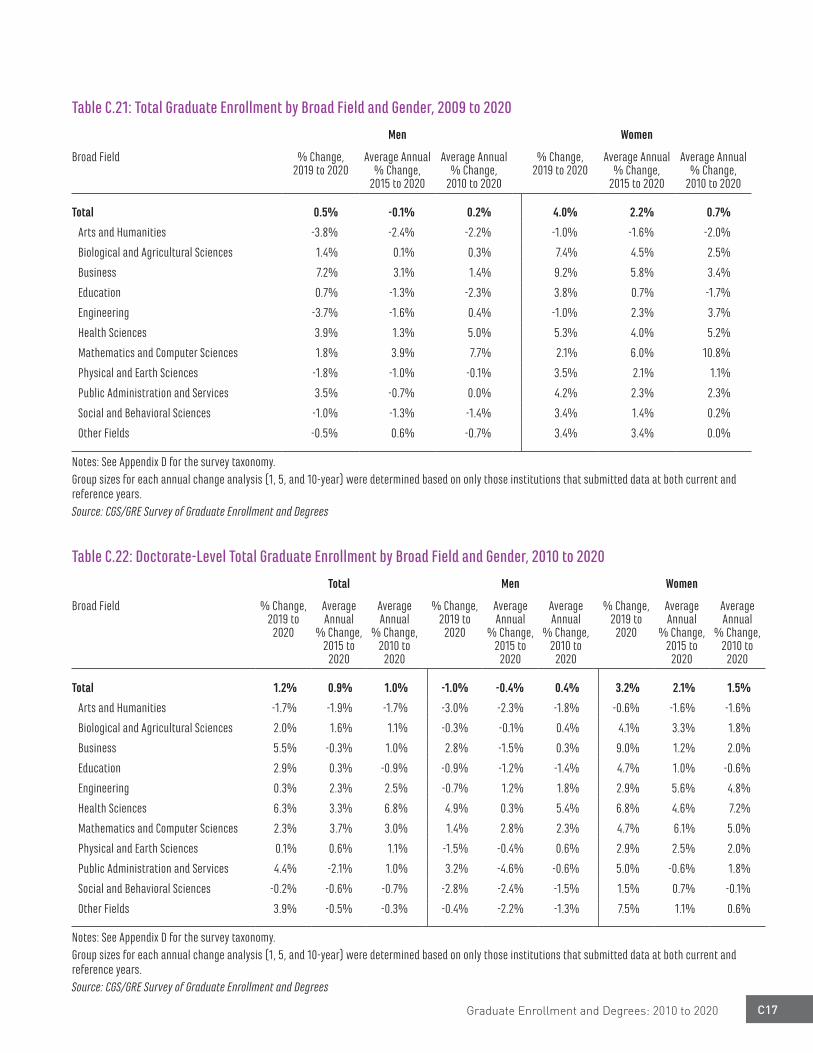
C17Graduate Enrollment and Degrees: 2010 to 2020
Table C.21: Total Graduate Enrollment by Broad Field and Gender, 2009 to 2020
Men Women
Broad Field % Change, 2019 to 2020
Average Annual % Change,
2015 to 2020
Average Annual % Change,
2010 to 2020
% Change, 2019 to 2020
Average Annual % Change,
2015 to 2020
Average Annual % Change,
2010 to 2020
Total 0.5% -0.1% 0.2% 4.0% 2.2% 0.7%
Arts and Humanities -3.8% -2.4% -2.2% -1.0% -1.6% -2.0%
Biological and Agricultural Sciences 1.4% 0.1% 0.3% 7.4% 4.5% 2.5%
Business 7.2% 3.1% 1.4% 9.2% 5.8% 3.4%
Education 0.7% -1.3% -2.3% 3.8% 0.7% -1.7%
Engineering -3.7% -1.6% 0.4% -1.0% 2.3% 3.7%
Health Sciences 3.9% 1.3% 5.0% 5.3% 4.0% 5.2%
Mathematics and Computer Sciences 1.8% 3.9% 7.7% 2.1% 6.0% 10.8%
Physical and Earth Sciences -1.8% -1.0% -0.1% 3.5% 2.1% 1.1%
Public Administration and Services 3.5% -0.7% 0.0% 4.2% 2.3% 2.3%
Social and Behavioral Sciences -1.0% -1.3% -1.4% 3.4% 1.4% 0.2%
Other Fields -0.5% 0.6% -0.7% 3.4% 3.4% 0.0%
Notes: See Appendix D for the survey taxonomy.Group sizes for each annual change analysis (1, 5, and 10-year) were determined based on only those institutions that submitted data at both current and reference years.Source: CGS/GRE Survey of Graduate Enrollment and Degrees
Table C.22: Doctorate-Level Total Graduate Enrollment by Broad Field and Gender, 2010 to 2020
Total Men Women
Broad Field % Change, 2019 to
2020
Average Annual
% Change, 2015 to
2020
Average Annual
% Change, 2010 to
2020
% Change, 2019 to
2020
Average Annual
% Change, 2015 to
2020
Average Annual
% Change, 2010 to
2020
% Change, 2019 to
2020
Average Annual
% Change, 2015 to
2020
Average Annual
% Change, 2010 to
2020
Total 1.2% 0.9% 1.0% -1.0% -0.4% 0.4% 3.2% 2.1% 1.5%
Arts and Humanities -1.7% -1.9% -1.7% -3.0% -2.3% -1.8% -0.6% -1.6% -1.6%
Biological and Agricultural Sciences 2.0% 1.6% 1.1% -0.3% -0.1% 0.4% 4.1% 3.3% 1.8%
Business 5.5% -0.3% 1.0% 2.8% -1.5% 0.3% 9.0% 1.2% 2.0%
Education 2.9% 0.3% -0.9% -0.9% -1.2% -1.4% 4.7% 1.0% -0.6%
Engineering 0.3% 2.3% 2.5% -0.7% 1.2% 1.8% 2.9% 5.6% 4.8%
Health Sciences 6.3% 3.3% 6.8% 4.9% 0.3% 5.4% 6.8% 4.6% 7.2%
Mathematics and Computer Sciences 2.3% 3.7% 3.0% 1.4% 2.8% 2.3% 4.7% 6.1% 5.0%
Physical and Earth Sciences 0.1% 0.6% 1.1% -1.5% -0.4% 0.6% 2.9% 2.5% 2.0%
Public Administration and Services 4.4% -2.1% 1.0% 3.2% -4.6% -0.6% 5.0% -0.6% 1.8%
Social and Behavioral Sciences -0.2% -0.6% -0.7% -2.8% -2.4% -1.5% 1.5% 0.7% -0.1%
Other Fields 3.9% -0.5% -0.3% -0.4% -2.2% -1.3% 7.5% 1.1% 0.6%
Notes: See Appendix D for the survey taxonomy.Group sizes for each annual change analysis (1, 5, and 10-year) were determined based on only those institutions that submitted data at both current and reference years.Source: CGS/GRE Survey of Graduate Enrollment and Degrees

C18 Council of Graduate Schools
Table C.23: Master’s-Level Total Graduate Enrollment by Broad Field and Gender, 2010 to 2020 *
Total Men Women
Broad Field % Change, 2019 to
2020
Average Annual
% Change, 2015 to
2020
Average Annual
% Change, 2010 to
2020
% Change, 2019 to
2020
Average Annual
% Change, 2015 to
2020
Average Annual
% Change, 2010 to
2020
% Change, 2019 to
2020
Average Annual
% Change, 2015 to
2020
Average Annual
% Change, 2010 to
2020
Total 3.1% 1.3% 0.4% 1.2% 0.0% 0.1% 4.3% 2.2% 0.5%
Arts and Humanities -2.6% -2.0% -2.4% -4.6% -2.5% -2.6% -1.2% -1.6% -2.3%
Biological and Agricultural Sciences 8.7% 3.6% 2.0% 4.2% 0.4% 0.3% 11.6% 6.1% 3.5%
Business 8.2% 4.6% 2.3% 7.4% 3.4% 1.5% 9.2% 6.1% 3.6%
Education 3.1% 0.2% -2.1% 1.4% -1.3% -2.6% 3.6% 0.6% -1.9%
Engineering -5.5% -2.7% 0.1% -6.1% -3.5% -0.6% -4.1% 0.1% 2.8%
Health Sciences 4.5% 3.5% 4.7% 3.4% 2.0% 4.7% 4.8% 3.9% 4.7%
Mathematics and Computer Sciences 1.8% 4.8% 11.7% 1.9% 4.2% 11.0% 1.5% 5.9% 13.3%
Physical and Earth Sciences 0.6% -1.4% -1.7% -3.0% -3.2% -2.4% 4.9% 1.0% -0.9%
Public Administration and Services 4.0% 2.1% 1.9% 3.5% 0.0% 0.1% 4.2% 2.7% 2.5%
Social and Behavioral Sciences 3.1% 1.1% -0.4% 0.4% -0.3% -1.3% 4.7% 1.9% 0.2%
Other Fields 1.6% 2.9% -0.3% -0.6% 1.3% -0.6% 2.8% 3.8% -0.1%
* Includes first-time enrollment in graduate-level certificate and education specialist programs.Notes: See Appendix D for the survey taxonomy.Group sizes for each annual change analysis (1, 5, and 10-year) were determined based on only those institutions that submitted data at both current and reference years.Source: CGS/GRE Survey of Graduate Enrollment and Degrees

C19Graduate Enrollment and Degrees: 2010 to 2020
Table C.24: Graduate Degrees and Certificates Awarded by Degree Level and Institution Type, 2009-10 to 2019-20
Degree Level and Institution Type % Change, ‘18-19 to ‘19-20
Average Annual % Change,
‘14-15 to ‘19-20
Average Annual % Change,
‘09-10 to ‘19-20
Doctoral Degrees -0.7% 1.1% 2.9%
Public -2.0% 0.5% 2.7%
Private, not-for-profit 2.4% 1.9% 2.8%
Private, for-profit S S S
Master’s Degrees 0.2% 1.8% 1.4%
Public 1.1% 2.3% 2.1%
Private, not-for-profit -1.1% 2.1% 2.1%
Private, for-profit S S S
Graduate-Level Certificates 20.7% 10.0% 9.5%
Public 27.5% 13.6% 16.5%
Private, not-for-profit 5.3% 3.7% 1.1%
Private, for-profit S S S
Notes: Group sizes for each annual change analysis (1, 5, and 10-year) were determined based on only those institutions that submitted data at both current and reference years.S = Suppressed due to small number of institutional respondents in this category.Source: CGS/GRE Survey of Graduate Enrollment and Degrees

C20 Council of Graduate Schools
Table C.25: Graduate Degrees and Certificates Awarded by Degree Level and Carnegie Classification, 2009-10 to 2019-20
Degree Level and Carnegie Classification * % Change, ‘18-19 to ‘19-20
Average Annual % Change,
‘14-15 to ‘19-20
Average Annual % Change,
‘09-10 to ‘19-20
Doctoral Degrees -0.7% 1.1% 2.9%
Doctoral: Very High Research -2.2% 0.3% 1.6%
Doctoral: High Research -2.3% 1.3% 5.0%
Doctoral/Professional Universities 4.6% 6.3% 11.7%
Master’s Colleges and Universities 27.3% 13.9% 23.4%
Other -3.3% -5.7% 0.5%
Master’s Degrees 0.2% 1.8% 1.4%
Doctoral: Very High Research 0.9% 3.4% 3.4%
Doctoral: High Research -0.5% 0.8% 1.1%
Doctoral/Professional Universities -0.9% 2.0% 1.6%
Master’s Colleges and Universities 0.5% 0.6% 0.3%
Other -5.9% -7.6% -6.5%
Graduate-Level Certificates 20.7% 10.0% 9.5%
Doctoral: Very High Research 28.2% 22.9% 19.9%
Doctoral: High Research 16.6% 7.3% 2.9%
Doctoral/Professional Universities 3.7% -2.1% 15.8%
Master’s Colleges and Universities 15.4% 1.7% 2.8%
Other 17.6% 3.3% -1.2%
* See Appendix A for information about the Carnegie Classification system. Note: Group sizes for each annual change analysis (1, 5, and 10-year) were determined based on only those institutions that submitted data at both current and reference years.Source: CGS/GRE Survey of Graduate Enrollment and Degrees

C21Graduate Enrollment and Degrees: 2010 to 2020
Table C.26: Graduate Degrees and Certificates Awarded by Degree Level, Institution Type, and Gender, 2009-10 to 2019-20
Men Women
Degree Level and Institution Type % Change, ‘18-19 to ‘19-20
Average Annual % Change,
‘14-15 to ‘19-20
Average Annual % Change,
‘09-10 to ‘19-20
% Change, ‘18-19 to ‘19-20
Average Annual % Change,
‘14-15 to ‘19-20
Average Annual % Change,
‘09-10 to ‘19-20
Doctoral Degrees -1.7% 2.2% 2.6% 0.2% 1.7% 3.2%
Public -3.0% -0.3% 2.4% -1.0% 1.3% 3.0%
Private, not-for-profit 1.3% 1.4% 2.7% 3.4% 1.8% 3.0%
Private, for-profit S S S S S S
Master’s Degrees -1.9% 0.8% 1.4% 1.7% 2.4% 1.4%
Public -1.0% 1.1% 2.2% 2.7% 3.0% 2.1%
Private, not-for-profit -3.2% 1.2% 1.6% 0.4% 2.8% 2.5%
Private, for-profit S S S S S S
Graduate-Level Certificates 18.7% 14.6% 12.7% 22.9% 9.4% 7.9%
Public 28.8% 20.5% 20.0% 28.0% 10.7% 14.4%
Private, not-for-profit -6.2% 3.5% 2.4% 11.9% 7.8% 0.6%
Private, for-profit S S S S S S
Notes: Group sizes for each annual change analysis (1, 5, and 10-year) were determined based on only those institutions that submitted data at both current and reference years.S = Suppressed due to small number of institutional respondents in this category.Source: CGS/GRE Survey of Graduate Enrollment and Degrees
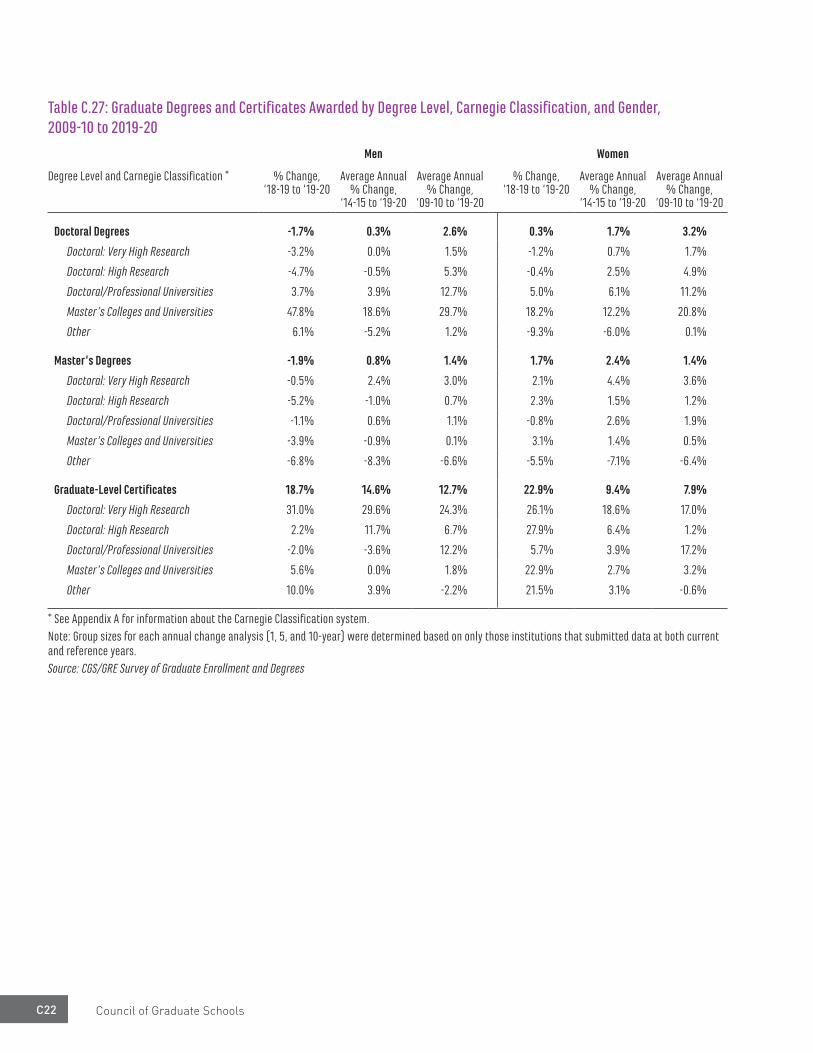
C22 Council of Graduate Schools
Table C.27: Graduate Degrees and Certificates Awarded by Degree Level, Carnegie Classification, and Gender, 2009-10 to 2019-20
Men Women
Degree Level and Carnegie Classification * % Change, ‘18-19 to ‘19-20
Average Annual % Change,
‘14-15 to ‘19-20
Average Annual % Change,
‘09-10 to ‘19-20
% Change, ‘18-19 to ‘19-20
Average Annual % Change,
‘14-15 to ‘19-20
Average Annual % Change,
‘09-10 to ‘19-20
Doctoral Degrees -1.7% 0.3% 2.6% 0.3% 1.7% 3.2%
Doctoral: Very High Research -3.2% 0.0% 1.5% -1.2% 0.7% 1.7%
Doctoral: High Research -4.7% -0.5% 5.3% -0.4% 2.5% 4.9%
Doctoral/Professional Universities 3.7% 3.9% 12.7% 5.0% 6.1% 11.2%
Master’s Colleges and Universities 47.8% 18.6% 29.7% 18.2% 12.2% 20.8%
Other 6.1% -5.2% 1.2% -9.3% -6.0% 0.1%
Master’s Degrees -1.9% 0.8% 1.4% 1.7% 2.4% 1.4%
Doctoral: Very High Research -0.5% 2.4% 3.0% 2.1% 4.4% 3.6%
Doctoral: High Research -5.2% -1.0% 0.7% 2.3% 1.5% 1.2%
Doctoral/Professional Universities -1.1% 0.6% 1.1% -0.8% 2.6% 1.9%
Master’s Colleges and Universities -3.9% -0.9% 0.1% 3.1% 1.4% 0.5%
Other -6.8% -8.3% -6.6% -5.5% -7.1% -6.4%
Graduate-Level Certificates 18.7% 14.6% 12.7% 22.9% 9.4% 7.9%
Doctoral: Very High Research 31.0% 29.6% 24.3% 26.1% 18.6% 17.0%
Doctoral: High Research 2.2% 11.7% 6.7% 27.9% 6.4% 1.2%
Doctoral/Professional Universities -2.0% -3.6% 12.2% 5.7% 3.9% 17.2%
Master’s Colleges and Universities 5.6% 0.0% 1.8% 22.9% 2.7% 3.2%
Other 10.0% 3.9% -2.2% 21.5% 3.1% -0.6%
* See Appendix A for information about the Carnegie Classification system. Note: Group sizes for each annual change analysis (1, 5, and 10-year) were determined based on only those institutions that submitted data at both current and reference years.Source: CGS/GRE Survey of Graduate Enrollment and Degrees
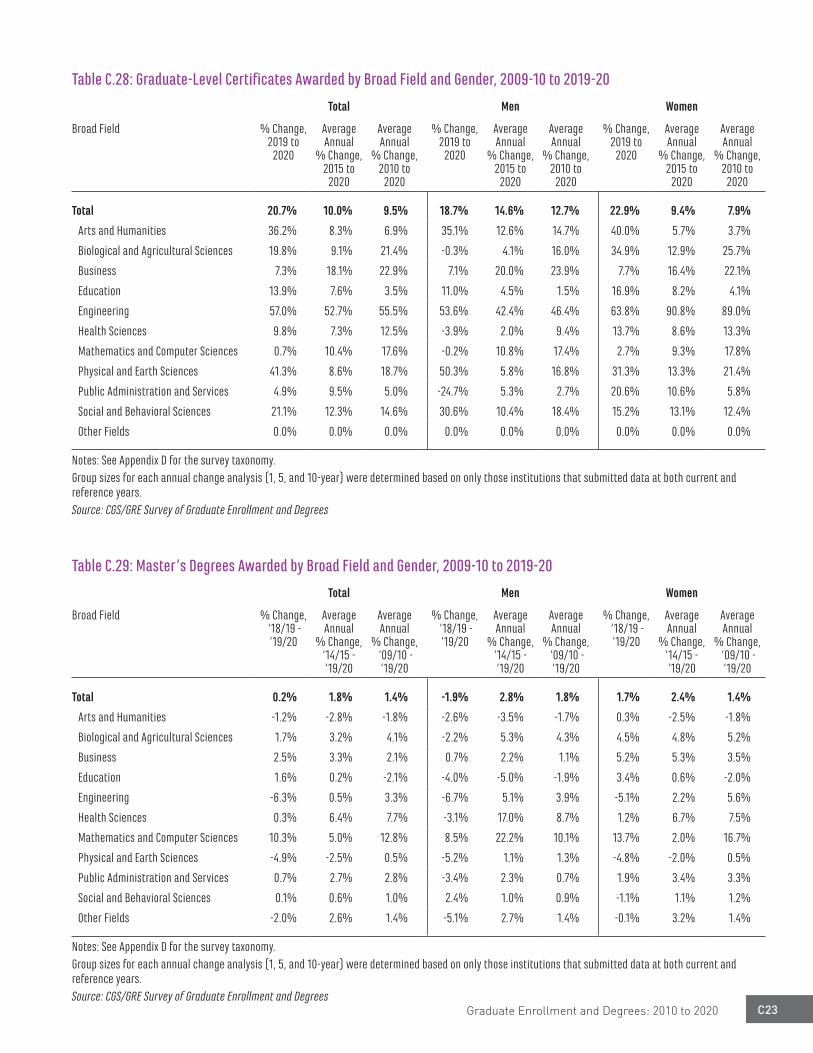
C23Graduate Enrollment and Degrees: 2010 to 2020
Table C.28: Graduate-Level Certificates Awarded by Broad Field and Gender, 2009-10 to 2019-20
Total Men Women
Broad Field % Change, 2019 to
2020
Average Annual
% Change, 2015 to
2020
Average Annual
% Change, 2010 to
2020
% Change, 2019 to
2020
Average Annual
% Change, 2015 to
2020
Average Annual
% Change, 2010 to
2020
% Change, 2019 to
2020
Average Annual
% Change, 2015 to
2020
Average Annual
% Change, 2010 to
2020
Total 20.7% 10.0% 9.5% 18.7% 14.6% 12.7% 22.9% 9.4% 7.9%
Arts and Humanities 36.2% 8.3% 6.9% 35.1% 12.6% 14.7% 40.0% 5.7% 3.7%
Biological and Agricultural Sciences 19.8% 9.1% 21.4% -0.3% 4.1% 16.0% 34.9% 12.9% 25.7%
Business 7.3% 18.1% 22.9% 7.1% 20.0% 23.9% 7.7% 16.4% 22.1%
Education 13.9% 7.6% 3.5% 11.0% 4.5% 1.5% 16.9% 8.2% 4.1%
Engineering 57.0% 52.7% 55.5% 53.6% 42.4% 46.4% 63.8% 90.8% 89.0%
Health Sciences 9.8% 7.3% 12.5% -3.9% 2.0% 9.4% 13.7% 8.6% 13.3%
Mathematics and Computer Sciences 0.7% 10.4% 17.6% -0.2% 10.8% 17.4% 2.7% 9.3% 17.8%
Physical and Earth Sciences 41.3% 8.6% 18.7% 50.3% 5.8% 16.8% 31.3% 13.3% 21.4%
Public Administration and Services 4.9% 9.5% 5.0% -24.7% 5.3% 2.7% 20.6% 10.6% 5.8%
Social and Behavioral Sciences 21.1% 12.3% 14.6% 30.6% 10.4% 18.4% 15.2% 13.1% 12.4%
Other Fields 0.0% 0.0% 0.0% 0.0% 0.0% 0.0% 0.0% 0.0% 0.0%
Notes: See Appendix D for the survey taxonomy. Group sizes for each annual change analysis (1, 5, and 10-year) were determined based on only those institutions that submitted data at both current and reference years.Source: CGS/GRE Survey of Graduate Enrollment and Degrees
Table C.29: Master’s Degrees Awarded by Broad Field and Gender, 2009-10 to 2019-20
Total Men Women
Broad Field % Change, ‘18/19 -‘19/20
AverageAnnual
% Change, ‘14/15 - ‘19/20
AverageAnnual
% Change, ‘09/10 - ‘19/20
% Change, ‘18/19 -‘19/20
AverageAnnual
% Change, ‘14/15 - ‘19/20
AverageAnnual
% Change, ‘09/10 - ‘19/20
% Change, ‘18/19 -‘19/20
AverageAnnual
% Change, ‘14/15 - ‘19/20
AverageAnnual
% Change, ‘09/10 - ‘19/20
Total 0.2% 1.8% 1.4% -1.9% 2.8% 1.8% 1.7% 2.4% 1.4%
Arts and Humanities -1.2% -2.8% -1.8% -2.6% -3.5% -1.7% 0.3% -2.5% -1.8%
Biological and Agricultural Sciences 1.7% 3.2% 4.1% -2.2% 5.3% 4.3% 4.5% 4.8% 5.2%
Business 2.5% 3.3% 2.1% 0.7% 2.2% 1.1% 5.2% 5.3% 3.5%
Education 1.6% 0.2% -2.1% -4.0% -5.0% -1.9% 3.4% 0.6% -2.0%
Engineering -6.3% 0.5% 3.3% -6.7% 5.1% 3.9% -5.1% 2.2% 5.6%
Health Sciences 0.3% 6.4% 7.7% -3.1% 17.0% 8.7% 1.2% 6.7% 7.5%
Mathematics and Computer Sciences 10.3% 5.0% 12.8% 8.5% 22.2% 10.1% 13.7% 2.0% 16.7%
Physical and Earth Sciences -4.9% -2.5% 0.5% -5.2% 1.1% 1.3% -4.8% -2.0% 0.5%
Public Administration and Services 0.7% 2.7% 2.8% -3.4% 2.3% 0.7% 1.9% 3.4% 3.3%
Social and Behavioral Sciences 0.1% 0.6% 1.0% 2.4% 1.0% 0.9% -1.1% 1.1% 1.2%
Other Fields -2.0% 2.6% 1.4% -5.1% 2.7% 1.4% -0.1% 3.2% 1.4%
Notes: See Appendix D for the survey taxonomy. Group sizes for each annual change analysis (1, 5, and 10-year) were determined based on only those institutions that submitted data at both current and reference years.Source: CGS/GRE Survey of Graduate Enrollment and Degrees

C24 Council of Graduate Schools
Table C.30: Doctoral Degrees Awarded by Broad Field and Gender, 2009-10 to 2019-20
Total Men Women
Broad Field % Change, ‘18/19 -‘19/20
AverageAnnual
% Change, ‘14/15 - ‘19/20
AverageAnnual
% Change, ‘09/10 - ‘19/20
% Change, ‘18/19 -‘19/20
AverageAnnual
% Change, ‘14/15 - ‘19/20
AverageAnnual
% Change, ‘09/10 - ‘19/20
% Change, ‘18/19 -‘19/20
AverageAnnual
% Change, ‘14/15 - ‘19/20
AverageAnnual
% Change, ‘09/10 - ‘19/20
Total -0.7% 1.1% 2.9% -1.7% 0.3% 2.6% 0.3% 1.7% 3.2%
Arts and Humanities -3.2% -1.9% 0.3% -2.2% -1.4% 0.8% -4.0% -2.3% -0.1%
Biological and Agricultural Sciences -0.7% -0.1% 0.1% -4.6% -0.8% 0.7% 3.1% 0.4% -0.4%
Business -11.6% 4.6% 5.5% -6.9% 5.0% 4.7% -17.5% 4.6% 6.6%
Education 1.9% -0.1% 1.0% 3.3% 0.4% 0.6% 1.1% -0.3% 1.3%
Engineering -0.8% 1.6% 4.4% -0.8% 1.3% 4.1% -0.7% 2.6% 5.6%
Health Sciences 4.3% 3.9% 8.7% 4.7% 2.0% 9.8% 4.2% 4.8% 8.4%
Mathematics and Computer Sciences 2.9% 0.6% 2.9% 4.4% 1.6% 2.9% -1.2% -1.9% 3.0%
Physical and Earth Sciences -4.8% -0.3% 1.3% -4.5% -0.2% 1.0% -5.5% -0.6% 1.9%
Public Administration and Services -7.3% 3.8% 3.9% 14.3% 3.7% 2.3% -15.0% 3.6% 4.9%
Social and Behavioral Sciences -2.3% -0.9% 0.9% -4.0% -1.5% 0.1% -0.9% -0.5% 1.5%
Other Fields -2.2% -3.9% 2.2% -8.4% -5.2% 1.9% 3.5% -2.8% 2.4%
Notes: See Appendix D for the survey taxonomy. Group sizes for each annual change analysis (1, 5, and 10-year) were determined based on only those institutions that submitted data at both current and reference years.Source: CGS/GRE Survey of Graduate Enrollment and Degrees

D1Graduate Enrollment and Degrees: 2010 to 2020
ARTS AND HUMANITIES
Arts – History, Theory, and Criticism, Art History, Criticism, and ConservationEthnomusicologyMusic History, Literature, and
TheoryMusicologyTheatre Literature, History and
CiticismArts – History, Theory, and
Criticism, Other
Arts – Performance and Studio Arts, Entertainment, and Media
Management Crafts/Craft DesignDance Design and Applied ArtsDrama/Theatre Arts Film/Video and Photographic
ArtsFine and Studio Arts Music Arts – Performance and Studio,
Other
English Language and LiteratureAmerican Literature English Language and LiteratureEnglish Literature Rhetoric and Composition/
Writing Studies English Language and
Literatures, Other
Foreign Languages and Literatures African Languages and
LiteraturesAmerican Sign LanguageAsiatic Languages and
LiteraturesCeltic Languages and
LiteraturesClassics and Classical Languages
and LiteraturesGermanic Languages and
LiteraturesIranian/Persian Languages and
LiteraturesModern Greek Language and
LiteratureRomance Languages and
LiteraturesSlavic, Baltic, and Albanian Languages and LiteraturesForeign Languages and
Literatures, Other
History American History European History History and Philosophy of
Science and TechnologyHistory, GeneralHistory, Other
Philosophy EthicsLogicPhilosophyPhilosophy, Other
Arts and Humanities, OtherLinguistic, Comparative, and
Related Language Studies and Services
Humanities/Humanistic StudiesLiberal Arts and Sciences/
Liberal ArtsArts and Humanities, Other
BIOLOGICAL AND AGRICULTURAL SCIENCESAgriculture, Natural Resources,
and Conservation Agricultural and Domestic
Animal ServicesAgricultural and Food Products
ProcessingAgricultural Business and
ManagementAgricultural Economics Agricultural MechanizationAgricultural ProductionAgricultural Public ServicesAgriculture, GeneralAgronomyAnimal SciencesApplied HorticultureFishing and Fisheries Sciences
and ManagementFood Science and TechnologyForestryHorticultural Business ServicesInternational AgricultureNatural Resources and
ConservationNatural Resources Management
and PolicyParks, Recreation, and Leisure
Facilities ManagementParks, Recreation, and Leisure
StudiesPlant Sciences
APPENDIX DTaxonomy of Fields of Study

D2 Council of Graduate Schools
Soil SciencesWildlife and Wildlands Science
and ManagementAgriculture, Natural Resources, and Conservation, Other
Biological and Biomedical SciencesAnatomical SciencesAnimal BiologyBacteriologyBiochemistryBioinformaticsBiology, GeneralBiomathematicsBiometryBiophysicsBiotechnologyBotany/Plant BiologyCell/Cellular BiologyComputational BiologyDevelopmental BiologyEcologyEntomologyEpidemiologyEvolutionGeneticsImmunologyMicrobiological SciencesMolecular BiologyMolecular MedicineNeurosciencesParasitology PathologyPharmacologyPhysiologyPopulation BiologySystematicsToxicologyZoologyBiological and Biomedical
Sciences, Other
BUSINESS
AccountingAccounting Auditing Taxation
Banking and FinanceBanking and Financial Support
ServicesCredit ManagementFinancial Planning and ServicesInternational FinanceInvestments and Securities Public Finance
Business Administration and ManagementBusiness Administration and
ManagementBusiness OperationsBusiness/Commerce, GeneralConstruction ManagementE-Commerce Entrepreneurship Hospitality Administration/
Management Human Resources Development Human Resources ManagementLabor and Industrial Relations Logistics and Supply Chain
Management Operations Management Organizational Leadership Organizational ManagementProject ManagementSmall Business OperationsSport and Fitness
Administration/ManagementTelecommunications
ManagementBusiness Administration and
Management, Other
Business, OtherBusiness StatisticsBusiness/Corporate
CommunicationsBusiness/Managerial EconomicsInsurance
International Business Management Information
Systems Management Science MarketingMarketing ManagementMerchandisingReal Estate SalesBusiness Fields, Other
EDUCATION
Education AdministrationEducational Administration Educational Leadership Educational Supervision
Curriculum and InstructionCurriculum and Instruction
Early Childhood EducationEarly Childhood Education and
TeachingKindergarten/Preschool
Education and Teaching
Elementary EducationElementary Education and
TeachingElementary-Level Teaching
Fields
Educational Assessment, Evaluation, and ResearchEducational Assessment,
Testing, and Measurement Educational Evaluation and
ResearchEducational Psychology Educational Statistics and
Research MethodsLearning SciencesSchool Psychology
Higher EducationHigher Education Higher Education
Administration

D3Graduate Enrollment and Degrees: 2010 to 2020
Secondary EducationSecondary Education and
TeachingSecondary-Level Teaching Fields
Special EducationEducation/Teaching of Students
w/ Specific DisabilitiesEducation/Teaching of Students
w/ Specific Learning Disabilities
Education/Teaching of the Gifted and Talented
Special Education and TeachingOther Special Education Fields
Student Counseling and Personnel ServicesCollege Student Counseling and
Personnel Services Counselor EducationSchool Counseling and Guidance
ServicesStudent Counseling and
Personnel Services, Other
Education, OtherAdult and Continuing Education Bilingual, Multilingual, and
Multicultural EducationEducation, GeneralEducational/Instructional Media
DesignHealth and Physical EducationInternational and Comparative
EducationJunior High/Middle School
Education and Teaching Outdoor EducationSocial and Philosophical
Foundations of EducationTeaching English as a Second or
Foreign Language Other Education Fields
ENGINEERING
Chemical EngineeringChemical and Biomolecular
EngineeringChemical Engineering
Civil EngineeringArchitectural Engineering Civil Engineering Construction EngineeringEnvironmental/Environmental
Health EngineeringGeotechnical and
Geoenvironmental EngineeringStructural EngineeringSurveying Engineering Transportation and Highway
EngineeringWater Resources Engineering
Computer, Electrical, and Electronics EngineeringComputer Engineering Computer Hardware
EngineeringComputer Software EngineeringElectrical Engineering Electronics EngineeringLaser and Optical Engineering Telecommunications
Engineering
Industrial EngineeringIndustrial Engineering Manufacturing EngineeringOperations Research
Materials EngineeringCeramic Sciences and
Engineering Materials EngineeringMaterials Science Metallurgical Engineering Polymer/Plastics Engineering
Mechanical EngineeringEngineering Mechanics Mechanical Engineering
Engineering, OtherAeronautical Engineering Aerospace Engineering Agricultural Engineering Biochemical EngineeringBiomedical/Medical Engineering Electromechanical EngineeringEngineering ChemistryEngineering Physics Engineering Science Forest EngineeringGeological/Geophysical
Engineering Mining and Mineral Engineering Naval Architecture and Marine
Engineering Nuclear EngineeringOcean EngineeringPaper Science and EngineeringPetroleum Engineering Systems Engineering Textile Sciences and Engineering Engineering, Other
HEALTH AND MEDICAL SCIENCES
Allied HealthAlternative and Complementary
MedicineAudiology Bioethics/Medical EthicsChiropractic (excluding D.C. and
D.C.M.)Clinical/Medical Laboratory
Science/ResearchCommunication Disorders
Sciences and ServicesDentistry and Oral Sciences
(excluding D.D.S. and D.M.D.) Dietetics and Clinical Nutrition
ServicesEnvironmental Health Exercise ScienceHealth and Medical
Administrative ServicesHealth SciencesHealth/Medical Preparatory
ProgramsKinesiologyMedical Sciences (excluding
M.D.)

D4 Council of Graduate Schools
Mental and Social Health Services
Nursing Nutrition SciencesOccupational TherapyOptometry (excluding O.D.)Osteopathic Medicine (excluding
D.O.)Pharmaceutical Sciences
(excluding Pharm.D.)Physical TherapyPhysician AssistantPodiatry (excluding D.P.M., D.P.
and Pod.D.)Public Health Rehabilitation and TherapySpeech-Language Pathology Veterinary Biomedical and
Clinical Science Veterinary Medicine (excluding
D.V.M.)Health and Medical Sciences,
Other
MATHEMATICS AND COMPUTER SCIENCES Mathematical SciencesActuarial Science Applied Mathematics Mathematics ProbabilityStatistics Mathematical Sciences, Other
Computer and Information SciencesComputer and Information
Sciences, GeneralComputer Programming Computer ScienceComputer Software and Media
ApplicationsComputer Systems AnalysisComputer Systems Networking
and TelecommunicationsComputer/Information
Technology Administration and Management
Data Processing
Information Sciences/StudiesMicrocomputer Applications Computer and Information
Sciences, Other
PHYSICAL AND EARTH SCIENCES ChemistryAnalytical Chemistry Chemical PlasticsChemistry, General Environmental ChemistryForensic ChemistryInorganic ChemistryMedicinal and Pharmaceutical
ChemistryOrganic Chemistry Physical Chemistry Polymer Chemistry Theoretical ChemistryChemistry, Other
Earth, Atmospheric, and Marine SciencesAquatic Biology/LimnologyAtmospheric SciencesBiological OceanographyEarth SciencesGeochemistry Geological SciencesGeophysics and SeismologyGeosciencesHydrologyMarine BiologyMarine SciencesMeteorology Oceanography Paleontology Earth, Atmospheric, and Marine
ciences, Other
Physics and AstronomyAcousticsAstronomy Astrophysics Atomic/Molecular Physics Condensed Matter and Materials
PhysicsElementary Particle Physics Nuclear Physics
Optics/Optical Sciences Physics Planetary Astronomy and
Science Plasma and High-Temperature
PhysicsSolid State PhysicsTheoretical and Mathematical
Physics Physics and Astronomy, Other
Natural Sciences, OtherNatural Sciences, GeneralPhysical Sciences, GeneralScience TechnologiesNatural Sciences, Other
PUBLIC ADMINISTRATION AND SERVICESPublic AdministrationCommunity Organization and
AdvocacyPublic Administration
Social WorkSocial WorkYouth Services/AdministrationSocial Work, Other
SOCIAL AND BEHAVIORAL SCIENCES Anthropology and ArchaeologyAnthropology Archaeology
EconomicsApplied EconomicsEconometrics Economics International Economics

D5Graduate Enrollment and Degrees: 2010 to 2020
Political Science International Relations Political Science and
Government Public Policy Analysis
PsychologyApplied PsychologyClinical Psychology Cognitive Psychology Community Psychology Comparative Psychology Counseling Psychology Developmental and Child
Psychology Experimental PsychologyForensic PsychologyIndustrial and Organizational
sychologyPersonality Psychology Physiological Psychology Psycholinguistics Psychology, GeneralPsychometricsPsychopharmacology Quantitative PsychologyResearch and Experimental
Psychology Social Psychology Psychology, Other
SociologyDemography Rural SociologySociology
Social Sciences, OtherAdult Development and AgingArea, Ethnic, Cultural, Gender,
and Group Studies Criminal Justice/Criminology Geography and CartographyGerontology Social Sciences, GeneralUrban Studies/AffairsSocial Sciences, Other
OTHER FIELDS
Architecture and Environmental DesignArchitectural History and
CriticismArchitectural Sciences and
TechnologyArchitecture City/Urban, Community and
Regional Planning Environmental Design Interior ArchitectureLandscape Architecture Real Estate DevelopmentArchitecture and Environmental
Design, Other
Communications and JournalismAdvertising Communication and Media
StudiesCommunications TechnologiesJournalismMass CommunicationPublic Relations PublishingRadio, Television, and Digital
CommunicationSpeech Communication Communications and
Journalism, Other
Family and Consumer SciencesApparel and TextilesFamily and Consumer
EconomicsFamily and Consumer SciencesFamily StudiesFoods, Nutrition, and Wellness
StudiesHousing and Human
EnvironmentsHuman DevelopmentHuman SciencesWork and Family StudiesFamily and Consumer Sciences,
Other
Library and Archival SciencesArchives/Archival
AdministrationLibrary and Information ScienceLibrary and Archival Sciences,
Other
Religion and TheologyPhilosophy and Religious
Studies, GeneralReligion/Religious StudiesTheology and Religious
Vocations (excluding M.Div., M.H.L., B.D., and Ordination)
Religion and Theology, Other
Other FieldsFire ProtectionHomeland SecurityInterdisciplinary StudiesLegal Research and Professional
Studies (excluding L.L.B. and J.D.)
Military TechnologiesMultidisciplinary StudiesOther Fields Not Previously
Classified

D6 Council of Graduate Schools

E1Graduate Enrollment and Degrees: 2010 to 2020
APPENDIX EList of Institutions Participating in the Fall 2020 Survey
Abilene Christian University
Air Force Institute of Technology
Alabama State University
Albert Einstein College of Medicine
Albertus Magnus College
Alcorn State University
Alfred University
American Public University
Anderson University
Andrews University
Angelo State University
Antioch University-New England
Appalachian State University
Aquinas College
Arizona State University – Tempe
Arkansas State University
Arkansas Tech University
Auburn University
Auburn University at Montgomery
Augusta University
Aurora University
Austin Peay State University
Azusa Pacific University
Baker University
Ball State University
Barry University
Baylor College of Dentistry – Texas A&M University Health Science Center
Baylor College of Medicine
Baylor University
Bemidji State University
Benedictine University
Berry College
Bethel University
Binghamton University
Boise State University
Boston College
Boston University
Bowie State University
Bradley University
Brandeis University
Brenau University
Bridgewater State University
Brown University
Bryant University
Bryn Mawr College
Buffalo State College
Butler University
Caldwell University
California Institute of Integral Studies
California Institute of Technology
California Lutheran University
California State Polytechnic University – Pomona
California State University – Bakersfield
California State University – Chico
California State University – Dominguez Hills
California State University – East Bay
California State University – Fresno
California State University – Fullerton
California State University – Los Angeles
California State University – Sacramento
California State University – San Bernardino
California State University – San Marcos
California State University – Stanislaus
California University of Pennsylvania
Cameron University
Carlow University

E2 Council of Graduate Schools
Carson-Newman University
Case Western Reserve University
Central Connecticut State University
Central Michigan University
Central Washington University
Champlain College
Chapman University
Charleston Southern University
Chatham University
Christopher Newport University
Claremont Graduate University
Clark Atlanta University
Clark University
Clarke University
Clemson University
Cleveland State University
College of Charleston
College of Staten Island CUNY
Colorado School of Mines
Colorado State University – Fort Collins
Columbia College
Columbia College Chicago
Columbia University in the City of New York
Concordia University – Chicago
Cornell University
Creighton University
CUNY Brooklyn College
CUNY City College
CUNY Graduate School and University Center
Dartmouth College
Delta State University
DePaul University
Dominican University
Drake University
Drexel University
Duke University
Duquesne University
D’Youville College
East Carolina University
East Central University
East Stroudsburg University of Pennsylvania
East Tennessee State University
Eastern Illinois University
Eastern Michigan University
Eastern New Mexico University
Eastern Washington University
Elon University
Embry-Riddle Aeronautical University – Daytona Beach
Embry-Riddle Aeronautical University – Prescott
Emory University
Emporia State University
Fayetteville State University
Ferris State University
Fielding Graduate University
Fitchburg State University
Florida A & M University
Florida Atlantic University
Florida Institute of Technology
Florida International University
Florida State University
Fordham University
Fort Hays State University
Frostburg State University
Furman University
Gallaudet University
Gardner-Webb University
Geneva College
George Mason University
George Washington University
Georgetown University
Georgia College & State University
Georgia Institute of Technology – Main Campus
Georgia Southern University
Georgia Southwestern State University
Georgia State University
Gonzaga University
Governors State University
Grambling State University
Grand Valley State University

E3Graduate Enrollment and Degrees: 2010 to 2020
Hampton University
Harvard University
Hebrew Union College – Jewish Institute of Religion
Henderson State University
Hofstra University
Holy Family University
Hood College
Howard University
Humboldt State University
Illinois Institute of Technology
Illinois State University
Immaculata University
Indiana University of Pennsylvania – Main Campus
Indiana University – Bloomington
Indiana University-Purdue University – Indianapolis
Inter American University of Puerto Rico – Metro
Iona College
Iowa State University
Ithaca College
Jackson State University
James Madison University
Jewish Theological Seminary of America
John Brown University
John Carroll University
Johns Hopkins University
Kansas State University
Kean University
Keck Graduate Institute
Keene State College
Kennesaw State University
Kent State University at Kent
Kettering University
Kutztown University of Pennsylvania
La Salle University
La Sierra University
Lamar University
Lehigh University
Lewis University
Lincoln Memorial University
Lipscomb University
Lock Haven University
Longwood University
Louisiana State University and Agricultural & Mechanical College
Louisiana State University Health Sciences Center – New Orleans
Loyola Marymount University
Loyola University Chicago
Loyola University Maryland
Loyola University New Orleans
Madonna University
Marquette University
Marshall University
Marymount University
Marywood University
Massachusetts Institute of Technology
McDaniel College
McNeese State University
Medical College of Wisconsin
Medical University of South Carolina
Meharry Medical College
Mercy College
Meredith College
Metropolitan State University
Metropolitan State University of Denver
Miami University – Oxford
Michigan State University
Michigan Technological University
MidAmerica Nazarene University
Middle Tennessee State University
Middlebury College
Millersville University of Pennsylvania
Milwaukee School of Engineering
Minnesota State University Moorhead
Misericordia University
Mississippi College
Mississippi State University
Missouri State University – Springfield

E4 Council of Graduate Schools
Missouri University of Science & Technology
Missouri Western State University
Molloy College
Monmouth University
Montana State University
Montana Technological University
Montclair State University
Morehouse School of Medicine
Morgan State University
Mount Saint Joseph University
Mount Saint Mary’s University
National-Louis University
Nazareth College
New Jersey Institute of Technology
New Mexico Highlands University
New Mexico Institute of Mining and Technology
New Mexico State University – Main Campus
New York Institute of Technology
New York Medical College
New York University
Newman University
Nicholls State University
North Carolina A & T State University
North Carolina Central University
North Carolina State University at Raleigh
North Dakota State University – Main Campus
North Georgia College and State University
Northeastern Illinois University
Northeastern State University
Northeastern University
Northern Arizona University
Northern Kentucky University
Northern State University
Northwest Missouri State University
Northwestern State University of Louisiana
Northwestern University
Notre Dame de Namur University
Nova Southeastern University
Oakland University
Ohio State University – Main Campus
Ohio University – Main Campus
Oklahoma State University – Main Campus
Old Dominion University
Oregon State University
Our Lady of the Lake University
Pace University
Pacific Lutheran University
Pennsylvania State University – Main Campus
Piedmont College
Pittsburg State University
Plymouth State University
Polytechnic Institute of New York University
Portland State University
Prairie View A & M University
Princeton University
Providence College
Purdue University Fort Wayne
Purdue University – Main Campus
Quinnipiac University
Radford University
Regent University
Rhode Island College
Rhode Island School of Design
Rice University
Rochester Institute of Technology
Rockefeller University
Rose-Hulman Institute of Technology
Rowan University
Russell Sage College
Rutgers Graduate School of Biomedical Sciences
Rutgers University – New Brunswick
Rutgers University – Camden
Sacred Heart University
Saint Ambrose University
Saint John Fisher College
Salem State University
Salisbury University
Salve Regina University
Sam Houston State University
San Francisco State University

E5Graduate Enrollment and Degrees: 2010 to 2020
San Jose State University
Santa Clara University
Savannah College of Art and Design
Seattle Pacific University
Seattle University
Seton Hall University
Shenandoah University
Shippensburg University of Pennsylvania
Simmons University
Slippery Rock University of Pennsylvania
South Carolina State University
South Dakota School of Mines and Technology
South Dakota State University
Southeast Missouri State University
Southeastern Louisiana University
Southern Arkansas University Main Campus
Southern Illinois University – Carbondale
Southern Illinois University – Edwardsville
Spalding University
Springfield College
St Bonaventure University
St Catherine University
St John’s University – New York
St. Mary’s University
Stanford University
State University of New York at New Paltz
State University of New York Health Science Center
Stephen F Austin State University
Stetson University
Stevens Institute of Technology
Stockton University
Stony Brook University
Suffolk University
SUNY at Albany
SUNY at Fredonia
SUNY College at Oswego
SUNY College of Environmental Science and Forestry
SUNY Cortland
SUNY Polytechnic Institute
Syracuse University
Tarleton State University
Teachers College at Columbia University
Temple University
Tennessee State University
Tennessee Technological University
Texas A & M International University
Texas A & M University – Central Texas
Texas A & M University – College Station
Texas A & M University – Commerce
Texas A & M University – Corpus Christi
Texas A & M University – Kingsville
Texas A & M University – Texarkana
Texas Christian University
Texas Southern University
Texas State University
Texas Woman’s University
The Catholic University of America
The Citadel Military College of South Carolina
The College of Saint Rose
The New School
The University of Alabama
The University of Montana
The University of Tennessee Health Science Center
The University of Tennessee – Chattanooga
The University of Tennessee – Knoxville
The University of Tennessee – Martin
The University of Texas at Arlington
The University of Texas at Austin
The University of Texas at Dallas
The University of Texas at El Paso
The University of Texas at San Antonio
The University of Texas at Tyler
The University of Texas Health Science Center at Houston
The University of Texas Health Science Center at San Antonio
The University of Texas Medical Branch at Galveston
The University of Texas of the Permian Basin
The University of Texas Rio Grande Valley

E6 Council of Graduate Schools
The University of West Florida
Thomas Edison State University
Towson University
Trevecca Nazarene University
Troy University
Truman State University
Tufts University
Tulane University of Louisiana
Universidad Ana G. Mendez – Gurabo Campus
University at Buffalo
University of Akron Main Campus
University of Alabama at Birmingham
University of Alabama in Huntsville
University of Arizona
University of Arkansas
University of Arkansas at Little Rock
University of Arkansas at Monticello
University of Arkansas for Medical Sciences
University of California – Berkeley
University of California – Davis
University of California – Irvine
University of California – Los Angeles
University of California – Merced
University of California – San Diego
University of California – San Francisco
University of California – Santa Barbara
University of California – Santa Cruz
University of Central Arkansas
University of Central Florida
University of Central Missouri
University of Central Oklahoma
University of Chicago
University of Cincinnati
University of Colorado Boulder
University of Colorado Colorado Springs
University of Colorado Denver/ Anschutz Medical Campus
University of Connecticut
University of Dayton
University of Delaware
University of Denver
University of Florida
University of Georgia
University of Hartford
University of Hawaii at Manoa
University of Houston
University of Houston – Clear Lake
University of Idaho
University of Illinois at Chicago
University of Illinois at Springfield
University of Illinois at Urbana-Champaign
University of Iowa
University of Kansas
University of Kentucky
University of Louisiana at Lafayette
University of Louisiana at Monroe
University of Louisville
University of Maine
University of Mary Hardin-Baylor
University of Maryland – Baltimore
University of Maryland – Baltimore County
University of Maryland – College Park
University of Maryland – Eastern Shore
University of Massachusetts Medical School Worcester
University of Massachusetts – Amherst
University of Massachusetts – Boston
University of Massachusetts – Dartmouth
University of Massachusetts – Lowell
University of Memphis
University of Miami
University of Michigan – Ann Arbor
University of Michigan – Flint
University of Minnesota – Twin Cities
University of Mississippi
University of Mississippi Medical Center
University of Missouri – Columbia
University of Missouri – Kansas City
University of Missouri – St. Louis
University of Montevallo

E7Graduate Enrollment and Degrees: 2010 to 2020
University of Nebraska at Kearney
University of Nebraska at Omaha
University of Nebraska Medical Center
University of Nebraska – Lincoln
University of Nevada – Las Vegas
University of Nevada – Reno
University of New England
University of New Hampshire – Main Campus
University of New Haven
University of New Mexico – Main Campus
University of New Orleans
University of North Alabama
University of North Carolina at Chapel Hill
University of North Carolina at Charlotte
University of North Carolina at Greensboro
University of North Carolina at Pembroke
University of North Carolina at Wilmington
University of North Dakota
University of North Florida
University of North Texas
University of North Texas Health Science Center at Fort Worth
University of Northern Colorado
University of Northern Iowa
University of Notre Dame
University of Oklahoma – Health Sciences Center
University of Oklahoma – Norman Campus
University of Oregon
University of Pennsylvania
University of Phoenix – Sperling Center
University of Pittsburgh – Pittsburgh Campus
University of Rhode Island
University of Rochester
University of Saint Francis – Fort Wayne
University of San Diego
University of San Francisco
University of Scranton
University of South Alabama
University of South Carolina – Columbia
University of South Dakota
University of South Florida – Main Campus
University of Southern Maine
University of Southern Mississippi
University of St Thomas
University of Texas Southwestern Medical Center
University of the District of Columbia
University of the Incarnate Word
University of the Sciences in Philadelphia
University of Toledo
University of Tulsa
University of Utah
University of Vermont
University of Virginia-Main Campus
University of Washington – Seattle Campus
University of West Alabama
University of West Georgia
University of Wisconsin – Eau Claire
University of Wisconsin – La Crosse
University of Wisconsin – Madison
University of Wisconsin – Milwaukee
University of Wisconsin – River Falls
University of Wisconsin – Stevens Point
University of Wisconsin – Superior
University of Wyoming
Upstate Medical University
Ursuline College
Valdosta State University
Valparaiso University
Vanderbilt University
Virginia Commonwealth University
Virginia Polytechnic Institute and State University
Wagner College
Wake Forest University
Walden University
Walsh University
Washington State University
Washington University in St Louis
Watson School of Biological Sciences
Wayne State College
Wayne State University

E8 Council of Graduate Schools
West Chester University of Pennsylvania
West Virginia University
Western Carolina University
Western Connecticut State University
Western Illinois University
Western Kentucky University
Western Michigan University
Western Oregon University
Western Washington University
Westfield State University
Wheaton College
Wichita State University
Widener University
Wilkes University
William & Mary
William Paterson University of New Jersey
Winona State University
Winthrop University
Woods Hole Oceanographic Institution
Worcester State University
Wright State University – Main Campus
Yale University
Youngstown State University

F1Graduate Enrollment and Degrees: 2010 to 2020
APPENDIX FSurvey Instrument
2020____________________Data Sheet
Institution Name: ___________________________ GRE® Institution Code: _______________
I. Graduate Enrollment for 2020 Fall Term First Time Total (Includes First Time) Men Women Total Men Women Total Master’s and Other * Doctorate Total Full Time Part Time Total
II. Number of Degrees Conferred between July 1, 2019, and June 30, 2020
Men Women Total Master’s and Other * Doctorate Graduate Certificate
III. Number of Completed Applications Submitted for 2020 Fall Term Master’s and Other* Doctorate Total Accepted Not Accepted Total
IV. Graduate Enrollment by Race/Ethnicity for 2020 Fall Term First-Time Total (Includes First Time) Men Women Total Men Women Total Non-Resident Aliens (Temporary Residents)
U.S
Citi
zens
and
Pe
rman
ent
Resid
ents
Hispanic/Latino (of any race)
Non
-Hisp
anic
American Indian/Alaskan Native Asian Black/African American Native Hawaiian/Other Pacific Islander
White Two or More Races
Race/Ethnicity Unknown Citizenship Unknown Total
* Other includes other non-doctoral programs (for example, graduate certificate programs and educational specialist programs) except in question II where graduate certificates are reported separately.
Copyright © 2020 ETS. All rights reserved.

Council of Graduate SchoolsOne Dupont Circle, NW, Suite 230Washington, DC 20036-1146(202) 223-3791 (main)
www.cgsnet.org