Grading Standards in Education Departments at...
27
Grading Standards in Education Departments at Universities Cory Koedel University of Missouri June 2011 Students who take classes in education departments at universities receive significantly higher grades than students who take classes in other academic departments. The higher grades awarded by education departments cannot be explained by differences in student quality or by structural differences across departments (i.e., differences in class sizes). The remaining explanation is that the higher grades are the result of lower grading standards. This paper formally documents the grading-standards problem in education departments using administrative grade data from the 2007-2008 academic year. Because a large fraction of the teachers in K-12 schools receive training in education departments, I briefly discuss several possible consequences of the low grading standards for teacher quality in K-12 schools.
-
Upload
hoangxuyen -
Category
Documents
-
view
225 -
download
0
Transcript of Grading Standards in Education Departments at...
Grading Standards in Education Departments at Universities
Cory Koedel University of Missouri
June 2011
Students who take classes in education departments at universities receive significantly higher grades than students who take classes in other academic departments. The higher grades awarded by education departments cannot be explained by differences in student quality or by structural differences across departments (i.e., differences in class sizes). The remaining explanation is that the higher grades are the result of lower grading standards. This paper formally documents the grading-standards problem in education departments using administrative grade data from the 2007-2008 academic year. Because a large fraction of the teachers in K-12 schools receive training in education departments, I briefly discuss several possible consequences of the low grading standards for teacher quality in K-12 schools.
1
There is a large and growing research literature showing that teacher quality is an important
determinant of student success (recent studies include Aaronson et al., 2007; Koedel, 2008; Nye et
al., 2004; Rivkin et al., 2005; Rockoff, 2004). But while there is persistent research into a variety of
interventions aimed at improving teacher quality, surprisingly little attention has been paid to the
primary training ground for K-12 teachers—education departments at universities. This paper
provides an evaluation of the grading standards in these education departments. I show that
education students receive higher grades than do students in every other academic discipline. The
grading discrepancies that I document cannot be explained by differences between education and
non-education departments in student quality, or by structural differences across departments. The
likely explanation is grade inflation.
The earliest evidence on the grading-standards problem in education departments comes
from Weiss and Rasmussen in 1960. They showed that undergraduate students taking classes in
education departments were twice as likely to receive an “A” when compared to students taking
classes in business or liberal arts departments. The low grading standards in education departments,
illustrated by these authors over 50 years ago, are still prevalent today.
I document the disparity in current grading standards between education departments and
twelve other academic departments that are common to most universities using administrative data
from the 2007-2008 academic year. The comparison departments include (1) math, science and
economics departments: biology, chemistry, computer science, economics, mathematics and physics;
(2) social-science departments: political science, psychology and sociology; and (3) humanities
departments: English, history and philosophy.1 With great consistency, the data show that the grades
awarded by education departments are substantially higher than the grades awarded by all other
academic departments. 1 Although economics is a social science, the grade distributions in economics are much more similar to the hard sciences, and as such, they are grouped together for the analysis here.
2
The primary purpose of this paper is to highlight the magnitude of the current grading-
standards discrepancy between education and non-education departments. Anecdotally, although
most people seem to be aware that grading standards are lower in education departments, the
magnitude of the difference does not seem to be well understood. It would also be of interest to
evaluate the policy implications of the low grading standards in education departments – for
example, they are likely to affect the quality of the K-12 teaching workforce. But a formal analysis
along these lines seems virtually impossible given current data conditions. More concretely, there
appears to be little in the way of meaningful variation in grading standards across education
departments at different universities (see below), or within education departments over time (Weiss
and Rasmussen, 1960). Without this variation, researchers cannot evaluate the counterfactual impact
of more-stringent grading standards in education departments. The lack of variation in the data, and
the corresponding lack of rigorous research on this topic, however, should not be viewed as a
verdict on the importance of the grading-standards problem. The low grading standards in education
departments may have a large impact on the delivery of K-12 education in the United States despite
our difficulty in formally evaluating this issue.
Although data limitations prevent a formal analysis, I draw on evidence from the broader
research literature to consider several ways that the low grading standards in education departments
may affect teacher quality in K-12 schools. First, Babcock (2010) shows that grade inflation in
college reduces student effort, which in turn, reduces human-capital accumulation (Stinebrickner and
Stinebrickner, 2008). 2 Under fairly modest conditions, lower human-capital accumulation among
prospective teachers in college will negatively affect teacher quality in K-12 schools. Second, there is
a striking similarity between the low grading standards in education departments and the low
2 Although Babcock provides the only causal estimates of the effects of grading standards in college on student effort of which I am aware, similar results are found elsewhere. For example, Betts and Grogger (2003) and Figlio and Lucas (2004) show that K-12 students benefit from higher grading standards.
3
evaluation standards for teachers in the workforce (see, for example, Harris and Sass, 2010; Jacob
and Lefgren, 2008; TNTP, 2009). Murphy and Cleveland (1991) indicate that employee evaluations
can be affected by contextual norms – if the low grading standards to which prospective K-12
teachers are exposed in college affect their expectations in the workforce, this may affect their
evaluations in schools. The low evaluation standards for teachers in K-12 schools have been
identified as a likely impediment to student achievement by The New Teacher Project (TNTP,
2009). Finally, the grading standards in education departments are so low that grades cannot be used
to meaningfully distinguish students. In other departments, grades signal information about
performance to students, allowing them to sort into disciplines for which they are well-matched
(Arcidiacono, 2004; Michaels, 1976). There appears to be no such role for grades in education
departments—students who are poorly-matched for teaching careers are unlikely to receive any
indication that this is the case in their grade reports.3
I. Data
In my primary analysis I evaluate data from three large, public universities that have sizeable
undergraduate programs in education – Indiana University, Bloomington; Miami University, Oxford
(Ohio); and the University of Missouri, Columbia. Total enrollments at these universities in the fall
of 2007 were approximately 39,000, 16,000 and 28,000, respectively. The dataset includes the
universe of undergraduate classroom-level grade reports from administrative data for each university
for the 2007-2008 academic year. I use these grade reports to characterize the distributions of
classroom-level grades awarded by academic department.4
3 Arcidiacono (2004) shows that students sort across college majors using information about grades, which is consistent with grades providing information to individuals about their relative strengths and weaknesses. In a different context, Michaels (1976) provides a general discussion of the role of grades at universities, specifically noting their role in sorting students. 4 I use the term “classroom” to mean “lecture” – that is, I do not treat teaching-assistant “sections” of the same lecture as separate classes.
4
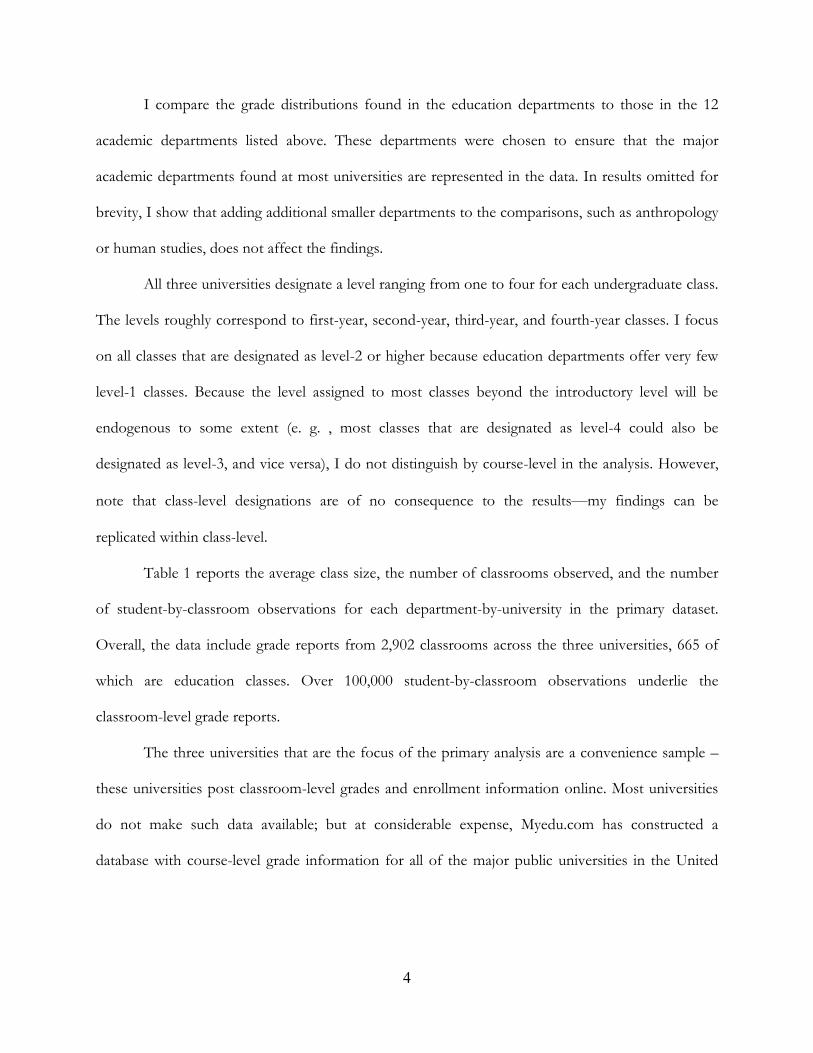
I compare the grade distributions found in the education departments to those in the 12
academic departments listed above. These departments were chosen to ensure that the major
academic departments found at most universities are represented in the data. In results omitted for
brevity, I show that adding additional smaller departments to the comparisons, such as anthropology
or human studies, does not affect the findings.
All three universities designate a level ranging from one to four for each undergraduate class.
The levels roughly correspond to first-year, second-year, third-year, and fourth-year classes. I focus
on all classes that are designated as level-2 or higher because education departments offer very few
level-1 classes. Because the level assigned to most classes beyond the introductory level will be
endogenous to some extent (e. g. , most classes that are designated as level-4 could also be
designated as level-3, and vice versa), I do not distinguish by course-level in the analysis. However,
note that class-level designations are of no consequence to the results—my findings can be
replicated within class-level.
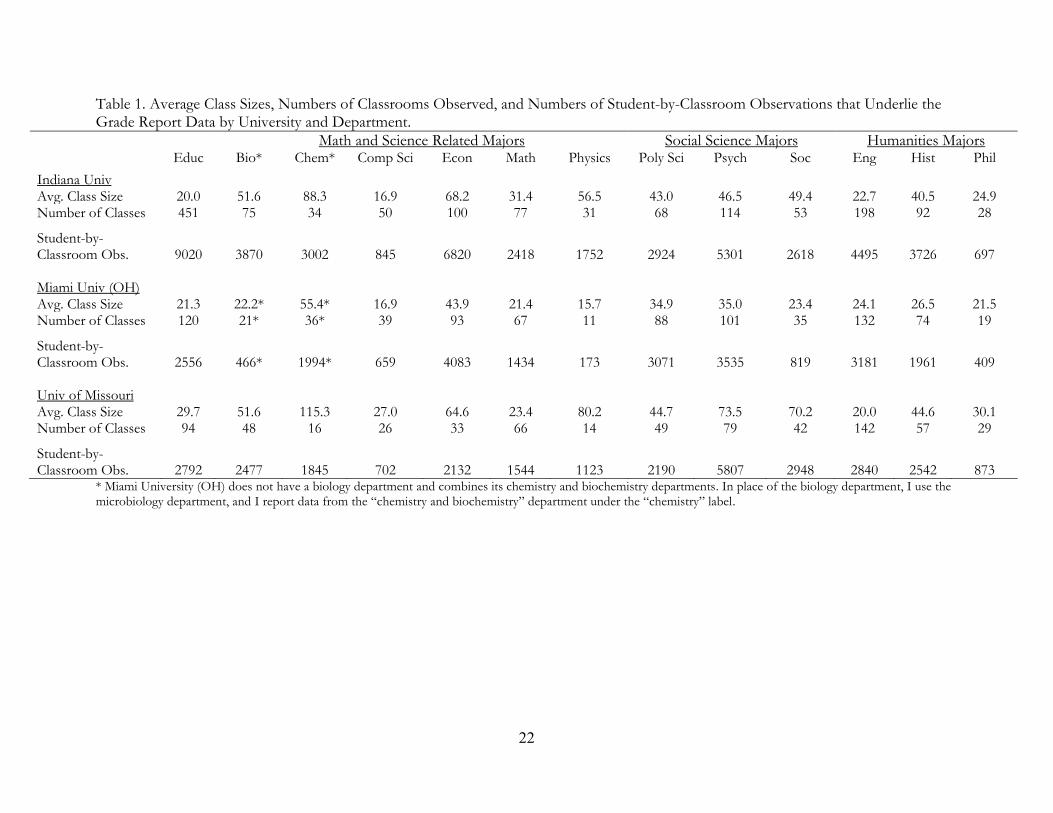
Table 1 reports the average class size, the number of classrooms observed, and the number
of student-by-classroom observations for each department-by-university in the primary dataset.
Overall, the data include grade reports from 2,902 classrooms across the three universities, 665 of
which are education classes. Over 100,000 student-by-classroom observations underlie the
classroom-level grade reports.
The three universities that are the focus of the primary analysis are a convenience sample –
these universities post classroom-level grades and enrollment information online. Most universities
do not make such data available; but at considerable expense, Myedu.com has constructed a
database with course-level grade information for all of the major public universities in the United
5
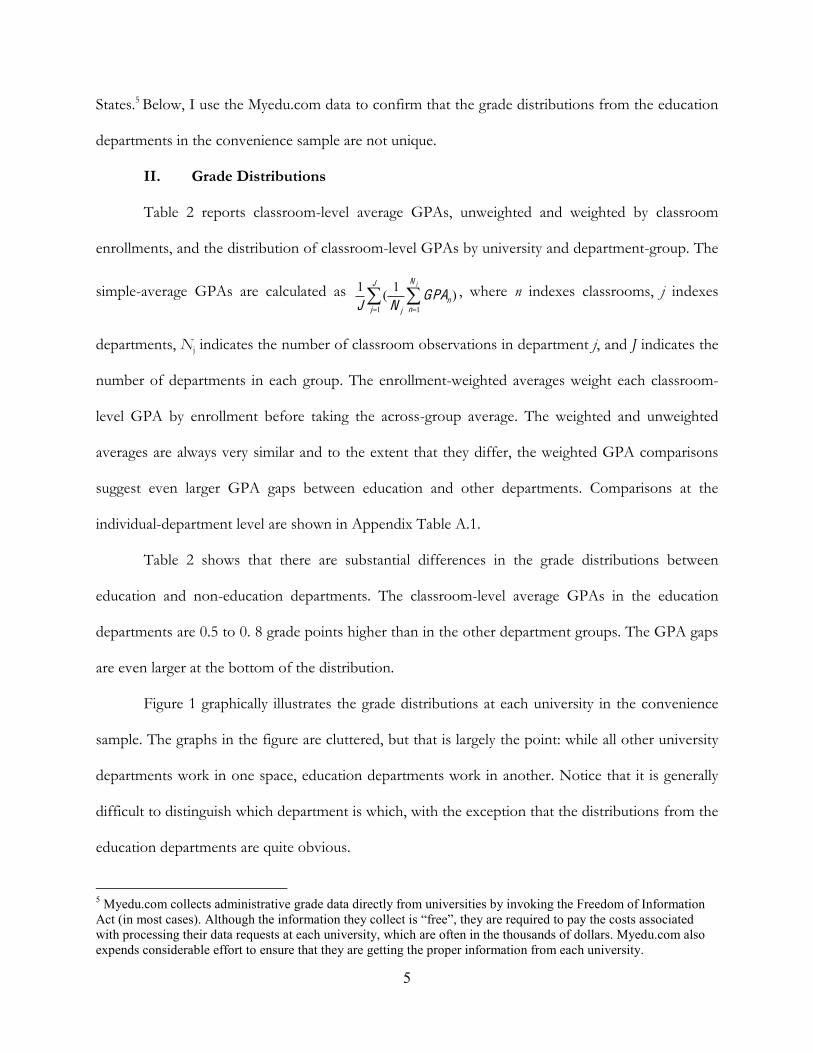
States.5 Below, I use the Myedu.com data to confirm that the grade distributions from the education
departments in the convenience sample are not unique.
II. Grade Distributions
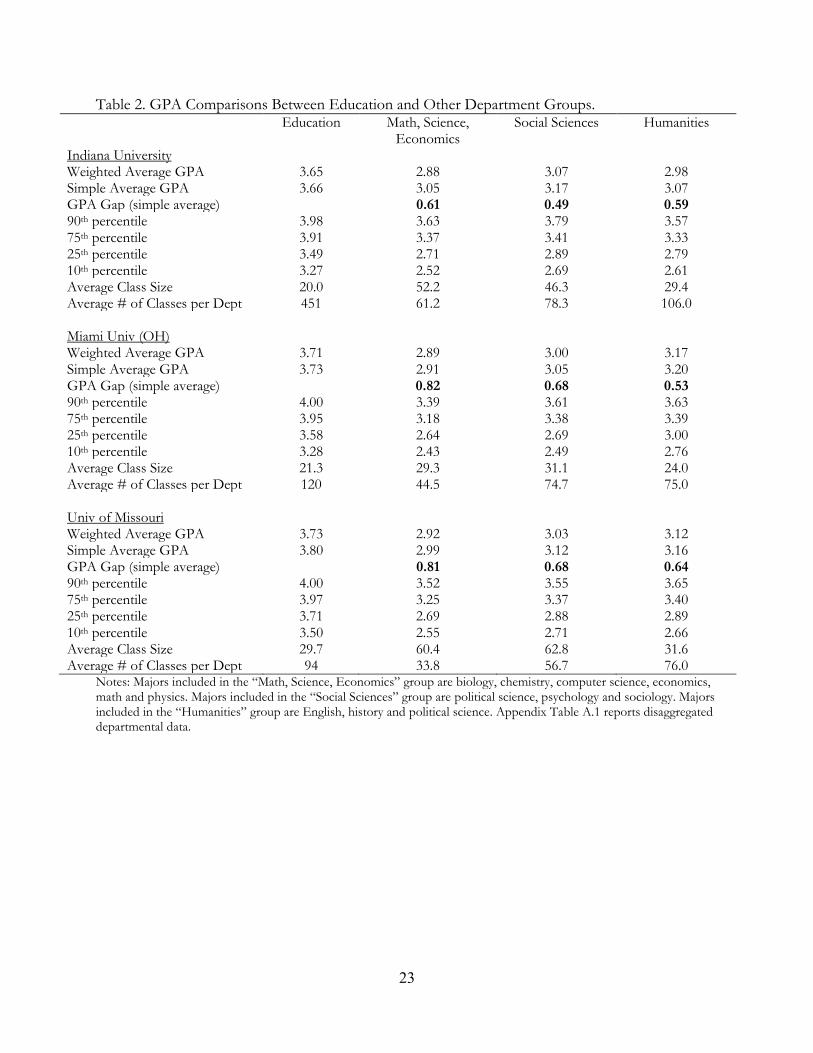
Table 2 reports classroom-level average GPAs, unweighted and weighted by classroom
enrollments, and the distribution of classroom-level GPAs by university and department-group. The
simple-average GPAs are calculated as 1 1
1 1( )jNJ
nj nj
GPAJ N , where n indexes classrooms, j indexes
departments, Nj indicates the number of classroom observations in department j, and J indicates the
number of departments in each group. The enrollment-weighted averages weight each classroom-
level GPA by enrollment before taking the across-group average. The weighted and unweighted
averages are always very similar and to the extent that they differ, the weighted GPA comparisons
suggest even larger GPA gaps between education and other departments. Comparisons at the
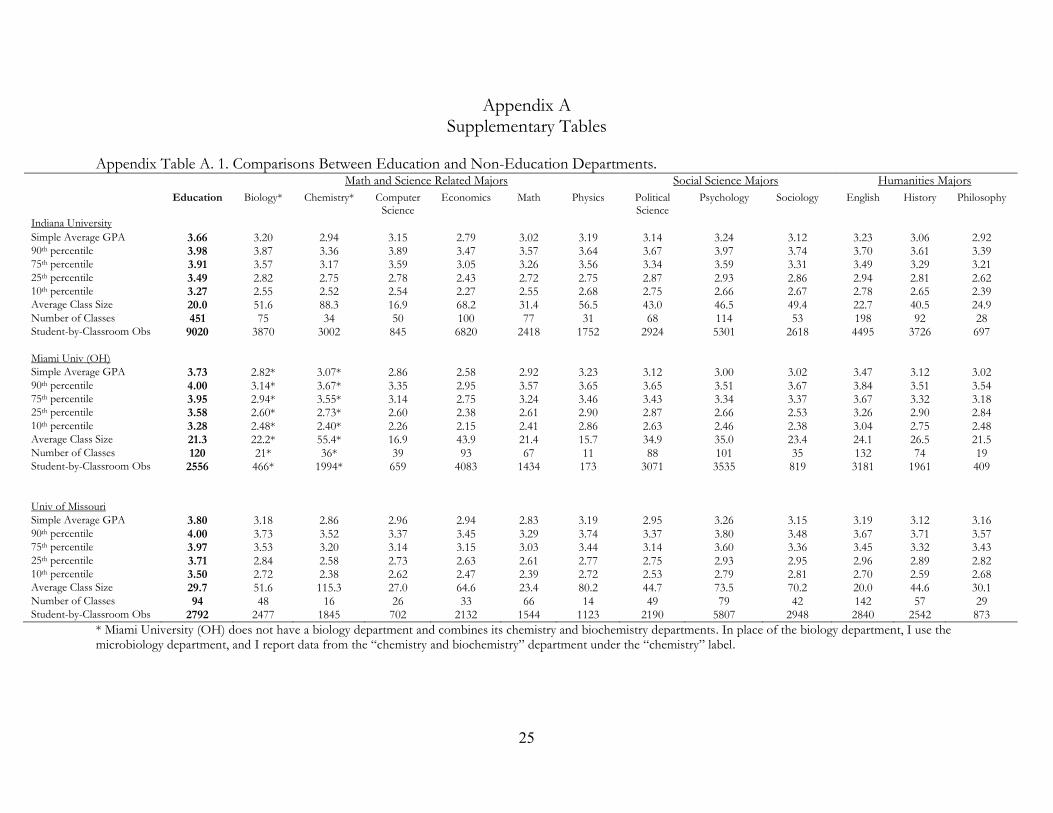
individual-department level are shown in Appendix Table A.1.
Table 2 shows that there are substantial differences in the grade distributions between
education and non-education departments. The classroom-level average GPAs in the education
departments are 0.5 to 0. 8 grade points higher than in the other department groups. The GPA gaps
are even larger at the bottom of the distribution.
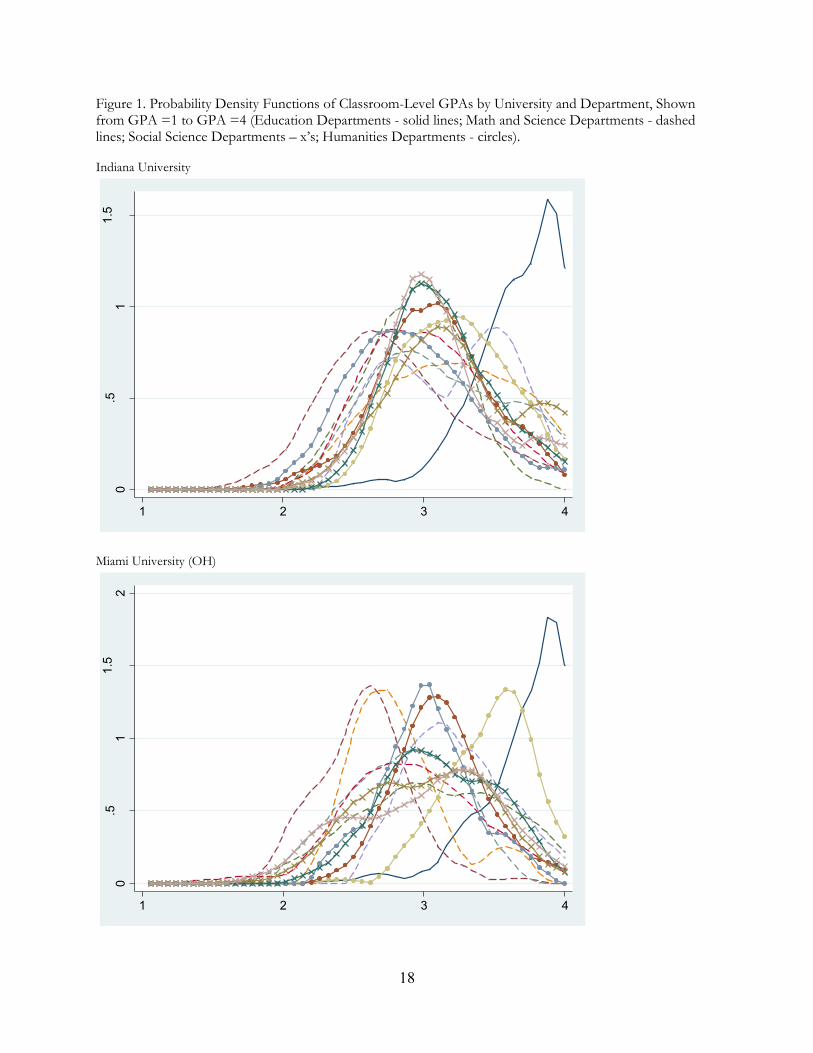
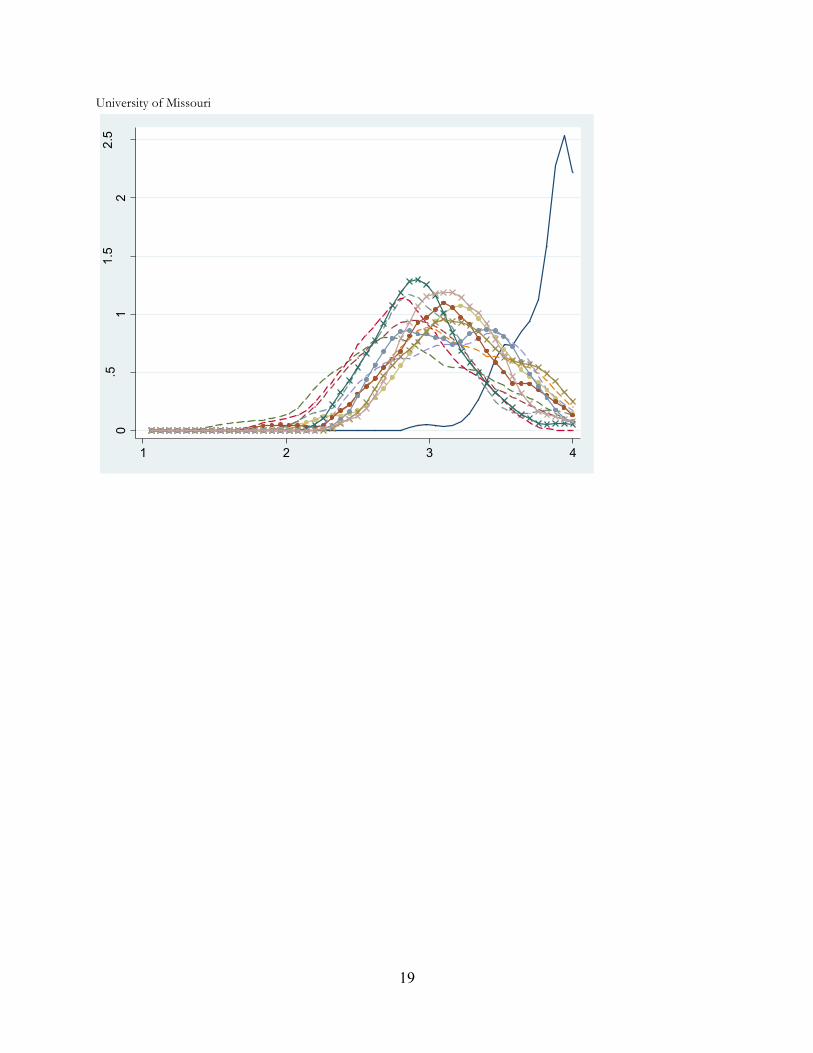
Figure 1 graphically illustrates the grade distributions at each university in the convenience
sample. The graphs in the figure are cluttered, but that is largely the point: while all other university
departments work in one space, education departments work in another. Notice that it is generally
difficult to distinguish which department is which, with the exception that the distributions from the
education departments are quite obvious.
5 Myedu.com collects administrative grade data directly from universities by invoking the Freedom of Information Act (in most cases). Although the information they collect is “free”, they are required to pay the costs associated with processing their data requests at each university, which are often in the thousands of dollars. Myedu.com also expends considerable effort to ensure that they are getting the proper information from each university.
6
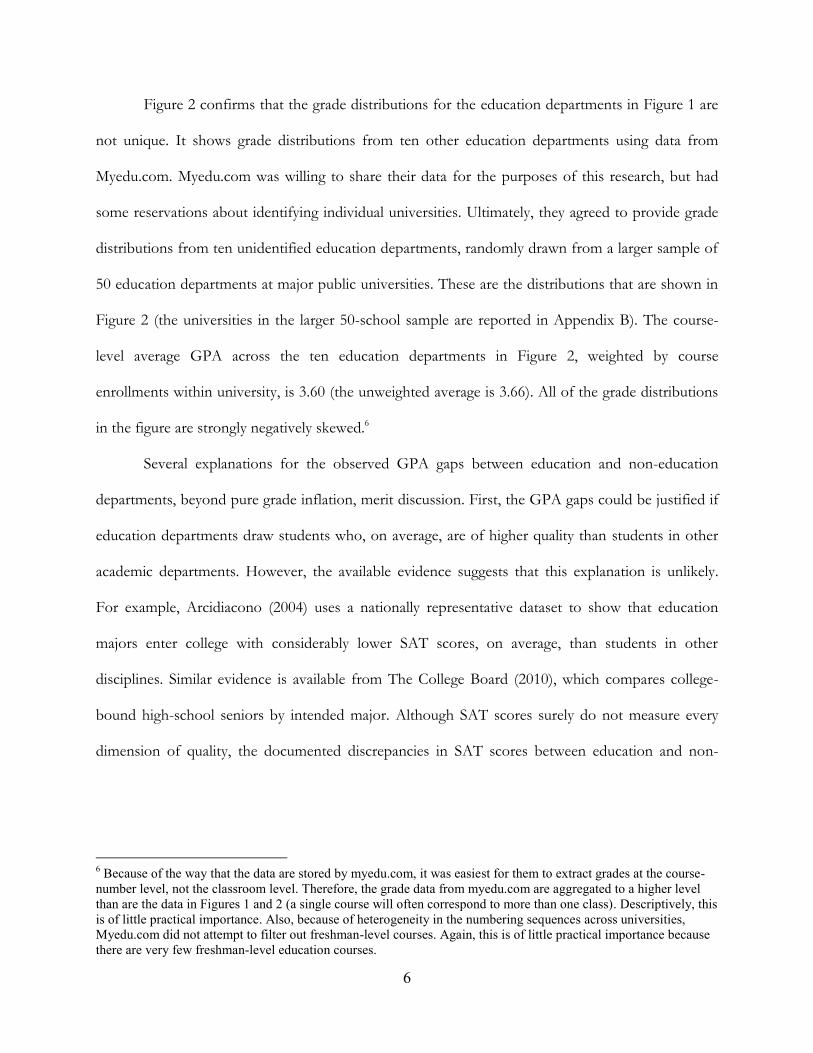
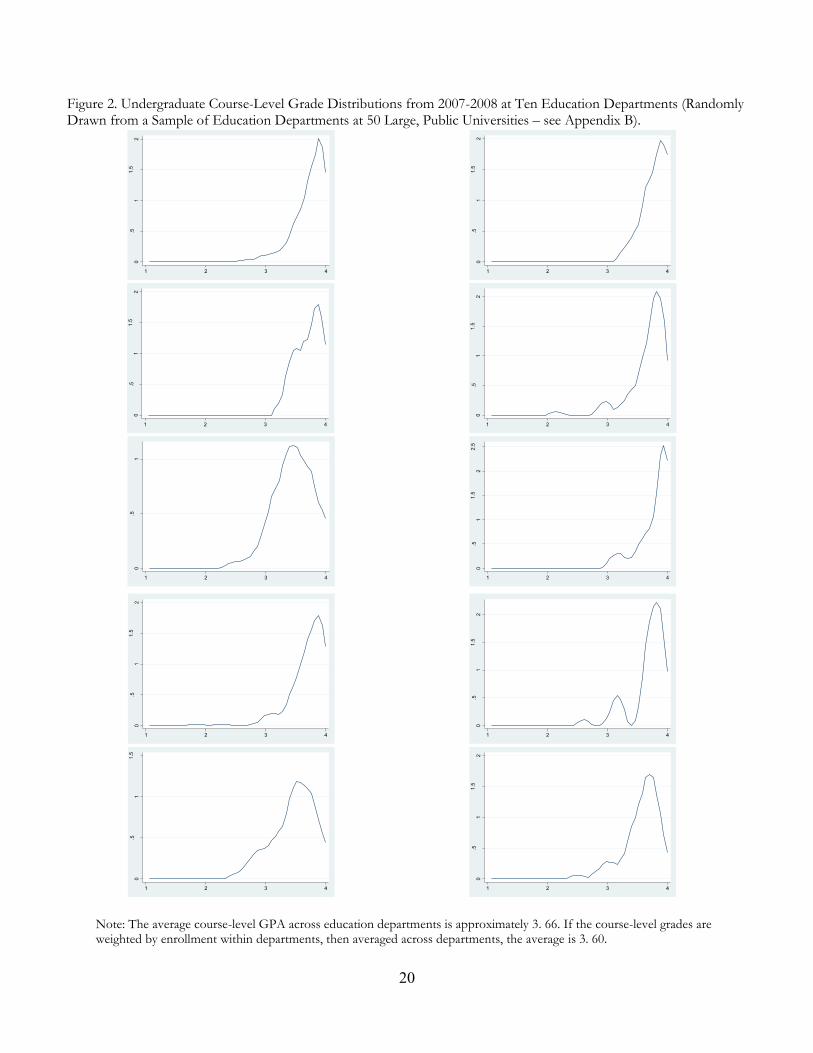
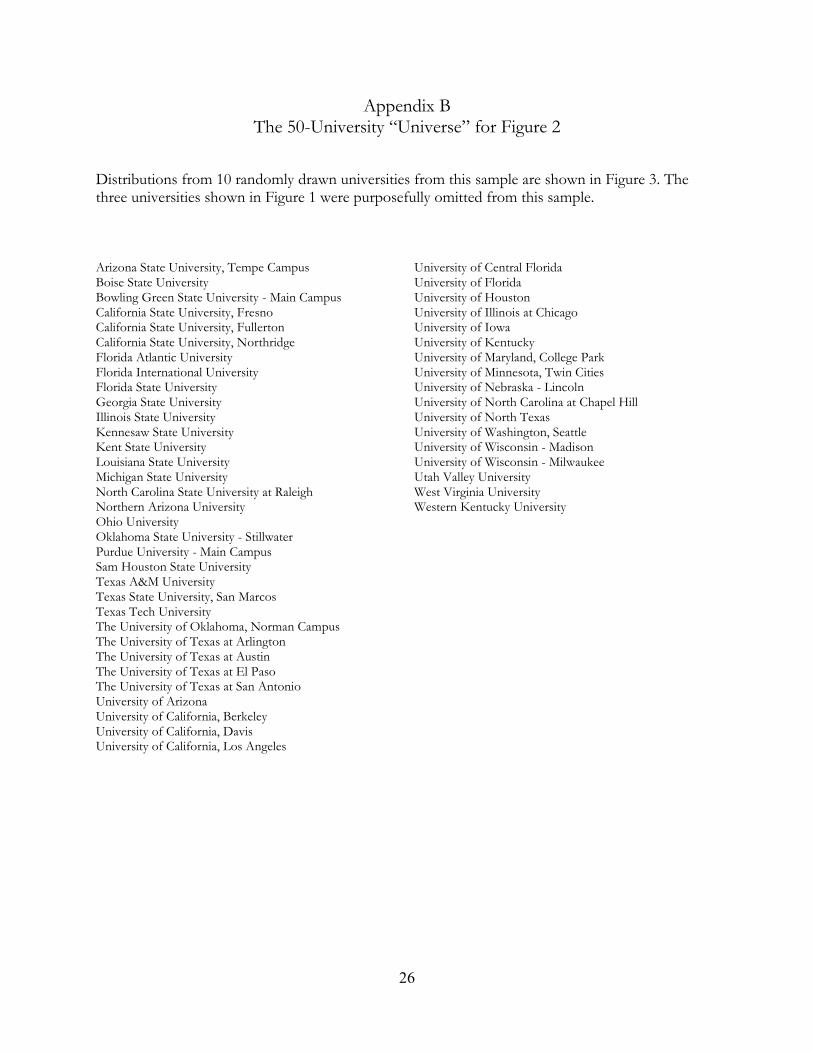
Figure 2 confirms that the grade distributions for the education departments in Figure 1 are
not unique. It shows grade distributions from ten other education departments using data from
Myedu.com. Myedu.com was willing to share their data for the purposes of this research, but had
some reservations about identifying individual universities. Ultimately, they agreed to provide grade
distributions from ten unidentified education departments, randomly drawn from a larger sample of
50 education departments at major public universities. These are the distributions that are shown in
Figure 2 (the universities in the larger 50-school sample are reported in Appendix B). The course-
level average GPA across the ten education departments in Figure 2, weighted by course
enrollments within university, is 3.60 (the unweighted average is 3.66). All of the grade distributions
in the figure are strongly negatively skewed.6
Several explanations for the observed GPA gaps between education and non-education
departments, beyond pure grade inflation, merit discussion. First, the GPA gaps could be justified if
education departments draw students who, on average, are of higher quality than students in other
academic departments. However, the available evidence suggests that this explanation is unlikely.
For example, Arcidiacono (2004) uses a nationally representative dataset to show that education
majors enter college with considerably lower SAT scores, on average, than students in other
disciplines. Similar evidence is available from The College Board (2010), which compares college-
bound high-school seniors by intended major. Although SAT scores surely do not measure every
dimension of quality, the documented discrepancies in SAT scores between education and non-
6 Because of the way that the data are stored by myedu.com, it was easiest for them to extract grades at the course-number level, not the classroom level. Therefore, the grade data from myedu.com are aggregated to a higher level than are the data in Figures 1 and 2 (a single course will often correspond to more than one class). Descriptively, this is of little practical importance. Also, because of heterogeneity in the numbering sequences across universities, Myedu.com did not attempt to filter out freshman-level courses. Again, this is of little practical importance because there are very few freshman-level education courses.
7
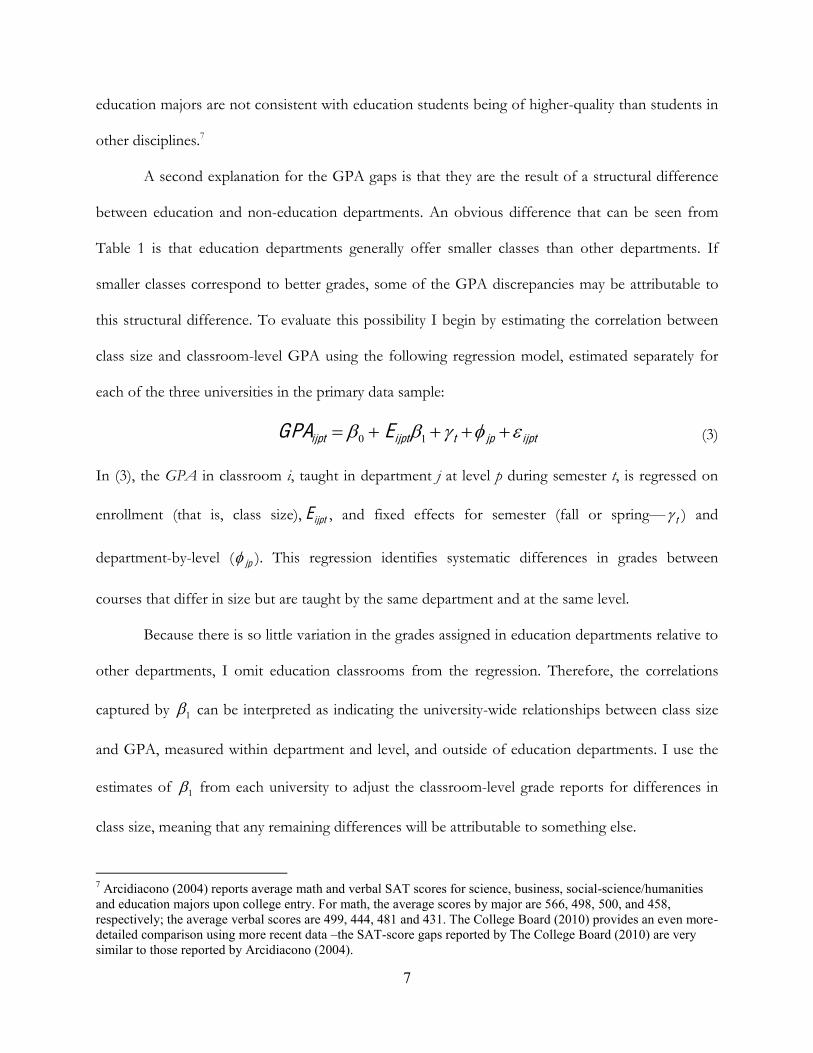
education majors are not consistent with education students being of higher-quality than students in
other disciplines.7
A second explanation for the GPA gaps is that they are the result of a structural difference
between education and non-education departments. An obvious difference that can be seen from
Table 1 is that education departments generally offer smaller classes than other departments. If
smaller classes correspond to better grades, some of the GPA discrepancies may be attributable to
this structural difference. To evaluate this possibility I begin by estimating the correlation between
class size and classroom-level GPA using the following regression model, estimated separately for
each of the three universities in the primary data sample:
0 1ijpt ijpt t jp ijptGPA E (3)
In (3), the GPA in classroom i, taught in department j at level p during semester t, is regressed on
enrollment (that is, class size), ijptE , and fixed effects for semester (fall or spring— t ) and
department-by-level ( jp ). This regression identifies systematic differences in grades between
courses that differ in size but are taught by the same department and at the same level.
Because there is so little variation in the grades assigned in education departments relative to
other departments, I omit education classrooms from the regression. Therefore, the correlations
captured by 1 can be interpreted as indicating the university-wide relationships between class size
and GPA, measured within department and level, and outside of education departments. I use the
estimates of 1 from each university to adjust the classroom-level grade reports for differences in
class size, meaning that any remaining differences will be attributable to something else.
7 Arcidiacono (2004) reports average math and verbal SAT scores for science, business, social-science/humanities and education majors upon college entry. For math, the average scores by major are 566, 498, 500, and 458, respectively; the average verbal scores are 499, 444, 481 and 431. The College Board (2010) provides an even more-detailed comparison using more recent data –the SAT-score gaps reported by The College Board (2010) are very similar to those reported by Arcidiacono (2004).
8
Perhaps not surprisingly, 1 is negative and statistically significant in all three regressions,
which means that smaller classes are indeed associated with higher grades. The association is likely
attributable to both causal and non-causal factors. For example, smaller classes may cause better
grades by improving instructors’ abilities to monitor students, facilitating different instructional
philosophies, or by increasing the social stigma attached to poor performance. Conversely, a non-
causal explanation is that departments teach selective classes on advanced topics, and purposefully
limit enrollment to their most able students. If the relationship between class size and GPA is
entirely causal, adjusting the GPA gaps for the differences in class sizes between education and non-
education departments will provide a more-accurate comparison. However, to the extent that the
correlation is not causal, and simply represents the effect of student sorting by class size, adjusting
the GPA gaps based on the output from equation (3) will likely overcompensate for the structural
component, and understate the grade-inflation problem.8
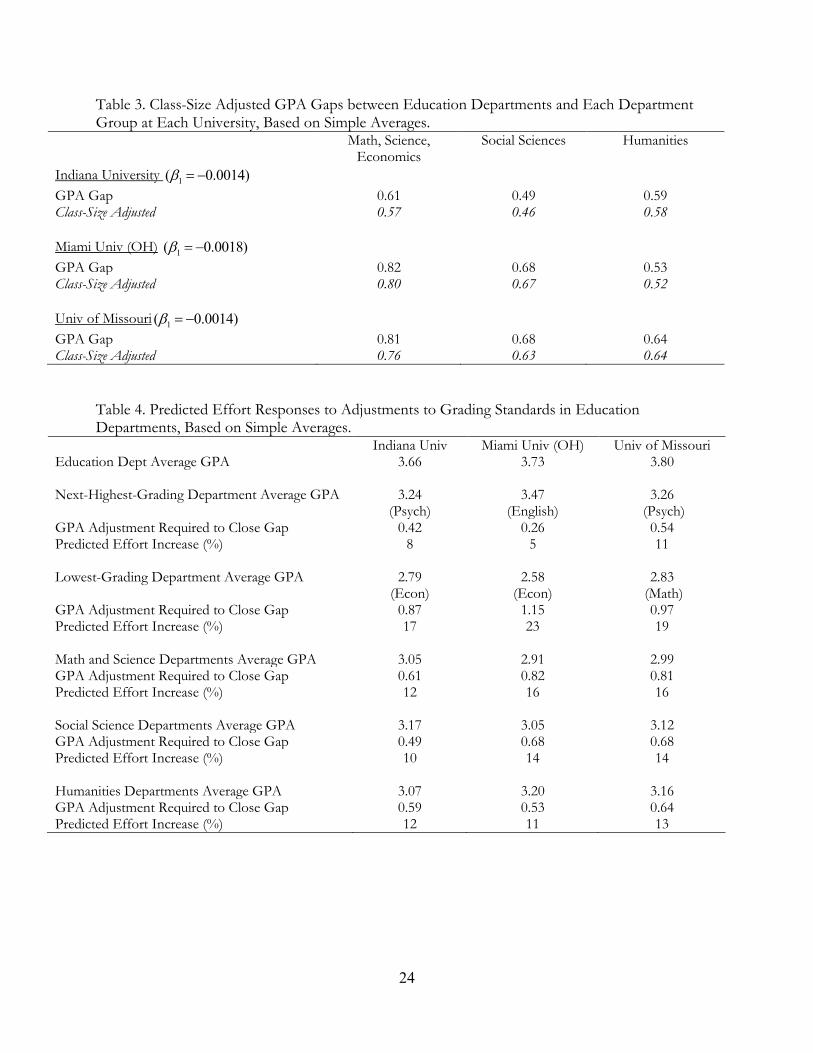
Table 3 reports GPA gaps that are adjusted for the class-size discrepancies between
education and non-education departments using the estimates of 1 from equation (3). Although
the adjusted GPA gaps are slightly smaller, they are still large. This suggests that the GPA gaps are
not explained by differences in class sizes between education and non-education departments.
It may also be that fundamental differences in instructional practice between education and
non-education departments influence the grade distributions. One possible difference is in
instructional philosophy. As a specific example, the mastery-learning framework is likely to be more
common in education departments. Within the mastery-learning framework, class topics are handled
discretely and students who have difficulty with a given topic receive additional instruction until they
succeed. The underlying philosophy that all students can master the topics of the course suggests
8 In theory, the bias from the adjustment could go in the other direction if academic departments sorted their least-able students into smaller classes. However, in practice, departments appear to be much more likely to offer smaller classes to their advanced students.
9
that grades in courses that are taught under the mastery-learning framework will be higher. While in
principle any professor in any discipline can adopt the mastery-learning approach, or something
similar, mastery-learning courses are likely to be more common in education departments because
(1) the sizeable research literature on mastery learning is in education and (2) the mastery-learning
approach may be a more reasonable fit for education classes based on course content.9
A second issue related to instructional practice involves the prevalence of practice-based
and/or internship courses in degree programs in education and non-education departments. Relative
to other academic disciplines, the nature of the training in education departments is likely to require
more practice-based courses. Grades in such courses can either be assigned as pass/fail, in which
case they are not factored into student GPAs, or as letter grades. In the latter case, it seems likely
that “A’s” will be commonly awarded to indicate satisfactory completion, meaning that such classes
will cause some grade inflation.
Unfortunately, I cannot investigate the effects on the grade distributions of differences in
instructional philosophies across academic departments because data are not available (for education
or other departments). However, this seems like a logical starting point for future work that attempts
to identify why the grading discrepancies that I document above exist. Alternatively, using data from
the University of Missouri and Miami University, where course descriptions are available, I can
evaluate the role of practice-based courses in determining the education-department grade
distributions.10 At Miami University, the courses that are clearly labeled as practice-based courses in
the administrative data are graded on a pass-fail basis, which means that they are not included in the
analysis above. At the University of Missouri, the practice-based courses do appear to be graded – if
9 The literature on mastery learning dates back to the 1970s – see, for example, Bloom (1974) or Block and Anderson (1975). There is some argument in the literature as to its merits (see, for example, Kulik et al., 1990; Slavin, 1990). 10 The data from Indiana University do not provide enough of a description of the course to categorize internship or practice-based courses. Also, it may be that some practice-based courses are not clearly labeled in the data from the other two universities, in which case I will not know to treat them as such.
10
I omit them from the GPA calculations, the average course-level GPA for the Missouri education
department declines by just 0.02 grade points. Clearly, the grading discrepancies are not driven by
differences across departments in the prevalence of practice-based courses.
Finally, I briefly raise a conceptual issue regarding mechanisms. While it is important to
understand the mechanisms that underlie the grade distributions, only in cases where the mechanism
is outside of the control of the faculty in academic departments is it reasonable to make an
adjustment to the grade distributions. The first two mechanisms considered above – departmental
differences in student quality and class size – are plausibly outside of faculty control.11 However, the
latter two mechanisms – differences in instructional philosophy and the prevalence and grading of
practice-based courses—are determined by faculty. For example, any professor in any discipline can
adopt a teaching philosophy that leads to higher student grades. Similarly, departments have some
discretion over the role and prevalence of practice-based courses in their degree programs, and
equally importantly, over how these courses are graded (i.e., by letter grade or pass-fail). The choices
that are made by faculty across departments contribute to the across-department grading
discrepancies that are highlighted by this study.
III. Potential Implications of the Low Grading Standards in Education Departments
The previous section documents sizeable differences in the grading standards between
education and non-education departments. Unfortunately, an empirical evaluation of the policy
implications seems virtually impossible given that the counterfactual of more-stringent grading
standards does not appear to exist in a meaningful way. For example, the low grading standards in
11 Very broadly considered, even these two mechanisms can be affected by faculty, but if we assume that faculty do not affect individual preferences for major choice, and if we assume that class-size differences are related to discipline-specific training needs, then these two mechanisms can be plausibly treated as being outside of faculty control.
11
education departments may adversely affect the quality of the K-12 teaching workforce; however,
the data lack sufficient variation to investigate this possibility.
Although I cannot provide direct evidence on the link between the grading standards in
education departments and teacher quality in K-12 schools, I draw on the larger research literature
to provide indirect evidence. Most notably, in the general university context, Babcock (2010) shows
that student effort responds negatively to low grading standards. He shows that when students’
grade expectations rise by one grade point, effort decreases by roughly 20 percent (measured by
study time). Extrapolating linearly from Babcock’s result, I predict the effort responses from
education students that would accompany more stringent grading standards in education
departments. A qualification to this analysis, shown in Table 5, is that there are many reasons to
expect Babcock’s analysis to understate students’ effort responses. As such, the predictions in the
table should perhaps be viewed as lower bounds.12
First consider the case where each education department from the convenience sample
raised its grading standards to be in line with the next-highest grading department at the same
university. The corresponding reductions in classroom-level average GPAs in the education
departments at Indiana, Miami and Missouri would be 0.42, 0.26 and 0.54, respectively. Applying
Babcock’s estimate, these differences would correspond to effort increases of between 5 and 11
percent by undergraduate education students. At the other extreme, if the education departments
raised their grading standards to be in line with the lowest-grading departments at their respective
universities, effort would increase by 17 to 23 percent. Perhaps a reasonable expectation is that
education departments bring their grading standards in line with humanities departments, which
12 The main reason to expect Babcock’s findings to understate the effect of increased grading standards is that he identifies his effect using within instructor-course variation. It is also likely that between-instructor and between-course variation in grading standards will be important – his estimates that use this variation are almost twice as large (but they are also more likely to be biased).
12
appear to most closely resemble education departments in terms of class sizes and grades. In this
case, student effort in education departments would increase by 11 to 13 percent.
Under fairly modest assumptions, increases in effort during prospective teachers’
undergraduate training will increase teacher quality in K-12 schools. First, trivially, increased effort
must correspond to increased learning, which appears to be the case (general evidence is available
from Stinebrickner and Stinebrickner, 2008). Second, it must be that either (1) a better
understanding of the content of classes taught in education departments improves teacher quality, or
(2) that indirectly, teachers gain other skills as a result of a more-demanding college experience (e.g.,
skills in time-management or improved work ethics). I am not aware of any direct evidence that
confirms either of these latter points, although recent data collection efforts will facilitate studies
that can provide insight in the near future.13
There may also be other consequences of the low grading standards in education
departments. For one, grades do not provide meaningful information to students about their relative
performance in education classes, meaning that students cannot use their grades to evaluate their fit
in the discipline. Among the general college population, Arcidiacono (2004) empirically establishes
that grades play a role in helping students sort into college majors. In education, however, students
who are not a good fit for the discipline will receive no indication that this is the case from their
grade reports.
Another possibility that merits attention from policymakers and higher-education
administrators is that the low grading standards in education departments may contribute to the
culture of low evaluation standards in education more generally. Although the existence of such a
link is merely speculative at this point, there is a striking similarity between the favorable grades
13 In fact, several states can link teachers to their training institutions, undergraduate and otherwise (examples include Florida, Louisiana, Missouri and Tennessee). Some are already attempting to determine what aspects of training improve teacher performance.
13
awarded to prospective teachers during university training and the favorable evaluations that
teachers receive in K-12 schools. To illustrate the low evaluation standards for K-12 teachers I draw
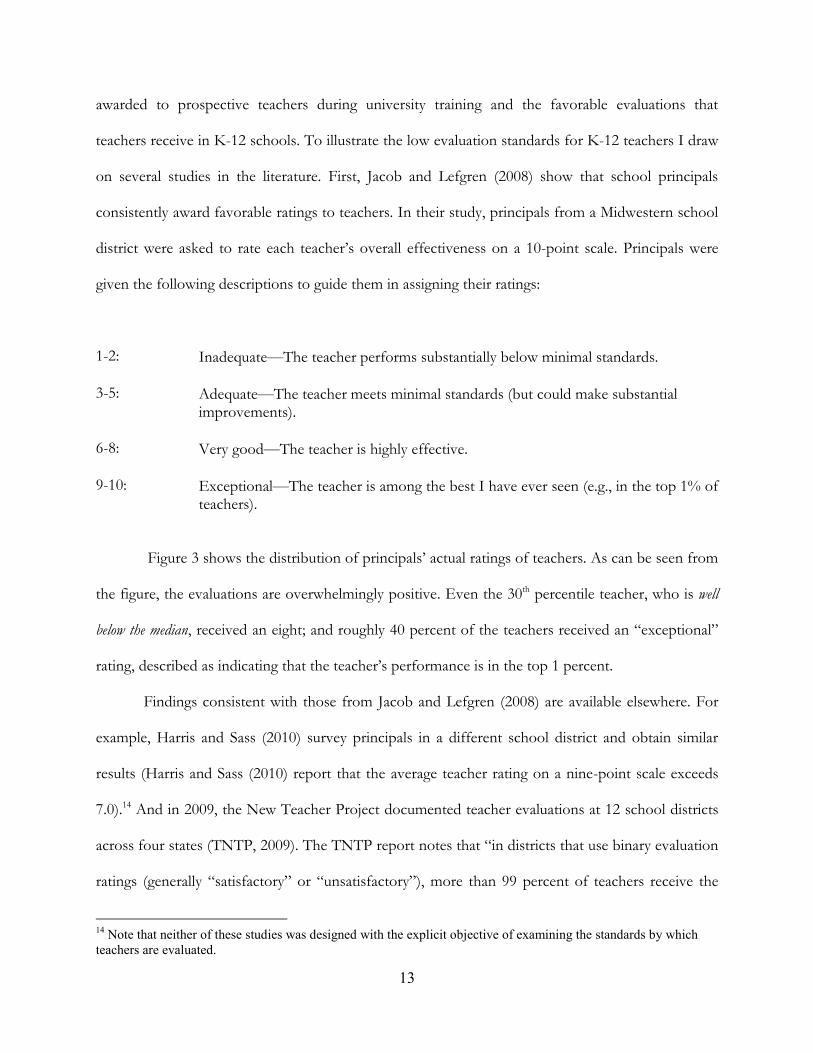
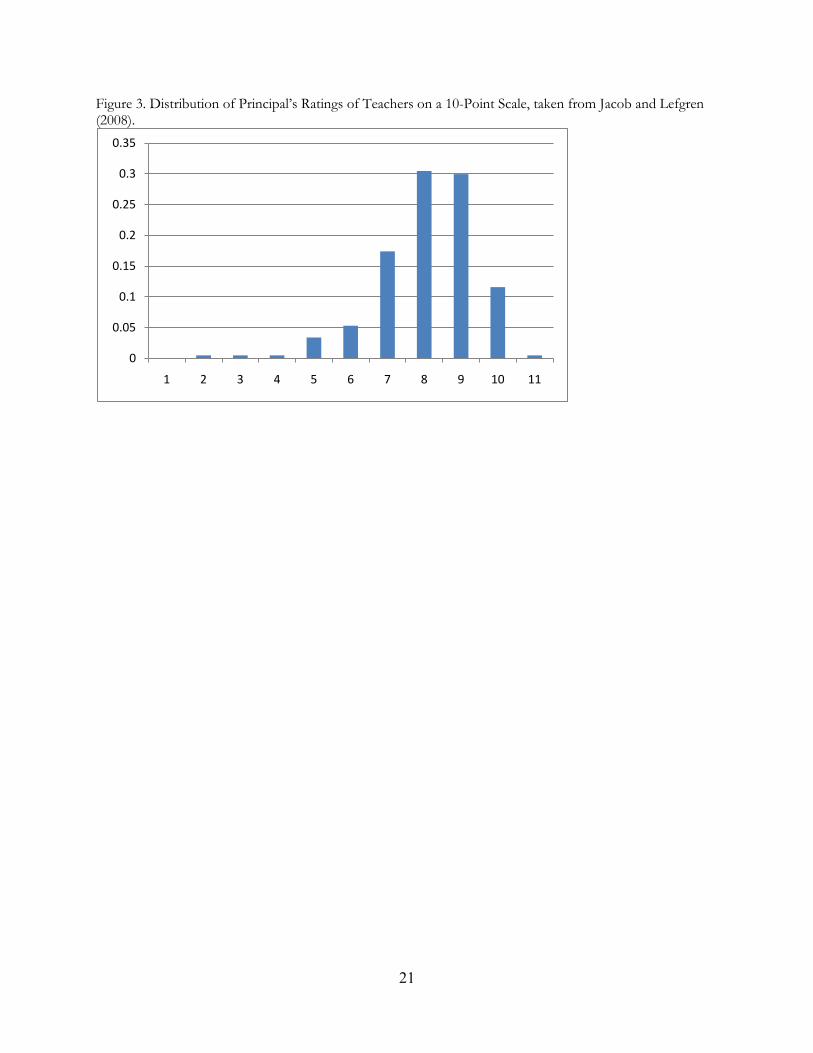
on several studies in the literature. First, Jacob and Lefgren (2008) show that school principals
consistently award favorable ratings to teachers. In their study, principals from a Midwestern school
district were asked to rate each teacher’s overall effectiveness on a 10-point scale. Principals were
given the following descriptions to guide them in assigning their ratings:
1-2: Inadequate—The teacher performs substantially below minimal standards.
3-5: Adequate—The teacher meets minimal standards (but could make substantial improvements).
6-8: Very good—The teacher is highly effective.
9-10: Exceptional—The teacher is among the best I have ever seen (e.g., in the top 1% of teachers).
Figure 3 shows the distribution of principals’ actual ratings of teachers. As can be seen from
the figure, the evaluations are overwhelmingly positive. Even the 30th percentile teacher, who is well
below the median, received an eight; and roughly 40 percent of the teachers received an “exceptional”
rating, described as indicating that the teacher’s performance is in the top 1 percent.
Findings consistent with those from Jacob and Lefgren (2008) are available elsewhere. For
example, Harris and Sass (2010) survey principals in a different school district and obtain similar
results (Harris and Sass (2010) report that the average teacher rating on a nine-point scale exceeds
7.0).14 And in 2009, the New Teacher Project documented teacher evaluations at 12 school districts
across four states (TNTP, 2009). The TNTP report notes that “in districts that use binary evaluation
ratings (generally “satisfactory” or “unsatisfactory”), more than 99 percent of teachers receive the
14 Note that neither of these studies was designed with the explicit objective of examining the standards by which teachers are evaluated.
14
satisfactory rating. Districts that use a broader range of rating options do little better; in these
districts, 94 percent of teachers receive one of the top two ratings and less than 1 percent are rated
unsatisfactory” (TNTP, p. 6).
Murphy and Cleveland (1991) suggest a mechanism by which the low grading standards in
education departments may affect teacher evaluations in K-12 schools. Namely, the low grading
standards may contribute to a cultural norm within the education sector: Murphy and Cleveland
(1991) write “in an organization where the norm is to give high ratings, the rater who defies the
norm might experience disapproval from his or her peers…pressures for non-conformity may be a
significant factor in rating inflation” (Murphy and Cleveland, p. 197). Murphy and Cleveland (1991)
also suggest that strongly held beliefs about how appraisals should be done within an organization
“may make it difficult to change the appraisal system …” (Murphy and Cleveland, p. 181). Although
no causal link can be established given current data, it is worth considering the possibility that
prospective teachers’ lack of exposure to critical evaluations during their university training translates
into expectations that they continue to receive non-critical evaluations in the workforce.15
IV. Conclusion
This paper uses recent administrative grade data to document large GPA gaps between
education departments and other academic departments at universities. Classroom-level average
GPAs in education departments are on the order of 0.5 to 0.8 grade points higher than in other
departments. The GPA gaps do not appear to be explained by differences in student quality across
departments, nor are they driven by the fact that classes in education departments are typically
15 There is a large literature in economics, management and psychology showing that performance evaluations for all workers tend to be inflated and compressed, so this problem is not unique to education (see, for example, Murphy and Cleveland, 1991). Nonetheless, the evaluations for teachers seem particularly lenient and compressed (TNTP, 2009). It is noteworthy that some of the checks and balances that reduce ratings leniency and compression in the private sector are absent in the public sector, including education (for example, see Murphy and Cleveland, 1991; Prendergast, 2002).
15
smaller. The remaining explanation is that the higher GPAs in education classes are the result of low
grading standards in education departments.
The contribution of this study is to empirically document the low grading standards in
education departments. Much work remains in the areas of identifying mechanisms and
understanding policy consequences. In terms of the former, the issue of differences across
departments in instructional philosophy seems like an obvious starting point. Additionally, a better
understanding of how faculty in different departments perceive the role of grades may provide
useful insights.
Understanding of the policy consequences of the favorable grades awarded by education
departments is also important. Because the vast majority of education majors go on to work as
classroom teachers, a first-order issue is to determine if and how the low grading standards in
education departments affect teacher quality in K-12 schools. Based on the larger research literature
I suggest some of the most likely possibilities. These include that the low grading standards (1)
reduce human-capital accumulation during college for prospective teachers, (2) result in inaccurate
performance signals being sent to students in education classes, and (3) affect evaluation standards
for teachers in the workforce. There is a considerable research basis for making the connections in
(1) and (2), although again, there is no direct evidence. Linking the low grading standards in
education departments to the low evaluation standards for teachers in the workforce is more
speculative, although there is some support in the literature for this possibility as well.
In conclusion, the rationale for the low grading standards in education departments is
unclear. Rather than asking why these grading standards should be changed, perhaps the more
reasonable policy question is this: why shouldn’t the grading standards in education departments be changed?
Beyond noting that the current system has considerable inertia, what benefits does it confer? Or, put
differently, if we were to start over with university education, and could choose the grading
16
distributions in each discipline, would we choose the currently-observed discrepancy between
education departments and all other academic departments at universities?
References Aaronson, Daniel, Lisa Barrow and William Sander. (2007). Teachers and Student Achievement in
the Chicago Public High Schools. Journal of Labor Economics 25, 95-135. Arcidiacono, Peter. (2004). Ability Sorting and the Returns to College Major, Journal of Econometrics,
121, 343-375. Babcock, Philip. (2010). Real Costs of Nominal Grade Inflation? New Evidence from Student
Course Evaluations. Economic Inquiry, 48, 983-996. Betts, Julian R. & Grogger, Jeff (2003). The Impact of Grading Standards on Student Achievement,
Educational Attainment, and Entry-Level Earnings. Economics of Education Review, 22, 343-352. Block, J. H., & Anderson, L. W. (1975). Mastery Learning in Classroom Instruction. New York:
Macmillan. Bloom, B. S. (1974). An introduction to mastery learning theory. In J. H. Block (Ed.), Schools, Society,
and Mastery Learning. New York: Holt, Rinehart & Winston. Figlio, David N. and Maurice E. Lucas. (2004). Do High Grading Standards Affect Student
Performance? Journal of Public Economics, 88, 1815-1834. Harris, Douglas and Tim R. Sass. (2010). What Makes for a Good Teacher and Who Can Tell?
Unpublished manuscript, Department of Economics, Florida State University, Tallahassee. Kulik, Chen-Lin, James A. Kulik and Robert Bangert-Drowns. (1990). Effectiveness of mastery
learning programs: A meta-analysis. Review of Educational Research, 60, 265-299. Jacob, Brian and Lars Lefgren. (2008). Principals as Agents: Subjective Performance Assessment in
Education. Journal of Labor Economics, 26, 101-136. Koedel, Cory. (2008). Teacher Quality and Dropout Outcomes in a Large, Urban School District.
Journal of Urban Economics, 64, 560-572. Michaels, James W. (1976). A Simple View of the Teaching Issue. Teaching Sociology, 3, 198-203. Murphy, Kevin R. and Jeanette N. Cleveland. (1991). Performance Appraisal: An Organizational
Perspective. Boston: Allyn and Bacon. Nye, B., Konstantopoulos, S, & Hedges, L.V. (2004). How Large are Teacher Effects? Educational
Evaluation and Policy Analysis, 26, 237-257. Predergast, Candice. (2002). Uncertainty and Incentives. Journal of Labor Economics, 20, S115-S137. Rivkin, Steven, Eric Hanushek and John Kain. (2005). Teachers, Schools and Academic
Achievement. Econometrica, 73, 417-458. Rockoff, Jonah. (2004). The Impact of Individual Teachers on Student Achievement: Evidence from
Panel Data. American Economic Review, 94, 247-252. Slavin, Robert. (1987). Mastery learning reconsidered. Review of Educational Research, 57, 175- 213. Stinebrickner, Ralph and Todd R. Stinebrickner. (2008). The Causal Effect of Studying on Academic
Performance. The B. E. Journal of Economic Analysis and Policy, 8, 1-53. The College Board. (2010). 2010 College-Bound Seniors: Total Group Profile Report. The New Teacher Project. (2009). The Widget Effect: Our National Failure to Acknowledge and
Act on Differences in Teacher Effectiveness. TNTP Policy Report. Weiss, Robert M. and Glen Rasmussen. (1960). Grading Practices in Undergraduate Education
Courses: Are the Standards Too Low? The Journal of Higher Education, 31, 143-149.
17
Koedel Biography: Cory Koedel is an assistant professor of economics at the University of Missouri, Columbia. He received his PhD in economics from the University of California, San Diego in 2007. In 2005, he was awarded a dissertation fellowship from the Spencer Foundation, and in 2008 he won the Outstanding Dissertation Award from the American Educational Research Association (Division L). Koedel has published several papers on teacher quality and teacher performance. In addition to teacher quality, his other research interests include teacher labor markets, school choice and curriculum evaluation.
18
Figure 1. Probability Density Functions of Classroom-Level GPAs by University and Department, Shown from GPA =1 to GPA =4 (Education Departments - solid lines; Math and Science Departments - dashed lines; Social Science Departments – x’s; Humanities Departments - circles). Indiana University
Miami University (OH)
0.5
11.5
1 2 3 4
0.5
11.5
2
1 2 3 4
19
University of Missouri
0.5
11.5
22.5
1 2 3 4
20
Figure 2. Undergraduate Course-Level Grade Distributions from 2007-2008 at Ten Education Departments (Randomly Drawn from a Sample of Education Departments at 50 Large, Public Universities – see Appendix B).
Note: The average course-level GPA across education departments is approximately 3. 66. If the course-level grades are weighted by enrollment within departments, then averaged across departments, the average is 3. 60.
0.5
11.5
2
1 2 3 4
0.5
11.5
2
1 2 3 4
0.5
11.5
2
1 2 3 4
0.5
11.5
2
1 2 3 4
0.5
1
1 2 3 4
0.5
11.5
22.5
1 2 3 4
0.5
11.5
2
1 2 3 4
0.5
11.5
2
1 2 3 4
0.5
11.5
1 2 3 4
0.5
11.5
2
1 2 3 4
21
Figure 3. Distribution of Principal’s Ratings of Teachers on a 10-Point Scale, taken from Jacob and Lefgren (2008).
0
0.05
0.1
0.15
0.2
0.25
0.3
0.35
1 2 3 4 5 6 7 8 9 10 11
22
Table 1. Average Class Sizes, Numbers of Classrooms Observed, and Numbers of Student-by-Classroom Observations that Underlie the Grade Report Data by University and Department.
Math and Science Related Majors Social Science Majors Humanities Majors Educ Bio* Chem* Comp Sci Econ Math Physics Poly Sci Psych Soc Eng Hist Phil Indiana Univ Avg. Class Size 20.0 51.6 88.3 16.9 68.2 31.4 56.5 43.0 46.5 49.4 22.7 40.5 24.9 Number of Classes 451 75 34 50 100 77 31 68 114 53 198 92 28
Student-by-Classroom Obs. 9020 3870 3002 845 6820 2418 1752 2924 5301 2618 4495 3726 697 Miami Univ (OH) Avg. Class Size 21.3 22.2* 55.4* 16.9 43.9 21.4 15.7 34.9 35.0 23.4 24.1 26.5 21.5 Number of Classes 120 21* 36* 39 93 67 11 88 101 35 132 74 19
Student-by-Classroom Obs. 2556 466* 1994* 659 4083 1434 173 3071 3535 819 3181 1961 409 Univ of Missouri Avg. Class Size 29.7 51.6 115.3 27.0 64.6 23.4 80.2 44.7 73.5 70.2 20.0 44.6 30.1 Number of Classes 94 48 16 26 33 66 14 49 79 42 142 57 29
Student-by-Classroom Obs. 2792 2477 1845 702 2132 1544 1123 2190 5807 2948 2840 2542 873
* Miami University (OH) does not have a biology department and combines its chemistry and biochemistry departments. In place of the biology department, I use the microbiology department, and I report data from the “chemistry and biochemistry” department under the “chemistry” label.
23
Table 2. GPA Comparisons Between Education and Other Department Groups. Education Math, Science,
Economics Social Sciences Humanities
Indiana University Weighted Average GPA 3.65 2.88 3.07 2.98 Simple Average GPA 3.66 3.05 3.17 3.07 GPA Gap (simple average) 0.61 0.49 0.59 90th percentile 3.98 3.63 3.79 3.57 75th percentile 3.91 3.37 3.41 3.33 25th percentile 3.49 2.71 2.89 2.79 10th percentile 3.27 2.52 2.69 2.61 Average Class Size 20.0 52.2 46.3 29.4 Average # of Classes per Dept 451 61.2 78.3 106.0 Miami Univ (OH) Weighted Average GPA 3.71 2.89 3.00 3.17 Simple Average GPA 3.73 2.91 3.05 3.20 GPA Gap (simple average) 0.82 0.68 0.53 90th percentile 4.00 3.39 3.61 3.63 75th percentile 3.95 3.18 3.38 3.39 25th percentile 3.58 2.64 2.69 3.00 10th percentile 3.28 2.43 2.49 2.76 Average Class Size 21.3 29.3 31.1 24.0 Average # of Classes per Dept 120 44.5 74.7 75.0 Univ of Missouri Weighted Average GPA 3.73 2.92 3.03 3.12 Simple Average GPA 3.80 2.99 3.12 3.16 GPA Gap (simple average) 0.81 0.68 0.64 90th percentile 4.00 3.52 3.55 3.65 75th percentile 3.97 3.25 3.37 3.40 25th percentile 3.71 2.69 2.88 2.89 10th percentile 3.50 2.55 2.71 2.66 Average Class Size 29.7 60.4 62.8 31.6 Average # of Classes per Dept 94 33.8 56.7 76.0
Notes: Majors included in the “Math, Science, Economics” group are biology, chemistry, computer science, economics, math and physics. Majors included in the “Social Sciences” group are political science, psychology and sociology. Majors included in the “Humanities” group are English, history and political science. Appendix Table A.1 reports disaggregated departmental data.
24
Table 3. Class-Size Adjusted GPA Gaps between Education Departments and Each Department Group at Each University, Based on Simple Averages.
Math, Science, Economics
Social Sciences Humanities
Indiana University 1( 0.0014) GPA Gap 0.61 0.49 0.59 Class-Size Adjusted 0.57 0.46 0.58 Miami Univ (OH) 1( 0.0018) GPA Gap 0.82 0.68 0.53 Class-Size Adjusted 0.80 0.67 0.52 Univ of Missouri 1( 0.0014) GPA Gap 0.81 0.68 0.64 Class-Size Adjusted 0.76 0.63 0.64
Table 4. Predicted Effort Responses to Adjustments to Grading Standards in Education Departments, Based on Simple Averages.
Indiana Univ Miami Univ (OH) Univ of Missouri Education Dept Average GPA 3.66 3.73 3.80 Next-Highest-Grading Department Average GPA 3.24
(Psych) 3.47
(English) 3.26
(Psych) GPA Adjustment Required to Close Gap 0.42 0.26 0.54 Predicted Effort Increase (%) 8 5 11 Lowest-Grading Department Average GPA 2.79
(Econ) 2.58
(Econ) 2.83
(Math) GPA Adjustment Required to Close Gap 0.87 1.15 0.97 Predicted Effort Increase (%) 17 23 19 Math and Science Departments Average GPA 3.05 2.91 2.99 GPA Adjustment Required to Close Gap 0.61 0.82 0.81 Predicted Effort Increase (%) 12 16 16 Social Science Departments Average GPA 3.17 3.05 3.12 GPA Adjustment Required to Close Gap 0.49 0.68 0.68 Predicted Effort Increase (%) 10 14 14 Humanities Departments Average GPA 3.07 3.20 3.16 GPA Adjustment Required to Close Gap 0.59 0.53 0.64 Predicted Effort Increase (%) 12 11 13
25
Appendix A Supplementary Tables
Appendix Table A. 1. Comparisons Between Education and Non-Education Departments.
Math and Science Related Majors Social Science Majors Humanities Majors
Education Biology* Chemistry* Computer Science
Economics Math Physics Political Science
Psychology Sociology English History Philosophy
Indiana University Simple Average GPA 3.66 3.20 2.94 3.15 2.79 3.02 3.19 3.14 3.24 3.12 3.23 3.06 2.92 90th percentile 3.98 3.87 3.36 3.89 3.47 3.57 3.64 3.67 3.97 3.74 3.70 3.61 3.39 75th percentile 3.91 3.57 3.17 3.59 3.05 3.26 3.56 3.34 3.59 3.31 3.49 3.29 3.21 25th percentile 3.49 2.82 2.75 2.78 2.43 2.72 2.75 2.87 2.93 2.86 2.94 2.81 2.62 10th percentile 3.27 2.55 2.52 2.54 2.27 2.55 2.68 2.75 2.66 2.67 2.78 2.65 2.39 Average Class Size 20.0 51.6 88.3 16.9 68.2 31.4 56.5 43.0 46.5 49.4 22.7 40.5 24.9 Number of Classes 451 75 34 50 100 77 31 68 114 53 198 92 28 Student-by-Classroom Obs 9020 3870 3002 845 6820 2418 1752 2924 5301 2618 4495 3726 697 Miami Univ (OH) Simple Average GPA 3.73 2.82* 3.07* 2.86 2.58 2.92 3.23 3.12 3.00 3.02 3.47 3.12 3.02 90th percentile 4.00 3.14* 3.67* 3.35 2.95 3.57 3.65 3.65 3.51 3.67 3.84 3.51 3.54 75th percentile 3.95 2.94* 3.55* 3.14 2.75 3.24 3.46 3.43 3.34 3.37 3.67 3.32 3.18 25th percentile 3.58 2.60* 2.73* 2.60 2.38 2.61 2.90 2.87 2.66 2.53 3.26 2.90 2.84 10th percentile 3.28 2.48* 2.40* 2.26 2.15 2.41 2.86 2.63 2.46 2.38 3.04 2.75 2.48 Average Class Size 21.3 22.2* 55.4* 16.9 43.9 21.4 15.7 34.9 35.0 23.4 24.1 26.5 21.5 Number of Classes 120 21* 36* 39 93 67 11 88 101 35 132 74 19 Student-by-Classroom Obs 2556 466* 1994* 659 4083 1434 173 3071 3535 819 3181 1961 409 Univ of Missouri Simple Average GPA 3.80 3.18 2.86 2.96 2.94 2.83 3.19 2.95 3.26 3.15 3.19 3.12 3.16 90th percentile 4.00 3.73 3.52 3.37 3.45 3.29 3.74 3.37 3.80 3.48 3.67 3.71 3.57 75th percentile 3.97 3.53 3.20 3.14 3.15 3.03 3.44 3.14 3.60 3.36 3.45 3.32 3.43 25th percentile 3.71 2.84 2.58 2.73 2.63 2.61 2.77 2.75 2.93 2.95 2.96 2.89 2.82 10th percentile 3.50 2.72 2.38 2.62 2.47 2.39 2.72 2.53 2.79 2.81 2.70 2.59 2.68 Average Class Size 29.7 51.6 115.3 27.0 64.6 23.4 80.2 44.7 73.5 70.2 20.0 44.6 30.1 Number of Classes 94 48 16 26 33 66 14 49 79 42 142 57 29 Student-by-Classroom Obs 2792 2477 1845 702 2132 1544 1123 2190 5807 2948 2840 2542 873
* Miami University (OH) does not have a biology department and combines its chemistry and biochemistry departments. In place of the biology department, I use the microbiology department, and I report data from the “chemistry and biochemistry” department under the “chemistry” label.
26
Appendix B The 50-University “Universe” for Figure 2
Distributions from 10 randomly drawn universities from this sample are shown in Figure 3. The three universities shown in Figure 1 were purposefully omitted from this sample. Arizona State University, Tempe Campus Boise State University Bowling Green State University - Main Campus California State University, Fresno California State University, Fullerton California State University, Northridge Florida Atlantic University Florida International University Florida State University Georgia State University Illinois State University Kennesaw State University Kent State University Louisiana State University Michigan State University North Carolina State University at Raleigh Northern Arizona University Ohio University Oklahoma State University - Stillwater Purdue University - Main Campus Sam Houston State University Texas A&M University Texas State University, San Marcos Texas Tech University The University of Oklahoma, Norman Campus The University of Texas at Arlington The University of Texas at Austin The University of Texas at El Paso The University of Texas at San Antonio University of Arizona University of California, Berkeley University of California, Davis University of California, Los Angeles
University of Central Florida University of Florida University of Houston University of Illinois at Chicago University of Iowa University of Kentucky University of Maryland, College Park University of Minnesota, Twin Cities University of Nebraska - Lincoln University of North Carolina at Chapel Hill University of North Texas University of Washington, Seattle University of Wisconsin - Madison University of Wisconsin - Milwaukee Utah Valley University West Virginia University Western Kentucky University