Grade Span 05-08 2015-2016 School Performance Reports · 2015-2016 School Performance Reports The...
15
2015-2016 School Performance Reports The New Jersey Department of Education (NJDOE) presents the 2015-16 School Performance Reports. These reports are designed to inform parents, educators and communities about how well a school is performing and preparing its students for college and careers. In particular, the School Performance Reports seek to: Focus attention on metrics that are indicative of college and career readiness. Benchmark a school's performance against other schools that are educating similar students, against district and state-wide outcomes, and against state targets to illuminate and build upon a school's strengths and identify areas for improvement. Improve educational outcomes for students by providing both longitudinal and growth data so that progress can be measured as part of an individual school's efforts to engage in continuous improvement. While the New Jersey School Performance Reports seek to bring more information to educators and stakeholders about the performance of schools, they do not seek to distill the performance of schools into a single metric, a single score, or a simplified conclusion. Instead, the intention is that educators and stakeholders will engage in meaningful conversations about the full range of the data presented. While the School Performance Reports bring attention to important student outcomes, the NJDOE does not collect data about other essential elements of a school, such as the provision of opportunities to participate and excel in extracurricular activities; the development of non-cognitive skills; the pervasiveness of a positive school culture or climate; or the attainment of other employability and technical skills, as many of these data are beyond both the capacity and resources of schools to measure. NJDOE welcomes feedback on the school performance reports: Survey If you have any questions regarding Performance Reports, please contact [email protected] 1 Overview Demographic Academic Achievement Student Growth School Climate College and Career Readiness Grade Span 05-08 State of New Jersey 2015-2016 25-3810-040 MONMOUTH OCEAN TWP Township of Ocean Intermediate School 1200 WEST PARK AVENUE OCEAN, NJ 07712-7296
-
Upload
phungkhuong -
Category
Documents
-
view
213 -
download
0
Transcript of Grade Span 05-08 2015-2016 School Performance Reports · 2015-2016 School Performance Reports The...

2015-2016 School Performance ReportsThe New Jersey Department of Education (NJDOE) presents the 2015-16 School Performance Reports. These reports are designed to inform parents, educators and communities about how well a school is performing and preparing its students for college and careers. In particular, the School Performance Reports seek to:
• Focus attention on metrics that are indicative of college and career readiness.• Benchmark a school's performance against other schools that are educating similar students, against district and state-wide outcomes,
and against state targets to illuminate and build upon a school's strengths and identify areas for improvement.• Improve educational outcomes for students by providing both longitudinal and growth data so that progress can be measured as part of
an individual school's efforts to engage in continuous improvement.
While the New Jersey School Performance Reports seek to bring more information to educators and stakeholders about the performance of schools, they do not seek to distill the performance of schools into a single metric, a single score, or a simplified conclusion. Instead, the intention is that educators and stakeholders will engage in meaningful conversations about the full range of the data presented. While the School Performance Reports bring attention to important student outcomes, the NJDOE does not collect data about other essential elements of a school, such as the provision of opportunities to participate and excel in extracurricular activities; the development of non-cognitive skills; the pervasiveness of a positive school culture or climate; or the attainment of other employability and technical skills, as many of these data are beyond both the capacity and resources of schools to measure.
NJDOE welcomes feedback on the school performance reports: SurveyIf you have any questions regarding Performance Reports, please contact [email protected]
1
Overview Demographic Academic Achievement Student Growth School ClimateCollege and Career Readiness
Grade Span 05-08
State of New Jersey2015-2016
25-3810-040MONMOUTHOCEAN TWP
Township of Ocean Intermediate School
1200 WEST PARK AVENUEOCEAN, NJ 07712-7296

This graph displays the percentages of students by ethnic/racial subgroup defined by the ESEA Waiver.
This graph displays the percentage of students by gender for the past three school years.
This table presents the main languages primarily spoken by students in their home.
2015-2016 Percent
English
Spanish
Creoles and pidgins, French-based
Portuguese
Chinese
Other
This graph displays the percentages of students by special population (Students with Disabilities, Economically Disadvantaged, and English Language Learners) for the past three school years.
2013-14 2014-15 2015-16
Grade 05 262 261 266
Grade 06 270 254 258
Grade 07 334 269 265
Grade 08 288 324 270
UG 26 32 22
Total 1180 1140 1081
This table presents the enrollment count of students by grade for the past three school years. Note: "UG" represents the count of student who were 'on roll' but are educated in ungraded classrooms.
Enrollment by Grade Enrollment by Gender Enrollment by Ethnic/ Racial Subgroup
Enrollment Trends by Special Population Language Diversity
* 2013-2014 and 2014-2015 enrollment data reflects students who were 'on roll' in October of each school year. 2015-2016 enrollment data reflects students who were 'on roll' at the end of the school year.
* An "S" indicates that data doesn't meet suppression rules and an "N" indicates that there's no data to display. 2
Overview Demographic Academic Achievement Student Growth School ClimateCollege and Career Readiness
Grade Span 05-08
State of New Jersey2015-2016
25-3810-040MONMOUTHOCEAN TWP
Township of Ocean Intermediate School
1200 WEST PARK AVENUEOCEAN, NJ 07712-7296

The Academic Achievement section measures the content knowledge that students have in English Language Arts/Literacy (ELA/L) and Mathematics as demonstrated in Partnership for Assessment of Readiness for College and Careers (PARCC) assessments. The PARCC assessment has five Performance Levels. Students performing at levels 4 and 5 (met or exceeded expectations) have demonstrated readiness for the next grade level/course, and are on track for college and careers.
Met/Exceeded Expectations
This table presents the percentage of students who met or exceeded expectations as well as compares the school's performance to schools across the district (with more than 5 schools) and the state.
Mathematics and English Language Arts/ LiteracyThis table presents the total number of valid test scores, the percentage of students who met or exceeded expectations/standards and statewide percentiles (a comparison between the school’s performance and schools across the state) as well as the participation rates for the school and by ethnic/racial subgroup and special population. The participation goals is established as 95% by the United States Department of education.√*= Met participation rate(participation averaging applied)
English Language Arts/Literacy
SUBGROUP
Valid Scores% Meeting Standards
Statewide Percentile
Participation Rate Met Goal?
Schoolwide 912 62% 63 86% X
White 604 68% 66 83% X
African American 93 33% 39 94% √
Hispanic 127 46% 54 89% X
American Indian S S S S
Asian 84 73% 40 94% √
Two or More Races S S S S
Students with Disability 166 19% 53 81% X
English Learner Students S S S S
Economically Disadvantaged Students 215 41% 61 88% X
Academic Achievement Schoolwide Performance
District Percentile Statewide Percentile
English Language Arts Literacy Met or Exceeded Expectations 62% S 63
Mathematics Met or Exceeded Expectations 52% S 57
Mathematics
Valid Scores% Meeting Standards
Statewide Percentile
Participation Rate Met Goal?
918 52% 57 86% X
606 59% 61 83% X
95 19% 32 94% X
129 32% 43 89% X
S S S S
84 69% 35 94% √
S S S S
165 16% 48 80% X
S S S S
217 32% 57 88% X
This section also measures Science as demonstrated in NJ ASK Science assessments.
* An "S" indicates that data doesn't meet suppression rules and an "N" indicates that there's no data to display. 3
Overview Demographic Academic Achievement Student Growth School ClimateCollege and Career Readiness
Grade Span 05-08
State of New Jersey2015-2016
25-3810-040MONMOUTHOCEAN TWP
Township of Ocean Intermediate School
1200 WEST PARK AVENUEOCEAN, NJ 07712-7296

PARCC Performance Distribution - Grade 05This table presents the grade-level performance, as measured by PARCC, in all five performance levels for the school and by ethnic/racial subgroup and special population.
Did Not Yet Meet Expectations Partially Met Expectations Approached Expectations Met Expectations Exceeded Expectations
PARCC ELA
Type Valid Scores
Mean Scale Score
District Mean Scale
Score
State Mean Scale Score
% Level_1 % Level_2 % Level_3 % Level_4 % Level_5 % Met/Exceed
ed Expectation
State % Met/Exceed
ed Expectation
Schoolwide 245 757 757 751 3% 11% 22% 59% 5% 64% 53%
White 162 762 762 758 1% 6% 24% 63% 7% 70% 64%
African American S S S 733 S S S S S S 32%
Hispanic 32 745 745 738 9% 22% 25% 41% 3% 44% 37%
Asian 25 766 766 773 N 4% 16% 80% N 80% 80%
American Indian N N N 750 N N N N N N 53%
Two or More Races S S S 759 S S S S S S 63%
Students with Disability 44 733 733 723 16% 30% 27% 23% 5% 27% 20%
English Language Learners S S S 711 S S S S S S 10%
Economically Disadvantaged Students 65 743 743 735 11% 22% 26% 39% 3% 42% 33%
PARCC MATH
Schoolwide 244 759 759 747 2% 7% 29% 47% 16% 63% 47%
White 162 763 763 753 1% 3% 27% 51% 18% 69% 57%
African American S S S 728 S S S S S S 24%
Hispanic 31 750 750 735 3% 10% 42% 36% 10% 45% 31%
Asian 25 771 771 774 N 4% 16% 56% 24% 80% 80%
American Indian N N N 747 N N N N N N 49%
Two or More Races S S S 754 S S S S S S 56%
Students with Disability 43 738 738 725 5% 26% 37% 26% 7% 33% 19%
English Language Learners S S S 721 S S S S S S 16%
Economically Disadvantaged Students 64 745 745 732 3% 14% 41% 38% 5% 42% 28%
* An "S" indicates that data doesn't meet suppression rules and an "N" indicates that there's no data to display. 4
Overview Demographic Academic Achievement Student Growth School ClimateCollege and Career Readiness
Grade Span 05-08
State of New Jersey2015-2016
25-3810-040MONMOUTHOCEAN TWP
Township of Ocean Intermediate School
1200 WEST PARK AVENUEOCEAN, NJ 07712-7296

PARCC Performance Distribution - Grade 06This table presents the grade-level performance, as measured by PARCC, in all five performance levels for the school and by ethnic/racial subgroup and special population.
Did Not Yet Meet Expectations Partially Met Expectations Approached Expectations Met Expectations Exceeded Expectations
PARCC ELA
Type Valid Scores
Mean Scale Score
District Mean Scale
Score
State Mean Scale Score
% Level_1 % Level_2 % Level_3 % Level_4 % Level_5 % Met/Exceed
ed Expectation
State % Met/Exceed
ed Expectation
Schoolwide 229 750 750 750 5% 14% 27% 45% 10% 54% 52%
White 151 755 755 756 2% 11% 26% 50% 12% 62% 61%
African American 20 729 729 732 15% 30% 30% 25% N 25% 31%
Hispanic 37 741 741 738 11% 14% 38% 32% 5% 38% 37%
Asian 21 747 747 772 10% 19% 14% 48% 10% 57% 79%
American Indian N N N 750 N N N N N N 58%
Two or More Races N N N 755 N N N N N N 60%
Students with Disability S S S 719 S S S S S S 15%
English Language Learners S S S 709 S S S S S S 10%
Economically Disadvantaged Students 51 736 736 735 6% 31% 35% 22% 6% 28% 33%
PARCC MATH
Schoolwide 232 744 744 743 5% 18% 31% 42% 4% 46% 43%
White 152 751 751 750 3% 13% 27% 52% 5% 57% 53%
African American S S S 724 S S S S S S 20%
Hispanic 39 734 734 730 8% 23% 46% 21% 3% 23% 26%
Asian S S S 768 S S S S S S 76%
American Indian N N N 745 N N N N N N 50%
Two or More Races N N N 748 N N N N N N 49%
Students with Disability S S S 717 S S S S S S 13%
English Language Learners S S S 713 S S S S S S 12%
Economically Disadvantaged Students 53 729 729 728 11% 28% 43% 15% 2% 17% 23%
* An "S" indicates that data doesn't meet suppression rules and an "N" indicates that there's no data to display. 5
Overview Demographic Academic Achievement Student Growth School ClimateCollege and Career Readiness
Grade Span 05-08
State of New Jersey2015-2016
25-3810-040MONMOUTHOCEAN TWP
Township of Ocean Intermediate School
1200 WEST PARK AVENUEOCEAN, NJ 07712-7296

PARCC Performance Distribution - Grade 07This table presents the grade-level performance, as measured by PARCC, in all five performance levels for the school and by ethnic/racial subgroup and special population.
Did Not Yet Meet Expectations Partially Met Expectations Approached Expectations Met Expectations Exceeded Expectations
PARCC ELA
Type Valid Scores
Mean Scale Score
District Mean Scale
Score
State Mean Scale Score
% Level_1 % Level_2 % Level_3 % Level_4 % Level_5 % Met/Exceed
ed Expectation
State % Met/Exceed
ed Expectation
Schoolwide 209 759 759 753 8% 9% 14% 44% 25% 69% 56%
White 135 763 763 760 6% 5% 13% 49% 27% 76% 65%
African American 27 737 737 733 15% 26% 26% 19% 15% 33% 35%
Hispanic 25 747 747 739 12% 16% 8% 56% 8% 64% 41%
Asian S S S 781 S S S S S S 84%
American Indian N N N 748 N N N N N N 54%
Two or More Races S S S 759 S S S S S S 63%
Students with Disability 46 720 720 716 30% 33% 11% 24% 2% 26% 16%
English Language Learners S S S 703 S S S S S S 10%
Economically Disadvantaged Students 51 743 743 735 16% 22% 18% 26% 20% 45% 37%
PARCC MATH
Schoolwide 208 745 745 740 9% 14% 26% 45% 7% 52% 39%
White 133 750 750 747 8% 9% 24% 50% 9% 59% 47%
African American 28 724 724 724 18% 32% 32% 18% N 18% 19%
Hispanic 26 734 734 729 12% 19% 39% 31% N 31% 23%
Asian S S S 763 S S S S S S 72%
American Indian N N N 736 N N N N N N 30%
Two or More Races S S S 744 S S S S S S 44%
Students with Disability 46 712 712 713 33% 39% 17% 9% 2% 11% 9%
English Language Learners S S S 711 S S S S S S 10%
Economically Disadvantaged Students 52 734 734 727 15% 23% 27% 33% 2% 35% 21%
* An "S" indicates that data doesn't meet suppression rules and an "N" indicates that there's no data to display. 6
Overview Demographic Academic Achievement Student Growth School ClimateCollege and Career Readiness
Grade Span 05-08
State of New Jersey2015-2016
25-3810-040MONMOUTHOCEAN TWP
Township of Ocean Intermediate School
1200 WEST PARK AVENUEOCEAN, NJ 07712-7296

PARCC Performance Distribution - Grade 08This table presents the grade-level performance, as measured by PARCC, in all five performance levels for the school and by ethnic/racial subgroup and special population.
Did Not Yet Meet Expectations Partially Met Expectations Approached Expectations Met Expectations Exceeded Expectations
PARCC ELA
Type Valid Scores
Mean Scale Score
District Mean Scale
Score
State Mean Scale Score
% Level_1 % Level_2 % Level_3 % Level_4 % Level_5 % Met/Exceed
ed Expectation
State % Met/Exceed
ed Expectation
Schoolwide 233 758 758 753 5% 12% 22% 49% 13% 62% 55%
White 155 763 763 759 3% 10% 19% 52% 16% 68% 63%
African American 24 746 746 732 8% 13% 38% 38% 4% 42% 34%
Hispanic 33 741 741 740 12% 24% 24% 33% 6% 39% 43%
Asian S S S 780 S S S S S S 82%
American Indian N N N 753 N N N N N N 52%
Two or More Races S S S 756 S S S S S S 59%
Students with Disability 36 722 722 715 22% 36% 31% 11% N 11% 16%
English Language Learners S S S 701 S S S S S S 9%
Economically Disadvantaged Students 52 750 750 736 6% 17% 29% 39% 10% 48% 38%
**PARCC MATH
Schoolwide 163 732 732 726 14% 19% 39% 28% N 28% 26%
White 101 736 736 732 9% 18% 42% 32% N 32% 32%
African American 24 719 719 712 33% 21% 25% 21% N 21% 14%
Hispanic 26 726 726 721 15% 27% 39% 19% N 19% 20%
Asian S S S 745 S S S S S S 49%
American Indian N N N 726 N N N N N N 25%
Two or More Races S S S 726 S S S S S S 26%
Students with Disability 36 707 707 704 42% 31% 17% 11% N 11% 8%
English Language Learners S S S 704 S S S S S S 9%
Economically Disadvantaged Students 44 727 727 718 23% 18% 34% 25% N 25% 18%
**Grade 8 does not include students who took an Algebra test.
* An "S" indicates that data doesn't meet suppression rules and an "N" indicates that there's no data to display. 7
Overview Demographic Academic Achievement Student Growth School ClimateCollege and Career Readiness
Grade Span 05-08
State of New Jersey2015-2016
25-3810-040MONMOUTHOCEAN TWP
Township of Ocean Intermediate School
1200 WEST PARK AVENUEOCEAN, NJ 07712-7296

PARCC ELA Performance TrendsThis graph presents the percentage of students who met or exceeded expectations for the past two years.
* An "S" indicates that data doesn't meet suppression rules and an "N" indicates that there's no data to display. 8
Overview Demographic Academic Achievement Student Growth School ClimateCollege and Career Readiness
Grade Span 05-08
State of New Jersey2015-2016
25-3810-040MONMOUTHOCEAN TWP
Township of Ocean Intermediate School
1200 WEST PARK AVENUEOCEAN, NJ 07712-7296

PARCC Performance Distribution - Algebra IThis table presents the End-Of-Course performance, as measured by PARCC, in all five performance levels for the school and by ethnic/racial subgroup and special populations.
Type Valid Scores
Mean Scale Score
District Mean Scale
Score
State Mean Scale Score
% Level_1 % Level_2 % Level_3 % Level_4 % Level_5 % Met/Exceed
ed Expectation
State % Met/Exceed
ed Expectation
Schoolwide 75 778 778 769 N 1% 8% 77% 13% 91% 42%
White 57 781 781 772 N N 5% 81% 14% 95% 51%
African American S S S 748 S S S S S S 20%
Hispanic S S S 746 S S S S S S 25%
Asian S S S 789 S S S S S S 76%
American Indian N N N 769 N N N N N N 40%
Two or More Races N N N 776 N N N N N N 47%
Students with Disability N N N 738 N N N N N N 10%
English Language Learners N N N 723 N N N N N N 9%
Economically Disadvantaged Students S S S 746 S S S S S S 23%
Did Not Yet Meet Expectations Partially Met Expectations Approached Expectations Met Expectations Exceeded Expectations
* An "S" indicates that data doesn't meet suppression rules and an "N" indicates that there's no data to display. 9
Overview Demographic Academic Achievement Student Growth School ClimateCollege and Career Readiness
Grade Span 05-08
State of New Jersey2015-2016
25-3810-040MONMOUTHOCEAN TWP
Township of Ocean Intermediate School
1200 WEST PARK AVENUEOCEAN, NJ 07712-7296
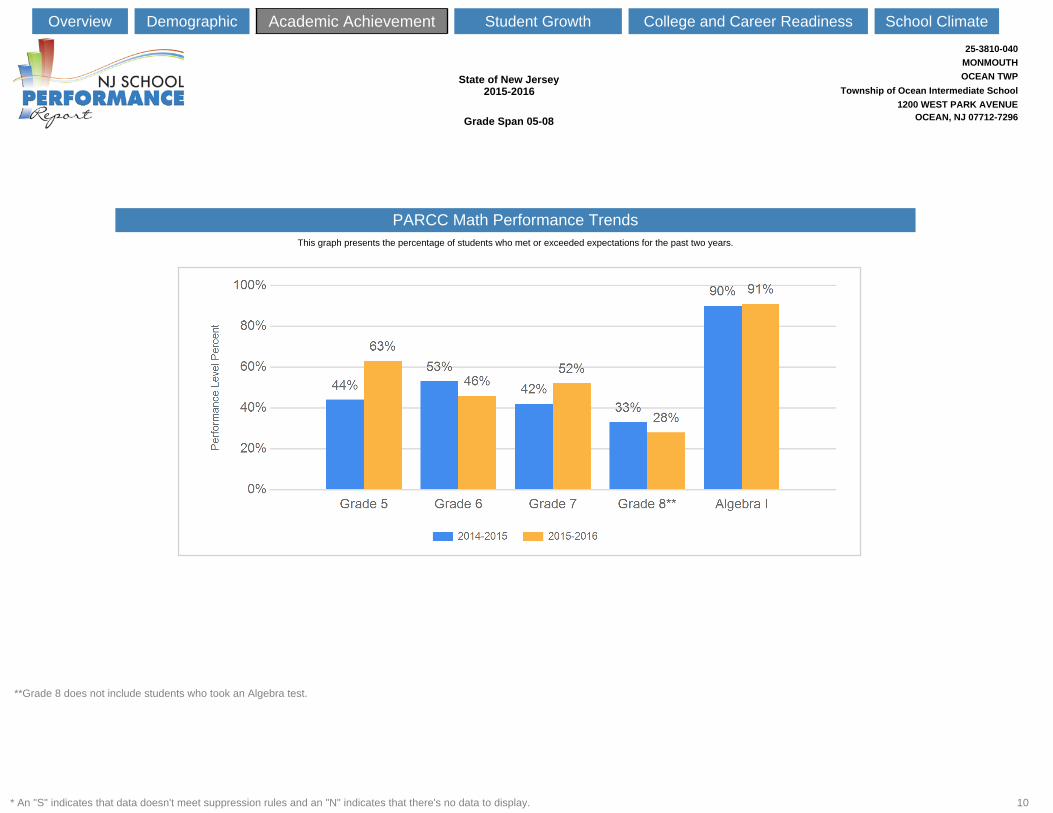
PARCC Math Performance TrendsThis graph presents the percentage of students who met or exceeded expectations for the past two years.
**Grade 8 does not include students who took an Algebra test.
* An "S" indicates that data doesn't meet suppression rules and an "N" indicates that there's no data to display. 10
Overview Demographic Academic Achievement Student Growth School ClimateCollege and Career Readiness
Grade Span 05-08
State of New Jersey2015-2016
25-3810-040MONMOUTHOCEAN TWP
Township of Ocean Intermediate School
1200 WEST PARK AVENUEOCEAN, NJ 07712-7296

Advanced Proficient
Proficient Partially Proficient
Statewide 26% 47% 27%
Schoolwide 26% 53% 21%
White 30% 58% 13%
African American 10% 38% 52%
Hispanic 10% 44% 46%
American Indian N N N
Asian 39% 52% 9%
Two or More Races S S S
Students with Disability N 40% 60%
English Language Learners S S S
Economically Disadvantaged Students 13% 52% 35%
This table presents the percentage of students in each proficiency category , as measured by NJASK, for the school and state and by ethnic/racial subgroup and special population.
NJASK Results Science - Grade Level 08 NJASK Proficiency Trends Science - Grade Level 08This graph displays the percentage of students who scored in each category for the past three school years.
The Academic Achievement section also measures the content knowledge that students have in science as demonstrated in NJASK Science assessment. The assessment has three proficiency categories. Students performing at "Proficient" and "Advanced Proficient" have demonstrated readiness for the next grade-level/course
* An "S" indicates that data doesn't meet suppression rules and an "N" indicates that there's no data to display. 11
Overview Demographic Academic Achievement Student Growth School ClimateCollege and Career Readiness
Grade Span 05-08
State of New Jersey2015-2016
25-3810-040MONMOUTHOCEAN TWP
Township of Ocean Intermediate School
1200 WEST PARK AVENUEOCEAN, NJ 07712-7296
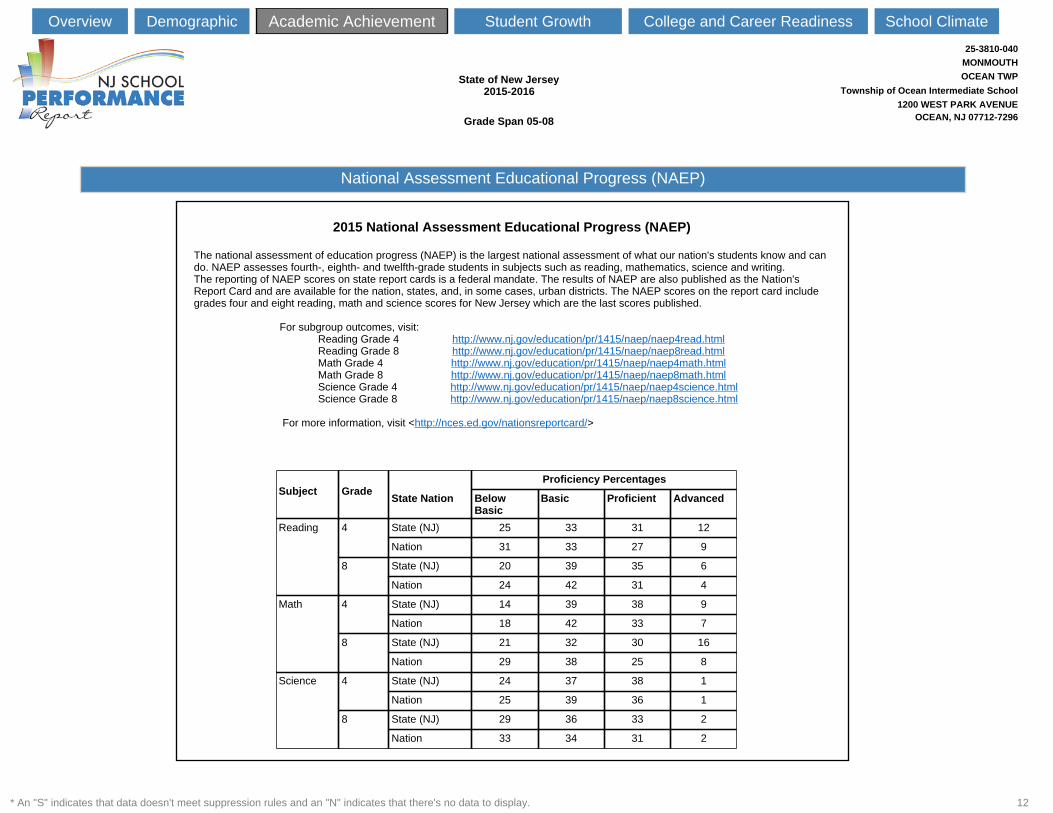
2015 National Assessment Educational Progress (NAEP)
The national assessment of education progress (NAEP) is the largest national assessment of what our nation's students know and can do. NAEP assesses fourth-, eighth- and twelfth-grade students in subjects such as reading, mathematics, science and writing.The reporting of NAEP scores on state report cards is a federal mandate. The results of NAEP are also published as the Nation's Report Card and are available for the nation, states, and, in some cases, urban districts. The NAEP scores on the report card include grades four and eight reading, math and science scores for New Jersey which are the last scores published.
For subgroup outcomes, visit: Reading Grade 4 http://www.nj.gov/education/pr/1415/naep/naep4read.html Reading Grade 8 http://www.nj.gov/education/pr/1415/naep/naep8read.html Math Grade 4 http://www.nj.gov/education/pr/1415/naep/naep4math.html Math Grade 8 http://www.nj.gov/education/pr/1415/naep/naep8math.html Science Grade 4 http://www.nj.gov/education/pr/1415/naep/naep4science.html Science Grade 8 http://www.nj.gov/education/pr/1415/naep/naep8science.html
For more information, visit <http://nces.ed.gov/nationsreportcard/>
Subject GradeProficiency Percentages
State Nation Below Basic
Basic Proficient Advanced
Reading 4 State (NJ) 25 33 31 12
Nation 31 33 27 9
8 State (NJ) 20 39 35 6
Nation 24 42 31 4
Math 4 State (NJ) 14 39 38 9
Nation 18 42 33 7
8 State (NJ) 21 32 30 16
Nation 29 38 25 8
Science 4 State (NJ) 24 37 38 1
Nation 25 39 36 1
8 State (NJ) 29 36 33 2
Nation 33 34 31 2
National Assessment Educational Progress (NAEP)
* An "S" indicates that data doesn't meet suppression rules and an "N" indicates that there's no data to display. 12
Overview Demographic Academic Achievement Student Growth School ClimateCollege and Career Readiness
Grade Span 05-08
State of New Jersey2015-2016
25-3810-040MONMOUTHOCEAN TWP
Township of Ocean Intermediate School
1200 WEST PARK AVENUEOCEAN, NJ 07712-7296

Met/ Exceeded ExpectationsThis table presents the schoolwide median growth score for all students in the school as well as the median for the district and the state.
This section of the performance report presents data about student growth, utilizing the Student Growth Percentile Methodology (SGP). SGP creates a measure of how students progressed in grades 4 through 8 in Language Arts Literacy and in grades 4 through 7 in Math when compared to other students with a similar test score history. Low Growth is defined as a Student Growth Percentile of less than 35, Typical Growth between 35-65 and High Growth is a score higher than 65. A short video explaining the methodology can be found here: http://www.state.nj.us/education/njsmart/performance/
Student Growth ELAThis table presents the interaction between student performance as demonstrated on PARCC and their growth scores.
Student Growth MathThis table presents the interaction between student performance as demonstrated on PARCC and their growth scores.
Growth
(Expectations) Low Typical High
Did Not Yet Meet (L1) 3% 1% 0%
Partially Met (L2) 5% 4% 2%
Approached (L3) 9% 8% 5%
Met (L4) 13% 17% 20%
Exceeded (L5) 1% 3% 8%
Growth
(Expectations) Low Typical High
Did Not Yet Meet (L1) 4% 1% 0%
Partially Met (L2) 7% 5% 2%
Approached (L3) 12% 11% 8%
Met (L4) 9% 14% 19%
Exceeded (L5) 1% 1% 6%
School Growth Indicators School Median
District Median
Statewide Median
Student Growth on Language Arts 51 S 50
Student Growth on Math 51 S 50
* An "S" indicates that data doesn't meet suppression rules and an "N" indicates that there's no data to display. 13
Overview Demographic Academic Achievement Student Growth School ClimateCollege and Career Readiness
Grade Span 05-08
State of New Jersey2015-2016
25-3810-040MONMOUTHOCEAN TWP
Township of Ocean Intermediate School
1200 WEST PARK AVENUEOCEAN, NJ 07712-7296

AbsenteeismThe graph displays the percentage of students by five ranges of absences. An absence is defined as being 'not present' and includes both excused and unexcused absences.
Chronic Absenteeism TrendThis graph presents the percentage of the enrolled students who were chronically absent for the past three years at the school.
Visual and Performing ArtsThis graph on the left displays the percentages of students who were enrolled in at least one of the four arts disciplines within the school and across the state. The graphs on the right show the percentage of students who were enrolled in any Visual and Performing Arts classes within the school and across the state.
Any Visual and Performing ArtsMUSIC
School
State
DRAMASchool
State
DANCESchool
State
VISUAL ARTSSchool
State
* An "S" indicates that data doesn't meet suppression rules and an "N" indicates that there's no data to display. 14
Overview Demographic Academic Achievement Student Growth School ClimateCollege and Career Readiness
Grade Span 05-08
State of New Jersey2015-2016
25-3810-040MONMOUTHOCEAN TWP
Township of Ocean Intermediate School
1200 WEST PARK AVENUEOCEAN, NJ 07712-7296

Length of School Day Instructional Time Student to Staff RatioThis table presents the amount of time a school is in session for a typical student on a normal school day.
This table presents the amount of time that a typical student is engaged in instructional activities under the supervision of a certified teacher. Shared Time students are educated elsewhere than at the school (Ex. vocational schools).
This table presents the count of students per faculty member or administrator in the school. All staff are counted in full-time equivalents.
Student Suspension Rate Student Expulsions Faculty AttendanceThis table presents the percentage of students who were suspended one or more times during the school year.
This table presents the number of students who were expelled from the school during the school year.
This table presents the percentage of days the school faculty were present during the school year.
School
2015-16 6 Hrs. 30 Mins.2015-16 School
Full Time 5 Hrs. 33 Mins.
Shared Time 0 Hrs. 0 Mins.
2015-16 School
Faculty 9:1
Administrator 181:1
School
2015-16 1.5%
School
2015-16 0
School
2015-16 91%
* An "S" indicates that data doesn't meet suppression rules and an "N" indicates that there's no data to display. 15
Overview Demographic Academic Achievement Student Growth School ClimateCollege and Career Readiness
Grade Span 05-08
State of New Jersey2015-2016
25-3810-040MONMOUTHOCEAN TWP
Township of Ocean Intermediate School
1200 WEST PARK AVENUEOCEAN, NJ 07712-7296


![County Summary of submitted School Performance …mogei.org/wp-content/uploads/2018/03/Kator-County...SCoRe Ltd [Date] County Summary of submitted School Performance Reports Period](https://static.fdocuments.in/doc/165x107/5ea401bc7705e901b8579512/county-summary-of-submitted-school-performance-mogeiorgwp-contentuploads201803kator-county.jpg)