Grade 7 Math Review -...
32
NEL 430 Review of Essential Skills from Grade 7: Chapter 1 Factors and Multiples A factor is one of the numbers you multiply in a multiplication operation. The factors of 30 are 1, 2, 3, 5, 6, 10, 15, and 30. A common factor is a number that divides into two or more other numbers with no remainder. For example, 2 is a common factor of 8 and 12. The greatest common factor (GCF) is the greatest whole number that divides into two or more other whole numbers with no remainder. For example, 5 is the GCF of 10 and 25. A common multiple is a number that is a multiple of two or more given numbers. For example, 6, 12, and 24 are common multiples of 2 and 3. The least common multiple (LCM) is the least whole number that has two or more given numbers as factors. For example, 24 is the LCM of 3 and 8. 1. List all the factors of each number. a) 24 b) 35 c) 64 d) 100 2. Use your answers to question 1 to determine the common factors and GCF of each pair of numbers. a) 24 and 64 b) 35 and 100 3. Which numbers are multiples of 4? 20 38 300 128 4. List five common multiples of 3 and 5. 5. Determine the LCM for each set of numbers. a) 2 and 3 b) 3, 6, and 9 Prime and Composite Numbers A number with only two different factors, 1 and itself, is a prime number. For example, 7 7 1, so 7 is a prime number. A number with more than two factors is a composite number. For example, 10 10 1 and 10 5 2, so 10 is a composite number. The number 1 is neither prime nor composite, since 1 1 1. from Grade 7 Chapter 1: Number Relationships Review of Essential Skills 6 5 30 factor factor
Transcript of Grade 7 Math Review -...

NEL430 Review of Essential Skills from Grade 7: Chapter 1
Factors and MultiplesA factor is one of the numbers you multiply in a multiplication operation.The factors of 30 are 1, 2, 3, 5, 6, 10, 15, and 30.
A common factor is a number that divides into two or more othernumbers with no remainder. For example, 2 is a common factor of 8 and12. The greatest common factor (GCF) is the greatest whole numberthat divides into two or more other whole numbers with no remainder.For example, 5 is the GCF of 10 and 25.
A common multiple is a number that is a multiple of two or more givennumbers. For example, 6, 12, and 24 are common multiples of 2 and 3.The least common multiple (LCM) is the least whole number that hastwo or more given numbers as factors. For example, 24 is the LCM of3 and 8.
1. List all the factors of each number.
a) 24 b) 35 c) 64 d) 100
2. Use your answers to question 1 to determine the common factorsand GCF of each pair of numbers.
a) 24 and 64 b) 35 and 100
3. Which numbers are multiples of 4?
20 38 300 128
4. List five common multiples of 3 and 5.
5. Determine the LCM for each set of numbers.
a) 2 and 3 b) 3, 6, and 9
Prime and Composite NumbersA number with only two different factors, 1 and itself, is a prime number.For example, 7 ! 7 " 1, so 7 is a prime number.
A number with more than two factors is a composite number. Forexample, 10 ! 10 " 1 and 10 ! 5 " 2, so 10 is a composite number.
The number 1 is neither prime nor composite, since 1 ! 1 " 1.
from Grade 7
Chapter 1: Number Relationships
Review of Essential Skills
6 " 5 ! 30
factor factor

NEL Review of Essential Skills from Grade 7: Chapter 1 431
6. a) List all the prime numbers from 1 to 15.
b) List all the composite numbers from 1 to 15.
7. Is an odd number always a prime number? Explain.
PowersA numerical expression that shows repeatedmultiplication is called a power. The power 43 is ashorter way of writing 4 " 4 " 4.
A power has a base and an exponent.
8. Use a power to represent each multiplication. Calculate.
a) 2 " 2 " 2 " 2 b) 5 " 5 " 5 c) 7 " 7 d) 12 " 12 " 12
9. Express each number as a power.
a) 25 b) 8 c) 81 d) 1000
10. a) Represent the area of b) Represent the volume ofthis shape as a power. this cube as a power.
Square RootsThe product of a whole number multiplied by itself is a perfect square.For example, 49 is a perfect square because 49 ! 7 " 7.
A square root is a number that, when multiplied by itself, equals the original number.The square root of 49 is represented as !49". !49" ! 7 because 7 " 7 or 72 ! 49.
11. List all the perfect squares from 1 to 100.
12. Determine each square root.
a) !64" b) !121" c) !16" d) !625"
13. Calculate the dimensions of a square that has an area of 144 cm2.
Order of OperationsRules for the Order of Operations (“BEDMAS”)BracketsExponentsDivide and Multiply from left to right.Add and Subtract from left to right.
14. Evaluate each expression.
a) 3 " 5 # 2 $ 6 b) 12 # 8 % 22 c) (12 $ 13) % 5 # 3
3 is the exponent of the power.
43 ! 64
4 is the base of the power.
3 cm
3 cm 2 cm
2 cm2 cm
For example,(6 $ 3)2 % (3 " 9)
! 92 % 27! 81 % 27! 3

A decimal can be written as a fraction by using a denominatorof 10, 100, 1000, …. The denominator used depends on thenumber of decimal places.
710 ! 0.7
NEL432 Review of Essential Skills from Grade 7: Chapter 2
Fractions and DecimalsA proper fraction is a part of a whole. The numerator shows howmany parts of a given size the fraction represents. The denominatortells how many parts the whole set has been divided into.
A decimal is a way of writing a fraction For example,with a denominator that is a multiple of 10.
A fraction can be written as a decimal by first expressing it as anequivalent fraction with a denominator of 10, 100, 1000, …and then representing it using the place value system.
Chapter 2: Proportional Relationships
numerator&34
&denominator
For example,"4
&265& ! &
12040
& and &12040
& ! 0.24
"4
For example,%25
0.225 ! &1202050
& and &1202050
& ! &490&
%251. Express each fraction as a decimal.
a) &190& b) &
12
& c) &14
& d) &35
& e) &34
& f) &1230& g) &
1215&
2. Express each decimal as a fraction.
a) 0.8 b) 0.65 c) 0.25 d) 0.3 e) 0.75 f) 0.44 g) 0.45
3. Arrange the following numbers in order from least to greatest.
a) &12
&, &34
&, &25
&, &170&, &
2225&, &
14
& b) 0.7, 0.35, 0.03, 0.1, 0.82, 0.75
Multiplying with DecimalsTo multiply two decimal numbers without using a calculator,you can multiply either factor by a power of 10 to get awhole number, multiply this whole number by the otherfactor, and then divide your result by the same power of 10.
For example, calculate 0.4 " 3.28.0.4 " 10 ! 44 " 3.28 ! 13.1213.12 % 10 ! 1.312
Therefore, 0.4 " 3.28 ! 1.312.It makes sense that 4 tenths of 3.28is one tenth of 4 times 3.28.
4. Calculate.a) 0.3 " 4.7 b) 0.06 " 2.19 c) 0.265 " 2.48 d) 1.32 " 2.006

Dividing with DecimalsTo divide one decimal by another without using acalculator, you can multiply the divisor by a power of10 to get a whole number, multiply the dividend by thesame power of 10, and then divide.
5. Calculate the following.
a) 14.56 % 0.5 b) 1300.512 % 0.2 c) 33.32 % 3.2 d) 517.5 % 2.4
RatiosA ratio is a way to compare two or more numbers. For example, in agroup of 7 boys and 9 girls, the ratio of boys to girls is 7 : 9, or 7 to 9, or &
79
&.
Equivalent ratios represent the same comparison. The ratios 7 : 9, 14 :18,and 35 : 45 are equivalent ratios.
In any proportion, the number that you can multiply ordivide each term in a ratio by to get the equivalent termin the other ratio is called the scale factor. The scalefactor can be either a whole number or a decimal.
A number sentence that relates two equivalent ratios iscalled a proportion.
6. Express each comparison as a ratio.
a) the number of blue squares to the number of white squares
b) the number of blue squares to the total number of squares
c) the number of white squares to the total number of squares
7. Which ratios are equivalent to 15 : 35?
5 : 7 18 : 42 9 : 21 3 : 7 &164& &
1320&
8. Determine the missing number in each proportion.
a) &49
& ! &8!
1& b) &
294& ! &
!
8& c) &
!
9& ! &
6439& d) &
!
3& ! &
1241&
RatesA rate is a comparison of two quantities measured in different units.Unlike ratios, rates include units. For example, if Sarah ran 5 km in 2 h,then she ran at the equivalent rate of 2.5 km/h.
NEL Review of Essential Skills from Grade 7: Chapter 2 433
For example, calculate 83.5 % 2.5.2.5 " 10 ! 2583.5 " 10 ! 835835 % 25 ! 33.4
Therefore, 83.5 % 2.5 ! 33.4.It makes sense that the number of25 tenths (2.5) in 835 tenths (83.5)is the number of 25 ones in 835.
For example, &79
""
55
& ! &3455&,
so 5 is the scale factor.
For example, &79
& ! &3455& is a proportion.

12. Copy and complete the chart.
NEL434 Review of Essential Skills from Grade 7: Chapter 2
9. Write two equivalent rates for each comparison.
a) 6 goals in 3 games
b) 4 km jogged in 30 min
c) 36 km on 3 L of gas
10. Write a proportion for each situation, and determine the missing term.
a) In 2 h, you can earn $15.00. In 8 h, you can earn $!.
b) Six boxes contain 90 markers. One box contains ! markers.
PercentsA percent is a special ratio that compares anumber to 100 using the % symbol. Forexample, 20 of the 100 squares are shaded.Therefore, 20% of the whole is shaded.
&12000
& ! 0.2 or 20%
11. What percent of the circle is shaded?
Fraction Ratio Decimal Percent
&14
& 0.25
4 : 20 20%6 : 8 0.75
13. Complete each calculation.
a) &35
& ! &1!
00& ! !% b) &
2215& ! &
1!
00& ! !%
14. Write each fraction as a percent.
a) &1290& b) &
15
& c) &1235& d) &
170&
15. Calculate.
a) 25% of 36 b) 15% of 160 c) 30% of ! ! 24 d) 10% of ! ! 14

Reading and Drawing GraphsBefore answering any questions about the information in a graph, youneed to understand the parts of the graph:• what type of graph it is (for example, a pictograph, bar graph,
histogram, line graph, scatter plot, or circle graph)• what the title tells you about the information in the graph• what the labels on the axes mean• what the units for the scales are• what the legend (if there is one) tells you
1. a) What type of graph is shown?
b) How much was the profitfrom CD sales in September?
c) How much was the profitfrom CD sales in November?
d) What is the difference betweenthe profits from DVD sales inOctober and December?
2. a) What type of graph is shown?
b) What distance was travelledin the first 30 min?
c) How long did it take to completethe 135 km trip?
d) What happened between30 and 40 min?
e) Write the rate that comparesthe total distance travelled tothe total time.
NEL Review of Essential Skills from Grade 7: Chapter 3 435
Chapter 3: Collecting, Organizing, andDisplaying Data
30
25
20
15
10
5
0
Prof
it ($
1000
s)
Sept. Oct. Nov.Month
Dec.
Profit from CD and DVD Sales
Profit fromCD sales
Profit fromDVD sales
140
Description of a 135 km Trip
Dis
tanc
e (k
m)
0
20
10 20 30 40Time (min)
40
60
80
100
120
50 60 70 80 90
3. a) What type of graph is shown?
b) How many books does each symbol represent?
c) How many books were checked out of thelibrary in January?
d) In which months was the same number ofbooks checked out?
e) How many books, on average, are checkedout of the library each month?
SeptemberOctoberNovemberDecemberJanuary
= 100 books
Books checked outMonth
Books Checked Out of Library

NEL436 Review of Essential Skills from Grade 7: Chapter 3
4. Last week, Joe recorded the dailyhigh temperatures as shown.
a) What type of graph would youuse to display Joe’s data? Why?
b) Draw this graph.
Scatter PlotsA scatter plot is a graph designed to show a relationshipbetween two variables on a coordinate grid.
5. a) What quantity is represented on the horizontal axisof this scatter plot?
b) What quantity is represented on the vertical axis ofthis scatter plot?
c) Does this scatter plot show a relationship betweenthe two quantities? If so, explain what it is. If not,explain why not.
6. a) Create a scatterplot for the data in this table.
b) Describe therelationship thatyour scatter plotshows.
Sample and PopulationThe total number of individuals or items is called the population.
A sample is a part of a population that is used to make predictions aboutthe whole population.
A census is used to count and question an entire population.
Mean, Median, and ModeThe mean of a set of numbers is a description of the average number inthe set. It is calculated by dividing the sum of the set of numbers by thenumber of numbers in the set.
Day Temperature (°C)
Monday 15Tuesday 17Wednesday 21Thursday 19Friday 23Saturday 23Sunday 20
Year 1928 1932 1936 1948 1952 1956 1960 1964 1968Time (s) 12.2 11.9 11.5 11.9 11.65 11.82 11.18 11.49 11.08
Year 1972 1976 1980 1984 1988 1992 1996 2000 2004Time (s) 11.07 11.08 11.06 10.97 10.54 10.82 10.94 10.75 10.93
70
Time Spent Studying fora Science Test
Test
sco
re (%
)
0 10 20 30 40Time (min)
50
60
50 60 70
100
80
90
Winning Times in Women’s Olympic 100 m Sprint

The middle number in a set of ordered numbers is the median. Whenthere is an even number of numbers, the median is the mean of the twomiddle numbers.
The number that occurs most often in a set of numbers is the mode.There may be more than one mode, or there might be no mode.
7. Determine the mean, median, and mode of each set of data.
a) 4, 9, 5, 9, 6, 8, 9, 11 b) 2, 3, 6, 12, 6, 1, 3, 6, 4
8. These marks were scored by 20 students on a test.
a) Determine the mean, median, and mode ofthis set of data.
b) Create a sample of this set of data. Determinethe mean, median, and mode of your sample.
Stem-and-Leaf PlotsA stem-and-leaf plot organizes numerical data based on place values.The digits that represent the greater values are the stems. The other digitsare the leaves.
For example, a basketball team scores these points in 14 games:129, 108, 114, 125, 132, 107, 97, 127, 108, 124, 117, 94, 99, 108
To put the points in a stem-and-leaf plot, first put them in increasing order:94, 97, 99, 107, 108, 108, 108, 114, 117, 124, 125, 127, 129, 132
Enter the scores in the stem-and-leaf plot. Use an appropriate interval forthe stem. The stem-and-leaf plot of the scores is shown.
9. a) Based on the data shown, howmany students wrote the test?
b) What was the lowest score?What was the highest score?
c) How many students scoredabove 90%?
10. Determine the mean, median, and mode of the data in thestem-and-leaf plot in question 9.
11. The heights, in centimetres, of Arjun’sclassmates are shown.
a) Display the heights in a stem-and-leaf plot.
b) What is the median height?
NEL Review of Essential Skills from Grade 7: Chapter 3 437
Basketball ScoresStem Leaf
9 4 7 910 7 8 8 811 4 712 4 5 7 913 2
This number representsthe score 108.
Math Test Scores(out of 50 points)
Stem Leaf
3 5 6 84 0 2 2 4 5 5 7 8 95 0 0 0
80% 69% 72% 88% 90% 45%58% 92% 73% 66% 100% 78%67% 50% 59% 82% 90% 84%40% 75%
146 129 155 162 138 170 158 154133 156 163 174 160 135 147 152166 168 157 146 157 164
NEL438 Review of Essential Skills from Grade 7: Chapter 4
Pattern Rules for SequencesA sequence is a list of things that are in a logical order or follow apattern. For example, the sequence 1, 3, 5, 7, 9, … is the list of oddnumbers. Each item or number in a sequence is called a term. In thesequence 1, 3, 5, 7, 9, …, the third term is 5. This sequence follows apattern that can be described using an addition rule: “Start at 1. Add 2to each term to get the next number in the sequence.”
1. Describe the pattern rule for each sequence. Write the next three terms.
a) 3, 8, 13, 18, 23, … b) 2, 4, 8, 16, 32, 64, … c) 100, 96, 92, 88, 84, …
2. The pattern rule for a sequence is “Start with 7. Double the termnumber, and subtract 5 to get the next term in the sequence.” Writethe first five numbers in the sequence.
3. The student council held a bake sale to raise money for the UnitedWay. In the first hour, the students sold $120 worth of baked goods.Each hour after that, they sold half of the previous hour’s sales.The sale lasted for 6 h.
a) What were their sales in the second, third, and fourth hours?
b) What were their total sales?
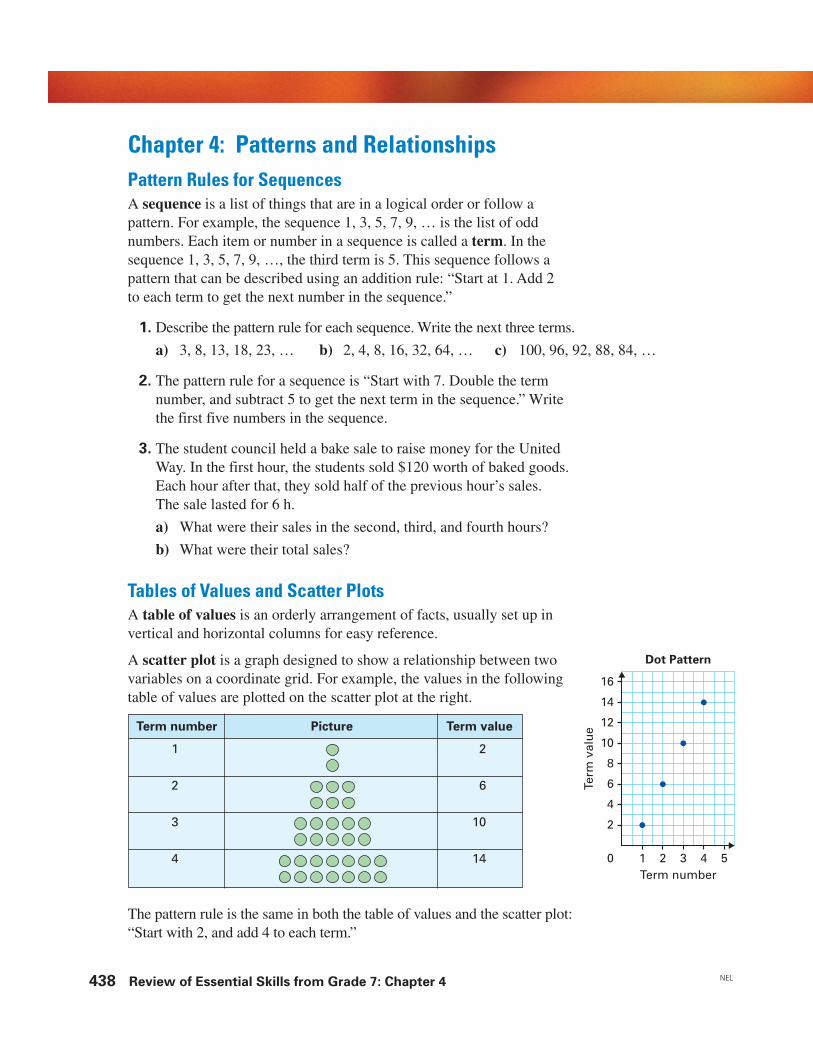
Tables of Values and Scatter PlotsA table of values is an orderly arrangement of facts, usually set up invertical and horizontal columns for easy reference.
A scatter plot is a graph designed to show a relationship between twovariables on a coordinate grid. For example, the values in the followingtable of values are plotted on the scatter plot at the right.
Chapter 4: Patterns and Relationships
Term number Picture Term value
1 2
2 6
3 10
4 14Term number
Term
val
ue
0
2
4
6
8
10
12
14
16
1 2 3 4 5
Dot Pattern
The pattern rule is the same in both the table of values and the scatter plot:“Start with 2, and add 4 to each term.”

4. Maria and Vlad used counters to show asequence of triangular numbers. They madethe following table of values.
a) What are the fifth, sixth, and seventhtriangular numbers? Explain howyou know.
b) Write the pattern rule that uses an“adding on” strategy to describe howyou could calculate any triangularnumber in this sequence.
c) Calculate the 10th triangular number.
NEL Review of Essential Skills from Grade 7: Chapter 4 439
Term valueTerm number (number of
(figure number) Picture counters)
1 1
2 3
3 6
4 10
5. a) Use a table of values to predict thenumber of squares you would need tobuild the sixth figure in this sequence.
b) Explain the pattern rule.
6. Create a scatter plot for the tableof values. Use your scatter plot todetermine the missing values inthe table.
Term number Term value
3 114 145 17
! 20
! 2310 !15 47
7. a) These figures are the first four figures in asequence. Make a table of values to show thenumber of triangles of each colour used tobuild each figure.
b) Draw a scatter plot to show the relationship between the redtriangles in each figure and the term number.
c) Draw a scatter plot to show the relationship between the bluetriangles in each figure and the term number.

6 cm
10 cm
8 cm6.5 cm
5.2 cm
8.0 cm
11.4 cm
NEL440 Review of Essential Skills from Grade 7: Chapter 5
Expressing Measurements in Different UnitsThe metre is the base unit for linear measurements in the metric system.
Chapter 5: Measurement of Circles
1 km 1 hm 1 dam 1 m 1 dm 1 cm 1 mm(kilometre) (hectometre) (decametre) (metre) (decimetre) (centimetre) (millimetre)
1000 m 100 m 10 m 1 m &110& or 0.1 m &
1100& or 0.01 m &
10100& or 0.001 m
To rewrite a smaller unit using a larger unit, divide by the appropriatepower of 10. For example, rewrite 32 mm using centimetres.32 mm % 10 ! 3.2 cm
To rewrite a larger unit using a smaller unit, multiply by the appropriatepower of 10. For example, rewrite 32 m using centimetres.32 m " 102 ! 3200 cm
1. Rewrite each measurement using millimetres.
a) 52 cm ! ! mm c) 71 cm ! ! mm
b) 68 cm ! ! mm d) 73 m ! ! mm
2. Rewrite each measurement using centimetres.
a) 70 mm ! ! cm c) 6 km ! ! cm
b) 105 dm ! ! cm d) 317 m ! ! cm
3. Rewrite each measurement using metres.
a) 7 km ! ! m c) 62 mm ! ! m
b) 79 cm ! ! m d) 872 cm ! ! m
4. Rewrite each measurement using kilometres.
a) 345 m ! ! km c) 205 m ! ! km
b) 8000 m ! ! km d) 26 m ! ! km
PerimeterThe distance around a 2-D shape is called its perimeter. To calculate theperimeter of a shape, add the lengths of all the sides of the shape.
5. Determine the perimeter of each shape.
a) b)

8 m
5 m
6 m7.0 mm
1.5 mm
6. Tony needs to build a dog pen for his puppy. The pen will be arectangle, with sides measuring 5 m and 8 m. How much fencingdoes he need?
AreaThe number of square units needed to cover the surface of a shape is its area.
Area Formulas
NEL Review of Essential Skills from Grade 7: Chapter 5 441
7. What is the area of each shape, in square units?
a) b)
Shape Diagram Formula
triangle A ! (b " h) % 2
square A ! s2
rectangle A ! l " w
parallelogram A ! b " h
trapezoid A ! (a $ b) " h % 2
b
h
s
l
w
b
h
b
a
h
8. Calculate the area of each shape.
a) b)

#10 100
EDCBA
5#5
#5 50 1 3#1#3
#5 50
NEL442 Review of Essential Skills from Grade 7: Chapter 6
Comparing and Ordering IntegersThe set of integers consists of all positive and negative whole numbers,including 0:…, #3, #2, #1, 0, 1, 2, 3, …You can compare integers by placing them on a number line. Forexample, #3 ' #1, because #3 is to the left of #1 on a number line.This can also be written as #1 ( #3.
Chapter 6: Integer Operations
Opposite integers are the same distance away from 0 on a number line.For example, #5 and 5 are opposite integers.
2. Draw a number line, and markeach of the following integers on it.Then list the integers from least to greatest.
9, #3, 7, 0, #5, #8, 3, #2
3. Use ' or ( to make each statement true.
a) #18 ! #13 d) #9 ! 5
b) 12 ! #6 e) #22 ! #24
c) 11 ! 23 f) 16 ! #16
Adding Integers and the Zero PrincipleInteger addition uses the zero principle. The zero principle shows thatthe sum of any two opposite integers is 0. For example, the sum of ($1)and (#1) is 0.
Integer addition can be modelled on a number line.Use a line pointing to the right to represent a positive integer.Use a line pointing to the left to represent a negative integer.
1. Identify the integer that each letter on the number line represents.

For example, calculate (#6) $ ($4).Start at 0 on a number line. Draw a line that is 6 units long and pointsto the left. This represents #6.Then, starting at the point where the first line ends, draw a line that is4 units long and points to the right. This represents $4. The second lineends at #2 on the number line. So, (#6) $ ($4) ! #2. Note that theoverlap of the lines becomes 0, based on the zero principle.
Integer addition can also be modelled with coloured counters, using redfor positive and blue for negative. For example, calculate (#6) $ ($4).Use 6 blue counters to represent #6 and 4 red counters to represent $ 4.
Use the zero principle: a red counter and a blue counter together arecalled a zero pair because their sum is 0. Circle all the zero pairs. Sincethe sum of all the zero pairs is 0, you can remove these counters.
There are 2 blue counters remaining. This represents #2,so (#6) $ ($4) ! #2.
4. Write the addition represented by each model, and calculate the sum.
a)
b)
c)
d)
5. Add using a model.
a) (#6) $ ($10) e) (#16) $ ($16)
b) (#3) $ (#7) f) (#23) $ (#37)
c) ($15) $ (#12) g) ($25) $ (#32)
d) (#3) $ (#8) $ ($11) h) (#25) $ (#18) $ ($41)
NEL Review of Essential Skills from Grade 7: Chapter 6 443
#6
#6
$4
#5#4#3#2#1 $50 $1$2$3$4
zero pair
#6
#6
$9
#5 #4 #3 #2 #1 0 $1 $2 $3 $4
#6
#3
#3
#5 #4 #3 #2 #1 0 $1
# (( )# (
)! )( )
# (! )(!
)
NEL444 Review of Essential Skills from Grade 7: Chapter 6
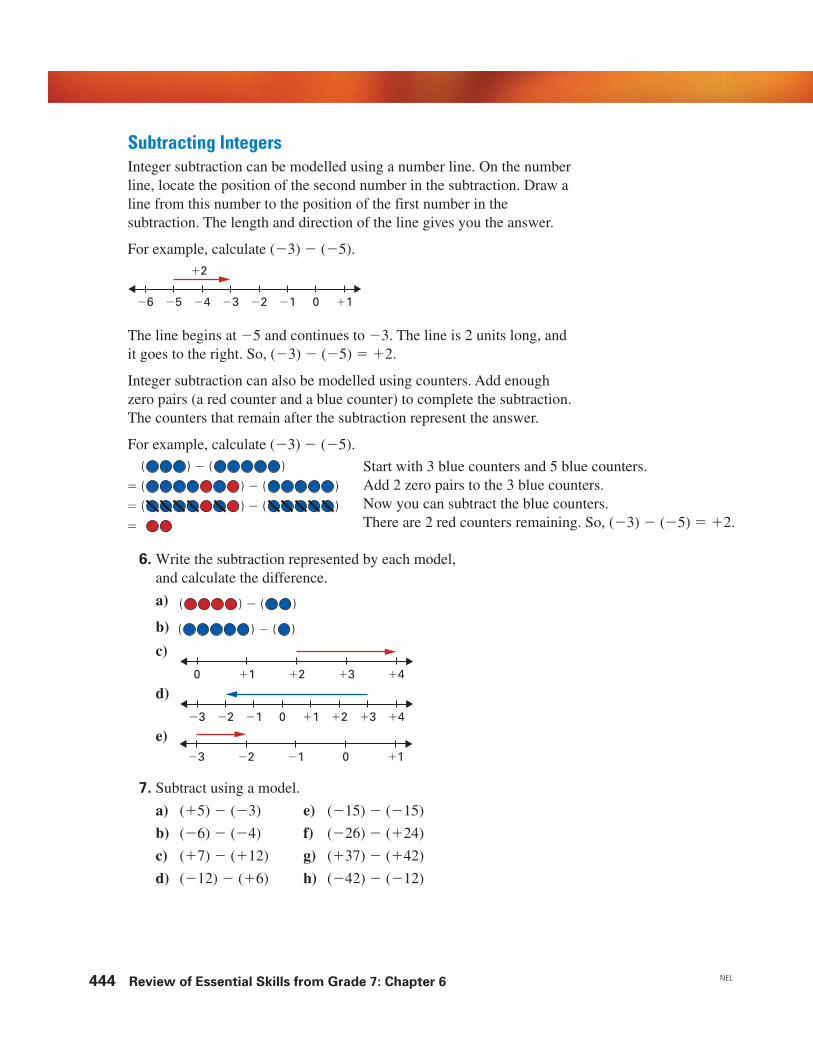
Subtracting IntegersInteger subtraction can be modelled using a number line. On the numberline, locate the position of the second number in the subtraction. Draw aline from this number to the position of the first number in thesubtraction. The length and direction of the line gives you the answer.
For example, calculate (#3) # (#5).
The line begins at #5 and continues to #3. The line is 2 units long, andit goes to the right. So, (#3) # (#5) ! $2.
Integer subtraction can also be modelled using counters. Add enoughzero pairs (a red counter and a blue counter) to complete the subtraction.The counters that remain after the subtraction represent the answer.
For example, calculate (#3) # (#5).
6. Write the subtraction represented by each model,and calculate the difference.
a)
b)
c)
d)
e)
7. Subtract using a model.
a) ($5) # (#3) e) (#15) # (#15)
b) (#6) # (#4) f) (#26) # ($24)
c) ($7) # ($12) g) ($37) # ($42)
d) (#12) # ($6) h) (#42) # (#12)
# ( )( )
# ( )( )
0 $4$3$2$1
#3 #2 #1 0 $1 $2 $3 $4
#3 #2 #1 0 $1
$2
#6 #5 #4 #3 #2 #1 0 $1
Start with 3 blue counters and 5 blue counters.Add 2 zero pairs to the 3 blue counters.Now you can subtract the blue counters.There are 2 red counters remaining. So, (#3) # (#5) ! $2.
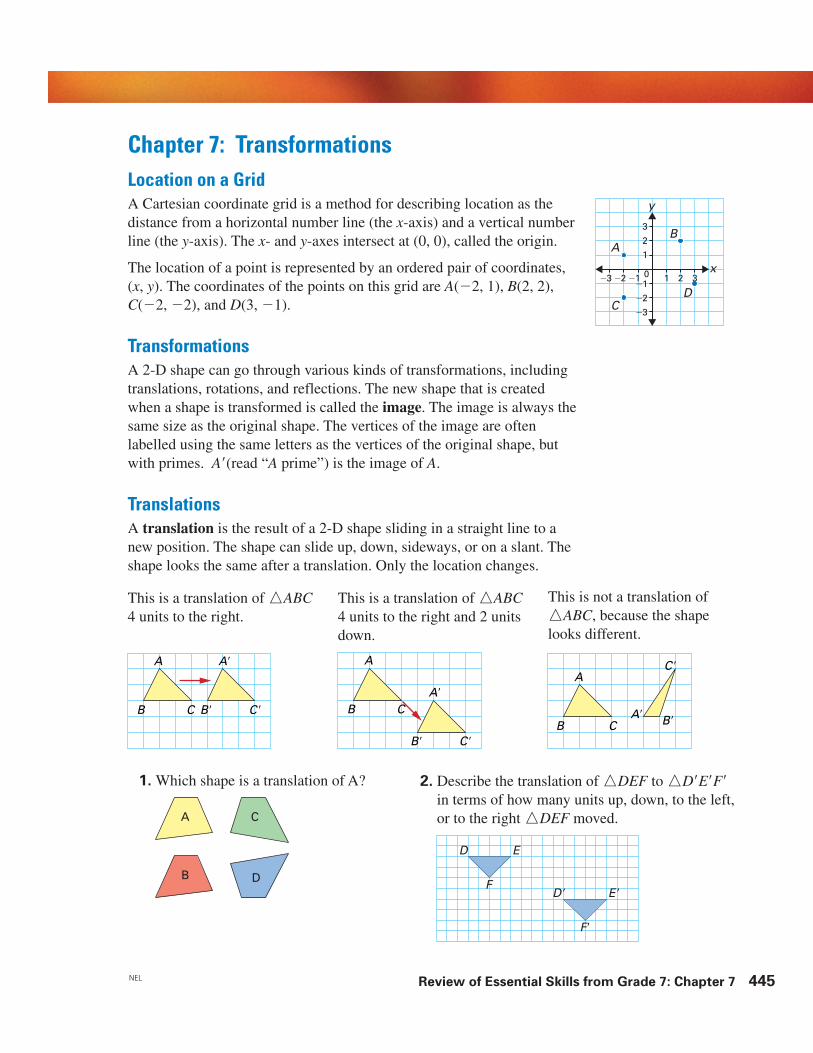
Location on a GridA Cartesian coordinate grid is a method for describing location as thedistance from a horizontal number line (the x-axis) and a vertical numberline (the y-axis). The x- and y-axes intersect at (0, 0), called the origin.
The location of a point is represented by an ordered pair of coordinates,(x, y). The coordinates of the points on this grid are A(#2, 1), B(2, 2),C(#2, #2), and D(3, #1).
TransformationsA 2-D shape can go through various kinds of transformations, includingtranslations, rotations, and reflections. The new shape that is createdwhen a shape is transformed is called the image. The image is always thesame size as the original shape. The vertices of the image are oftenlabelled using the same letters as the vertices of the original shape, butwith primes. A)(read “A prime”) is the image of A.
TranslationsA translation is the result of a 2-D shape sliding in a straight line to anew position. The shape can slide up, down, sideways, or on a slant. Theshape looks the same after a translation. Only the location changes.
NEL Review of Essential Skills from Grade 7: Chapter 7 445
Chapter 7: Transformations
0 x
BA
D
y
#3 #2 #1 1 2
321
#1#2#3C
3
This is a translation of !ABC4 units to the right.
This is a translation of !ABC4 units to the right and 2 unitsdown.
This is not a translation of!ABC, because the shapelooks different.
1. Which shape is a translation of A?
A
B C
A)
B) C)
A
B CA)
B) C)
A
B CA) B)
C)
A
B
C
D
D E
FD) E)
F)
2. Describe the translation of !DEF to !D)E)F)in terms of how many units up, down, to the left,or to the right !DEF moved.

NEL446 Review of Essential Skills from Grade 7: Chapter 7
RotationsA rotation occurs when each point in ashape moves about a fixed point, called thecentre of rotation, through the same angle.In this rotation, for example, !ABC moves90° clockwise through a centre of rotation.
3. Copy parallelogramABCD onto grid paper.Draw its image after atranslation 2 units to theright and 3 units down.
A B
DC
centre ofrotation
A)B)
C)
B
A
C
4. Which shape is not arotation of A? A B
CD
A
C
A)
B)
D
D)
C)
B
5. Describe the rotation ofrectangle ABCD torectangle A)B)C)D) interms of how manydegrees and in whichdirection ABCD wasrotated.

ReflectionsA reflection is the result of a flip of a 2-D shape over a line ofreflection. Each point in the shape is flipped to the oppositeside of the line of reflection, but stays the same distance fromthe line. This is a reflection of !ABC in a vertical line ofreflection.
NEL Review of Essential Skills from Grade 7: Chapter 7 447
P
RS
Q
centre of rotation
line of reflection
A A)
B B)C C)
7. Which shape is a reflection of A?
A B
C
D
8. Copy PQRS onto grid paper. Draw itsimage after a reflection in the line LR.
S
R
L
R
P
Q
6. Copy square PQRS onto grid paper.Draw its image after a rotation of180° about the centre of rotation.
Similarity and CongruenceTwo shapes that are the same shape are similar. Two shapes that are thesame size and shape are congruent.
9. a) Identify the congruent shapes.
b) Identify the similar shapes.
A B
CD E F

NEL448 Review of Essential Skills from Grade 7: Chapter 8
Algebraic ExpressionsAn algebraic expression is the result of applying arithmetic operationsto numbers and variables. For example, in the formula for the area of arectangle, A ! l " w, the variables A, l, and w represent the area, length, andwidth of the rectangle. The algebraic expression l " w shows the calculation.
1. a) What stays the same and what changesin this sequence?
b) Describe the sequence in words.
c) Write an algebraic expression that describes the total number ofcounters in each term of this sequence.
2. a) Describe, in words, the sequence 1, 4, 9, 16, 25, ….
b) Write an algebraic expression that describes how to calculate eachterm in this sequence using its term number.
3. The algebraic expression 3b $ 2 represents a pattern rule. Drawpossible figures for the first three terms in the pattern.
4. Evaluate each expression for c ! 6 and d ! 2.
a) 8c b) 2d # 9 c) c2 $ d
5. Write an algebraic expression for each phrase.
a) the cost of a number of hot dogs that are $2 each
b) the length of a line that increases by 6 units every time
c) the total value of a number of quarters and dimes
Solving Equations by InspectionAn equation is a mathematical statement that two expressions are equal.For example, 5x $ 3 ! 8.
The solution to an equation is the value of the variable that makes theequation true. One way to solve an equation is by inspection, which meansby examining it carefully.
For example, solve 5b # 2 ! 13. If you add 2 to both sides, then 5b mustequal 15. Since 5 " 3 ! 15, then b ! 3.
When you solve an equation, check the solution bysubstituting it into the equation to see if it makes theequation true.
The equation is true when b ! 3, so this solution is correct.
Chapter 8: Equations and Relationships
Figure 1 Figure 2 Figure 3
Check:Left side Right side
5b # 2 13! 5(3) # 2! 13 "

6. Use inspection to solve each equation. Check your solution.
a) n $ 5 ! 9 d) 2x $ 4 ! 10
b) c # 6 ! 4 e) 5v # 2 ! 48
c) 6p ! 54 f) 9s # 4 ! 68
7. To rent a lawn mower, a company charges a fixed rate of $5,plus $2 per day.
a) Write an equation that describes the cost (c) of renting a lawnmower for a certain number of days (d).
b) Write an equation that represents the number of days you canrent a lawn mower for $25.
c) Solve your equation and check your solution.
Solving Equations by Systematic TrialTo solve an equation by systematic trial, you need to predict the solution.Substitute your prediction into the equation, and calculate the result. Ifthe result is too low, then increase your prediction. If the result is toohigh, then decrease your prediction. Repeat this process until you havethe correct solution.
For example, solve 8k # 12 ! 108 using systematic trial.
NEL Review of Essential Skills from Grade 7: Chapter 8 449
Predict k. Evaluate 8k # 12. Is it equal to 108?
20 8(20) # 12 ! 160 # 12 No, it’s too high.! 148
12 8(12) # 12 ! 96 # 12 No, it’s too low.! 84
15 8(15) # 12 ! 120 # 12 I’ve solved it!! 108
8. Use systematic trial to determine the value of the variable ineach equation.
a) c # 25 ! 45 c) 5 $ 4c ! 61
b) 12d ! 156 d) 88 ! 4g # 8
9. The formula for the area of a triangle is A ! (b " h) % 2.
a) Determine the value of b in centimetres, if A ! 12 cm2 andh ! 4 cm.
b) Determine the value of h in centimetres, if A ! 26 cm2
and b ! 13 cm.

0 1
14
13
NEL450 Review of Essential Skills from Grade 7: Chapter 9
Modelling FractionsA variety of models can be used to represent fractions.
For example, each model represents the fraction &38
&.
Adding FractionsTo add fractions, the fractions need to have the same denominator. Ifnecessary, rename the fractions so that they have a common denominator.A common denominator is a common multiple of the two denominators.The numerator of the answer is the sum of the numerators. The denominatorof the answer is the common denominator.
For example, add &25
& $ &110& using fraction strips.
Represent each fraction with a fraction strip.Align the end of one shaded region with thebeginning of the other shaded region.
To get a common denominator, rename the &25
&
fraction strip as &140&. The fraction strips show
that &25
& $ &110& ! &
150&, or &
12
&.
Now add &23
& $ &16
& using number lines.
Use a number line marked in sixths.
Rename &23
& as &46
&. Draw arrows to show
that &46
& $ &16
& ! &56
&.
1. Write the fraction addition, and calculate the sum.
a) b)
Chapter 9: Fraction Operations18
18
18
18
18
18
18
18
10
15
15
15
15
15
110
110
110
110
110
110
110
110
110
110
110
110
110
110
110
110
110
110
110
110
110
110
110
110
110
110
110
110
110
110
110
110
110
110
110
110
110
110
110
110
56
16
23
46!
0 1
2. Add using a model.
a) &25
& $ &35
& b) &78
& $ &38
& c) &34
& $ &12
& d) &25
& $ &34
&
3. Mark has &38
& of a tank of gas. He adds another &12
& of a tank of gas. Is
his tank full? Explain.
14
14
14
14
18
18
18
18
18
18
18
18

Subtracting FractionsTo subtract fractions, use a common denominator. The numerator of theanswer is the difference between the numerators. The denominator of theanswer is the common denominator.
For example, subtract &25
& # &110& using fraction strips.
NEL Review of Essential Skills from Grade 7: Chapter 9 451
110
110
110
110
110
110
110
110
110
110
15
15
15
15
15
110
110
110
110
110
110
110
110
110
110
110
110
110
110
110
110
110
110
110
110
Represent each fraction with a fraction strip. Align the ends of thefraction strips.
Rename the &25
& fraction strip as &140&. The two fraction strips show that the
difference between &25
& and &110& is &
130&.
Subtract &74
& # &23
& using a number line.
Use a number line marked in 12ths. Rename &74
& as &2112&, and rename &
23
& as &182&.
There are 13 spaces between &182& and &
2112&. Each space is &
112&, so &
2112& # &
182& ! &
1132&.
0 21812
2112
4. Write the fraction subtraction, and calculate the difference.
a) b)13
19
19
19
19
19
19
19
19
19
13
13 0 11
287
5. Subtract using a model.
a) &45
& # &35
& b) &78
& # &58
& c) &34
& # &12
& d) &34
& # &15
&
6. Sarah’s pitcher of juice is &78
& full. She pours out a full glass. The glass
holds &14
& of a full pitcher. How full is Sarah’s pitcher now?
NEL452 Review of Essential Skills from Grade 7: Chapter 9
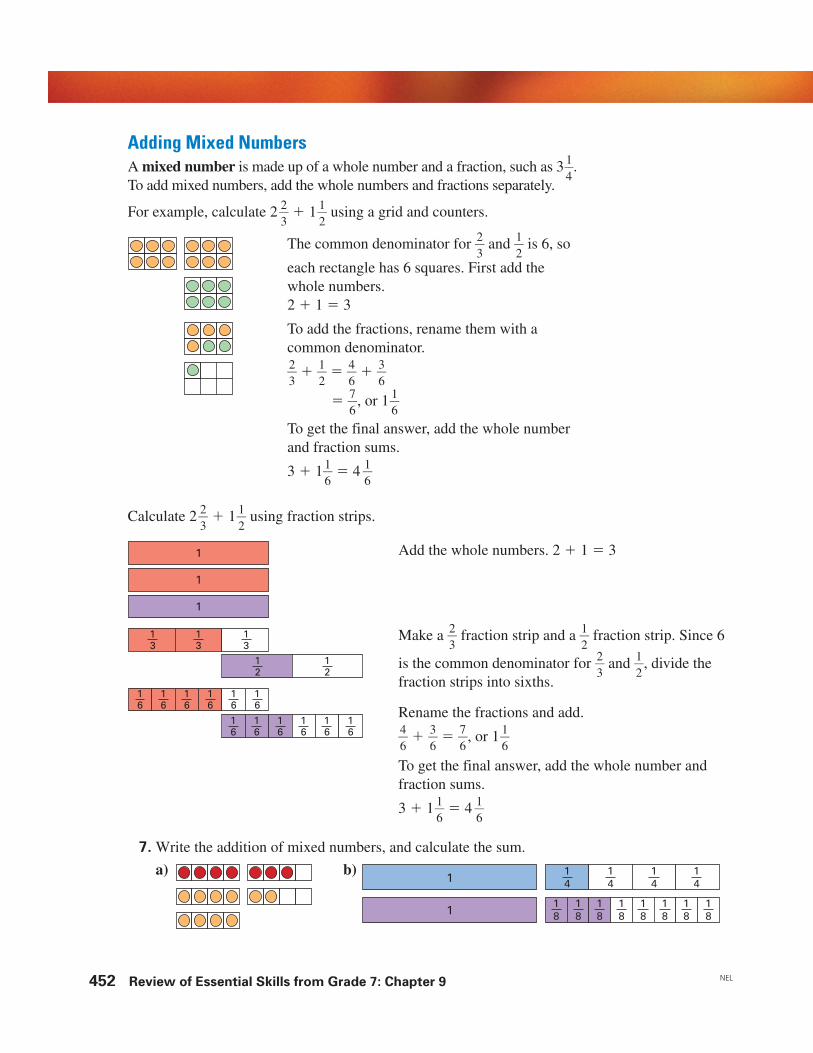
Adding Mixed NumbersA mixed number is made up of a whole number and a fraction, such as 3&
14
&.To add mixed numbers, add the whole numbers and fractions separately.
For example, calculate 2 &23
& $ 1&12
& using a grid and counters.
The common denominator for &23
& and &12
& is 6, so
each rectangle has 6 squares. First add thewhole numbers.2 $ 1 ! 3
To add the fractions, rename them with acommon denominator.
&23
& $ &12
& ! &46
& $ &36
&
! &76
&, or 1&16
&
To get the final answer, add the whole numberand fraction sums.
3 $ 1&16
& ! 4 &16
&
Calculate 2 &23
& $ 1&12
& using fraction strips.
1
1
1
1
312
16
16
16
16
16
16
16
16
16
16
16
16
12
13
13
Add the whole numbers. 2 $ 1 ! 3
Make a &23
& fraction strip and a &12
& fraction strip. Since 6
is the common denominator for &23
& and &12
&, divide thefraction strips into sixths.
Rename the fractions and add.
&46
& $ &36
& ! &76
&, or 1&16
&
To get the final answer, add the whole number andfraction sums.
3 $ 1&16
& ! 4 &16
&
18
18
18
18
18
18
18
18
14
11
1
414
14
7. Write the addition of mixed numbers, and calculate the sum.
a) b)
NEL Review of Essential Skills from Grade 7: Chapter 9 453
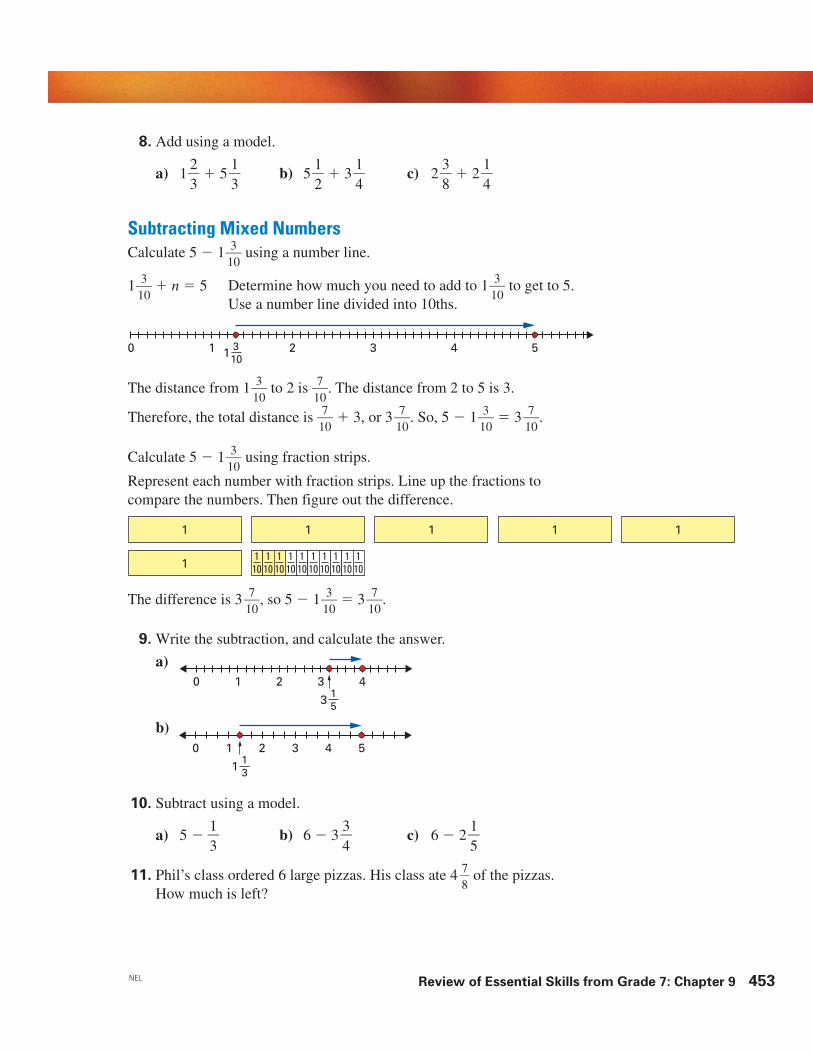
Subtracting Mixed NumbersCalculate 5 # 1&
130& using a number line.
1&130& $ n ! 5
10 2 3 4 53101
Determine how much you need to add to 1&130& to get to 5.
Use a number line divided into 10ths.
1
1
1
1 1 1 1
101
101
101
101
101
101
101
101
101
10
The difference is 3 &170&, so 5 # 1&
130& ! 3 &
170&.
8. Add using a model.
a) 1&23
& $ 5 &13
& b) 5 &12
& $ 3 &14
& c) 2 &38
& $ 2 &14
&
9. Write the subtraction, and calculate the answer.
a)0 1 2 3 4
153
0 1 2 3 4 5131
10. Subtract using a model.
a) 5 # &13
& b) 6 # 3 &34
& c) 6 # 2 &15
&
11. Phil’s class ordered 6 large pizzas. His class ate 4 &78
& of the pizzas.How much is left?
The distance from 1&130& to 2 is &
170&. The distance from 2 to 5 is 3.
Therefore, the total distance is &170& $ 3, or 3 &
170&. So, 5 # 1&
130& ! 3 &
170&.
Calculate 5 # 1&130& using fraction strips.
Represent each number with fraction strips. Line up the fractions tocompare the numbers. Then figure out the difference.
b)

NEL454 Review of Essential Skills from Grade 7: Chapter 9
Multiplying a Whole Number by a FractionMultiply 4 " &
152& using grids and counters.
16
16
16
16
16
16
16
16
16
16
16
16
16
16
16
16
16
16
16
16
16
16
16
16
16
16
16
16
16
16
16
16
16
16
16
16
Multiply 4 " &52
& using a number line.
12. Write the multiplication question, and calculate the answer.
a) b)
0 1 2 3 4 5 6 7 8 9 10 11
13. Multiply using a model.
a) 3 " &12
& b) 6 " &34
& c) 4 " &38
&
14. Every school day, Akiko has a music class that lasts &34
& of an hour.There are 20 school days in a month. How many hours of musiclessons does Akiko have each month?
0 1 2 3 0 1 2 3 4
Multiply 5 " &16
& using fraction strips.
The denominator is 12, so use 3-by-4 rectangles.
Show 4 sets of &152&. Move 7 counters to fill the
empty squares in one rectangle. Move theremaining counters to fill as many squares aspossible in another rectangle. The counters fill
1&182& squares. Therefore, 4 " &
152& ! 1&
182&, or 1&
23
&.
5 " &16
& means 5 sets of &16
&.
Put five &16
& strips together.
Together, they make &56
&.
This shows that 5 " &16
& ! &56
&.
4 " &52
& is 4 sets of &52
&. Use a number line marked in halves.
Draw 4 arrows. Each arrow shows &52
&.
The arrows show that 4 " &52
& ! &2100&, or 10.

Measuring and Constructing AnglesAn angle is formed where two rays intersect at a point called the vertex. Itis the amount of “turn,” in degrees, that is needed to turn one ray onto theother. When naming an angle, the letter that represents the vertex is placedin the middle of the letter sequence, or it can be used on its own. Forexample, this angle can be called !XYZ, !ZYX, or !Y.
A protractor can be used to measure and construct angles.To measure an angle, place the 0° line of the protractoralong one ray, with its centre over the vertex. Look at thescale on the edge to see how many degrees the angle is.For example, !ABC is 45° and !DBC is 140°.
To construct an angle, start by drawing one ray.Then place the 0° line of the protractor along the ray,with its centre at the start of the ray. On the scale of the protractor, locatethe degree that you want the angle to be. Mark a dot on the paper at thisdegree. Then draw a line from the start of the first ray through this dot.
Angles of different measurements have different names.
NEL Review of Essential Skills from Grade 7: Chapter 10 455
Chapter 10: Angles and Triangles
X
Z
Y
0 180
10 170
2016
030
150
4014
0
50
130
60
120
70
110
80
100
100
80110
70120
60130
50 14040 15030 16020 17010
1800
90A
C
D
B
Angle measurement Name of angle
less than 90° acute90° rightbetween 90° and 180° obtuse180° straightbetween 180° and 360° reflex
1. Measure each angle using a protractor.
a) b)A
CB
F
DE
2. Name each type of angle in question 1.
3. Use a protractor to construct each angle.
a) 30° b) 150° c) 85° d) 210°

NEL456 Review of Essential Skills from Grade 7: Chapter 10
Triangles can also be named based on the lengths of their sides.
Name of triangle Description Example
acute triangle All angles are less than 90°.
equilateral triangle All angles are 60°.
obtuse triangle One angle is greater than 90°.
right triangle One angle is 90°.
Name of triangle Description Example
equilateral triangle All sides are equal lengths.
isosceles triangle Two sides are equal lengths.
scalene triangle No sides are equal.
Classifying Triangles and QuadrilateralsTriangles can be named based on their angles.
4. Name each triangle based on their angles and lengths of sides.
a) b) c)
42° 78°
60°
115° 35°
30°
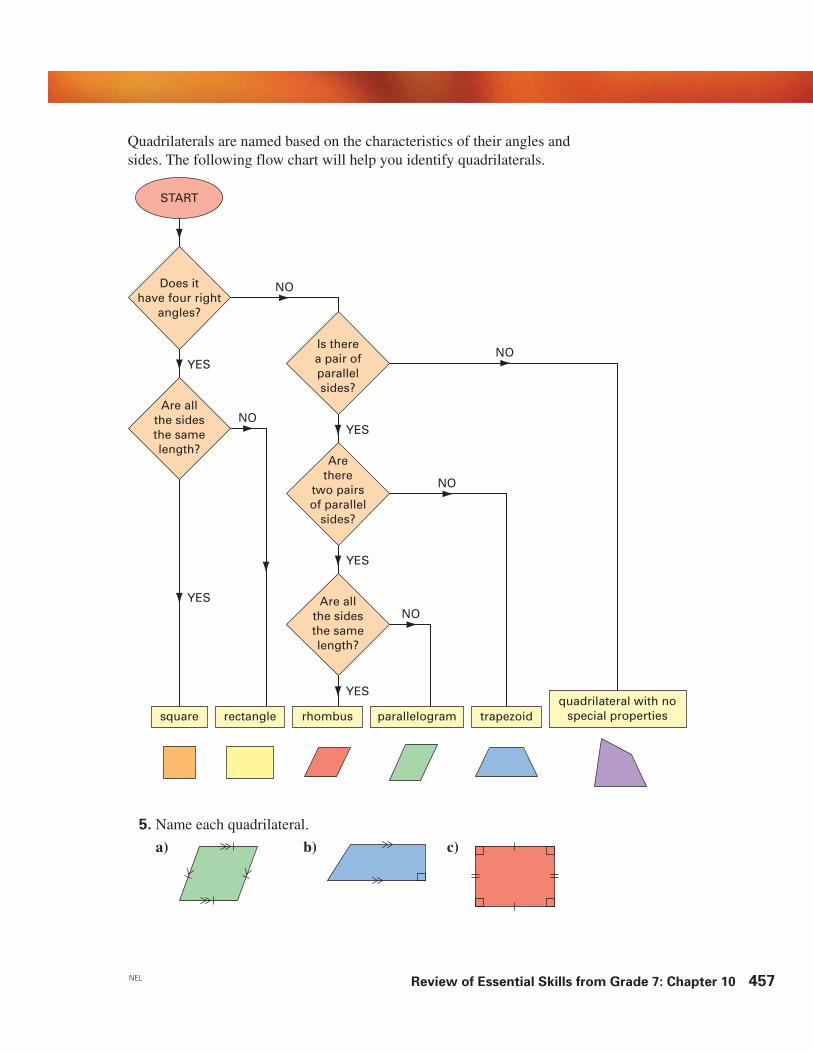
START
square rectangle rhombus trapezoidparallelogramquadrilateral with no
special properties
Does ithave four right
angles?
Are allthe sidesthe samelength?
Is therea pair ofparallelsides?
Arethere
two pairsof parallel
sides?
NOYES
Are allthe sidesthe samelength?
YES
YES
NO
NO
NO
NOYES
YES
5. Name each quadrilateral.
a) b) c)
NEL Review of Essential Skills from Grade 7: Chapter 10 457
Quadrilaterals are named based on the characteristics of their angles andsides. The following flow chart will help you identify quadrilaterals.
72 cm
12 cm
25 cm
1.1 m
2.3 m 1.1 m
8 cm6 cm
16 cm
3 cm
3 cm 3 cm
3 cm
13 cm
32 cm15 cm
5 cm
7.0 cm
4.7 cm
3.3 cm3.3 cm
NEL458 Review of Essential Skills from Grade 7: Chapter 11
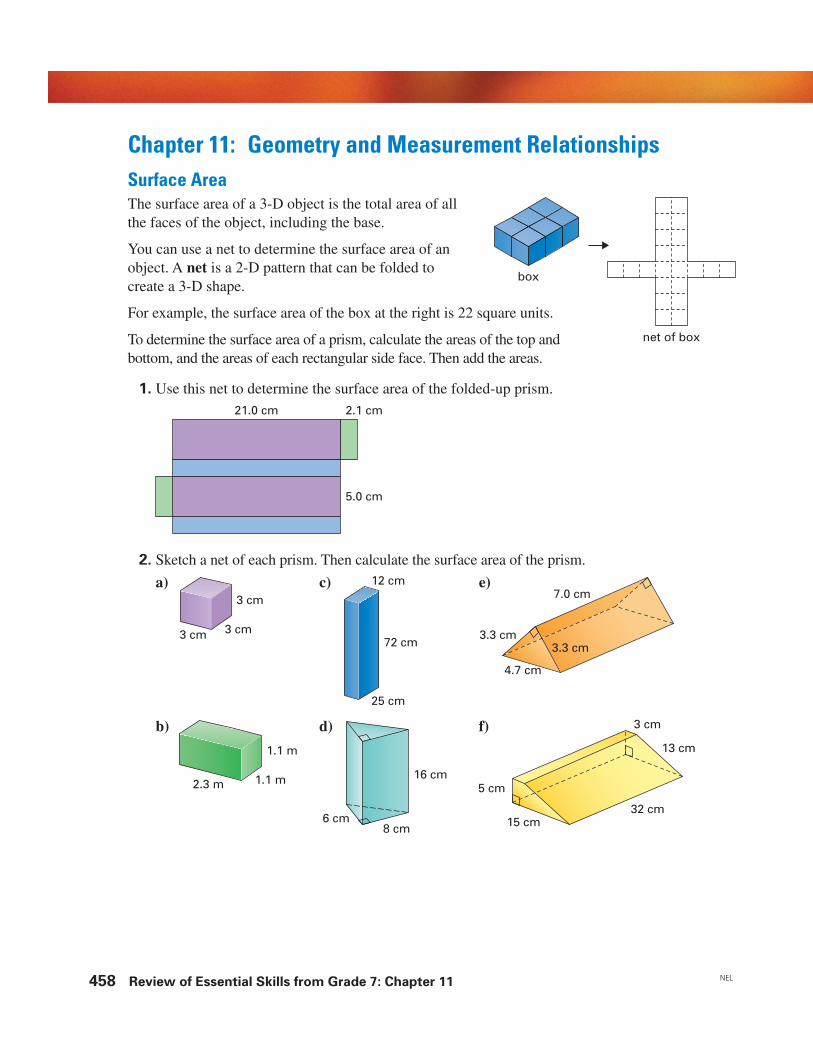
Chapter 11: Geometry and Measurement Relationships
box
net of box
5.0 cm
21.0 cm 2.1 cm
2. Sketch a net of each prism. Then calculate the surface area of the prism.
a) c) e)
b) d) f)
Surface AreaThe surface area of a 3-D object is the total area of allthe faces of the object, including the base.
You can use a net to determine the surface area of anobject. A net is a 2-D pattern that can be folded tocreate a 3-D shape.
For example, the surface area of the box at the right is 22 square units.
To determine the surface area of a prism, calculate the areas of the top andbottom, and the areas of each rectangular side face. Then add the areas.
1. Use this net to determine the surface area of the folded-up prism.

4.6 m 0.5 m
1.2 m
7.5 m 2.5 m
4 m
4 cm
A ! 16 cm2
A ! 30 m2
20 m
12 cm8 cm
18 cm
5 cm
A ! 64 cm2
1.2 m
3.8 m4.2 m
8 cm
A ! 40 cm2
VolumeThe volume of a 3-D object is the total amount of space that is occupiedby the object.
For example, the volume of this box is 6 cubes.
To determine the volume of a prism, multiplythe area of the base by the height of the prism.Volume ! (area of base) " (height)
3. Calculate the volume of each prism. Note that A represents the areaof the base of the prism.
a) c) e)
NEL Review of Essential Skills from Grade 7: Chapter 11 459
b) d) f)
4. Use each net to determine the volume of the folded-up prism.
a)
b)

NEL460 Review of Essential Skills from Grade 7: Chapter 12
ProbabilityProbability is a number between 0 and 1 that tells the likelihood ofsomething happening. Sometimes you can conduct an experiment, suchas tossing a coin or spinning a spinner, to determine probability.
A possible outcome is a single result that can occur in a probabilityexperiment. For example, getting Heads when tossing a coin is a possibleoutcome.
The favourable outcome is the desired result in a probabilityexperiment. For example, if you spin a coloured spinner to see how oftenthe red section comes up, then red is the favourable outcome.
An event is a set of one or more outcomes for a probability experiment.For example, if you roll a cube with the numbers 1 to 6, the event ofrolling an even number has the outcomes 2, 4, or 6.
The experimental probability of an event is the measure of thelikelihood of the event, based on data from an experiment. It is calculatedusing this ratio:
The theoretical probability of an event is the measure of the likelihoodof the event, calculated using this ratio:
The probability of an event can be expressed as a fraction, a decimal, or apercent. The probability of an event is often written as P(X), where X is adescription of the event. For example, if P(H) represents the probabilityof tossing a coin and getting Heads, then P(H) ! &
12
& or 0.5 or 50%.
1. Nesrine conducted an experiment in which she tossed two quarterstogether 50 times. The following chart shows her results.
number of favourable outcomes for the event&&&&&
total number of possible outcomes
number of trials in which event occurred&&&&&total number of trials in the experiment
Chapter 12: Probability
Event Number of occurrences
both coins Heads 10one coin Heads and the other Tails 25both coins Tails 15
a) Determine Nesrine’s experimental probability for each event.
b) Determine the theoretical probability of each event.
c) Which experimental probability is the same as the theoreticalprobability?

2. Determine the theoretical probability of each event for the followingsituations. Write the probability as a fraction, a decimal, and a percent.
NEL Review of Essential Skills from Grade 7: Chapter 12 461
a) Alok spins a spinnernumbered from 1 to 10.The 10 sections of thespinner are equal.i) P(spinning 5)ii) P(spinning a
multiple of 3)iii) P(spinning a prime
number)iv) P(spinning 11)
b) Ellen rolls a 20-sided dienumbered from 1 to 20.i) P(rolling a 15)ii) P(rolling an even
number)iii) P(rolling a number
divisible by 5)
c) Paul selects one coin.
i) P(dime)ii) P(copper coloured
coin)iii) P(silver coloured
coin)
Tree DiagramsA tree diagram is a way to record and count all the possible combinationsof events. For example, the tree diagram at the right shows all the possibleoutcomes of a three-child family.
This tree diagram shows that there are eight possibleoutcomes. You can use it to determine probabilities.
For example,P(all 3 children are boys) ! &
18
&
3. Use the tree diagram at the right to determineeach probability.a) P(3 girls) c) P(at least 1 girl)b) P(1 boy and 2 girls) d) P(all boys or all girls)
4. Indira spins the spinner shown and rolls a die.
a) Create the tree diagram that shows all the possibleoutcomes for one spin and one roll.
b) Determine each probability below.i) P(the spinner is red and the die is 5)ii) P(the spinner is green and the die is even)iii) P(the spinner is orange or yellow and the die is greater than 3)iv) P(the spinner is not red and the die is a multiple of 2)
c) Explain why P(the spinner is yellow and the die is 7) ! 0.
5. Bill rolls a pair of dice and calculates the sum of the two numbers.
a) List all the possible sums.
b) Draw a tree diagram that shows all the possible outcomes.
c) Determine the probability that Bill will toss a sum of 7.
1st child 2nd child 3rd child Outcome
BBB
BBG
BGB
BGG
boyboy
girl
boygirl
boy
girl
GBB
GBG
GGB
GGG
boyboy
girl
girlgirl
boy
girl