Grade 3 Curriculum Guide - Home - Prince William … Curriculum Guide Introduction Prince William...
44
Grade 3 Curriculum Guide SY 2011-12 through SY 2017-18 Mathematics
-
Upload
truongkiet -
Category
Documents
-
view
216 -
download
2
Transcript of Grade 3 Curriculum Guide - Home - Prince William … Curriculum Guide Introduction Prince William...

Grade 3
Curriculum Guide
SY 2011-12 through SY 2017-18
Mathematics
Mathematics Curriculum Guide Introduction
Prince William County Schools The Mathematics Curriculum Guide serves as a guide for teachers when planning instruction and assessment. It defines the content knowledge, skills, and understandings that are measured by the Standards of Learning assessment. It provides additional guidance to teachers as they develop an instructional program appropriate for their students. It also assists teachers in their lesson planning by identifying essential understandings, defining essential content knowledge, and describing the intellectual skills students need to use. This Guide delineates in greater specificity the content that all teachers should teach and all students should learn. The format of the Curriculum Guide facilitates teacher planning by identifying the key concepts, knowledge, and skills that should be the focus of instruction for each objective. The Curriculum Guide is divided into sections: Curriculum Information, Essential Knowledge and Skills, Key Vocabulary, Essential Questions and Understandings, and Teacher Notes and Elaborations. Resources and Sample Instructional Strategies and Activities are included in the Unit Guides. The purpose of each section is explained below. Curriculum Information: This section includes the objective and SOL Reporting Category. Essential Knowledge and Skills: Each objective is expanded in this section. What each student should know and be able to do in each objective is outlined. This is not meant to be either an exhaustive list or a list that limits what is taught in the classroom. This section is helpful to teachers when planning classroom assessments as it is a guide to the knowledge and skills that define the objective. Key Vocabulary: This section includes vocabulary that is key to the objective and many times the first introduction for the student to new concepts and skills. Essential Questions and Understandings: This section delineates the key concepts, ideas and mathematical relationships that all students should grasp to demonstrate an understanding of the objectives. Teacher Notes and Elaborations: This section includes background information for the teacher. It contains content that is necessary for teaching this objective and may extend the teachers’ knowledge of the objective beyond the current grade level. It may also contain definitions of key vocabulary to help facilitate student learning.

FOCUS K-3_______________STRAND: NUMBER AND NUMBER SENSE___________GRADE LEVEL 3
Students in grades K–3 have a natural curiosity about their world, which leads them to develop a sense of number. Young children are
motivated to count everything around them and begin to develop an understanding of the size of numbers (magnitude), multiple ways
of thinking about and representing numbers, strategies and words to compare numbers, and an understanding of the effects of simple
operations on numbers. Building on their own intuitive mathematical knowledge, they also display a natural need to organize things
by sorting, comparing, ordering, and labeling objects in a variety of collections.
Consequently, the focus of instruction in the number and number sense strand is to promote an understanding of counting,
classification, whole numbers, place value, fractions, number relationships (“more than,” “less than,” and “equal to”), and the effects
of single-step and multistep computations. These learning experiences should allow students to engage actively in a variety of
problem solving situations and to model numbers (compose and decompose), using a variety of manipulatives. Additionally, students
at this level should have opportunities to observe, to develop an understanding of the relationship they see between numbers, and to
develop the skills to communicate these relationships in precise, unambiguous terms.
GRADE 3 CURRICULUM GUIDE PRINCE WILLIAM COUNTY SCHOOLS
Curriculum Information
Essential Knowledge and Skills
Key Vocabulary
Essential Questions and Understandings
Teacher Notes and Elaborations
Strand
Number and Number Sense
SOL Reporting Category
Number and Number Sense
Virginia SOL 3.1
The student will
a) read and write six-digit numerals
and identify the place value and
value of each digit;
b) round whole numbers, 9,999 or less,
to the nearest ten, hundred, and
thousand; and
c) compare two whole numbers
between 0 and 9,999, using symbols
(>, <, or = ) and words (is greater
than, is less than, or is equal to).
Foundational Objectives
2.1
The student will
a. read, write, and identify the place
value of each digit in a three-digit
numeral, using numeration models;
b. round two-digit numbers to the
nearest ten; and
c. compare two whole numbers
between 0 and 999, using symbols
(>, <, or =) and words (is greater
than, is less than, or is equal to).
1.1
The student will
b. group a collection of up to 100
objects into tens and ones and write the
corresponding numeral to develop an
understanding of place value.
The student will use problem solving,
mathematical communication,
mathematical reasoning, connections
and representations to
Investigate and identify the place and
value for each digit in a six-digit
numeral, using Base-10 manipulatives
(e.g., Base-10 blocks).
Use the patterns in the place value
system to read and write numbers.
Write six-digit numbers in expanded
notation.
Read six-digit numerals orally.
Write six-digit numerals that are stated
verbally, written in words or expanded
form.
Round a given whole number, 9,999 or
less, to the nearest ten, hundred, and
thousand.
Solve problems, using rounding of
numbers, 9,999 or less, to the nearest
ten, hundred, and thousand.
Determine which of two whole num-
bers between 0 and 9,999 is greater.
Determine which of two whole
numbers between 0 and 9,999 is less.
Compare two whole numbers between
0 and 9,999, using symbols >, <, or =.
Use the terms is greater than, is less
than, and is equal to when comparing
two whole numbers.
Key Vocabulary
digit hundreds
hundred thousands is equal to (=)
is greater than (>) is less than (<)
ones place value
round tens
ten thousands thousands
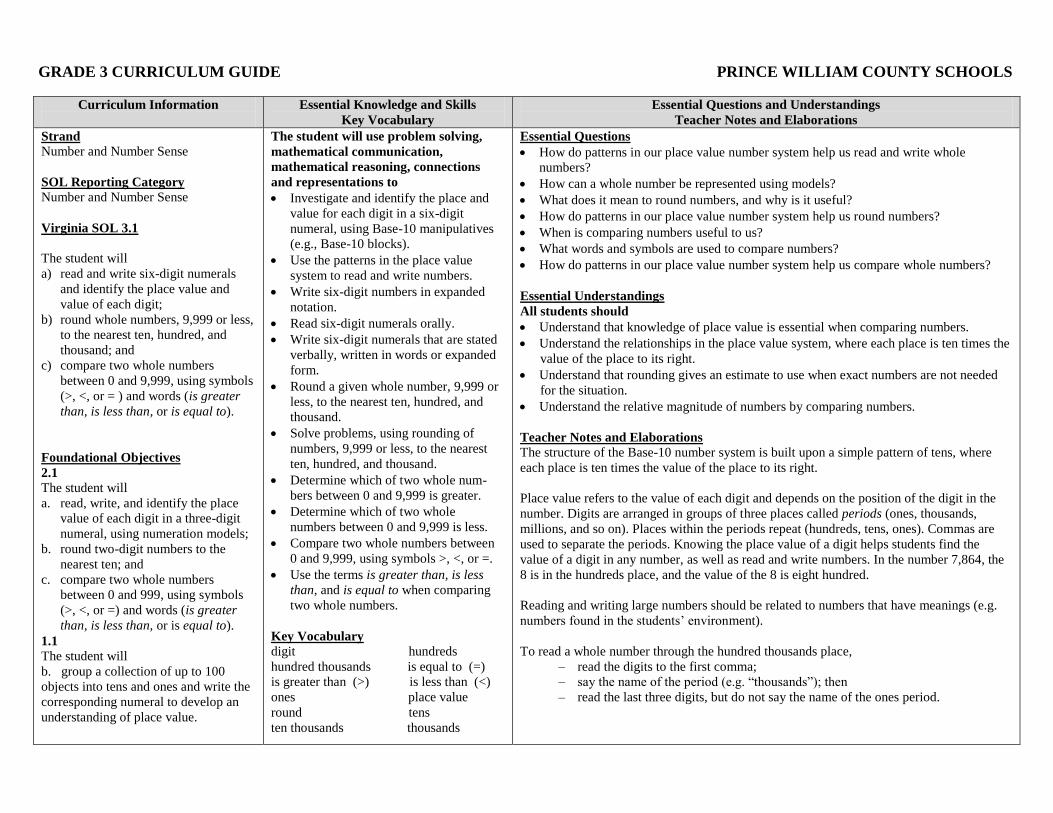
Essential Questions
How do patterns in our place value number system help us read and write whole
numbers?
How can a whole number be represented using models?
What does it mean to round numbers, and why is it useful?
How do patterns in our place value number system help us round numbers?
When is comparing numbers useful to us?
What words and symbols are used to compare numbers?
How do patterns in our place value number system help us compare whole numbers?
Essential Understandings
All students should
Understand that knowledge of place value is essential when comparing numbers.
Understand the relationships in the place value system, where each place is ten times the
value of the place to its right.
Understand that rounding gives an estimate to use when exact numbers are not needed
for the situation.
Understand the relative magnitude of numbers by comparing numbers.
Teacher Notes and Elaborations
The structure of the Base-10 number system is built upon a simple pattern of tens, where
each place is ten times the value of the place to its right.
Place value refers to the value of each digit and depends on the position of the digit in the
number. Digits are arranged in groups of three places called periods (ones, thousands,
millions, and so on). Places within the periods repeat (hundreds, tens, ones). Commas are
used to separate the periods. Knowing the place value of a digit helps students find the
value of a digit in any number, as well as read and write numbers. In the number 7,864, the
8 is in the hundreds place, and the value of the 8 is eight hundred.
Reading and writing large numbers should be related to numbers that have meanings (e.g.
numbers found in the students’ environment).
To read a whole number through the hundred thousands place,
– read the digits to the first comma;
– say the name of the period (e.g. “thousands”); then
– read the last three digits, but do not say the name of the ones period.

GRADE 3 CURRICULUM GUIDE PRINCE WILLIAM COUNTY SCHOOLS
Curriculum Information
Essential Questions and Understandings
Teacher Notes and Elaborations
Strand
Number and Number Sense
SOL Reporting Category
Number and Number Sense
Virginia SOL 3.1
The student will
a) read and write six-digit numerals
and identify the place value and
value of each digit;
b) round whole numbers, 9,999 or less,
to the nearest ten, hundred, and
thousand; and
c) compare two whole numbers
between 0 and 9,999, using symbols
(>, <, or = ) and words (is greater
than, is less than, or is equal to).
Foundational Objectives
2.1
The student will
d. read, write, and identify the place
value of each digit in a three-digit
numeral, using numeration models;
e. round two-digit numbers to the
nearest ten; and
f. compare two whole numbers
between 0 and 999, using symbols
(>, <, or =) and words (is greater
than, is less than, or is equal to).
1.1
The student will
b. group a collection of up to 100
objects into tens and ones and write the
corresponding numeral to develop an
understanding of place value.
Teacher Notes and Elaborations (continued)
Whole numbers may be written in a variety of formats:
– Standard: 123,456;
– Written: one hundred twenty-three thousand, four hundred fifty-six; and
– Expanded: (1 x 100,000) + (2 x 10,000) + (3 x 1,000) + (4 x 100) + (5 x 10) + (6 x 1).
Students need to model numbers to develop number sense. Models such as symbol cards, the abacus, and place value charts help students
understand the structure of the Base-10 number system. Concrete materials, such as Base-10 blocks may be used to represent whole
numbers through thousands. Larger numbers may be represented on place value charts.
In addition to knowledge about place value, students need to develop a sense of relative quantity (“size”). Models such as Base-10 blocks
and bundles of sticks convey both place value structure and relative quantity. It is important, however, for students to visualize quantities
beyond thousands. Models for larger numbers can include two-dimensional Base-10 arrays and organized collections (e.g. a million stars),
as well as number lines.
Flexibility in thinking about numbers – or “decomposition” of numbers (e.g. 12, 345 is 123 hundreds, 4 tens, and 5 ones) – is critical and
supports understandings essential to multiplication and division.
Students should be able to understand, model, and represent numbers in various formats. For example, the number 32,645 can be
represented as:
3 ten thousands, 2 thousands, 6 hundreds, 4 tens, and 5 ones, or
2 ten thousands, 12 thousands, 6 hundreds, 4 tens, and 5 ones, or
326 hundreds, 4 tens, and 5 ones, etc.
Rounding is one of the estimation strategies that are often used to assess the reasonableness of a solution or to give an estimate of an
amount. Students should explore reasons for estimation, using practical experiences, and use rounding to solve practical situations.
To round a number means to substitute a “nice” number that is close, so that numbers may be more easily communicated, or to arrive at
meaningful approximations for computation. It is more meaningful when emphasis is on understanding the rounding concept. Students
should work to develop the procedure for rounding instead of memorizing a rote procedure. Using models for number quantity (e.g. base
ten collection, base ten blocks, and two-dimensional base ten arrays) can help students visualize the meaning of rounding. Opportunities to
explore the concept of rounding on number lines develop students’ number sense for rounding to the nearest ten, hundred, or thousand.
When given a number to round, locate it on the number line. Next determine the multiple of ten, hundred, or thousand it is between. Then
identify to which it is closer. Understanding where to place given numbers between anchor numbers on a number line is a prerequisite to
rounding and ordering numbers.
GRADE 3 CURRICULUM GUIDE PRINCE WILLIAM COUNTY SCHOOLS
Curriculum Information
Essential Questions and Understandings
Teacher Notes and Elaborations
Strand
Number and Number Sense
SOL Reporting Category
Number and Number Sense
Virginia SOL 3.1
The student will
a) read and write six-digit numerals
and identify the place value and
value of each digit;
b) round whole numbers, 9,999 or less,
to the nearest ten, hundred, and
thousand; and
c) compare two whole numbers
between 0 and 9,999, using symbols
(>, <, or = ) and words (is greater
than, is less than, or is equal to).
Foundational Objectives
2.1
The student will
g. read, write, and identify the place
value of each digit in a three-digit
numeral, using numeration models;
h. round two-digit numbers to the
nearest ten; and
i. compare two whole numbers
between 0 and 999, using symbols
(>, <, or =) and words (is greater
than, is less than, or is equal to).
1.1
The student will
b. group a collection of up to 100
objects into tens and ones and write
the corresponding numeral to
develop an understanding of place
value.
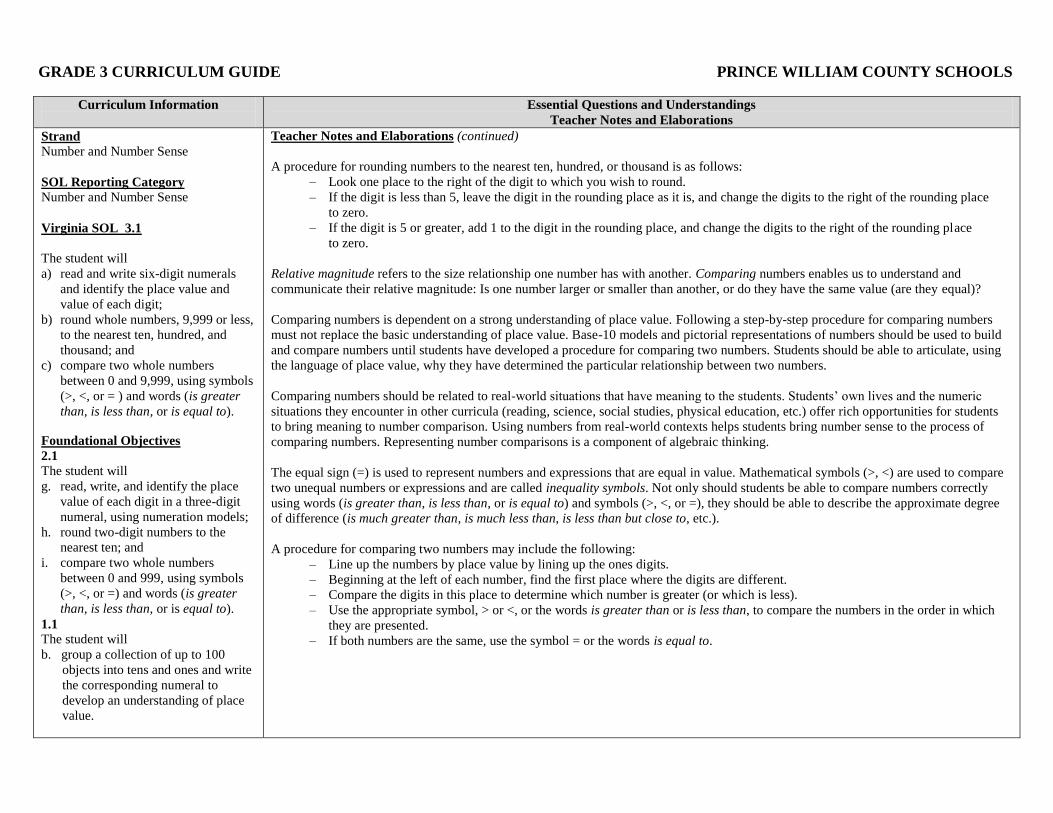
Teacher Notes and Elaborations (continued)
A procedure for rounding numbers to the nearest ten, hundred, or thousand is as follows:
– Look one place to the right of the digit to which you wish to round.
– If the digit is less than 5, leave the digit in the rounding place as it is, and change the digits to the right of the rounding place
to zero.
– If the digit is 5 or greater, add 1 to the digit in the rounding place, and change the digits to the right of the rounding place
to zero.
Relative magnitude refers to the size relationship one number has with another. Comparing numbers enables us to understand and
communicate their relative magnitude: Is one number larger or smaller than another, or do they have the same value (are they equal)?
Comparing numbers is dependent on a strong understanding of place value. Following a step-by-step procedure for comparing numbers
must not replace the basic understanding of place value. Base-10 models and pictorial representations of numbers should be used to build
and compare numbers until students have developed a procedure for comparing two numbers. Students should be able to articulate, using
the language of place value, why they have determined the particular relationship between two numbers.
Comparing numbers should be related to real-world situations that have meaning to the students. Students’ own lives and the numeric
situations they encounter in other curricula (reading, science, social studies, physical education, etc.) offer rich opportunities for students
to bring meaning to number comparison. Using numbers from real-world contexts helps students bring number sense to the process of
comparing numbers. Representing number comparisons is a component of algebraic thinking.
The equal sign (=) is used to represent numbers and expressions that are equal in value. Mathematical symbols (>, <) are used to compare
two unequal numbers or expressions and are called inequality symbols. Not only should students be able to compare numbers correctly
using words (is greater than, is less than, or is equal to) and symbols (>, <, or =), they should be able to describe the approximate degree
of difference (is much greater than, is much less than, is less than but close to, etc.).
A procedure for comparing two numbers may include the following:
– Line up the numbers by place value by lining up the ones digits.
– Beginning at the left of each number, find the first place where the digits are different.
– Compare the digits in this place to determine which number is greater (or which is less).
– Use the appropriate symbol, > or <, or the words is greater than or is less than, to compare the numbers in the order in which
they are presented.
– If both numbers are the same, use the symbol = or the words is equal to.
GRADE 3 CURRICULUM GUIDE PRINCE WILLIAM COUNTY SCHOOLS
Curriculum Information
Essential Knowledge and Skills
Key Vocabulary
Essential Questions and Understandings
Teacher Notes and Elaborations
Strand
Number and Number Sense
SOL Reporting Category
Number and Number Sense
Virginia SOL 3.2
T The student will recognize and use the
inverse relationships between
addition/subtraction and
multiplication/division to complete
basic fact sentences. The student will
use these relationships to solve
problems.
Foundational Objectives
2.4
The student will
a. count forward by twos, fives, and
tens to 100, starting at various
multiples of 2, 5, or 10;
b. count backward by tens from 100;
and
c. recognize even and odd numbers.
2.5
The student will recall addition facts
with sums to 20 or less and the
corresponding subtraction facts.
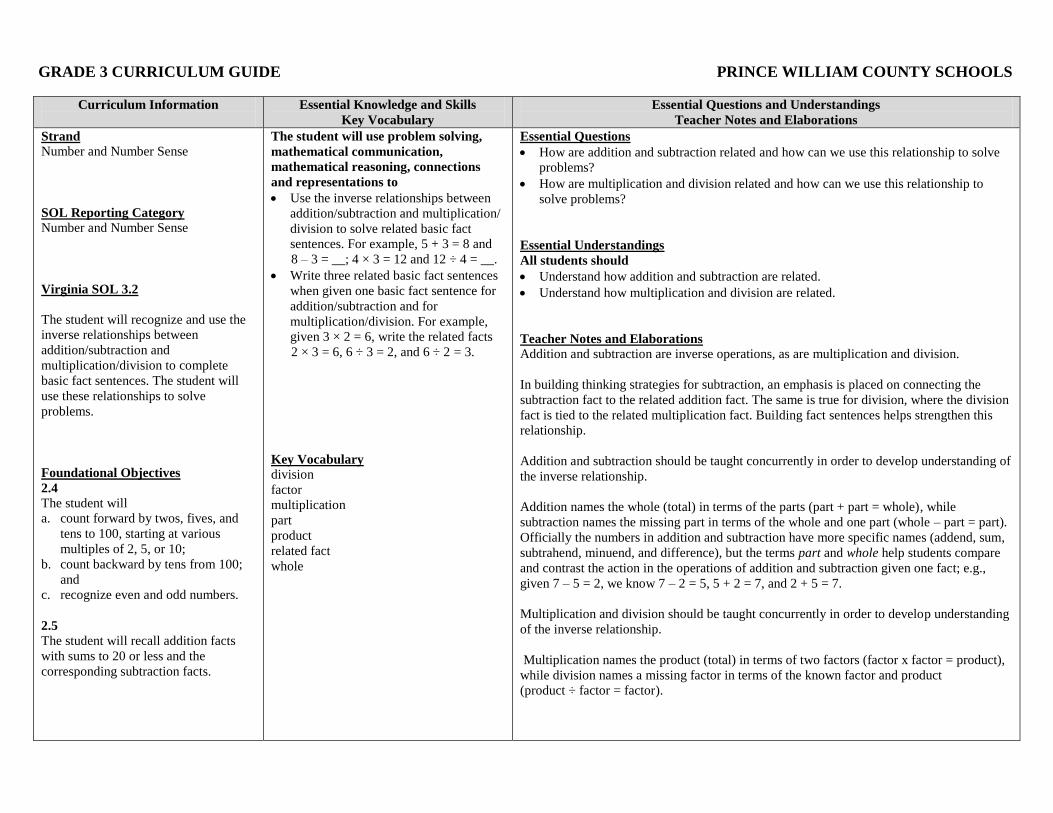
The student will use problem solving,
mathematical communication,
mathematical reasoning, connections
and representations to
Use the inverse relationships between
addition/subtraction and multiplication/
division to solve related basic fact
sentences. For example, 5 + 3 = 8 and
8 – 3 = __; 4 × 3 = 12 and 12 ÷ 4 = __.
Write three related basic fact sentences
when given one basic fact sentence for
addition/subtraction and for
multiplication/division. For example,
given 3 × 2 = 6, write the related facts
2 × 3 = 6, 6 ÷ 3 = 2, and 6 ÷ 2 = 3.
Key Vocabulary
division
factor
multiplication
part
product
related fact
whole
Essential Questions
How are addition and subtraction related and how can we use this relationship to solve
problems?
How are multiplication and division related and how can we use this relationship to
solve problems?
Essential Understandings
All students should
Understand how addition and subtraction are related.
Understand how multiplication and division are related.
Teacher Notes and Elaborations
Addition and subtraction are inverse operations, as are multiplication and division.
In building thinking strategies for subtraction, an emphasis is placed on connecting the
subtraction fact to the related addition fact. The same is true for division, where the division
fact is tied to the related multiplication fact. Building fact sentences helps strengthen this
relationship.
Addition and subtraction should be taught concurrently in order to develop understanding of
the inverse relationship.
Addition names the whole (total) in terms of the parts (part + part = whole), while
subtraction names the missing part in terms of the whole and one part (whole – part = part).
Officially the numbers in addition and subtraction have more specific names (addend, sum,
subtrahend, minuend, and difference), but the terms part and whole help students compare
and contrast the action in the operations of addition and subtraction given one fact; e.g.,
given 7 – 5 = 2, we know 7 – 2 = 5, 5 + 2 = 7, and 2 + 5 = 7.
Multiplication and division should be taught concurrently in order to develop understanding
of the inverse relationship.
Multiplication names the product (total) in terms of two factors (factor x factor = product),
while division names a missing factor in terms of the known factor and product
(product ÷ factor = factor).

GRADE 3 CURRICULUM GUIDE PRINCE WILLIAM COUNTY SCHOOLS
Curriculum Information
Essential Questions and Understandings
Teacher Notes and Elaborations
Strand
Number and Number Sense
SOL Reporting Category
Number and Number Sense
Virginia SOL 3.2
The student will recognize and use the
inverse relationships between
addition/subtraction and
multiplication/division to complete
basic fact sentences. The student will
use these relationships to solve
problems.
Foundational Objectives
2.4
The student will
d. count forward by twos, fives, and
tens to 100, starting at various
multiples of 2, 5, or 10;
e. count backward by tens from 100;
and
f. recognize even and odd numbers.
2.5
The student will recall addition facts
with sums to 20 or less and the
corresponding subtraction facts.
Teacher Notes and Elaborations (continued)
Officially, the numbers in multiplication and division have more specific names (multiplier, multiplicand, product, dividend, divisor,
quotient), but the terms factor and product help students compare and contrast the action in the operations of multiplication and division
given one fact; e.g., given 2 x 3 = 6, we know 3 x 2 = 6, 6 ÷ 2 = 3, and 6 ÷ 3 = 2.
Models should be used as students build their understanding of inverse operations. Modeling and building sets of related fact sentences
helps strengthen this relationship.
Students should understand that inverse operations are not confined to “basic facts.” By comparing a variety of solution strategies to
meaningful problems, students deepen their understanding of addition and subtraction (and likewise, multiplication and division) and learn
the power of using inverse operations in solving problems with numbers of all magnitudes.
GRADE 3 CURRICULUM GUIDE PRINCE WILLIAM COUNTY SCHOOLS
Curriculum Information
Essential Knowledge and Skills
Key Vocabulary
Essential Questions and Understandings
Teacher Notes and Elaborations
Strand
Number and Number Sense
SOL Reporting Category
Number and Number Sense
Virginia SOL 3.3
The student will
a) name and write fractions (including
mixed numbers) represented by a
model;
b) model fractions (including mixed
numbers) and write the fractions’
names; and
c) compare fractions having like and
unlike denominators, using words
and symbols (>, <, or =).
Foundational Objectives
2.3
The student will
a. identify the parts of a set and/or
region that represent fractions for
halves, thirds, fourths, sixths,
eighths, and tenths;
b. write the fractions; and
c. compare the unit fractions for
halves, thirds, fourths, sixths,
eighths, and tenths.
1.3
The student will identify the parts of a
set and/or region that represent
fractions for halves, thirds, and fourths
and write the fractions.
The student will use problem solving,
mathematical communication,
mathematical reasoning, connections
and representations to
Name and write fractions (including
mixed numbers) represented by a model
to include halves, thirds, fourths,
eighths, tenths, and twelfths.
Use concrete materials and pictures to
model at least halves, thirds, fourths,
eighths, tenths, and twelfths.
Compare fractions using the terms is
greater than, is less than, or is equal to
and the symbols (>, <, and =).
Comparisons are made between
fractions with both like and unlike
denominators, using models, concrete
materials, and pictures.
Key Vocabulary
benchmark compare
denominator eighths
equivalent fraction
improper fraction mixed number
model numerator
proper fraction unit fractions
whole
Essential Questions
What is a fraction? … a mixed number?... a decimal? And how are they named and
written?
Why is the “whole” important when thinking about fractions?
How is an “improper” fraction related to a mixed number?
How can we use fractions to describe everyday situations?
How can fractions, including mixed numbers, be modeled?
How can fractions with different denominators be equivalent?
What are benchmarks and how can they be used to compare fractions?
Essential Understandings
All students should
Understand that the whole must be defined.
Understand that the denominator tells the number of equal parts that represent a whole.
Understand that the numerator is a number that tells how many equal size parts are
being considered.
Understand that the value of a fraction is dependent on both the number of parts in a
whole (denominator) and the number of those parts being considered (numerator).
Understand that a proper fraction is a fraction whose numerator is smaller than its
denominator.
Understand that an improper fraction is a fraction whose numerator is greater than or
equal to the denominator and is one or greater than one.
Understand that an improper fraction can be expressed as a whole number or a mixed
number.
Understand that a mixed number in simplest form is written as a whole number and a
proper fraction.
Teacher Notes and Elaborations
A fraction is a way of representing part of a whole (as in a region/area model or a
length/measurement model) or part of a group (as in a set model). Fractions are used to
name a part of one thing or a part of a collection of things. Models can include pattern
blocks, fraction bars, ruler, number line, counters, etc.
In each area/region and length/measurement model, the parts must be equal-sized. Wholes
are divided or partitioned into equal-sized parts.
In the set model, each member of the set is an equal part of the set. The members of the set
do not have to be equal in size.
GRADE 3 CURRICULUM GUIDE PRINCE WILLIAM COUNTY SCHOOLS
Curriculum Information
Essential Questions and Understandings
Teacher Notes and Elaborations
Strand
Number and Number Sense
SOL Reporting Category
Number and Number Sense
Virginia SOL 3.3
The student will
a) name and write fractions (including
mixed numbers) represented by a
model;
b) model fractions (including mixed
numbers) and write the fractions’
names; and
c) compare fractions having like and
unlike denominators, using words
and symbols (>, <, or =).
Foundational Objectives
2.3
The student will
d. identify the parts of a set and/or
region that represent fractions for
halves, thirds, fourths, sixths,
eighths, and tenths;
e. write the fractions; and
f. compare the unit fractions for
halves, thirds, fourths, sixths,
eighths, and tenths.
1.3
The student will identify the parts of a
set and/or region that represent
fractions for halves, thirds, and fourths
and write the fractions.
Teacher Notes and Elaborations (continued)
The concept of the part-whole relationship is essential to developing an understanding of the mathematical terms numerator and
denominator. The denominator tells how many equal parts are in the whole or set. The numerator tells how many of those parts are being
considered.
Provide opportunities to make connections among fraction representations by connecting concrete or pictorial representations with oral
language and symbolic representations. Informal, integrated experiences with fractions at this level will help students develop a foundation
for deeper learning at later grades. Understanding the language of fractions (e.g., thirds means “three equal parts of a whole,”31 represents
one of three equal-size parts when a pizza is shared among three students, or three-fourths means “three of four equal parts of a whole”)
furthers this development.
Equivalent fractions name the same number. Students should use a variety of models to identify different names for equivalent fractions
(21 ,
42 ,
63 ,
84 ,
105 ,
126 ). Students should focus on finding equivalent fractions of familiar fractions such as halves, thirds, fourths, eighths,
tenths, and twelfths.
Comparing unit fractions (a fraction in which the numerator is one) builds a mental image of fractions and the understanding that as the
number of pieces of a whole increases, the size of one single piece decreases (e.g., 51 of a bar is smaller than
41 of a bar).
Comparing fractions to a benchmark on a number line (e.g., close to 0, less than21 , exactly
21 , greater than
21 , or close to 1) facilitates the
comparison of fractions when using concrete materials or pictorial models.
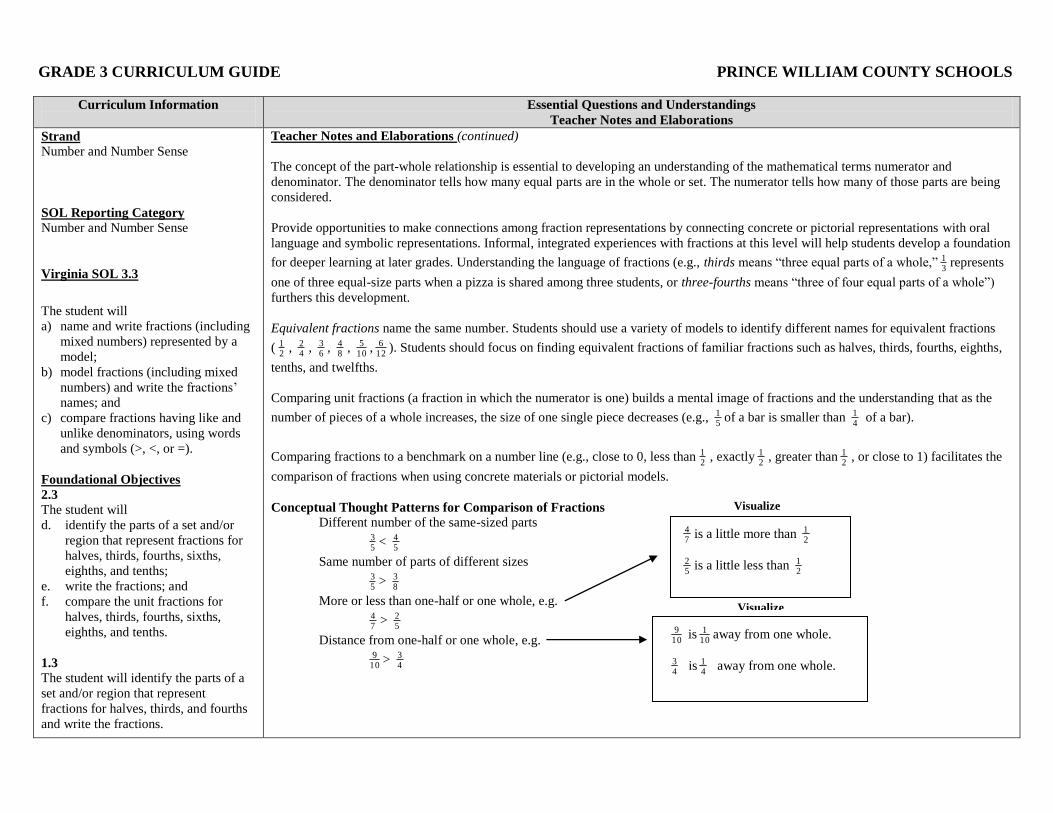
Conceptual Thought Patterns for Comparison of Fractions
Different number of the same-sized parts
53 <
54
Same number of parts of different sizes
53 >
83
More or less than one-half or one whole, e.g.
74 >
52
Distance from one-half or one whole, e.g.
109 >
43
109 is
101 away from one whole.
43 is
41 away from one whole.
Visualize
74 is a little more than
21
52 is a little less than
21
Visualize

FOCUS K-3_____________STRAND: COMPUTATION AND ESTIMATION_________GRADE LEVEL 3
A variety of contexts are necessary for children to develop an understanding of the meanings of the operations such as addition and
subtraction. These contexts often arise from practical experiences in which they are simply joining sets, taking away or separating
from a set, or comparing sets. These contexts might include conversations, such as “How many books do we have altogether?” or
“How many cookies are left if I eat two?” or “I have three more candies than you do.” Although young children first compute using
objects and manipulatives, they gradually shift to performing computations mentally or using paper and pencil to record their thinking.
Therefore, computation and estimation instruction in the early grades revolves around modeling, discussing, and recording a variety of
problem situations. This approach helps students transition from the concrete to the representation to the symbolic in order to develop
meaning for the operations and how they relate to each other.
In grades K–3, computation and estimation instruction focuses on
relating the mathematical language and symbolism of operations to problem situations;
understanding different meanings of addition and subtraction of whole numbers and the relation between the two operations;
developing proficiency with basic addition, subtraction, multiplication, division and related facts;
gaining facility in manipulating whole numbers to add and subtract and in understanding the effects of the operations on whole
numbers;
developing and using strategies and algorithms to solve problems and choosing an appropriate method for the situation;
choosing, from mental computation, estimation, paper and pencil, and calculators, an appropriate way to compute;
recognizing whether numerical solutions are reasonable;
experiencing situations that lead to multiplication and division, such as equal groupings of objects and sharing equally; and
performing initial operations with fractions.
GRADE 3 CURRICULUM GUIDE PRINCE WILLIAM COUNTY SCHOOLS
Curriculum Information
Essential Knowledge and Skills
Key Vocabulary
Essential Questions and Understandings
Teacher Notes and Elaborations
Strand
Computation and Estimation
SOL Reporting Category
Computation and Estimation
Virginia SOL 3.4
The s The student will estimate solutions to
and solve single-step and multistep
problems involving the sum or
difference of two whole numbers, each
9,999 or less, with or without
regrouping.
Foundational Objectives
2.6
The student, given two whole numbers
whose sum is 99 or less, will
a. estimate the sum; and
b. find the sum, using various methods
of calculation.
2.7
The student, given two whole numbers,
each of which is 99 or less, will
a. estimate the difference; and
b. find the difference, using various
methods of calculation.
1.5
The student will recall basic addition
facts with sums to 18 or less and the
corresponding subtraction facts.
The student will use problem solving,
mathematical communication,
mathematical reasoning, connections
and representations to
Determine whether an estimate or an
exact answer is an appropriate solution
for practical addition and subtraction
problem situations involving single-step
and multistep problems.
Determine whether to add or subtract in
practical problem situations.
Estimate the sum or difference of two
whole numbers, each 9,999 or less
when an exact answer is not required.
Add or subtract two whole numbers,
each 9,999 or less.
Solve practical problems involving the
sum of two whole numbers, each 9,999
or less, with or without regrouping,
using calculators, paper and pencil, or
mental computation in practical
problem situations.
Solve practical problems involving the
difference of two whole numbers, each
9,999 or less, with or without
regrouping, using calculators, paper and
pencil, or mental computation in
practical problem situations.
Solve single-step and multistep
problems involving the sum or
difference of two whole numbers, each
9,999 or less, with or without
regrouping.
Key Vocabulary
difference plus
estimate same
equal sum
minus
Essential Questions
What situations call for the computation of sums or differences?
When is it more appropriate to estimate sums and differences than to compute them, and
how do we decide which strategy to use?
How can we use number sense to determine the reasonableness of a computation or
estimation?
Essential Understandings
All students should
Understand that estimation skills are valuable, time-saving tools particularly in practical
situations when exact answers are not required or needed.
Understand that estimation skills are also valuable in determining the reasonableness of
the sum or difference when solving for the exact answer is needed.
Develop and use strategies to estimate whole number sums and differences to determine
the reasonableness of an exact answer.
Develop flexible methods of adding whole numbers by combining numbers in a variety
of ways, most depending on place values.
Teacher Notes and Elaborations
Knowing whether to find an exact answer or to make an estimate is learned through
practical experiences in recognizing which is appropriate. Determining whether an estimate
is appropriate and using a variety of strategies to estimate requires experiences with
problem situations involving estimation.
An estimate is a number close to an exact amount. An estimate tells about how much or
about how many. Estimation is useful in everyday life. (Do I have enough money? How big
a turkey will I need for 12 people?) An estimate produces answers that are “good enough”
for the purpose. The situation determines what we need to know and, thus, the strategy we
use for estimation. Consider the sum: $349.29 + $85. 99 + $175.25. For the three prices, the
question, “About how much?” is very different from “Is it more than $600?” Students
should consider the context when deciding what estimation strategy to use. They should be
able to explain and justify their strategy and describe the closeness of their estimate.
Different strategies for estimation include rounding, compatible numbers, front-end
estimation, and compensation.
Compatible numbers are numbers that are easy to work with mentally. Number pairs that
are easier to add or subtract are compatible. For example, 52 + 74 can be estimated using
50 + 75. The difference, 83 – 38, is close to 80 – 40.
GRADE 3 CURRICULUM GUIDE PRINCE WILLIAM COUNTY SCHOOLS
Curriculum Information
Essential Questions and Understandings
Teacher Notes and Elaborations
Strand
Computation and Estimation
SOL Reporting Category
Computation and Estimation
Virginia SOL 3.4
The s The student will estimate solutions to
and solve single-step and multistep
problems involving the sum or
difference of two whole numbers, each
9,999 or less, with or without
regrouping.
Foundational Objectives
2.6
The student, given two whole numbers
whose sum is 99 or less, will
c. estimate the sum; and
d. find the sum, using various methods
of calculation.
2.7
The student, given two whole numbers,
each of which is 99 or less, will
c. estimate the difference; and
d. find the difference, using various
methods of calculation.
1.5
The student will recall basic addition
facts with sums to 18 or less and the
corresponding subtraction facts.
Teacher Notes and Elaborations (continued)
Front-end or leading digit estimation always gives a sum less than the actual sum; however, the estimate can be adjusted or refined so it is
closer to the actual sum. For example, 9,162 + 5, 643 + 6,636 could be estimated using 9,000 + 5,000 + 6,000. (To refine the estimate, one
might glance down the hundreds in each number and see that the estimate could be increased by 1,000.) Front-end estimation is useful
when dealing with many large numbers, e.g. the number of people who attended football games in a season.
Compensation is a strategy shoppers may use when mentally estimating a total purchase amount. For example, $2.38 + $5.22 + $0.39 may
be estimated as $2 + $5 + $1 (where the $1 represents an approximation of the accumulated cent amounts: .38 + .22 + .39).
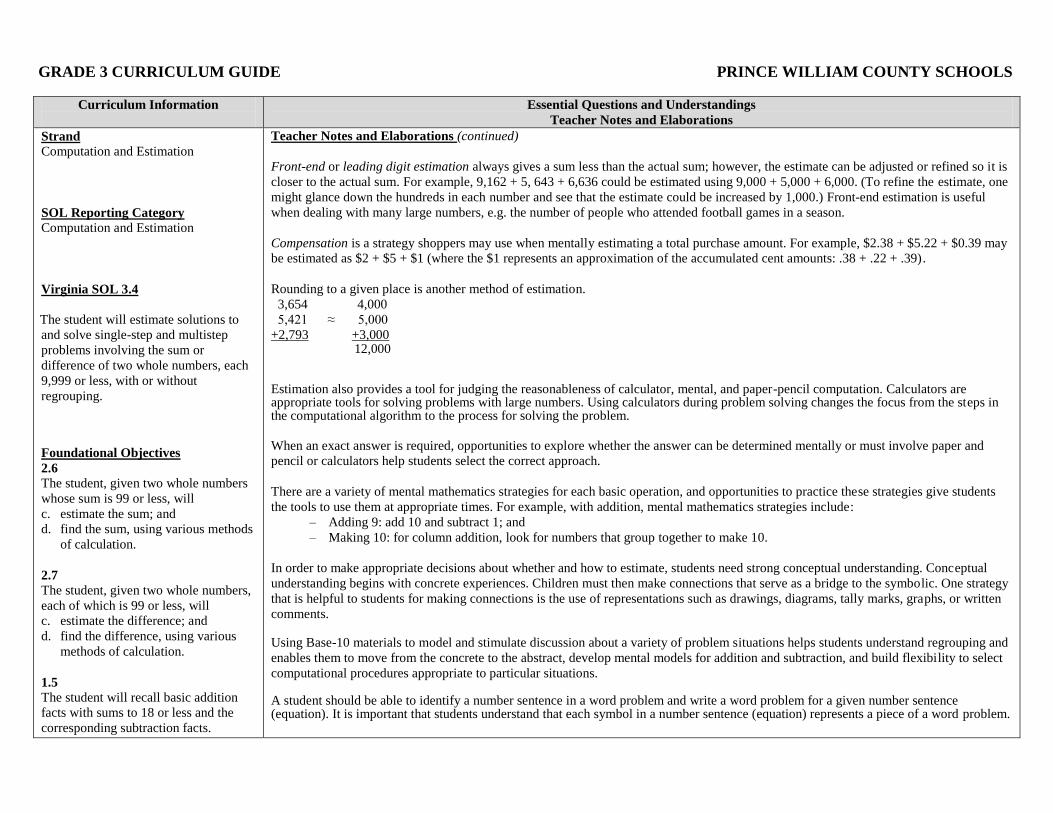
Rounding to a given place is another method of estimation.
3,654 4,000
5,421 ≈ 5,000
+2,793 +3,000 12,000 Estimation also provides a tool for judging the reasonableness of calculator, mental, and paper-pencil computation. Calculators are appropriate tools for solving problems with large numbers. Using calculators during problem solving changes the focus from the steps in the computational algorithm to the process for solving the problem.
When an exact answer is required, opportunities to explore whether the answer can be determined mentally or must involve paper and
pencil or calculators help students select the correct approach.
There are a variety of mental mathematics strategies for each basic operation, and opportunities to practice these strategies give students
the tools to use them at appropriate times. For example, with addition, mental mathematics strategies include:
– Adding 9: add 10 and subtract 1; and
– Making 10: for column addition, look for numbers that group together to make 10.
In order to make appropriate decisions about whether and how to estimate, students need strong conceptual understanding. Conceptual
understanding begins with concrete experiences. Children must then make connections that serve as a bridge to the symbolic. One strategy
that is helpful to students for making connections is the use of representations such as drawings, diagrams, tally marks, graphs, or written
comments. Using Base-10 materials to model and stimulate discussion about a variety of problem situations helps students understand regrouping and
enables them to move from the concrete to the abstract, develop mental models for addition and subtraction, and build flexibility to select
computational procedures appropriate to particular situations. A student should be able to identify a number sentence in a word problem and write a word problem for a given number sentence (equation). It is important that students understand that each symbol in a number sentence (equation) represents a piece of a word problem.

GRADE 3 CURRICULUM GUIDE PRINCE WILLIAM COUNTY SCHOOLS
Curriculum Information
Essential Questions and Understandings
Teacher Notes and Elaborations
Strand
Computation and Estimation
SOL Reporting Category
Computation and Estimation
Virginia SOL 3.4
The s The student will estimate solutions to
and solve single-step and multistep
problems involving the sum or
difference of two whole numbers, each
9,999 or less, with or without
regrouping.
Foundational Objectives
2.6
The student, given two whole numbers
whose sum is 99 or less, will
e. estimate the sum; and
f. find the sum, using various methods
of calculation.
2.7
The student, given two whole numbers,
each of which is 99 or less, will
e. estimate the difference; and
f. find the difference, using various
methods of calculation.
1.5
The student will recall basic addition
facts with sums to 18 or less and the
corresponding subtraction facts.
Teacher Notes and Elaborations (continued)
An example of an approach to solving problems is Polya’s four-step plan:
– Understand: Retell the problem; read it twice; take notes; study the charts or diagrams; look up words and symbols that are new.
– Plan: Decide what operation(s) and sequence of steps to use to solve the problem.
– Solve: Follow the plan and work accurately. If the first attempt does not work, try another plan.
– Look back: Does the answer make sense?
Addition is the combining of quantities. When adding we may use the following terms:
addend → 423
addend → + 246
sum → 669
Subtraction is the inverse of addition; it yields the difference between two numbers. The following terms are used in subtraction:
minuend → 7,698
subtrahend → – 5,341
difference → 2,357
Regrouping may be used in addition and subtraction algorithms. An algorithm is a step-by-step method for computing.
GRADE 3 CURRICULUM GUIDE PRINCE WILLIAM COUNTY SCHOOLS
Curriculum Information
Essential Knowledge and Skills
Key Vocabulary
Essential Questions and Understandings
Teacher Notes and Elaborations
Strand
Computation and Estimation
SOL Reporting Category
Computation and Estimation
Virginia SOL 3.5
The student will recall multiplication
facts through the twelves table, and the
corresponding division facts.
Foundational Objective
2.4
The student will
a. count forward by twos, fives, and
tens to 100, starting at various
multiples of 2, 5, or 10…
The student will use problem solving,
mathematical communication,
mathematical reasoning, connections,
and representations to
Recall and state the multiplication and
division facts through the twelves table.
Recall and write the multiplication and
division facts through the twelves table.
Key Vocabulary
array
divide
division
equal
factor
groups
multiply
multiplication
product
quotient
Essential Questions
What situations call for multiplication? … for division?
How can we model multiplication facts? …division facts?
How are multiplication and division related?
What strategies can help us learn the multiplication combinations? … division
combinations?
Essential Understandings
All students should
Develop fluency with number combinations for multiplication and division.
Understand that multiplication is repeated addition.
Understand that division is the inverse of multiplication.
Understand that patterns and relationships exist in the facts.
Understand that number relationships can be used to learn and retain the facts.
Teacher Notes and Elaborations
The development of computational fluency relies on quick access to number facts. A certain
amount of practice is necessary to develop fluency with computational strategies; however,
the practice must be motivating and systematic if students are to develop fluency in
computation, whether mental, with manipulative materials, or with paper and pencil.
Strategies to learn the multiplication facts through the twelves table include an
understanding of multiples/skip counting, pattern of nines, commutative property, related
facts and, properties of zero and one as factors. (The zero property of multiplication states
that if 0 is a factor, the product is always 0.) In order to develop and use strategies to learn
the multiplication facts through the twelves table, students should use concrete materials,
hundred chart, and mental mathematics.
To extend the understanding of multiplication, three models may be used:
– The equal-sets or equal-groups model lends itself to sorting a variety of concrete
objects into equal groups and reinforces repeated addition or skip counting.
– The array model, consisting of rows and columns (e.g., 3 rows of 4 columns for a
3-by-4 array) helps build the commutative property.
– The length model (e.g., a number line) also reinforces repeated addition or skip
counting.
GRADE 3 CURRICULUM GUIDE PRINCE WILLIAM COUNTY SCHOOLS
Curriculum Information
Essential Questions and Understandings
Teacher Notes and Elaborations
Strand
Computation and Estimation
SOL Reporting Category
Computation and Estimation
Virginia SOL 3.5
The student will recall multiplication
facts through the twelves table, and the
corresponding division facts.
Foundational Objective
2.4
The student will
b. count forward by twos, fives, and
tens to 100, starting at various
multiples of 2, 5, or 10…
Teacher Notes and Elaborations (continued)
Division is the inverse of multiplication. It is the operation of determining how many times one quantity is contained in another when one
set is equally divided into smaller sets. The quotient is the answer to a division problem. In context, students encounter the following two
kinds of division:
1. When the original amount and the number of shares or groups are known, we divide to find the size of each share. This is
technically referred to as partitive division, because the action involved is one of dividing or partitioning a set into a
predetermined number of groups. In a card game, dealing cards equally to each player is a partitive division process.
2. When the original amount and the size of each share are known, we divide to find the number of shares. This is called quotitive
or measurement division. Repeated subtraction models the quotitive division process. Both partitive and quotitive division
situations may be modeled with Base-10 or set manipulatives.
GRADE 3 CURRICULUM GUIDE PRINCE WILLIAM COUNTY SCHOOLS
Curriculum Information
Essential Knowledge and Skills
Key Vocabulary
Essential Questions and Understandings
Teacher Notes and Elaborations
Strand
Computation and Estimation
SOL Reporting Category
Computation and Estimation
Virginia SOL 3.6
The student will represent
multiplication and division, using area,
set, and number line models, and create
and solve problems that involve
multiplication of two whole numbers,
one factor 99 or less and the second
factor 5 or less.
The student will use problem solving,
mathematical communication,
mathematical reasoning, connections
and representations to
Model multiplication, using area, set,
and number line models.
Model division, using area, set, and
number line models.
Solve multiplication problems, using
the multiplication algorithm, where one
factor is 99 or less and the second factor
is 5 or less.
Create and solve word problems
involving multiplication, where one
factor is 99 or less and the second factor
is 5 or less.
Key Vocabulary
array
division
multiplication
number line
set
Essential Questions
What situations call for multiplication? … for division?
How can we model multiplication using area, set, and number line models? … model
division…?
How can number sense and place value understandings be used to devise strategies to
compute a product with a two-digit number as one of its factors?
Essential Understandings
All students should
Understand the meanings of multiplication and division.
Understand the models used to represent multiplying and dividing whole numbers.
Teacher Notes and Elaborations
The multiplication and division facts through the twelves tables should be modeled.
Multiplication is a shortcut for repeated addition. The terms associated with multiplication
are indicated below.
factor → 54
factor → × 3
product →162
Creating real-life problems and solving them facilitates the connection between
mathematics and everyday experiences (e.g., area problems).
The use of Base-10 blocks and repeated addition can serve as a model. For example, 4 × 12
is read as four sets consisting of one rod and two units. The sum is renamed as four rods and
eight units or 48. This can be thought of as 12 + 12 + 12 + 12 = 48 (whole set).
The use of Base-10 blocks and the array model can be used to solve the same problem. A
rectangle array that is one rod and two units long by four units wide is formed. The area of
this array is represented by 4 rods and 8 units.
The number line model can be used to solve a multiplication problem such as 3 × 4. This is
represented on the number line by three jumps of four.
GRADE 3 CURRICULUM GUIDE PRINCE WILLIAM COUNTY SCHOOLS
Curriculum Information
Essential Questions and Understandings
Teacher Notes and Elaborations
Strand
Computation and Estimation
SOL Reporting Category
Computation and Estimation
Virginia SOL 3.6
The student will represent
multiplication and division, using area,
set, and number line models, and create
and solve problems that involve
multiplication of two whole numbers,
one factor 99 or less and the
second factor 5 or less.
Teacher Notes and Elaborations (continued)
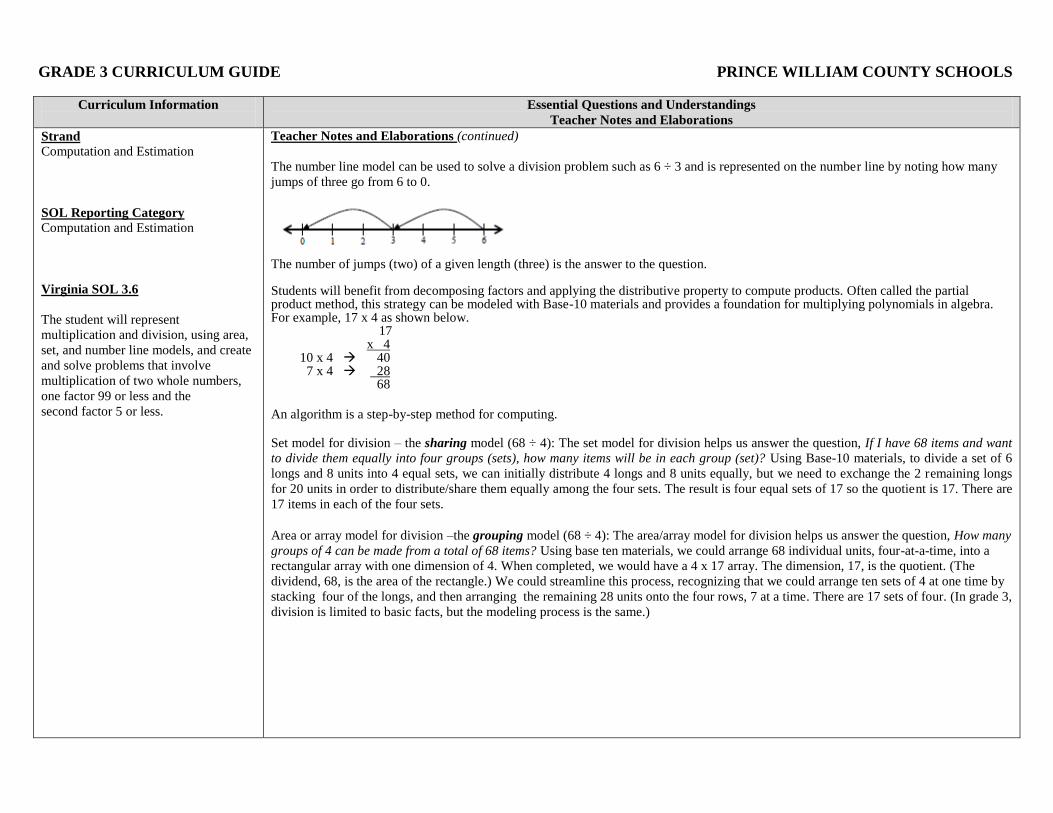
The number line model can be used to solve a division problem such as 6 ÷ 3 and is represented on the number line by noting how many
jumps of three go from 6 to 0.
The number of jumps (two) of a given length (three) is the answer to the question. Students will benefit from decomposing factors and applying the distributive property to compute products. Often called the partial product method, this strategy can be modeled with Base-10 materials and provides a foundation for multiplying polynomials in algebra. For example, 17 x 4 as shown below. 17 x 4 10 x 4 40 7 x 4 28 68
An algorithm is a step-by-step method for computing. Set model for division – the sharing model (68 ÷ 4): The set model for division helps us answer the question, If I have 68 items and want
to divide them equally into four groups (sets), how many items will be in each group (set)? Using Base-10 materials, to divide a set of 6
longs and 8 units into 4 equal sets, we can initially distribute 4 longs and 8 units equally, but we need to exchange the 2 remaining longs
for 20 units in order to distribute/share them equally among the four sets. The result is four equal sets of 17 so the quotient is 17. There are
17 items in each of the four sets.
Area or array model for division –the grouping model (68 ÷ 4): The area/array model for division helps us answer the question, How many
groups of 4 can be made from a total of 68 items? Using base ten materials, we could arrange 68 individual units, four-at-a-time, into a
rectangular array with one dimension of 4. When completed, we would have a 4 x 17 array. The dimension, 17, is the quotient. (The
dividend, 68, is the area of the rectangle.) We could streamline this process, recognizing that we could arrange ten sets of 4 at one time by
stacking four of the longs, and then arranging the remaining 28 units onto the four rows, 7 at a time. There are 17 sets of four. (In grade 3,
division is limited to basic facts, but the modeling process is the same.)

GRADE 3 CURRICULUM GUIDE PRINCE WILLIAM COUNTY SCHOOLS
Curriculum Information
Essential Knowledge and Skills
Key Vocabulary
Essential Questions and Understandings
Teacher Notes and Elaborations
Strand
Computation and Estimation
SOL Reporting Category
Computation and Estimation
Virginia SOL 3.7
The student will add and subtract
proper fractions having like
denominators of 12 or less.
Foundational Objectives
2.3
The student will
a. identify the parts of a set and/or
region that represent fractions for
halves, thirds, fourths, sixths,
eighths, and tenths;
b. write the fractions; and
c. compare the unit fractions for
halves, thirds, fourths, sixths,
eighths, and tenths.
2.5 The student will recall addition facts
with sums to 20 or less and the
corresponding subtraction facts.
The student will use problem solving,
mathematical communication,
mathematical reasoning, connections,
and representations to
Demonstrate a fractional part of a
whole, using
– region/area models (e.g., pie pieces,
pattern blocks, geoboards, drawings);
– set models (e.g., chips, counters,
cubes, drawings); and
– length/measurement models (e.g., nonstandard units such as rods,
connecting cubes, and drawings).
Name and write fractions and mixed
numbers represented by drawings or
concrete materials.
Represent a given fraction or mixed
number, using concrete materials,
pictures, and symbols. For example,
write the symbol for one-fourth and
represent it with concrete materials
and/or pictures.
Add and subtract with proper fractions
having like denominators of 12 or less,
using concrete materials and pictorial
models representing area/regions
(circles, squares, and rectangles),
length/measurements (fraction bars and
strips), and sets (counters).
Essential Questions
How is the part-whole relationship expressed by fractions important when adding or
subtracting fractions?
How can concrete materials and visual models be used to demonstrate the addition and
subtraction of fractions?
How can benchmarks and equivalent forms be used to add and subtract commonly-used
fractions?
Essential Understandings
All students should
Understand that a proper fraction is a fraction whose numerator is smaller than its
denominator.
Understand that an improper fraction is a fraction whose numerator is greater than or
equal to the denominator and is one or greater than one.
Understand that an improper fraction can be expressed as a whole number or a mixed
number.
Understand that a mixed number is written as a whole number and a proper fraction. A
mixed number is the sum of a whole number and the proper fraction.
Understand that computation with fractions uses the same strategies as whole number
computation.
Teacher Notes and Elaborations
A proper fraction is a fraction whose numerator is less than the denominator. A proper
fraction is a fraction that is always less than one.
An improper fraction is a fraction whose numerator is greater than or equal to the
denominator. An improper fraction is a fraction that is equal to or greater than one. An
improper fraction can be expressed as a mixed number.
A mixed number is written as a whole number and a proper fraction.
The strategies of addition and subtraction applied to fractions are the same as the strategies
applied to whole numbers.
Concrete materials and pictorial models representing area/regions (circles, squares, and
rectangles), length/measurements (fraction bars and strips), and sets (counters) can be used
to add and subtract fractions having like denominators of 12 or less.

GRADE 3 CURRICULUM GUIDE PRINCE WILLIAM COUNTY SCHOOLS
Curriculum Information
Essential Knowledge and Skills
Key Vocabulary
Essential Questions and Understandings
Teacher Notes and Elaborations
Strand
Computation and Estimation
SOL Reporting Category
Computation and Estimation
Virginia SOL 3.7
The student will add and subtract
proper fractions having like
denominators of 12 or less.
Foundational Objectives
2.3
The student will
d. identify the parts of a set and/or
region that represent fractions for
halves, thirds, fourths, sixths,
eighths, and tenths;
e. write the fractions; and
f. compare the unit fractions for
halves, thirds, fourths, sixths,
eighths, and tenths.
2.5 The student will recall addition facts
with sums to 20 or less and the
corresponding subtraction facts.
Key Vocabulary
denominator
fraction
improper fraction
mixed number
numerator
proper fraction
numerator
proper fraction
whole number
Teacher Notes and Elaborations (continued)
Reasonable answers to problems involving addition and subtraction of fractions can be
established by using benchmarks such as 0,21 , and 1. For example,
53 and
54 are each
greater than21 , so their sum is greater than 1.
FOCUS K-3______________________STRAND: MEASUREMENT__________________GRADE LEVEL 3
Measurement is important because it helps to quantify the world around us and is useful in so many aspects of everyday life. Students
in grades K–3 should encounter measurement in many normal situations, from their daily use of the calendar and from science
activities that often require students to measure objects or compare them directly, to situations in stories they are reading and to
descriptions of how quickly they are growing.
Measurement instruction at the primary level focuses on developing the skills and tools needed to measure length, weight/mass,
capacity, time, temperature, area, perimeter, volume, and money. Measurement at this level lends itself especially well to the use of
concrete materials. Children can see the usefulness of measurement if classroom experiences focus on estimating and measuring real
objects. They gain deep understanding of the concepts of measurement when handling the materials, making physical comparisons,
and measuring with tools.
As students develop a sense of the attributes of measurement and the concept of a measurement unit, they also begin to recognize the
differences between using nonstandard and standard units of measure. Learning should give them opportunities to apply both
techniques and nonstandard and standard tools to find measurements and to develop an understanding of the use of simple U.S.
Customary and metric units.
Teaching measurement offers the challenge to involve students actively and physically in learning and is an opportunity to tie together
other aspects of the mathematical curriculum, such as fractions and geometry. It is also one of the major vehicles by which
mathematics can make connections with other content areas, such as science, health, and physical education.
GRADE 3 CURRICULUM GUIDE PRINCE WILLIAM COUNTY SCHOOLS
Curriculum Information
Essential Knowledge and Skills
Key Vocabulary
Essential Questions and Understandings
Teacher Notes and Elaborations
Strand
Measurement
SOL Reporting Category
Measurement and Geometry
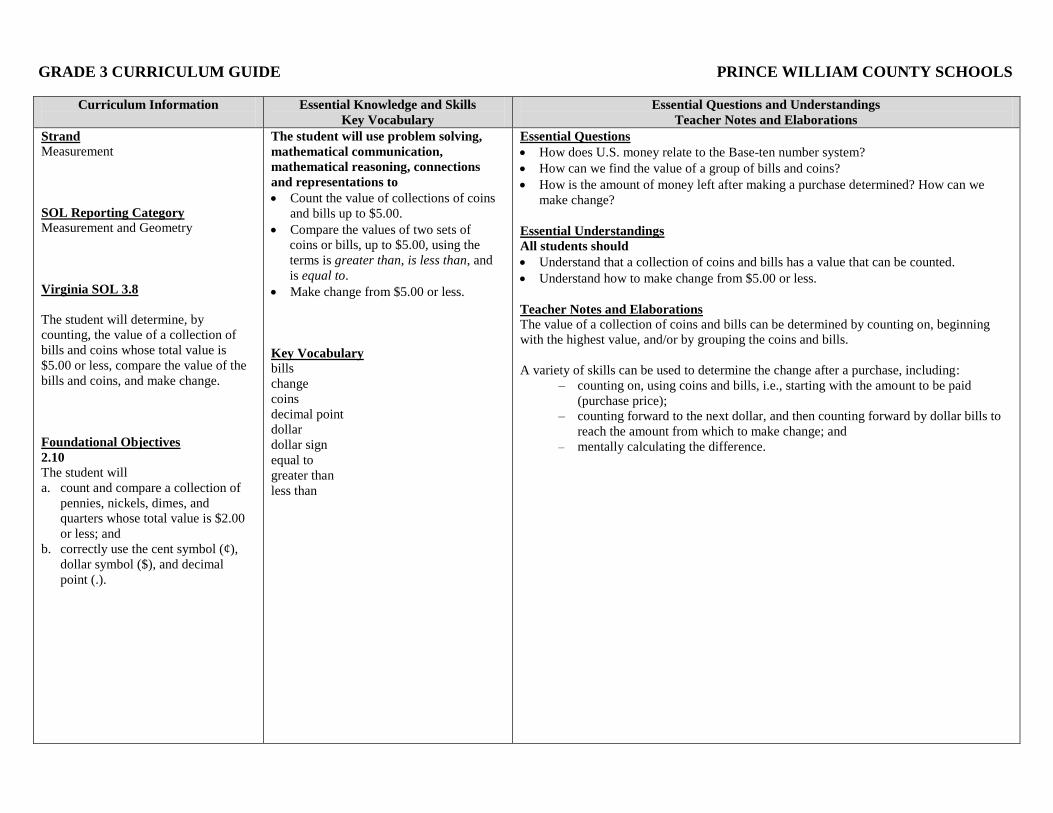
Virginia SOL 3.8
The student will determine, by
counting, the value of a collection of
bills and coins whose total value is
$5.00 or less, compare the value of the
bills and coins, and make change.
Foundational Objectives
2.10
The student will
a. count and compare a collection of
pennies, nickels, dimes, and
quarters whose total value is $2.00
or less; and
b. correctly use the cent symbol (¢),
dollar symbol ($), and decimal
point (.).
The student will use problem solving,
mathematical communication,
mathematical reasoning, connections
and representations to
Count the value of collections of coins
and bills up to $5.00.
Compare the values of two sets of
coins or bills, up to $5.00, using the
terms is greater than, is less than, and
is equal to.
Make change from $5.00 or less.
Key Vocabulary
bills
change
coins
decimal point
dollar
dollar sign
equal to
greater than
less than
Essential Questions
How does U.S. money relate to the Base-ten number system?
How can we find the value of a group of bills and coins?
How is the amount of money left after making a purchase determined? How can we
make change?
Essential Understandings
All students should
Understand that a collection of coins and bills has a value that can be counted.
Understand how to make change from $5.00 or less.
Teacher Notes and Elaborations
The value of a collection of coins and bills can be determined by counting on, beginning
with the highest value, and/or by grouping the coins and bills.
A variety of skills can be used to determine the change after a purchase, including:
– counting on, using coins and bills, i.e., starting with the amount to be paid
(purchase price);
– counting forward to the next dollar, and then counting forward by dollar bills to
reach the amount from which to make change; and
– mentally calculating the difference.

GRADE 3 CURRICULUM GUIDE PRINCE WILLIAM COUNTY SCHOOLS
Curriculum Information
Essential Knowledge and Skills
Key Vocabulary
Essential Questions and Understandings
Teacher Notes and Elaborations
Strand
Measurement
SOL Reporting Category
Measurement and Geometry
Virginia SOL 3.9
The student will estimate and use U.S.
Customary and metric units to measure
a) length to the nearest21 inch, inch,
foot, yard, centimeter, and meter;
b) liquid volume in cups, pints, quarts,
gallons, and liters;
c) weight/mass in ounces, pounds,
grams, and kilograms; and
d) area and perimeter.
Foundational Objective
2.11
The student will estimate and measure
a. length to the nearest centimeter and
inch;
b. weight/mass of objects in
pounds/ounces and
kilograms/grams, using a scale; and
c. liquid volume in cups, pints, quarts,
gallons, and liters.
The student will use problem solving,
mathematical communication,
mathematical reasoning, connections
and representations to
Estimate and use U.S. Customary and
metric units to measure lengths of
objects to the nearest21 of an inch, inch,
foot, yard, centimeter, and meter.
Determine the actual measure of length
using U.S. Customary and metric units
to measure objects to the nearest21 of an
inch, foot, yard, centimeter, and meter.
Estimate and use U.S. Customary and
metric units to measure liquid volume
to the nearest cup, pint, quart, gallon,
and liter.
Determine the actual measure of liquid
volume using U.S. Customary and
metric units to measure to the nearest
cup, pint, quart, gallon, and liter.
Estimate and use U.S. Customary and
metric units to measure the weight/mass
of objects to the nearest ounce, pound,
gram, and kilogram.
Determine the actual measure of
weight/mass using U.S. Customary and
metric units to measure the weight/mass
of objects to the nearest ounce, pound,
gram, and kilogram.
Estimate and use U.S. Customary and
metric units to measure area and
perimeter.
Determine the actual measure of area or
perimeter using U.S. Customary and
metric units.
Essential Questions
How is the length of an object measured?
What units are used to measure length?
How can measurement of length be estimated?
How is the liquid volume (capacity) of a container measured?
How can measurement of liquid volume be estimated?
How are measurements of weight/mass made?
How can measurement of weight/mass be estimated?
How is perimeter measured?
Why is area measured in square units?
How can measurements of perimeter and area be estimated?
Essential Understandings
All students should
Understand how to estimate measures of length, liquid volume, weight/mass, area and
perimeter.
Understand how to determine the actual measure of length, liquid volume, weight/mass,
area and perimeter.
Understand that perimeter is a measure of the distance around a polygon.
Understand that area is a measure of square units needed to cover a surface.
Teacher Notes and Elaborations
The concept of a standard measurement unit is one of the major ideas in understanding
measurement. Familiarity with standard units is developed through hands-on experiences of
comparing, estimating, measuring, and constructing.
Benchmarks of common objects need to be established for each of the specified units of
measure (e.g., the mass of a mathematics book is about one kilogram). Practical experience
measuring familiar objects helps to establish benchmarks and facilitates the student’s ability
to estimate measures. One unit of measure may be more appropriate than another to
measure an object, depending on the size of the object and the degree of accuracy desired.
Correct use of measurement tools is essential to understanding the concepts of
measurement. Research has shown that students often interpret the numbers on standard
rulers as fixed measurements regardless of where on the ruler they started their
measurement. A student who truly understands the concept of unit will not make this error.

GRADE 3 CURRICULUM GUIDE PRINCE WILLIAM COUNTY SCHOOLS
Curriculum Information
Essential Knowledge and Skills
Key Vocabulary
Essential Questions and Understandings
Teacher Notes and Elaborations
Strand
Measurement
SOL Reporting Category
Measurement and Geometry
Virginia SOL 3.9
The student will estimate and use U.S.
Customary and metric units to measure
a) length to the nearest21 inch, inch,
foot, yard, centimeter, and meter;
b) liquid volume in cups, pints, quarts,
gallons, and liters;
c) weight/mass in ounces, pounds,
grams, and kilograms; and
d) area and perimeter.
Foundational Objective
2.11
The student will estimate and measure
d. length to the nearest centimeter and
inch;
e. weight/mass of objects in
pounds/ounces and
kilograms/grams, using a scale; and
f. liquid volume in cups, pints, quarts,
gallons, and liters.
Key Vocabulary area
centimeter
cup
foot
gallon
gram
inch
kilogram
length
liquid volume
liter
mass
measure
meter
Metric system
ounce
perimeter
pint
pound
quart
U.S. Customary
weight
yard
Teacher Notes and Elaborations (continued)
When taught rule-based procedures such as, “Always place the end of the ruler at the very
end of the object to be measured; the length of the object is the amount shown on the ruler
at the other end of the object,” students may not develop measurement sense. Students
should learn to accurately deduce the length of objects that are not positioned at the zero
point of the measuring tool or which are longer than the measuring tool. Measuring with an
unmarked or “broken ruler” (with the first several units broken off) encourages students to
consider the actual number of units rather than focusing on the number printed on the ruler.
Students should use various tools to measure liquid volume including graduated cylinders,
measuring cups, and recycled containers (e.g., milk jugs). They develop measurement sense
by creating their own liquid measurement tools by marking calibrated measurements on
clear plastic containers.
Weight and mass are different. Mass is the amount of matter in an object. Weight is
determined by the pull of gravity on the mass of an object. The mass of an object remains
the same regardless of its location. The weight of an object changes dependent on the
gravitational pull at its location. In everyday life, most people are actually interested in
determining an object’s mass, although they use the term weight (e.g., “How much does it
weigh?” versus “What is its mass?”).
Perimeter is the distance around any two-dimensional figure and is found by adding the
measures of the sides.
Area is a two-dimensional measure and is therefore measured in square units. Area is the
number of square units needed to cover a figure, or more precisely, it is the measure in
square units of the interior region of a two-dimensional figure.
GRADE 3 CURRICULUM GUIDE PRINCE WILLIAM COUNTY SCHOOLS
Curriculum Information
Essential Knowledge and Skills
Key Vocabulary
Essential Questions and Understandings
Teacher Notes and Elaborations
Strand
Measurement
SOL Reporting Category
Measurement and Geometry
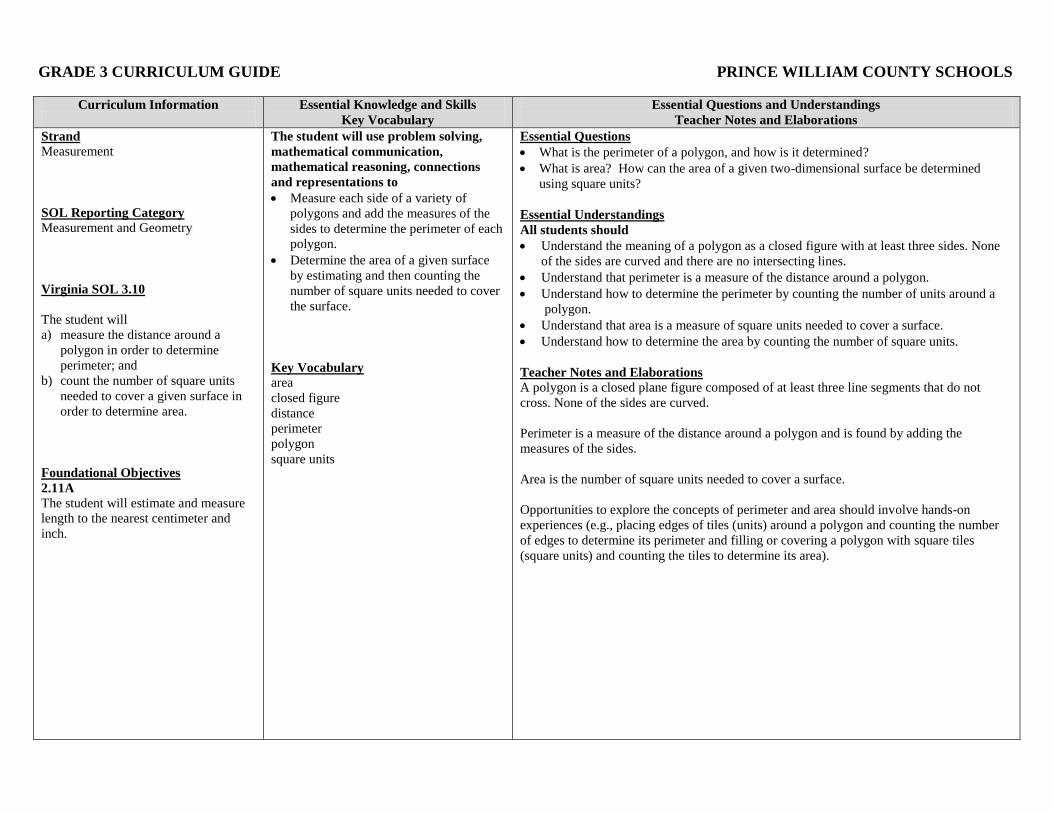
Virginia SOL 3.10
The student will
a) measure the distance around a
polygon in order to determine
perimeter; and
b) count the number of square units
needed to cover a given surface in
order to determine area.
Foundational Objectives
2.11A
The student will estimate and measure
length to the nearest centimeter and
inch.
The student will use problem solving,
mathematical communication,
mathematical reasoning, connections
and representations to
Measure each side of a variety of
polygons and add the measures of the
sides to determine the perimeter of each
polygon.
Determine the area of a given surface
by estimating and then counting the
number of square units needed to cover
the surface.
Key Vocabulary
area
closed figure
distance
perimeter
polygon
square units
Essential Questions
What is the perimeter of a polygon, and how is it determined?
What is area? How can the area of a given two-dimensional surface be determined
using square units?
Essential Understandings
All students should
Understand the meaning of a polygon as a closed figure with at least three sides. None
of the sides are curved and there are no intersecting lines.
Understand that perimeter is a measure of the distance around a polygon.
Understand how to determine the perimeter by counting the number of units around a
polygon.
Understand that area is a measure of square units needed to cover a surface.
Understand how to determine the area by counting the number of square units.
Teacher Notes and Elaborations
A polygon is a closed plane figure composed of at least three line segments that do not
cross. None of the sides are curved.
Perimeter is a measure of the distance around a polygon and is found by adding the
measures of the sides.
Area is the number of square units needed to cover a surface.
Opportunities to explore the concepts of perimeter and area should involve hands-on
experiences (e.g., placing edges of tiles (units) around a polygon and counting the number
of edges to determine its perimeter and filling or covering a polygon with square tiles
(square units) and counting the tiles to determine its area).

GRADE 3 CURRICULUM GUIDE PRINCE WILLIAM COUNTY SCHOOLS
Curriculum Information
Essential Knowledge and Skills
Key Vocabulary
Essential Questions and Understandings
Teacher Notes and Elaborations
Strand
Measurement
SOL Reporting Category
Measurement and Geometry
Virginia SOL 3.11
The student will
a) tell time to the nearest minute, using
analog and digital clocks; and
b) determine elapsed time in one-hour
increments over a 12-hour period.
Foundational Objectives
2.12
The student will tell and write time to
the nearest five minutes, using analog
and digital clocks.
The student will use problem solving,
mathematical communication,
mathematical reasoning, connections
and representations to
Tell time to the nearest minute, using
analog and digital clocks.
Match the times shown on analog and
digital clocks to written times and to
each other.
When given the beginning time and
ending time, determine the elapsed time
in one-hour increments within a 12-
hour period (times do not cross between
a.m. and p.m.).
Solve practical problems in relation to
time that has elapsed.
Key Vocabulary
analog clock
digital clock
elapsed
hour
minute
time
Essential Questions
How is time represented differently on digital and analog clocks?
In what everyday situations do we determine elapsed time?
How can elapsed time be determined (in hours)?
Essential Understandings
All students should
Apply appropriate techniques to determine time to the nearest minute, using analog and
digital clocks.
Understand how to determine elapsed time in one-hour increments over a 12-hour
period.
Teacher Notes and Elaborations
It is important for students to develop a sense of time. They can estimate the duration of a
given activity in minutes, hours, days, or weeks. They should relate time to everyday life
(e.g., classroom activities, TV, bus or movie schedules, etc.).
While digital clocks make reading time easy, it is necessary to ensure that students
understand that there are sixty minutes in an hour when using analog and digital clocks.
Use of a demonstration clock with gears ensures that the positions of the hour hand and the
minute hand are precise when time is read.
Students need to understand that time has passed or will pass. Elapsed time is the amount of
time that has passed between two given times. Elapsed time should be modeled and
demonstrated using geared analog clocks and timelines. Elapsed time can be found by
counting on from the beginning time to the finishing time, i.e. count the number of whole
hours between the beginning time and the finishing time. For example, to find the elapsed
time between 7 a.m. and 10 a.m., students can count on to find the difference between the
times (7 and 10), so the total elapsed time is 3 hours.

GRADE 3 CURRICULUM GUIDE PRINCE WILLIAM COUNTY SCHOOLS
Curriculum Information
Essential Knowledge and Skills
Key Vocabulary
Essential Questions and Understandings
Teacher Notes and Elaborations
Strand
Measurement
SOL Reporting Category
Measurement and Geometry
Virginia SOL 3.12
The student will identify equivalent
periods of time, including relationships
among days, months, and years, as well
as minutes and hours.
Foundational Objectives
2.12
The student will tell and write time to
the nearest five minutes, using analog
and digital clocks.
2.13
The student will
a. determine past and future days of
the week; and
b. identify specific days and dates on a
given calendar.
1.11
The student will use calendar language
appropriately (e.g., names of the
months, today, yesterday, next week,
last week).
The student will use problem solving,
mathematical communication,
mathematical reasoning, connections
and representations to
Identify equivalent relationships
observed in a calendar, including the
number of days in a given month, the
number of days in a week, the number
of days in a year, and the number of
months in a year.
Identify the number of minutes in an
hour and the number of hours in a day.
Key Vocabulary
calendar
date
day
leap year
month
week
year
Essential Questions
How are minutes, hours, days, weeks, months, and years related?
What are some time patterns found in the calendar?
Essential Understandings
All students should
Understand the relationship that exists among periods of time, using calendars and
clocks.
Teacher Notes and Elaborations
The use of a calendar facilitates the understanding of time relationships between days and
months, days and weeks, days and years, and months and years. If the date is January 6,
what date would it be in two weeks? How many weeks are in March, April, and May? The
knowledge that a year has 365 and 41 days will help students understand the necessity of
adding a full day every fourth year, called a leap year.
The use of an analog clock facilitates the understanding of time relationships between
minutes and hours and hours and days. Recognize that students need to know the
relationships; such as if there are 24 hours in one day, how many hours are in three days?
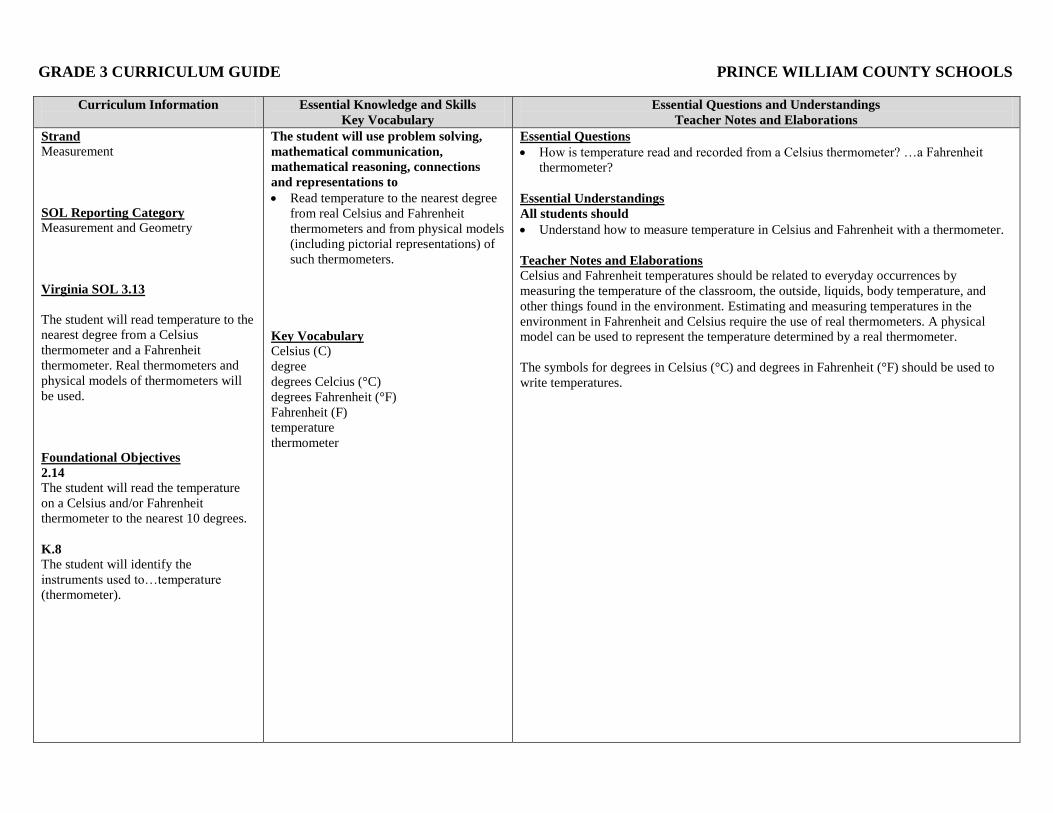
GRADE 3 CURRICULUM GUIDE PRINCE WILLIAM COUNTY SCHOOLS
Curriculum Information
Essential Knowledge and Skills
Key Vocabulary
Essential Questions and Understandings
Teacher Notes and Elaborations
Strand
Measurement
SOL Reporting Category
Measurement and Geometry
Virginia SOL 3.13
The student will read temperature to the
nearest degree from a Celsius
thermometer and a Fahrenheit
thermometer. Real thermometers and
physical models of thermometers will
be used.
Foundational Objectives
2.14
The student will read the temperature
on a Celsius and/or Fahrenheit
thermometer to the nearest 10 degrees.
K.8 The student will identify the
instruments used to…temperature
(thermometer).
The student will use problem solving,
mathematical communication,
mathematical reasoning, connections
and representations to
Read temperature to the nearest degree
from real Celsius and Fahrenheit
thermometers and from physical models
(including pictorial representations) of
such thermometers.
Key Vocabulary
Celsius (C)
degree
degrees Celcius (°C)
degrees Fahrenheit (°F)
Fahrenheit (F)
temperature
thermometer
Essential Questions
How is temperature read and recorded from a Celsius thermometer? …a Fahrenheit
thermometer?
Essential Understandings
All students should
Understand how to measure temperature in Celsius and Fahrenheit with a thermometer.
Teacher Notes and Elaborations
Celsius and Fahrenheit temperatures should be related to everyday occurrences by
measuring the temperature of the classroom, the outside, liquids, body temperature, and
other things found in the environment. Estimating and measuring temperatures in the
environment in Fahrenheit and Celsius require the use of real thermometers. A physical
model can be used to represent the temperature determined by a real thermometer.
The symbols for degrees in Celsius (°C) and degrees in Fahrenheit (°F) should be used to
write temperatures.

FOCUS K-3_____________________STRAND: GEOMETRY______________________GRADE LEVEL 3
Children begin to develop geometric and spatial knowledge before beginning school, stimulated by the exploration of figures and
structures in their environment. Geometric ideas help children systematically represent and describe their world as they learn to
represent plane and solid figures through drawing, block constructions, dramatization, and verbal language.
The focus of instruction at this level is on
observing, identifying, describing, comparing, contrasting, and investigating solid objects and their faces;
sorting objects and ordering them directly by comparing them one to the other;
describing, comparing, contrasting, sorting, and classifying figures; and
exploring symmetry, congruence, and transformation.
In the primary grades, children begin to develop basic vocabulary related to these figures but do not develop precise meanings for
many of the terms they use until they are thinking beyond Level 2 of the van Hiele theory (see below).
The van Hiele theory of geometric understanding describes how students learn geometry and provides a framework for structuring
student experiences that should lead to conceptual growth and understanding.
Level 0: Pre-cognition. Geometric figures are not recognized. For example, the students cannot differentiate between three-sided
and four-sided polygons.
Level 1: Visualization. Geometric figures are recognized as entities, without any awareness of parts of figures or relationships
between components of a figure. Students should recognize and name figures and distinguish a given figure from others that look
somewhat the same. (This is the expected level of student performance during grades K and 1.)
Level 2: Analysis. Properties are perceived but are isolated and unrelated. Students should recognize and name properties of
geometric figures. (Students are expected to transition to this level during grades 2 and 3.)
GRADE 3 CURRICULUM GUIDE PRINCE WILLIAM COUNTY SCHOOLS
Curriculum Information
Essential Knowledge and Skills
Key Vocabulary
Essential Questions and Understandings
Teacher Notes and Elaborations
Strand
Geometry
SOL Reporting Category
Measurement and Geometry
Virginia SOL 3.14
The student will identify, describe,
compare, and contrast characteristics of
plane and solid geometric figures
(circle, square, rectangle,
triangle, cube, rectangular prism, square
pyramid, sphere, cone, and cylinder) by
identifying relevant characteristics,
including the number of angles,
vertices, and edges, and the number and
shape of faces, using concrete models.
Foundational Objectives
2.16
The student will identify, describe,
compare, and contrast plane and solid
geometric figures (circle/sphere,
square/cube, and rectangle/rectangular
prism).
1.12
The student will identify and trace,
describe, and sort plane geometric
figures (triangle, square, rectangle, and
circle) according to number of sides,
vertices, and right angles.
The student will use problem solving,
mathematical communication,
mathematical reasoning, connections
and representations to
Identify models and pictures of plane
geometric figures (circle, square,
rectangle, and triangle) and solid
geometric figures (cube, rectangular
prism, square pyramid, sphere, cone,
and cylinder) by name.
Identify and describe plane geometric
figures by counting the number of sides
and angles.
Identify and describe solid geometric
figures by counting the number of
angles, vertices, edges, and by the
number and shape of faces.
Compare and contrast characteristics of
plane and solid geometric figures (e.g.,
circle/sphere, square/cube,
triangle/square pyramid, and
rectangle/rectangular prism), by
counting the number of sides, angles,
vertices, edges, and the number and
shape of faces.
Compare and contrast characteristics of
solid geometric figures (i.e., cube,
rectangular prism, square pyramid,
sphere, cylinder, and cone) to similar
objects in everyday life (e.g., a party hat
is like a cone).
Identify characteristics of solid
geometric figures (cylinder, cone, cube,
square pyramid, and rectangular prism).
Essential Questions
How are sides, angles, vertices, edges, and faces used to describe plane and solid
geometric figures?
How can the characteristics (attributes) of geometric figures be used to recognize and
define them?
What are the differences and similarities between and among plane and solid geometric
shapes?
Essential Understandings
All students should
Understand how to identify and describe plane and solid geometric figures by using
relevant characteristics.
Understand the similarities and differences between plane and solid figures.
Teacher Notes and Elaborations
The study of geometric figures must be active, using visual images and concrete materials.
Access to a variety of concrete tools such as graph paper, pattern blocks, geoboards, and
geometric solids is greatly enhanced by computer software tools that support exploration.
Opportunity must be provided for building and using geometric vocabulary to describe
plane and solid figures.
The van Hiele theory of geometric understanding describes how students learn geometry
and provides a framework for structuring student experiences that should lead to conceptual
growth and understanding.
– Level 0: Pre-recognition. Geometric figures are not recognized. For example,
students cannot differentiate between three-sided and four-sided polygons.
– Level 1: Visualization. Geometric figures are recognized as entities, without any
awareness of parts of figures or relationships between components of a figure.
Students should recognize and name figures and distinguish a given figure from
others that look somewhat the same (e.g., “I know it’s a rectangle because it
looks like a door, and I know that the door is a rectangle.”).
– Level 2: Analysis. Properties are perceived, but are isolated and unrelated.
Students should recognize and name properties of geometric figures (e.g., “I
know it’s a rectangle because it’s closed, it has four sides and four right angles,
and opposite sides are parallel.”).
A plane geometric figure is any two-dimensional closed figure. Circles and polygons are
examples of plane geometric figures. A circle is not considered a polygon.

GRADE 3 CURRICULUM GUIDE PRINCE WILLIAM COUNTY SCHOOLS
Curriculum Information
Essential Knowledge and Skills
Key Vocabulary
Essential Questions and Understandings
Teacher Notes and Elaborations
Strand
Geometry
SOL Reporting Category
Measurement and Geometry
Virginia SOL 3.14
The student will identify, describe,
compare, and contrast characteristics of
plane and solid geometric figures
(circle, square, rectangle,
triangle, cube, rectangular prism, square
pyramid, sphere, cone, and cylinder) by
identifying relevant characteristics,
including the number of angles,
vertices, and edges, and the number and
shape of faces, using concrete models.
Foundational Objectives
2.16
The student will identify, describe,
compare, and contrast plane and solid
geometric figures (circle/sphere,
square/cube, and rectangle/rectangular
prism).
1.12
The student will identify and trace,
describe, and sort plane geometric
figures (triangle, square, rectangle, and
circle) according to number of sides,
vertices, and right angles.
Key Vocabulary
angles
circle
cone
cylinder
cube
edges
face
plane
rectangle
rectangular prism
sides
solid
sphere
square
square pyramid
triangle
vertices
vertex
Teacher Notes and Elaborations (continued)
Three-dimensional figures are called solid figures or simply solids. Solids enclose a region
of space. The interior of both plane and solid figures are not part of the figure. Solids are
classified by the types of surfaces they have. These surfaces may be flat, curved, or both. A
solid geometric object can be hollow rather than solid. The word “solid” indicates a three-
dimensional figure.
A face is a polygon that serves as one side of a solid figure (e.g., a square is a face of a
cube). An edge is the line segment where two faces of a solid figure intersect.
A vertex is the point at which two lines, line segments, or rays meet to form an angle. It is
also the point on a three dimensional figure where three or more faces intersect.
A rectangular prism is a solid figure in which all six faces are rectangles with three pair of
parallel congruent opposite faces. A cube is a special rectangular prism with six congruent
square faces and with every edge the same length.
A sphere is a solid figure with all of its points the same distance from its center.
A square pyramid is a solid figure with one square face and four triangular faces that share a
common vertex.
A cylinder is a solid figure formed by two congruent parallel circles joined by a curved
surface. A cone is a solid, pointed figure that has a flat, round face (usually a circle) that is
joined to a vertex by a curved surface. The curved surface of a cone or cylinder is not
considered a face. Since circles are not polygons, the circular bases are not considered faces
either. Cylinders and cones do not have edges.
The following chart defines the characteristics of solid geometric figures.
Solid Geometric Figure # of Faces Shape of Faces # of Edges # of Vertices
Cube 6 squares 12 8
Rectangular Prism 6 rectangles 12 8
Square Pyramid 5 Square/triangles 8 5
Sphere 0 none 0 0
Cone 0 none* 0 0**
Cylinder 0 none* 0 0
*Cones and cylinders do not have faces. They have bases that are circles.
**The tip of the cone is called an apex.

GRADE 3 CURRICULUM GUIDE PRINCE WILLIAM COUNTY SCHOOLS
Curriculum Information
Essential Knowledge and Skills
Key Vocabulary
Essential Questions and Understandings
Teacher Notes and Elaborations
Strand
Geometry
SOL Reporting Category
Measurement and Geometry
Virginia SOL 3.15
The student will identify and draw
representations of points, line segments,
rays, angles, and lines.
The student will use problem solving,
mathematical communication,
mathematical reasoning, connections
and representations to
Identify examples of points, line
segments, rays, angles, and lines.
Draw representations of points, line
segments, rays, angles, and lines, using
a ruler or straightedge.
Key Vocabulary
angle
line
line segment
point
ray
Essential Questions
What is the relationship between rays and angles? …lines and line segments?
How can a set of intersecting lines be used to demonstrate the relationships between and
among points, lines, line segments, rays, and angles?
Essential Understandings
All students should
Understand that line segments and angles are fundamental components of plane
polygons.
Understand that a line segment is a part of a line, has two end points, and contains all the
points between those two endpoints.
Understand that points make up a line.
Understand that a line continues indefinitely in two opposite directions.
Understand that a ray is part of a line, has one endpoint, and continues indefinitely in
only one direction.
Understand that an angle is formed by two rays having a common endpoint.
Teacher Notes and Elaborations
Understanding points, lines, segments, rays, and angles is essential to understanding more
complex geometric figures and relationships. Students should have many opportunities to
describe objects in real life using these ideas. They should also apply these concepts to
analyze the properties of geometric figures.
A point is an exact location in space. It has no length or width. Usually, a point is named
with a capital letter.
A line is a collection of points going on and on in both directions. It has no endpoints. When
a line is drawn, at least two points on it can be marked and given capital letter names. The
line can also be named with a single, lower-case letter. Arrows must be drawn to show that
the line goes on in both directions infinitely. A line has only one dimension: length.
A line segment is part of a line. It has two endpoints and includes all the points between
those endpoints. The endpoints are used to name a line segment. Below is segment AB.
A B
A B

GRADE 3 CURRICULUM GUIDE PRINCE WILLIAM COUNTY SCHOOLS
Curriculum Information
Essential Questions and Understandings
Teacher Notes and Elaborations
Strand
Geometry
SOL Reporting Category
Measurement and Geometry
Virginia SOL 3.15
The student will identify and draw
representations of points, line segments,
rays, angles, and lines.
Teacher Notes and Elaborations (continued)
A ray is part of a line. It has one endpoint and continues on and on in one direction. Below is ray BA.
B A
An angle is formed by two rays having a common endpoint. This endpoint is called the vertex. Angles are found wherever lines and line
segments intersect. An angle can be named in three different ways by using:
– three letters to name, in this order, a point on one ray, the vertex, and a point on the other ray;
– one letter at the vertex; or
– a number written inside the rays of the angle.
This angle could be called angle ABC, angle CBA, angle B or angle 1.
Angle rulers may be particularly useful in developing the concept of an angle.
C
B
A
1

GRADE 3 CURRICULUM GUIDE PRINCE WILLIAM COUNTY SCHOOLS
Curriculum Information
Essential Knowledge and Skills
Key Vocabulary
Essential Questions and Understandings
Teacher Notes and Elaborations
Strand
Geometry
SOL Reporting Category
Measurement and Geometry
Virginia SOL 3.16
The student will identify and describe
congruent and noncongruent plane
figures.
The student will use problem solving,
mathematical communication,
mathematical reasoning, connections
and representations to
Identify examples of congruent and
noncongruent figures. Verify their
congruence by laying one on top of the
other using drawings or models.
Determine and explain why plane
figures are congruent or noncongruent,
using tracing procedures.
Key Vocabulary
congruent
noncongruent
Essential Questions
How can you determine whether two figures are congruent or noncongruent?
How can you verify that congruent plane figures remain congruent even if their
positions are changed? …that noncongruent figures remain noncongruent…?
Essential Understandings
All students should
Understand that congruent plane figures match exactly.
Understand that noncongruent plane figures do not match exactly.
Understand that congruent plane figures remain congruent even if they are in different
spatial orientations.
Understand that noncongruent plane figures remain noncongruent even if they are in
different spatial orientations.
Teacher Notes and Elaborations
Congruent plane figures are figures having exactly the same size and shape. Noncongruent
plane figures are figures that are not exactly the same size and/or shape. For example; two
circles that are different sizes are noncongruent. Opportunities for exploring figures that are
congruent and/or noncongruent can best be accomplished by using physical models. Change
in position (geometric transformation) does not alter the congruence of figures.
Have students identify figures that are congruent or noncongruent by using direct
comparisons and/or tracing procedures.
FOCUS K-3________________STRAND: PROBABILITY AND STATISTICS_________GRADE LEVEL 3
Students in the primary grades have a natural curiosity about their world, which leads to questions about how things fit together or
connect. They display their natural need to organize things by sorting and counting objects in a collection according to similarities and
differences with respect to given criteria.
The focus of probability instruction at this level is to help students begin to develop an understanding of the concept of chance. They
experiment with spinners, two-colored counters, dice, tiles, coins, and other manipulatives to explore the possible outcomes of
situations and predict results. They begin to describe the likelihood of events, using the terms impossible, unlikely, equally likely, more
likely, and certain.
The focus of statistics instruction at this level is to help students develop methods of collecting, organizing, describing, displaying, and
interpreting data to answer questions they have posed about themselves and their world.
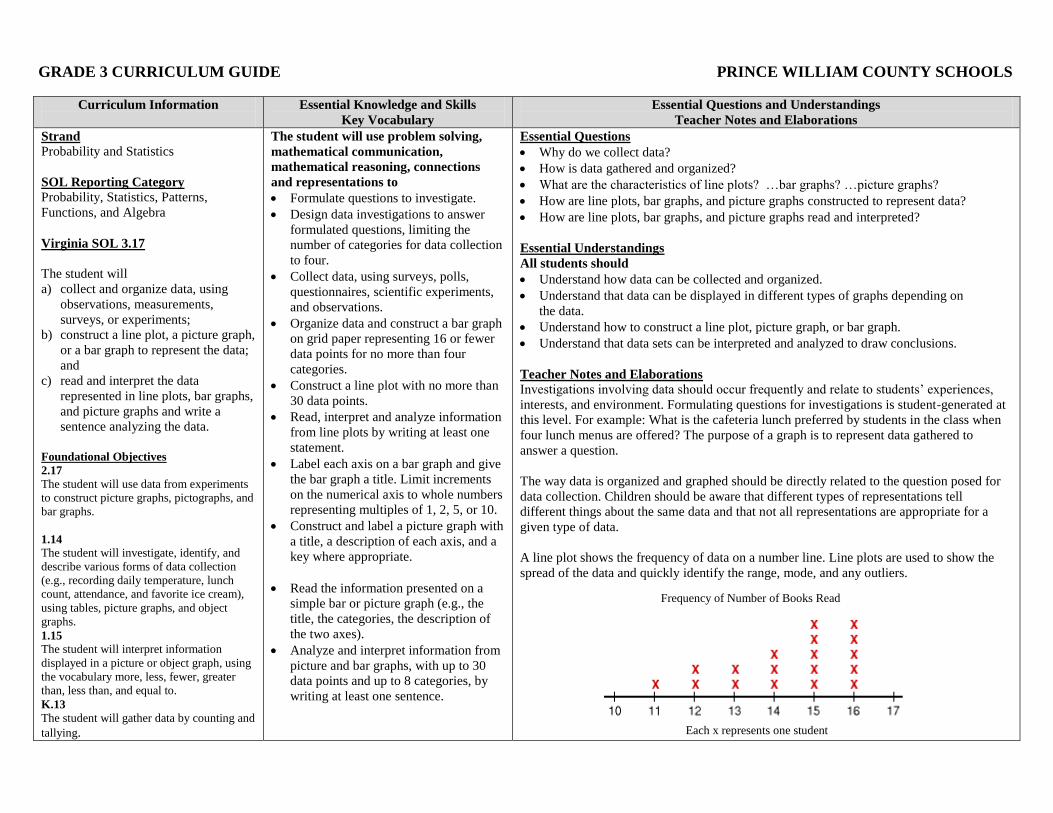
GRADE 3 CURRICULUM GUIDE PRINCE WILLIAM COUNTY SCHOOLS
Curriculum Information
Essential Knowledge and Skills
Key Vocabulary
Essential Questions and Understandings
Teacher Notes and Elaborations
Strand
Probability and Statistics
SOL Reporting Category Probability, Statistics, Patterns,
Functions, and Algebra
Virginia SOL 3.17
The student will
a) collect and organize data, using
observations, measurements,
surveys, or experiments;
b) construct a line plot, a picture graph,
or a bar graph to represent the data;
and
c) read and interpret the data
represented in line plots, bar graphs,
and picture graphs and write a
sentence analyzing the data.
Foundational Objectives
2.17
The student will use data from experiments
to construct picture graphs, pictographs, and
bar graphs.
1.14
The student will investigate, identify, and
describe various forms of data collection
(e.g., recording daily temperature, lunch
count, attendance, and favorite ice cream),
using tables, picture graphs, and object
graphs.
1.15 The student will interpret information
displayed in a picture or object graph, using
the vocabulary more, less, fewer, greater
than, less than, and equal to.
K.13
The student will gather data by counting and
tallying.
The student will use problem solving,
mathematical communication,
mathematical reasoning, connections
and representations to
Formulate questions to investigate.
Design data investigations to answer
formulated questions, limiting the
number of categories for data collection
to four.
Collect data, using surveys, polls,
questionnaires, scientific experiments,
and observations.
Organize data and construct a bar graph
on grid paper representing 16 or fewer
data points for no more than four
categories.
Construct a line plot with no more than
30 data points.
Read, interpret and analyze information
from line plots by writing at least one
statement.
Label each axis on a bar graph and give
the bar graph a title. Limit increments
on the numerical axis to whole numbers
representing multiples of 1, 2, 5, or 10.
Construct and label a picture graph with
a title, a description of each axis, and a
key where appropriate.
Read the information presented on a
simple bar or picture graph (e.g., the
title, the categories, the description of
the two axes).
Analyze and interpret information from
picture and bar graphs, with up to 30
data points and up to 8 categories, by
writing at least one sentence.
Essential Questions
Why do we collect data?
How is data gathered and organized?
What are the characteristics of line plots? …bar graphs? …picture graphs?
How are line plots, bar graphs, and picture graphs constructed to represent data?
How are line plots, bar graphs, and picture graphs read and interpreted?
Essential Understandings
All students should
Understand how data can be collected and organized.
Understand that data can be displayed in different types of graphs depending on
the data.
Understand how to construct a line plot, picture graph, or bar graph.
Understand that data sets can be interpreted and analyzed to draw conclusions.
Teacher Notes and Elaborations
Investigations involving data should occur frequently and relate to students’ experiences,
interests, and environment. Formulating questions for investigations is student-generated at
this level. For example: What is the cafeteria lunch preferred by students in the class when
four lunch menus are offered? The purpose of a graph is to represent data gathered to
answer a question.
The way data is organized and graphed should be directly related to the question posed for
data collection. Children should be aware that different types of representations tell
different things about the same data and that not all representations are appropriate for a
given type of data.
A line plot shows the frequency of data on a number line. Line plots are used to show the
spread of the data and quickly identify the range, mode, and any outliers.
Frequency of Number of Books Read
Each x represents one student
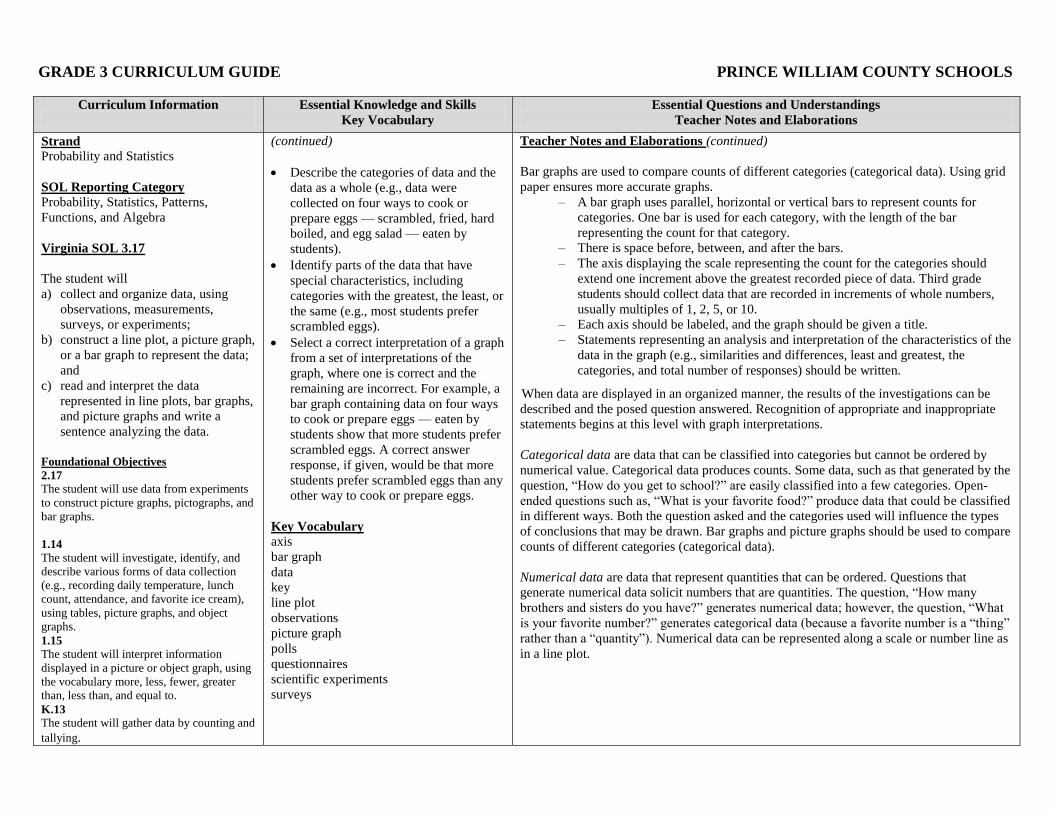
GRADE 3 CURRICULUM GUIDE PRINCE WILLIAM COUNTY SCHOOLS
Curriculum Information
Essential Knowledge and Skills
Key Vocabulary
Essential Questions and Understandings
Teacher Notes and Elaborations
Strand
Probability and Statistics
SOL Reporting Category Probability, Statistics, Patterns,
Functions, and Algebra
Virginia SOL 3.17
The student will
a) collect and organize data, using
observations, measurements,
surveys, or experiments;
b) construct a line plot, a picture graph,
or a bar graph to represent the data;
and
c) read and interpret the data
represented in line plots, bar graphs,
and picture graphs and write a
sentence analyzing the data.
Foundational Objectives
2.17
The student will use data from experiments
to construct picture graphs, pictographs, and
bar graphs.
1.14
The student will investigate, identify, and
describe various forms of data collection
(e.g., recording daily temperature, lunch
count, attendance, and favorite ice cream),
using tables, picture graphs, and object
graphs.
1.15 The student will interpret information
displayed in a picture or object graph, using
the vocabulary more, less, fewer, greater
than, less than, and equal to.
K.13
The student will gather data by counting and
tallying.
(continued)
Describe the categories of data and the
data as a whole (e.g., data were
collected on four ways to cook or
prepare eggs — scrambled, fried, hard
boiled, and egg salad — eaten by
students).
Identify parts of the data that have
special characteristics, including
categories with the greatest, the least, or
the same (e.g., most students prefer
scrambled eggs).
Select a correct interpretation of a graph
from a set of interpretations of the
graph, where one is correct and the
remaining are incorrect. For example, a
bar graph containing data on four ways
to cook or prepare eggs — eaten by
students show that more students prefer
scrambled eggs. A correct answer
response, if given, would be that more
students prefer scrambled eggs than any
other way to cook or prepare eggs.
Key Vocabulary
axis
bar graph
data
key
line plot
observations
picture graph
polls
questionnaires
scientific experiments
surveys
Teacher Notes and Elaborations (continued)
Bar graphs are used to compare counts of different categories (categorical data). Using grid
paper ensures more accurate graphs.
– A bar graph uses parallel, horizontal or vertical bars to represent counts for
categories. One bar is used for each category, with the length of the bar
representing the count for that category.
– There is space before, between, and after the bars.
– The axis displaying the scale representing the count for the categories should
extend one increment above the greatest recorded piece of data. Third grade
students should collect data that are recorded in increments of whole numbers,
usually multiples of 1, 2, 5, or 10.
– Each axis should be labeled, and the graph should be given a title.
– Statements representing an analysis and interpretation of the characteristics of the
data in the graph (e.g., similarities and differences, least and greatest, the
categories, and total number of responses) should be written.
When data are displayed in an organized manner, the results of the investigations can be
described and the posed question answered. Recognition of appropriate and inappropriate
statements begins at this level with graph interpretations.
Categorical data are data that can be classified into categories but cannot be ordered by
numerical value. Categorical data produces counts. Some data, such as that generated by the
question, “How do you get to school?” are easily classified into a few categories. Open-
ended questions such as, “What is your favorite food?” produce data that could be classified
in different ways. Both the question asked and the categories used will influence the types
of conclusions that may be drawn. Bar graphs and picture graphs should be used to compare
counts of different categories (categorical data).
Numerical data are data that represent quantities that can be ordered. Questions that
generate numerical data solicit numbers that are quantities. The question, “How many
brothers and sisters do you have?” generates numerical data; however, the question, “What
is your favorite number?” generates categorical data (because a favorite number is a “thing”
rather than a “quantity”). Numerical data can be represented along a scale or number line as
in a line plot.

GRADE 3 CURRICULUM GUIDE PRINCE WILLIAM COUNTY SCHOOLS
Curriculum Information
Essential Questions and Understandings
Teacher Notes and Elaborations
Strand
Probability and Statistics
SOL Reporting Category Probability, Statistics, Patterns,
Functions, and Algebra
Virginia SOL 3.17
The student will
a) collect and organize data, using
observations, measurements,
surveys, or experiments;
b) construct a line plot, a picture graph,
or a bar graph to represent the data;
and
c) read and interpret the data
represented in line plots, bar graphs,
and picture graphs and write a
sentence analyzing the data.
Foundational Objectives
2.17
The student will use data from experiments
to construct picture graphs, pictographs, and
bar graphs.
1.14
The student will investigate, identify, and
describe various forms of data collection
(e.g., recording daily temperature, lunch
count, attendance, and favorite ice cream),
using tables, picture graphs, and object
graphs.
1.15 The student will interpret information
displayed in a picture or object graph, using
the vocabulary more, less, fewer, greater
than, less than, and equal to.
K.13
The student will gather data by counting and
tallying.
Teacher Notes and Elaborations (continued)
Students in Grade 3 do not need to master the terms “categorical” and numerical”, but they do need to develop a functional understanding
of the two types of data. They need to be able to determine whether the questions they choose will produce data that are quantities or data
that can be classified into categories. They need experience designing and evaluating categories for data and deciding what to do with data
that doesn’t fit or seems unclear.

GRADE 3 CURRICULUM GUIDE PRINCE WILLIAM COUNTY SCHOOLS
Curriculum Information
Essential Knowledge and Skills
Key Vocabulary
Essential Questions and Understandings
Teacher Notes and Elaborations
Strand
Probability and Statistics
SOL Reporting Category Probability, Statistics, Patterns,
Functions, and Algebra
Virginia SOL 3.18
The student will investigate and
describe the concept of probability as
chance and list possible results of a
given situation.
Foundational Objective
2.18
The student will use data from
experiments to predict outcomes when
the experiment is repeated.
The student will use problem solving,
mathematical communication,
mathematical reasoning, connections
and representations to
Define probability as the chance that an
event will happen.
List all possible outcomes for a given
situation (e.g., heads and tails are the
two possible outcomes of flipping a
coin).
Identify the degree of likelihood of an
outcome occurring using terms such as
impossible, unlikely, as likely as,
equally likely, likely, and certain.
Key Vocabulary
as likely as
certain
chance
equally likely
impossible
likely
probability
unlikely
Essential Questions
What is meant by “probability?”
How is the chance of an outcome predicted?
How can the possible results of an event be shown?
How can words be used to describe the likelihood of a specific result?
Essential Understandings
All students should
Investigate, understand, and apply basic concepts of probability.
Understand that probability is the chance of an event happening.
Teacher Notes and Elaborations
A spirit of investigation and experimentation should permeate probability instruction, where
students are actively engaged in explorations and have opportunities to use manipulatives.
Investigation of experimental probability is continued at this level through informal
activities using two-colored counters, spinners, and random number generators (number cubes).
Probability is the chance of an event occurring. The probability of an event occurring is the
ratio of desired outcomes to the total number of possible outcomes. If all the outcomes of an
event are equally likely to occur,
the probability of the event =
The probability of an event occurring is represented by a ratio between 0 and 1. An event is
“impossible” if it has a probability of 0 (e.g., the probability that the month of April will
have 31 days). An event is “certain” if it has a probability of 1 (e.g., the probability that the
sun will rise tomorrow morning).
When a probability experiment has very few trials, the results can be misleading. The more
times an experiment is done, the closer the experimental probability comes to the theoretical
probability (e.g., a coin lands heads up half of the time).
Students should have opportunities to describe in informal terms (i.e., impossible, unlikely,
as likely as, equally likely, likely, and certain) the degree of likelihood of an event
occurring. Activities should include real-life examples. For any event, such as flipping a
coin, the equally likely things that can happen are called outcomes. For example, there are
two equally likely outcomes when flipping a coin: the coin can land heads up, or the coin
can land tails up.
A sample space represents all possible outcomes of an experiment. The sample space may
be organized in a list, table, or chart.
number of favorable outcomes
total number of possible outcomes.

FOCUS K-3_________STRAND: PATTERNS, FUNCTIONS, AND ALGEBRA________GRADE LEVEL 3
Stimulated by the exploration of their environment, children begin to develop concepts related to patterns, functions, and algebra
before beginning school. Recognition of patterns and comparisons are important components of children’s mathematical development.
Students in kindergarten through third grade develop the foundation for understanding various types of patterns and functional
relationships through the following experiences:
sorting, comparing, and classifying objects in a collection according to a variety of attributes and properties;
identifying, analyzing, and extending patterns;
creating repetitive patterns and communicating about these patterns in their own language;
analyzing simple patterns and making predictions about them;
recognizing the same pattern in different representations;
describing how both repeating and growing patterns are generated; and
repeating predictable sequences in rhymes and extending simple rhythmic patterns.
The focus of instruction at the primary level is to observe, recognize, create, extend, and describe a variety of patterns. These students
will experience and recognize visual, kinesthetic, and auditory patterns and develop the language to describe them orally and in
writing as a foundation to using symbols. They will use patterns to explore mathematical and geometric relationships and to solve
problems, and their observations and discussions of how things change will eventually lead to the notion of functions and ultimately to
algebra.

GRADE 3 CURRICULUM GUIDE PRINCE WILLIAM COUNTY SCHOOLS
Curriculum Information
Essential Knowledge and Skills
Key Vocabulary
Essential Questions and Understandings
Teacher Notes and Elaborations
Strand
Patterns, Functions, and Algebra
SOL Reporting Category Probability, Statistics, Patterns,
Functions, and Algebra
Virginia SOL 3.19
The student will recognize and describe
a variety of patterns formed using
numbers, tables, and pictures, and
extend the patterns, using the same or
different forms.
Foundational Objectives
2.20
The student will identify, create, and
extend a wide variety of patterns.
1.17
The student will recognize, describe,
extend, and create a wide variety of
growing and repeating patterns.
The student will use problem solving,
mathematical communication,
mathematical reasoning, connections
and representations to
Recognize repeating and growing
numeric and geometric patterns (e.g.,
skip counting, addition tables, and
multiplication tables).
Describe repeating and growing
numeric and geometric patterns formed
using numbers, tables, and/or pictures,
using the same or different forms.
Extend repeating and growing patterns
of numbers or figures using concrete
objects, numbers, tables, and/or
pictures.
Key Vocabulary core
extend
growing pattern
number pattern
pattern
repeating pattern
Essential Questions
What is a pattern?
How is a pattern analyzed to understand how it grows or changes?
How can a pattern be expressed in different forms?
Essential Understandings
All students should
Understand that numeric and geometric patterns can be expressed in words or symbols.
Understand the structure of a pattern and how it grows or changes.
Understand that mathematical relationships exist in patterns.
Understand that patterns can be translated from one representation to another.
Teacher Notes and Elaborations
Exploring patterns requires active physical and mental involvement. The use of materials to
extend patterns permits experimentation or trial-and-error approaches that are almost
impossible without them. Reproduction of a given pattern in a different representation,
using symbols and objects, lays the foundation for writing numbers symbolically or
algebraically.
The simplest types of patterns are repeating patterns. In each case, students need to identify
the basic unit of the pattern and repeat it. Opportunities to create, recognize, describe, and
extend repeating patterns are essential to the primary school experience.
Growing patterns are more difficult for students to understand than repeating patterns
because not only must they determine what comes next, they must also begin the process of
generalization. Students need experiences with growing patterns in both arithmetic and
geometric formats.
Create an arithmetic number pattern. Sample numeric patterns include:
– 6, 9, 12, 15, 18, …(growing pattern – increases by 3);
– 1, 2, 4, 7, 11, 16, …(growing pattern – increases by 1, then 2, then 3, etc);
– 20, 18, 16, 14,…(growing pattern – shrinks by 2); and
– 1, 3, 5, 1, 3, 5, 1, 3, 5 … (repeating pattern – 1, 3, 5 is the repeating core).
In geometric patterns, students must often recognize transformations of a figure, particularly
rotation or reflection. Rotation is the result of turning a figure around a point or a vertex,
and reflection is the result of flipping a figure over a line.

GRADE 3 CURRICULUM GUIDE PRINCE WILLIAM COUNTY SCHOOLS
Curriculum Information
Essential Questions and Understandings
Teacher Notes and Elaborations
Strand
Patterns, Functions, and Algebra
SOL Reporting Category Probability, Statistics, Patterns,
Functions, and Algebra
Virginia SOL 3.19
The student will recognize and describe
a variety of patterns formed using
numbers, tables, and pictures, and
extend the patterns, using the same or
different forms.
Foundational Objectives
2.20
The student will identify, create, and
extend a wide variety of patterns.
1.17
The student will recognize, describe,
extend, and create a wide variety of
growing and repeating patterns.
Teacher Notes and Elaborations (continued)
Sample geometric patterns include: O Δ O O Δ Δ O O O Δ Δ Δ … and □□__□_□□__□_…
A table of values can be analyzed to determine the pattern that has been used, and that pattern can then be used to find the next value.
A logical pattern is a predictable sequence of elements (sounds, colors, letters, words, numbers, objects, geometric shapes, etc.). Logical
patterns occur regularly in mathematics. A pattern is recognized by detecting its underlying structure or rule. Identifying and extending
patterns is an important process in algebraic thinking. Discussion of how each element in a pattern relates to the previous element leads to
analysis of the pattern, to its extension, and to the creation of the pattern in different manifestations. The same pattern can be found in
many different forms.
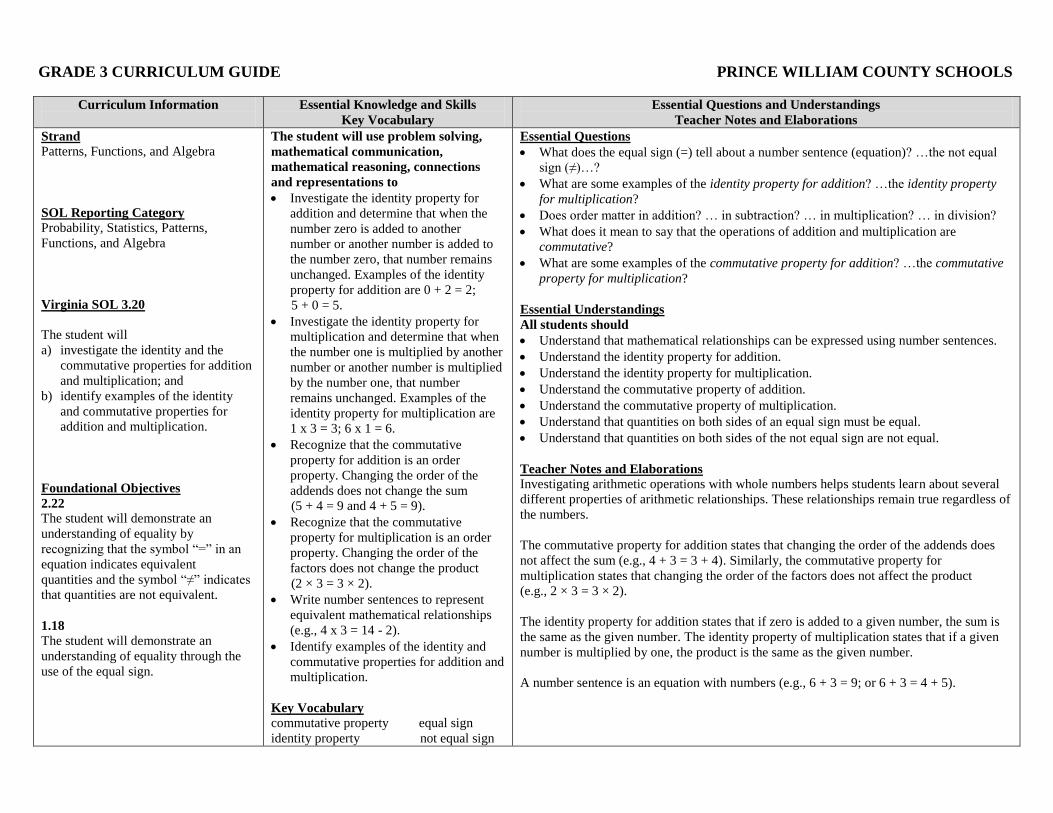
GRADE 3 CURRICULUM GUIDE PRINCE WILLIAM COUNTY SCHOOLS
Curriculum Information
Essential Knowledge and Skills
Key Vocabulary
Essential Questions and Understandings
Teacher Notes and Elaborations
Strand
Patterns, Functions, and Algebra
SOL Reporting Category Probability, Statistics, Patterns,
Functions, and Algebra
Virginia SOL 3.20
The student will
a) investigate the identity and the
commutative properties for addition
and multiplication; and
b) identify examples of the identity
and commutative properties for
addition and multiplication.
Foundational Objectives
2.22
The student will demonstrate an
understanding of equality by
recognizing that the symbol “=” in an
equation indicates equivalent
quantities and the symbol “≠” indicates
that quantities are not equivalent.
1.18
The student will demonstrate an
understanding of equality through the
use of the equal sign.
The student will use problem solving,
mathematical communication,
mathematical reasoning, connections
and representations to
Investigate the identity property for
addition and determine that when the
number zero is added to another
number or another number is added to
the number zero, that number remains
unchanged. Examples of the identity
property for addition are 0 + 2 = 2;
5 + 0 = 5.
Investigate the identity property for
multiplication and determine that when
the number one is multiplied by another
number or another number is multiplied
by the number one, that number
remains unchanged. Examples of the
identity property for multiplication are
1 x 3 = 3; 6 x 1 = 6.
Recognize that the commutative
property for addition is an order
property. Changing the order of the
addends does not change the sum
(5 + 4 = 9 and 4 + 5 = 9).
Recognize that the commutative
property for multiplication is an order
property. Changing the order of the
factors does not change the product
(2 × 3 = 3 × 2).
Write number sentences to represent
equivalent mathematical relationships
(e.g., 4 x 3 = 14 - 2).
Identify examples of the identity and
commutative properties for addition and
multiplication.
Key Vocabulary
commutative property equal sign
identity property not equal sign
Essential Questions
What does the equal sign (=) tell about a number sentence (equation)? …the not equal
sign (≠)…?
What are some examples of the identity property for addition? …the identity property
for multiplication?
Does order matter in addition? … in subtraction? … in multiplication? … in division?
What does it mean to say that the operations of addition and multiplication are
commutative?
What are some examples of the commutative property for addition? …the commutative
property for multiplication?
Essential Understandings
All students should
Understand that mathematical relationships can be expressed using number sentences.
Understand the identity property for addition.
Understand the identity property for multiplication.
Understand the commutative property of addition.
Understand the commutative property of multiplication.
Understand that quantities on both sides of an equal sign must be equal.
Understand that quantities on both sides of the not equal sign are not equal.
Teacher Notes and Elaborations
Investigating arithmetic operations with whole numbers helps students learn about several
different properties of arithmetic relationships. These relationships remain true regardless of
the numbers.
The commutative property for addition states that changing the order of the addends does
not affect the sum (e.g., 4 + 3 = 3 + 4). Similarly, the commutative property for
multiplication states that changing the order of the factors does not affect the product
(e.g., 2 × 3 = 3 × 2).
The identity property for addition states that if zero is added to a given number, the sum is
the same as the given number. The identity property of multiplication states that if a given
number is multiplied by one, the product is the same as the given number.
A number sentence is an equation with numbers (e.g., 6 + 3 = 9; or 6 + 3 = 4 + 5).