Grade 2 Data Management & Probability Teacher’s Notes 2/Math2/G2dmtn.pdf · Materials: 1)...
89
Grade 2 Data Management & Probability Teacher’s Notes
-
Upload
truonglien -
Category
Documents
-
view
221 -
download
3
Transcript of Grade 2 Data Management & Probability Teacher’s Notes 2/Math2/G2dmtn.pdf · Materials: 1)...

Grade 2 Data Management & Probability
Teacher’s Notes

Ontario Mathematics Curriculum Grades 1 to 8, 1997Strand: Data Management and ProbabilityGrade: 2
© Math Wizards, 2003All rights reservedDeveloped by T. TaskerMay be photocopied for classroom use. Further replication or commercial use is strictlyprohibited.
Overall Expectations:- sort and classify objects and data using concrete materials- collect and organize data- create and interpret displays of data, and present and discuss the information- demonstrate an understanding of probability and demonstrate the ability to apply probability infamiliar day-to-day situations
This resource is based on Data Management & Probability Friday’s. That is, every Friday abreak from the current mathematical unit is taken and Data Management & Probability isstudied. Therefore there are 34 activities, one for almost every Friday of the year. This methodcan also help make the five mathematic strands more manageable.

Resource Overview
Graphing andInterpretation
Activity 1meteorology
Activity 2school graph
Activity 3leaf graph
Activity 4flower graph
Activity 5bug graph
Activity 6cars in lot
Activity 7box of smarties
Activity 8tally to graph
Activity 9tally to graph
Activity 10class survey
Activity 11survey of friends
Activity 12glyph
Activity 13graph glyph
Activity 14glyph
Activity 15graph glyph
Sort and classify Activity 16just sort
Activity 17identify ruleresort
Activity 18identify ruleresort
Activity 19leaf attributes
Activity 20mitten attributes
Activity 21snowmen attributes
Activity 22sock attributes
Activity 23Venn DiagramButtons
Activity 24Venn Diagram Shapes
Probability Activity 25coin tossing
Activity 26coin tossing
Activity 27dice rolling
Activity 28dice rolling
Activity 29rolling a special dieand graphing
Activity 30rolling a special dieand graphing
Activity 31rolling two die andgraphing
Activity 32spinner
Activity 33spinner

Materials:1) different shaped pasta2) various colours offood colouring3) jar4) tin foil
Materials BoxThe materials to implement this data management resource are easily and inexpensively made. Below is a list of those materials that you will need, organized by activity.
Activity SEVEN - smarties
Activity TWELVE - construction paper- scissors- glue
Activity THIRTEEN - glyphs from last week
Activity FOURTEEN - construction paper- scissors- glue
Activity FIFTEEN - glyphs from last week
Activity SIXTEEN - beads or buttons
ActivityTWENTY-THREETWENTY-FOUR
- sorting objects, commercial or home made coloured pasta
To make coloured pasta:Method:1) Put the pasta and the food colouringinto the jar.2) Close the jar lid tight and shake.3) Once colouring is evenly spreadonto the pasta, spread out onto tin foilto dry.
ActivityTWENTY-FIVE
- nickels
Activity TWENTY-SIX
- quarters
ActivityTWENTY-SEVEN
- six sided die
Activity TWENTY-EIGHT
- twelve sided die
ActivityTWENTY-NINETHIRTYTHIRTY-ONE
- cardstock- scissors- glue
ActivityTHIRTY-TWOTHIRTY-THREE
- commercial spinners OR CD spinners (building instructions followthis list of materials)

CD Spinner Instructions
Materials:1) foam core board (available at stationary stores)2) ruler3) exacto knife4) pencil5) hammer6) #8-32 x 3/4 bolt7) glue8) back up plate (washer)9) #8-32 x 3/4 nut10) an unwanted CD11) velcro12) full white sheet labels (example: Avery 08165 for inkjet printers)13) Clear CD / DVD labels14) cardboard15) scissors16) 4mm-.7 nut
Directions
1) Cut two 7.5cm x 7.5cm squares of foam core with anexacto knife.
2) Mark the centre of one square on both sides, and on oneside of the second square.
3) Hammer the bottom of the bolt into the centre of ONEfoam core square to form a hole in which the bolt may beinserted.
4) Lightly hammer the head of the bolt into the SECONDfoam core square so that it makes a small dimple.
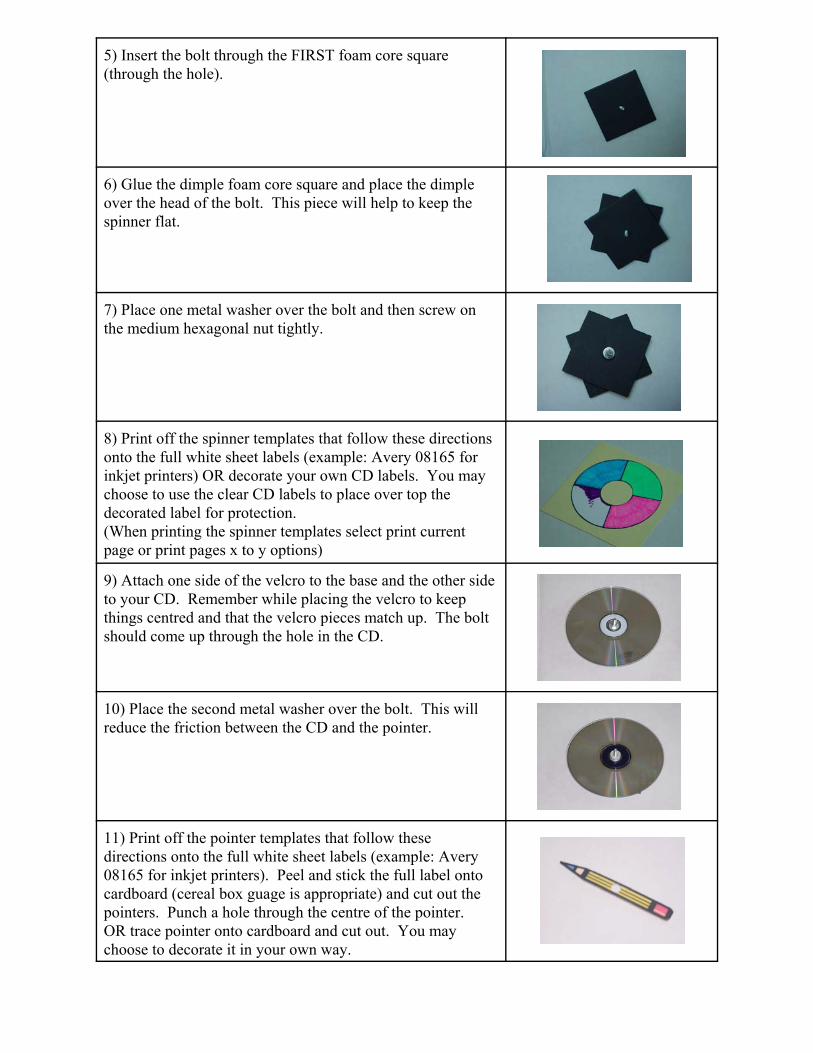
5) Insert the bolt through the FIRST foam core square(through the hole).
6) Glue the dimple foam core square and place the dimpleover the head of the bolt. This piece will help to keep thespinner flat.
7) Place one metal washer over the bolt and then screw onthe medium hexagonal nut tightly.
8) Print off the spinner templates that follow these directionsonto the full white sheet labels (example: Avery 08165 forinkjet printers) OR decorate your own CD labels. You maychoose to use the clear CD labels to place over top thedecorated label for protection.(When printing the spinner templates select print currentpage or print pages x to y options)
9) Attach one side of the velcro to the base and the other sideto your CD. Remember while placing the velcro to keepthings centred and that the velcro pieces match up. The boltshould come up through the hole in the CD.
10) Place the second metal washer over the bolt. This willreduce the friction between the CD and the pointer.
11) Print off the pointer templates that follow thesedirections onto the full white sheet labels (example: Avery08165 for inkjet printers). Peel and stick the full label ontocardboard (cereal box guage is appropriate) and cut out thepointers. Punch a hole through the centre of the pointer.OR trace pointer onto cardboard and cut out. You maychoose to decorate it in your own way.

12) Place the pointer over the bolt and then screw on thesmall hexagonal nut just enough to prevent the pointer fromflying off.
© Math Wizards, 2003


Grade 2 Data Management & Probability
Name:_____________
Meteorology

Data Management and ProbabilityLet’s be Meteorologists!
Let’s record our weatherMonday Tuesday Wednesday Thursday Friday
**Have students draw theweather for that day.**
**This activity should be doneat the beginning of each day.**
Let’s graph our weather! **Create a bar graph below.**1 2 3 4 5 6 7 8 9 10 11 12 13 14 15
Sunny '
Cloudy
Rainy
Sun and Cloud
Snowy †
WindyGrade 2 DMactivity001 covers:D6:collect first-hand data from their environment (eg. the number of days of sun, rain, snow during the month of November)© Math Wizards, 2003

Data Management and ProbabilityLet’s be Meteorologists: SEPTEMBER
Let’s record our weatherMonday Tuesday Wednesday Thursday Friday
Let’s graph our weather!1 2 3 4 5 6 7 8 9 10 11 12 13 14 15
Sunny '
Cloudy
Rainy
Sun and Cloud
Snowy †
WindyGrade 2 DMactivity001 covers:D6:collect first-hand data from their environment (eg. the number of days of sun, rain, snow during the month of November)© Math Wizards, 2003

Data Management and ProbabilityLet’s be Meteorologists: OCTOBER
Let’s record our weatherMonday Tuesday Wednesday Thursday Friday
Let’s graph our weather!1 2 3 4 5 6 7 8 9 10 11 12 13 14 15
Sunny '
Cloudy
Rainy
Sun and Cloud
Snowy †
WindyGrade 2 DMactivity001 covers:D6:collect first-hand data from their environment (eg. the number of days of sun, rain, snow during the month of November)© Math Wizards, 2003

Data Management and ProbabilityLet’s be Meteorologists: NOVEMBER
Let’s record our weatherMonday Tuesday Wednesday Thursday Friday
Let’s graph our weather!1 2 3 4 5 6 7 8 9 10 11 12 13 14 15
Sunny '
Cloudy
Rainy
Sun and Cloud
Snowy †
WindyGrade 2 DMactivity001 covers:D6:collect first-hand data from their environment (eg. the number of days of sun, rain, snow during the month of November)© Math Wizards, 2003

Data Management and ProbabilityLet’s be Meteorologists: DECEMBER
Let’s record our weatherMonday Tuesday Wednesday Thursday Friday
Let’s graph our weather!1 2 3 4 5 6 7 8 9 10 11 12 13 14 15
Sunny '
Cloudy
Rainy
Sun and Cloud
Snowy †
WindyGrade 2 DMactivity001 covers:D6:collect first-hand data from their environment (eg. the number of days of sun, rain, snow during the month of November)© Math Wizards, 2003

Data Management and ProbabilityLet’s be Meteorologists: JANUARY
Let’s record our weatherMonday Tuesday Wednesday Thursday Friday
Let’s graph our weather!1 2 3 4 5 6 7 8 9 10 11 12 13 14 15
Sunny '
Cloudy
Rainy
Sun and Cloud
Snowy †
WindyGrade 2 DMactivity001 covers:D6:collect first-hand data from their environment (eg. the number of days of sun, rain, snow during the month of November)© Math Wizards, 2003

Data Management and ProbabilityLet’s be Meteorologists: FEBRUARY
Let’s record our weatherMonday Tuesday Wednesday Thursday Friday
Let’s graph our weather!1 2 3 4 5 6 7 8 9 10 11 12 13 14 15
Sunny '
Cloudy
Rainy
Sun and Cloud
Snowy †
WindyGrade 2 DMactivity001 covers:D6:collect first-hand data from their environment (eg. the number of days of sun, rain, snow during the month of November)© Math Wizards, 2003

Data Management and ProbabilityLet’s be Meteorologists: MARCH
Let’s record our weatherMonday Tuesday Wednesday Thursday Friday
Let’s graph our weather!1 2 3 4 5 6 7 8 9 10 11 12 13 14 15
Sunny '
Cloudy
Rainy
Sun and Cloud
Snowy †
WindyGrade 2 DMactivity001 covers:D6:collect first-hand data from their environment (eg. the number of days of sun, rain, snow during the month of November)© Math Wizards, 2003

Data Management and ProbabilityLet’s be Meteorologists: APRIL
Let’s record our weatherMonday Tuesday Wednesday Thursday Friday
Let’s graph our weather!1 2 3 4 5 6 7 8 9 10 11 12 13 14 15
Sunny '
Cloudy
Rainy
Sun and Cloud
Snowy †
WindyGrade 2 DMactivity001 covers:D6:collect first-hand data from their environment (eg. the number of days of sun, rain, snow during the month of November)© Math Wizards, 2003

Data Management and ProbabilityLet’s be Meteorologists: MAY
Let’s record our weatherMonday Tuesday Wednesday Thursday Friday
Let’s graph our weather!1 2 3 4 5 6 7 8 9 10 11 12 13 14 15
Sunny '
Cloudy
Rainy
Sun and Cloud
Snowy †
WindyGrade 2 DMactivity001 covers:D6:collect first-hand data from their environment (eg. the number of days of sun, rain, snow during the month of November)© Math Wizards, 2003

Data Management and ProbabilityLet’s be Meteorologists: JUNE
Let’s record our weatherMonday Tuesday Wednesday Thursday Friday
Let’s graph our weather!1 2 3 4 5 6 7 8 9 10 11 12 13 14 15
Sunny '
Cloudy
Rainy
Sun and Cloud
Snowy †
WindyGrade 2 DMactivity001 covers:D6:collect first-hand data from their environment (eg. the number of days of sun, rain, snow during the month of November)© Math Wizards, 2003

Grade 2 Data Management & Probability
Name:_____________

Data Management & ProbabilityActivity TWO
Today we will be completing a bar graph on the next page. Rememberto:- identify the four parts of the graph (title, labels, scale, data)- create an appropriate title for the graph; and- make sure all the columns are properly labelled
When you have completed the graph, answer the following questions:
1) What does Merlin have most of?______________________________________________________________________________________
2) What does Merlin need to buy?_______________________________________________________________________________________
3) How many pencils and erasers does Merlin have altogether?_________________________________________________________
Grade 2 DMactivity002 covers:D1:pose questions about meanings derived from the data on graphs (eg. which was the rainiest month?)D7:identify the basic parts of a graph: labels, scales, title, dataD9: construct and label simple concrete graphs, bar graphs, and pictographs using one-to-one correspondence© Math Wizards, 2003
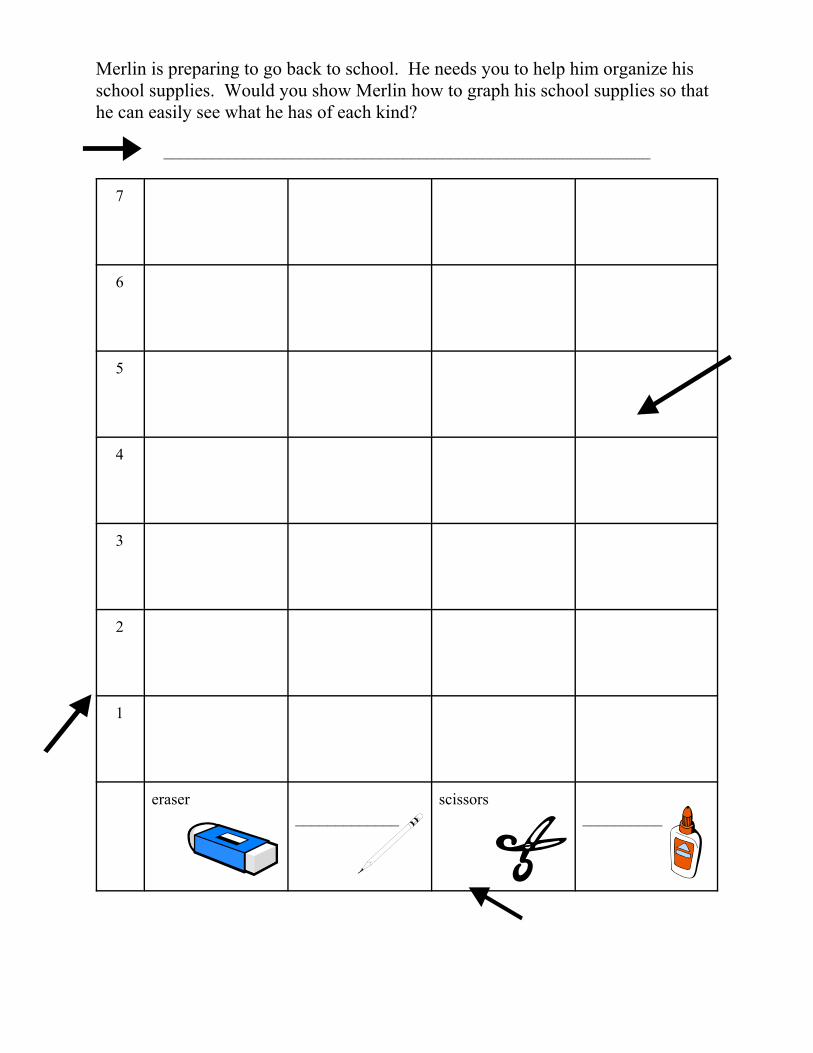
Merlin is preparing to go back to school. He needs you to help him organize hisschool supplies. Would you show Merlin how to graph his school supplies so thathe can easily see what he has of each kind?
_____________________________________________________________
7
6
5
4
3
2
1
eraser_____________
scissors__________

** Photocopy for students.**

Data Management & ProbabilityActivity THREE
Today we will be completing a bar graph on the next page. Rememberto:- identify the four parts of the graph (title, labels, scale, data)- create an appropriate title for the graph; and- make sure all the columns are properly labelled
When you have completed the graph, answer the following questions:
1) What does Merlin have most of?______________________________________________________________________________________
2) What does Merlin have least of? ______________________________________________________________________________________
3) How many oak and maple leaves does Merlin have altogether__________________________________________________________________________________________________________________Grade 2 DMacitivity003 covers:D1:pose questions about meanings derived from the data on graphs (eg. which was the rainiest month?)D7:identify the basic parts of a graph: labels, scales, title, dataD9: construct and label simple concrete graphs, bar graphs, and pictographs using one-to-one correspondence© Math Wizards, 2003

Merlin is raking the leaves in his yard. He needs you to help him sort the leavesinto different bins. Would you show Merlin how to graph his leaves so that he caneasily see how many he has of each kind?
_________________________________________________________
7
6
5
4
3
2
1
oak maple elm willow

** Photocopy for Students.**

Data Management & ProbabilityActivity FOUR
Today we will be completing a bar graph on the next page. Rememberto:- identify the four parts of the graph (title, labels, scale, data)- create an appropriate title for the graph; and- make sure all the columns are properly labelled
When you have completed the graph, answer the following questions:
1) What does Merlin have most of?________________________________________________________________________________________
2) What does Merlin have least of?________________________________________________________________________________________
3) How many sunflowers and roses does Merlin have altogether?____________________________________________________________________________________________________________________Grade 2 DMactivity004 covers:D1:pose questions about meanings derived from the data on graphs (eg. which was the rainiest month?)D7:identify the basic parts of a graph: labels, scale, title, dataD9: construct and label simple concrete graphs, bar graphs, and pictographs using one-to-one correspondence.© Math Wizards, 2003
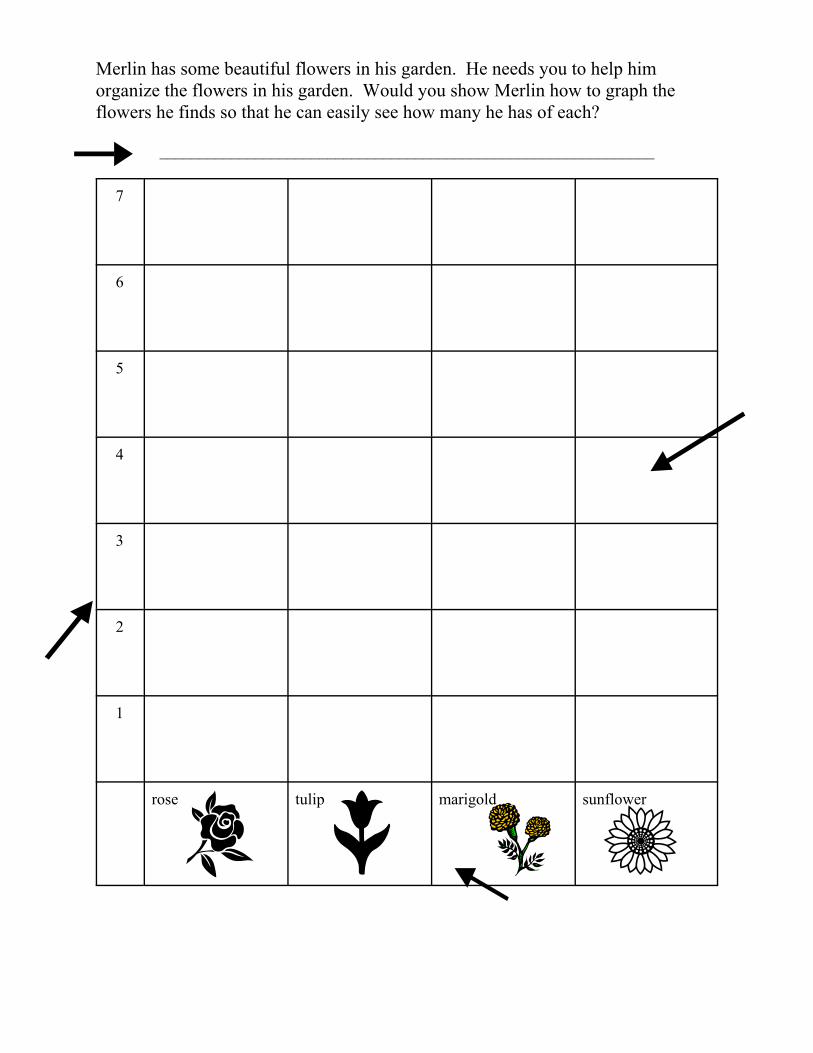
Merlin has some beautiful flowers in his garden. He needs you to help himorganize the flowers in his garden. Would you show Merlin how to graph theflowers he finds so that he can easily see how many he has of each?
______________________________________________________________
7
6
5
4
3
2
1
rose tulip marigold sunflower

** Photocopy for students.**

Data Management & ProbabilityActivity FIVE
Today we will be completing a bar graph on the next page. Rememberto:- identify the four parts of the graph (title, labels, scale, data)- create an appropriate title for the graph; and- make sure all the columns are properly labelled
When you have completed the graph, answer the following questions:
1) What does Merlin have most of?________________________________________________________________________________________
2) What does Merlin have least of?________________________________________________________________________________________
3) How many worms and ants does Merlin have altogether? ____________________________________________________________________Grade 2 DMactivity005 covers:D1:pose questions about meanings derived from the data on graphs (eg. which was the rainiest month?)D7:identify the basic parts of a graph: labels, scale, title, dataD9: construct and label simple concrete graphs, bar graphs, and pictographs using one-to-one correspondence.© Math Wizards, 2003

Merlin has noticed some bugs in his garden. He needs you to help him sortthrough the different bugs in his garden. Would you show Merlin how to graph thebugs so that he can easily see how many he has of each kind?
____________________________________________________________
7
6
5
4
3
2
1
___________lady bug earthworm bee

** Photocopy for students.**

Data Management & ProbabilityActivity SIX
There are lots of cars in the school parking lot. Merlin wants to know what colourof car is the most popular at your school. Take a trip to the parking lot, count andtally the colour of cars in the chart below.
Colour Tally Marks Total
Red
Gold
Blue
Green
Black
Silver
White
Brown
From your tally chart make a graph.
_________________________________________________
red
gold
blue
green
black
silver
white
brown
1 2 3 4 5 6 7 8 9 10 11 12 13 14

1) Which colour of car was the most popular?____________________________________________________________________________________________________________________
2) Which colour of car was the least popular?____________________________________________________________________________________________________________________
3) How many blue and gold cars are there altogether?___________________________________________________________ _________________________________________________________
4) How many green and brown cars are there altogether?___________________________________________________________ _________________________________________________________
4) Merlin wants his car to be original and different. Which colour wouldyou suggest to Merlin?________________________________________Why?____________________________________________________________________________________________________________________

Draw a picture of the parking lot using the data you collected.
Describe your picture and how the data helped you draw it:________________________________________________________________________________________________________________________________________________________________________________________________________________________________________Grade 2 DMactivity006 covers:D1:pose questions about meanings derived from the data on graphs (e.g., which was the rainiest month?)D6: collect first-hand data from their environment (e.g., the number of days of sun, rain, snow during the month of November)D7: identify the basic parts of a graph: labels, scales, title, data.D10:interpret displays of numerical information and express understanding in a variety of ways (eg. draw a picture and use informal language todiscuss)© Math Wizards, 2003

Data Management and ProbabilityActivity SEVEN
Merlin has lots of smarties but he wants to know how many he has of each colour. Count and tally the smarties in the chart below.
Colour Tally Marks Total
Red
Orange
Yellow
Green
Blue
Purple
Pink
Brown
From your tally chart make a graph.
__________________________________________________
red
orange
yellow
green
blue
purple
pink
brown
1 2 3 4 5 6 7 8 9 10 11 12 13 14

1) Which colour of smartie was found the most?____________________________________________________________________________________________________________________
2) Which colour of smartie was found the least?____________________________________________________________________________________________________________________
3) How many yellow and blue smarties are there altogether?____________________________________________________________________________________________________________________
4) How many green and brown smarties are there altogether?____________________________________________________________________________________________________________________
4) If you were to eat the red ones last, how many smarties would there be left?______________________________________________________________________________________________________________________________________________________________________________

Draw a picture of the box of smarties using the data you collected.
Describe your picture and how the data helped you draw it:____________________________________________________________________________________________________________________________________________________________________________________________________________________________________________________________________________________________________________________________________________________________Grade 2 DMactivity007 covers:D1:pose questions about meanings derived from the data on graphs (e.g., which was the rainiest month?)D6: collect first-hand data from their environment (e.g., the number of days of sun, rain, snow during the month of November)D7: identify the basic parts of a graph: labels, scales, title, dataD10:interpret displays of numerical information and express understanding in a variety of ways (eg. draw a picture and use informal language todiscuss)© Math Wizards, 2003

Data Management & ProbabilityActivity EIGHT
There is a beautiful apple orchard beside Merlin’s castle and yesterdayhe picked a bushel of apples. He made a tally chart of the different kindsof apples.
McIntoshApples
Granny SmithApples
Red DeliciousApples
Snow Apples
| | | | | | | | | | | | | | | | | | | | | | | | |
Using Merlin’s tally chart, make a bar graph on the chart paper below.

Ask Merlin three questions about the graph:
1) ____________________________________________________________________________________________________________________________________________________________________________
2) ____________________________________________________________________________________________________________________________________________________________________________
3) ____________________________________________________________________________________________________________________________________________________________________________
Grade 2 DMactivity008 covers:D1:pose questions about meanings derived from the data on graphs (eg. which was the rainiest month?)D9:construct and label simple concrete graphs, bar graphs, and pictographs using one-to-one correspondence© Math Wizards, 2003

Data Management & ProbabilityActivity NINE
There is a beautiful pond beside Merlin’s castle and yesterday hewatched all the little fish swim about. He made a tally chart of thedifferent kinds of fish.
Gold Fish Trout Carp Sun Fish
| | | | | | | | | | | | | | | | | | | | | | | |
Using Merlin’s tally chart, make a bar graph on the chart paper below.

Ask Merlin three questions about the graph:
1) ____________________________________________________________________________________________________________________________________________________________________________
2) ____________________________________________________________________________________________________________________________________________________________________________
3) ____________________________________________________________________________________________________________________________________________________________________________
Grade 2 DMactivity009 covers:D1:pose questions about meanings derived from the data on graphs (eg. which was the rainiest month?)D9:construct and label simple concrete graphs, bar graphs, and pictographs using one-to-one correspondence© Math Wizards, 2003

Data Management & ProbabilityActivity TEN
Today we will be conducting a class survey. As a class, let’s follow thesteps below to guide you in the construction of your survey.
Step ONE:
Our survey question is:____________________________________________________________________________________________________________________
We want to know this because:____________________________________________________________________________________________________________________
The choices in the survey include:____________________________________________________________________________________________________________________
Step TWO:
Let’s survey the class and record our data in the tally chart below. Makesure you put your choices on the top of each column.

Step THREE:
Graph the data using the chart paper below:
Step FOUR:
How can we use this information now?______________________________________________________________________________________________________________________________________________________________________________
Grade 2 DMactivity010 covers:D5:generate questions that have a finite number of responses for a given topic (eg. how many different items of clothing are you wearing?)D8:organize data using graphic organizers (eg. diagrams, charts, graphs, webs) and various recording methods (eg. placing stickers, drawinggraphs)© Math Wizards, 2003

Data Management & ProbabilityActivity ELEVEN
Today you will be conducting a survey of some of your friends. Followthe steps below to guide you in the construction of your survey.
Step ONE:
My survey question is:____________________________________________________________________________________________________________________
I want to know this because:____________________________________________________________________________________________________________________
The choices I provide include:____________________________________________________________________________________________________________________
Step TWO:
Survey your friends and record your data in the tally chart below. Makesure you put your choices on the top of each column.

Step THREE:
Graph your data using the chart paper below:
Step FOUR:
How can you use this information now?______________________________________________________________________________________________________________________________________________________________________________
Grade 2 DMactivity011 covers:D5:generate questions that have a finite number of responses for a given topic (eg. how many different items of clothing are you wearing?)D8:organize data using graphic organizers (eg. diagrams, charts, graphs, webs) and various recording methods (eg. placing stickers, drawinggraphs)© Math Wizards, 2003

Data Management & ProbabilityActivity TWELVE
Answer the following questions:What is your favourite time?
What is your favourite day?
What is your favourite month?
What is your favourite season?
Today we are going to create a glyph. A glyph is a picture that isactually a graph. It originates from ancient hieroglyphics.
Today our glyph will be in the form of a watch. Each question you wereasked above will be represented by a different part of the watch.
Your favourite time will be represented by the time shown on the face ofthe watch.
Your favourite day will be represented by the colour of your watchbands. For example, if your favourite day is Sunday, your watch bandwould be white.
Monday Tuesday Wednesday Thursday Friday Saturday Sunday
red orange yellow green blue purple white
Your favourite month will be represented by the number of holes in yourwatch band. For example, if your favourite month is April, your watchband would have four holes.
Jan. Feb. March April May June July Aug. Sept. Oct. Nov. Dec.
1 2 3 4 5 6 7 8 9 10 11 12

Your favourite season will be represented by the colour of your watchhands. For example, if your favourite season is winter, your watchhands would be black.
Fall Winter Spring Summer
Red Black Blue Green
Look at the watch below:The person’s favourite time is THREE O’CLOCK (time)The person’s favourite day is SUNDAY (white watch band)The person’s favourite month is APRIL (four holes)The person’s favourite season is WINTER (black watch hands)
Make your own watch with construction paper. When you’re finisheddraw your watch in the space below.** Hang the glyphs up on a wall for next week’s activity.**
Grade 2 DMactivity012 covers:D8:organize data using graphic organizers (eg. diagrams, charts, graphs, webs) and various recording methods (eg. lacing stickers, drawinggraphs)D9:construct and label simple concrete graphs, bar graphs, and pictographs using one-to-one correspondence© Math Wizards, 2003

Data Management & ProbabilityActivity THIRTEEN
Using our glyphs from last week, let’s graph the information about ourfavourite days, months and seasons.
Title: __________________________________________
10
9
8
7
6
5
4
3
2
1
mon.red
tues.orange
wed.yellow
thurs.green
fri.blue
sat.purple
sun.white

Title: _______________________________________
10
9
8
7
6
5
4
3
2
1Jan1
Feb2
March3
April4
May5
June6
July7
Aug8
Sep9
Oct10
Nov11
Dec12
Title:__________________________________________
1 2 3 4 5 6 7 8 9 10
fallred
winterblack
springblue
summergreen
What is the most favourite day? ________________________________

What is the least favourite day? ________________________________
What is the most favourite month? ______________________________
What is the least favourite month? ______________________________
What is the most favourite season? ______________________________
What is the least favourite season? ______________________________
Is it easier to read the glyphs or graphs? __________________________
Why?______________________________________________________________________________________________________________________________________________________________________________
Grade 2 DMactivity013 covers:D6:collect first-hand data from their environment (eg. the number of days of sun, rain, snow during the month of November)D9:construct and label simple concrete graphs, bar graphs, and pictographs using one-to-one correspondence© Math Wizards, 2003

Data Management & ProbabilityActivity FOURTEEN
Answer the following questions:How old are you?
What is your favourite subject?
How many brothers and sisters doyou have?
What colour eyes do you have?
What colour hair do you have?
Today we are going to create a glyph. A glyph is a picture that isactually a graph. It originates from ancient hieroglyphics.
Today our glyph will be in the form of a snowman. Each question youwere asked above will be represented by a different part of thesnowman.
Your age will be represented by how many balls are in the snowman. For example if you are 7 your snowman will have 3 balls.
Age 6 Age 7 Age 8
2 balls 3 balls 4 balls
Your favourite subject will be represented by the colour of thesnowman’s scarf. For example, if your favourite subject is music, yoursnowman’s scarf will be black.
Phys. Ed. Art Language Science Math SocialStudies
Music
red orange yellow green blue purple black

The number of brothers and sisters you have will be represented by thenumber of buttons on your snowman. For example, if you have 3brothers and sisters, your snowman will have three buttons.
The colour of your eyes will be represented by the colour of yoursnowman’s eyes. For example, if you have grey eyes, your snowmanwill have grey eyes.
Blue eyes Green eyes Brown eyes Grey eyes
blue green brown grey
The colour of your hair will be represented by the colour of yoursnowman’s hat. For example, if you have black hair, your snowman willhave a black hat.
Blond hair Red hair Black hair Brown hair
yellow hat red hat black hat brown hat
Look at the snowman below:The person is SEVEN years old (3 balls)The person’s favourite subject is MUSIC (black scarf)The person has THREE brothers and sisters (three buttons)The person has GREY eyes (grey eyes)The person has BLACK hair (black hat)

Make your own snowman with construction paper. When you’refinished, draw your snowman in the space below.** Hang the glyphs up on a wall for next week’s activity.**
Grade 2 DMactivity014 covers:D8:organize data using graphic organizers (eg. diagrams, charts, graphs, webs) and various recording methods (eg. lacing stickers, drawinggraphs)D9:construct and label simple concrete graphs, bar graphs, and pictographs using one-to-one correspondence© Math Wizards, 2003

Data Management & ProbabilityActivity FIFTEEN
Using our glyphs from last week, let’s graph the information about ourselves.
Title: __________________________________________
1 2 3 4 5 6 7 8 9
age 6
age 7
age 8
Title:__________________________________________
9
8
7
6
5
4
3
2
1
(Scarf) Phys.Ed(red)
Art(orange)
Language(yellow)
Science(green)
Math(blue)
SocialStudies(purple)
Music(black)

Title: ______________________________________
9
8
7
6
5
4
3
2
11 sibling 2 siblings 3 siblings 4 siblings 5 siblings 6 siblings 7 siblings
Title: _______________________________________
1 2 3 4 5 6 7 8 9blueeyes
greeneyes
browneyes
greyeyes

Title:__________________________________________
1 2 3 4 5 6 7 8 9blondhair
redhair
blackhair
brownhair
Write down three things you’ve learned about the students in our classfrom these graphs:
1)__________________________________________________________________________________________________________________2)__________________________________________________________________________________________________________________3)__________________________________________________________________________________________________________________Grade 2 DMactivity015 covers:D6:collect first-hand data from their environment (eg. the number of days of sun, rain, snow during the month of November)D9:construct and label simple concrete graphs, bar graphs, and pictographs using one-to-one correspondence© Math Wizards, 2003

Data Management & ProbabilityActivity SIXTEEN
** You could use buttons or beads for this activity.**
Merlin has left you a cup of buttons. He would like your help sortingthem. Sort your magical buttons and then draw and write about whatyou did.
Draw your sort:
Describe your sort in words:_____________________________________________________________________________________________________________________________________________________________________________________________________________________________________________________________________________________________
Grade 2 DMactivity016 covers:D2:sort and classify concrete objects, pictures, and symbols according to two specific attributes (eg. shape and texture)© Math Wizards, 2003

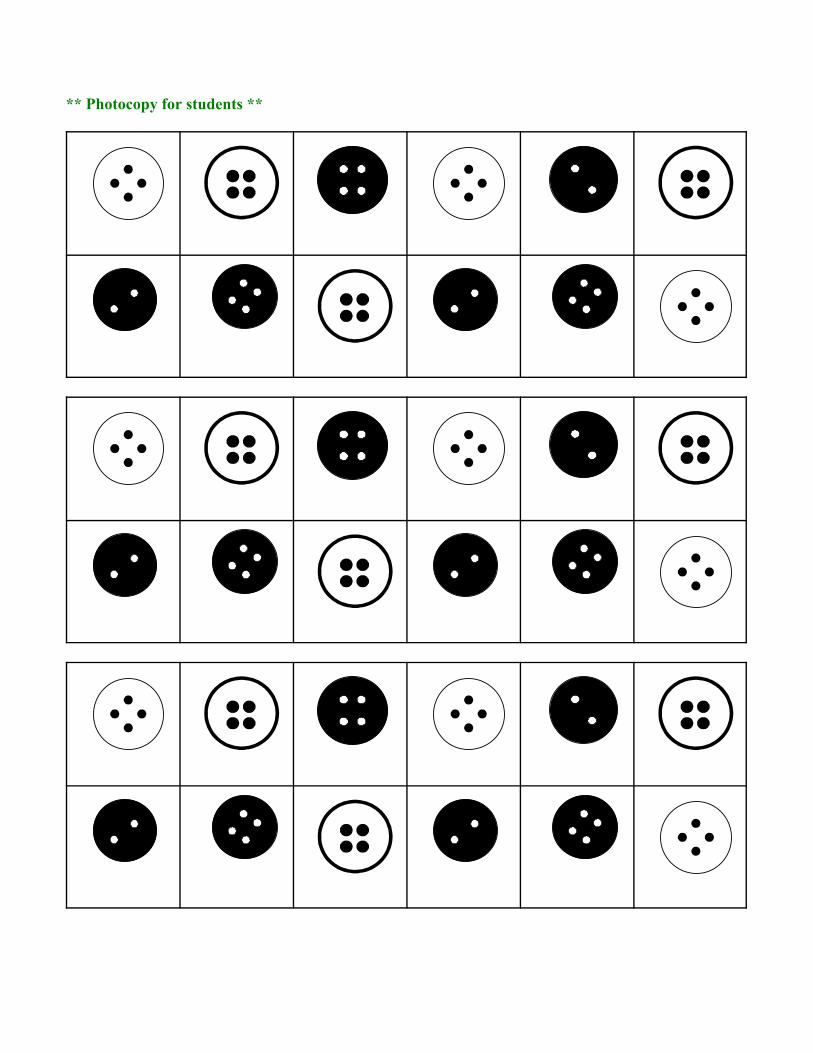
Data Management & ProbabilityActivity SEVENTEEN
Look at the following sort:
What rule did Merlin use to sort the buttons?______________________________________________________________________________________________________________________________________________________________________________
Name the different attributes the buttons have:____________________________________________________________________________________________________________________
Sort the buttons in a different way:
Grade 2 DMactivitiy017 covers:D2:sort and classify concrete objects, pictures, and symbols according to two specific attributes (eg. shape and texture)D3:identify attributes and rules in presorted sets© Math Wizards, 2003

**Photocopy for students.**

Data Management & ProbabilityActivity EIGHTEEN
Look at the following sort:
What rule did Merlin use to sort the buttons?______________________________________________________________________________________________________________________________________________________________________________
Name the different attributes the buttons have:____________________________________________________________________________________________________________________
Sort the buttons in a different way:
Grade 2 DMactivitiy018 covers:D2:sort and classify concrete objects, pictures, and symbols according to two specific attributes (eg. shape and texture)D3:identify attributes and rules in presorted sets© Math Wizards, 2003

**Photocopy for students.**

Fall Flutter RustleSummer
Windy Nutty Breezy Crunchy
Data Management & ProbabilityActivity NINETEEN
1) Read the chart and decorate the oak leaves.Acorn No acorn
Brown leaf NuttyWindyRustle
FallCrunchy
Green leaf BreezyFlutter
Summer
2) Name the different attributes___________________________________________________________________________________________
3) What is the most common combination of attributes?_______________________________________________________________________
4) What does the chart tell you?_____________________________________________________________________________________________________________________________________________________Grade 2 DMactivity019 covers:D4:recognize that an object can have more than one attribute.© Math Wizards, 2003

Laura Ethan Michael Victoria
Megan Sarah Mark
Data Management and ProbabilityActivity TWENTY
1) Read the chart and decorate the mittens.Zigzag Snowflake
Blue MichaelMegan
SarahVictoria
Red Laura
MarkEthan
2) Name the different attributes___________________________________________________________________________________________
3) What is the least common combination of attributes?________________________________________________________________________
4) What does the chart tell you?_____________________________________________________________________________________________________________________________________________________Grade 2 DMactivity020 covers:D4:recognize that an object can have more than one attribute© Math Wizards, 2003

Chilly Frosty Brrr! Snowy
Frigid Jack Frost Icicle
Data Management & ProbabilityActivity TWENTY-ONE
1) Read the chart and decorate the snowmen.Scarf Green ribbon
Hat Brrr!Icicle
SnowyFrigid
No hat Chilly Jack FrostFrosty
2) Name the different attributes___________________________________________________________________________________________
3) What is the least common combination of attributes?________________________________________________________________________
4) What does the chart tell you?_____________________________________________________________________________________________________________________________________________________Grade 2 DMactivity021 covers:D4:recognize that an object can have more than one attribute© Math Wizards, 2003

Cordelia Eric Jennifer Valerie
Megan Sarah Jonathon
Data Management & ProbabilityActivity TWENTY-TWO
1) Read the chart and decorate the socksBlack cuff White cuff
Green sock CordeliaMegan
EricJennifer
Blue sock Valerie Sarah
Jonathon
2) Name the different attributes___________________________________________________________________________________________
3) What is the least common combination of attributes?________________________________________________________________________
4) What does the chart tell you?_____________________________________________________________________________________________________________________________________________________Grade 2 DMactivity022 covers:D4:recognize that an object can have more than one attribute© Math Wizards, 2003

Data Management & ProbabilityActivity TWENTY-THREE
** Do an example at the carpet with coloured pasta (see materials for recipe) or use sorting objects.**Help Merlin sort his buttons into a DOUBLE Venn diagram.
Grade 2 DMactivity023 covers:D2:sort and classify concrete objects, pictures, and symbols according to two specific attributes (eg. shape and texture)D4:recognize that an object can have more than one attribute© Math Wizards, 2003
** Photocopy for students **

Data Management & ProbabilityActivity TWENTY-FOUR
** Do an example at the carpet with coloured pasta (see materials for recipe) or use sorting objects.**Help Merlin sort his shapes into a DOUBLE Venn diagram.
Grade 2 DMactivity024 covers:D2:sort and classify concrete objects, pictures, and symbols according to two specific attributes (eg. shape and texture)D4:recognize that an object can have more than one attribute© Math Wizards, 2003

�����������������������
�����������������������
�����������������������
�����������������������
�����������������������
�����������������������
�����������������������
�����������������������
�����������������������
�����������������������
�����������������������
�����������������������
� ����������������������
�����������������������
�����������������������
�����������������������
�����������������������
�����������������������
�����������������������
�����������������������
�����������������������
�����������������������
�����������������������
�����������������������
�����������������������
�����������������������
� ����������������������
�����������������������
** Photocopy for students **

Data Management & ProbabilityActivity TWENTY-FIVE
Coins have two sides. One side is called “heads” because it has a pictureof Queen Elizabeth’s head and the other side is called “tails.” Differenttypes of coins have a different tail picture. All Canadian nickels havebeavers.
Which side is luckier? Circle one.
Heads Tails
Toss the coin TEN times. Record your results in the tally chart below.
Tally Marks Total
Heads
Tails
Which side came up the most?____________________________________
Did you predict correctly? _______________________________________
Grade 2 DMactivity025 covers:D12:investigate simple probability situations (e.g. flipping a coin, tossing dice)© Math Wizards, 2003

Data Management & ProbabilityActivity TWENTY-SIX
Coins have two sides. One side is called “heads” because it has a pictureof Queen Elizabeth’s head and the other side is called “tails”. Differenttypes of coins have a different tail picture. All Canadian quarters havecaribou.
Which side is luckier? Circle one.
Heads Tails
Toss the coin TEN times. Record your results in the tally chart below.
Tally Marks Total
Heads
Tails
Which side came up the most?____________________________________
Did you predict correctly? _______________________________________
Were your results with the quarter similar to your results with the nickel lastweek?____________________________________________________________________________________________________________________________Grade 2 DMactivity026 covers:D12:investigate simple probability situations (e.g. flipping a coin, tossing dice)© Math Wizards, 2003

Data Management & ProbabilityActivity TWENTY-SEVEN
Today, Merlin has left you a magic die. He would like you to conductsome probability experiments with the die. Record your results in thetally charts provided and be sure to answer all the questions.
Roll the die TEN times. Record it in the chart below.
Die Tally Marks Total
1
2
3
4
5
6
1) Which number was rolled the most?__________________________
2) Which number was rolled the least?___________________________
3) How many 2's and 5's altogether?____________________________
4) Do you think there is an equal chance of rolling any number on thedie? ______________________________________________________
5) Explain:__________________________________________________________________________________________________________________________________________________________________________________________________________________________________________________________________________________________________Grade 2 DMactivity027 covers:D11:explore through simple games and experiments the likelihood that an event may occurD12:investigate simple probability situations (e.g., flipping a coin, tossing dice)© Math Wizards, 2003

Data Management & ProbabilityActivity TWENTY-EIGHT
Today, Merlin has left you a magic die. He would like you to conductsome probability experiments with the die. Record your results in thetally charts provided and be sure to answer all the questions.
Roll the die FORTY times. Record it in the chart below.
Die Tally Marks Total
1
2
3
4
5
6
7
8
9
10
11
12
1) Which number was rolled the most?___________________________
2) Which number was rolled the least?___________________________
3) How is the 12 sided die different from the 6 sided die?____________________________________________________________________________________________________________________
Grade 2 DMactivity028 covers:D11:explore through simple games and experiments the likelihood that an event may occurD12:investigate simple probability situations (e.g., flipping a coin, tossing dice)© Math Wizards, 2003

Data Management & ProbabilityActivity TWENTY-NINE
Merlin has given you a special die on the condition that you make aBAR GRAPH showing what you rolled. Roll the die TWENTY times.
12
11
10
9
8
7
6
5
4
3
2
1
Look at the die carefully and fill in the following chart.Picture
Number ofsides

What side is most likely to come up? ____________________________
Why?______________________________________________________________________________________________________________________________________________________________________________
What side is least likely to come up? ____________________________
Why?______________________________________________________________________________________________________________________________________________________________________________
Grade 2 DMactivity029 covers:D11:explore through simple games and experiments the likelihood that an event may occurD12:investigate simple probability situations (eg. flipping a coin, tossing dice)D13:use mathematical language (eg. likely, unlikely, probably) in informal discussion to describe probability© Math Wizards, 2003

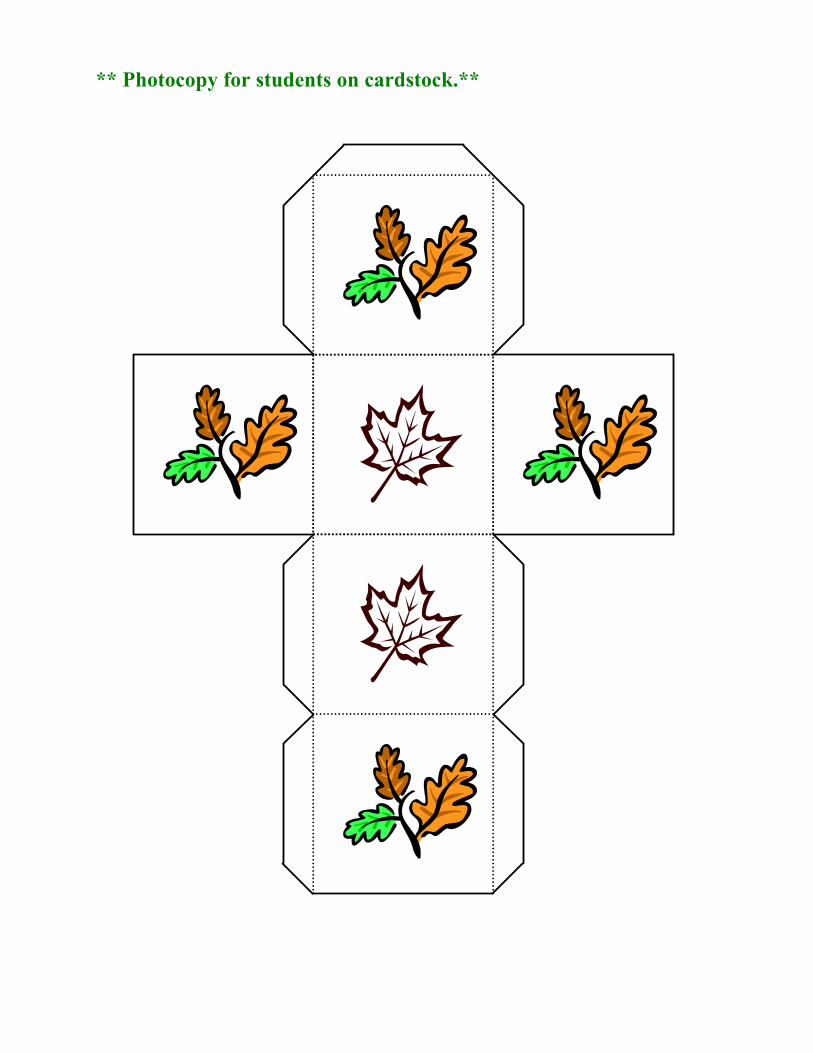
** Photocopy for students on cardstock.**

Data Management & ProbabilityActivity THIRTY
Merlin has given you a special die on the condition that you make aBAR GRAPH showing what you rolled. Roll the die TWENTY times.
12
11
10
9
8
7
6
5
4
3
2
1
Look at the die carefully and fill in the following chart.Picture
Number ofsides

What side is most likely to come up? ___________________________
Why?______________________________________________________________________________________________________________________________________________________________________________
What side is least likely to come up? ____________________________
Why?______________________________________________________________________________________________________________________________________________________________________________
Grade 2 DMactivity030 covers:D11:explore through simple games and experiments the likelihood that an event may occurD12:investigate simple probability situations (eg. flipping a coin, tossing dice)D13:use mathematical language (eg. likely, unlikely, probably) in informal discussion to describe probability© Math Wizards, 2003
** Photocopy for students on cardstock.**

Data Management & ProbabilityActivity THIRTY-ONE
Merlin has given you a special die on the condition that you make aBAR GRAPH showing what you rolled. Roll the die TWENTY times.
12
11
10
9
8
7
6
5
4
3
2
1
Look at the die carefully and fill in the following chart.Picture
Number ofsides

What side is most likely to come up? ____________________________
Why?______________________________________________________________________________________________________________________________________________________________________________
What side is least likely to come up? ____________________________
Why?______________________________________________________________________________________________________________________________________________________________________________
What is special about this die?______________________________________________________________________________________________________________________________________________________________________________
Grade 2 DMactivity031 covers:D11:explore through simple games and experiments the likelihood that an event may occurD12:investigate simple probability situations (eg. flipping a coin, tossing dice)D13:use mathematical language (eg. likely, unlikely, probably) in informal discussion to describe probability© Math Wizards, 2003

** Photocopy for students on cardstock.**

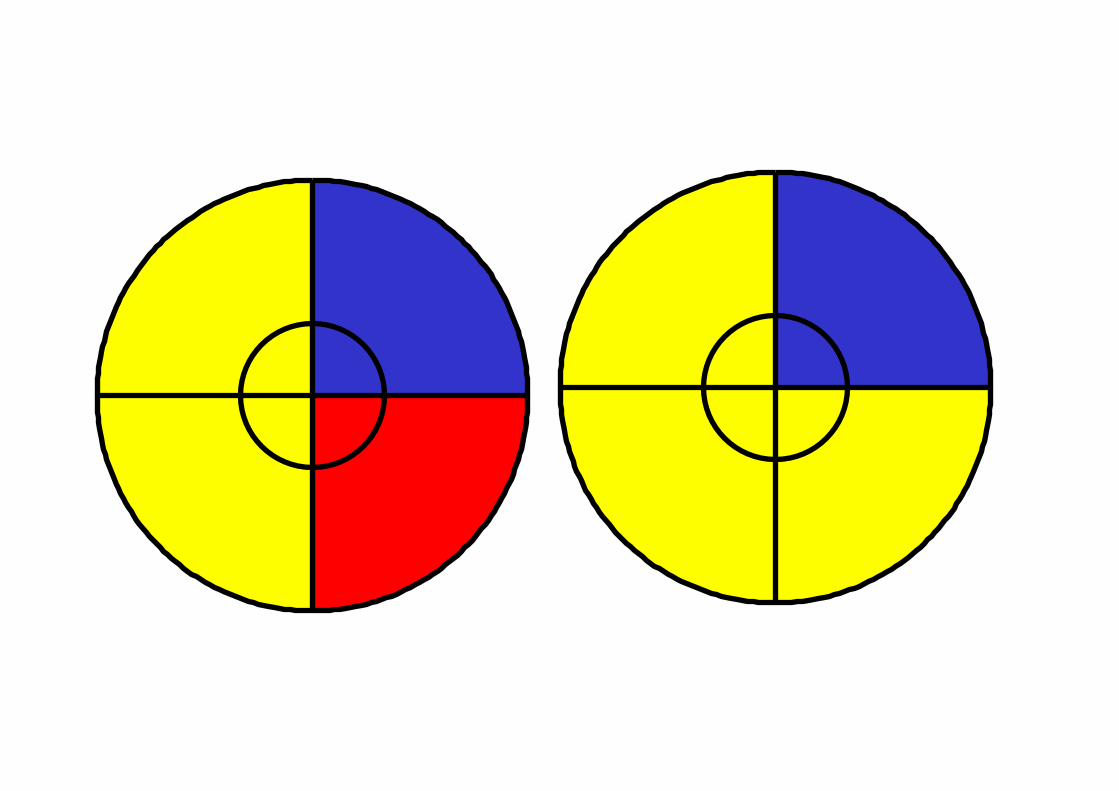
RED BLUE
Data Management & ProbabilityActivity THIRTY-TWO
** Do an example probability experiment with the spinners at the carpet. Youwill need to have one base and one labelled CD for each student (see materialsbox for building instructions). **
Merlin wants us to do a probability experiment witha spinner. He has left us a spinner with a top thatlooks like the picture on the right.Spin the spinner 30 times and record your results inthe tally chart below.
My PredictionI think the spinner will land more often on thecolour:__________________________________________
Colour Tally
RED
BLUE
Complete the following questions:
1) What colour did the spinner land on the most?__________________________
2) Did you predict correctly?__________________________________________
3) Is there an equal chance of landing on the red side or the blue side?__________
4) Why might the spinner land on one side more than the other?______________________________________________________________________________________________________________________________________________________________________________________________________Grade 2 DMactivity032 covers:D11:explore through simple games and experiments the likelihood that an event may occurD12:investigate simple probability situations (eg. flipping a coin, tossing a dice)D13: use mathematical language (eg. likely, unlikely, probably) in informal discussion to describe probability© Math Wizards, 2003

RED BLUE
Data Management & ProbabilityActivity THIRTY-THREE
** Do an example probability experiment with the spinners at the carpet. Youwill need to have one base and one labelled CD for each student (see materialsbox for building instructions). **
Merlin wants us to do a probability experiment witha spinner. He has left us a spinner with a top thatlooks like the picture on the right.Spin the spinner 30 times and record your results inthe tally chart below.
My PredictionI think the spinner will land more often on thecolour:__________________________________________
Colour Tally
RED
BLUE
Complete the following questions:
1) What colour did the spinner land on the most?__________________________
2) Did you predict correctly?__________________________________________
3) Draw an unfair spinner below and describe why it is unfair___________________________________________________________________________________________________________________________________________________________
Grade 2 DMactivity033 covers:D11:explore through simple games and experiments the likelihood that an event may occurD12:investigate simple probability situations (eg. flipping a coin, tossing a dice)D13: use mathematical language (eg. likely, unlikely, probably) in informal discussion to describe probability© Math Wizards, 2003