GPS MICRO STRIP RECTANGULAR PATCH ANTENNA AT 2.45 … · classification and designing of antenna is...
7
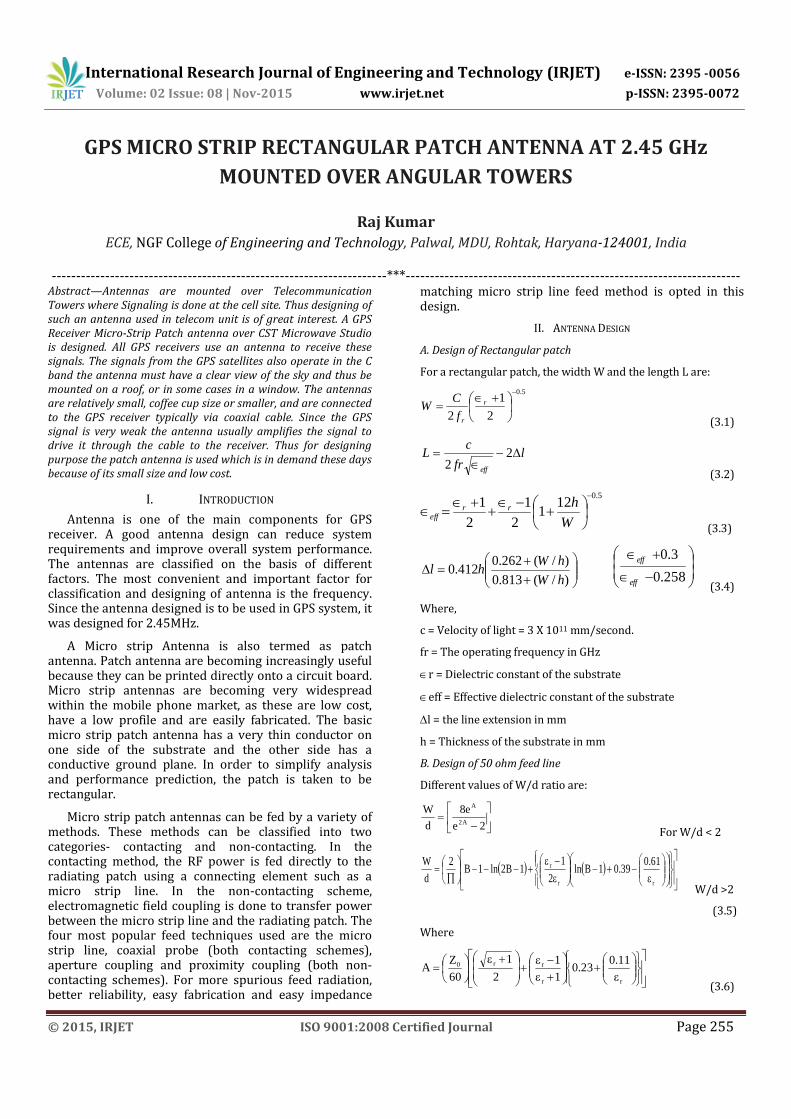
International Research Journal of Engineering and Technology (IRJET) e-ISSN: 2395 -0056 Volume: 02 Issue: 08 | Nov-2015 www.irjet.net p-ISSN: 2395-0072 © 2015, IRJET ISO 9001:2008 Certified Journal Page 255 GPS MICRO STRIP RECTANGULAR PATCH ANTENNA AT 2.45 GHz MOUNTED OVER ANGULAR TOWERS Raj Kumar ECE, NGF College of Engineering and Technology, Palwal, MDU, Rohtak, Haryana-124001, India ---------------------------------------------------------------------***--------------------------------------------------------------------- Abstract—Antennas are mounted over Telecommunication Towers where Signaling is done at the cell site. Thus designing of such an antenna used in telecom unit is of great interest. A GPS Receiver Micro-Strip Patch antenna over CST Microwave Studio is designed. All GPS receivers use an antenna to receive these signals. The signals from the GPS satellites also operate in the C band the antenna must have a clear view of the sky and thus be mounted on a roof, or in some cases in a window. The antennas are relatively small, coffee cup size or smaller, and are connected to the GPS receiver typically via coaxial cable. Since the GPS signal is very weak the antenna usually amplifies the signal to drive it through the cable to the receiver. Thus for designing purpose the patch antenna is used which is in demand these days because of its small size and low cost. I. INTRODUCTION Antenna is one of the main components for GPS receiver. A good antenna design can reduce system requirements and improve overall system performance. The antennas are classified on the basis of different factors. The most convenient and important factor for classification and designing of antenna is the frequency. Since the antenna designed is to be used in GPS system, it was designed for 2.45MHz. A Micro strip Antenna is also termed as patch antenna. Patch antenna are becoming increasingly useful because they can be printed directly onto a circuit board. Micro strip antennas are becoming very widespread within the mobile phone market, as these are low cost, have a low profile and are easily fabricated. The basic micro strip patch antenna has a very thin conductor on one side of the substrate and the other side has a conductive ground plane. In order to simplify analysis and performance prediction, the patch is taken to be rectangular. Micro strip patch antennas can be fed by a variety of methods. These methods can be classified into two categories- contacting and non-contacting. In the contacting method, the RF power is fed directly to the radiating patch using a connecting element such as a micro strip line. In the non-contacting scheme, electromagnetic field coupling is done to transfer power between the micro strip line and the radiating patch. The four most popular feed techniques used are the micro strip line, coaxial probe (both contacting schemes), aperture coupling and proximity coupling (both non- contacting schemes). For more spurious feed radiation, better reliability, easy fabrication and easy impedance matching micro strip line feed method is opted in this design. II. ANTENNA DESIGN A. Design of Rectangular patch For a rectangular patch, the width W and the length L are: 5 . 0 2 1 2 r r f C W (3.1) l fr c L eff 2 2 (3.2) 5 . 0 12 1 2 1 2 1 W h r r eff (3.3) ) / ( 813 . 0 ) / ( 262 . 0 412 . 0 h W h W h l 258 . 0 3 . 0 eff eff (3.4) Where, c = Velocity of light = 3 X 10 11 mm/second. fr = The operating frequency in GHz r = Dielectric constant of the substrate eff = Effective dielectric constant of the substrate l = the line extension in mm h = Thickness of the substrate in mm B. Design of 50 ohm feed line Different values of W/d ratio are: 2 e e 8 d W A 2 A For W/d < 2 r r r 61 . 0 39 . 0 1 B ln 2 1 1 B 2 ln 1 B 2 d W W/d >2 (3.5) Where r r r r 0 11 . 0 23 . 0 1 1 2 1 60 Z A (3.6)
Transcript of GPS MICRO STRIP RECTANGULAR PATCH ANTENNA AT 2.45 … · classification and designing of antenna is...
International Research Journal of Engineering and Technology (IRJET) e-ISSN: 2395 -0056
Volume: 02 Issue: 08 | Nov-2015 www.irjet.net p-ISSN: 2395-0072
© 2015, IRJET ISO 9001:2008 Certified Journal Page 255
GPS MICRO STRIP RECTANGULAR PATCH ANTENNA AT 2.45 GHz
MOUNTED OVER ANGULAR TOWERS
Raj Kumar
ECE, NGF College of Engineering and Technology, Palwal, MDU, Rohtak, Haryana-124001, India
---------------------------------------------------------------------***---------------------------------------------------------------------Abstract—Antennas are mounted over Telecommunication Towers where Signaling is done at the cell site. Thus designing of such an antenna used in telecom unit is of great interest. A GPS Receiver Micro-Strip Patch antenna over CST Microwave Studio is designed. All GPS receivers use an antenna to receive these signals. The signals from the GPS satellites also operate in the C band the antenna must have a clear view of the sky and thus be mounted on a roof, or in some cases in a window. The antennas are relatively small, coffee cup size or smaller, and are connected to the GPS receiver typically via coaxial cable. Since the GPS signal is very weak the antenna usually amplifies the signal to drive it through the cable to the receiver. Thus for designing purpose the patch antenna is used which is in demand these days because of its small size and low cost.
I. INTRODUCTION
Antenna is one of the main components for GPS receiver. A good antenna design can reduce system requirements and improve overall system performance. The antennas are classified on the basis of different factors. The most convenient and important factor for classification and designing of antenna is the frequency. Since the antenna designed is to be used in GPS system, it was designed for 2.45MHz.
A Micro strip Antenna is also termed as patch antenna. Patch antenna are becoming increasingly useful because they can be printed directly onto a circuit board. Micro strip antennas are becoming very widespread within the mobile phone market, as these are low cost, have a low profile and are easily fabricated. The basic micro strip patch antenna has a very thin conductor on one side of the substrate and the other side has a conductive ground plane. In order to simplify analysis and performance prediction, the patch is taken to be rectangular.
Micro strip patch antennas can be fed by a variety of methods. These methods can be classified into two categories- contacting and non-contacting. In the contacting method, the RF power is fed directly to the radiating patch using a connecting element such as a micro strip line. In the non-contacting scheme, electromagnetic field coupling is done to transfer power between the micro strip line and the radiating patch. The four most popular feed techniques used are the micro strip line, coaxial probe (both contacting schemes), aperture coupling and proximity coupling (both non-contacting schemes). For more spurious feed radiation, better reliability, easy fabrication and easy impedance
matching micro strip line feed method is opted in this design.
II. ANTENNA DESIGN
A. Design of Rectangular patch
For a rectangular patch, the width W and the length L are:
5.0
2
1
2
r
rf
CW
(3.1)
lfr
cL
eff
22
(3.2)
5.012
12
1
2
1
W
hrreff
(3.3)
)/(813.0
)/(262.0412.0
hW
hWhl
258.0
3.0
eff
eff
(3.4)
Where,
c = Velocity of light = 3 X 1011 mm/second.
fr = The operating frequency in GHz
r = Dielectric constant of the substrate
eff = Effective dielectric constant of the substrate
l = the line extension in mm
h = Thickness of the substrate in mm
B. Design of 50 ohm feed line
Different values of W/d ratio are:
2e
e8
d
WA2
A
For W/d < 2
rr
r 61.039.01Bln
2
11B2ln1B
2
d
W
W/d >2
(3.5)
Where
rr
rr0 11.023.0
1
1
2
1
60
ZA
(3.6)

International Research Journal of Engineering and Technology (IRJET) e-ISSN: 2395 -0056
Volume: 02 Issue: 08 | Nov-2015 www.irjet.net p-ISSN: 2395-0072
© 2015, IRJET ISO 9001:2008 Certified Journal Page 256
r0Z2
377B
(3.7)
w
H121
1
2
1
2
1 rrre
(3.8)
re
0g
(3.9)
(3.10)
C. Designing of λ/4 Transformer Line
λ/4 transformer line is designed to
precisely match the impedance between input
feed line and the patch.The input resistance to
patch is given by Rin:
patch
effin
W2
120R
(3.11)
inR50Z (3.12)
The same formulas which are used for calculating
length and width of 50 ohm line have been used for calculating
length and width of transformer line.
II. DESIGN PARAMETERS
The rectangular patch is realized with a
substrate material of GML 1000 and permittivity of 3.2.
Fig 1: Structure of Rectangular Patch Antenna
TABLE I. DESIGN PARAMETERS
III. SIMULATION RESULTS AND DISCUSSIONS
A.Return loss:
As expected, Operating frequency of 2.45GHz is obtained as
shown in the figure 2 and 3. Referring to figure 3 the red curve
shows the return loss of initial structure designed and green
curve shows the return loss of optimized structure. Both have a
peak at 2.45 GHz but the difference lies in the accuracy.
The value of S11 for initial structure was -14.678371
dB which was improved to the best value of -29.822192 dB after
optimization of the structure.
Fig 2 Return Loss
Parameters Designed
values Optimized
values
Operating frequency 2.45 2.45
Patch length (AL) 34.046
32.414
Patch width (AW) 42.248
39.2
Quarter line length (QL) 20.634
19.2
Quarter line width (QW) 0.9255
0.5478
Substrate Length (SL) 70
70
Substrate width (SW) 70
70
Input Line Length 19.173
5
Input Line Width 1.833 1.833
4L
g
International Research Journal of Engineering and Technology (IRJET) e-ISSN: 2395 -0056
Volume: 02 Issue: 08 | Nov-2015 www.irjet.net p-ISSN: 2395-0072
© 2015, IRJET ISO 9001:2008 Certified Journal Page 257
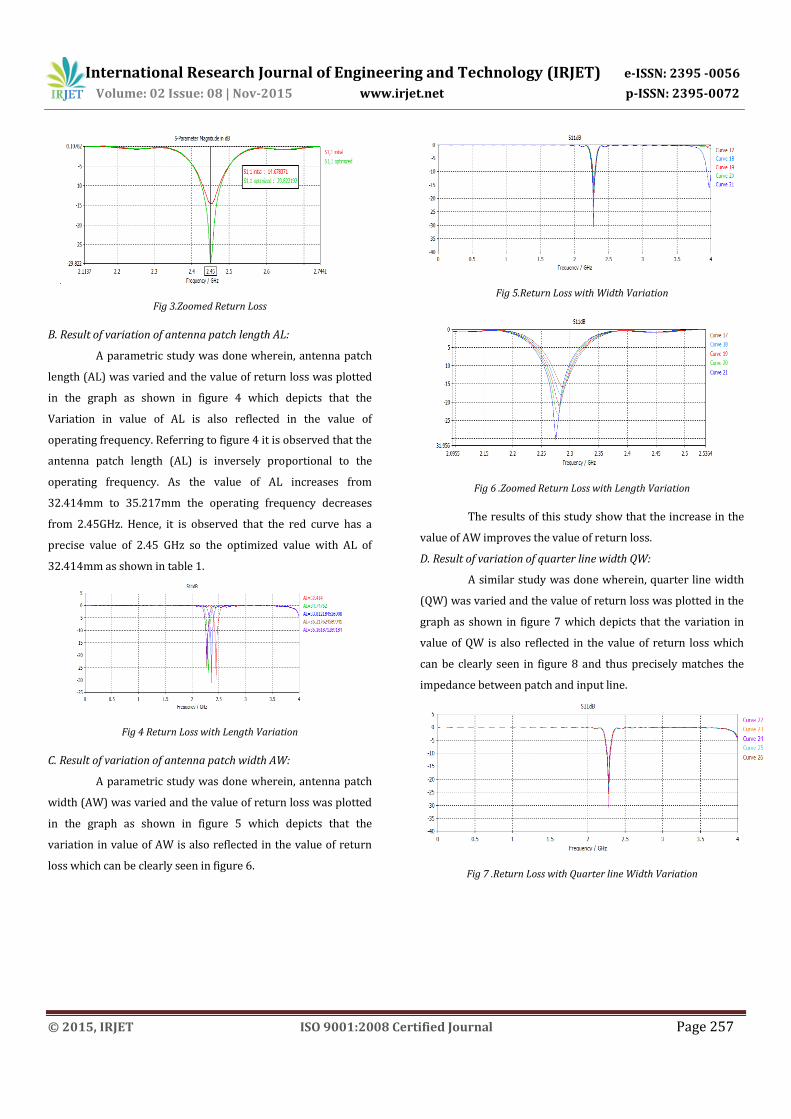
Fig 3.Zoomed Return Loss
B. Result of variation of antenna patch length AL:
A parametric study was done wherein, antenna patch
length (AL) was varied and the value of return loss was plotted
in the graph as shown in figure 4 which depicts that the
Variation in value of AL is also reflected in the value of
operating frequency. Referring to figure 4 it is observed that the
antenna patch length (AL) is inversely proportional to the
operating frequency. As the value of AL increases from
32.414mm to 35.217mm the operating frequency decreases
from 2.45GHz. Hence, it is observed that the red curve has a
precise value of 2.45 GHz so the optimized value with AL of
32.414mm as shown in table 1.
Fig 4 Return Loss with Length Variation
C. Result of variation of antenna patch width AW:
A parametric study was done wherein, antenna patch
width (AW) was varied and the value of return loss was plotted
in the graph as shown in figure 5 which depicts that the
variation in value of AW is also reflected in the value of return
loss which can be clearly seen in figure 6.
Fig 5.Return Loss with Width Variation
Fig 6 .Zoomed Return Loss with Length Variation
The results of this study show that the increase in the
value of AW improves the value of return loss.
D. Result of variation of quarter line width QW:
A similar study was done wherein, quarter line width
(QW) was varied and the value of return loss was plotted in the
graph as shown in figure 7 which depicts that the variation in
value of QW is also reflected in the value of return loss which
can be clearly seen in figure 8 and thus precisely matches the
impedance between patch and input line.
Fig 7 .Return Loss with Quarter line Width Variation
International Research Journal of Engineering and Technology (IRJET) e-ISSN: 2395 -0056
Volume: 02 Issue: 08 | Nov-2015 www.irjet.net p-ISSN: 2395-0072
© 2015, IRJET ISO 9001:2008 Certified Journal Page 258
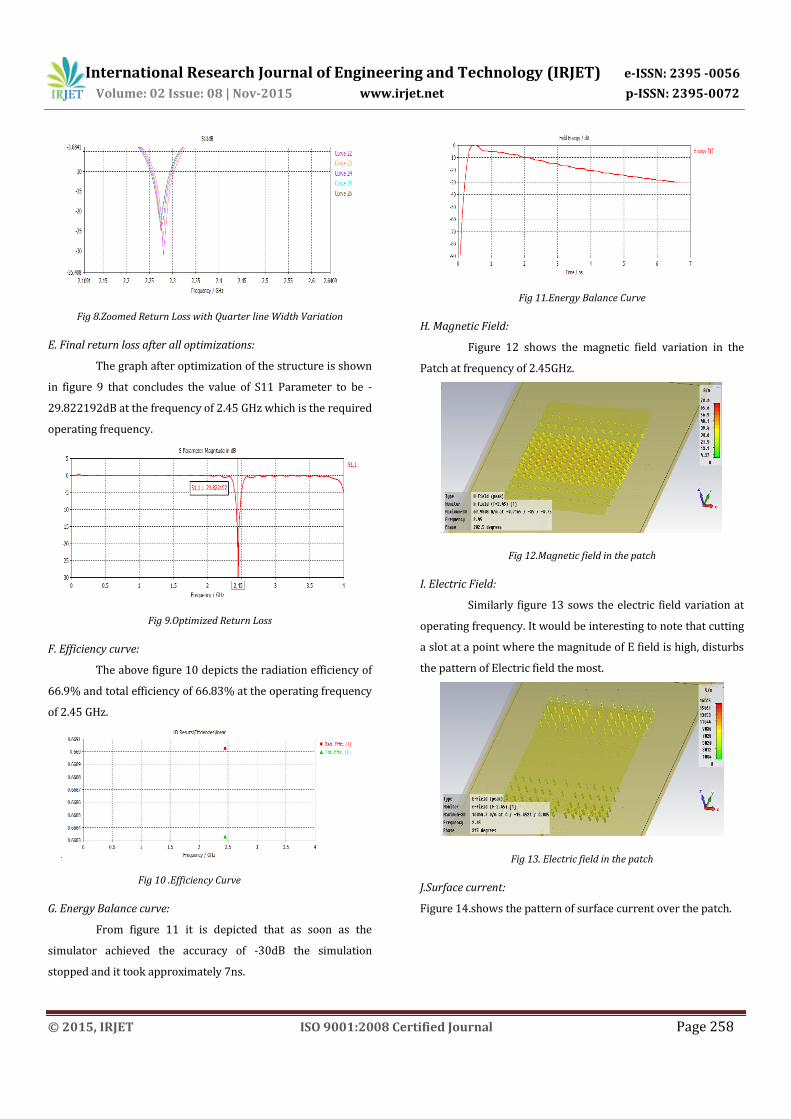
Fig 8.Zoomed Return Loss with Quarter line Width Variation
E. Final return loss after all optimizations:
The graph after optimization of the structure is shown
in figure 9 that concludes the value of S11 Parameter to be -
29.822192dB at the frequency of 2.45 GHz which is the required
operating frequency.
Fig 9.Optimized Return Loss
F. Efficiency curve:
The above figure 10 depicts the radiation efficiency of
66.9% and total efficiency of 66.83% at the operating frequency
of 2.45 GHz.
Fig 10 .Efficiency Curve
G. Energy Balance curve:
From figure 11 it is depicted that as soon as the
simulator achieved the accuracy of -30dB the simulation
stopped and it took approximately 7ns.
Fig 11.Energy Balance Curve
H. Magnetic Field:
Figure 12 shows the magnetic field variation in the
Patch at frequency of 2.45GHz.
Fig 12.Magnetic field in the patch
I. Electric Field:
Similarly figure 13 sows the electric field variation at
operating frequency. It would be interesting to note that cutting
a slot at a point where the magnitude of E field is high, disturbs
the pattern of Electric field the most.
Fig 13. Electric field in the patch
J.Surface current:
Figure 14.shows the pattern of surface current over the patch.

International Research Journal of Engineering and Technology (IRJET) e-ISSN: 2395 -0056
Volume: 02 Issue: 08 | Nov-2015 www.irjet.net p-ISSN: 2395-0072
© 2015, IRJET ISO 9001:2008 Certified Journal Page 259
Fig 14.Return Loss with Quarter line Width Variation
K. 3D Far Field:
Figure 15 shows the Radiation Pattern of the patch
antenna designed where red portion represents the maximum
value of gain or directivity. So the line of maximum directivity is
along z axis according to the patch designed in x-y plane.
Fig 15.3D Radiation Pattern
Fig 16.Major lobe of 3D Radiation Pattern
Figure 16 depicts the major lobe of patch antenna
along z axis and minor lobe is along –z axis where gain or
directivity will be minimum and is represented by blue color.
Thus similar patterns are expected from GPS antennas.
L. E and H Plane Polar Plot:
Theta is the angle between the x axis and the line from
the origin to the point of measurement. Phi is the angle between
the z axis and the line joining the origin to the point of
measurement. Varying phi while keeping theta constant gives
H-Plane polar plot whereas varying theta while keeping phi
constant gives the E-Plane Polar Plot.
Figure 17 represents the H Plane polar plot where
theta is fixed at 0 degree and phi is varied from 0 to 360 degrees
giving a constant gain of 7.1dB in all directions.
Fig 17. H-Plane Polar plot at theta=0
Figure 18 represents the H Plane polar plot where theta is
fixed at 90 deg. and phi is varied from 0 to 360 deg. giving a
major lobe at 307 deg. and at 233 deg. having the magnitude of -
2.9dB.
Figure 19 represents the E Plane polar plot where phi is
fixed at 0 deg. and theta is varied from 0 to 360 deg. giving a
major lobe at 0 deg. having the gain of 7.1dB.
Fig 18. H-Plane Polar plot at theta=90
Fig 19.E-Plane Polar Plots at theta = 0

International Research Journal of Engineering and Technology (IRJET) e-ISSN: 2395 -0056
Volume: 02 Issue: 08 | Nov-2015 www.irjet.net p-ISSN: 2395-0072
© 2015, IRJET ISO 9001:2008 Certified Journal Page 260
Figure 20 represents the E Plane polar plot where phi is
fixed at 90 deg. and theta is varied from 0 to 360 deg. giving a
major lobe at 0 deg. having the gain of 7.1dB.
Fig 20. E-Plane Polar Plots at theta = 90
IV. FABRICATIONRESULTS AND DISCUSSIONS
Figure 21 represents the return loss of the fabricated
antenna with the help of Vector Network Analyzer. These
results shows that the operating frequency of fabricated
antenna is 2.4618GHz which is almost near to the value of
frequency the antenna was designed for.
Fig 21. Observed results on Vector Network Analyzer
The value of Return Loss (S11) in the graph is -11.87dB which is more than
99.9% of accuracy, hence the fabricated antenna is reliable for real time
applications.
Figure 22 is the polar plot of radiation pattern of the fabricated
antenna as obtained by the measurement done in Anechoic Chamber whose
shape and direction of radiation are as expected.
Fig 22. Radiation Pattern observed for Fabricated Antenna
Table II COMPARISON OF DIFFERENT RESULTS
Parameter Simulation
ResultsUsing Micro-
Stripes
Measured
results Through
V.N.A
Return Loss -30Db -11.8dB
Resonating
Frequency
2.45 GHz 2.461GHz
V. CONCLUSIONS
For achieving the design of the GPS antenna, software used
is CST Microwave Studio where the specification of operating
frequency and substrate material used for micro-strip patch
antenna was initially selected to be 2.45GHz and GML1000
respectively.
As expected, Operating frequency of 2.45GHz is obtained
where the return loss of structure designed and the return loss
of optimized structure both have a peak at 2.45 GHz but the
difference lies in their magnitude.A parametric study was done
where, antenna patch length (AL), antenna patch width (AW)
and Quarter wave line width (QW) of the designed antenna is
varied. This variation tells that the operating frequency is
inversely proportional to the AL. Also the results show that the
increase in the value of AW improves the value of return loss
and thus optimization is achieved. Variation in QW helps in
precisely matching the impedance between patch and input
line.Next energy balance curve of the antenna was observed
where it was plotted that as soon as radiated power was
matched with the energy of input feed line to an accuracy of -
30dB, the simulator stopped. Radiation Pattern of the patch

International Research Journal of Engineering and Technology (IRJET) e-ISSN: 2395 -0056
Volume: 02 Issue: 08 | Nov-2015 www.irjet.net p-ISSN: 2395-0072
© 2015, IRJET ISO 9001:2008 Certified Journal Page 261
antenna designed shows that the maximum value of gain or
directivity is along z axis and minimum is along –z axis.
Vector network analyzer was used to check the parameters
of the fabricated antenna and it was observed that the operating
frequency of 2.45GHz was achieved with the value of accuracy
of -11dB which is suitable for real time applications.Further the
antenna was tested in anechoic chamber and the shape and
direction of radiation pattern plotted was as expected.
VI. FUTEURE PROSPECTS
Different types of substrate material other than GML1000
and background material other than Vacuum can be chosen and
the best combination of two can be found out for best
results.The accuracy can be further improved for the designed
structure. In the work done the accuracy maintained was -30dB
which can be reduced to improve the performance. Similarly
structure can be further optimized for précised results.The
optimized accuracy was -30 dB but the fabricated antenna
accuracy came to be -11 dB so the fabrication process must be
improved to decrease the deterioration in the results.For
simulation of antenna designed the transient solver was used.
Outputs of frequency solver can also be simulated and
compared for further analysis.The similar studies can be done
for antennas working in frequency bands other than C band
(2.45GHz).
REFERENCES
[1] Usman Ali, SadiqUllah, Shahbaz Khan, James. A. Flint “Comparative Study of Rectangular MicrostripPatchAntenna on Various types of Metamaterials Surfaces” 20 I 4 International Conference on Open Source Systems and Technologies (ICOSST), Page 186-191.
[2] TahsinFerdousAraNayna, A. K. M. Baki, Feroz Ahmed“Comparative Study of Rectangular and Circular Microstrip Patch Antennas in X Band” International Conference on Electrical Engineering and Information & Communication Technology (ICEEICT) 2014
[3] NorfishahAbWahab, Zulkifli Bin Maslan, Wan Norsyafizan W. Muhamad, NorhayatiHamzah “Microstrip Rectangular 4x1 Patch Array Antenna at 2.5GHz for WiMax Application” 2010 Second International Conference on Computational Intelligence, Communication Systems and Networks
[4] Shiban K. Koul. "Optimized tunable frequency microstrip patch antenna" , 2011 IEEE International Conference on Microwaves Communications Antennas and Electronic Systems (COMCAS 2011), 11/2011
[5] Y. C. Lee. "Packaging Rf Devices and Modules" , Wiley Encyclopedia of Electrical and Electronics Engineering, 12/27/1999
[6] Krewski, Aleksander, Werner L. Schroeder, and Klaus Solbach. "MIMO LTE antenna design for laptops based on theory of characteristic modes" , 2012 6th European Conference on Antennas and Propagation (EUCAP), 2012
[7] Sharma. "A novel dual frequency wideband antenna for mobile communications" , Proceedings of IEEE TENCON 98 IEEE Region 10 International Conference on Global Connectivity in Energy Computer Communication and Control (Cat No 98CH36229) TENCON-98, 1998
[8] Al-Charchafchi, Sami H. Loukrezis, Frang. "Electromagnetically coupled, stacked microstrip patch antennas." , Microwave Journal, June 1995 Issue
[9] "Metrological Principles Applied to Geohydraulic Data" , Quality Assurance for Chemistry and Environmental Science, 2007
[10] Khashan, L.M.. "Design and implementation of a C-band active integrated antenna", Physica B: Physics of Condensed Matter.
[11] Kuttler, . "Some Curvilinear Coordinate Systems" , Calculus Theory and Applications, 2010


![A Reconfigurable Multiband Antenna for RFID and GPS ...designed a multiband antenna for RFID applications which was applicable for several standards [11]. Due to different worldwide](https://static.fdocuments.in/doc/165x107/5e7d81804c433e7bde0965ae/a-reconfigurable-multiband-antenna-for-rfid-and-gps-designed-a-multiband-antenna.jpg)