GPS Based Phasor Technology in Electrical Power System · GPS Based Phasor Technology in Electrical...
4
GPS Based Phasor Technology in Electrical Power System Rohini P. Haridas Electrical Engineering Department, S.S.G.M.C.E, Shegaon, India Email: [email protected] Abstract—The electrical power system has been increasing in complexity at rapid rate in last few decades. Traditional SCADA systems are based on steady state power flow analysis and therefore cannot observe the dynamic characteristic of the system. Synchronized phasor measurement units (PMUs) were first introduced in early 1980s. Synchronized phasor measurements are becoming an important element of wide area measurement systems used in advanced power system monitoring, protection, and control applications. Phasor measurement units (PMUs) are power system devices that provide synchronized measurements of real-time phasors of voltages and currents. Synchronization is achieved by same-time sampling of voltage and current waveforms using timing signals from the Global Positioning System. The advantage of referring phase angle to a global reference time is helpful in capturing the wide area snap shot of the power system [1]. The GPS based phasor measurement technology provides the dynamic view of power system. This paper gives the introduction to GPS based phasor measurement techniques in power system. Index Terms—GPS, synchrophasor, PMU, SCADA I. INTRODUCTION For decades, traditional SCADA measurement has been providing power system information to system operators. These measurements are typically taken once every 4 to 10 seconds offering a steady state view of the power system behavior. However, for monitoring and control of such large grid only steady state information is not being sufficient. Synchronized measurement technology (Wide area measurement) is considered to be one of the most important technologies in the future of power systems due to its unique ability to sample analog voltage and current waveform data in synchronism with a GPS-clock and compute the corresponding frequency component from widely dispersed locations. GPS based Synchronized phasor measurement units (PMUs) were first introduced in early 1980s. Synchronized phasor measurements are becoming an important element of wide area measurement systems used in advanced power system monitoring, protection, and control applications. Phasor measurement units (PMUs) are power system devices that provide Manuscript received July 24, 2014; revised December 20, 2014. synchronized measurements of real-time phasors of voltages and currents. Synchronization is achieved by same-time sampling of voltage and current waveforms using timing signals from the Global Positioning System. The advantage of referring phase angle to a global reference time is helpful in capturing the wide area snap shot of the power system. The occurrence of major blackouts has given new impetus for large scale implementation of wide area measurement systems using PMUs and PDCs. Data provided by PMUs are very accurate and enable the system analyst to determine the exact sequence of events which have led to blackouts. It also help to analyze the sequence of events which helps pinpoint the exact causes and malfunctions that may have contributed to the failure of power system [2]. A number of PMUs are already installed in several utilities around the world for various applications such as post-mortem analysis, adaptive protection, system protection schemes, and state estimation. Effective utilization of this technology is very useful in mitigating blackouts and learning the real time behavior of the power system. A. Phasor Basics A pure sinusoidal waveform can be represented by a unique complex number known as a phasor. Consider a sinusoidal signal () cos( ) m xt X t (1) where, m X is the peak value of the signal is the frequency of the signal in radians per second is the phase angle in radians The phasor representation of this sinusoidal is given by where, ( / 2) j r i m X X jX X e / 2 (cos sin ) m x j (2) where, / 2 m x is the magnitude of the phasor i.e. the r.m.s. value of sinusoid. is its phase angle. The sinusoidal signal and its phasor representation given by 1 and 2 are illustrated in Fig. 1. International Journal of Electronics and Electrical Engineering Vol. 3, No. 6, December 2015 ©2015 International Journal of Electronics and Electrical Engineering 493 doi: 10.12720/ijeee.3.6.493-496
Transcript of GPS Based Phasor Technology in Electrical Power System · GPS Based Phasor Technology in Electrical...

GPS Based Phasor Technology in Electrical
Power System
Rohini P. Haridas Electrical Engineering Department, S.S.G.M.C.E, Shegaon, India
Email: [email protected]
Abstract—The electrical power system has been increasing
in complexity at rapid rate in last few decades. Traditional
SCADA systems are based on steady state power flow
analysis and therefore cannot observe the dynamic
characteristic of the system. Synchronized phasor
measurement units (PMUs) were first introduced in early
1980s. Synchronized phasor measurements are becoming an
important element of wide area measurement systems used
in advanced power system monitoring, protection, and
control applications. Phasor measurement units (PMUs) are
power system devices that provide synchronized
measurements of real-time phasors of voltages and currents.
Synchronization is achieved by same-time sampling of
voltage and current waveforms using timing signals from
the Global Positioning System. The advantage of referring
phase angle to a global reference time is helpful in capturing
the wide area snap shot of the power system [1]. The GPS
based phasor measurement technology provides the
dynamic view of power system. This paper gives the
introduction to GPS based phasor measurement techniques
in power system.
Index Terms—GPS, synchrophasor, PMU, SCADA
I. INTRODUCTION
For decades, traditional SCADA measurement has
been providing power system information to system
operators. These measurements are typically taken once
every 4 to 10 seconds offering a steady state view of the
power system behavior. However, for monitoring and
control of such large grid only steady state information is
not being sufficient. Synchronized measurement
technology (Wide area measurement) is considered to be
one of the most important technologies in the future of
power systems due to its unique ability to sample analog
voltage and current waveform data in synchronism with a
GPS-clock and compute the corresponding frequency
component from widely dispersed locations.
GPS based Synchronized phasor measurement units
(PMUs) were first introduced in early 1980s.
Synchronized phasor measurements are becoming an
important element of wide area measurement systems
used in advanced power system monitoring, protection,
and control applications. Phasor measurement units
(PMUs) are power system devices that provide
Manuscript received July 24, 2014; revised December 20, 2014.
synchronized measurements of real-time phasors of
voltages and currents. Synchronization is achieved by
same-time sampling of voltage and current waveforms
using timing signals from the Global Positioning System.
The advantage of referring phase angle to a global
reference time is helpful in capturing the wide area snap
shot of the power system.
The occurrence of major blackouts has given new
impetus for large scale implementation of wide area
measurement systems using PMUs and PDCs. Data
provided by PMUs are very accurate and enable the
system analyst to determine the exact sequence of events
which have led to blackouts. It also help to analyze the
sequence of events which helps pinpoint the exact causes
and malfunctions that may have contributed to the failure
of power system [2].
A number of PMUs are already installed in several
utilities around the world for various applications such as
post-mortem analysis, adaptive protection, system
protection schemes, and state estimation. Effective
utilization of this technology is very useful in mitigating
blackouts and learning the real time behavior of the
power system.
A. Phasor Basics
A pure sinusoidal waveform can be represented by a
unique complex number known as a phasor. Consider a
sinusoidal signal
( ) cos( )m
x t X t (1)
where,
mX is the peak value of the signal
is the frequency of the signal in radians per second
is the phase angle in radians
The phasor representation of this sinusoidal is given by
where,
( / 2)j
r i mX X jX X e
/ 2(cos sin )m
x j (2)
where,
/ 2m
x is the magnitude of the phasor i.e. the r.m.s.
value of sinusoid.
is its phase angle.
The sinusoidal signal and its phasor representation
given by 1 and 2 are illustrated in Fig. 1.
International Journal of Electronics and Electrical Engineering Vol. 3, No. 6, December 2015
©2015 International Journal of Electronics and Electrical Engineering 493doi: 10.12720/ijeee.3.6.493-496
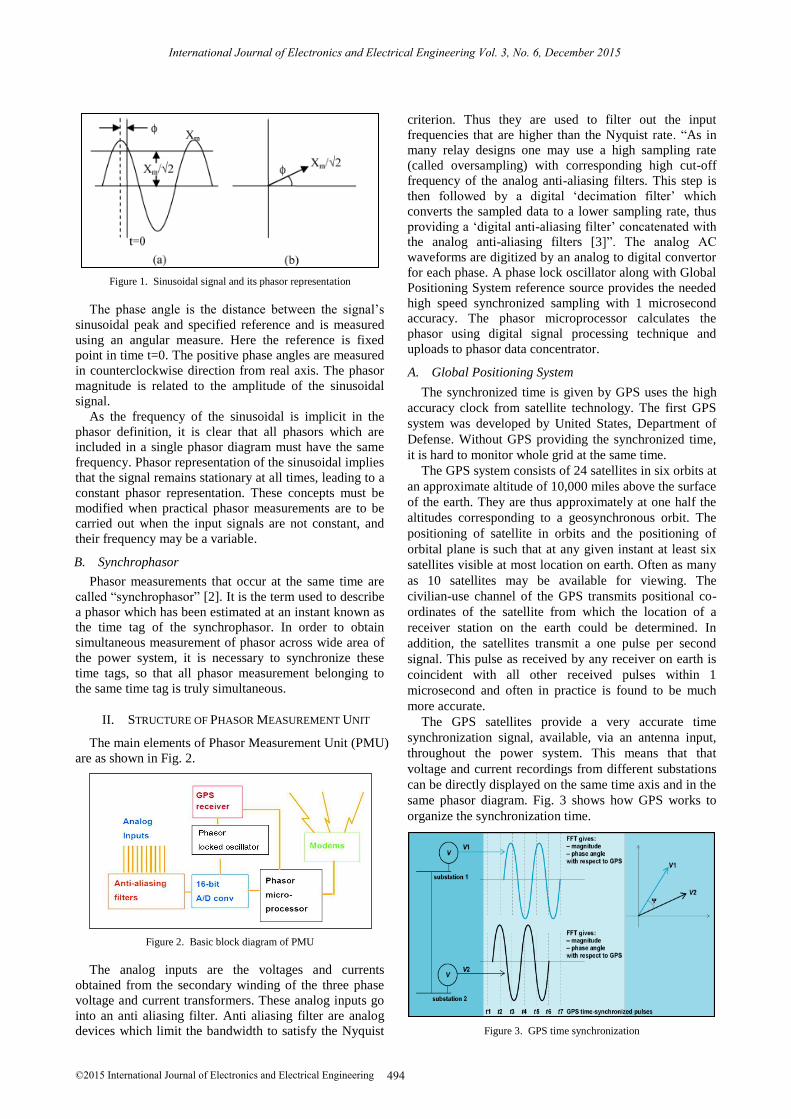
Figure 1. Sinusoidal signal and its phasor representation
The phase angle is the distance between the signal’s
sinusoidal peak and specified reference and is measured
using an angular measure. Here the reference is fixed
point in time t=0. The positive phase angles are measured
in counterclockwise direction from real axis. The phasor
magnitude is related to the amplitude of the sinusoidal
signal.
As the frequency of the sinusoidal is implicit in the
phasor definition, it is clear that all phasors which are
included in a single phasor diagram must have the same
frequency. Phasor representation of the sinusoidal implies
that the signal remains stationary at all times, leading to a
constant phasor representation. These concepts must be
modified when practical phasor measurements are to be
carried out when the input signals are not constant, and
their frequency may be a variable.
B. Synchrophasor
Phasor measurements that occur at the same time are
called “synchrophasor” [2]. It is the term used to describe
a phasor which has been estimated at an instant known as
the time tag of the synchrophasor. In order to obtain
simultaneous measurement of phasor across wide area of
the power system, it is necessary to synchronize these
time tags, so that all phasor measurement belonging to
the same time tag is truly simultaneous.
The main elements of Phasor Measurement Unit (PMU)
are as shown in Fig. 2.
Figure 2. Basic block diagram of PMU
The analog inputs are the voltages and currents
obtained from the secondary winding of the three phase
voltage and current transformers. These analog inputs go
into an anti aliasing filter. Anti aliasing filter are analog
devices which limit the bandwidth to satisfy the Nyquist
criterion. Thus they are used to filter out the input
frequencies that are higher than the Nyquist rate. “As in
many relay designs one may use a high sampling rate
(called oversampling) with corresponding high cut-off
frequency of the analog anti-aliasing filters. This step is
then followed by a digital ‘decimation filter’ which
converts the sampled data to a lower sampling rate, thus
providing a ‘digital anti-aliasing filter’ concatenated with
the analog anti-aliasing filters [3]”. The analog AC
waveforms are digitized by an analog to digital convertor
for each phase. A phase lock oscillator along with Global
Positioning System reference source provides the needed
high speed synchronized sampling with 1 microsecond
accuracy. The phasor microprocessor calculates the
phasor using digital signal processing technique and
uploads to phasor data concentrator.
A. Global Positioning System
The synchronized time is given by GPS uses the high
accuracy clock from satellite technology. The first GPS
system was developed by United States, Department of
Defense. Without GPS providing the synchronized time,
it is hard to monitor whole grid at the same time.
The GPS system consists of 24 satellites in six orbits at
an approximate altitude of 10,000 miles above the surface
of the earth. They are thus approximately at one half the
altitudes corresponding to a geosynchronous orbit. The
positioning of satellite in orbits and the positioning of
orbital plane is such that at any given instant at least six
satellites visible at most location on earth. Often as many
as 10 satellites may be available for viewing. The
civilian-use channel of the GPS transmits positional co-
ordinates of the satellite from which the location of a
receiver station on the earth could be determined. In
addition, the satellites transmit a one pulse per second
signal. This pulse as received by any receiver on earth is
coincident with all other received pulses within 1
microsecond and often in practice is found to be much
more accurate.
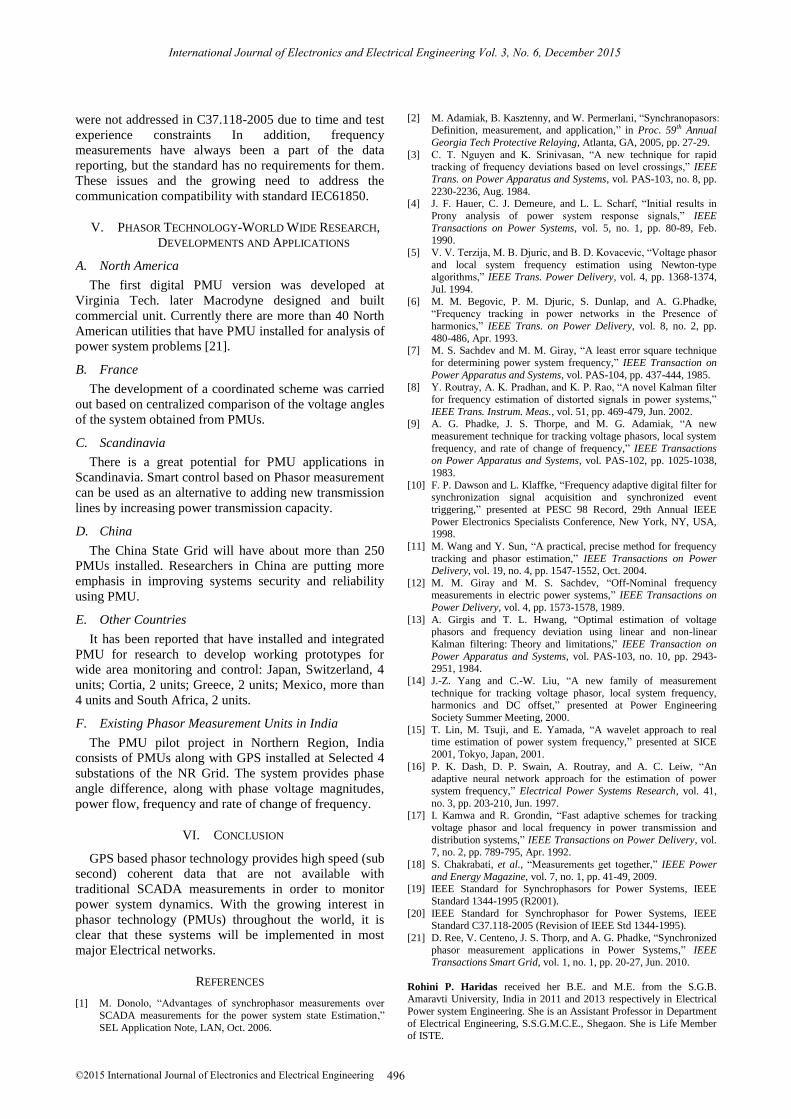
The GPS satellites provide a very accurate time
synchronization signal, available, via an antenna input,
throughout the power system. This means that that
voltage and current recordings from different substations
can be directly displayed on the same time axis and in the
same phasor diagram. Fig. 3 shows how GPS works to
organize the synchronization time.
Figure 3. GPS time synchronization
International Journal of Electronics and Electrical Engineering Vol. 3, No. 6, December 2015
©2015 International Journal of Electronics and Electrical Engineering 494
II. STRUCTURE OF PHASOR MEASUREMENT UNIT

B. Phasor Network
The simplest form of the phasor network consists of
two nodes, one phasor measurement unit (PMU) at node
1 that communicates with one phasor data concentrator
(PDC) at node 2.A typical phasor network is as shown in
Fig. 4.
Figure 4. Phasor networks
The PMUs are installed in power system substations.
The selection of stations where these installations take
place depends upon the use to be made of the
measurements they provide. The PMU provides the
measurements of time-stamped positive sequence voltage
and currents of all monitored buses and feeders along
with the frequency and rate of change of frequency. The
measurements are stored in local data storage which can
be accessed from remote location for post –mortem
analysis. There may be some local application task which
requires PMU data; in that case it can be made available
locally for such tasks.
The PMUs are connected to the PDC at utility centre
where the data is aggregated .the main function of PDC is
to gather data from several PMUs reject bad data and
create coherent record data from a wider part of power
system. A personal computer connected to the output of
PDC provides the users with software such as RTDMS
(real Time Dynamic Monitoring System) and displays
locally measured frequencies, primary voltages, currents,
MWs and MVARs for system operators. Additionally
may PDCs belonging to different utilities can also be
connected to common central PDC known as Super PDC.
It aggregates the data across the utilities to provide an
interconnection-wide snapshot.
C. Comparision between SCADA and GPS Based
Phasor Technology (Table I)
TABLE I. COMPARISON BETWEEN SCADA AND GPS BASED PHASOR
TECHNOLOGY
Factors SCADA PMU
Measurement Analog Digital
Resolution 2-4 samples per
cycle Up to 60 samples per
cycle
Phasor Angle
Measurement No Yes
Monitoring Local Wide-area
Observability Steady state Dynamic/Transient state
III. PHASOR ESTIMATION TECHNIQUES
Phasors are the most important quantities in power
system operation. Phasor can constitute the state of the
power system. It is therefore essentional to find the best
algorithm for estimating the phasor and implements it.
The possible digital algorithms of PMU measurements
are assumed to be
Modified level crossing techniques [3]
Prony analysis [4]
Newton method [5], [6]
Least error square error techniques [7]
Kalman filter techniques [8]
Smart discrete fourier transform [9]-[14]
Wavelet approach [15]
Adaptive neural network approach [16]-[18]
IV. SYNCHROPHASOR STANDARDS
A. Standard IEEE 1344
The concept of synchronized phasor with the power
system was introduces in the 1980s and the first
synchrophasor standard, IEEE 1344 was introduced in
1995. It was created to introduce synchrophasors to the
power industry and set basic concepts for the
measurement and methods for data handling. It
introduced a Phasor measurement unit (PMU) which is a
device and estimates synchrophasor equivalent quantities
for an AC input. It also introduced synchronized
measurement using precise timing sources, formalized an
extension for IRIG-B which has been adopted by industry.
B. Standard IEEE C37.118-2005
This standard defines synchronized phasor
measurements used in power system applications. It
provides a method to qualify the measurement, tests to be
sure the measurement conforms to the definition, and
error limits for the test. It also defines a data
communication protocol, including messages formats for
communicating this data in a real time system.
Explanation, examples, and supporting information are
also provided.
In the first major improvement, C37.118 [19], [20]
added a method for evaluating a PMU measurement and
requirements for steady-state measurement. Total vector
error or TVE compares both magnitude and phase of the
PMU phasor estimate with the theoretical phasor
equivalent signal for the same instant of time. TVE
provides an accurate method of evaluating the PMU
measurement
Second C37.118 expanded the communication method
to include higher order collection and improved
identifications. The basic status was improved to include
indications of data quality. PMU identification was added
to all messages. The concept of phasor data concentrator
(PDC) which included data from several PMUs
introduced. Data type and classes were indentified. The
underlying data communication protocol was left to users,
and several industry based standard methods have been
developed that support C37.118. The standard C37.118-
2005 has been very successful. Dynamic measurements
International Journal of Electronics and Electrical Engineering Vol. 3, No. 6, December 2015
©2015 International Journal of Electronics and Electrical Engineering 495
were not addressed in C37.118-2005 due to time and test
experience constraints In addition, frequency
measurements have always been a part of the data
reporting, but the standard has no requirements for them.
These issues and the growing need to address the
communication compatibility with standard IEC61850.
V. PHASOR TECHNOLOGY-WORLD WIDE RESEARCH,
DEVELOPMENTS AND APPLICATIONS
A. North America
The first digital PMU version was developed at
Virginia Tech. later Macrodyne designed and built
commercial unit. Currently there are more than 40 North
American utilities that have PMU installed for analysis of
power system problems [21].
B. France
The development of a coordinated scheme was carried
out based on centralized comparison of the voltage angles
of the system obtained from PMUs.
C. Scandinavia
There is a great potential for PMU applications in
Scandinavia. Smart control based on Phasor measurement
can be used as an alternative to adding new transmission
lines by increasing power transmission capacity.
D. China
The China State Grid will have about more than 250
PMUs installed. Researchers in China are putting more
emphasis in improving systems security and reliability
using PMU.
E. Other Countries
It has been reported that have installed and integrated
PMU for research to develop working prototypes for
wide area monitoring and control: Japan, Switzerland, 4
units; Cortia, 2 units; Greece, 2 units; Mexico, more than
4 units and South Africa, 2 units.
F. Existing Phasor Measurement Units in India
The PMU pilot project in Northern Region, India
consists of PMUs along with GPS installed at Selected 4
substations of the NR Grid. The system provides phase
angle difference, along with phase voltage magnitudes,
power flow, frequency and rate of change of frequency.
VI. CONCLUSION
GPS based phasor technology provides high speed (sub
second) coherent data that are not available with
traditional SCADA measurements in order to monitor
power system dynamics. With the growing interest in
phasor technology (PMUs) throughout the world, it is
clear that these systems will be implemented in most
major Electrical networks.
REFERENCES
[1] M. Donolo, “Advantages of synchrophasor measurements over
SCADA measurements for the power system state Estimation,”
SEL Application Note, LAN, Oct. 2006.
[2] M. Adamiak, B. Kasztenny, and W. Permerlani, “Synchranopasors: Definition, measurement, and application,” in Proc. 59th Annual
Georgia Tech Protective Relaying, Atlanta, GA, 2005, pp. 27-29.
[3] C. T. Nguyen and K. Srinivasan, “A new technique for rapid tracking of frequency deviations based on level crossings,” IEEE
Trans. on Power Apparatus and Systems, vol. PAS-103, no. 8, pp.
2230-2236, Aug. 1984. [4] J. F. Hauer, C. J. Demeure, and L. L. Scharf, “Initial results in
Prony analysis of power system response signals,” IEEE
Transactions on Power Systems, vol. 5, no. 1, pp. 80-89, Feb. 1990.
[5] V. V. Terzija, M. B. Djuric, and B. D. Kovacevic, “Voltage phasor
and local system frequency estimation using Newton-type algorithms,” IEEE Trans. Power Delivery, vol. 4, pp. 1368-1374,
Jul. 1994.
[6] M. M. Begovic, P. M. Djuric, S. Dunlap, and A. G.Phadke, “Frequency tracking in power networks in the Presence of
harmonics,” IEEE Trans. on Power Delivery, vol. 8, no. 2, pp.
480-486, Apr. 1993. [7] M. S. Sachdev and M. M. Giray, “A least error square technique
for determining power system frequency,” IEEE Transaction on
Power Apparatus and Systems, vol. PAS-104, pp. 437-444, 1985. [8] Y. Routray, A. K. Pradhan, and K. P. Rao, “A novel Kalman filter
for frequency estimation of distorted signals in power systems,”
IEEE Trans. Instrum. Meas., vol. 51, pp. 469-479, Jun. 2002. [9] A. G. Phadke, J. S. Thorpe, and M. G. Adamiak, “A new
measurement technique for tracking voltage phasors, local system
frequency, and rate of change of frequency,” IEEE Transactions on Power Apparatus and Systems, vol. PAS-102, pp. 1025-1038,
1983.
[10] F. P. Dawson and L. Klaffke, “Frequency adaptive digital filter for synchronization signal acquisition and synchronized event
triggering,” presented at PESC 98 Record, 29th Annual IEEE
Power Electronics Specialists Conference, New York, NY, USA, 1998.
[11] M. Wang and Y. Sun, “A practical, precise method for frequency
tracking and phasor estimation,” IEEE Transactions on Power Delivery, vol. 19, no. 4, pp. 1547-1552, Oct. 2004.
[12] M. M. Giray and M. S. Sachdev, “Off-Nominal frequency measurements in electric power systems,” IEEE Transactions on
Power Delivery, vol. 4, pp. 1573-1578, 1989.
[13] A. Girgis and T. L. Hwang, “Optimal estimation of voltage phasors and frequency deviation using linear and non-linear
” IEEE Transaction on
Power Apparatus and Systems, vol. PAS-103, no. 10, pp. 2943-2951, 1984.
[14] J.-Z. Yang and C.-W. Liu, “A new family of measurement
technique for tracking voltage phasor, local system frequency, harmonics and DC offset,” presented at Power Engineering
Society Summer Meeting, 2000.
[15] T. Lin, M. Tsuji, and E. Yamada, “A wavelet approach to real time estimation of power system frequency,” presented at SICE
2001, Tokyo, Japan, 2001.
[16] P. K. Dash, D. P. Swain, A. Routray, and A. C. Leiw, “An adaptive neural network approach for the estimation of power
system frequency,” Electrical Power Systems Research, vol. 41,
no. 3, pp. 203-210, Jun. 1997. [17] I. Kamwa and R. Grondin, “Fast adaptive schemes for tracking
voltage phasor and local frequency in power transmission and
distribution systems,” IEEE Transactions on Power Delivery, vol. 7, no. 2, pp. 789-795, Apr. 1992.
[18] S. Chakrabati, et al., “Measurements get together,” IEEE Power
and Energy Magazine, vol. 7, no. 1, pp. 41-49, 2009. [19] IEEE Standard for Synchrophasors for Power Systems, IEEE
Standard 1344-1995 (R2001).
[20] IEEE Standard for Synchrophasor for Power Systems, IEEE Standard C37.118-2005 (Revision of IEEE Std 1344-1995).
[21] D. Ree, V. Centeno, J. S. Thorp, and A. G. Phadke, “Synchronized
phasor measurement applications in Power Systems,” IEEE Transactions Smart Grid, vol. 1, no. 1, pp. 20-27, Jun. 2010.
Rohini P. Haridas received her B.E. and M.E. from the S.G.B. Amaravti University, India in 2011 and 2013 respectively in Electrical
Power system Engineering. She is an Assistant Professor in Department
of Electrical Engineering, S.S.G.M.C.E., Shegaon. She is Life Member of ISTE.
International Journal of Electronics and Electrical Engineering Vol. 3, No. 6, December 2015
©2015 International Journal of Electronics and Electrical Engineering 496
Kalman filtering: Theory and limitations,