GPS Analysis of Elite Level Hockey - Victoria Universityvuir.vu.edu.au/22298/1/Denise H...
164
GPS Analysis of Elite Level Hockey Submitted by Denise H. Jennings This thesis is submitted in partial fulfilment of the requirements for the award of Doctor of philosophy Supervisor: Dr Robert J.A. Aughey Co-supervisors: Associate Professor Aaron Coutts Dr Stuart Cormack School of Sport & Exercise Science Institute of Sport, Exercise and Active Living Victoria University, Melbourne, Australia 2012
Transcript of GPS Analysis of Elite Level Hockey - Victoria Universityvuir.vu.edu.au/22298/1/Denise H...

GPS Analysis of Elite Level Hockey
Submitted by
Denise H. Jennings
This thesis is submitted in partial fulfilment of the requirements for the award of
Doctor of philosophy
Supervisor: Dr Robert J.A. Aughey
Co-supervisors: Associate Professor Aaron Coutts
Dr Stuart Cormack
School of Sport & Exercise Science
Institute of Sport, Exercise and Active Living
Victoria University, Melbourne, Australia
2012

iii
ABSTRACT
This thesis investigated the suitability of Global Positioning System (GPS) to assess
activity profiles in elite hockey. Study one established validity and reliability of GPS
units (1 and 5 Hz) to assess distance during movement’s common to team sport.
Measurement accuracy decreased as speed increased in both straight line and change of
direction (COD) courses. Difference between criterion and GPS measured distance
ranged from 9.0 – 32.4%. Higher sampling rates improved validity regardless of
distance and locomotion. Reliability improved as distance travelled increased but
decreased as speed increased. Total distance (TD) over the team-sport circuit exhibited
the lowest variation (Coefficient of variation (CV) 3.6% at 1 and 5Hz), while sprinting
over 10 m demonstrated the highest (CV 77.2% at 1 Hz). Study two examined the
variability between GPS units. Differences (±90% CI) between the units ranged from
9.9 ±4.7% - 11.9 ±19.5% for straight line running, 9.5 ±7.2% - 10.7 ±7.9% in COD
courses and 11.1 ±4.2% in the team-sport circuit. Similar variability was displayed for
TD (10.3 ±6.2%) and High Speed Running Distance (HSR) (10.3 ±15.6) during match
play. It is recommended players wear the same GPS unit for each exercise session.
Study three compared activity profiles of national and international hockey players.
International players covered more TD (13.9%) and HSR (42.0%) than sub-elite
players. Less running was performed during the second half in both competitions (TD =
6.1−7.5%). Study four investigated the influence of multiple games on exercise
intensity during an international hockey tournament. Two levels of comparison were
made; (a) data from subsequent matches were compared to match 1 and (b) data from
each match compared to a tournament average (TA). The amount of HSR was
maintained as the tournament progressed. When compared to the TA, defenders showed
more variation in each match. All positions showed lower movement outputs when the

iv
team won by a large margin. It was possible for elite team sport athletes to maintain
exercise intensity when playing six matches in a period of nine days.

v
STUDENT DECLARATION
“I, Denise Jennings declare that the PhD thesis entitled “GPS analysis of elite level
hockey” is no more than 100,000 words in length including quotes and exclusive of
tables, figures, appendices, bibliography, references and footnotes. This thesis contains
no material that has been submitted previously, in whole or in part, for the award of any
other academic degree or diploma. Except where otherwise indicated, this thesis is my
own work”.
Signature: Date: 8 August, 2013

vi
ACKNOWLEDGEMENTS
I thought this section would be the easiest to write, free flowing thank-you’s to
everyone who helped me along the way. Surely the university has a document or policy
on what should be included, which font to use, the line spacing, who to include and the
word limit. Alas, this is the creative aspect of the document, your own style, is that why
it is so difficult? A PhD thesis was once described to me as the process of hitting your
head against a brick wall until your supervisors and examiners deem that you have done
it enough times to break through the wall. Needless to say, there are a few bruisers.
They will heal; the resilience and achievement will remain.
Over the last 5 years there have been a number of constants. These include, supervisors,
colleagues, friends, and of course, family.
To my two supervisors, Rob and Aaron, who’s extensive, knowledge and support has
been invaluable. For different reasons you both have been an integral part of the last 5
and a bit years from inception to completion. The experiences I have had over this time
have taught me many things, not only professionally but personally. You have
challenged, helped and most of all supported me through the duration of this thesis. I
thank you both for the time and effort you have devoted to me and the ongoing support
you have shown to assisting me in completing this thesis. I look forward to maintaining
this relationship for many years to come.
Stu, your impact on this thesis began well before the first word was written. You
continually challenge my thoughts and ideals both professionally and personally. I have
been fortunate to work with you and you have helped shaped my philosophy regarding
the type of coach and sport scientist that I aspire to be. You have listened to my
frustrations, to my theories and read through countless drafts without judging only at
times, questioning and always encouraging. Thank you, my friend, we have been
through a lot together and thankfully now we can add this to the list!

vii
To my amazing family, who have supported me not only in this pursuit but in all aspects
of my life. Your continual and unconditional support has allowed me to simply be
myself and you have always provided me with the environment to achieve anything I set
my mind to whether sporting or academically. Mum and dad, you have taught me that if
you want to achieve anything in life you need to work hard at it, be patient, learn from
setbacks and mistakes and make sure you don’t make the same ones twice! But
regardless if we do, all three of us know that you will always be there behind us,
encouraging, supporting and loving us without boundaries.
To the one who helped measure and spray paint the angles on the ground, charged
countless GPS eggs, made numerous cups of tea, warmed my freezing hands and
patiently asked “how’s it going ?” not really knowing which answer you would get,
thank you. Kate you have more than a constant in this process, you have “lived it” and
truly understand the highs and lows associated with trying to work full time, study part
time, and have some remnants of a life. I love you and can’t wait to spend more
weekends with you.
Thank you to the elite hockey players involved in these studies from the Victorian
Institute of Sport and the Australian men’s hockey team. To John Mowat and Ted
Polglaze thank you for the use of your athletes for these studies and your interest in the
project.

viii
ABBREVIATIONS
GENERAL
CT Champions Trophy
FIH International Hockey Federation
AHL Australian Hockey League
MSFT Multistage Fitness Test
ATP Adenosine Tri-Phosphate
AF Australian Football
º Degrees
s Seconds
min Minutes
mm Millimetres
g Gram
kg Kilogram
h Hour
y Year
LOCOMOTOR ANALYSIS: UNITS
GPS Global position system
Hz Hertz
dGPS Differential Global position system
WAAS Wide Angle Augmentation System
HDOP Horizontal Dilution of Position
CBT Computer Based Tracking
COD Change of Direction
TD Total Distance

ix
HSR High Speed Running
LSR Low Speed Running
VHSR Very High Speed Running
TMA Time-motion Analysis
TA Tournament Average
m metres
Km kilometres
m.min-1
km.h
metres per minute
-1
m.s
kilometres per hour
-1
metres per second
STATISTICAL:
TEM Technical error of the measurement
TE Typical error
CV% Co-efficient of variation
SD Standard deviation
SEE% Standard error of the estimate
SWC Smallest worthwhile change
CI Confidence Interval
ES Effect Size
ICC Intra-class correlation coefficient
CARDIOVASCULAR UNITS
V.O2max Maximum oxygen consumption ml·kg-1·min-1

x
PUBLICATIONS
The following publications are presented in support of this thesis:
Publications arising directly from this thesis:
1. Jennings, D., Cormack, S.J., Boyd, L.J., Coutts, A., Aughey, R (2010) The
validity and reliability of GPS units for measuring distance in team sport specific
running patterns, Int J Sports Physiol Perform, 5:328-341
(Study 1; Chapter 3)
2. Jennings, D., Cormack, S.J., Coutts, A., Aughey, R (2010) Variability of GPS
units for measuring distance in team sport movements, Int J Sports Physiol
Perform,
5(4):565-9 (Study 2; Chapter 4)
3. Jennings, D., Cormack, S.J., Coutts, A., Aughey, R (2011) International field
hockey players perform more high intensity running than national level
counterparts, J Strength Cond Res, 26(4):947-952, April 2012 (Study 3; Chapter
5)
4. Jennings, D., Cormack, S.J., Coutts, A., Aughey, R (2012) GPS analysis of
international field hockey tournament,
Int J Sports Physiol Perform, 7(3):224-31
(Study 4; Chapter 6)

xi
TABLE OF CONTENTS
ABSTRACT ............................................................................................................ III
STUDENT DECLARATION ........................................................................................ V
ACKNOWLEDGEMENTS ......................................................................................... VI
ABBREVIATIONS .................................................................................................... VIII
PUBLICATIONS ............................................................................................................ X
TABLE OF CONTENTS ............................................................................................. XI
LIST OF TABLES .................................................................................................... XVII
LIST OF FIGURES ................................................................................................... XIX
CHAPTER 1. INTRODUCTION ............................................................................ 20
CHAPTER 2. REVIEW OF LITERATURE ......................................................... 25
2.1 Introduction ...................................................................................................... 25
2.2 Hockey ............................................................................................................... 25
2.2.1 Introduction .................................................................................................... 25
2.2.2 The game of hockey ....................................................................................... 26
2.2.3 The physiological capacity of hockey players ................................................ 28
2.3 Time-motion analysis ....................................................................................... 31
2.3.1 Video-based time-motion analysis systems .................................................... 33
xii
2.3.2 Reliability of video-based analysis systems ................................................... 36
2.3.3 Automated systems ......................................................................................... 39
2.3.3.1 Reliability of automated tracking systems 40
2.3.3.2 Validation of automated tracking systems 40
2.4 Global Positioning System ............................................................................... 42
2.4.1 Horizontal dilution of position ....................................................................... 44
2.4.2 Application of GPS to team sport ................................................................... 45
2.4.3 Reliability of GPS for use in team sports ....................................................... 47
2.4.4 Sample rate ..................................................................................................... 48
2.4.5 Assessment of distance and speed using GPS ................................................ 49
2.4.6 Changes of Direction (COD) .......................................................................... 51
2.4.7 Validity of distance and speed using GPS ...................................................... 53
2.4.8 Limitations of GPS ......................................................................................... 57
2.5 Time-motion analysis in hockey ...................................................................... 58
2.5.1 Activity profile of female hockey ................................................................... 59
2.5.2 Activity profile of male hockey ...................................................................... 61
2.5.3 Positional differences ..................................................................................... 62
2.5.4 Activity profile across a match ....................................................................... 64
2.5.5 Activity profile across a tournament .............................................................. 67
2.5.6 Levels of competition ..................................................................................... 69
2.6 Aims ................................................................................................................... 70
2.6.1 Study 1: The validity and reliability of GPS units for measuring distance in
team sport specific running patterns. .......................................................................... 71
2.6.2 Study 2: Variability of GPS units for measuring distance in team sport
movements .................................................................................................................. 71

xiii
2.6.3 Study 3: International field hockey players perform more high intensity
running than national level counterparts .................................................................... 71
2.6.4 Study 4: GPS analysis of international field hockey tournament ................... 72
2.7 Research linking the manuscripts ................................................................... 72
CHAPTER 3. THE VALIDITY AND RELIABILITY OF GPS UNITS FOR
MEASURING DISTANCE IN TEAM SPORT SPECIFIC RUNNING PATTERNS
............................................................................................................ 73
3.1 Introduction ...................................................................................................... 73
3.2 Methods ............................................................................................................. 75
3.2.1 Experimental design ....................................................................................... 75
3.2.2 Straight-line running ....................................................................................... 76
3.2.3 Change of Direction ........................................................................................ 77
3.2.4 Simulated team sport running circuit .............................................................. 77
3.2.5 Statistical Analyses ......................................................................................... 78
3.3 Results ................................................................................................................ 79
3.3.1 Validity ........................................................................................................... 79
3.3.2 Bias ................................................................................................................. 81
3.3.3 Reliability ....................................................................................................... 81
3.4 Discussion .......................................................................................................... 85
3.4.1 Practical Applications ..................................................................................... 88
CHAPTER 4. VARIABILITY OF GPS UNITS FOR MEASURING DISTANCE
IN TEAM SPORT MOVEMENTS ............................................................................. 89

xiv
4.1 Introduction ...................................................................................................... 89
4.2 Methods ............................................................................................................. 89
4.2.1 Experimental design ....................................................................................... 90
4.2.2 Statistical Analyses ......................................................................................... 90
4.3 Results ................................................................................................................ 91
4.4 Discussion .......................................................................................................... 93
4.4.1 Practical Applications ..................................................................................... 94
CHAPTER 5. INTERNATIONAL FIELD HOCKEY PLAYERS PERFORM
MORE HIGH INTENSITY RUNNING THAN NATIONAL LEVEL
COUNTERPARTS ....................................................................................................... 95
5.1.1 Introduction .................................................................................................... 95
5.2.1 Experimental Approach to the Problem ......................................................... 96
5.2.2 Subjects ........................................................................................................... 97
5.2.3 Study Design and Procedures ......................................................................... 97
5.2.4 Statistical Analyses ......................................................................................... 98
5.3 Results ................................................................................................................ 99
5.4 Discussion ........................................................................................................ 100
5.5 Practical Applications .......................................................................................... 106
CHAPTER 6. GPS ANALYSIS OF INTERNATIONAL FIELD HOCKEY
TOURNAMENT ......................................................................................................... 108
6.1 Introduction .................................................................................................... 108
xv
6.2 Methods ........................................................................................................... 110
6.2.1 Experimental design ..................................................................................... 111
6.2.2 Statistical Analyses ....................................................................................... 112
6.3 Results .................................................................................................................... 112
6.2.3 Comparison to Match 1 ................................................................................ 113
6.2.4 Comparison to Tournament Average (TA) .................................................. 114
6.3 Discussion ........................................................................................................ 115
6.3.1 Practical Applications ................................................................................... 121
6.3.2 Conclusion .................................................................................................... 121
CHAPTER 7. GENERAL DISCUSSION ............................................................. 123
7.1 Overview .......................................................................................................... 123
7.2 Advancements in GPS technology ................................................................ 123
7.2.1 The effect of GPS sample rate on reliability and validity ............................ 123
7.2.2 Criterion measures used in GPS validity studies .......................................... 126
7.2.3 Effect of sample rate on measuring acceleration and COD using GPS. ....... 127
7.3 Comparison of Activity profile ...................................................................... 128
7.3.1 Comparing player performances using GPS ................................................ 128
7.3.2 Comparison between sports .......................................................................... 129
7.3.3 Rule changes in hockey ................................................................................ 131
7.4 Key findings / Practical applications ............................................................ 131
7.4.1 Study 1: The validity and reliability of GPS units for measuring distance in
team sport specific running patterns. ........................................................................ 132

xvi
7.4.2 Study 2: Variability of GPS units for measuring distance in team sport
movements ................................................................................................................ 133
7.4.3 Study 3: International field hockey players perform more high intensity
running than national level counterparts .................................................................. 133
7.4.4 Study 4: GPS analysis of international field hockey tournament ................. 134
CHAPTER 8. LIMITATIONS AND RECOMMENDATIONS FOR FUTURE
RESEARCH 135
8.1 Limitations ...................................................................................................... 135
8.1.1 GPS ............................................................................................................... 135
8.1.2 Time-motion analysis in hockey .................................................................. 135
8.2 Future Research .............................................................................................. 138
8.2.1 The use of GPS in team sport analysis ......................................................... 138
8.2.2 Future studies in hockey ............................................................................... 141
REFERENCES 144
APPENDIX 1: INFORMATION FOR PARTICIPANTS ...................................... 153
8.2.3 Study 1 & 2 ................................................................................................... 153
8.2.4 Study 3 & 4 ................................................................................................... 157
APPENDIX 2: INFORMED CONSENT FORM .................................................... 161
8.2.5 Study 1 & 2 ................................................................................................... 161
xvii
LIST OF TABLES
Table 1-1: Hockey studies divided into topic groups. Reproduced from (Podgórski &
Pawlak, 2011) 21 ...................................................... Error! Bookmark not defined.
Table 2-1: Statistical measure of absolute reliability for velocity over four different
tests. Raw typical error, total error, relationships and typical error as a CV%
between velocity from the timing gates and Prozone® were calculated. Reproduced
from Di Salvo, et al (2010). .................................................................................... 41
Table 3-1: Standard error of the estimate of GPS monitoring of straight line running at
different locomotion’s and distances. Standard deviation (± 90% CI) of the %
difference between the known distance and the GPS recorded distance for each
trial at both 1 Hz and 5 Hz (n=20). ......................................................................... 80
Table 3-2: Standard error of the estimate of GPS monitoring of two change of direction
courses at different locomotion speeds. Standard Deviation (± 90% CI) of the %
difference between the known distance and the GPS recorded distance for each
trial at both 1 and 5 Hz (n=20). .............................................................................. 80
Table 3-3: Percent bias (±90% confidence interval) of GPS distance from the reference
distance (n=20). ...................................................................................................... 82
Table 3-4: Percent bias of GPS monitoring of two change of direction (COD) courses
for different locomotion speeds. Mean difference of GPS distance from criterion
distance expressed as a percentage ± 90% confidence intervals (n=20) ................ 82
Table 3-5: Reliability of GPS in straight line running at different speeds, distances and
sample rates (n=20). TE = Typical Error with 90% confidence interval; CV (%) =
Coefficient of Variation; SWC = smallest worthwhile change. ............................. 83
Table 3-6: Reliability of GPS in two change of direction (COD) courses at different
sampling rates (n=20). TE = Typical Error with 90% confidence interval; CV (%)
= Coefficient of Variation; SWC = smallest worthwhile change. .......................... 84
xviii
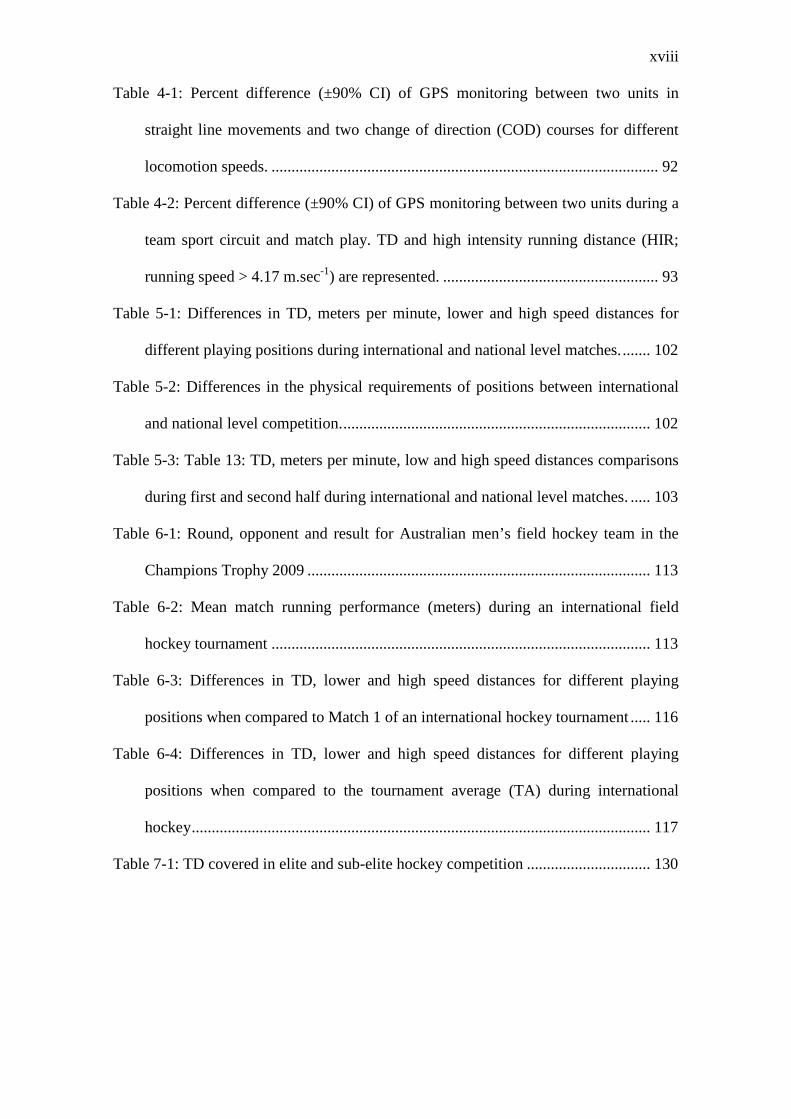
Table 4-1: Percent difference (±90% CI) of GPS monitoring between two units in
straight line movements and two change of direction (COD) courses for different
locomotion speeds. ................................................................................................. 92
Table 4-2: Percent difference (±90% CI) of GPS monitoring between two units during a
team sport circuit and match play. TD and high intensity running distance (HIR;
running speed > 4.17 m.sec-1) are represented. ...................................................... 93
Table 5-1: Differences in TD, meters per minute, lower and high speed distances for
different playing positions during international and national level matches. ....... 102
Table 5-2: Differences in the physical requirements of positions between international
and national level competition. ............................................................................. 102
Table 5-3: Table 13: TD, meters per minute, low and high speed distances comparisons
during first and second half during international and national level matches. ..... 103
Table 6-1: Round, opponent and result for Australian men’s field hockey team in the
Champions Trophy 2009 ...................................................................................... 113
Table 6-2: Mean match running performance (meters) during an international field
hockey tournament ............................................................................................... 113
Table 6-3: Differences in TD, lower and high speed distances for different playing
positions when compared to Match 1 of an international hockey tournament ..... 116
Table 6-4: Differences in TD, lower and high speed distances for different playing
positions when compared to the tournament average (TA) during international
hockey ................................................................................................................... 117
Table 7-1: TD covered in elite and sub-elite hockey competition ............................... 130

xix
LIST OF FIGURES
Figure 2.1: Dimensions of hockey field (reproduced from
www.dsr.wa.gov.au/hockeydimensions) ................................................................ 27
Figure 2.2: Typical positional formation in hockey. ...................................................... 28
Figure 2.3: GPS unit scanning for and locking into 3 of 27 satellite signals (Larsson,
2003). ...................................................................................................................... 43
Figure 2.4: Hockey specific circuit. Reproduced from (MacLeod et al, 2009). ............. 55
Figure 2.5: Diagram of simulated team sport running circuit. Reproduced from Coutts &
Duffield (2010). ...................................................................................................... 56
Figure 3.1: Change of direction (COD) course: (a) Gradual 10 m COD. 4 × 10 m
straights with 3 × 90° COD (b) Tight 5 m COD. 8 × 5 m straights with 7 × 90°
COD. ....................................................................................................................... 77
Figure 3.2: Modified team sport circuit. ......................................................................... 78
Figure 7.1: Summary of team sport m.min-1as derived by GPS data (Reproduced from
Aughey, 2011). ..................................................................................................... 129
20
CHAPTER 1. INTRODUCTION
Hockey is a competitive sport requiring prolonged, high-intensity intermittent
exercise that has origins dating back to 2000 BC in Asia. As a sport, hockey was
spread around the world by English soldiers and sailors while carrying out their duties
in expanding and defending the British Empire, and early colonial Australia was no
exception. By 1900 AD there were already a number of local men’s hockey clubs
scattered throughout the states and competitive hockey was being played in private
girl’s schools in Australia. The first men's association, the South Australian Hockey
Association, was formed in 1903. In 1910, the All Australian Women's Hockey
Association was created as the national association for women's hockey and in 1925
the men's hockey national body; the Australian Hockey Association was established
(Jaensch, Jones, & Nairn, 2003). Today, hockey is a mass participation sport played in
every continent of the world, with many nations competing in the three major
international competitions - The Olympic Games, World Cup and Champion's Trophy
(CT).
A number of significant rule changes have occurred that have improved various
aspects of play concerned with issues such as safety, officiating and the speed of the
game. Rule changes in hockey have dramatically transformed the game over the past
50 years and are governed by the International Hockey Federation (FIH). The modern
game of hockey is now much different from what was played in the early 1900’s
(Craig, 1979). Examples of such changes include the introduction of common rules
for men and women (1975) and the abolition of the off-side rule (1998). More
significantly, changes to the playing surface (from grass to artificial grass) and the
creation of an unlimited substitution rule, have both likely influenced the physical and
technical demands of hockey match play.
21
At the elite level, hockey is physically demanding, requiring players to have a high
level of aerobic fitness, as well as the capacity to perform short-duration, high-
intensity efforts (Spencer et al., 2004). In order to cope with the physical demands of
match play, training is complex and challenging, as the players are required to
develop many facets of physical fitness (e.g., speed, agility, strength, power and
aerobic capacity) and skill. As in all competitive sports, hockey coaches are dedicated
to improving their teams’ performance by optimising training practises specific to
their sport.
Hockey shares many tactical and structural similarities with soccer which allows for
good comparison between sports. In contrast to soccer however, the volume and
quality of research, investigating various aspects of performance in hockey is limited.
At the elite level there have been relatively few studies that have provided information
on activity patterns and player performance, especially since the more recent rule
changes. The most significant of which is the unlimited substitution rule which may
have altered the speed and nature of the game (Boyle, Mahoney, & Wallace, 1994;
Lythe & Kilding, 2011; Spencer, et al., 2004). The scarcity of research in this area
suggests that there is little known about the physical requirements of modern hockey,
even at the elite level of competition.
The majority of previous peer-reviewed research in hockey has examined the
incidence and type of injuries in training, skill development, tactics and match play as
well as the anthropometric and physical characteristics of players (Table 1.1).
However, relatively little attention has been given to identifying the differences in
physical outputs, activity patterns or physiological responses during match play
between various playing positions or standards of competition (Lythe & Kilding,
2011; Macutkiewicz & Sunderland, 2011; Spencer, et al., 2004). Furthermore, no
22
studies have been completed on players competing at the elite level of competitions of
international significance
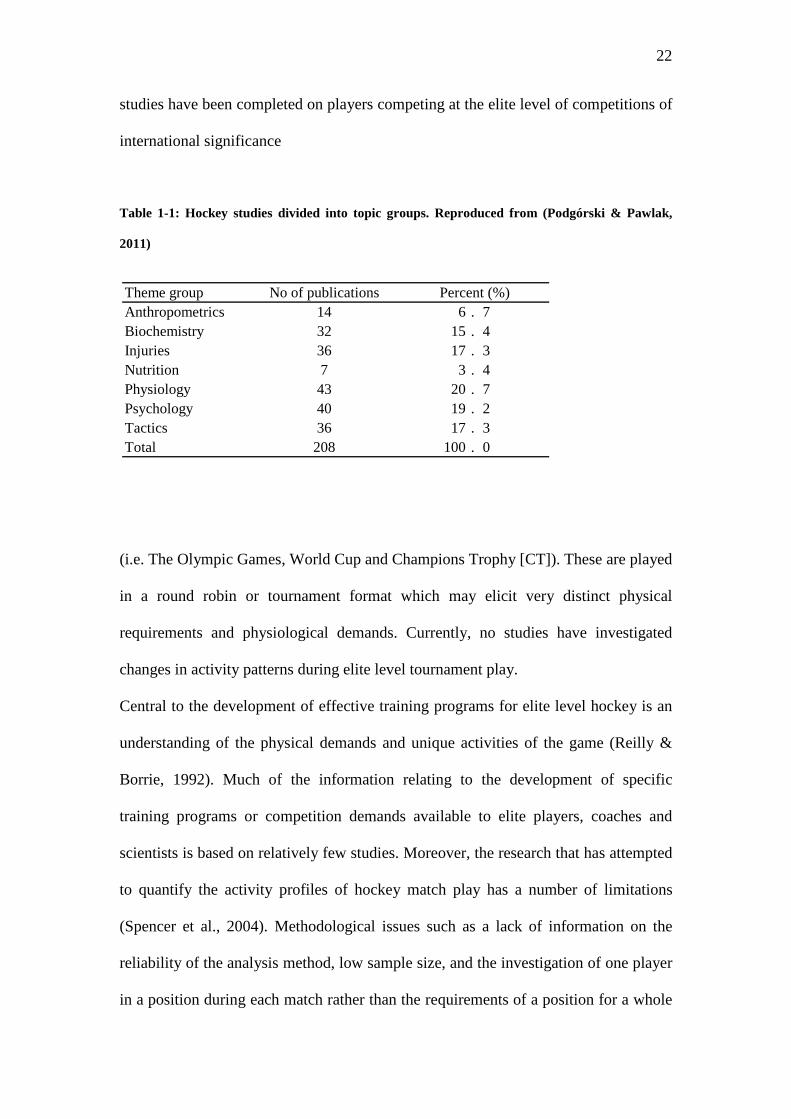
Table 1-1: Hockey studies divided into topic groups. Reproduced from (Podgórski & Pawlak,
2011)
(i.e. The Olympic Games, World Cup and Champions Trophy [CT]). These are played
in a round robin or tournament format which may elicit very distinct physical
requirements and physiological demands. Currently, no studies have investigated
changes in activity patterns during elite level tournament play.
Central to the development of effective training programs for elite level hockey is an
understanding of the physical demands and unique activities of the game (Reilly &
Borrie, 1992). Much of the information relating to the development of specific
training programs or competition demands available to elite players, coaches and
scientists is based on relatively few studies. Moreover, the research that has attempted
to quantify the activity profiles of hockey match play has a number of limitations
(Spencer et al., 2004). Methodological issues such as a lack of information on the
reliability of the analysis method, low sample size, and the investigation of one player
in a position during each match rather than the requirements of a position for a whole
Theme group No of publicationsAnthropometrics 14 6 . 7Biochemistry 32 15 . 4Injuries 36 17 . 3Nutrition 7 3 . 4Physiology 43 20 . 7Psychology 40 19 . 2Tactics 36 17 . 3Total 208 100 . 0
Percent (%)

23
match may limit these studies. Research is yet to compare time–motion analysis
between different levels of elite competition or throughout an international
tournament. It is possible that due to the differences in physical fitness and skill
between positional sub-groups or playing abilities that the physical match profiles
may vary accordingly. Therefore, in order to provide relevant data for the design of
specific training programs, there is a need for greater data collection of various
playing positions at all playing levels.
Monitoring athletes during competition to develop an understanding of physical and
technical demands has evolved considerably since the early methods were pioneered
(Pollard, 2002). Indeed, current methods have become extremely sophisticated and are
now being applied to a range of sports. Until recently, quantification of player activity
profiles has been difficult as it has required manual analysis with only one player
being analysed at a time (Roberts, Trewartha, & Stokes, 2006). However, with recent
technological developments there are now many systems that can analyse activity
patterns of multiple players simultaneously. For example, micro-technology
applications incorporating gyroscopes, magnetometers and tri-axial accelerometers
have been increasingly used to assess and analyse sporting performances. The use of
global positioning system (GPS) receivers are being increasingly applied to a range of
sporting applications. Recent advances in this system now enable units to be worn
during competition and training, providing detailed information about activity patterns
of athletes. This technology has provided an alternate data acquisition method to
video-based time-motion analysis when determining the demands of training and
competition in real time as well as potentially overcoming some of the limitations
associated with traditional methods (Liebermann et al., 2002; Peterson, Pyne, Portus,
24
& Dawson, 2009). This is a distinct advantage compared to the time consuming
video-based time-motion analysis systems.
This technology is now widely used in team sport and has led to an increase in the use
of GPS to investigate specific speeds and distances travelled during training and
competition. However, this has been prior to the establishment of the measurement
validity and reliability of these GPS devices. As yet, the value of GPS for the
assessment of athlete activity profiles in team sport remains unclear and there has
been insufficient published data to establish the reliability, validity and practicality of
this application (Dobson & Keogh, 2007).
This thesis aims to determine which aspects of GPS derived data are valid and reliable
for use when describing activity profiles in team sport, and specifically elite level
hockey. An additional aim is to quantify differences between national and
international competition as well as examine activity profile variations during an elite
international tournament.
25
CHAPTER 2. REVIEW OF LITERATURE
2.1 Introduction
The following section reviews the research methods used to determine activity
profiles of team sports. This review focussed primarily on methods used in hockey,
however some additional methods utilised in other team sports are also discussed. The
literature reviewed will be from prior to the publication of the four experimental
chapters. More recently published literature will be examined in the general
discussion section.
2.2 Hockey
2.2.1 Introduction
Hockey originated in primitive form, thousands of years before the first Olympic
matches, in 776 B.C. The sport evolved through Roman-influenced Europe and
developed derivatives in Germany (Kolbe), Holland (Het Kolven), France (Hocquet)
and Ireland (Hurling). The first hockey association was formed in 1873 and
international field hockey competitions were played by men as early as 1895 (Reilly
& Borrie, 1992). At present there are 64 ranked women’s teams and 68 ranked men’s
teams in the world and hockey is a formal sport in both the Commonwealth and
Olympic Games. Other significant international tournaments at the elite level include
the World Cup and CT.
In Australia, field hockey has approximately 145,000 registered players from 880
clubs. In addition to players registered with clubs, hockey is played extensively in
Australian schools and at a recreational level bringing the total participants close to
200,000. The Australian Hockey League (AHL) is the highest standard of domestic
competition and provides a pathway to international representation.
26
Despite its widespread popularity, there has been relatively little information and
research conducted on the physical and physiological demands of hockey. The
following literature review consists of searches for scientific studies on hockey hosted
on a number of available databases. They were obtained by browsing for publications
on a variety of topics in the PubMed and EBSCO host databases, which included
Academic Search Premier, SPORT Discus, and MEDLINE. Key words included in
this search were, field hockey, movement patterns, GPS, time-motion analysis,
activity profile, competition and tournament. Often referred to as field hockey to
differentiate it from ice hockey, within Australia and other Commonwealth nations,
the term hockey is used. For the purpose of this thesis, hockey will be used
throughout.
2.2.2 The game of hockey
Hockey is played between two teams of eleven players, including a goalkeeper. The
field of play is rectangular (91.4 m long and 55 m wide, Figure 2.1) and a match
consists of two, 35 minute halves. The object of the match is to hit the ball
(approximately 9 inches in circumference) into the opponent’s goal using specially
shaped sticks that are 36 - 42 inches in length.
A significant rule of hockey is that for a goal to be scored the ball must touch an
attacking player’s stick inside of the attacking circle (a 16 yard semi-circle around the
goal). Additionally, penalty corners, which are an important goal scoring set-piece
opportunity, are awarded for infringements by the defenders inside the circle. These
two factors make getting the ball into this area a key objective for the attacking team.

27
Figure 2.1: Dimensions of hockey field (reproduced from www.dsr.wa.gov.au/hockeydimensions)
The playing positions of hockey can be divided into three broad groups; strikers,
midfielders and defenders. More specifically, positions can be defined using five
categories; goalkeepers, fullbacks, halves, inside forwards and forwards with each
position positional area having specific roles and activities. For the purpose of this
review the positional group of the strikers consists of the three forwards, while the
midfielders consist of two inside forwards as well as the centre half, and defenders
contain the two outside half-backs as well as the two full backs. Many similarities
exist between field hockey and soccer, making comparisons between sports possible.
These include positional formations, number of players as well as similarities in field
91.4m
55m
22.9m
14.6m

28
size and match duration. Although there are many options, a typical hockey team
formation is a goal keeper, two fullbacks, three halves, two inside forwards and three
strikers (Figure 2.2).
Over the past four decades a number of significant modifications to the structure of
hockey have transpired. In the 1970s the playing surface changed from grass to
artificial turf significantly altering the pace and style of the game (Reilly & Borrie,
1992). In recent times, the most significant changes have been the removal of the off-
side rule and the introduction of unlimited interchange. Although it is possible that
these changes may have facilitated fast-paced, continuous play and altered the tactical
and physiological requirements of the game (Spencer, et al., 2004), the magnitude of
effect is not yet known.
Figure 2.2: Typical positional formation in hockey.
2.2.3 The physiological capacity of hockey players
Hockey is a sport that demands a combination of high muscular strength, power,
speed and flexibility, as well as high aerobic and anaerobic capacities (Reilly &
Borrie, 1992). The physical capabilities of hockey players have been measured using
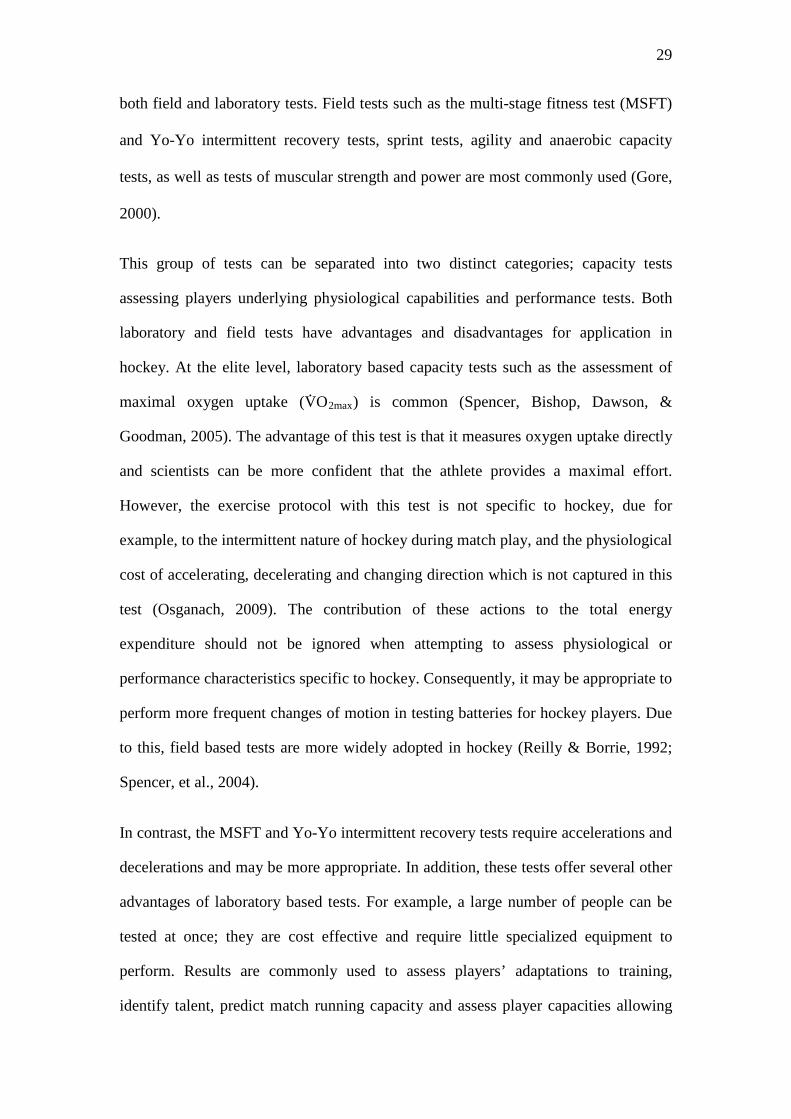
29
both field and laboratory tests. Field tests such as the multi-stage fitness test (MSFT)
and Yo-Yo intermittent recovery tests, sprint tests, agility and anaerobic capacity
tests, as well as tests of muscular strength and power are most commonly used (Gore,
2000).
This group of tests can be separated into two distinct categories; capacity tests
assessing players underlying physiological capabilities and performance tests. Both
laboratory and field tests have advantages and disadvantages for application in
hockey. At the elite level, laboratory based capacity tests such as the assessment of
maximal oxygen uptake (V.O2max Spencer, Bishop, Dawson, &
Goodman, 2005
) is common (
). The advantage of this test is that it measures oxygen uptake directly
and scientists can be more confident that the athlete provides a maximal effort.
However, the exercise protocol with this test is not specific to hockey, due for
example, to the intermittent nature of hockey during match play, and the physiological
cost of accelerating, decelerating and changing direction which is not captured in this
test (Osganach, 2009). The contribution of these actions to the total energy
expenditure should not be ignored when attempting to assess physiological or
performance characteristics specific to hockey. Consequently, it may be appropriate to
perform more frequent changes of motion in testing batteries for hockey players. Due
to this, field based tests are more widely adopted in hockey (Reilly & Borrie, 1992;
Spencer, et al., 2004).
In contrast, the MSFT and Yo-Yo intermittent recovery tests require accelerations and
decelerations and may be more appropriate. In addition, these tests offer several other
advantages of laboratory based tests. For example, a large number of people can be
tested at once; they are cost effective and require little specialized equipment to
perform. Results are commonly used to assess players’ adaptations to training,
identify talent, predict match running capacity and assess player capacities allowing

30
for the prescription of training programs (Castagna, Impellizzeri, Chamari,
Carlomagno, & Rampinini, 2006).
Like other sports that require prolonged high-intensity, intermittent exercise, hockey
has a large reliance on the aerobic pathways for energy provision (Reilly & Borrie,
1992). Although aerobic metabolic pathways provide the majority of energy,
anaerobic activity is highlighted during the more crucial moments of the match that
contribute directly to winning possession of the ball as well as the scoring or
conceding of goals. Hockey is referred to as an intermittent team sport due to the
pattern of repeated short bursts of high intensity activity interspersed with active and
passive recovery. Such a pattern requires lactate removal and rapid regeneration of
phosphocreatine (PCr) stores to allow for sustained performance (Tomlin & Wenger,
2001).
Muscular strength in hockey is required to strike the ball, tackle and also tolerate
physical impacts with other players. Moreover, anaerobic power is also important in
accelerating the body during short movements and changing direction quickly.
Indeed, players who can sustain a high work-rate throughout a match may gain an
advantage over equally skilled players whose energy can approach depletion towards
the end of a game or after a series of high intensity efforts, resulting in reduced
physical performance (Reilly, Bangsbo, & Franks, 2000).
Published research on the physical demands of hockey is limited, especially relating
to recent and elite competition. Regardless, research from other team sports has
shown that the aerobic system is important for facilitating recovery between high-
intensity efforts in field sports and is related to performance during prolonged high-
intensity running exercise (Helgerud, Engen, Wisløff, & Hoff, 2001; Sirotic & Coutts,
2007). However, few studies have directly measured V.O2max in male hockey players,

31
particularly at the elite level (Lythe & Kilding, 2011; Spencer, et al., 2004).
Descriptive information from the Indian national team reported that average
V.O2max was 54.4 ml·kg-1·min-1and 53.8 ml·kg-1·min-1
Cych, 2006
for junior players and senior
players, respectively ( ). Interestingly, slightly higher values were
measured in the junior players in that study, this may have been due to lower body
mass, although this information was not included in the results. No information was
provided in regard to the timing of testing in relation to different squads preparations
as this may have influenced the fitness of subjects, limiting the application of this
information.
A study of Australian international players reported higher V.O2max values (57.9 ±3.6
ml·kg-1·min-1 Spencer, et al., 2004) ( ). The higher fitness of these players may have
been due to the increased professionalism of international teams as well as a greater
emphasis on a systematic use of sports science to develop training regimes (MacLeod,
Bussell, & Sunderland, 2007). The higher fitness of these players is also an indication
of the increase in athleticism in international hockey over the last 5 – 10 years; a trend
that has also been reported in other team sports such as soccer (Bangsbo, Mohr, &
Krustrup, 2006) and rugby union (Quarrie & Hopkins, 2007). Aerobic capacities have
improved with semi-elite Australian national league level players also showing higher
V.O2max values (62.1 ±2.6 ml·kg-1·min-1 Harvey, Naughton, & Graham, 2009) ( ).
Recently, high values were also reported by New Zealand national team members
(64.9 ±1.9 ml·kg-1·min-1
Lythe & Kilding, 2011
). These players were in the final stages of preparation for a
major tournament and had been training consistently for a number of months, and as a
consequence were likely to be in peak fitness ( ). 2.3 Time-motion analysis
Time–motion analysis provides an objective yet non-invasive method for quantifying
the activity profiles of an athlete during match play. Such analyses may provide a
32
valuable insight into the physical work demands and activity profiles of a chosen
sport. This information has been used for, and is considered a fundamental
requirement for the development of physical training programs (Duthie, et al., 2003).
Feedback from motion analysis also has the capacity to set benchmarks for desirable
on-field physical performance and can assist in quantifying the changes in sports,
competition levels and performances over time (Williams, Lee, & Reilly, 1999).
Time-motion studies have provided information on the mode, frequency, and duration
of player activities in sports such as soccer (Bangsbo, et al., 2006; Bangsbo,
Nørregaard, & Thosøe, 1991; Burgess, Naughton, & Norton, 2006; Krustrup, Mohr,
Ellingsgaard, & Bangsbo, 2005), rugby union (Duthie, Pyne, & Hooper, 2003a;
Sirotic, Coutts, Knowles, & Catterick, 2009), rugby league (Estell, Lord, Barnsley,
Shenstone, & Kannangara, 1996; Gabbett, 2005) and Australian football (AF)
(Appleby & Dawson, 2002; Aughey, 2010; Brewer, Dawson, Heasman, Stewart, &
Cormack, 2010; Coutts, Quinn, Hocking, Castagna, & Rampinini, 2010; Dawson,
Hopkinson, Appleby, Stewart, & Roberts, 2004b). These studies have allowed
insights into the activity profiles of these respective competitions. Commonly reported
variables in previous studies, include total distance covered, specific distances
covered and time spent in various speed zones (Dawson, Hopkinson, Appleby,
Stewart, & Roberts, 2004a; Dawson, et al., 2004b; Deutsch, Kearney, & Rehrer, 2007;
Duthie, Pyne, & Hooper, 2005; Spencer et al., 2005), length, time and frequency of
efforts (Bangsbo, et al., 1991; Duthie, et al., 2005), and work to rest ratios including
time between maximal efforts (Dawson, et al., 2004a, 2004b; Spencer, et al., 2004).
This information has also been suggested to be used to improve the specificity and
focus of training to promote enhanced physiological adaptations to improve match
performance (Dawson, et al., 2004b; Spencer, et al., 2004).
33
Time-motion analysis in hockey has determined the activity profile of both female
(Gabbett, 2010; Lothian & Farrally, 1994; MacLeod, et al., 2007) and male players
(Lythe & Kilding, 2011; Spencer, et al., 2004), the number of repeat sprints
performed in competition (Spencer, et al., 2004) as well as the differences in motion
between two halves of a game. Changes in activity profiles of hockey players have
also been analysed between consecutive games (Spencer, et al., 2004). A variety of
measurement systems and methods have been used to document time and motion
activity in team sports. The following section will focus on two specific methods:
video-based and automated systems.
2.3.1 Video-based time-motion analysis systems
The majority of time-motion investigations in hockey have used observational
techniques to evaluate the overall physical activity associated with match-play by
recording and analysing the many different activities for the players observed
(Spencer, et al., 2004). Early approaches focused on the use of hand notation systems
for the recording of activity patterns, where player movements were tracked on a scale
plan of the pitch. More refined systems were then developed using coded
commentaries of activities recorded on audio tape, in conjunction with measurements
based on stride length and frequency taken from video recordings to evaluate the total
distance (TD) covered for the duration of a match (Dobson & Keogh, 2007). Whilst
the early studies that employed these methods revealed important information about
the demands of hockey, the complexity and large amount of time required for coding,
analysing and interpreting the output inhibited their use by performance analysts
(Lythe & Kilding, 2011). Furthermore, these methods did not allow real-time analysis
and were extremely labour-intensive in terms of the capture and analysis of data
(Carling, Bloomfield, Nelsen, & Reilly, 2008). These original techniques were also

34
restricted to the analysis of a single player, therefore limiting the practical application
of research projects.
A later method of filming and analysis utilised two or three fixed cameras (Reilly &
Gilbourne, 2003). This allows for a combined view with the cameras covering the
complete playing area and their fields of view overlapping facilitating the tracking of
players from one camera’s view to the next. Player motion was then subjectively
categorised while watching the video playback. This can be performed by one, but
usually two operators. The first operator watching the video, calling changes in
motion of a single player, with the second operator imputing the events manually into
a computer with purpose built software (Edgecomb & Norton, 2006; Spencer, et al.,
2004). Computer-based tracking (CBT) relies on ground markings and reference
points that translate to markers on a miniaturized, calibrated version of the playing
field (Edgecomb & Norton, 2006). This method utilises a stylus or movements of a
mouse which correspond to the linear distance travelled by the player to estimate
activity profiles. The validity and reliability of this method is discussed in the
following section. Although each method used different techniques, they
fundamentally measured the same variables, namely, the activity profile of players.
Alternative methods for measuring activity profiles have included video footage taken
from overhead views of the pitch for computer-linked analysis of the movements of
the whole team and synchronized cameras positioned to overlook each half of the
pitch; activities are then calculated using trigonometric principles (Edgecomb &
Norton, 2006). Both notation and motion analysis techniques provide a valuable
source of feedback to coaches and players, specifically regarding the physical
requirements of match play.

35
Activity profiles of players within a team have been established according to the
intensity, duration, and frequency of classified activities (e.g., walking, moving
sideways or backwards, jogging, cruising, and sprinting). Movement classification
systems were originally documented in the soccer literature (Reilly & Thomas, 1976)
and recently modified for use in other team sports such as rugby (Deutsch, Maw,
Jenkins, & Reaburn, 1998; Docherty, Wenger, & Neary, 1988) and hockey (MacLeod,
et al., 2007; Spencer, et al., 2004). Each movement was coded as one of six speeds of
locomotion and depending on the sport assessed, game specific movements and
involvements were also identified (Duthie, et al., 2003a; Macutkiewicz & Sunderland,
2011). For example, hockey time-motion analysis studies have included lunging as
part of the analysis (MacLeod, et al., 2007). Rugby time-motion analysis studies have
also included game specific movements identifying three states of non-running
intensive exertion (rucking / mauling, tackling, and scrimmaging), and three discrete
activities (kicking, jumping, passing) (Sirotic, et al., 2009).
Whilst there is no strict consensus in time-motion research on motion categories, there
are common modes of movement used in studies across different sports. In a study of
elite men’s hockey using a video-based time-motion analysis system, player motion
was coded into five distinct categories. These were defined as follows (Spencer, et al.,
2004):
1. Standing: motionless.
2. Walking: motion, but with both feet in contact with the ground at the same
time at some point during the gait cycle.
3. Jogging: motion with an airborne phase, but with low knee lift
36
4. Striding: vigorous motion with airborne phase, higher knee lift than jogging
(included skirmishing movements of rapid changes of motion,
forwards / backwards/ laterally).
5. Sprinting: maximal effort with a greater extension of the lower leg during
forward swing and a higher heel lift relative to striding.
Difficulties exist when comparing data from studies using different classification
systems. For example, some studies have combined the motions of sprinting and
striding (or high-intensity efforts) into one category and utilised different speed zones
to define these high intensity categories. This may impact the distance recorded for
these zones (Mayhew & Wenger, 1985; McKenna, Patrick, Sandstrom, & Chennells,
1988; Meir, Arthur, & Forrest, 1993). Furthermore, different methods have been used
to document motion activity (i.e. manual charting, audio recording, video recording
and computer tracking), which may influence the accuracy of results (Spencer, et al.,
2004).
2.3.2 Reliability of video-based analysis systems
Reliability is an assessment of the consistency of a measure and is usually determined
by testing and then retesting individuals under the same conditions (Atkinson &
Nevill, 2001). For a measurement system or testing procedure to be useful in
assessing athletic performance, it needs to be able to reproduce consistent and reliable
data (Duthie, Pyne, & Hooper, 2003b). There are numerous statistical procedures used
to determine the reliability of a system or test (Atkinson & Nevill, 2001; Hopkins,
2000). Ideally, a combination of statistical procedures including the technical error of
measurement (TEM) and correlation analysis, each with corresponding confidence
intervals, should be used (Pyne, 2003). This can also be expressed in relative terms as
a coefficient of variation (CV). The information obtained from these reliability

37
measures will allow sport scientists to interpret the smallest worthwhile change, or
changes independent of ‘technological, biological and systematic’ error (Atkinson &
Nevill, 2001). The ability to identify a ‘real’ change in these measures enables sports
scientists to more accurately assess performance, evaluate player qualities, the effects
of interventions and prescribe training. This type of analysis is especially important
for elite level athletes when small, meaningful changes may be lost with traditional
approaches to statistical analyses (Hopkins, 2000).
The reliability of video-based time–motion analysis methods has been determined for
many team sports (Coutts & Reaburn, 2000; Dawson, et al., 2004b; Duthie, et al.,
2003b; Krustrup & Bangsbo, 2001; Martin, Smith, Tolfrey, & Jones, 2001; Williams,
et al., 1999). These studies reveal wide variations in the level of test-retest reliability
between both the time–motion analysis methods used, but these have been estimated
from a number of statistical methods. Since a number of human testers are used in
manual video-based time-motion analysis, most researchers determine their own
reliability statistic (intra- and inter observer) as part of the study methodology. Intra
and inter-observer reliability assessments are common practice as human testers are
required to collect and analyse data. These variations may also be related to the
typically low sample size used for assessment which may be due to the time
consuming nature of this work. Differences in durations of matches analysed as well
as the inconsistency in time elapsed between testing and re-testing may also add to the
surrounding issues when assessing this aspect of reliability. Additionally, manual
time–motion studies may be influenced by an observer’s knowledge of the game,
focus of attention, level of arousal and anticipation of game-specific events during
each analysis occasion (Duthie, et al., 2003b).

38
The intra-tester reliability of video-based motion-analysis has been determined from
international male hockey players during match play. In that study, observers visually
categorized players’ movements into standing, walking, jogging, striding and
sprinting. To determine the reliability, half the match was analysed twice for five
players, by the same observer. The typical error (TE), expressed as a coefficient of
variation (CV), was 5.9-10.2% (mean = 7.8%) for the frequency of movement and
5.7-9.8% (mean 8.1%) for duration of movement (Spencer, et al., 2004).
In order to provide accurate information for specialised training programs and to
accurately describe match profiles, time–motion measurement systems need to be able
to reproduce consistent and reliable data. A tracking system with poor measurement
reliability is of little practical benefit for coaches and scientists, as small variations in
match running performance between players or matches cannot be detected. Indeed, in
a study that examined the reliability of a video-based analysis system during a rugby
union match, moderate to poor reliability for total duration of activities with a CV of
5.8–11.1% were reported (Duthie, et al., 2003b). Further, a TEM of 4.3–13.6% for the
frequency of individual activities, indicating good-to-poor reliability were also
reported (Duthie, et al., 2003b). Interestingly, when analysing movement distance at
different intensities using a computer based tracking system, low-intensity activities
demonstrated a good level of reliability (4.0–6.0 TEM%), and measures of high-speed
movements demonstrated only a moderate-to-poor level (6.5–13.2 TEM%) of
reliability (Sirotic & Coutts, 2009). The increased measurement error at higher speeds
may be due to the difficulty in assessing these brief and high intensity efforts as they
occur over short distances. Better reliability is more commonly observed in lower
speed activities performed over longer distances.

39
In comparison, the total frequency of activities during 10 minutes of futsal match-play
movement patterns had a TEM of 5.0% for video-based analysis indicating good to
moderate reliability for notational analysis (Doğramaci & Watsford, 2006). However
the comparison between studies is difficult due to variations in the sample time used
to calculate the TEM. The lower TEM’s in the futsal study may be due to the lower
total sampling time, compared to the 80 mins of a rugby union match used by Duthie
et al (2003).
The poor reliability of these methods, especially at higher speeds, along with the
logistical limitations (i.e. time consuming data collection procedures and the
requirement for extensive post hoc data analysis) has led to the development of semi-
automated tracking systems (e.g. Prozone Sports Ltd®, Leeds, UK; & Amisco Pro,
Sport-Universal Process, Nice, France) and microtechnologies, including GPS.
2.3.3 Automated systems
Advances in technology have allowed new methods of assessing the activity profiles
of players in soccer, including the multiple-camera method (Di Salvo, Collins,
McNeill, & Cardinale, 2006; Edgecomb & Norton, 2006; Rampinini, Coutts,
Castagna, Sassi, & Impellizzeri, 2007). These multi-player tracking systems are based
on integrated computer and video technology and are currently the most widely used
commercial tracking systems in professional European soccer. Systems were
developed to further increase accuracy (sampling rate > 10 Hertz (Hz)), and reduce
labour in the recording and analysis stage. Multiple cameras (6 to 12) are strategically
positioned to simultaneously observe the playing surface, umpire, ball and all players
involved in the match activity (Rampinini et al., 2007). Optical character recognition
technology detects cues such as players’ numbers, and individual gait patterns to
distinguish between players. The ‘x’ and ‘y’ co-ordinates of each individual is used to

40
calculate movement throughout the video captured space (Carling, et al., 2008). In
comparison to other video-based time-motion analysis systems, a distinct advantage
of this system is the capture of player movement in real-time. However, operators are
required to manage the system during capturing periods (Di Salvo et al., 2007;
Rampinini, Coutts, et al., 2007).
2.3.3.1 Reliability of automated tracking systems
Relatively little information exists regarding the reliability of automated tracking
systems, with the majority of studies examining soccer-specific activity. Intra- and
inter-operator reliability was assessed for the Prozone automated camera tracking
system (Prozone Sports Ltd®, Leeds, UK) during a soccer match. Two trained
observers tracked five randomly selected professional soccer players on two separate
occasions. Intra-observer reliability for TD (CV = 1.0%) was high, as was the
distances covered in each velocity band (CV= <1.2%). Similar to the previous video-
based analysis systems, at high speeds the reliability decreased (CV= 2.4%) (Bradley
et al., 2009). Inter-observer reliability showed similar tendencies, with lower intensity
activities (CV= 1.2%) more reliable, compared to sprinting (CV= 3.5%). Although
reliability decreased at higher velocities, this variation was below that deemed to be
an acceptable level for team sports analysis.
2.3.3.2 Validation of automated tracking systems
Despite the widespread popularity of semi-automated player tracking devices, there is
relatively little information regarding the validity of these systems. Validation of the
same system (Prozone Sports Ltd®, Leeds, UK) was carried out using a series of runs,
of known distance performed at different velocities in different parts of two separate
stadiums (Di Salvo, et al., 2006). Straight, curved and turning runs (90 degree (º))
were performed at velocities ranging from 1.95 to 6.38 m.s-1. Velocity measured from

41
the tracking system was compared to the actual velocity based on the time taken to
complete each course using timing gates. Pearson’s correlation displayed very large
relationships across all distances and velocities (r = 0.92 to 1.00) (Di Salvo, et al.,
2006). Straight line activities were the most accurate, with turning activities being
more difficult to measure (Table 2.1). Sprinting activity (>25 km·h-1
Duthie, Pyne, Marsh, & Hooper, 2006
) however, as
reported in the previous reliability study was not validated. Unfortunately, failure to
accurately measure this type of maximal activity may underestimate the true
locomotor demands of matches ( ).
Multi-player tracking systems such as AMISCO and Pro Zone generally require the
permanent installation of several cameras fixed in optimally calculated positions to
cover the entire surface of play. Being a fixed camera set up, usually at the playing
stadium of the home team, the use of the system at other venues and training facilities
is not possible, limiting valuable data collection to competition matches only (Carling,
et al., 2008).
Table 2-1: Statistical measure of absolute reliability for velocity over four different tests. Raw
typical error, total error, relationships and typical error as a CV% between velocity from the
timing gates and Prozone® were calculated. Reproduced from Di Salvo, et al (2010).
Test
Typical Error (Upper and Lower 95% Confidence Intervals)
Total Error (Limits of
agreement)
Intraclass Correlation Coefficient
Typical Error
as CV (%) 60 m straight run 0.04 0.05 0.999 0.2 (0.06 - 0.03) (0.12) 50 m curved run 0.07 0.09 0.999 0.3 (0.11 - 0.05) (0.22) 15 m straight sprint 0.01 0.02 0.999 0.2 (0.04 - 0.01) (0.05) 20 m sprint and turn 0.23 0.23 0.950 1.3 (0.58 - 0.15) (0.85)

42
A further limitation of these systems is the high financial cost (Di Salvo, et al., 2006).
This restricts the use of automated systems to elite sporting organisations. To
overcome the costs of multiple camera systems, GPS systems have been suggested as
a viable alternative for time-motion analysis (Witte & Wilson, 2004).
2.4 Global Positioning System
The global positioning system (GPS) is a navigation system that uses up to 27
operational satellites in orbit around earth. First developed for the U.S. military, GPS
became fully operational in the mid-1990s (Witte & Wilson, 2004). Increasingly, GPS
has been used for aviation, marine, recreational and more recently in the sporting
environment. It allows the tracking of a change in position (displacement) of an object
(e.g. an athlete) in real-time. As yet however, the usefulness of this application to
team sport analysis remains unclear as there has not been sufficient published data to
establish the reliability, validity and practicality of 1 and 5 Hz GPS systems.
One advantage of GPS over semi-automated analysis systems is that GPS devices can
now be worn during competition and training. A further benefit is the systems
portability. Rather than a fixed camera with a specific stadium, this system can be
used at different competition and training venues, providing a more extensive
information about the activity profile of athletes. Information from these devices is
derived using satellites orbiting the earth. The satellites first set the clock in the GPS
receiver by synchronising it with the atomic clock in the satellite. The satellites then
constantly send information (at the speed of light) about exact time to the GPS
receiver. By calculating the displacement between the signal (satellite) and the
receiver (GPS unit), the exact position can be determined. This calculation utilizes a
doppler frequency calculation, whereby the phase-shift difference between the
43
satellite and an oscillator-produced signal within the receiver is measured (Schutz &
Herren, 2000). By calculating the distance to at least four satellites, the exact position
can be trigonometrically determined (Cunniffe, Proctor, Baker, & Davies, 2009).
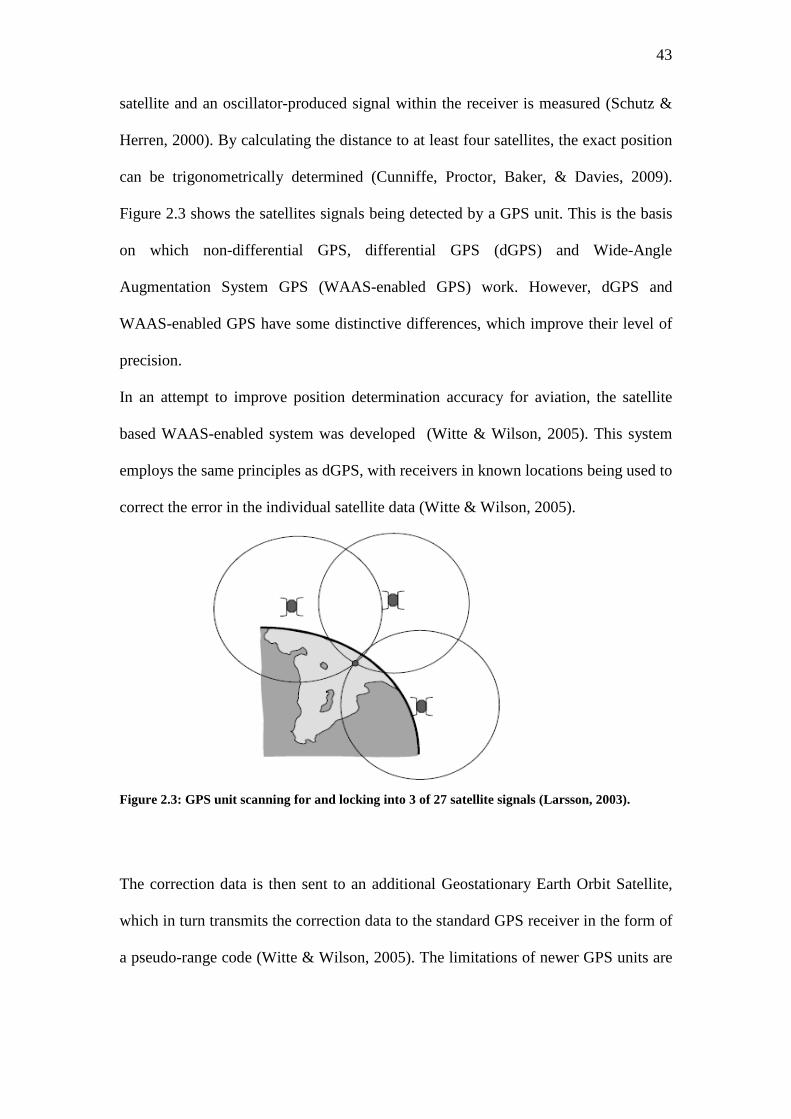
Figure 2.3 shows the satellites signals being detected by a GPS unit. This is the basis
on which non-differential GPS, differential GPS (dGPS) and Wide-Angle
Augmentation System GPS (WAAS-enabled GPS) work. However, dGPS and
WAAS-enabled GPS have some distinctive differences, which improve their level of
precision.
In an attempt to improve position determination accuracy for aviation, the satellite
based WAAS-enabled system was developed (Witte & Wilson, 2005). This system
employs the same principles as dGPS, with receivers in known locations being used to
correct the error in the individual satellite data (Witte & Wilson, 2005).
Figure 2.3: GPS unit scanning for and locking into 3 of 27 satellite signals (Larsson, 2003).
The correction data is then sent to an additional Geostationary Earth Orbit Satellite,
which in turn transmits the correction data to the standard GPS receiver in the form of
a pseudo-range code (Witte & Wilson, 2005). The limitations of newer GPS units are
44
their costs and design as they are bulkier and less portable than traditional GPS units.
These factors preclude the use of these in team sport environments.
Differential GPS requires that one of the receivers is located at a station of known
position (the “base” station), while the other is at an unknown location or “receiver
station”. The stationary receiver then compares their fixed position to the position
given by the satellites to the GPS unit. The correction signals are then sent from these
receivers via radio waves to the GPS unit via a differential receiver (Larsson &
Henriksson-Larsen, 2001). The GPS unit is then able to re-calculate the correct
position of each satellite and therefore its position on earth more accurately than a
standard GPS unit (Schutz & Herren, 2000). The application and potential use of these
systems for studies of locomotion was performed over an orienteering course, where
one participant was tracked over a predetermined course (Larsson, 2003). One of the
major disadvantages of the dGPS technique is that speed can only be measured in an
environment in which access to the satellites is not obstructed by urban landscapes,
tall skyscrapers, tunnels, stadium roofs or roofs that overhang playing surfaces
(Schutz & Herren, 2000). Since elite team sports competition often takes place in
stadiums, a further methodological consideration that is most often ignored is the
potential horizontal dilution of position error that may occur as a function of building
structures near the playing field (Williams & Morgan, 2009).
2.4.1 Horizontal dilution of position
The horizontal dilution of position (HDOP) is a reflection of the geometrical
arrangement of satellites and is related to both the accuracy and quality of the signal.
Values can range between 1 and a maximum value of 50, with an ideal HDOP of 1
indicating that one satellite is directly overhead with the remainder equally spaced
around the horizon (Witte & Wilson, 2004). Higher values show a situation where

45
satellites are tightly clustered overhead and a maximum value of 50 indicating that
the position fix is unreliable (Witte & Wilson, 2005). When reporting GPS data,
authors should attempt to quantify and report both HDOP and estimates of the number
of satellites to provide readers with a clearer understanding of the quality of data
presented.
2.4.2 Application of GPS to team sport
There is a growing body of literature examining the use of GPS for time-motion and
player analysis. Specifically, GPS technology is used by many sports to quantify the
activity profile of players during training and competition. The development of GPS
units, designed for athlete tracking, have provided an alternate data acquisition
method to determine the demands of training and competition in real time with the
potential to overcome some of the limitations associated with traditional methods
(Liebermann, et al., 2002; Peterson, et al., 2009). Until recently, measurement and
quantification of player activity profiles has been difficult as it has required manual
analysis with only one player being analysed at a time (Roberts, et al., 2006). The
GPS system automatically tracks and stores the movement patterns of individuals.
Multiple players can be tracked at the same time, with data collection automated. This
is a distinct advantage compared to video-based time-motion analysis.
The GPS receivers worn by players during training and competition draw on signals
sent from at least four satellites located in the atmosphere. Using this information, the
receivers are able to calculate and store data on position, time and velocity. Early
units weighed approximately four kilograms (kg), and thus could not be used in
athletic settings (Larsson, 2003). The current size of the receiver has decreased from
initial models to the point of being appropriate for use in sporting environments. Units
are approximately 67- 76 grams (g), and 48 mm x 20 mm x 87 mm in size, the size of
46
a small mobile phone. Current GPS devices can withstand heat, moisture and potential
impact which can be applied in team sport environments. Devices are typically worn
in custom made harnesses or built into playing garments located in the centre area of
the upper back slightly superior to the shoulder blades at approximately the level of
thoracic vertebrae (T1). This ensures that range of movement through the upper body
and torso are not limited and provides clear unrestricted reception to antennas located
at the top of the units.
The application of GPS technology in sporting settings utilizes the same principles for
position calculation as does navigational GPS units, with the unit’s operating initially
at 1 Hz. The first commercially available GPS devise designed specifically for use in
sporting environments became available in 2003 (Edgecomb & Norton, 2006). At
present, two commercial manufacturers are commonly used in elite sports
environments and time-motion research (i.e. Catapult and GPSports). With the
production of sport-specific GPS hardware and software, information from GPS units
has increasingly been used to assess the activity of players training and competition.
The accompanying software allows analysis of the GPS signal, which can provide the
athlete with information such as distances covered, speed achieved as well as
frequency and durations of efforts performed. Indeed, GPS technology has the
potential to provide a more comprehensive, accurate and automated examination of
player movements in invasion style team sports (e.g., hockey, rugby union, rugby
league, soccer and Australian Football).
Position data can now be collected at a 5 Hz sample rate during match play and
training. This increase in sample rate may enhance the validity and reliability of GPS
for team sport applications. Few studies have investigated the reliability and validity
of GPS technology for the assessment of activities performed in team sport (Barbero

47
Álvarez, Coutts, Granda, Barbero Álvarez, & Castagna, 2010; Coutts & Duffield,
2010; Edgecomb & Norton, 2006; MacLeod, Morris, Nevill, & Sunderland, 2009;
Peterson, et al., 2009). Additionally, most studies have assessed the validity and
reliability of these GPS devices with distance and positional data recorded at 1 Hz,
(Barbero Álvarez, et al., 2010; Coutts & Duffield, 2010; Edgecomb & Norton, 2006;
MacLeod, et al., 2009). Only recently, have researchers used 5 Hz data (Peterson, et
al., 2009).
2.4.3 Reliability of GPS for use in team sports
A growing body of research exists on the use of GPS devices for the measurement of
physical activity but only very limited research to date has applied GPS to team sport
time-motion analysis. However, only a small number of studies have investigated the
reliability of GPS technology for the assessment of team sport movement patterns
(Barbero Álvarez, et al., 2010; Coutts & Duffield, 2010; Edgecomb & Norton, 2006;
MacLeod, et al., 2009; Peterson, et al., 2009). Additionally, relatively few studies
have assessed the reliability of these GPS devices with distance and positional data
recorded at 5 Hz, (Peterson, et al., 2009). The reliability of GPS to determine human
locomotion is influenced by a number of factors including, sample rate, velocity and
duration of movement, as well as the type of task performed.
The increase in the application of GPS technology to investigate activity patterns in
team sports in training and competition has largely occurred prior to the establishment
of variables that are reliable and valid. Fast bowler movement patterns in one day
cricket (Peterson, et al., 2009) and distance and intensity measures in tennis (Reid,
Duffield, Dawson, Baker, & Crespo, 2008) have been described, yet surprisingly no
reliability data reported for the devices in these studies.

48
Interest in GPS monitoring of hockey is growing. Information collected by
conditioning and sports science personnel using GPS data attempts to quantify the
activity demands of training and competition (Gabbett, 2010). However, the reliability
and validity of this methodology for use in hockey has yet to been established. It is
prudent therefore, to assess the reliability and validity of GPS measurements over
sport-specific distances and locomotion patterns to determine the measurement error.
Once the technology is deemed to be accurate and reliable and the measurement error
is less than the within-player variability, sports science practitioners can confidently
use the GPS measurements to estimate game distances and player movement
velocities.
2.4.4 Sample rate
The sample rate refers to the speed at which a GPS unit can collect movement
information (Coutts & Duffield, 2010). The sample rate may impact on the quality of
the data collected, with a higher sampling rate potentially allowing for the collection
of more accurate movement data. A 1-Hz GPS unit, for example, collects only one
position measurement each second. These units may miss critical data and be unable
to accurately detect changes in running distances at higher velocities. (Coutts &
Duffield, 2010). To investigate this, three 1 Hz GPS units were used to estimate
distance and speed in a linear running protocol at varying velocities. This information
was then compared against timing gates over 10 trials (Portas, Rush, Barnes, &
Batterham, 2007). Results suggested that the error for GPS distance measurements
varied by the velocity of the trial. Specifically, the mean percentage error, equivalent
to CV, was highest during running at 22.5 km·h-1 (5.64%; 2.82 m) and lowest (0.71%;
0.36 m) at the slowest velocity of 6.45 km·h-1. Similar findings were also found for
non-differential GPS, with 1 Hz units reported to be accurate and reliable for
49
measuring linear distance at low velocities (Townshend, Worringham, & Stewart,
2008). Interestingly, in this study it was suggested that the sampling frequency of 1
Hz meant that the number of actual values collected within each 10-m section ranged
from a single value during the highest speeds to as many as nine data samples during
slow walking (Townshend, et al., 2008).
2.4.5 Assessment of distance and speed using GPS
Critical movements for performance in team sports are the ability to maximally
accelerate, decelerate and change direction at speed over a short distance (Dobson &
Keogh, 2007). Several studies have reported that increased sprint and repeated-sprint
performance, (Coutts, Russell, & Sirotic, 2005; Duthie, et al., 2006; Impellizzeri et al.,
2008; Rampinini, Impellizzeri, Castagna, Coutts, & Wisløff, 2009) particularly with
the ball, are important for team performance (Rampinini, et al., 2009). Due to the
short nature of sprints in the team sport (Dawson, et al., 2004b), the ability to
accelerate is likely to be more important than a player’s top speed (Young, Benton,
Duthie, & Pryor, 2001). It is therefore necessary to be able to accurately measure
these characteristics in match play.
Accurate determination of player speed is an important component of time-motion
analysis and can increase the specificity of strength and conditioning programs. An
early GPS study assessed velocity using a bicycle ridden around a running track,
comparing GPS speed to a custom-made speedometer. The cycling tasks were
conducted at a range of velocities from 10 - 35 km·hr-1
Witte & Wilson, 2004
and over both a straight and
curved path ( ). The speed determined by the GPS receiver was
within 0.2 m·s-1 of the criterion speed measured for 45% of the values with a further
19% lying within 0.4 m·s-1 for the linear path. However, an underestimation of speed

50
occurred when the cyclist followed a curved path and at higher speeds, and movement
error increased when a curve of smaller radius was followed (Witte & Wilson, 2004).
The application of GPS to the team sport context is a logical progression for sport
scientists and coaches aiming to measure activity profiles. However, the accuracy of
GPS when assessing rapid changes in speed (accelerations and decelerations) and
direction is still evolving. An initial study investigated the use of this technology for
use in AF (Edgecomb & Norton, 2006). The study had two aims, the first of which
was to compare GPS against another computer based tracking system (CBT), and the
second to assessing validity of GPS distance against a calibrated trundle wheel
pedometer. Results indicated that GPS overestimated the actual distance, as measured
by the calibrated trundle wheel, by 4.8%, indicating a systematic error in the tracking
system. There was also, 5.8% difference when CBT was compared to the calibrated
trundle wheel (Edgecomb & Norton, 2006). However, the distances used only ranged
from 128 to 1,386 m, which is much less than most team sports such as hockey where
typical distances range from 8,000 to 10,000 m (Lythe & Kilding, 2011). In relative
terms, a potential difference of 5.8% may equate to over 500 m in a hockey match.
There is presently limited information regarding the validity and reliability of the
various GPS devices for measuring movement during high-intensity, intermittent
exercise. To quantify these changes of speed and direction, researchers compared GPS
derived distance to the criterion (128.5 m) distance covered during a team sport
specific circuit. In agreement with previous research (Edgecomb & Norton, 2006), the
1 Hz GPS units in this study demonstrated a good level of reliability for the total
measured distance (Coutts & Duffield, 2010). However, the CV was poor for both
high speed running (11.2–32.4%) and very high speed running (11.5–30.4%).
Additionally, frequently short sprints and brief maximal accelerations of >1 s are

51
completed in team sports, it was suggested that at high speeds, (for example running
distance at velocities >20 km·h−1
Only two studies have examined the validity and reliability of 5 Hz GPS devices
(
) may be missed by GPS devices with a 1 Hz
sampling rate.
Coutts & Duffield, 2010; Peterson, et al., 2009). In an investigation assessing cricket-
specific movement patterns, results demonstrated that 5 Hz devices have an
acceptable validity and reliability for estimating longer distances (600–8,800 m) in
walking and striding activities (i.e., CV < 3%), but were poor (i.e., CV >15%) for
shorter sprints of between 20 to 40 m (Peterson, et al., 2009). The second study
confirmed these results, reporting even larger errors for high speed tennis specific
court based movements over short distances (i.e., CV <30%) (Duffield, Reid, Baker,
& Spratford, 2009).
At present, the efficacy of these devices for assessing activity profiles for team sport
specific requirements is not well understood.
2.4.6 Changes of Direction (COD)
In addition to rapid changes in speed, the ability to change direction is also important
in team sport (Duthie, et al., 2006). For example, in a study investigating the physical
demands of premier league soccer, players performed the equivalent of 726 ± 203
turns during the match; 609 ± 193 of these being of 0° to 90° to the left or
right. (Bloomfield, Polman, & O’Donoghue, 2007;). Furthermore, more than half the
number of sprints performed in AF involved at least one change of direction (Dawson,
et al., 2004b). Accordingly, it is logical that coaches and scientists should be able to
quantify these demands. However, changes in motion rather than changes in direction
have been investigated in hockey. Changes in movement were recorded and classified
into motion categories (standing, walking, jogging, striding, and sprinting). In elite

52
women’s hockey, changes in motion occurred every 3 s (MacLeod, et al., 2007). In
contrast, elite male hockey players had a change in motion every 5.5 s during the
match play (Spencer, et al., 2004). Differences may exist due to the different number
of movement categories used, with the female hockey study utilising six categories,
including lunging, whereas male hockey studies have used five. To date, no time-
motion analysis research performed in hockey has incorporated changes of direction
into their investigations. This may be due to the time consuming nature of video-
based time-motion analysis with the collection of another variable amplifying data
analysis. It would be useful for sports science practitioners to be able to use GPS to
have the capacity to accurately identify changes of direction.
A critical component of changing direction is the ability to accelerate and decelerate.
A study investigating the accuracy of GPS to determine accelerations and
decelerations that occurred during cycling, found that the transition from acceleration
to deceleration was not smooth or accurate. The authors concluded that this was a
result of the low sampling frequency of GPS as well as the filtering of data that occurs
in the GPS software programs (Witte & Wilson, 2004) and asserted that higher
sampling frequencies could provide more accurate data on accelerations and
decelerations. However, research is required to assess the ability of GPS to accurately
measure the acceleration and decelerations and associated changes in direction in
team sports such as hockey where these movements are regularly completed.
Sample rate and the speed of movement may also influence the reliability of GPS for
assessing COD. Indeed, earlier research has demonstrated that the error of 1 Hz GPS
increased during high velocity and /or multidirectional motion (Coutts & Duffield,
2010). More recently, the reliability of soccer specific movements were investigated
using both 1 and 5 Hz GPS units over a variety of angles. The authors concluded that
53
there is “a threshold” for multidirectional motion where, at both 1 and 5 Hz, GPS
became less reliable (Portas, et al., 2007). This occurred when the turning angle
increased to 180̊ . This may have implications when attempting to accurately assess
team sports involving movements that involve a rapid COD over a variety of different
angles, such as hockey.
The reliability of GPS for assessing these changes remains unclear. Nonetheless, it is
apparent that the combination of COD, sample rate and speed of movement affects the
ability of GPS to reliably detect these movements. Further research is required to
identify the reliability of GPS to assess hockey specific movements such as
accelerating, decelerating and COD, enabling sport scientists to confidently measure
the activity profiles associated with match play.
2.4.7 Validity of distance and speed using GPS
In order to validate the use of GPS in team sports, knowledge of the accuracy and
precision of the measurements are essential. Validity can be determined by comparing
the new test or method against a previously established “gold standard” (Wilkinson et
al, 2009). The most popular method of GPS validity assessment is to compare a
known distance or course measured with a tape measure or trundle wheel, to the
recorded GPS distance (Aughey, 2011a). Light gates are set up at nominated points to
obtain a criterion sprint time for a known distance. The GPS estimated distance for the
time taken on each course as measured by the timing gates is then determined using
the manufacturer software. The start time for each effort is determined by the first
increase above zero on the velocity trace (Peterson, et al., 2009).
Validation of GPS devices for assessing team sport movements did not occur until
2008 (
The time from timing
lights is used to indicate the end of the movement for each known distance.
Coutts & Duffield, 2010; MacLeod, et al., 2009). However, comparison

54
between studies is difficult due to differences in methodology, type of unit, sample
rates and statistical method applied. One of the first studies examining the validity of
team sport using non-differential GPS found it was a valid system to assess distance
and speeds in a variety of hockey specific activities. Using a hockey specific circuit
(Figure 2.4), the authors observed a strong correlation (r = 0.99; P<0.001) between the
participants speed, as measured by timing gates, and the GPS (MacLeod, et al., 2009).
Interestingly, this study showed that GPS was accurate for determining velocity,
whereas other studies have shown differing results when assessing short duration,
high speed efforts (Coutts & Duffield, 2010). For example, a low sample rate
underestimated distance (31%) in high velocity tennis specific drills, whilst the typical
errors ranged from 3% to 40% when estimating sprint distances of 20 to 40 m in
cricket specific sprint efforts (Peterson, et al., 2009). One reason for the disparity in
findings could be found in the differences in methodology between the studies. In the
hockey study, the validity of distance and mean speed for four types of hockey
specific shuttles, total lap distance, and overall total distance were assessed. What is
unclear from this study is the validity and reliability of the individual movement
patterns (walking, jogging, cruise, and sprint) that comprised the hockey simulation
circuit which, unlike the cricket investigation, were not examined. The 7 km·h−1
average movement speed, indicating an overall intensity of walking, around the
hockey circuit may also have impacted the accuracy of these results. It would be of
interest to perform a larger amount of high intensity distance and determine the
impact this has on the validity of GPS to assess these movements.

55
Figure 2.4: Hockey specific circuit. Reproduced from (MacLeod et al, 2009).
Whilst the validity of higher speed efforts of short duration do not appear to be
acceptable, it seems that GPS does have adequate validity for assessing longer
distances, for example TD or mean speed (m·min-1
MacLeod,
et al., 2009
). For example there were only
small differences when comparing 1 Hz GPS distance (6820.5 m) to the actual total
distance participants covered during a hockey specific circuit (6818.0 m) (
). However others reported that slightly poorer TE for 1 Hz GPS to assess
TD during a team sports specific running circuit that required regular changes in
speed and activity (Peterson, et al., 2009). Team sport specific circuits (Figure 2.5) of
128.5m, with a greater amount of variation in velocities were used in a more recent
validation study. In agreement with previous research this study also demonstrated a
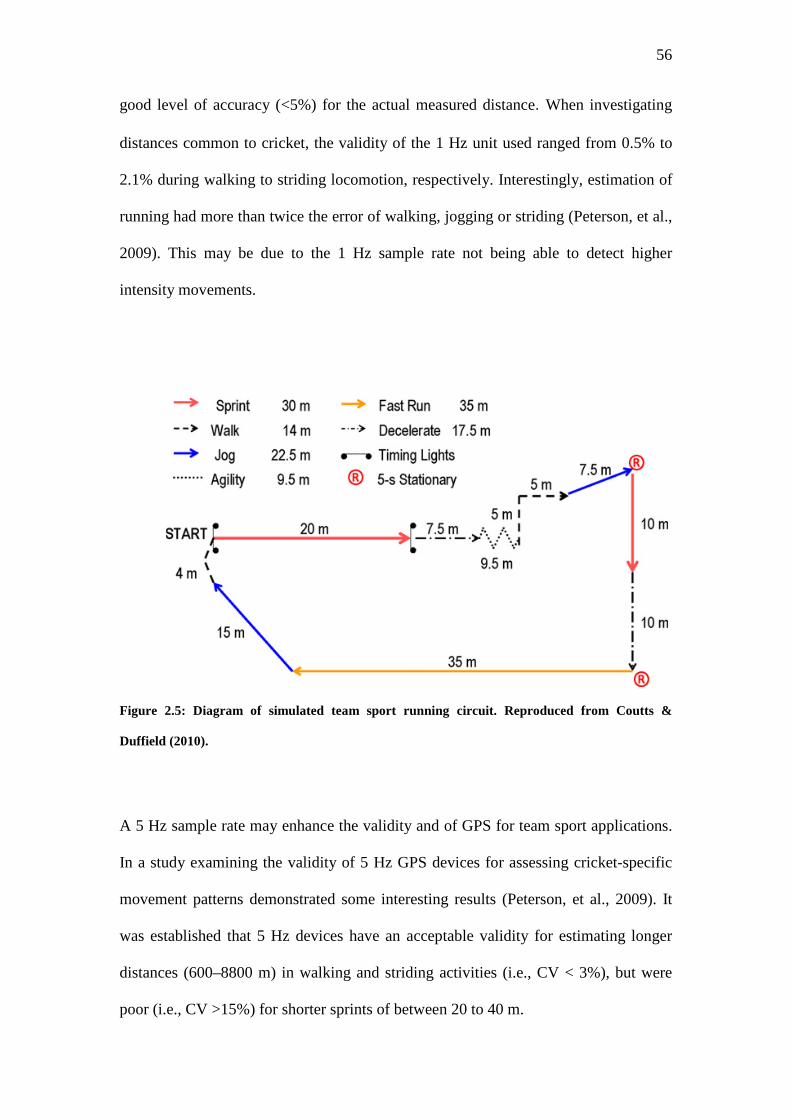
56
good level of accuracy (<5%) for the actual measured distance. When investigating
distances common to cricket, the validity of the 1 Hz unit used ranged from 0.5% to
2.1% during walking to striding locomotion, respectively. Interestingly, estimation of
running had more than twice the error of walking, jogging or striding (Peterson, et al.,
2009). This may be due to the 1 Hz sample rate not being able to detect higher
intensity movements.
Figure 2.5: Diagram of simulated team sport running circuit. Reproduced from Coutts &
Duffield (2010).
A 5 Hz sample rate may enhance the validity and of GPS for team sport applications.
In a study examining the validity of 5 Hz GPS devices for assessing cricket-specific
movement patterns demonstrated some interesting results (Peterson, et al., 2009). It
was established that 5 Hz devices have an acceptable validity for estimating longer
distances (600–8800 m) in walking and striding activities (i.e., CV < 3%), but were
poor (i.e., CV >15%) for shorter sprints of between 20 to 40 m.

57
Under- and over-estimations of criterion distance with various GPS devices have been
reported. Studies have investigated the length and type of movement (COD), the
model of GPS device being used, and more importantly, speed of movement
(Edgecomb & Norton, 2006; MacLeod, et al., 2009). At present the majority of
findings suggest that the 5 Hz systems display higher accuracy and reliability
compared to 1 Hz (Coutts & Duffield, 2010; Peterson, et al., 2009). However, the
effectiveness of these devices for assessing movement specific to team sports such as
hockey is not well understood.
2.4.8 Limitations of GPS
Although GPS can be used for a variety of applications it does have some limitations
for use with team sport. First, the signal from the satellites to the GPS units can be
interrupted by the atmosphere and local obstructions such as buildings which may
cause the signal to bounce around rather than being directly transmitted to the unit
(Schutz & Herren, 2000). Signals sent from the satellite to the GPS unit can also drop
out for periods of time, causing incomplete data sets (Duncan, Badland, & Mummery,
2009). These limitations may cause errors in the calculation of the distance of the
satellites from the GPS unit (Larsson & Henriksson-Larsen, 2001) and most likely
explain some of the measurement error reported in previous validation studies.
Another potential limitation is the constant changing orientation, positioning and
identity of the satellites over time. This may make research conditions difficult to
standardise when using GPS. To assess the influence of this, trials of a known
distance using a hockey specific circuit were conducted on different days at 9:00,
13:00, and 16:00 and compared to GPS distance. No differences existed between TD
measures, suggesting satellite positioning at different times of the day did not affect
the validity of the system (MacLeod, et al., 2009). In contrast however, in a study
58
investigating the stability of GPS distance measures over four consecutive days,
participants completed identical running circuits of a known distance wearing 1 Hz
GPS units. While the GPS and known distance were highly correlated (ICC = 0.99),
the difference across the four GPS trials (p < 0.0001; ES = 0.20) showed a lack of
measurement stability (Wissell, Williams, & Lorenzen, 2010). This work
demonstrated there are major limitations when using GPS for the assessment of team
sport specific movements during training session occurring on consecutive days or
during matches completed over multiple days within a tournament scenario.
2.5 Time-motion analysis in hockey
Time–motion analysis provides an objective yet non-invasive method for quantifying
activities and movements of athletes during match play (Duthie, et al., 2003a). In
time-motion analysis, movement patterns, distance covered, mean speeds, levels of
“exertion” and work-to-rest ratios can be established by quantifying the time spent
performing different activities. Existing studies have generally established the activity
profiles by calculating the distances travelled in pre-determined motion categories
(standing, walking, jogging, striding, and sprinting) as well as frequency of
occurrence for each activity for players in a variety of positions. Time-motion analysis
can also provide valuable information regarding the fatigue during matches (Aughey,
2010; Mohr, Krustrup, & Bangsbo, 2003; Sirotic, Knowles, Catterick, & Coutts,
2011) and/or the activity profiles of different levels of competition (Brewer, et al.,
2010; Mohr, Krustrup, Andersson, Kirkendall, & Bangsbo, 2008; Sirotic, et al., 2009).
The use of GPS as an analysis tool allows extensive performance data to be generated
within a few hours after the completion of training or match. However, as previously
described, the number of variables and scope of data collected may be limited by the
accuracy of the system. This is especially relevant for the assessment of high intensity

59
activities, which appear to be more important to team performance and success than
the total distance travelled (Mohr et al, 2003; Di Salvo, 2009).
In comparison to other team sports, there have been relatively few attempts to
determine the activity profile of high level hockey (Gabbett, 2010; Lothian &
Farrally, 1994; MacLeod, et al., 2007; Spencer, et al., 2004). Although the most recent
hockey-specific time-motion studies have provided a basic understanding of the
activity profiles of hockey, gaps in the literature and limitations to individual studies
exist (Lythe & Kilding, 2011). Early investigations into the activity profiles in hockey
categorised it as aerobically demanding with frequent though brief repeated high
intensity efforts superimposed (Reilly & Borrie, 1992). At the elite level there have
been relatively few studies that have provided information on activity patterns and
player performance, especially since some of the more recent rule changes have been
made.
2.5.1 Activity profile of female hockey
While there is relatively little research on time-motion analysis of male hockey, there
is a larger body of knowledge in female hockey that can assist in understanding the
male version of the game. In general it has been reported that elite female hockey
players travel between 3,400 – 9,500 m during a match (Gabbett, 2010; Macutkiewicz
& Sunderland, 2011), with regular changes in activity and velocity. Video-based time-
motion analysis investigating the physical demands of female national league players
determined that between 78 - 84% of activity was accounted for with low intensity
movements (Lothian & Farrally, 1994). This differed to club level female players who
covered on average 3,901 ±552 m over the duration of a game with the majority of
time spent performing low intensity movements (97.4%) and only 2.6% accounting
for high intensity activities. However, a major limitation of that study was that player

60
movement was only recorded every 15 s and time spent performing discrete activities
were not recorded. This may have caused an underestimation of both total distance
covered and the amount of high intensity activity performed.
More recently, it was reported that high intensity activity accounted for 7.9 ±1.2% of
total playing time in female English national league players (MacLeod, et al., 2007).
Different movement classification systems were used in the more recent study with
six motion categories utilised rather than the five previously employed. As well as
this, Lothian and Farrally (1994) defined hockey skill related motions of trapping,
dribbling and passing as high intensity activities, even though they may be performed
at a low intensity. These methodological differences may have influenced the amount
of high intensity activity recorded. Finally, in the years between the two studies, there
were some significant rule modifications such as the use of continuous substitutions
and the elimination of the offside rule which may also have influenced activity
patterns. Recently, GPS technology has been used to objectively quantify movement
in team sports (Coutts & Duffield, 2010) and more specifically in hockey (Gabbett,
2010; Lythe & Kilding, 2011; Macutkiewicz & Sunderland, 2011). Indeed, GPS
technology was recently used to quantify the activity profile of elite female hockey
players in the Australian Hockey League (AHL) (Gabbett, 2010) and English national
league (Macutkiewicz & Sunderland, 2011). On average, AHL players covered 6,600
m (range: 3,400 – 9,500 m) in the match, a considerably greater distance than
previously reported for female players using video-based time-motion analysis
systems. However, although more distance was covered, time spent in low- to
moderate speed activities was similar to previous work. Notably, these periods of
lower speed exercise were interspersed with frequent bouts of high-acceleration and
high-velocity movement activities (Gabbett, 2010). Similar distances were found in
61
the English women’s national league, with players covering on average 5,541 ±1,144
m. It was reported that forwards spent a greater percentage of time running, fast
running, and sprinting than midfielders and defenders (Macutkiewicz & Sunderland,
2011). This differed to the AHL study where, midfielders spent more time and
covered greater distances in high intensity running (i.e. > 5 m·s-1) than strikers and
defenders. The differences in activity profiles reported in these studies may have been
due to different playing styles utilised in each league, team and positional tactics. The
number of substitutions used within matches analysed was only reported in the
English national league study, making comparisons problematic. The continuous
substitution rule, and the substitution strategies resulting from this, has been shown to
impact activity patterns (Macutkiewicz, 2011). The two studies also employed a
different number of velocity bands when classifying movements, with the English
national league study utilising six bands compared with five for the AHL study. When
the velocity bands were collapsed to form exercise intensity groupings differences
were also observed. These groupings differentiated between low (0-1.67 m·s-1 vs 0-1
m·s-1), medium (1.67-4.17 m·s-1 vs 1-5 m·s-1) and high intensity categories (4.17-8.19
m·s-1 vs >7 m·s-1
2.5.2 Activity profile of male hockey
). This may have affected the amount of high intensity activity
recorded.
Time-motion analysis of the 1973 World Cup provided some early data quantifying
the distances covered during hockey matches (Wein, 1981). In that study, defenders
covered less distance than midfielders, 5,160 m and 6,360 m respectively. The
greatest distance covered was recorded by a midfielder playing on the New Zealand
team. However, little information was reported on individual playing time and it is
unclear if results included players who played for less than 70 mins (Wein, 1981).

62
Manual video-based time–motion analysis performed during international male
hockey demonstrated that players spend most of a match exercising at lower speeds
(i.e. standing, walking, jogging), with a small proportion of time (~5.6%) spent at
higher speeds (striding and sprinting) and an occasional bout of repeated sprint
exercise (Spencer, et al., 2004).
The activity profile of elite male hockey players’ has also been assessed using GPS
technology during competition. The average total distance (TD) covered per position
was 8,160 ±428 m (70 min) and 6,798 ±2,009 m when expressed per player (mean
playing time: 51.9 min) (Lythe & Kilding, 2011). The distance per player data is
similar to elite female hockey players (Gabbett, 2010) but higher than previous studies
in males (Wein, 1981). However, it is difficult to compare this data with other results
reported in the literature, due to the number of different movement categorizations
(five vs. six), methodology (e.g. GPS, manual video-based analysis) and GPS sample
rates (i.e. 1 Hz vs. 5 Hz) employed.
Whilst these studies provide useful information on some of the physical requirements
of international field hockey, no studies have investigated the activity demands of
national level competition or compared these to the top level international
competition. Further, it is possible the game demands have changed in the 5-6 years
since some of these studies were completed.
2.5.3 Positional differences
As previously described, hockey categorises players into three distinct positional
groups (strikers, midfielders and defenders). Understanding the activity profiles (i.e.
distance covered and intensity) specific to each positional role is essential when
developing sport-specific training programs.

63
Given the similarities between soccer and hockey, both positionally and strategically,
some useful comparisons can be made between sports. In soccer, there are major
individual differences in the physical demands of players, in part related to positional
roles within the team. A number of studies have compared playing positions (Di Salvo
et al, 2009; Bloomfield et al, 2007; Bangsbo, 1994; Bangsbo et al., 1991; Ekblom,
1986; Reilly & Thomas, 1979). In a study of top-class players, defenders covered less
TD and performed less high speed running (HSR) than players in the other positions
(Mohr et al., 2003). This was probably closely linked to the tactical roles of the
defenders as well as their lower physical capacity (Bangsbo, 1994). In comparison,
the attackers covered a distance at a high intensity equal to the midfield players, but
sprinted more than the midfield players and defenders (Mohr et al, 2003). In
comparison, a more recent study of elite level soccer players, using a semi-automatic
computer tracking system (Prozone) investigated the amounts of high speed activities
in the English premier league were investigated. Similar to the previous work, the
results indicated that differences in total amount of HSR and sprinting existed
between positions with the largest amounts of HSR and sprinting associated with wide
defenders, attackers and midfield players (both central and wide).
Currently only one study has described the specific activity patterns of positional
groups within male international level hockey using GPS (Lythe & Kilding, 2011). In
that study, fullbacks were found to be the most unique of the positional groups,
covering significantly less total distance than the other positions and performed a
greater proportion of distance at low intensity. Similar to the previously mentioned
soccer study, fullbacks covered the least TD, performed a greater proportion of
distance at low intensity and less distance at moderate and high intensities than other
positional groups. For most measures, except distance covered, this data is similar to

64
that reported in early video-based time-motion hockey studies (Cych, 2006; Spencer,
et al., 2004). However, there were a number of limitations to this research. The study
used six narrow velocity bands to discriminate between movement speeds and
distances. The ability of 1 Hz devices to accurately assess high speed movements may
reduce the capacity to accurately report distance covered in narrow speed zones. To
reduce this error an increase in sampling rate could be employed and coupled with
wider speed zones in future GPS time-motion analysis studies. Advancements in
technology may enable further differentiate between positions in elite level hockey.
2.5.4 Activity profile across a match
It is generally accepted that physical performance declines during a match as a
consequence of increased fatigue towards the end of the game (Bangsbo, et al., 1991;
Mohr, Krustrup, et al., 2003; Mohr, Krustrup, & Bangsbo, 2005; Reilly & Thomas,
1976; Van Gool, Van Gerven, & Boumans, 1988). Several researchers in soccer have
observed a reduction in TD covered in the second half when compared to the first
(Bangsbo, et al., 1991; Reilly & Thomas, 1976; Van Gool, et al., 1988). This
reduction may indicate the development of fatigue in the second half, although TD
covered appears not to be the best indicator of physical performance in a match
(Mohr, Krustrup, et al., 2003). A number of studies have investigated the amount of
high speed running (HSR) and its importance to performance in team sports (Di
Salvo, Gregson, Atkinson, Tordoff, & Drust, 2009; Mohr, Krustrup, et al., 2003;
Rampinini, Coutts, et al., 2007). Some studies have reported that the most successful
teams (top 5 in the English Premier league) perform less HSR that the bottom 5 teams
(Di Salvo, et al., 2009). Indeed, in soccer, HSR can be used to differentiate between
the tactical roles of players (Di Salvo, et al., 2007), between elite and sub-elite players

65
(Mohr, Krustrup, et al., 2003), and is related to the overall success of a team
(Rampinini, Coutts, et al., 2007).
Several studies have provided evidence that players’ ability to perform high intensity
exercise is reduced towards the end of games in both elite and sub-elite soccer
(Krustrup, et al., 2005; Krustrup, Mohr, Nybo, et al., 2006; Mohr, Krustrup, et al.,
2003; Mohr, et al., 2005; Reilly & Thomas, 1976). It has also been demonstrated that
the amount of sprinting and HSR, covered are lower in the second half than in the first
half of a soccer game (Bangsbo, 1994; Bangsbo, et al., 1991; Mohr, Krustrup, et al.,
2003; Reilly & Thomas, 1976). Further, the players’ physical performance was
reduced after a period with a large amount of high-intensity exercise during match-
play and towards the end of the match, suggesting that fatigue occurs both transiently
and at the end of a game (Mohr, Krustrup, et al., 2003).
There are similar findings regarding the decrement of HSR during match play in other
elite level team sports. Research in elite level rugby league demonstrated that the
ability to perform physical activity during the second half is related to the physical
stress of the first half (Sirotic, et al., 2009; Sirotic, Russell, & Coutts, 2005).
Furthermore, players who completed more physical activity in the first half showed a
decrement in physical performance during the second half in both total intensity of
exercise and HSR. Conversely, when a lower physical stress was placed on the
players during the first half, second-half total intensity of exercise and HSR exercise
was maintained (Mohr, Krustrup, et al., 2003).
In a study of AF players TD, HSR and lower speed activity (LSA) were reduced in the
fourth quarter (Coutts, et al., 2010), however, there was not a gradual reduction in
exercise intensity during each half as reported by some studies on high-level soccer
players (Bradley, et al., 2009; Di Salvo, et al., 2009; Mohr, Krustrup, et al., 2003).

66
Rather, the TD, sprint distance and HSR distance were reduced following the first
quarter and the very high intensity running (VHIR) was reduced during the final
quarter. One possible explanation for the differences between the within-match
variations in activity profile observed between AF and soccer is that AF allows
unlimited interchange of players and is played in four quarters of ~30 min with rest
periods. Both the use of the unlimited number of player interchanges during a game
along with the regular programmed breaks in play (i.e. quarter time, half-time and
three-quarter time) in AF may allow for greater recovery from short-term fatigue.
These regular short breaks may allow the players to reduce the metabolic stress and
their perception of fatigue, and exercise at higher intensities immediately after the
breaks (Marcora & Staiano, 2010; Noakes, 2012).
In comparison to research performed in other elite level team sports, the extent to
which HSR has been examined in elite male hockey is limited. In an early study of
English national league level hockey, the amount of high-intensity activity performed
decreased during the 2nd half (Lothian & Farrally, 1994). In contrast, when each 5
min period of the 1st and 2nd halves were compared during an international match,
results suggested no significant decrease in the amount of striding and sprinting that
occurred (Spencer, et al., 2004). A more recent investigation of international players
using 1 Hz GPS devices supported these findings. Although there was a 4.8 %
reduction in TD covered between the 1st and 2nd halves, no change in HSR distances
was reported as the match progressed. These results may have been influences by the
different methods of analysis and methodologies used to assess HSR. Six speed zones
were used in the later study in an attempt to get a more accurate description of HSR
distances. Further research, using currently available 5 Hz GPS devices and

67
identifying the number of substitutions per match may provide greater insight into the
overall and positional HSR activity profiles of elite hockey players.
Although similarities between soccer and hockey exist, recent rule variations have
changed the movement characteristics of match play in hockey (Spencer, et al., 2004).
Specifically, changes to the playing surface (grass to Astroturf), the elimination of the
offside rule and the introduction of unlimited substitutions have all had an influence
on the speed of the game (Lythe & Kilding, 2011; Spencer, et al., 2004). The
influence of the number of substitutions may be the most significant rule change in
relation to the players’ ability to sustain the amount of HSR within a half and across
the full match. To date no information exists regarding the effect unlimited
substitutions have had on the maintenance of HSR within a match or across a
tournament. Investigations into this would enable coaches to develop specific
substitution strategies to maximise players HSR output. This in turn could influence
specific tactics used during a match.
2.5.5 Activity profile across a tournament
The three major international competitions at the elite level are the Olympic Games,
World Cup and Champions Trophy (CT). The CT consists of the top six ranked
countries playing a round-robin style tournament, within a period of nine days. This
schedule may involve intense periods where teams are required to play up to three
matches in four days. With limited time to recover before the next match and an
increased importance of match outcomes as the tournament progresses, the ability to
maintain exercise intensity across a tournament could be important.
Given that the majority of competition within hockey is performed in tournament
scenarios rather than week-to-week competition, no studies have investigated the
effect a tournament may have on HSR distances. Research in soccer has investigated
68
changes in the activity profiles of players over the course of a match or different
phases of a season (Di Salvo, et al., 2007; Rampinini, et al., 2009). A recent study
examined the effects of three matches in five days in professional soccer, suggesting
that the activity profiles were not influenced by the short recovery between matches
(Odetoyinbo, Wooster, & Lane, 2009). Similar results were observed when comparing
the same top class soccer players over two consecutive matches indicating that
activity profiles were not statistically influenced by the short recovery periods
between matches (Rey, Lago-Peñas, Lago-Ballesteros, Casais, & Dellal, 2010).
Only one study has examined changes in activity profiles over a tournament scenario
in elite hockey players using video-based time-motion analysis. In this study, residual
fatigue was evident in subsequent matches when players compete in three field
hockey matches within a four-day time period (Spencer, et al., 2005). During the
tournament investigated, players increased the time spent standing and reduced the
time spent jogging from match 1 to match 3, indicative of fatigue. However, during
major international tournaments, more than three matches are played. For example,
the CT consists of six matches played over a period of nine days. Thus the changes in
activity pattern experienced by players competing in the CT may be even greater than
previously reported (Spencer, et al., 2005), although this is yet to be investigated.
Information on the activity profile of players in a single match may provide valuable
information on positional profiles in field hockey. However a detailed analysis
throughout a tournament could provide a greater insight into the requirements over the
duration of such competitions. Previous studies in basketball, soccer and hockey
examined the match demands of a tournament by comparing subsequent matches to
the first match played. (Montgomery et al., 2008; Rowsell, Coutts, & Reaburn 2007).
Whilst this approach provides a comparison with a theoretically 'fatigue-free' baseline

69
(i.e. match 1), results may be heavily influenced by tactics, opposition, environmental
and other factors related to the first match. There is potential benefit in examining
individual match activity profiles in comparison to values such as a tournament
average or matches displaying the highest level of exercise intensity. Published
research on the physical demands of men’s hockey is limited, especially relating to
recent elite competition and tournament play.
2.5.6 Levels of competition
Time–motion analysis may also provide specific information that can be applied to
the physical and game-specific skill preparation of players at different competitive
levels or leagues. Such preparation may assist in improving weaknesses in physical
and game-specific skill match play between each standard of competition in order to
make a more successful transition into the higher playing level. Physical match
performance is different between professional soccer players of different competitive
levels (Andersson, Randers, Heiner-Moller, Krustrup, & Mohr, 2010; Mohr, et al.,
2008). A larger amount of HSR is performed by players at higher competition level
games compared with players at moderate levels in both male and female soccer
players (Andersson, et al., 2010; Mohr, et al., 2008; Rampinini et al., 2008). In a study
of female soccer players, the HSR performed during games in top-class vs. high-level
players was compared. The top-class players covered more distance at high intensities
compared with the high-level players, which could partly be explained by a superior
fitness level in the top-class players (Mohr, et al., 2008). In addition to the fitness
level, it has also been shown that the opponent has an impact on exercise intensity and
the fatigue development during games (Rampinini, et al., 2008).
In Australia, the AHL is the highest standard of domestic competition and provides a
pathway to international representation. The extent to which the activity profiles in the

70
AHL prepare players to make a successful transition to international competition is
not known. Whilst previous studies provide useful information on some of the
physical requirements of international hockey, no studies have investigated the
activity profiles of national level competition or compared these to the top level
international tournaments. Additionally, as HSR is an important discriminator
between elite and sub-elite team sport athletes (Mohr, Krustrup, et al., 2003), no
studies have investigated differences in HSR between these competition levels.
At present, research into hockey at the elite level is limited. With advancements in
micro technologies and the subsequent use of GPS for time-motion analysis of team
sport, the ability to perform a more comprehensive analysis is now possible. Utilising
5 Hz GPS devices may provide a more accurate and detailed insight into the activity
profiles of hockey players at the elite level. This technology may enable the
identification of greater differences between positions, competition levels and be able
to define the amounts of HSR performed both from a positional and match perspective
with a greater level of precision. Finally, this technology may provide greater
understanding into activity profiles of players across an international tournament and
accurately identify HSR requirements of positional groups, assessing how these
change across a number of consecutive matches. The results of these investigations
will allow sport scientist, practitioners and coaches to develop a greater understanding
into of the physical requirements of hockey at the elite level enabling the design of
sport and position specific training programs.
2.6 Aims
The primary aim of this series of investigations included in this thesis is to determine
the reliability and validity of GPS for measuring key variables associated with time–
motion analysis common to team sports. A secondary aim is to utilise this tool to

71
describe and compare the activity profiles of elite male hockey players with regard to
playing level and positional roles. Finally, assessing differences in the activity profiles
of elite hockey players during an international tournament may enable the
development and improve the effectiveness of training strategies and programs that
will ultimately optimise performance.
2.6.1 Study 1: The validity and reliability of GPS units for measuring
distance in team sport specific running patterns.
• The purpose of this study was to assess the validity and reliability of distance
data measured by GPS units sampling at 1 and 5 Hz during movement patterns
common to team sports.
2.6.2 Study 2: Variability of GPS units for measuring distance in team
sport movements
• The aim of this investigation was to examine the differences in distances
measured by two GPS units of the same model worn by the same player while
performing movements common to team sports.
2.6.3 Study 3: International field hockey players perform more high
intensity running than national level counterparts
• The purpose of this study was to examine several aspects of elite field hockey
running performance.
• The three specific aims of this study were to determine: 1) the activity profile
of national and international field hockey competitions, specifically the
influence of competition level on HSR; 2) if playing position within a level of
72
competition influences the activity profile; and 3) if the movement
characteristics are different between each half of a match.
2.6.4 Study 4: GPS analysis of international field hockey tournament
• This examination was undertaken to determine the influence of multiple
games on exercise intensity during a world class hockey tournament.
• The specific aims of this study were to determine: (1) if the mean match
intensity changed throughout a tournament, specifically high speed running;
and (2) if playing position influences movement output across the tournament.
2.7 Research linking the manuscripts
This research project investigated the suitability of GPS to identify and assess activity
profiles within elite male hockey players. To achieve this, four separate research
projects were undertaken. Study 1 examined the reliability and validity of GPS to
identify and determine specific movement patterns and velocities commonly found in
field based team sports (Chapter 3). Additionally, Study 2 (Chapter 4) investigated the
difference between GPS units by determining the between unit variability. As a result
of the findings from Chapter 3 and 4, specifically the detection of adequately valid
and reliable time–motion analysis variables, Chapters 5 investigated the differences in
activity profiles between competition levels and positional sub-groups in elite hockey
players. Finally, Chapter 6 was undertaken to determine the influence of multiple
games on exercise intensity during a world class hockey tournament.
73
CHAPTER 3. THE VALIDITY AND RELIABILITY OF
GPS UNITS FOR MEASURING DISTANCE IN TEAM
SPORT SPECIFIC RUNNING PATTERNS
3.1 Introduction
Quantifying the movement demands of team sport players during training and
matches provides valuable information that can be used to better understand the
demands of competition and develop specific training programs. Until recently,
measurement and quantification of player movement demands has been difficult as it
has required manual analysis with only one player being analysed at a time (Roberts,
et al., 2006). However, with recent technological developments there are now many
systems that can analyse movement patterns of many players in team sports
simultaneously, including manual and computer-assisted video-based time-motion
analysis systems, triangulation of miniature electronic transmitters and GPS devices
(Carling, et al., 2008; Dobson & Keogh, 2007). Specifically, GPS technology is used
by many sports to quantify movement demands during training and competition
(Aughey & Falloon, 2010; Barbero Álvarez, et al., 2010; Coutts & Duffield, 2010;
Edgecomb & Norton, 2006; MacLeod, et al., 2009).
The use of video-based time-motion analysis (TMA) has been well documented
(Bradley, et al., 2009; Carling, et al., 2008; Rampinini, Coutts, et al., 2007;
Rampinini, et al., 2009), however, there is a growing body of literature examining the
use of GPS for game and player analysis (Aughey & Falloon, 2010; Barbero Álvarez,
et al., 2010; Coutts, et al., 2010; Peterson, et al., 2009). Indeed, GPS technology has
the potential to provide a more comprehensive, accurate and automated examination
of player movements in invasion style team sports (e.g. hockey, rugby union, rugby
74
league, soccer and AF). However, few studies have investigated the reliability and
validity of GPS technology for the assessment of team sport movement patterns
(Barbero Álvarez, et al., 2010; Coutts & Duffield, 2010; Edgecomb & Norton, 2006;
MacLeod, et al., 2009; Peterson, et al., 2009). Additionally, most studies have
assessed the validity and reliability of these GPS devices with distance and positional
data recorded at 1 Hz, (Barbero Álvarez, et al., 2010; Coutts & Duffield, 2010;
Edgecomb & Norton, 2006; MacLeod, et al., 2009), with relatively few utilising 5 Hz
data (Peterson, et al., 2009).
Technology developments now allow position data to be collected at 5 Hz during
match play and training. This increase in sample rate may enhance the validity and
reliability of GPS for team sport applications. To date, however, only one study has
examined the validity and reliability of 5 Hz GPS devices, assessing cricket-specific
movement patterns (Peterson, et al., 2009). The results demonstrated that 5 Hz
devices have an acceptable validity and reliability for estimating longer distances
(600-8800 m) in walking and striding activities (i.e. CV < 3%), but were poor (i.e. CV
>15%) for shorter sprints of between 20 to 40 m (Peterson, et al., 2009). The efficacy
of these devices for assessing movement demands specific to team sports such as the
football codes is not well understood.
Critical movements to performance in team sports are the ability to maximally
accelerate, decelerate and change direction at speed over a short distance (Dobson &
Keogh, 2007). For example, AF, soccer, rugby union and hockey players’ exhibit
similar sprint distances, typically between 10-20 m (Coutts, et al., 2010; Duthie, et al.,
2006; MacLeod, et al., 2009; Sirotic, et al., 2009). Several studies have shown that
increased sprint and repeated-sprint performance (Dawson, et al., 2004b; Duthie, et
al., 2006; Impellizzeri, et al., 2008; Rampinini, Bishop, et al., 2007; Sirotic, et al.,
75
2009; Spencer, et al., 2004), particularly with the ball (Rampinini, et al., 2009), are
important for team performance. In addition, the ability to change direction is
important in these sports (Bloomfield, et al., 2007; Duthie, et al., 2006; Mujika,
Santisteban, Impellizzeri, & Castagna, 2009). Dawson et al (2004b) investigated
players’ movement patterns in AF and demonstrated that more than half the number
of sprints performed in a match involved at least one change of direction. It is
therefore necessary to be able to accurately measure these characteristics in match
play. Therefore, the aims of this study were to assess the reliability and validity at
both 1 Hz and 5 Hz of the MinimaxX GPS device for the assessment of different
movement patterns and distances common to team sport play.
3.2 Methods
Twenty elite Australian football players (mean ±SD) age, stature and body mass: 24 ±
4 y, 188 ± 7 cm, and 87 ± 9 kg respectively participated in the study. This study
conformed to the National Health and Medical Research Council’s Statement on
Human Experimentation. All athletes gave informed consent following full disclosure
of procedures.
3.2.1 Experimental design
This study evaluated the validity and reliability of distance data collected from GPS
units at 1 and 5 Hz during movement patterns common to team sports. Specifically,
the accuracy of these devices was assessed during straight line running at various
speeds, during two COD courses, and during a team sport running circuit. This
research design allowed for the assessment of team-sport specific movement patterns
of increasing intensities, complexity and specificity. During each trial subjects wore
two GPS units (MinimaxX, Team 2.5, Catapult Innovations, Scoresby, Australia) in a
custom made harness with the units located on the right and left scapula,

76
approximately 25 cm apart. The antennas of each unit were exposed to allow a clear
satellite reception. Trials were completed on a grassed AF field, clear of large
buildings to enhance satellite reception. The mean ±SD number of satellites during
data collection for the straight line, COD and simulated team sport running circuit
were 8.2 ±0.6, 8.3 ±0.4 and 8.2 ±0.6, respectively. The HDOP is a reflection of the
geometrical arrangement of satellites and is related to both the accuracy and quality of
the signal. Values can range between 1 and a maximum value of 50, with an ideal
HDOP of 1 indicating that one satellite is directly overhead with the remainder
equally spaced around the horizon (Witte & Wilson, 2004). Higher values indicating
that the position fix is entirely unreliable (Witte & Wilson, 2005). The mean HDOP
during data collection was 1.5 ±0.28, 1.26 ±0.09 and 1.25 ±0.06 for straight line,
COD and simulated team sport running circuit, respectively. To assess the influence
of sample rate, data for each trial was collected and analysed at 1 and 5 Hz.
Electronic timing gates (Smart Speed, Fusion Sport, Queensland, Australia) were used
to obtain a criterion sprint time for a known distance (accurate to 0.01 s). The GPS
estimated distance for the time taken on each course as measured by the timing gates
was determined with Logan Plus v4.2.3 software (Catapult Innovations, Scoresby,
Australia) for each trial. The start time for each trial was determined by the first
increase above zero on the velocity trace (Peterson, et al., 2009).
The time from timing
lights was used to indicate the end of the movement for each known distance.
3.2.2 Straight-line running
Subjects commenced from a stationary position and completed two trials of each self
selected speed of walking, jogging, striding and sprinting. Timing gates were set up at
the 0, 10, 20, 40 m points measured subject time over these distances.

77
3.2.3 Change of Direction
Subjects walked, jogged, strode and sprinted through two different courses
(Figure3.1) of known distance (40 m) and angle of COD (90°). Players commenced
from a stationary position and followed a painted course marked on the ground. At
each COD, poles were used to ensure players tracked the correct pathway as close to
the known distance as possible.
Figure 3.1: Change of direction (COD) course: (a) Gradual 10 m COD. 4 × 10 m straights with 3
× 90° COD (b) Tight 5 m COD. 8 × 5 m straights with 7 × 90° COD.
3.2.4 Simulated team sport running circuit
A sample of players (n=10) completed five trials of a marked team sport running
circuit (140 m) modified from Bishop et al (2001) (Figure 7). The circuit included,
two maximal sprints, a zigzag COD, three periods of walking, three periods of
jogging, one striding effort and a deceleration to a complete stop. Measurement of the
circuit was made with a calibrated measuring tape and goniometer for COD sections.
The participants were instructed to start from a stationary position and follow a
marked course on the grassed playing field, completing each circuit within one
minute. At the COD section, poles and painted lines were used to ensure players
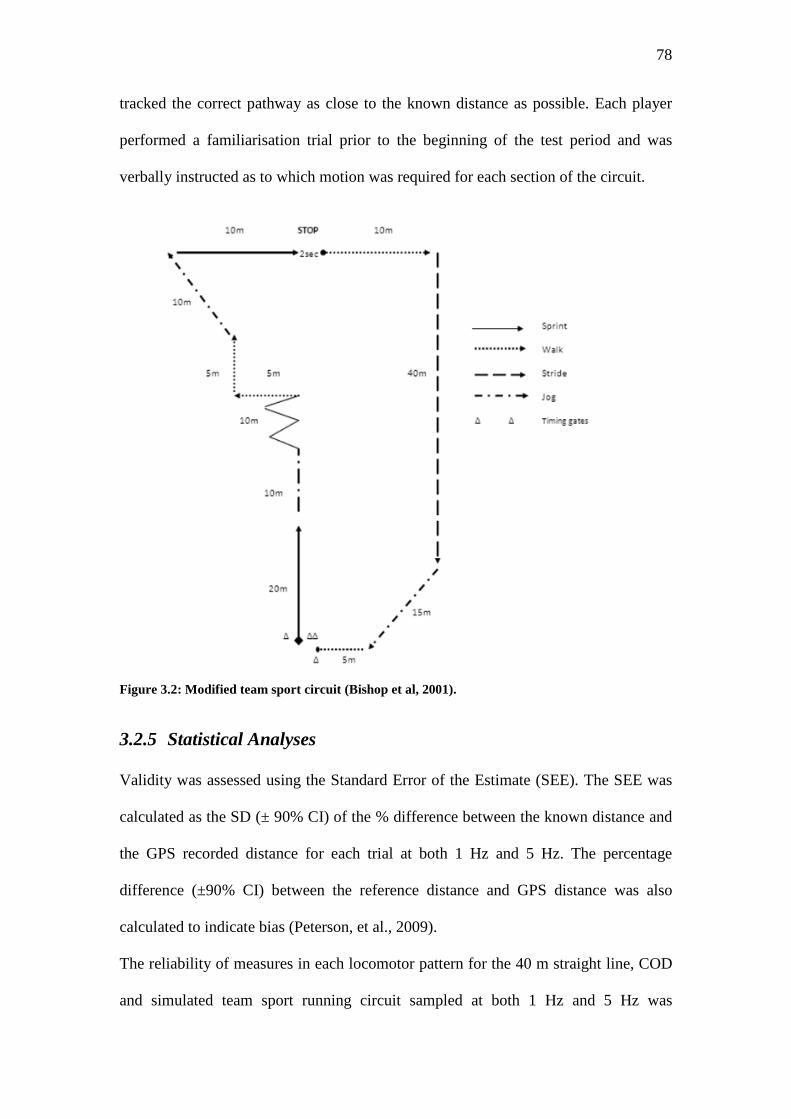
78
tracked the correct pathway as close to the known distance as possible. Each player
performed a familiarisation trial prior to the beginning of the test period and was
verbally instructed as to which motion was required for each section of the circuit.
Figure 3.2: Modified team sport circuit (Bishop et al, 2001).
3.2.5 Statistical Analyses
Validity was assessed using the Standard Error of the Estimate (SEE). The SEE was
calculated as the SD (± 90% CI) of the % difference between the known distance and
the GPS recorded distance for each trial at both 1 Hz and 5 Hz. The percentage
difference (±90% CI) between the reference distance and GPS distance was also
calculated to indicate bias (Peterson, et al., 2009).
The reliability of measures in each locomotor pattern for the 40 m straight line, COD
and simulated team sport running circuit sampled at both 1 Hz and 5 Hz was
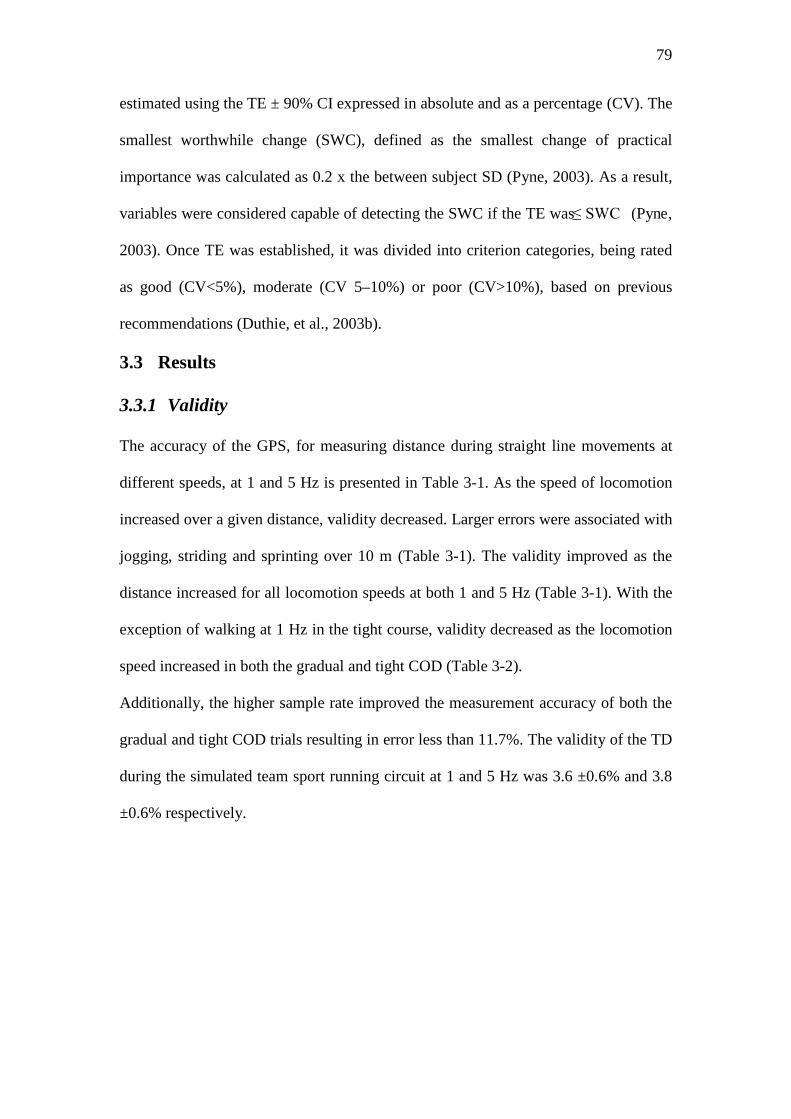
79
estimated using the TE ± 90% CI expressed in absolute and as a percentage (CV). The
smallest worthwhile change (SWC), defined as the smallest change of practical
importance was calculated as 0.2 x the between subject SD (Pyne, 2003). As a result,
variables were considered capable of detecting the SWC if the TE was ≤ SWC (Pyne,
2003). Once TE was established, it was divided into criterion categories, being rated
as good (CV<5%), moderate (CV 5–10%) or poor (CV>10%), based on previous
recommendations (Duthie, et al., 2003b).
3.3 Results
3.3.1 Validity
The accuracy of the GPS, for measuring distance during straight line movements at
different speeds, at 1 and 5 Hz is presented in Table 3-1. As the speed of locomotion
increased over a given distance, validity decreased. Larger errors were associated with
jogging, striding and sprinting over 10 m (Table 3-1). The validity improved as the
distance increased for all locomotion speeds at both 1 and 5 Hz (Table 3-1). With the
exception of walking at 1 Hz in the tight course, validity decreased as the locomotion
speed increased in both the gradual and tight COD (Table 3-2).
Additionally, the higher sample rate improved the measurement accuracy of both the
gradual and tight COD trials resulting in error less than 11.7%. The validity of the TD
during the simulated team sport running circuit at 1 and 5 Hz was 3.6 ±0.6% and 3.8
±0.6% respectively.
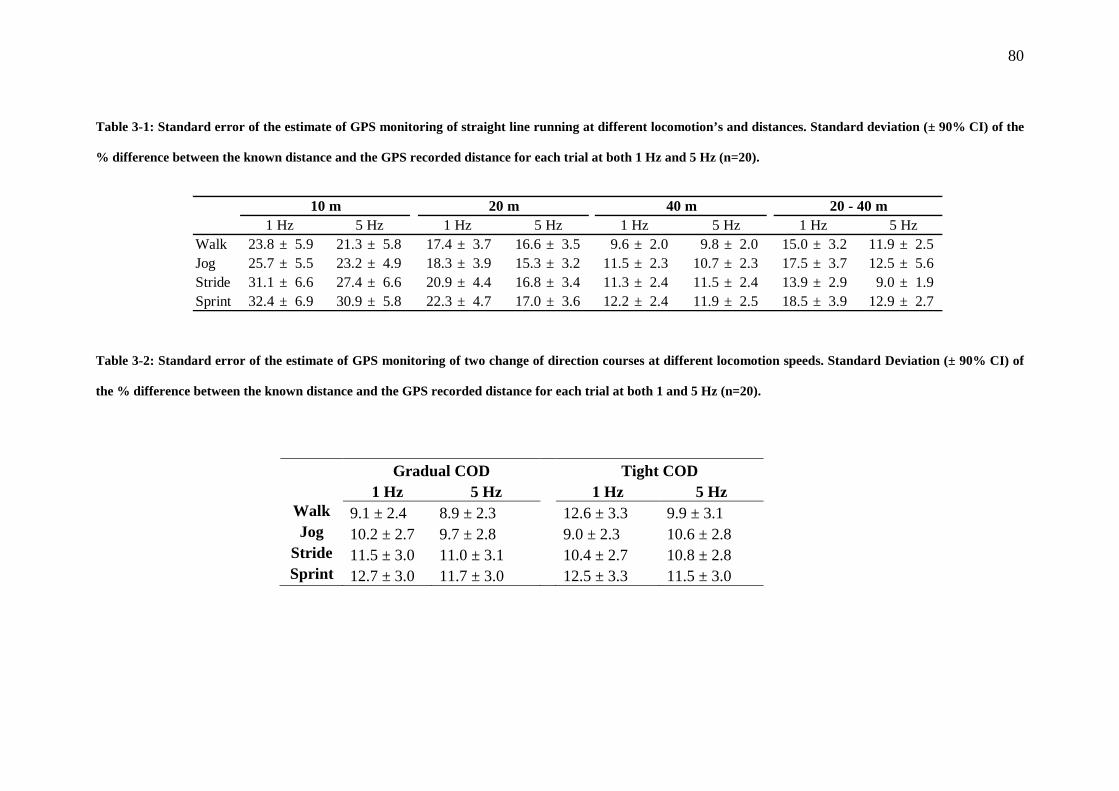
80
Walk 23.8 ± 5.9 21.3 ± 5.8 17.4 ± 3.7 16.6 ± 3.5 9.6 ± 2.0 9.8 ± 2.0 15.0 ± 3.2 11.9 ± 2.5Jog 25.7 ± 5.5 23.2 ± 4.9 18.3 ± 3.9 15.3 ± 3.2 11.5 ± 2.3 10.7 ± 2.3 17.5 ± 3.7 12.5 ± 5.6Stride 31.1 ± 6.6 27.4 ± 6.6 20.9 ± 4.4 16.8 ± 3.4 11.3 ± 2.4 11.5 ± 2.4 13.9 ± 2.9 9.0 ± 1.9Sprint 32.4 ± 6.9 30.9 ± 5.8 22.3 ± 4.7 17.0 ± 3.6 12.2 ± 2.4 11.9 ± 2.5 18.5 ± 3.9 12.9 ± 2.7
40 m1 Hz 5 Hz
20 - 40 m1 Hz 5 Hz
10 m1 Hz 5 Hz
20 m1 Hz 5 Hz
Table 3-1: Standard error of the estimate of GPS monitoring of straight line running at different locomotion’s and distances. Standard deviation (± 90% CI) of the
% difference between the known distance and the GPS recorded distance for each trial at both 1 Hz and 5 Hz (n=20).
Table 3-2: Standard error of the estimate of GPS monitoring of two change of direction courses at different locomotion speeds. Standard Deviation (± 90% CI) of
the % difference between the known distance and the GPS recorded distance for each trial at both 1 and 5 Hz (n=20).
Gradual COD Tight COD 1 Hz 5 Hz 1 Hz 5 Hz Walk 9.1 ± 2.4 8.9 ± 2.3 12.6 ± 3.3 9.9 ± 3.1 Jog 10.2 ± 2.7 9.7 ± 2.8 9.0 ± 2.3 10.6 ± 2.8
Stride 11.5 ± 3.0 11.0 ± 3.1 10.4 ± 2.7 10.8 ± 2.8 Sprint 12.7 ± 3.0 11.7 ± 3.0 12.5 ± 3.3 11.5 ± 3.0

81
3.3.2 Bias
The GPS substantially underestimated the criterion distance when striding and
sprinting over short distances (10 and 20 m) at both 1 and 5 Hz (Table 3-3). As the
distance increased, the magnitude of the error decreased when jogging, striding and
sprinting (Table 3-3). These GPS underestimated the criterion distance during the
tight COD trial at all locomotion speeds (Table 3-4). A higher sampling rate
decreased the error from the criterion distance in both the tight and gradual COD
regardless of locomotion speed. The GPS underestimated the TD of the simulated
team sport running circuit by 5.7 ±0.6% and 3.7 ±0.6% for 1 and 5 Hz respectively.
3.3.3 Reliability
Reliability improved for all locomotor activities moving in a straight line when
sampled at the higher rate and over longer distances (Table 3-5). Regardless of
locomotion or distance, GPS was incapable of detecting the SWC for straight line
locomotion (TE > SWC, Table 3-5). The CV for measures over the shorter distances
(i.e. 10 m and 20 m) were poor (CV > 10%) regardless of locomotor activity, speed or
sampling rate (Table 3-5). The higher sample rate and slower movement speed
improved all reliability measures regardless of distance (Table 3-6). The CV
measured at 5 Hz for the 20-40 m split were similar, regardless of locomotion speed
with values ranging from 12.1% (walking) to 9.8% (sprinting).
Small differences in the reliability measures between the CVs for the tight COD and
gradual COD were evident (Table 3-6). In all cases, the magnitude of the TE was
substantially greater than the SWC (Table 3-6). As locomotion speed in the COD
increased, reliability measures marginally improved at higher sampling rates (Table
8). The CV for both the tight and gradual COD tasks were similar to the 40 m straight

82
Table 3-3: Percent bias (±90% confidence interval) of GPS distance from the reference distance (n=20).
Table 3-4: Percent bias of GPS monitoring of two change of direction (COD) courses for different locomotion speeds. Mean difference of GPS distance from
criterion distance expressed as a percentage ± 90% confidence intervals (n=20)
10 m 0-20 m 40 m 20-40 m 1 Hz 5 Hz 1 Hz 5 Hz 1 Hz 5 Hz 1 Hz 5 Hz Walk 2.2 ± 5.9 4.5 ± 5.8 2.3 ± 3.7 5.5 ± 3.5 4.3 ± 2.0 5.3 ± 2.1 0.4 ± 3.2 2.3 ± 2.5 Jog -10.3 ± 5.5 7.1 ± 4.9 -9.6 ± 3.9 3.2 ± 3.2 0.5 ± 2.4 2.4 ± 2.3 5.7 ± 3.7 4.5 ± 2.6 Stride -30.8 ± 6.6 -15.0 ± 6.6 -16.9 ± 4.4 -11.8 ± 3.4 -2.9 ± 2.4 -2.2 ± 2.4 9.1 ± 2.9 4.6 ± 1.9 Sprint -37.1 ± 6.9 -26.0 ± 5.8 -30.9 ± 4.7 -18.6 ± 3.6 -10.1 ± 2.4 -6.2 ± 2.5 1.9 ± 3.9 0.7 ± 2.7
Gradual COD Tight COD 1 Hz 5 Hz 1 Hz 5 Hz Walk -2.0 ± 2.4 -0.6 ± 2.3 -9.2 ± 3.3 -5.2 ± 3.1 Jog -6.1 ± 2.7 -2.3 ± 2.8 -13.4 ± 2.3 -7.1 ± 2.8
Stride -12.4 ± 3.0 -7.8 ± 3.1 -15.4 ± 2.7 -10.9 ± 2.8 Sprint -17.4 ± 3.0 -12.9 ± 3.0 -22.2 ± 3.3 -15.8 ± 3.0

83
Table 3-5: Reliability of GPS in straight line running at different speeds, distances and sample rates (n=20). TE = Typical Error with 90% confidence interval; CV
(%) = Coefficient of Variation; SWC = smallest worthwhile change.
Walk Jog Stride Sprint
TE (m)
CV (%)
SWC (m)
TE (m)
CV (%)
SWC (m)
TE (m)
CV (%)
SWC (m)
TE (m)
CV (%)
SWC (m)
1-Hz 10 m 2.4
(2.0-3.1) 30.8 0.5 2.4
(2.0-3.1) 34.7 0.5 2.8
(2.3-3.6) 58.8 0.6 3.1
(2.6-4.0) 77.2 0.6
20 m 3.1 (2.6-4.0)
20.4 0.7 2.9 (2.4-3.8)
20.9 0.7 4.4 (3.6-5.6)
33.3 0.8 4.3 (3.6 -5.5)
44.9 0.9
40 m 2.8 (2.3-3.6)
7.0 0.7 3.5 (2.9-4.5)
9.4 0.9 3.8 (3.1-4.8)
10.5 0.9 3.9 (3.2-5.0)
11.5 0.9
20-40 m 3.2 (2.6-4.0)
17.5 0.6 3.7 (3.1-4.8)
21.0 0.7 2.8 (2.3-3.6)
14.0 0.6 2.4 (2.0-3.1)
14.0 0.7
5-Hz 10 m 2.6
(2.1-3.3) 23.3 0.5 2.2
(1.8-2.8) 22.8 0.5 2.7
(2.2-3.4) 33.4 0.6 2.6
(2.1-3.3) 39.5 0.6
20 m 3.40 (2.8-4.4)
21.2 0.6 2.6 (2.1-3.3)
15.6 0.6 2.9 (2.4-3.7)
17.5 0.6 3.2 (2.7-4.2)
23.0 0.7
40 m 2.7 (2.2-3.4)
6.6 0.7 3.6 (2.9-4.6)
9.1 0.8 3.5 (2.9 4.5)
9.1 0.8 3.5 (2.9- 4.5)
9.2 0.8
20-40 m 2.4 (2.0-3.0)
12.1 0.5 2.3 (1.9-3.0)
12.3 0.5 1.6 (1.3-2.0)
8.0 0.4 1.7 (1.4-2.2)
9.8 0.5
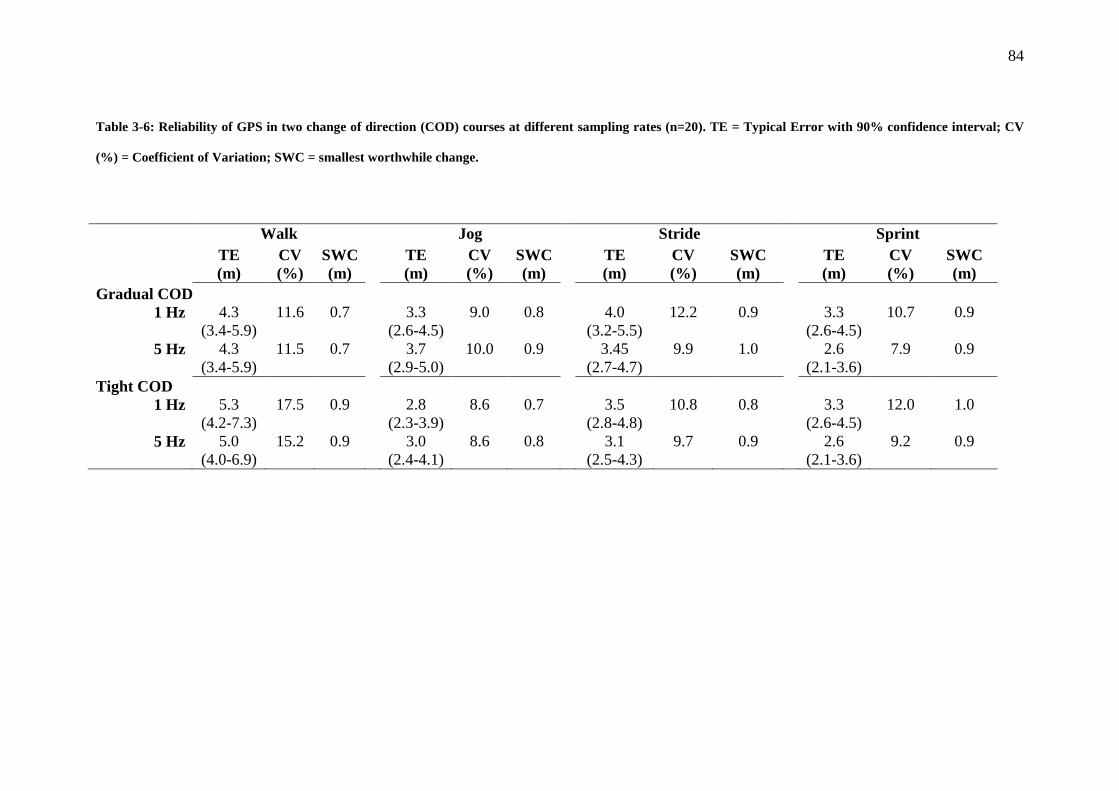
84
Table 3-6: Reliability of GPS in two change of direction (COD) courses at different sampling rates (n=20). TE = Typical Error with 90% confidence interval; CV
(%) = Coefficient of Variation; SWC = smallest worthwhile change.
Walk Jog Stride Sprint
TE (m)
CV (%)
SWC (m)
TE (m)
CV (%)
SWC (m)
TE (m)
CV (%)
SWC (m)
TE (m)
CV (%)
SWC (m)
Gradual COD 1 Hz 4.3
(3.4-5.9) 11.6 0.7 3.3
(2.6-4.5) 9.0 0.8 4.0
(3.2-5.5) 12.2 0.9 3.3
(2.6-4.5) 10.7 0.9
5 Hz 4.3 (3.4-5.9)
11.5 0.7 3.7 (2.9-5.0)
10.0 0.9 3.45 (2.7-4.7)
9.9 1.0 2.6 (2.1-3.6)
7.9 0.9
Tight COD 1 Hz 5.3
(4.2-7.3) 17.5 0.9 2.8
(2.3-3.9) 8.6 0.7 3.5
(2.8-4.8) 10.8 0.8 3.3
(2.6-4.5) 12.0 1.0
5 Hz 5.0 (4.0-6.9)
15.2 0.9 3.0 (2.4-4.1)
8.6 0.8 3.1 (2.5-4.3)
9.7 0.9 2.6 (2.1-3.6)
9.2 0.9
85
line values in jogging, striding and sprinting. However, CV values for COD walking
were larger than straight line walking.
The simulated team sport circuit showed good reliability with a CV of 3.6% for each
sample rate. However, the TE for 1 Hz: 4.6 m (4.1-5.3 m 90% CI) and 5 Hz: 4.7 m
(4.2-5.4 m 90% CI) was again greater than the SWC (1 Hz = 1.0 and 5 Hz =1.1 m).
3.4 Discussion
The first major finding of this study was that GPS grossly underestimated the criterion
distance during sprinting over short distances. This error was evident regardless of
sampling rate, although the higher sampling rate improved validity irrespective of
distance and locomotion in the straight line, COD and simulated running circuit trials.
The reliability of GPS improved as distance travelled increased but decreased as
speed increased. In agreement with previous research (Coutts & Duffield, 2010;
Edgecomb & Norton, 2006; MacLeod, et al., 2009; Peterson, et al., 2009) the GPS
devices have acceptable reliability and validity for assessing TD during longer
duration training drills and games. However, the current results show that these
devices cannot be used to measure brief, high-intensity sprints, or slow and fast
accelerations over distances of less than 20 m, regardless of sampling rate. The
present findings question the efficacy of using GPS technology to quantify high speed
movements and accelerations over short distances in team sports. The poor accuracy
of these devices for assessing brief accelerations and short sprints may be due to the
low number of position measures taken during brief efforts <3 s. However, changes in
velocity also seem to influence the accuracy of the measure. The present results show
that the 20-40 m distance measures (i.e. post-acceleration) are more accurate than the
0-20 m (i.e. acceleration) phase of the 40 m sprint/stride. This is likely to be
associated with the smaller variations in velocity in the final 20 m of these efforts.
86
Interestingly, there were lower bias values in the 20-40 m phase during sprinting and
walking compared to jogging and striding. The higher bias values when jogging and
striding might be due to players moving non-constant velocities during this part of the
test. However, it is suggested that future studies need to determine the influence of
changes in velocity on measurement error with GPS devices.
The measurement accuracy of GPS decreased during high-intensity COD movements
regardless of sample rate. The tight COD demonstrated lower validity than the gradual
COD, and this may be due to the increased number of speed changes in the tight COD
course. Nonetheless, at slow speeds, the GPS units appear to provide a valid measure
of distance for gradual COD activities.
The degree of reliability varied as a function of distance and intensity. In straight line
trials, the largest CV values occurred during striding and sprinting over shorter
distances. This is supported by the finding that reliability improved after the
acceleration phase of the 40 m strides and sprints. The poor reliability for these
shorter distances may demonstrate the inability of GPS to identify periods of rapid
variations in speed. These rapid accelerations over short distances are critical in team
sports such as AF, soccer, rugby union and hockey, with typical sprint ranges between
10-20 m (Dawson, et al., 2004b; Duthie, et al., 2006; Impellizzeri, et al., 2008;
Rampinini, Bishop, et al., 2007; Sirotic, et al., 2009; Spencer, et al., 2004). Given the
larger CV during short, high-intensity efforts, the use of GPS to assess running efforts
is inappropriate, especially if data is sampled at 1 Hz.
There was little difference in the reliability of GPS measures between the gradual and
tight COD course. Due to the regular changes in direction, acceleration was slower in
the agility courses than the straight line course. This most likely explains the
improved reliability with the COD courses compared to the straight line movements

87
of similar speeds. Higher sampling frequencies also improved the reliability during
high speed measures when sprinting through the COD courses. This suggests that
using GPS at a higher sampling rate is more suitable for use in team sports where
changes of direction are prevalent. It is possible that some of the error maybe due to
differences between the actual and intended pathway (Coutts & Duffield, 2010).
However, in this study error related to deviations from the intended pathway were
minimised with the use of poles placed at each COD and painted lines to ensure
minimal movement from the set course.
The simulated team sport circuit is more complex, consisting of a combination of
locomotion speeds over straight line and COD movements but over a longer distance.
The present results show that the validity and CV were similar to what has been
reported for 1 Hz GPS (Coutts & Duffield, 2010). The TD measured for longer team
sport bouts therefore has acceptable accuracy and reliability. Similar to straight line
running, longer durations and/or distances, as well as sampling rate improves the
measuring precision of these GPS devices.
Collectively, the present results show that the GPS devices used in this study have an
acceptable level of validity and reliability for recording movement patterns at lower
speeds and for higher sampling rates over longer efforts. The inability of these GPS
units to accurately assess movement during rapid variations in speed over short
distances, which are critical in team sports (Dawson, et al., 2004b; Duthie, et al.,
2006; Impellizzeri, et al., 2008; Rampinini, Bishop, et al., 2007; Sirotic, et al., 2009;
Spencer, et al., 2004), questions the usefulness of these devices for assessing small
segments of training or games. In this study, the higher sampling rate improved
validity regardless of distance and speed of movement during straight line, COD and
the simulated team sport running circuit. However, the poor reliability measures, in
88
relation to the SWC, suggest that the GPS provides information that currently is
unable to identify small changes of practical importance. In all cases, magnitude of
the typical error was substantially greater than the SWC.
3.4.1 Practical Applications
GPS micro-technology, such as GPS, is currently utilised in team sports to quantify
movement demands in both training and competition. This information can then be
utilised to modify the type, duration and intensity of training, improving the
specificity of these sessions. In agreement with previous research (Coutts & Duffield,
2010; Edgecomb & Norton, 2006; MacLeod, et al., 2009; Peterson, et al., 2009), the
reliability and validity of GPS to estimate longer distances appears to be acceptable
(i.e. <10%) for game and training purposes. However, currently available GPS
systems maybe limited for the assessment of brief, high speed straight line running,
accelerations or efforts involving a change of direction. These results also show that
an increased sample rate improves the reliability and validity of GPS devices. Further
development of GPS technology is required before practitioners can be confident
about the suitability of GPS for the quantification of short, high intensity intermittent
running movement patterns common in team sports. In particular, care needs to be
taken when interpreting data on single sprints or small changes in direction and
velocity. The degree of error may reduce the ability to report distance covered in
narrow speed zones. At present, practitioners may be limited to using variables such
as TD obtained for full matches or periods of play.

89
CHAPTER 4. VARIABILITY OF GPS UNITS FOR
MEASURING DISTANCE IN TEAM SPORT
MOVEMENTS
4.1 Introduction
Global positioning system (GPS) technology is commonly used for the quantification
of movement demands in team sports (Roberts, et al., 2006). Several studies have
investigated the reliability and validity of GPS devices for measuring movements and
velocities in different sporting activities (Coutts & Duffield, 2010; Duffield, et al.,
2009; MacLeod, et al., 2009). However, few have examined the between-unit
variation with 5 Hz GPS. Quantification of between-unit measurement variation
allows more accurate comparisons between players or bouts of activity. The aim of
this study was to examine the differences between distance measures of two GPS
units of the same model worn by the same player while performing movements
common to team sports.
4.2 Methods
Twenty elite AF players (mean (±SD) age, stature and body mass: 24 ±4 y, 188 ±7
cm, 87 ±9 kg, respectively) completed the straight line, change of direction (COD)
and team sport specific circuit trials. Eight elite male hockey players (mean (±SD)
age, stature and body mass: 22 ±4 y, 178 ±8 cm and 78 ±9 kg, respectively)
participated in the match play. This study conformed to the National Health and
Medical Research Council’s Statement on Human Experimentation. All athletes gave
informed consent following full disclosure of procedures.

90
4.2.1 Experimental design
The differences in distance measures obtained from two GPS units worn by the same
subject were assessed during two trials each of straight line locomotion at four speeds
and two COD courses (Figure 3.1). The antennas of each unit were exposed to allow a
clear satellite reception. Trials were completed on a grassed AF field, clear of large
buildings to enhance satellite reception.
Between unit variability for high speed running distance (HSR; running speed > 4.17
m.sec-1
The mean ±SD number of satellites during data collection for the straight line, COD,
simulated team sport running circuit and during match play were 8.2 ±0.6, 8.3 ±0.4
and 8.2 ±0.6, respectively. The mean HDOP during data collection was 1.5 ±0.28,
1.26 ±0.09 and 1.25 ±0.06 for straight line, COD and simulated team sport running
circuit, respectively. The number of satellites and HDOP (mean±SD) during match
play data collection for the three AHL games were 8.5 ±0.5 and 1.2 ±0.3; 7.8 ±0.4 and
1.1 ±0.1; and, 8.4 ±0.6 and 1.1 ±0.1 respectively.
) and TD were made using a team sport running circuit (Figure 3.2) and during
match play. Data from eight field players was collected during three AHL matches
during the 2009 season (n=24). Each game was played in the afternoon at the same
venue. In each trial subjects wore two 5 Hz GPS units (MinimaxX, Team 2.5,
Catapult Innovations, Scoresby, Australia) in a custom made harness with the units
located on the right and left scapula, approximately 25 cm apart.
4.2.2 Statistical Analyses
The percentage difference ±90% confidence interval (CI) was used to determine
differences between units. This was calculated using the following formulae: (Unit
B/Unit A) x 100/1.TD and HSR were chosen as variables during the team sport circuit

91
and match play as a result of the results of Chapter 3 (Coutts & Duffield, 2010).
4.3 Results
Table 4-1 summarizes the between-unit differences for straight line running and COD
courses at four different speeds. Differences (±90% CI) ranged from 9.9 ±4.7% to
11.9 ±19.5% for straight line movements and from 9.5 ±7.2% to 10.7 ±7.9% in the
COD courses. Similar results (Table4-2) were exhibited for TD and HSR distance in
the simulated team sport circuit and match play.

92
Table 4-1: Percent difference (±90% CI) of GPS monitoring between two units in straight line movements and two change of direction (COD) courses for different
locomotion speeds.
Straight line Change of Direction
0-10 m SWC 0-20 m SWC 0-40 m SWC 20-40 m SWC Tight SWC Gradual SWC
Walk 10.7 ±7.5 6.3 11.1 ±4.0 9.3 10.1 ±3.9 2.6 9.9 ±4.7 3.1 10.8 ±7.6 4.2 10.4 ±5.7 3.1
Jog 10.9 ±7.8 5.2 11.1 ±9.3 6.2 10.2 ±3.8 2.6 10.3 ±4.9 3.3 9.5 ±7.2 2.3 10.4 ±5.2 2.8
Stride 11.1 ±20.8 9.8 10.3 ±8.5 5.7 10.2 ±4.5 3.0 10.4 ±3.9 2.6 10.6 ±7.8 3.0 9.7 ±4.7 2.5
Sprint 11.9 ±19.5 11.0 10.3 ±8.1 5.4 10.7 ±6.3 3.4 10.5 ±5.2 3.4 10.7 ±7.9 2.4 10.0 ±3.8 2.1

93
Table 4-2: Percent difference (±90% CI) of GPS monitoring between two units during a team
sport circuit and match play. TD and high intensity running distance (HIR; running speed > 4.17
m.sec-1
) are represented.
4.4 Discussion
The present findings show a considerable degree of variation in distance measured
from two GPS units worn by the same player completing the same movement task.
Additionally, the variation between the two GPS units was similar regardless of the
movement pattern.
Whilst previous studies have examined the between-unit variability during cricket
(Peterson, et al., 2009) and tennis (Duffield, et al., 2009), only one study has reported
this error during field-based team sport specific movements (Coutts & Duffield,
2010). In that study 1 Hz GPS units, were used rather than the 5 Hz units used here. In
the present study, the magnitude of the between-unit difference for the team sport
circuit was 11.1±4.2% which is greater than that previously reported (coefficient of
variation: 3.5–6.6%) (Coutts & Duffield, 2010). The differences in the between-unit
variability reported in these studies maybe due to the different software and hardware
used to collect and treat the data. The present results showed that the level of
between-unit variation was consistent (~10%) regardless of distance (TD and HSR
distance), movement speed and change of direction. These findings have important
practical implications as when this between-unit difference is coupled with test-retest
Circuit SWC (m) Match Play SWC (m)
Total 11.1 ±4.2 1.5 10.3 ±6.2 1.9
HIR 11.6 ±9.3 3.2 10.3 ±15.6 3.1
94
error of GPS (Coutts & Duffield, 2010; Duffield, et al., 2009; Peterson, et al., 2009),
the ability to detect small differences between players may be limited.
4.4.1 Practical Applications
Therefore, to
minimise this source of measurement error, it is recommended that the same unit be
used for individual players during all exercise sessions. It is also recommended that
the between-unit measurement error should be considered if making comparisons
between players.
Analysis of external loads (i.e. total and HSR distance travelled) provides valuable
information regarding the physiological and performance requirements of team sport
athletes. It is common that sport scientists and coaches use distance measures from
matches or training drills to assess work demands and compare performance of team
sport athletes. These findings show that careful consideration should be given to the
between-unit variability when interpreting results, particularly when comparing
distance measures from players using different GPS units. Further work is required to
reduce the between-unit variability before comparisons between players can be
reliably performed.

95
CHAPTER 5. INTERNATIONAL FIELD HOCKEY
PLAYERS PERFORM MORE HIGH INTENSITY
RUNNING THAN NATIONAL LEVEL
COUNTERPARTS
5.1.1 Introduction
Hockey is a team sport played by both men and women, with major international
tournaments including the Champions Trophy (CT) and the Olympic games. The
Australian Hockey League (AHL) is the highest standard of domestic competition in
Australia and provides a pathway to international representation. The extent to which
the activity profiles in the AHL prepare players to make a successful transition to
international competition is not known.
Time–motion analysis provides valuable information regarding the activity profile of
players within a team sport (Bangsbo, et al., 1991; Krustrup, et al., 2005; Rampinini,
Coutts, et al., 2007), fatigue patterns during matches (Aughey, 2010; Mohr, Krustrup,
et al., 2003; Sirotic, et al., 2011) and/or the activity of different levels of competition
(Brewer, et al., 2010; Mohr, et al., 2008; Sirotic, et al., 2009). However, in
comparison to other team sports, there have been relatively few attempts to determine
the activity profile of high level hockey (Gabbett, 2010; Lothian & Farrally, 1994;
MacLeod, et al., 2007; Spencer, et al., 2004). Manual video-based time–motion
analysis demonstrated that international male hockey players spend most of a match
exercising at lower speeds (i.e. standing, walking, jogging), with a small proportion of
time (~5.6%) spent at higher speeds (striding and sprinting) and an occasional bout of
repeated sprint exercise (Spencer, et al., 2004). Additionally, elite hockey players
increase the time spent standing and reduce the time spent jogging from game 1 to

96
game 3 in an international hockey tournament, indicative of fatigue (Spencer et al.,
2005). However, whilst these studies provide useful information on some of the
physical requirements of international hockey, no studies have investigated the
activity demands of national level competition or compared these to the top level
international competition. Further, it is possible the game demands have changed in
the 5-6 years since these studies were completed.
As with soccer, hockey categorises players into three distinct positional groups
(strikers, midfielders and defenders). Currently no studies have described the specific
physical requirements of positional groups within male international or national level
field hockey. Understanding the activity profile necessary for success in hockey
players according to their positional role during competitive matches (i.e. distance
covered and intensity) is necessary to develop sport-specific training protocols.
Additionally, the amount of HSR is an important discriminator between elite and sub-
elite team sport athletes (Mohr, Krustrup, et al., 2003). To date however, no studies
Therefore, the purpose of this study was to examine several aspects of elite hockey
running performance. The three specific aims of this study were to determine: 1) the
activity profile of national and international hockey competitions, specifically the
influence of competition level on HSR; 2) if playing position within a level of
competition influences the activity profile; and 3) if the movement characteristics are
different between each half of a match.
have investigated differences in HSR between playing positions, competition levels or
during each half in male hockey.
5.2.1 Experimental Approach to the Problem
The activity profile of national and international level tournaments were examined
using GPS technology. Specifically, the level of competition, playing position and

97
differences existing between the first and second half were investigated. Players were
separated into three distinct positional groups (strikers, midfielders and defenders) for
positional comparison. An understanding of the positional requirements during
tournament play is important for monitoring performance and effectively planning
player preparation programs.
5.2.2 Subjects
Sixteen national level hockey players (mean (±SD) age, stature and body mass: 22 ±4
y, 178 ±8 cm and 78 ±9 kg, respectively) were assessed while competing in the 2008
AHL. To evaluate international competition, sixteen male hockey players (mean
(±SD) age, stature and body mass: 27 ±4 y, 179 ±5 cm and 77 ±5 kg, respectively)
from the Australian men’s hockey team where analysed while competing in the 2009
CT. Only one player competed in both tournaments. Goalkeepers were excluded from
this study. This study conformed to the National Health and Medical Research
Council’s Statement on Human Experimentation. All athletes gave informed consent
following full disclosure of procedures.
Endurance performance was measured using the multi-stage fitness test (MSFT),
whereby subjects run back and forth on a 20 m course and touch the 20 m line; at the
same time a sound signal is emitted from a pre-recorded tape (Ramsbottom, Brewer,
& Williams, 1988). The intraclass correlation coefficient (ICC) for test-retest
reliability and typical error of measurement (TEM) for the MSFT were 0.93 and
3.5%, respectively (Leger & Lambert, 1982).
5.2.3 Study Design and Procedures
Time-motion analyses were conducted during the national level AHL (six round
matches followed by a semi-final and final) and the international level CT (five round
matches and a final). During each match 16 players each wore a GPS unit

98
(MinimaxX, Team 2.5, Catapult Innovations, Scoresby, Australia) in a custom pocket
in the player uniform, located between the scapulae. The antennas of each unit were
exposed to allow a clear satellite reception. The number of satellites during data
collection for the AHL and CT competition were 8.5 ±0.7 and 8.3 ±0.6, respectively.
The mean HDOP, during data collection was 1.50 ±0.26 and 1.25 ±0.16 for, AHL and
CT competition, respectively. A sample rate of 5 Hz was used for data collection. To
limit error, each player wore the same unit for the duration of the competition. The
following parameters were assessed for both national (AHL) and international level
competitions (CT): TD, also expressed in meters covered per minute (m·min-1), HSR
(running speed >4.17 m·s-1) distance, and lower speed running (LSR; 0.10-4.17 m·s-1
Coutts & Duffield, 2010
).
These measures have demonstrated acceptable levels of reliability for assessing team
sport activity demands using GPS ( ).
The distances from each field position, not the individual players, were used to
describe the positional activity profile (Spencer, et al., 2004). For example, when
several players played in one position, the activity profile was recreated by combining
data from each substitute playing in that position. The match data was then divided
into activity profile for each half of each match in both competitions.
5.2.4 Statistical Analyses
Descriptive data for both competitions is presented as mean ± SD. All other variables
were log transformed to reduce bias due to non-uniformity of error and analyzed using
the ES statistic with 90% CI and percent difference to determine the magnitude of
effects using a custom spreadsheet (Hopkins, 2003). Mean differences in MSFT
performance between competition levels and activity demands (TD, m·min-1
Hopkins, 2003
, HSR,
LSR) between positions, competition levels and halves, were assessed using a
customized spreadsheet ( ). Differences were classified as substantial

99
when there was a ≥ 75% likelihood of the effect being equal to or greater than 0.2, and
classified as small 0.2-0.6; moderate 0.6-1.2; large 1.2-2.0; and very large 2.0-4.0
(Cohen, 1988). Effects with less certainty were classified as trivial and where the
±90% CI of the ES crossed the boundaries of ES -0.2 and 0.2, the effect was reported
as unclear.
5.3 Results
This statistical approach was utilized to identify meaningful differences
whilst accounting for the precision of measurement through confidence intervals.
Players competing in international competition had a 10.1% greater MSFT
performance than those competing at the national level (2859 ±223 vs. 2568 ±194 m,
ES=1.35). The TD travelled independent of positional groups throughout the 70-mins
of play was 9776 ±720 m and 8589 ±623 m for CT and AHL matches, respectively.
International players performed 42.0% more HSR (2294 ±433 vs. 1652 ±416 m;
ES=1.45) and 7.6% more LSR (7441 ±511 vs. 6905 ±447 m, ES=1.45) than national
players. During CT, midfielders had greater HSR distance, but similar LSR distance
compared to strikers (Table 5-1). Defenders performed substantially less HSR than
strikers (Table 5-1). Moreover, the HSR distance differed markedly between the three
positions, with defenders covering the least HSR (1728 ±201 m).
Within the AHL, there were no differences between strikers and midfielders for TD or
m·min-1. However, the strikers completed more HSR (striker: 1896 ±368 m; midfield
1778 ±387 m) but there was little variation in LSR distances. Similar to the CT, the
AHL defenders covered less distance in all variables in comparison to the strikers and
midfielders, (Table 5-2). Strikers and midfielders had greater HSR during AHL than
defenders (Table 5-2). In contrast to CT, AHL midfielders covered more HSR than
strikers (10.1 ±7.4%). In general, CT had greater movement demands than AHL
(Table 5-2). However, the greatest difference between competition levels was

100
observed in HSR with AHL strikers, midfielders and defenders, performing less HSR
than players competing in the same positions in CT.
The TD covered decreased in the second halves across all positions in both the CT
(6.1 to 7.5%) and the AHL (2.4 to 4.7%, Table 5-3). In CT, the strikers also
demonstrated a 6% reduction in LSA in the second half. In contrast the strikers in
AHL demonstrated moderate changes in time−motion variables. Midfielders during
both levels of competition showed decreases in distances across all variables from the
first to second half. Similarly, the defenders in both the CT and the AHL showed
decreases in TD, m·min-1
5.4 Discussion
and LSA but maintained the ability to perform HSR
between the first and second halves.
The main finding of this study was that international players completed more HSR
across all positions than players at an elite national level. In both competitions,
midfielders and strikers performed more HSR than defenders and the activity
demands of players decreased in the second half.
The present study demonstrated that international players covered a greater TD and
HSR distance than the national level competition. Our hockey results agree with some
(Andersson, et al., 2010; Mohr, Ellingsgaard, Andersson, Bangsbo, & Krustrup, 2003;
Mohr, et al., 2008) but not all previous studies (Bradley, et al., 2009) that have
reported greater TD in higher level soccer competition. Elite AF also has higher TD
and number of high intensity efforts than sub-elite competition (Brewer, et al., 2010).
However, care must be taken in comparing data between these sports as each have
different rules (i.e. field size, match duration, player substitution and rotation) and
also different match analysis methods have been used (e.g. GPS, semi-automated
computerized systems and manual video-based analysis). Nonetheless, it seems that

101
international hockey has greater physical demands than the AHL. These findings
should be taken into account when planning to use AHL to prepare players for future
international competition. In support of recent research (Andersson, et al., 2010;
Mohr, et al., 2008) reporting differences in HSR profiles between international and
elite domestic soccer players, we also found that international field hockey
competition has greater HSR demands than national level competition. There are
several possible explanations for the differences in HSR between competitions. The
most likely explanation in this study is the greater endurance capacity of the
international players when compared to AHL players.
Furthermore, as the aerobic fitness of soccer players increased, match running
performance also improved (Helgerud, et al., 2001; Impellizzeri et al., 2006). Indeed,
a 10% increase in V O2max
Helgerud, et al., 2001
resulted in a 20% increase in match running distance in
young elite players in one study ( ). Similarly, a 7% increase in V
O2max
Impellizzeri, et al., 2006
resulted in a 6% increase in TD and 18% increase in high intensity activity
during soccer match play of elite juniors ( ). Interestingly, the
magnitude of change in aerobic fitness reported in these previous training studies is
similar to the difference between the international and national players’ aerobic
capacity in this study.
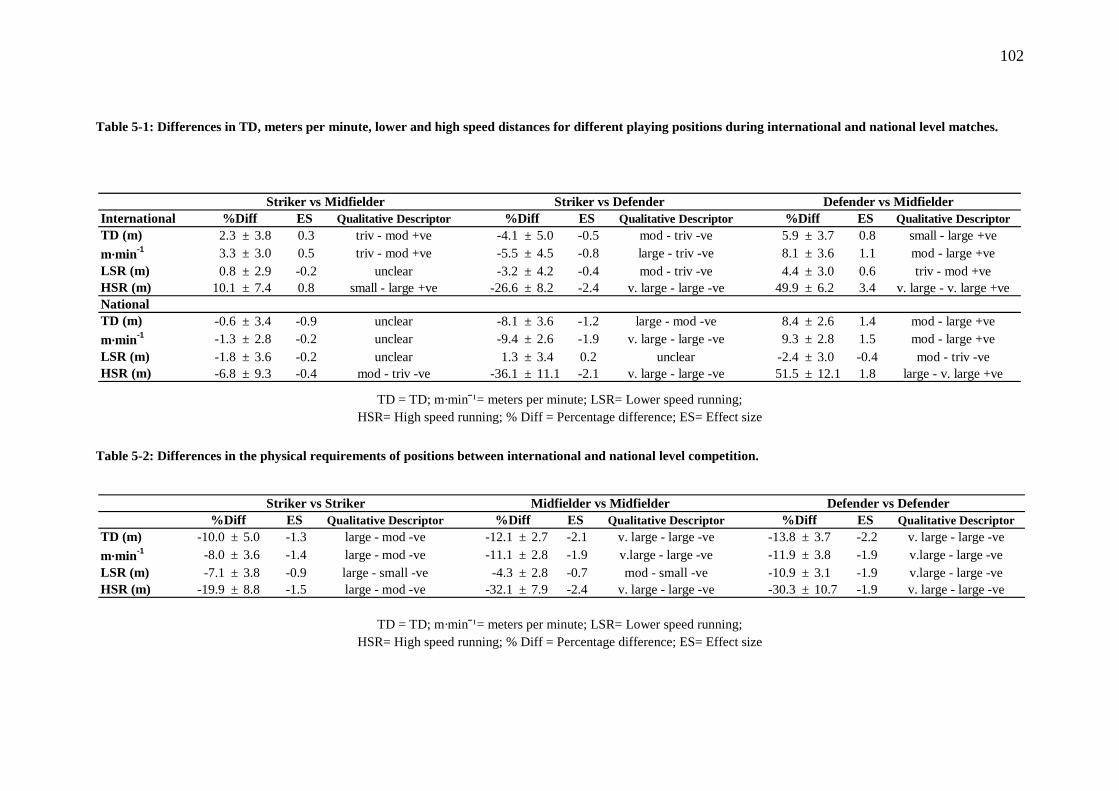
102
Table 5-1: Differences in TD, meters per minute, lower and high speed distances for different playing positions during international and national level matches.
TD = TD; m·minˉ¹= meters per minute; LSR= Lower speed running;
HSR= High speed running; % Diff = Percentage difference; ES= Effect size Table 5-2: Differences in the physical requirements of positions between international and national level competition.
TD = TD; m·minˉ¹= meters per minute; LSR= Lower speed running; HSR= High speed running; % Diff = Percentage difference; ES= Effect size
International ES Qualitative Descriptor ES Qualitative Descriptor ES Qualitative DescriptorTD (m) 2.3 ± 3.8 0.3 triv - mod +ve -4.1 ± 5.0 -0.5 mod - triv -ve 5.9 ± 3.7 0.8 small - large +vem·min-1 3.3 ± 3.0 0.5 triv - mod +ve -5.5 ± 4.5 -0.8 large - triv -ve 8.1 ± 3.6 1.1 mod - large +veLSR (m) 0.8 ± 2.9 -0.2 unclear -3.2 ± 4.2 -0.4 mod - triv -ve 4.4 ± 3.0 0.6 triv - mod +veHSR (m) 10.1 ± 7.4 0.8 small - large +ve -26.6 ± 8.2 -2.4 v. large - large -ve 49.9 ± 6.2 3.4 v. large - v. large +veNational TD (m) -0.6 ± 3.4 -0.9 unclear -8.1 ± 3.6 -1.2 large - mod -ve 8.4 ± 2.6 1.4 mod - large +vem·min-1 -1.3 ± 2.8 -0.2 unclear -9.4 ± 2.6 -1.9 v. large - large -ve 9.3 ± 2.8 1.5 mod - large +veLSR (m) -1.8 ± 3.6 -0.2 unclear 1.3 ± 3.4 0.2 unclear -2.4 ± 3.0 -0.4 mod - triv -veHSR (m) -6.8 ± 9.3 -0.4 mod - triv -ve -36.1 ± 11.1 -2.1 v. large - large -ve 51.5 ± 12.1 1.8 large - v. large +ve
Striker vs Midfielder Striker vs Defender Defender vs Midfielder%Diff %Diff %Diff
ES Qualitative Descriptor ES Qualitative Descriptor ES Qualitative DescriptorTD (m) -10.0 ± 5.0 -1.3 large - mod -ve -12.1 ± 2.7 -2.1 v. large - large -ve -13.8 ± 3.7 -2.2 v. large - large -vem·min-1 -8.0 ± 3.6 -1.4 large - mod -ve -11.1 ± 2.8 -1.9 v.large - large -ve -11.9 ± 3.8 -1.9 v.large - large -veLSR (m) -7.1 ± 3.8 -0.9 large - small -ve -4.3 ± 2.8 -0.7 mod - small -ve -10.9 ± 3.1 -1.9 v.large - large -veHSR (m) -19.9 ± 8.8 -1.5 large - mod -ve -32.1 ± 7.9 -2.4 v. large - large -ve -30.3 ± 10.7 -1.9 v. large - large -ve
Striker vs Striker Midfielder vs Midfielder Defender vs Defender%Diff %Diff %Diff

103
Table 5-3: Table 13: TD, meters per minute, low and high speed distances comparisons during first and second half during international and national level
matches.
TD = TD; m·minˉ¹= meters per minute; LSA= Low speed running; HSR= High speed running; % Diff = Percentage difference; ES= Effect size
International ES Qualitative Descriptor ES Qualitative Descriptor ES Qualitative DescriptorTD (m) -6.1 ± 7.0 -0.6 large-trivial -ve -7.5 ± 4.1 -0.8 large-small -ve -6.9 ± 5.6 -0.7 large-trivial -vem·min-1 -3.3 ± 5.9 -0.4 unclear -5.9 ± 4.2 -0.6 mod -small -ve -4.6 ± 5.5 -0.5 mod - triv -veLSR (m) -6.0 ± 6.6 -0.7 large-triv -ve -6.7 ± 4.2 -0.7 mod -small -ve -6.9 ± 5.7 -0.7 large-trivial -veHSR (m) -6.8 ± 11.2 -0.5 unclear -8.7 ± 6.8 -0.6 mod - triv -ve -4.9 ± 9.8 -0.3 unclearNationalTD (m) -4.3 ± 3.5 -0.6 mod - triv -ve -4.7 ± 4.9 -0.5 mod - triv -ve -2.4 ± 3.4 -0.7 mod - triv -vem·min-1 -3.2 ± 4.1 -0.4 mod - triv -ve -4.8 ± 2.9 -0.8 large-small -ve -2.8 ± 3.0 -0.5 mod - triv -veLSR (m) -4.2 ± 4.5 -0.5 mod - triv -ve -2.3 ± 4.0 -0.3 mod - triv -ve -3.2 ± 3.0 -0.5 mod - triv -veHSR (m) -8.6 ± 11.9 -0.4 mod - triv -ve -8.1 ± 12.2 -0.4 mod - triv -ve -1.0 ± 13.7 -0.3 unclear
Striker Midfield Defender %Diff %Diff %Diff
104
In addition to physical fitness, other factors may explain the differences in the activity
demands between the different competition levels. For example, differences in tactics,
technical abilities, or the quality of the opposition could affect the movement demands
in hockey. Several studies from professional soccer have shown these to be factors
that affect the amount of HSR performed (Bradley, et al., 2009; Rampinini, et al.,
2008; Rampinini, et al., 2009). The activity profiles could have been further
influenced by motivational factors, such as the competitive importance placed on the
game or the coaches use of the continuous substitutions rule throughout the match
(Brewer, et al., 2010; Di Salvo, et al., 2009; MacLeod, et al., 2007; Mohr, Krustrup, et
al., 2003). Many factors influence the differences in HSR between competitions.
These should be taken into account when interpreting differences between positional
demands in each competition level.
The present study confirmed that there were positional differences in activity profiles
in both the CT and AHL. In the AHL, both the strikers and midfielders covered
greater distance than defenders. In contrast, in women’s AHL, midfielders and
defenders covered the greater TDs than strikers (Gabbett, 2010). This difference may
be due to the variations in the tactical requirements of specific positions and playing
styles of teams. In CT, there were smaller differences in the TD between these playing
positions. It is possible that these positional differences are due to the greater physical
capacity or tactical strategies employed by the defenders at this level. Further research
that investigates the relationship between technical/tactical skills and physical
performance is required to elucidate these positional differences.
Different positional requirements were also observed for HSR in both competitions.
Specifically, midfielders and strikers covered more HSR than defenders regardless of
105
competition level. This observation is in accordance with female AHL competition
where midfielders covered more distance in HSR than strikers and defenders
(Gabbett, 2010). Moreover, it was reported from one international hockey match that
midfielders and strikers also had a higher sprint frequency than defenders (Spencer, et
al., 2004). However, direct comparison with these previous studies is difficult due to
the different match analysis methods used. The present information may assist the
physical preparation of talented national level players, enabling them to make a
successful transition to international match play.
In the current study, the positional activity profile decreased in the second half for
both competitions. These findings agree with soccer research that demonstrated a
reduction in TD covered in the second half compared with the first (Bangsbo, et al.,
1991; Mohr, Ellingsgaard, et al., 2003). Others have shown decreased positional and
movement demands during the second half of elite (Coutts, et al., 2010) and sub-elite
AF matches (Brewer, et al., 2010). However, unlike the current study, no differences
were found between the elite and sub-elite AF leagues (Brewer, et al., 2010).
Additionally, the amount of HSR was significantly reduced in hockey (MacLeod, et
al., 2007), soccer (Krustrup & Bangsbo, 2001; Mohr, Ellingsgaard, et al., 2003) and
rugby league (Sirotic, et al., 2009) in the second half of matches. In comparison, the
current study showed only small changes in HSR for midfielders (CT and AHL) and
strikers (AHL) from the first to second halves, whilst, defenders maintained the
amount of HSR during the match in both competitions.
The use of distances from each field position, not the individual players, to describe
the positional demands may have protected anticipated declines in HSR from the first
to second halves. Also, the smaller decrease in HSR in the present study may be
related to the unlimited substitution rule as well as positional and tactical
106
requirements of defenders employed during both competitions. It is likely that the
coaches manage player rotations in hockey to maintain the exercise intensity of the
team. Future studies should examine the relationship between player rotation and
activity demands in hockey.
In summary, the present study demonstrated that international competition
substantially increases the positional movement of hockey athletes, with greater HSR
at the international level. Additionally, positional differences with midfielders and
strikers performing more HSR than defenders were observed. Finally, results
indicated that regardless of playing level, players had reduced running and were
unable to maintain the demands in the second half of a match. However, further
research is required to confirm optimal strategies for preparing hockey players for the
demands of international competition.
5.5 Practical Applications
These results can be used by coaches to develop specific tactical and rotational
strategies which attempt to maintain the level of HSR throughout a match. Differences
in HSR and aerobic capacity between levels highlight one area of improvement
required by national level players. Whilst the activity profile of CT competition
suggests a need for greater aerobic capacity development in international players, it is
not clear from the current study whether the fitness levels of the players in examined
here is due to the demands of international training and competition or was in fact
present initially and acted as a discriminator for selection. It is possible that both
natural selection and the training process have played a role. Players at the national
level may require additional conditioning to achieve the higher aerobic capacity
required if aspiring to international representation. The relatively large difference in
HSR between the two levels shows the importance of being able to perform greater

107
amounts of HSR and to recover from these actions throughout the game. Thus the
training of elite hockey players should focus on improving their ability to perform
intense exercise and to recover rapidly from periods of high-intensity running. Finally,
emphasis should be placed in the individualization of conditioning programs to
address the specific demands of the different playing positions. Specific game related
training drills may be used to address this need.

108
CHAPTER 6. GPS ANALYSIS OF INTERNATIONAL
FIELD HOCKEY TOURNAMENT
6.1 Introduction
Hockey is an international sport played at many standards, ranging from amateur to
elite level. The most important international competitions are the CT and the Olympic
games. The CT consists of the top six ranked countries playing a round-robin style
tournament, within a period of nine days. This schedule may involve intense periods
where teams are required to play up to three matches in four days. With limited time
to recover before the next match and an increased importance of match outcomes as
the tournament progresses, the ability to maintain exercise intensity across a
tournament could be important as it is possible players will experience accumulated
fatigue.
International male hockey players spend most of a match exercising at low intensity
(i.e. standing, walking, jogging), with a small proportion of time (~5.6%) spent at
higher intensities (striding and sprinting) and an occasional bout of repeated sprint
exercise (Lythe & Kilding, 2011; Spencer, et al., 2004). Several studies have shown a
decrement in physical performance during soccer matches (Mohr, Krustrup, et al.,
2003; Mohr, et al., 2005; Rampinini, Coutts, et al., 2007). In particular, some studies
have shown that HSR and sprinting decrease between the first and second half. This
decline in physical activity has been linked to match related fatigue (Bangsbo, et al.,
2006; Mohr, Krustrup, et al., 2003; Mohr, et al., 2005). Similar findings have been
observed in elite female hockey players with a decline in high intensity exercise in the
second half of matches (MacLeod, et al., 2007). However, other studies from elite
men’s hockey have shown that the distance covered at HSR did not decrease as the

109
halves progressed (Lythe & Kilding, 2011; Spencer, et al., 2004). Differences in the
results may be due to the data collection method used in these time-motion analysis
studies (i.e. GPS vs. Video-based). Additionally, these time-motion analysis methods
may not have been sensitive enough to detect HSR. The use of subjective techniques
(MacLeod, et al., 2007; Spencer, et al., 2004) and more recently, data collection using
1 Hz GPS units (Lythe & Kilding, 2011) to describe player activity may not be
sensitive enough to accurately categorise high intensity running distances. Several
studies have shown that HSR is important to performance in team sports (Di Salvo, et
al., 2009; Mohr, Krustrup, et al., 2003; Rampinini, Coutts, et al., 2007). Indeed, in
soccer HSR differentiates between the tactical roles of players (Di Salvo, et al., 2007)
as well as being related to the overall success of a team (Rampinini, Coutts, et al.,
2007). However, the extent to which playing position influences high speed running
performance in elite hockey across a tournament is currently unknown (Chapter 5).
Only one study has examined changes in activity profiles over a tournament scenario
in elite hockey players using video-based time-motion analysis. During the
tournament investigated, players increased the time spent standing and reduced the
time spent jogging from match 1 to match 3, indicative of fatigue. In that study,
residual fatigue was evident in subsequent matches when players competed in three
hockey matches within a four-day time period. However, during major international
tournaments, more than three matches are played. For example, the CT consists of six
matches played over a period of nine days. Thus the fatigue experienced by players
competing in the CT may be even greater than previously reported (Spencer, et al.,
2005), although this is yet to be investigated.
Information on the activity profile of players in a single match may provide valuable
information on positional profiles in hockey. However a detailed analysis throughout

110
a tournament could provide a greater insight into these requirements over the duration
of such competitions. Previous studies examining activity profiles in a tournament
have compared subsequent matches to the first match played within a tournament
(Montgomery, et al., 2008; Rowsell, et al., 2007). Whilst this approach provides a
comparison with a theoretically 'fatigue-free' baseline (i.e. match 1), results may be
heavily influenced by tactics, opposition, environmental and other factors related to
the first match. This is especially the case in quasi-experimental studies that have
analysed activity profiles of teams participating in international competitions.
Therefore, this method of analysis may be limited. An analysis method that may
ameliorate some of the limitations of this approach is to compare activity profiles of
players in each match within a tournament to the typical or average match
requirements of that team participating within the tournament. Although each method
of comparison has limitations, performing both levels of analysis may potentially
provide a more complete understanding of the changes in exercise intensity within an
international tournament.
Therefore the purpose of this study was to investigate the influence of multiple
matches on exercise intensity during a world class hockey tournament. The specific
aims of this study were to determine: (1) if the mean match intensity changed
throughout a tournament, specifically HSR; and (2) if playing position influences
movement output across the tournament.
6.2 Methods
Sixteen male field hockey players (mean (±SD) age, stature and body mass, estimated
V O2max: 27 ±4 y, 179 ±5 cm, 77 ±5 kg and 64.2 ± 3.1 ml.kg-1min-1, respectively) from
the Australian field hockey team were investigated while competing in the 2009 CT,
held in Melbourne, Australia. Goalkeepers were excluded from this study. This study

111
conformed to the National Health and Medical Research Council’s Statement on
Human Experimentation. All athletes gave informed consent following full disclosure
of procedures.
6.2.1 Experimental design
Time-motion analyses were conducted during the international level CT which
consisted of five round matches and a final. The matches were played in a stable
ambient temperature (i.e., temperature ranged between 22 °C and 26 °C). The six
matches were played over nine days, with a rest day separating matches two and
three, three and four, and four and five. Each match consisted of two 35 minute halves
and was played under FIH rules which allow for the use of unlimited substitutions.
During each match 15 players (N=15) each wore a GPS unit (MinimaxX, Team 2.5,
Catapult Innovations, Scoresby, Australia) in a custom pocket in the player uniform,
located between the scapula. The antennas of each unit were exposed to allow a clear
satellite reception. The number of satellites and the mean HDOP during data
collection was 8.3 ±0.6 and 1.25 ±0.2, respectively. A sample rate of 5 Hz was used
for data collection. To limit error, each player wore the same unit for the duration of
the competition (Coutts & Duffield, 2010).
The distances from each field position, not the individual players, were used to
describe the positional activity profile (Lythe & Kilding, 2011; Spencer, et al., 2004).
For example, when several players played in one position, the activity profiles were
recreated by combining data from each substitute playing in that position. The
rotational strategy was predetermined and the timing of each substitution recorded
during the match. The match data was then divided into activity profiles for three
distinct positional groups; strikers, midfielders and defenders.
112
The following parameters were assessed during the matches: TD, HSR (running speed
>4.17 m·s-1) distance and LSR (0.10-4.17 m·s-1
Data from each position across the tournament was averaged to calculate the
tournament average (TA). This information was divided into positional groups for the
above parameters. Each of the round matches and final was then compared to the TA
to determine changes in exercise intensity.
). These measures are more reliable for
assessing team sport activity patterns than using narrow speed bands (especially at
higher speeds) when using GPS (Chapter 3).
6.2.2 Statistical Analyses
Descriptive data is presented as mean ± SD. All other variables were log transformed
to reduce bias due to non-uniformity of error and analyzed using the ES statistic with
90% CI and percent difference to determine the magnitude of effects using a custom
spreadsheet (Hopkins, 2003). Mean differences in movement demands (TD, HSR,
LSA) between positions and matches, were assessed using a customized spreadsheet
(Hopkins, 2003). Likely differences between means of less than 75% were considered
to not be practically important (Cormack, Newton, & McGuigan, 2008). The
likelihood of a > 75% difference in means was accepted as representing a practically
meaningful difference. Differences > 95% and >99% were classified as very likely
and almost certainly, respectively (Hopkins, 2003).
6.3 Results
Table 6-1 illustrates the match score against each of the opponents during the CT
tournament. The mean (±SD) number of substitutions per match was 65 ±2 with the
same substitution strategy used across each positional group in each match. Individual
match running performance as well as tournament average for TD, LSA and HSR is
shown in Table 6-2.

113
Table 6-1: Round, opponent and result for Australian men’s field hockey team in the Champions
Trophy 2009
Table 6-2: Mean match running performance (meters) during an international field hockey
tournament
TD= TD; LSA = Low speed activity distance; HSR= High speed running distance; TA= Tournament
Average (mean± SD)
6.2.3 Comparison to Match 1
Differences in TD, LSA and HSR distance for different playing positions when
compared to the match 1 are shown in Table 6-3. The overall physical output (TD,
LSA, and HSR) of the strikers was lower in matches 3 and 5 when compared to match
1. The strikers completed less LSA in all matches, except for match 4 a loss against
Germany. The HSR decreased in matches 3, 5, 6 however, no variation was found in
matches 2 and 4.
Round 1 2 3 4 5 6 (Final)Opponent Korea Holland England Germany Spain GermanyResult 4-0 7-2 2-1 1-3 10-3 5-3
OPPONENTTD (m) 10787 ± 211 9791 ± 40 8956 ± 343 10530 ± 773 9211 ± 288 9638 ± 253 5506 ± 4984LSA (m) 8013 ± 80 7354 ± 2 6944 ± 166 7951 ± 232 6975 ± 52 7192 ± 132 4087 ± 3826HSR (m) 2706 ± 57 2382 ± 16 1975 ± 89 2497 ± 202 2160 ± 140 1418 ± 77 1240 ± 1138
OPPONENTTD (m) 10336 ± 208 10342 ± 332 10185 ± 195 10310 ± 297 9900 ± 180 9883 ± 329 5652 ± 5182LSA (m) 7642 ± 67 6889 ± 47 7387 ± 31 7677 ± 133 7223 ± 11 7357 ± 35 4042 ± 3820HSR (m) 2787 ± 65 2536 ± 120 2597 ± 169 2545 ± 25 2399 ± 88 2459 ± 10 1435 ± 1289
OPPONENTTD (m) 9514 ± 21 9433 ± 474 9871 ± 47 10251 ± 30 8638 ± 516 9010 ± 314 5255 ± 4843LSA (m) 7600 ± 135 7706 ± 370 7936 ± 30 8310 ± 170 7200 ± 126 7363 ± 194 4268 ± 3938HSR (m) 1887 ± 83 1675 ± 13 1837 ± 18 1868 ± 128 1418 ± 120 1716 ± 98 978 ± 877
Spain Final
Korea Holland England Germany Spain Final TA
STRIKER TA
MIDFIELDTA
DEFENDER
Korea Holland England Germany Spain Final
Korea Holland England Germany

114
Compared to match 1, variations in TD covered by the midfielders were only
demonstrated in matches 5 and 6 with less distance covered in these matches. The
greatest variation was observed in HSR distance. In all matches, when compared back
to match 1, less HSR distance was performed. However, the amount of HSR did not
decrease as the tournament progressed.
With the exception of match 4 (a loss to Germany), there was relatively little variation
in the movement characteristics of the defenders during the tournament. In match 4,
the defenders had higher TD and LSR distance. In matches with a definitive winning
score line (greater than 2 goals), defenders performed less HSR.
All positions showed the lowest physical output in match 5 where the team won by a
large margin (10-2 vs. Spain). Only the defenders LSR did not conform to this pattern
with no clear difference observed.
6.2.4 Comparison to Tournament Average (TA)
Comparisons between individual matches and the TA characteristics for strikers,
midfielders and defenders are shown in Table 6-4. There were no practically
important differences between the variables in TD for strikers, except between match
1 and 4. Within these matches, strikers covered a greater distance than the TA. Also,
the strikers LSA distance decreased in match 3, but increased in match 4 which
coincided with a defeat against Germany.
Midfielders and defenders showed far more variation in each match when compared
to the TA. Midfielders covered less distance in match 5 and 6. Match 1 and 6
provided the greatest variation in HSR, with midfielders performing more HSR in
match 1 but less in match 6. Increases in LSR were evident in match 1 and 3; however
less distance was covered in match 2 when compared to the TA.
115
Defenders showed the largest variations in distance in each movement category of all
positions. All three variables were higher in matches 3 and 4 when compared to the
TA. More HSR was completed in matches 1, 3 and 4 when compared to the TA.
Interestingly, match 5, where the team won by the largest margin (10-3), defenders
decreased in all variables. However, in the other match with a large winning score line
(match 2: 7-2) no clear difference was observed.
6.3 Discussion
This is the first study to investigate the activity profile of elite field hockey players
during the CT. Results indicate that this elite team was able to maintain exercise
intensity when playing six matches in a period of nine days. These results are in
contrast to previous investigations of tournament play in field hockey. Only one study
has examined fatigue over a tournament scenario in elite hockey players (Spencer, et
al., 2005). In that study, players increased the time spent standing and reduced the
time spent jogging from match 1 to match 3, suggestive of fatigue. In contrast, when
assessing LSR across all positions in the current study this was not evident. Only
strikers followed a similar pattern. This was only apparent when each match was
compared to the first match. No distinct pattern was observed when comparing back
to the TA. However, direct comparison with these previous studies is difficult due to
the different match analysis methods used (e.g. GPS and manual video-based
analysis). Further, it is possible that activity profiles have changed in the 5-6 years
since the earlier study was completed.
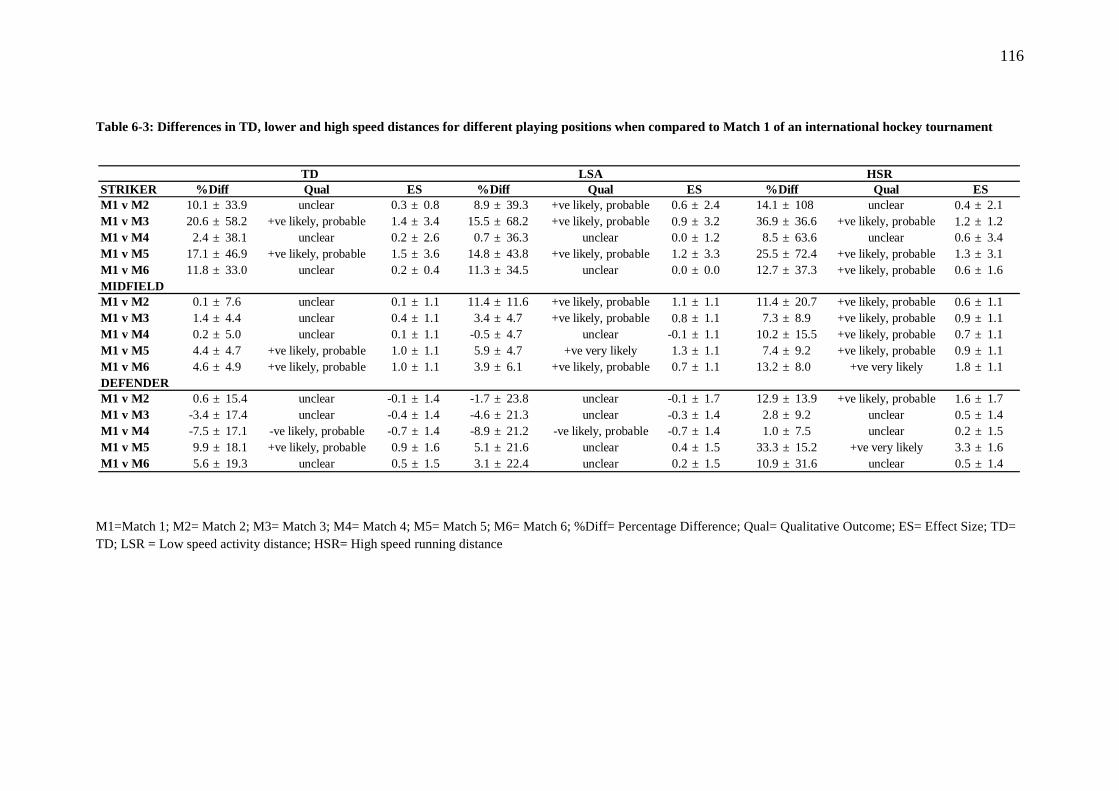
116
Table 6-3: Differences in TD, lower and high speed distances for different playing positions when compared to Match 1 of an international hockey tournament
M1=Match 1; M2= Match 2; M3= Match 3; M4= Match 4; M5= Match 5; M6= Match 6; %Diff= Percentage Difference; Qual= Qualitative Outcome; ES= Effect Size; TD= TD; LSR = Low speed activity distance; HSR= High speed running distance
STRIKER Qual Qual QualM1 v M2 10.1 ± 33.9 unclear 0.3 ± 0.8 8.9 ± 39.3 +ve likely, probable 0.6 ± 2.4 14.1 ± 108 unclear 0.4 ± 2.1M1 v M3 20.6 ± 58.2 +ve likely, probable 1.4 ± 3.4 15.5 ± 68.2 +ve likely, probable 0.9 ± 3.2 36.9 ± 36.6 +ve likely, probable 1.2 ± 1.2M1 v M4 2.4 ± 38.1 unclear 0.2 ± 2.6 0.7 ± 36.3 unclear 0.0 ± 1.2 8.5 ± 63.6 unclear 0.6 ± 3.4M1 v M5 17.1 ± 46.9 +ve likely, probable 1.5 ± 3.6 14.8 ± 43.8 +ve likely, probable 1.2 ± 3.3 25.5 ± 72.4 +ve likely, probable 1.3 ± 3.1M1 v M6 11.8 ± 33.0 unclear 0.2 ± 0.4 11.3 ± 34.5 unclear 0.0 ± 0.0 12.7 ± 37.3 +ve likely, probable 0.6 ± 1.6MIDFIELD M1 v M2 0.1 ± 7.6 unclear 0.1 ± 1.1 11.4 ± 11.6 +ve likely, probable 1.1 ± 1.1 11.4 ± 20.7 +ve likely, probable 0.6 ± 1.1M1 v M3 1.4 ± 4.4 unclear 0.4 ± 1.1 3.4 ± 4.7 +ve likely, probable 0.8 ± 1.1 7.3 ± 8.9 +ve likely, probable 0.9 ± 1.1M1 v M4 0.2 ± 5.0 unclear 0.1 ± 1.1 -0.5 ± 4.7 unclear -0.1 ± 1.1 10.2 ± 15.5 +ve likely, probable 0.7 ± 1.1M1 v M5 4.4 ± 4.7 +ve likely, probable 1.0 ± 1.1 5.9 ± 4.7 +ve very likely 1.3 ± 1.1 7.4 ± 9.2 +ve likely, probable 0.9 ± 1.1M1 v M6 4.6 ± 4.9 +ve likely, probable 1.0 ± 1.1 3.9 ± 6.1 +ve likely, probable 0.7 ± 1.1 13.2 ± 8.0 +ve very likely 1.8 ± 1.1DEFENDERM1 v M2 0.6 ± 15.4 unclear -0.1 ± 1.4 -1.7 ± 23.8 unclear -0.1 ± 1.7 12.9 ± 13.9 +ve likely, probable 1.6 ± 1.7M1 v M3 -3.4 ± 17.4 unclear -0.4 ± 1.4 -4.6 ± 21.3 unclear -0.3 ± 1.4 2.8 ± 9.2 unclear 0.5 ± 1.4M1 v M4 -7.5 ± 17.1 -ve likely, probable -0.7 ± 1.4 -8.9 ± 21.2 -ve likely, probable -0.7 ± 1.4 1.0 ± 7.5 unclear 0.2 ± 1.5M1 v M5 9.9 ± 18.1 +ve likely, probable 0.9 ± 1.6 5.1 ± 21.6 unclear 0.4 ± 1.5 33.3 ± 15.2 +ve very likely 3.3 ± 1.6M1 v M6 5.6 ± 19.3 unclear 0.5 ± 1.5 3.1 ± 22.4 unclear 0.2 ± 1.5 10.9 ± 31.6 unclear 0.5 ± 1.4
TD LSA HSR%Diff ES %Diff ES %Diff ES

117
Table 6-4: Differences in TD, lower and high speed distances for different playing positions when compared to the tournament average (TA) during international
hockey
M1=Match 1; M2= Match 2; M3= Match 3; M4= Match 4; M5= Match 5; M6= Match 6; TA= Tournament Average; %Diff= Percentage Difference; Qual= Qualitative Outcome; ES= Effect Size; TD= TD; LSA = Low speed activity distance; HSR= High speed running distance
STRIKER Qual Qual Qual M1 v TA -8.6 ± 35.0 -ve likely, probable -0.5 ± 1.5 -7.1 ± 34.9 unclear -0.1 ± 0.4 -13.4 ± 47.5 unclear -1.3 ± 3.5M2 v TA 0.6 ± 12.6 unclear 0.2 ± 3.2 1.3 ± 16.8 unclear 0.1 ± 1.2 -1.1 ± 103.9 unclear -0.1 ± 1.7M3 v TA 10.2 ± 45.6 unclear 0.3 ± 1.0 7.5 ± 53.7 +ve likely, probable 0.0 ± 0.2 18.6 ± 30.1 +ve likely, probable 1.1 ± 1.6M4 v TA -6.4 ± 19.9 -ve likely, probable -1.1 ± 3.1 -6.3 ± 10.6 -ve likely, probable -1.6 ± 2.5 -6.0 ± 58.9 unclear -0.4 ± 3.0M5 v TA 7.1 ± 32.0 unclear 0.4 ± 1.7 6.8 ± 24.0 unclear 0.21 ± 0.7 8.7 ± 68.0 unclear 0.4 ± 2.7M6 v TA 2.2 ± 11.4 unclear 0.5 ± 2.2 3.5 ± 4.7 unclear 0.2 ± 0.2 -2.3 ± 31.0 unclear -0.2 ± 2.0MIDFIELD Qual Qual Qual M1 v TA -1.1 ± 4.4 unclear -0.3 ± 1.1 -3.6 ± 4.8 -ve likely, probable -0.9 ± 1.1 -6.4 ± 10.3 -ve likely, probable -7.2 ± 1.07M2 v TA -1.0 ± 7.6 unclear -0.2 ± 1.1 7.4 ± 11.8 +ve likely, probable 0.71 ± 1.1 4.3 ± 21.6 unclear 0.2 ± 1.1M3 v TA 0.3 ± 2.4 unclear 0.1 ± 1.1 -0.3 ± 3.7 unclear -0.1 ± 1.1 0.4 ± 10.4 unclear 0.1 ± 1.08M4 v TA -0.9 ± 4.0 unclear -0.3 ± 1.1 -4.1 ± 3.6 -ve likely, probable -1.3 ± 1.1 -11.1 ± 16.0 unclear 0.2 ± 1.09M5 v TA 3.2 ± 3.5 +ve likely, probable 1.0 ± 1.1 1.9 ± 3.7 unclear 0.57 ± 1.1 0.5 ± 10.6 unclear 0.1 ± 1.08M6 v TA 3.4 ± 3.8 +ve likely, probable 1.0 ± 1.1 0.2 ± 5.5 unclear 0.0 ± 1.1 6.0 ± 9.9 +ve likely, probable 0.7 ± 1.08DEFENDER Qual Qual Qual M1 v TA 0.5 ± 18.5 unclear -0.5 ± 1.6 2.4 ± 22.3 unclear 0.18 ± 1.6 -8.0 ± 6.0 -ve very likely -2.2 ± 1.5M2 v TA 1.2 ± 8.7 unclear 0.2 ± 1.5 0.6 ± 9.8 unclear 0.1 ± 1.5 -8.7 ± 13.8 unclear 0.4 ± 1.7M3 v TA -3.4 ± 7.3 -ve likely, probable -0.8 ± 1.7 -2.4 ± 7.2 -ve likely, probable -0.6 ± 1.6 -5.3 ± 9.1 -ve likely, probable -0.9 ± 1.4M4 v TA -7.0 ± 6.7 -ve likely, probable -1.6 ± 1.4 -6.8 ± 6.9 -ve likely, probable -1.6 ± 1.4 -7.0 ± 7.3 -ve likely, probable -1.5 ± 1.5M5 v TA 10.4 ± 7.0 +ve very likely 2.3 ± 1.5 7.6 ± 6.5 +ve very likely 1.71 ± 1.5 22.7 ± 15.1 +ve very likely 2.4 ± 1.6M6 v TA 6.1 ± 17.9 unclear 0.6 ± 1.7 5.5 ± 19.2 unclear 0.5 ± 1.6 2.1 ± 31.4 unclear -0.2 ± 2.0
ES
ES LSA HSR
%Diff ES %Diff ES %Diff ES
%Diff ES TD
%Diff ES %Diff
%Diff ES %Diff ES %Diff

118
In general, research in soccer has investigated fatigue over the course of a match or
different phases of a season (Di Salvo, et al., 2007; Krustrup, Mohr, Steensberg, et al.,
2006; Mohr, Krustrup, et al., 2003; Rampinini, et al., 2009). A recent study examined
the effects of three matches in five days in professional soccer, suggested that the
activity profiles were not influenced by the short recovery between matches
(Odetoyinbo, et al., 2009). Similar results were observed when comparing the same
top class soccer players over two consecutive matches (Rey, et al., 2010) suggesting
that activity profiles were not influenced by the short recovery periods between
matches. Collectively, these findings support the current results, suggesting that short
periods of recovery do not necessarily affect activity profile of elite level hockey
players.
One of the most significant rule changes in hockey has been to allow unlimited
interchange of players during matches. This change may have markedly altered the
tactical and apparent physiological requirements of the match (Spencer, et al., 2005).
Unfortunately, the number of substitutions has not been described in previous hockey
research. Similar to other team sports (Basketball, Ice hockey, AF), coaches in elite
hockey use a high number of interchanges in an attempt to maintain the exercise
intensity of the team. This tactic allows attacking and defensive pressure to be applied
to the opposition throughout a match (Charlesworth, 2001). In the current study, a
high number of substitutions were used to rotate players throughout each match and
the same substitution strategy was used for each match. This tactical approach may
have permitted the maintenance of positional intensity by allowing players time to
recover on the bench. This interchange strategy may have influenced the ability of
players to cope with the requirements of the tournament, given the short recovery
periods between matches. However, this strategy relies on an even distribution of

119
talent (technical skill efficiency and tactical knowledge) throughout the team and may
not suit teams with a lack of depth. In this study, the technical skill efficiency was not
analysed or controlled for. Therefore, future studies should examine the importance of
these abilities within different rotational strategies in team sports such as hockey.
In addition to significant rule changes, recent studies have reported higher fitness
levels in modern day elite hockey players (Lythe & Kilding, 2011). Indeed, research
from soccer has demonstrated in both referees and players that increases in fitness
translate to enhanced physical outputs during matches (Helgerud, et al., 2001;
Krustrup, Mohr, & Bangsbo, 2002). Players who can sustain a high work-rate
throughout a match gain an advantage over equally skilled players, whose energy can
approach depletion towards the end of a match or after a series of high intensity
efforts, resulting in reduced performance (Reilly , Williams, Nevill, & Franks, 2000).
The elite Australian hockey players had similarly high aerobic capacities to their New
Zealand counterparts (Lythe & Kilding, 2011), but higher than previously reported for
elite players (Spencer, et al., 2004). The higher fitness of these elite players, coupled
with a high rotational strategy during each match, may partly explain the ability to
maintain high exercise intensity during the tournament.
Situational variables including match location, match status (i.e. whether the team was
winning, losing or drawing) (Lago, Casais, Dominguez, & Sampaio, 2010), and the
quality of the opposition (strong or weak) are important factors for soccer
performance. In a recent study of elite Spanish soccer players investigating the effect
of score-line on performance, players performed less high-intensity activity when
winning than when they were losing. In agreement, the midfielders and defenders in
this study performed less HSR compared to match 1, in matches with a large positive
score line. This was evident when comparing matches back to the first match of the

120
tournament. However, when comparisons were made to the TA, only defenders
reduced the amount of HSR when the team was winning. In the most significant
victory, comparing back to the TA results suggested that the score-line did not
influence the amount of HSR performed for strikers and midfielders. Conversely, the
opposite was true for defenders. In the victory with the greatest margin, (i.e. 10-3
victory against Spain), defenders decreased the amount of HSR by 22.7 ± 15.1%
when compared to the TA. This may have been due to the lack of defensive play
required during the match with the ball likely spending the majority of time in the
attacking half of the field.
Soccer players also performed less low-intensity activity when losing than when
winning (Lago, et al., 2010). Interestingly, in the only loss of the tournament in this
study (match 4 vs. Germany), when compared back to the TA, players LSA distance
across the three positions increased. However, only the defenders increased the
amount of LSA compared to the first match of the tournament. Given that winning is
a comfortable status for a team (Bloomfield, Polman, & O'Donoghue, 2005), it is
possible that opposition players assumed a ball contention strategy, keeping the match
slower. This is typical of European field hockey teams when in a winning position,
playing the ball around defensive personnel to maintain possession denying
opposition use of the ball. Defenders also increased HSR (when compared to TA)
during this match and the close 2-1 victory against England. This may be explained by
the defensive players being under greater sustained periods of pressure with the ball in
the defensive half of the field for a greater period of time. Additionally, the
requirement to cover attacking leads from defenders might lead to an increase in the
amount of HSR.

121
Two styles of analysis were completed in this investigation, often providing different
results. By comparing matches back to the first match of a tournament, the assumption
made is that this match is free of fatigue and not influenced by contextual factors.
However, when compared to the TA, no distinct trends emerged. This may suggest
that both methods have limitations and that these limitations need to be considered
when interpreting results in tournament based time-motion analysis studies. By
performing both methods of analysis, however, a more complete understanding of the
tournament may be revealed.
6.3.1 Practical Applications
This information can be used to assist in the design physical preparation programs as
well as guide the formation of tactical strategies when preparing for elite international
hockey players for competition in a tournament format. These findings suggest that
short periods of recovery between consecutive matches do not necessarily affect
activity profile of elite level hockey players. However, the high levels of fitness as
well as the technical ability of the elite level players in this study may have
contributed to these results. Caution is required if attempting to adopt this strategy in
teams with lower fitness or skill levels. Although each method of comparison used in
this study has limitations, performing two levels of analyses provides a greater
understanding of the activity profiles for team sports competing in tournaments.
6.3.2 Conclusion
In summary, the activity profiles of players from an elite hockey team competing in
an international tournament were analysed. Results indicate that this elite team was
able to maintain exercise intensity when playing six matches in a period of nine days.
These results are in contrast to previous investigations of tournament play in field
hockey. The high number of interchanges used by elite hockey coaches in this study

122
may have contributed to maintenance of activity profiles throughout the tournament.
This tactic allowed attacking and defensive pressure to be applied to the opposition
not only throughout a match, but throughout the duration of the nine day tournament.
The higher fitness of these elite players, coupled with a high rotational strategy during
each match, may also explain the ability to maintain high exercise intensity during the
tournament. A potential limitation of this study was the relatively low number of
matches and players examined. Therefore, the patterns observed might only be
specific to this particular team. Accordingly, care should be taken when generalising
these findings to other hockey teams or sports

123
CHAPTER 7. GENERAL DISCUSSION
7.1 Overview
This thesis has presented four studies that attempt to extend the current understanding
of the application of GPS for quantifying the activity profile of hockey athletes.
Initially, a study was conducted to determine the validity and reliability of a 5 Hz GPS
system. Following this, the magnitude of between-unit variation was examined to
assess the ability of these units to be used for making comparisons between players.
Two studies were then conducted to describe the activity profile of positional groups
within elite hockey using the variables identified as being the most valid and reliable.
Study three investigated the impact of the level of competition and positional
requirements on the activity profile of elite level hockey players. Study four described
the activity profile of three distinct positional groups at the elite level across an
international level hockey tournament. Specifically, this study assessed positional
differences, activity profile modifications from first to second half and compared the
activity profile of all matches to the first match and the tournament average. In the
final section of this thesis, key findings from the present work are highlighted and
discussed in light of related research, and especially recent manuscripts that have been
published subsequent to the studies presented in this thesis. Avenues for future
research as well as recommendations arising from the present results are also
considered.
7.2 Advancements in GPS technology
7.2.1 The effect of GPS sample rate on reliability and validity
Prior to this thesis, few studies had investigated the reliability and validity of GPS
technology for the assessment of team sport movements (Barbero Álvarez, et al.,

124
2010; Coutts & Duffield, 2010; Edgecomb & Norton, 2006; MacLeod, et al., 2009;
Peterson, et al., 2009). Additionally, most studies had assessed the validity and
reliability of these GPS devices with distance and positional data recorded at only 1
Hz (Barbero Álvarez, et al., 2010; Coutts & Duffield, 2010; Edgecomb & Norton,
2006; MacLeod, et al., 2009), with only one utilising 5 Hz data (Peterson, et al.,
2009). Chapter 3 of this thesis determined the validity and reliability of GPS for the
assessment of team sport athletes’ specific movements. In agreement with previous
research (Coutts & Duffield, 2010; Edgecomb & Norton, 2006; MacLeod, et al.,
2009; Peterson, et al., 2009),
Dawson, et al., 2004b
GPS devices have acceptable reliability and validity for
assessing TD during longer duration training drills and games. Team sports however,
require a mixture of movements, completed at a variety of intensities, incorporating
many, and often unpredictable changes of direction. The use of GPS to determine
these types of movement is, at present, limited. The results of Chapter 3 and 4 suggest
that GPS under-estimates the criterion distance during short distance sprinting, which
is prevalent in team sport ( ; Duthie, et al., 2006; Spencer, et al.,
2004). This error was evident regardless of GPS sample rate. However, a higher
sample rate improved validity irrespective of distance and locomotion in the straight
line, COD and simulated running circuit trials.
A recent study using a different criterion measure as well as a more recent GPS device
than used in this thesis, points to improved accuracy (Varley, Fairweather, & Aughey,
2012). In that investigation, 5 and 10 Hz GPS units were compared to a laser
(sampling at a rate of 50 Hz) to assess their suitability for measuring instantaneous
velocity during the acceleration, deceleration, and constant velocity phases of straight-
line running. Findings determined that 10 Hz devices provided an acceptable level of
accuracy and reliability for determining instantaneous velocity for all phases of

125
straight-line running. Furthermore, the higher sampling rate had greatly improved
reliability during the constant velocity and acceleration phase and deceleration phase
when compared with 5 Hz units. Interestingly, the accuracy of GPS in measuring
changes in velocity during deceleration was poor, even with a higher sampling rate
overestimations of up to 19.3% existed The reason for this finding is unclear and
warrants investigations given that decelerations can be frequent and important
movements in team sport.
As the 10 Hz devices were only released in the past two years, limited research exists
regarding their use in the sporting environment (Castellano, Casamichana, Calleja-
González, San Román, & Ostojic, 2011; Pyne, Petersen, Higham, & Cramer, 2010;
Varley, et al., 2012). Initial comparison between 5 and 10 Hz units were performed
over a straight line course of 10, 20, 30 and 40 m. When compared to sprint efforts
over the same distances, the 10 Hz unit is markedly more accurate (SEE= 10-m, 13.9
± 5.1%; 20-m, 8.8 ± 3.2%; 30-m, 6.2 ± 2.3%; and 40-m, 5.0 ± 1.8%). Also, as
distance travelled increased, the reliability of the 10 Hz devices improved (TE ± 90%
CI; 10 m = 11.7 ± 3.6%; 20 m= 6.9 ± 2.1%; 40 m= 3.8 ± 1.1%). The efforts in both
studies were maximal sprints performed in a straight line. It would be of interest to
determine the validity and reliability for other velocities (i.e. walking, jogging and
striding) as well as team sport specific movements involving COD. Although given
the reliability of sprinting, it may be that these lower velocity movements follow the
trend of 5 and 1 Hz models with lower speeds exhibiting greater levels of reliability.
The higher number of samples per second of 10 Hz units may increase the accuracy of
these devices to assess brief accelerations involved in COD activities. Future research
investigating the effectiveness of 10 Hz devices to accurately determine high intensity
movements involving COD is necessary.

126
7.2.2 Criterion measures used in GPS validity studies
The validity of a test or new measurement system has typically been determined by
comparisons to a criterion measure or “gold standard” procedure. The first difficulty
encountered when assessing GPS validity is determining the gold standard in
measurement for comparison. There have been three methods used in the literature
investigating the validity of GPS for use in sport: timing gates, laser and VICON
analysis.
The most widely used method is to measure a course with a trundle wheel or tape
measure and setting timing gates at the start and finish of the course to obtain a time
for a known distance. The detail of this method has previously been discussed
(Chapter 3). The current studies have attempted to limit the amount of error within the
criterion measure. The ability of a trundle wheel or tape measure to accurately
measure the known distance is one such example. In an attempt to limit this error,
calibrated trundle wheels and tape measures have been utilised. Further, during trials
involving sport specific circuits, poles and painted lines were used to ensure players
tracked the correct pathway as close to the known distance as possible. Accurately
determining the starting point for movement in the GPS software is extremely
difficult and finally there is some inherent error in the ability of timing gates to
accurately measure time over the course (0.01 s) (Aughey, 2011a).
When assessing changes in velocity, one study used laser technology to measure
changes in velocity during rapid actions such as accelerations. Compared with timing
gates, which can only determine average velocity based on a limited number of
samples, laser devices sample at 50 Hz (Varley, et al., 2012). This should increase the
sensitivity of the criterion measure to a greater extent than timing gates. However, this
127
method can only be used to assess straight line running and may be limited in its
ability to assess COD movements which are prevalent in team sports.
In an investigation of tennis movements, a high resolution motion analysis device, the
VICON motion analysis system, was used to determine criterion movement distance
and speed data during tennis drills. Three-dimensional (3D) positional reflective
markers were attached to a harness of one of the participant’s GPS devices and
recorded by a 22 camera VICON motion analysis system (Oxford Metrics, UK)
operating at 100 Hz. The accuracy of the VICON system was calibrated to less than 1
pixel for each camera, representing an error of 0.0008% (Duffield, et al., 2009). This
method increased the accuracy of the gold standard criterion measure, overcoming the
errors associated with timing gates (Duffield, et al., 2009). However, the technical
practicalities of this method, associated cost and set up time limited its use as a
comparative method, in this study.
7.2.3 Effect of sample rate on measuring acceleration and COD using
GPS.
Speed and acceleration are important qualities in field sports (Aughey, 2010; Aughey,
2011b), with running speed over short distances fundamental to success (Baker &
Nance, 1999; Sayers, 2000). In hockey, players accelerate over short distances and
sprint to create space, chase opponents, and to penetrate the opposition’s defence. The
majority of these movements also involve changes in direction as well as rapid
decelerations. The ability to quantify these rapid acceleration-deceleration phases
would enable sports practitioners to gain better insight into the associated physical
cost of these movements. Newer GPS models with higher sample rates may provide
an acceptable tool for the measurement of constant velocity, acceleration, and
deceleration during straight-line running and have sufficient sensitivity for detecting

128
changes in performance in team sport. However, researchers may be limited to simply
reporting the occurrence of decelerations, as opposed to quantifying the distance and
duration.
7.3 Comparison of Activity profile
7.3.1 Comparing player performances using GPS
The capacity to compare player performance and activity profiles during competition
or training is of great interest to coaches and support staff. With the level of between-
unit variation for 5 Hz units ~10% (Chapter 4), regardless of distance (TD and HSR),
movement speed and change of direction, it is recommended the same unit is used for
individual players during all exercise sessions. It is also recommended that the
between-unit measurement error should be considered if making comparisons
between players. Sampling at 10 Hz, enables these evaluations to take place with
greater certainty, and without the requirement of the same unit on the same player.
Recently, the inter-device reliability of 10 Hz units was determined with small
variations between devices evident. Authors reported a CV of 1.3% and 0.7% in
sprints of 15 m and 30 m, respectively (Castellano, et al., 2011) concluding that it is
not always necessary to monitor players with the same device. This enables
comparisons to be made between players with a greater level of confidence and
precision.
Differences in methodology make comparison to other research difficult. In other
studies of inter-unit reliability multiple units have been worn by either the same
subject or a number of subjects (Coutts & Duffield, 2010; Peterson, et al., 2009).
However in that study, researchers compared differences between the performances of
nine participants who each wore a single unit (Castellano, et al., 2011). This method
makes comparison of the difference between units for the same performance difficult.
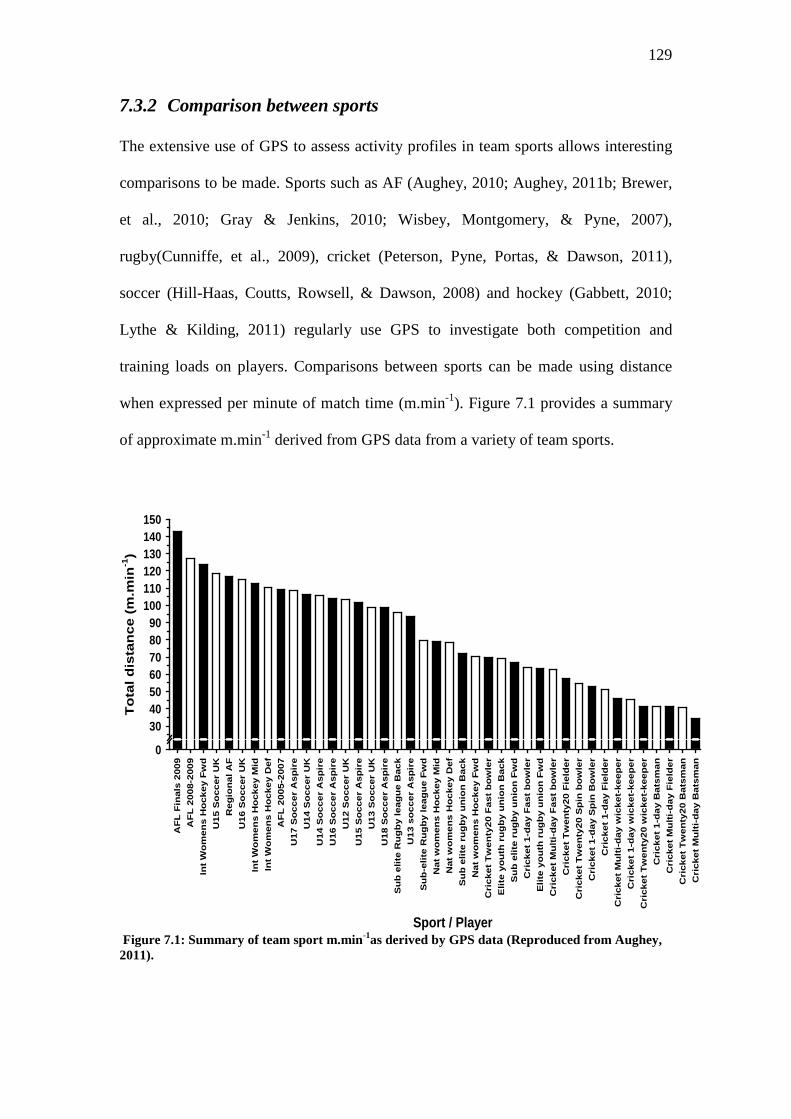
129
7.3.2 Comparison between sports
The extensive use of GPS to assess activity profiles in team sports allows interesting
comparisons to be made. Sports such as AF (Aughey, 2010; Aughey, 2011b; Brewer,
et al., 2010; Gray & Jenkins, 2010; Wisbey, Montgomery, & Pyne, 2007),
rugby(Cunniffe, et al., 2009), cricket (Peterson, Pyne, Portas, & Dawson, 2011),
soccer (Hill-Haas, Coutts, Rowsell, & Dawson, 2008) and hockey (Gabbett, 2010;
Lythe & Kilding, 2011) regularly use GPS to investigate both competition and
training loads on players. Comparisons between sports can be made using distance
when expressed per minute of match time (m.min-1). Figure 7.1 provides a summary
of approximate m.min-1
derived from GPS data from a variety of team sports.
AF
L F
inal
s 20
09A
FL
200
8-20
09In
t W
om
ens
Ho
ckey
Fw
dU
15 S
occ
er U
KR
egio
nal
AF
U16
So
ccer
UK
Int
Wo
men
s H
ock
ey M
idIn
t W
om
ens
Ho
ckey
Def
AF
L 2
005-
2007
U17
So
ccer
Asp
ire
U14
So
ccer
UK
U14
So
ccer
Asp
ire
U16
So
ccer
Asp
ire
U12
So
ccer
UK
U15
So
ccer
Asp
ire
U13
So
ccer
UK
U18
So
ccer
Asp
ire
Su
b e
lite
Ru
gb
y le
agu
e B
ack
U13
so
ccer
Asp
ire
Su
b-e
lite
Ru
gb
y le
agu
e F
wd
Nat
wo
men
s H
ock
ey M
idN
at w
om
ens
Ho
ckey
Def
Su
b e
lite
rug
by
un
ion
Bac
kN
at w
om
ens
Ho
ckey
Fw
dC
rick
et T
wen
ty20
Fas
t b
ow
ler
Elit
e yo
uth
ru
gb
y u
nio
n B
ack
Su
b e
lite
rug
by
un
ion
Fw
dC
rick
et 1
-day
Fas
t b
ow
ler
Elit
e yo
uth
ru
gb
y u
nio
n F
wd
Cri
cket
Mu
lti-
day
Fas
t b
ow
ler
Cri
cket
Tw
enty
20 F
ield
erC
rick
et T
wen
ty20
Sp
in b
ow
ler
Cri
cket
1-d
ay S
pin
Bo
wle
rC
rick
et 1
-day
Fie
lder
Cri
cket
Mu
lti-
day
wic
ket-
keep
erC
rick
et 1
-day
wic
ket-
keep
erC
rick
et T
wen
ty20
wic
ket-
keep
erC
rick
et 1
-day
Bat
sman
Cri
cket
Mu
lti-
day
Fie
lder
Cri
cket
Tw
enty
20 B
atsm
anC
rick
et M
ult
i-d
ay B
atsm
an
To
tal d
ista
nce
(m
.min
-1)
0
30405060708090
100110120130140150
Sport / Player Figure 7.1: Summary of team sport m.min-1
as derived by GPS data (Reproduced from Aughey, 2011).
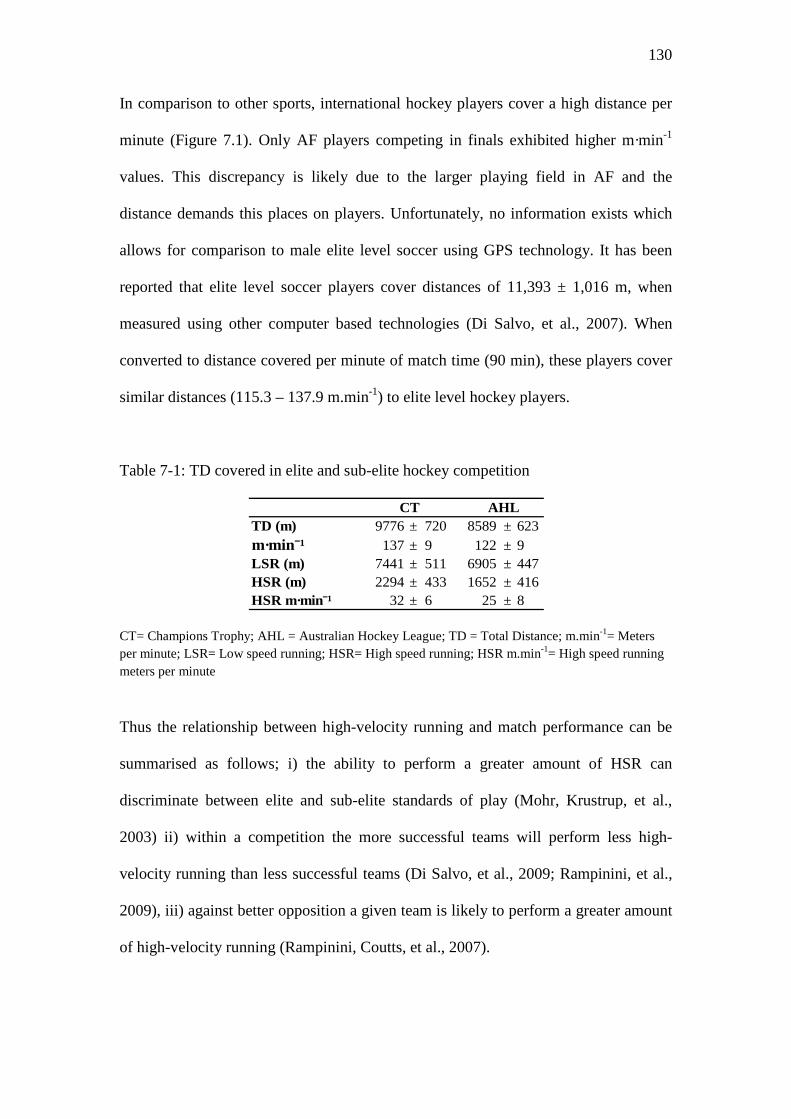
130
In comparison to other sports, international hockey players cover a high distance per
minute (Figure 7.1). Only AF players competing in finals exhibited higher m·min-1
Di Salvo, et al., 2007
values. This discrepancy is likely due to the larger playing field in AF and the
distance demands this places on players. Unfortunately, no information exists which
allows for comparison to male elite level soccer using GPS technology. It has been
reported that elite level soccer players cover distances of 11,393 ± 1,016 m, when
measured using other computer based technologies ( ). When
converted to distance covered per minute of match time (90 min), these players cover
similar distances (115.3 – 137.9 m.min-1
) to elite level hockey players.
Table 7-1: TD covered in elite and sub-elite hockey competition
CT= Champions Trophy; AHL = Australian Hockey League; TD = Total Distance; m.min-1= Meters per minute; LSR= Low speed running; HSR= High speed running; HSR m.min-1
= High speed running meters per minute
Thus the relationship between high-velocity running and match performance can be
summarised as follows; i) the ability to perform a greater amount of HSR can
discriminate between elite and sub-elite standards of play (Mohr, Krustrup, et al.,
2003) ii) within a competition the more successful teams will perform less high-
velocity running than less successful teams (Di Salvo, et al., 2009; Rampinini, et al.,
2009), iii) against better opposition a given team is likely to perform a greater amount
of high-velocity running (Rampinini, Coutts, et al., 2007).
TD (m) 9776 ± 720 8589 ± 623m·minˉ¹ 137 ± 9 122 ± 9LSR (m) 7441 ± 511 6905 ± 447HSR (m) 2294 ± 433 1652 ± 416HSR m·minˉ¹ 32 ± 6 25 ± 8
CT AHL

131
7.3.3 Rule changes in hockey
Despite rule changes allowing unlimited interchange which have markedly altered
tactics in elite level hockey, the number of interchanges that occur has not been
reported. A greater number of short rest periods throughout a half of hockey, may
allow players to sustain higher intensity movements and reduce the effect of fatigue
on performance. Coaches and support staff are continually searching for the ideal
rotation strategy to maximise and maintain the intensity of the team, while still
allowing for the structural and tactical nuances to consistently be applied. This
strategy is usually applied with a specific number of minutes allocated to each
positional group. For example, in the study completed in Chapter 6, players in each
positional group had a set number of minutes on and off the field. Whether this was
the most effective use of playing time or resting time is unknown and may depend on
the fitness of each individual player. The results of the matches, as well as the
maintenance of HSR across the tournament, suggest the rotation strategy implemented
for this team, in this tournament, was effective. The high level of aerobic fitness of the
playing squad (64.2 ± 3.1 ml·kg-1·min-1
Lythe & Kilding, 2011
), which is comparable to other international
level hockey players ( ), may be one contributing factor to the
success of the team. Furthermore, this strategy of continual rotation would only be
effective and indeed was effective, if the playing group was of a consistently high
skill level. Rotating players of lesser ability or talent at this level would negate this
concept.
7.4 Key findings / Practical applications
In summary, this thesis has attempted to increase the understanding of the match
profile and activity demands of elite hockey players. This was achieved by conducting
research which investigated the accuracy of GPS technology to assess activity profiles

132
in team sport. The reliable and valid variables derived from this research were then
used to further understand differences between two groups of hockey players varying
in playing ability and positional roles. The results may assist sports scientists, coaches
and conditioning specialists to optimise the performance of elite hockey players.
The following section outlines the key findings and practical applications resulting
from each of the four chapters.
7.4.1 Study 1: The validity and reliability of GPS units for measuring
distance in team sport specific running patterns.
Key findings:
1. The 1 and 5 Hz GPS units underestimated the criterion distance during
sprinting over short distances.
2. The reliability of 1 and 5 Hz GPS improved as distance travelled increased
but decreased as speed increased.
3. The 1 and 5 Hz GPS devices have acceptable reliability and validity for
assessing TD during longer duration training drills and games.
Practical Applications:
1. One and 5 Hz GPS devices cannot currently be used to measure brief, high-
intensity sprints over distances of less than 20 m or accelerations /
decelerations, regardless of sampling rate.
2. It is recommended wide velocity bands be used to report distance covered in
specific speed zones.

133
7.4.2 Study 2: Variability of GPS units for measuring distance in team
sport movements
Key findings:
1. There is a considerable degree of variation (9.9 ±4.7% to 11.9 ±19.5% for straight
line running movements and from 9.5 ±7.2% to 10.7 ±7.9% in the COD) in
distance measured from two GPS units worn by the same player completing
the same movement task.
2. The variation between the two GPS units was similar regardless of the
movement pattern.
Practical Applications:
1. Between-unit difference should be used in conjunction with test-retest error of
GPS when assessing athlete performance.
2. To minimise the source of measurement error, it is recommended that the
same unit be used for individual players during all exercise sessions.
7.4.3 Study 3: International field hockey players perform more high
intensity running than national level counterparts
Key Findings:
1. International players completed a greater TD and HSR distance across all
positions than players at an elite national level.
2. In both competitions, midfielders and strikers performed more HSR than
defenders.

134
3. The positional activity profile decreased in the second half for both
competitions
Practical Applications:
1. Players at the national level may require additional conditioning to achieve the
higher aerobic capacity required if aspiring to international representation.
2. The training of elite field hockey players should focus on improving their
ability to perform intense exercise and to recover rapidly from periods of high-
intensity running.
3. Emphasis should be placed on the individualization of conditioning programs
to address the specific demands of the different playing positions and
underlying physiological limitations.
7.4.4 Study 4: GPS analysis of international field hockey tournament
Key Findings:
1. This elite team was able to maintain exercise intensity when playing six games
in a period of nine days.
2. Performing two methods of analysis, firstly against a tournament average and
secondly, against the first match of a tournament, provides a more complete
understanding of the activity profiles during tournament play.
Practical Applications:
1. This information can be used to guide player physical preparation and tactical
strategies when preparing for international competition.
2. Caution is required if attempting to adopt a strategy that involves a high
number of substitutions in teams with lower fitness or skill levels.

135
CHAPTER 8. LIMITATIONS AND
RECOMMENDATIONS FOR FUTURE RESEARCH
8.1 Limitations
8.1.1 GPS
Coupled with the previously discussed development of a “gold standard” criterion
measure, accurately determining the starting point for a movement is difficult to
establish in the GPS software. The start time was determined by the first increase
above zero on the velocity trace and then, using each associated sprint time (from
timing gates), the associated distance was determined. Therefore, the validation of
GPS to date has methodological limitations that although they can be controlled for,
still must be taken into account when interpreting results.
Global positioning systems have rapidly advanced in the past 10 years. During this
time, software and hardware has become more sophisticated, with an increased
sample rate one such advancement. At the time of these studies the highest available
sample rate was 5 Hz. Currently, at least one manufacturer has made available units
sampling at 10 Hz. This increase in sample rate has already been proven to enhance
the validity and reliability of straight line movements and may yet demonstrate the
ability to detect brief high intensity acceleration phases involving COD that are
associated with team sports.
8.1.2 Time-motion analysis in hockey
Using high level athletes as a research cohort during competition provides a unique
opportunity to understand elite performance. The data obtained reflects current trends
that are directly applicable to athletes at the same or aspiring to compete at similar
levels. However, the ability to control variables and create a stable research

136
environment is reduced. Injuries to players during matches, unexpected score lines
and the influence of team tactics, opposition strategies and umpires’ decisions on
results are all intrinsic qualities of sporting competition that can confound the results.
Time-motion analysis studies do have a number of potential limitations, mostly
relating to the validity and reliability of measurement. In order to lessen these
concerns and to address the issue of representation, an increase in games sampled and
analysed may need to be carried out. Since variability between matches may be
inherent to invasion styl e team sports, it might be that a larger number of
matches is needed to check when the average values stabilise in order for a true
work-rate profile to be established (Drust, A tkinson, & Reilly, 2007).
There are inherent difficulties in investigating both physical and technical outputs
during a team sport and it is acknowledged that the present thesis was conducted
using just eight AHL and six CT matches, albeit against different opposition. This
number of matches limits the statistical power of the findings and recommendations
but does provide a unique insight into the potential effects of an elite level tournament
on activity profiles. As well as the limited number of games, the different opposition
may also have provided limitations to research design. Typically, most elite level
hockey is played in tournament situations with clusters of 6-8 matches over a short
time period. While this potentially affects the control of the research, the advantage is
that data is collected in ‘real’ environments giving insights into elite competition
rather than under contrived practice match settings. The information analysed also
came from only one team, therefore the activity profiles and results observed might be
a reflection of this particular team and difficult to extrapolate to other teams.
The use of distance from each position, rather than the distance covered by individual
players, to describe the positional activity profile may have protected anticipated
137
declines in TD and HSR when the first and second halves of matches were compared.
Also, the smaller decrease in HSR in the present study may be related to the unlimited
substitution rule as well as positional and tactical requirements employed during both
competitions. It is likely that the coaches manage player rotations in field hockey to
maintain the exercise intensity of the team. Future studies should examine the
relationship between player rotation and activity profile in field hockey.
Recent soccer research has also shown that activity profiles in the same league are
influenced by team success, with the less successful team players often having higher
intensities of effort, possibly because they are forced to chase more to try to win back
the ball (Di Salvo, et al., 2009; Mohr, Krustrup, et al., 2003). Within a game, other
factors such as aerobic capacity, motivation, chance of winning and match tactics (of
both teams) can clearly affect the activity profile of players (Rampinini, Coutts, et al.,
2007; Rampinini, et al., 2009; Rampinini, Sassi, Sassi, & Impellizzeri, 2004). These
are all limitations of time-motion analysis and are difficult to control for. Similar to
soccer, each playing position in hockey has different tactical requirements in relation
to ball movement throughout a match (Rampinini, Coutts, et al., 2007). Unfortunately,
information regarding match statistics and ball involvements was not able to be
collected during the two tournaments. In a study of elite soccer, forwards and
midfielders completed similar amounts of VHIR. However, it was the forwards who
covered a significantly greater portion of this distance with the ball when compared to
other positions (Castagna, et al., 2006; Rampinini, Coutts, et al., 2007). This
information could have implications for the design of position specific small sided
games and skill based conditioning training drills.
138
Difficulties exist when comparing recent findings and data with reported results from
the literature. Different technologies, methods and categorisations for the assessment
of activity profiles indicate these comparisons are potential limitations.
8.2 Future Research
8.2.1 The use of GPS in team sport analysis
The application of GPS to future research is likely to focus on two distinct areas.
Firstly, the further increases in sample rate and secondly, the integration of GPS data
with statistical and strategic information.
With 10 Hz units entering the commercial market, the need to establish the reliability,
validity and variability for sport specific team sport movements exists. This should
occur prior to their use in sporting situations. Determining the variables that these
units can measure accurately will enable practitioners to confidently report and assess
training and match variables. The increased sample rate may enable a greater number
of areas to be investigated with confidence. Most notably, number of sprints or efforts
at different velocities, distance covered when sprinting and the number of repeated
sprint efforts performed is of great interest to coaches and sport scientists. Some of
these are already incorporated into the assessment of training and competition in
professional sport. However, the accuracy and precision of these measures using
current 1 and 5 Hz units is questionable. The use a 10 Hz sample rate may enable this
to be performed with future investigations focusing on these issues.
The creation of guidelines for velocity bands using 1, 5 and now 10 Hz units would
enable continuity in reporting as well as consistent methodology for ease of
comparison between studies, athletes and sports. The recommendations from this
study regarding wide velocity bands could be used as a starting point for future
investigations. With the advent of 10 Hz units, those using this new technology, once

139
validated, may have the potential to use narrower bands and increase the detail in
reporting of these zones. Conversely, when sampling at 1 or 5 Hz sample rates,
velocity band width may be limited to two zones: HSR and LSR. Increases in sample
rate may enable these to be expanded to five zones, similar to those used in other
video-based time-motion analysis studies.
Assessing activity levels and running intensities of players using real time GPS
software may provide coaches and support staff with information to assist in the
appropriate times to interchange players (Aughey & Falloon, 2010). Pre-determined
ranges of HSR or HSR m.min-1 could be individually established prior to
competitions and coupled with the “coaches’ eye” (the coaches ability to make
strategic or tactical changes based on experience or intuition) could provide a more
complete picture on when players are decreasing their ability to produce high intensity
efforts. These levels could be established as a result of individual speed data collected
as part of routine fitness testing batteries. High velocity running ranges could be
determined from 0-40 m sprint times and used as thresholds for individual players
during matches. For example, players with lower maximal velocities as determined
using this sprint data may then have lower HSR ranges. While these may be time
consuming to determine for an entire squad, it may individualise the HSR distance
thresholds used. Other researchers have suggested using a player’s individual high
intensity threshold based on speed at the second ventilatory threshold (VT2speed
Abt & Lovell, 2009
) to
determine HSR distance ( ). When this method was compared to
the HSR distance from a computerised match analysis system, HSR distance was
substantially underestimated (Abt & Lovell, 2009).
Zones representing different sports or even sex specific zones could be determined
which better represent the HSR requirements of sports. Recent work in this area has
140
proposed standard definitions (velocity ranges) that could be determined by an
objective analysis of time-motion data identifying the average velocity distribution
(Dwyer & Gabbett, 2012). A curve fitting process has then been suggested to
determine the typical locomotor categories. Based on the findings of these analyses,
recommendations about sport-specific velocity ranges to be used in future time-
motion studies of field sport athletes could then be made (Dwyer & Gabbett, 2012).
This method may allow a more accurate comparison between players competing in
the same sport. For example, the HSR zone suggested in that study for women’s
hockey is lower than that of men’s soccer and hockey. If the same categories are used,
HSR in women’s team sports may be underestimated (Dwyer & Gabbett, 2012).
Differences in match-to-match HSR could also be attributed to the influence of
different opponents with factors such as playing styles, fitness and tactics being the
likely cause of this variance (Rampinini, Coutts, et al., 2007). These characteristics
must be taken into consideration when using HSR to discriminate between matches
and players performance.
As previously mentioned, the incorporation of tactical and skill information with GPS
would provide a greater and more comprehensive analysis of team sport. This
information could enhance the understanding of position specific requirements not
only from a movement standpoint, but also from a game involvement perspective.
This information would further enhance the ability of coaches and conditioning
specialists to devise positional and strategic training drills which involve appropriate
velocities, intensities and distances, as well as ball involvements and tactical
movement patterns.

141
8.2.2 Future studies in hockey
With the introduction of GPS technology, sport scientists and support staff are able to
gain specific information on the distances covered in low and high intensity activities
achieved by players during training and competition. Coaches are increasingly trying
to match the demands of competition in the training environment, from both a
physical and technical aspect. This series of studies provides the information
regarding the physical demands of competition at the elite level. The missing
component is the analysis of the training environment. A greater understanding of
training allows for the tailoring of training to adapt players to the activity profiles
required in competition. This has been completed in women’s hockey where the
discrepancy between competition requirements and training stimulus was found
(Gabbett, 2010). Specifically, female AHL players spent more time in low intensity
activities, but less time in moderate and high intensity activities in training than in
competition (Gabbett, 2010). This type of analysis has yet to be completed in elite
male hockey.
Recent rule changes may have markedly altered the tactical and apparent
physiological requirements of the match. The use a high number of interchanges by
coaches is an attempt to maintain the exercise intensity of the team. This tactic allows
attacking and defensive pressure to be applied to the opposition throughout a match.
Developing a team and in turn, a more individualised substitution system,
appropriately matched to the capacity of the available players, could increase
performance statistics and consequently the likelihood of success. Fitness and
physiological parameters could be partnered with GPS information, specifically the
amounts of HSR in predetermined periods of play or rotations, to investigate the
optimal amount of time each player can sustain high intensity movements. Coupled
142
with this, is the amount of recovery time each player requires between these periods
of intense activity to maintain performance levels.
It has been suggested that physical performance in elite soccer may be influenced by
match contextual factors. Activity profiles can be affected by the level of opponent as
well as differences in tactics and styles of play adopted by opposition teams
(Rampinini, Coutts, et al., 2007). Investigation of the effect of the opponent on the
reference team has been completed in soccer, but never in elite hockey.
Internationally, different nations and regions of hockey are renowned for their
different styles of play and the influence of these on Australian teams would be of
interest to coaching and sport science staff. Furthermore, the physical cost of tactics
employed by coaches would be valuable information for preparation and conditioning
staff, enabling them to ready players for the demands of specific strategies. Full
ground presses, where intense levels of pressure are applied all over the field, zone
defences, man-to-man marking and half ground presses are specific defensive
strategies employed by hockey coaches. The cost of these strategies and determining
the length of time these tactics can be employed before the amount of sustained
pressure (HSR distance) diminishes would be invaluable information for coaching
staff. Practice matches with the reference team playing a consistent style and the
opposition team changing their tactics would enable this type of analysis to be
completed. Comparisons could be made between GPS data of specific periods of play
where different tactics or styles of play are employed.
Rule changes in hockey have dramatically transformed the game over the years. The
most recent change to the rules came in 2010 when the FIH Hockey Rules Board
introduced a significant change into the procedures for taking a free hit, centre pass or
side-line hit. A “self-pass” was introduced, which enables the player taking the free
143
hit to play the ball themselves and effectively “play on” (FIH Rules of hockey, 2010).
This rule makes the game more continuous with fewer breaks in play. Players and
coaches alike already recognize that this rule change has had an effect in the game,
but empirical evidence confirming this has not been presented. Comparisons between
GPS match data collected before and after the introduction of this rule could identify
if this is in fact the case.
As there has been only a relatively small amount of published literature on elite
hockey, it is likely that there is still much to learn and significant benefit to be gained
from the investigation of activity profiles, positional requirements and competition
analysis.

144
REFERENCES
Abt, G., & Lovell, R. (2009). The use of individualized speed and intensity thresholds for determining the distance run at high-intensity in professional soccer. Journal of Sports Sciences, 27(9), 893-898.
Andersson, H., Randers, M., Heiner-Moller, A., Krustrup, P., & Mohr, M. (2010). Elite female soccer players perform more high-intensity running when playing in international games compared with domestic league games. Journal of Strength and Conditiong Research, 24(4), 912-919.
Appleby, B., & Dawson, B. (2002). Video analysis of selected game activities in Australian Rules Football. Journal of Science and Medicine in Sport, 5(2), 129-142.
Atkinson, G., & Nevill, A. M. (2001). Selected issues in the design and analysis of sport performance research. Journal of Sports Sciences, 19(10), 811-827.
Aughey, R. J. (2010). Australian Football Player Work Rate:Evidence of Fatigue and Pacing? International Journal of Sports Physiology and Performance, 5, 394-405.
Aughey, R. J. (2011a). Applications Of GPS Technologies to Field Sports. International Journal of Sports Physiology and Performance, 6, 295-310.
Aughey, R. J. (2011b). Increased high-intensity activity in elite Australian Football finals matches. International Journal of Sports Physiology and Performance,, 6, 367-379.
Aughey, R. J., & Falloon, C. (2010). Real-time versus post-game GPS data in team sports. Journal of Science and Medicine in Sport(May), 348-449
Baker, D., & Nance, S. (1999). The relation between running speed and measures of strength and power in professional rugby league players. Journal of Strength and Conditioning Research, 13(3), 230-235.
Bangsbo, J. (1994). The physiology of soccer with special reference to intense intermittent exercise. Acta Physiologica Scandinavica, 151(Supplement 619), 1-156.
Bangsbo, J., Mohr, M., & Krustrup, P. (2006). Physical and metabolic demands of training and match-play in the elite football player. Journal of Sports Sciences, 24(7), 665-674.
Bangsbo, J., Nørregaard, L., & Thosøe, F. (1991). Activity profile of competition soccer. Canadian Journal of Sport Sciences, 16, 110-116.
Barbero Álvarez, J. C., Coutts, A. J., Granda, J., Barbero Álvarez, V., & Castagna, C. (2010). The validity and reliability of a Global Positioning Satellite System device to assess speed and repeated sprint ability (RSA) in athletes. Journal of Science and Medicine in Sport, 13(2) (March), 232-235.
Bishop, D., Spencer, M., Duffield, R., & Lawrence, S. (2001). The validity of a repeated sprint ability test. Journal of Science and Medicine in Sport, 4(1), 19-29.
Bloomfield, Polman, R., & O'Donoghue, P. (2005). Effects of score-line on intensity of play in midfield and forward players in the FA Premier League. Journal of Sports Sciences, 23, 191-192.
Bloomfield, Polman, R., & O’Donoghue, P. (2007). Physical demands of different positions in FA Premier League soccer. Journal of Sports Science and Medicine, 6, 63–70.
145
Boyle, P., Mahoney, C., & Wallace, W. (1994). The competitive demands of elite male field hockey. The Journal of Sports Medicine and Physical Fitness, 34(3), 235.
Bradley, P. S., Sheldon, W., Wooster, B., Olsen, P., Boanas, P., & Krustrup, P. (2009). High-intensity running in FA Premier League soccer matches. Journal of Sports Sciences, 27(2), 159-168.
Brewer, C., Dawson, B., Heasman, J., Stewart, G., & Cormack, S. (2010). Movement pattern comparison in elite (AFL) and sub-elite (WAFL) Australian football games using GPS. Journal of Science and Medicine in Sport, 13(6), 618-623.
Burgess, D. J., Naughton, G., & Norton, K. I. (2006). Profile of movement demands of national football players in Australia. Journal of Science and Medicine in Sport, 9(4), 334-341.
Carling, C., Bloomfield, J., Nelsen, L., & Reilly, T. (2008). The role of motion analysis in elite soccer: contemporary performance measurement techniques and work rate data. Sports Medicine, 38(10), 839-862.
Castagna, C., Impellizzeri, F. M., Chamari, K., Carlomagno, D., & Rampinini, E. (2006). Aerobic fitness and Yo-Yo Continuous and Intermittent tests performances in soccer players: A correlation study. Journal of Strength and Conditioning Research, 20(2), 320-325.
Castellano, J., Casamichana, D., Calleja-González, J., San Román, J., & Ostojic, S. (2011). Reliability and accuracy of 10 Hz GPS devices for short-distance exercise. Journal of Sports Science and Medicine, 10, 233-234.
Charlesworth, R. (2001). The coach: Managing for success: Pan Macmillan. Cohen, J. (1988). Statistical Power Analysis for the Behavioral Sciences. Hillsdale,
NJ: Lawrence Erlbaum Associates. Cormack, S. J., Newton, R. U., & McGuigan, M. R. (2008). Neuromuscular and
endocrine responses of elite players to an Australian rules football match. International Journal of Sports Physiology and Performance, 3(3), 359–374.
Coutts, A. J., & Duffield, R. (2010). Validity and reliability of GPS units for measuring movement demands of team sports. Journal of Science and Medicine in Sport, 13(1), 133-135.
Coutts, A. J., Quinn, J., Hocking, J., Castagna, C., & Rampinini, E. (2010). Match running performance in elite Australian Rules Football. Journal of Science and Medicine in Sport, 13(5), 543-548.
Coutts, A. J., & Reaburn, P. R. J. (2000). Time and motion analysis of the AFL field umpire. Journal of Science and Medicine in Sport, 3(2), 132-139.
Coutts, A. J., Russell, N. R., & Sirotic, A. C. (2005). A comparison of different recovery practices during the half-time of a simulated team sport match on subsequent repeated sprint ability. Journal of Science and Medicine in Sport, 8(4), s223.
Craig, M. (1979). Modern hockey for juniors. Melbourne, Australia: T&H Hunter Pty Ltd.
Cunniffe, B., Proctor, W., Baker, J. S., & Davies, B. (2009). An Evaluation of the Physiological Demands of Elite Rugby Union Using Global Positioning System Tracking Software. The Journal of Strength & Conditioning Research, 23(4), 1195-1203
Cych, P. (2006). Possibilities of and constraints on the application of GPS devices in controlling orienteering training Studies of Physical, Culture and Tourism, 13, 109-115.
146
Dawson, B., Hopkinson, R., Appleby, B., Stewart, G., & Roberts, C. (2004a). Comparison of training activities and game demands in the Australian Football League. Journal of Science and Medicine in Sport, 7(3), 292-301.
Dawson, B., Hopkinson, R., Appleby, B., Stewart, G., & Roberts, C. (2004b). Player movement patterns and game activities in the Australian Football League. Journal of Science and Medicine in Sport, 7(3), 278-291.
Deutsch, M., Kearney, G., & Rehrer, N. (2007). Time-motion analysis of professional rugby untion players during match-play. Journal of Sports Science, 25(4), 461-472.
Deutsch, M., Maw, G., Jenkins, D., & Reaburn, P. (1998). Heart rate, blood lactate and kinematic data of elite colts (under-19) rugby union players during competition. Journal of Sports Sciences, 16(6), 561-570.
Di Salvo, V., Baron, R., Tschan, H., Calderon Montero, F., Bachl, N., & Pigozzi, F. (2007). Performance characteristics according to playing position in elite soccer. International Journal of Sports Medicine, 28(3), 222-227.
Di Salvo, V., Collins, A., McNeill, B., & Cardinale, M. (2006). Validation of Prozone ®
Di Salvo, V., Gregson, W., Atkinson, G., Tordoff, P., & Drust, B. (2009). Analysis of high intensity activity in Premier League soccer. International Journal of Sports Medicine, 30(3), 205-212.
: A new video-based performance analysis system. International Journal of Performance Analysis in Sport, 6(1), 108-119.
Dobson, B., & Keogh, J. W. L. (2007). Methodological issues for the application of time-motion analysis research. Strength and Conditioning Journal, 29(2), 48-55.
Docherty, D., Wenger, H. A., & Neary, P. (1988). Time-motion analysis related to the physiological demands of rugby. Journal of Human Movement Studies, 14, 269-277.
Doğramaci, S. N., & Watsford, M. L. (2006). A comparison of two different methods for time-motion analysis in team sports. International Journal of Performance Analysis in Sport, 6(1), 73-83.
Drust, B., Atkinson, G., & Reilly, T. (2007). Future perspectives in the evaluation of the physiological demands of soccer. Sports Medicine, 37(9), 783-805.
Duffield, R., Reid, M., Baker, J., & Spratford, W. (2009). Accuracy and reliability of GPS devices for measurement of movement patterns in confined spaces for court-based sports. Journal of Science and Medicine in Sport, 13(5), 523-525.
Duncan, M. J., Badland, H. M., & Mummery, W. K. (2009). Applying GPS to enhance understanding of transport-related physical activity. Journal of Science and Medicine in Sport, 12(5), 549-556.
Duthie, G., Pyne, D., & Hooper, S. (2003a). Applied physiology and game analysis of rugby union. Sports Medicine, 33(13), 973-991.
Duthie, G., Pyne, D., & Hooper, S. (2003b). The reliability of video based time motion analysis. Journal of Human Movement Studies, 44, 259-272.
Duthie, G., Pyne, D., Marsh, D., & Hooper, S. (2006). Sprint patterns in rugby union players during competition. Journal of Strength and Conditioning Research, 20(1), 208-214.
Duthie, G., Pyne, D. B., & Hooper, S. L. (2005). Time motion analysis of 2001 and 2002 super 12 rugby. Journal of Sports Sciences, 23(5), 523-530.
Dwyer, D. B., & Gabbett, T. J. (2012). Global Positioning System Data Analysis: Velocity Ranges and a New Definition of Sprinting for Field Sport Athletes. The Journal of Strength & Conditioning Research, 26(3), 818-824

147
Edgecomb, S. J., & Norton, K. I. (2006). Comparison of global positioning and computer-based tracking systems for measuring player movement distance during Australian football. Journal of Science and Medicine in Sport, 9(1-2), 25-32.
Estell, J., Lord, P., Barnsley, L., Shenstone, B., & Kannangara, S. (1996). Physiological demands of rugby league. Paper presented at the Australian Conference of Science and Medicine in Sport, Canberra.
Gabbett, T. (2005). Science of rugby league football: a review. Journal of Sports Sciences, 23(9), 961-976.
Gabbett, T. (2010). GPS Analysis of Elite Women's Field Hockey Training and Competition. The Journal of Strength & Conditioning Research, 24(5), 1321.
Gore, C. (Ed.). (2000). Physiological Tests for Elite Athletes (1st ed.). Champaign, Illinois: Human Kinetics.
Gray, A. J., & Jenkins, D. G. (2010). Match analysis and the physiological demands of Australian Football. Sports Medicine, 40(4), 347-360.
Harvey, B., Naughton, G., & Graham, K. (2009). Quantifying game demands of open age and under 21 male state hockey players. Journal of Science and Medicine in Sport, 12(S ), S30.
Helgerud, J., Engen, L., Wisløff, U., & Hoff, J. (2001). Aerobic endurance training improves soccer performance. Medicine and Science in Sports and Exercise, 33(11), 1925-1931.
Hill-Haas, S., Coutts, A., Rowsell, G., & Dawson, B. (2008). Variability of acute physiological responses and performance profiles of youth soccer players in small-sided games. Journal of Science and Medicine in Sport, 11(5), 487-490.
Hopkins, W. G. (2000). Measures of reliability in sports medicine and science. Sports Medicine, 30(1), 1-15.
Hopkins, W. G. (2003). A spreadsheet for analysis of straightforward controlled trials. Sportscience, 7, i. Retrieved from
Impellizzeri, Marcora, Castagna, Reilly, T., Sassi, A., Iaia, F. M., & Rampinini, E. (2006). Physiological and performance effects of generic versus specific aerobic training in soccer players. International Journal of Sports Medicine, 27(6), 483-492
Impellizzeri, Rampinini, E., Castagna, C., Bishop, D., Ferrari Bravo, D., Tibaudi, A., & Wisloff, U. (2008). Validity of a repeated-sprint test for football. International Journal of Sports Medicine.
Jaensch, H., Jones, S., & Nairn, v. (2003). Hat pins to bodysuits. Underdale, South Australia: Gillingham Printers.
Krustrup, P., & Bangsbo, J. (2001). Physiological demands of top-class soccer refereeing in relation to physical capacity: effect of intense intermittent exercise training. Journal of Sports Sciences, 19(11), 881-891.
Krustrup, P., Mohr, M., & Bangsbo, J. (2002). Activity profile and physiological demands of top-class soccer assistant refereeing in relation to training status. Journal of Sports Sciences, 20(11), 861-871.
Krustrup, P., Mohr, M., Ellingsgaard, H., & Bangsbo, J. (2005). Physical demands during an elite female soccer game: importance of training status. Medicine and Science in Sports and Exercise, 37(7), 1242-1248.
Krustrup, P., Mohr, M., Nybo, L., Jensen, J. M., Nielsen, J. J., & Bangsbo, J. (2006). The Yo-Yo IR2 test: physiological response, reliability, and application to elite soccer. Medicine and Science in Sports and Exercise, 38(9), 1666-1673.

148
Krustrup, P., Mohr, M., Steensberg, A., Bencke, J., Kjaer, M., & Bangsbo, J. (2006). Muscle and blood metabolites during a soccer game: implications for sprint performance. Medicine and Science in Sports and Exercise, 38(6), 1165-1174.
Lago, C., Casais, L., Dominguez, E., & Sampaio, J. (2010). The effects of situational variables on distance covered at various speed in elite soccer. European Journal of Sport Science, 103-109.
Larsson, P. (2003). Global positioning system and sport-specific testing. Sports Medicine, 33(15), 1093-1101.
Larsson, P., & Henriksson-Larsen, K. (2001). The use of dGPS and simultaneous metabolic measurements during orienteering. Medicine and Science in Sports and Exercise, 33(11), 1919-1924.
Leger, L. A., & Lambert, J. (1982). A maximal multistage 20 m shuttle run test to predict VO2
Liebermann, D. G., Katz, L., Hughes, M. D., Bartlett, R. M., McClements, J., & Franks, I. M. (2002). Advances in the application of information technology to sport performance. Journal of Sports Sciences, 20(10), 755-769.
max. European Journal of Applied Physiology, 49, 1-5.
Lothian, F., & Farrally, M. (1994). A time-motion analysis of women's hockey. Journal of Human Movement Studies, 26, 255-265.
Lythe, J., & Kilding, A. E. (2011). Physical demands and physiological responses during elite field hockey. International Journal of Sports Medicine, 32(7), 523-528.
MacLeod, H., Bussell, C., & Sunderland, C. (2007). Time-motion analysis of elite women's field hockey, with particular reference to maximum intensity movement patterns. International Journal of Performance Analysis in Sport, 7(2), 1-12.
MacLeod, H., Morris, J., Nevill, A., & Sunderland, C. (2009). The validity of a non-differential global positioning system for assessing player movement patterns in field hockey. Journal of Sports Sciences, 27(2), 121-128.
Macutkiewicz, D., & Sunderland, C. (2011). The use of GPS to evaluate activity profiles of elite women hockey players during match-play. Journal of Sports Sciences, 29(9), 967-973.
Marcora, S., & Staiano, W. (2010). The limit to exercise tolerance in humans: mind over muscle? European Journal of Applied Physiology, 109, 763–770.
Martin, J., Smith, N. C., Tolfrey, K., & Jones, A. M. (2001). Activity analysis of English Premiership rugby football union refereeing. Ergonomics, 44(12), 1069-1075.
Mayhew, S. R., & Wenger, H. A. (1985). Time-motion analysis of professional soccer. Journal of Human Movement Studies, 11, 49-52.
McKenna, M. J., Patrick, J. D., Sandstrom, E. R., & Chennells, M. H. D. (1988). Computer-video analysis of activity patterns in Australian Rules Football. In T. Reilly, A. Lees, K. Davids & W. J. Murphy (Eds.), Science and Football (Vol. 1, pp. 274-281). London: E&FN Spon.
Meir, R., Arthur, D., & Forrest, M. (1993). Time and motion analysis of professional rugby league: a case study. Strength and Conditioning Coach, 3(1), 24-29.
Mohr, M., Ellingsgaard, H., Andersson, H., Bangsbo, J., & Krustrup, P. (2003). Physical demands in high-level female soccer - application of fitness tests to evaluate match performance. Journal of Sports Sciences, 22(6), 552-553.
Mohr, M., Krustrup, P., Andersson, H., Kirkendall, D. T., & Bangsbo, J. (2008). Match activities of elite women soccer players at different performance levels. Journal of Strength and Conditiong Research, 22(2), 341-349.
149
Mohr, M., Krustrup, P., & Bangsbo, J. (2003). Match performance of high-standard soccer players with special reference to development of fatigue. Journal of Sports Sciences, 21(7), 519-528.
Mohr, M., Krustrup, P., & Bangsbo, J. (2005). Fatigue in soccer: A brief review Journal of Sports Sciences, 23(6), 593-599.
Montgomery, P. G., Pyne, D. B., Cox, A. J., Hopkins, W. G., Minahan, C. L., & Hunt, P. H. (2008). Muscle damage, inflammation, and recovery interventions during a 3-day basketball tournament. European Journal of Sport Science, 8(5), 241-250.
Mujika, I., Santisteban, J., Impellizzeri, F., & Castagna, C. (2009). Fitness determinants of success in men's and women's football. Journal of Sports sciences, 27(2), 107-114.
Noakes, T. D. (2012). The Central Governor Model in 2012: eight new papers deepen our understanding of the regulation of human exercise performance. British Journal of Sports Medicine, 46(1), 1-3.
Odetoyinbo, K., Wooster, B., & Lane, A. (2009). The effect of a succession of matches on the activity profiles of professional soccer players. In T. Reilly & F. Korkusuz (Eds.), Science and Football VI (pp. 105-110). London: Routledge.
Osganach, C. P., S. Bernardini, R. Rinaldo, R. DiPrampero, P. (2009). Energy Cost and Metabolic Power in Elite Soccer: A New Match Analysis Approach. Medicine and Science in Sports and Exercise, 42(1), 170-178.
Peterson, C., Pyne, D. B., Portas, M., & Dawson, B. (2011). Comparison of player movment patterns between 1-day and test cricket. Journal of Strength & Conditioning Research 25(5), 1306-1311.
Peterson, C., Pyne, D. B., Portus, M., & Dawson, B. (2009). Validity and reliability of GPS units to monitor cricket-specific movement patterns. International Journal of Sports Physiology and Performance, 4(3), 381-393.
Podgórski, T., & Pawlak, M. (2011). A half century of scientific research in field hockey. Human Movement, 12(2), 108-123.
Pollard, R. (2002). Charles Reep (1904-2002): pioneer of notational and performance analysis in football. Journal of Sports Sciences, 20(10), 853-855.
Portas, M., Rush, C., Barnes, C., & Batterham, A. M. (2007). Method comparison of linear distance and velocity measurements with global positioning satellite (GPS) and timing gates. Journal of Sports Science and Medicine, 6(Supplement 10), 7-8.
Pyne, D. (2003). Interpreting the results of fitness testing. Paper presented at the International Science and Football Symposium, Melbourne, Australia.
Pyne, D., Petersen, C., Higham, G., & Cramer, N. (2010). Comparison Of 5- And 10-Hz GPS Technology For Team Sport Analysis. Medicine and Science in Sports and Exercise, 42(5)(May), 78.
Quarrie, K. L., & Hopkins, W. G. (2007). Changes in player characteristics and match activities in Bledisloe Cup rugby union from 1972 to 2004. Journal of Sports Science, 25, 895 – 903.
Rampinini, E., Bishop, D., Marcora, S. M., Ferrari Bravo, D., Sassi, R., & Impellizzeri, F. M. (2007). Validity of simple field tests as indicators of match-related physical performance in top-level professional soccer players. International Journal of Sports Medicine, 28(3), 228-237.

150
Rampinini, E., Coutts, A. J., Castagna, C., Sassi, R., & Impellizzeri, F. M. (2007). Variation in top-level soccer performance International Journal of Sports Medicine, 28(12), 1018–1024.
Rampinini, E., Impellizzeri, F. M., Castagna, C., Azzalin, A., Bravo, D. F., & Wisloff, U. (2008). Effect of match-related fatigue on short-passing ability in young soccer players. Medicine and Science in Sports and Exercise, 40(5), 934-942.
Rampinini, E., Impellizzeri, F. M., Castagna, C., Coutts, A. J., & Wisløff, U. (2009). Technical performance during soccer matches of the Italian Serie A league: Effect of fatigue and competitive level. Journal of Science and Medicine in Sport, 12(1), 227-233.
Rampinini, E., Sassi, R., Sassi, A., & Impellizzeri, F. M. (2004, July 3-6). Soccer performance: relationships with opponents. Paper presented at the 9th Annual Congress European College of Sport Science, Clermont-Ferrand, France.
Ramsbottom, R., Brewer, J., & Williams, C. (1988). A progressive shuttle run test to estimate maximal oxygen uptake. British Journal of Sports Medicine, 22, 141-144.
Reid, M., Duffield, R., Dawson, B., Baker, J., & Crespo, M. (2008). Quantification of the physiological and performance characteristics of on-court tennis drills. British Journal of Sports Medicine, 42, 146–151.
Reilly, T., Bangsbo, J., & Franks, A. (2000). Anthropometric and physiological predispositions for elite soccer. Journal of Sports Sciences, 18(9), 669-683.
Reilly, T., & Borrie, A. (1992). Physiology applied to field hockey. Sports Medicine, 14(1), 10-26.
Reilly, T., & Gilbourne, D. (2003). Science and football: a review of applied research in the football codes. Journal of Sports Sciences, 21(9), 693-705.
Reilly, T., & Thomas, V. (1976). A motion analysis of workrate in different positional roles in professional football match-play. Journal of Human Movement Studies, 2, 87-97.
Reilly , T., Williams, A. M., Nevill, A., & Franks, A. (2000). A multidisciplinary approach to talent identification in soccer. Journal of Sports Sciences, 18(9), 695-702.
Rey, E., Lago-Peñas, C., Lago-Ballesteros, J., Casais, L., & Dellal, A. (2010). The effect of cumulative fatigue on activity profiles of professional soccer players during a congested fixture period. Biology of Sport, 27, 181-185.
Roberts, A., Trewartha, G., & Stokes, K. A. (2006). A comparison of time-motion analysis methods for field-based sports. International Journal of Sports Physiology and Performance, 1, 386-397.
Rowsell, G., Coutts, A. J., & Reaburn , P. R. J. (2007). Effect of cold-water immersion on match running performance in high-level junior soccer players during a four-day tournament Journal of Science and Medicine in Sport, 10(6 (Supplement)), 24.
Sayers, M. (2000). Running techniques for field sport players. Sports Coach, 23, 26–27.
Schutz, Y., & Herren, R. (2000). Assessment of speed of human locomotion using a differential satellite global positioning system. Medicine and Science in Sports and Exercise, 32(3), 642-646.
Sirotic, A. C., & Coutts, A. J. (2007). Physiological and performance test correlates of prolonged, high-intensity, intermittent running performance in moderately trained women team sport athletes. Journal of Strength and Conditioning Research, 21(1), 138-144.

151
Sirotic, A. C., & Coutts, A. J. (2009). The reliability of using a computer-based tracking system for time-motion analysis of rugby league. International Journal of Performance Analysis in Sport, in review.
Sirotic, A. C., Coutts, A. J., Knowles, H., & Catterick, C. (2009). A comparison of match demands between elite and semi-elite rugby league competition. Journal of Sports Sciences, 27(3), 203-211.
Sirotic, A. C., Knowles, H., Catterick, C., & Coutts, A. J. (2011). Positional match demands of professional rugby league competition. Journal of Strength and Conditioning Research, accepted.
Sirotic, A. C., Russell, N. R., & Coutts, A. J. (2005). Time-motion analysis of elite and semi-elite rugby league. Journal of Science and Medicine in Sport, 8(4), s67.
Spencer, M., Bishop, D., Dawson, B., & Goodman, C. (2005). Physiological and metabolic responses of repeated-sprint activities:specific to field-based team sports. Sports Medicine, 35(12), 1025-1044.
Spencer, M., Lawrence, S., Rechichi, C., Bishop, D., Dawson, B., & Goodman, C. (2004). Time-motion analysis of elite field hockey, with special reference to repeated-sprint activity. Journal of Sports Sciences, 22(9), 843-850.
Spencer, M., Rechichi, C., Lawrence, S., Dawson, B., Bishop, D., & Goodman, C. (2005). Time-motion analysis of elite field hockey during several games in succession: A tournament scenario. Journal of science and medicine in sport / Sports Medicine Australia, 8(4), 382-391.
Tomlin, D. L., & Wenger, H. A. (2001). The relationship between aerobic fitness and recovery from high intensity intermittent exercise. Sports Medicine, 31(1), 1-11.
Townshend, A., Worringham, C., & Stewart, I. (2008). Assessment of speed and position during human locomotion using nondifferential GPS. Medicine Science Sports Exercise and Injury, 40(1), 124-132.
Van Gool, D., Van Gerven, D., & Boumans, J. (1988). The physiological load imposed on soccer players during real match-play. In T. Reilly, A. Lees, K. Davids & W. Murphy (Eds.), Science and Football (pp. 51-59). London: E & FN Spon.
Varley, M. C., Fairweather, I. H., & Aughey, R. J. (2012). Validity and reliability of GPS for measuring instantaneous velocity during acceleration, deceleration, and constant motion. Journal of Sports Science, 30(2), 121-127.
Wein, H. (1981). The advanced science of hockey. London Pelham Books. Williams, Lee, D., & Reilly, T. (1999). A quantitative analysis of matches played in
the 1991 – 92 and 1997 – 98 seasons. A report for F.A. Technical Department . In: Liverpool: Research Institute for Sport and Exercise Sciences, John Moores University.
Williams, & Morgan. (2009). Horizontal positioning error derived from stationary GPS units: A function of time and proximity to building infrastructure. International Journal of Performance Analysis of Sport, 9, 275-280.
Wisbey, B., Montgomery, P., & Pyne, D. (2007). Quantifying changes in AFL players game demands using GPS tracking: 2007 AFL season AFL Board Research Report (pp. 1-31). Melbourne: Australian Football League.
Wissell, D., Williams, M., & Lorenzen, C. (2010). Accuracy and stability of distance measured by Global Positioning System (GPS): implications for the sports scientist. Journal of Science and Medicine in Sport, 17.
152
Witte, T., & Wilson, A. (2004). Accuracy of non-differential GPS for the determination of speed over ground. Journal of Biomechanics, 37(12), 1891-1898.
Witte, T., & Wilson, A. (2005). Accuracy of WAAS-enabled GPS for the determination of position and speed over ground. [Short communication]. Journal of Biomechanics, 38(8), 1717-1722.
Young, W., Benton, D., Duthie, G., & Pryor, J. (2001). Resistance training for short sprints and maximum speed sprints. Strength and Conditioning Journal, 23(2), 7-13.

153
APPENDIX 1: INFORMATION FOR PARTICIPANTS
8.2.3 Study 1 & 2
1. The validity and reliability of GPS units for measuring distance in team sport
specific running patterns
2. Variability of GPS units for measuring distance in team sport movements
154
INFORMATION TO PARTICIPANTS INVOLVED IN RESEARCH
You are invited to participate
You are invited to participate in a research project entitled:
The validity and reliability of GPS units for measuring distance in team sport specific running patterns
This project will be conducted within the School of Exercise Science Victoria University by Dr Robert
Aughey and Ms Denise Jennings. This study will form part of a PhD study conducted by Ms Denise
Jennings.
Project explanation
Analysis of team sport players during competition provides valuable information regarding the
physiological requirements of matches and activity profiles of players. This information can
subsequently be used to enhance the specificity of training programs to better prepare athletes for the
rigors of competition. There have been numerous attempts to determine the physical demands of team
sports during competition.
1,2,3,4
Whilst the use of video-based time-motion analysis (TMA) has been well documented, 1,2,3,4 there is
little published data examining the use of Global Positioning Systems (GPS) for game and player
analysis.5 Video-based TMA, has a number of limitations. Specifically, the validity and reliability of
data collection and the time consuming nature of analysis 6
. GPS technology has the potential to
provide a more comprehensive, accurate and automated examination of player movements in invasion
style team sports (e.g. hockey, rugby, rugby league, soccer and Australian Rules football). Few studies
however, have investigated the reliability and validity of GPS technology for assessment of team sport
qualities.
At present conventional GPS devices sample at a rate of 1 hertz (Hz). Time-motion analysis in a
number of team sports has revealed that the majority of sprints are less than 2 seconds in duration or
performed over a distance of less than 20 m 7,8. In light of this, sampling at a rate of 1 Hz may be
insufficient to detect short high speed movements typical in team sports. With the development of new
technology, a higher sampling rate of 5 Hz is available. This sampling rate may increase the number of
high intensity sprints detected, providing a more accurate picture of the physiological characteristics
required in team sports.
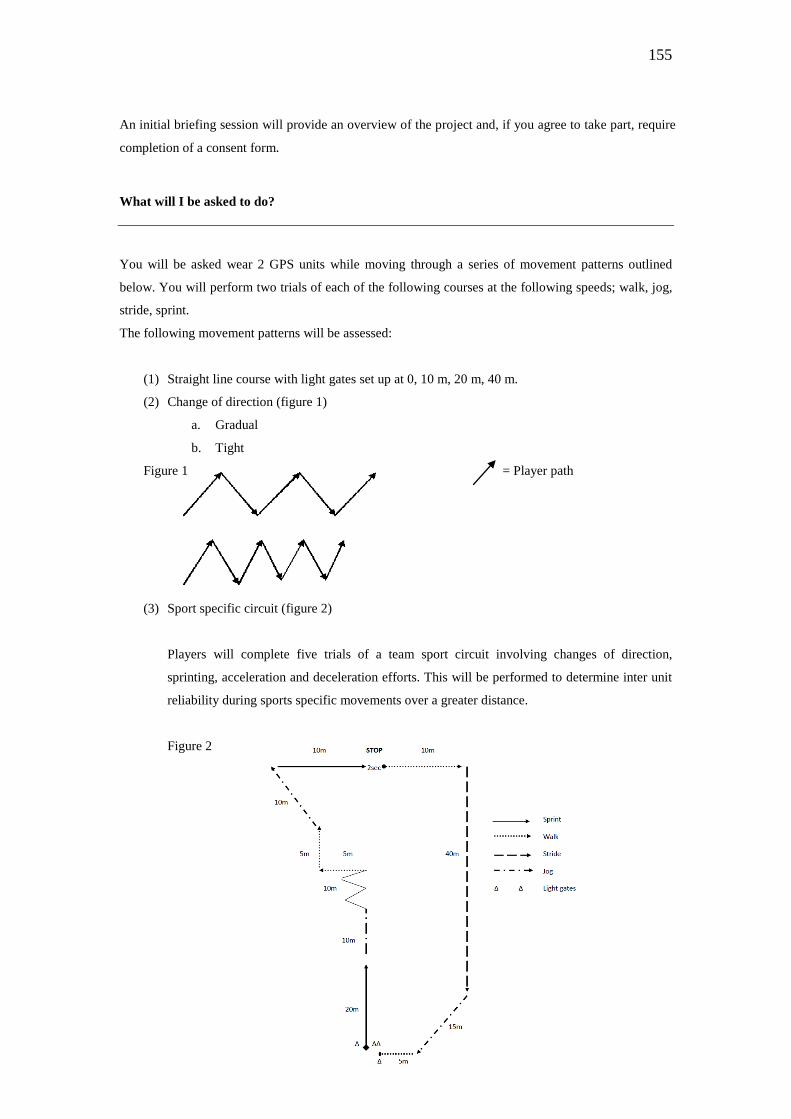
155
An initial briefing session will provide an overview of the project and, if you agree to take part, require
completion of a consent form.
What will I be asked to do?
You will be asked wear 2 GPS units while moving through a series of movement patterns outlined
below. You will perform two trials of each of the following courses at the following speeds; walk, jog,
stride, sprint.
The following movement patterns will be assessed:
(1) Straight line course with light gates set up at 0, 10 m, 20 m, 40 m.
(2) Change of direction (figure 1)
a. Gradual
b. Tight
Figure 1 = Player path
(3) Sport specific circuit (figure 2)
Players will complete five trials of a team sport circuit involving changes of direction,
sprinting, acceleration and deceleration efforts. This will be performed to determine inter unit
reliability during sports specific movements over a greater distance.
Figure 2

156
How will the information I give be used?
Information collected will be downloaded and analysed to assess the following variables:
- TD travelled 1 Hz - TD travelled 5 Hz
This information will subsequently be used to assess the reliability, validity and variability of the GPS
units to measure distances commonly seen in team sports.
What are the potential risks of participating in this project?
There are no physical risks for participants involved with this study. A thorough warm up will be
performed prior to data collection of each movement pattern.
How will this project be conducted?
The project will be performed prior to training at the Essendon Football Club training ground. Data will
be collected from the GPS units and following this analysis, results will be presented back to the group
during an information session. The results from this study may have implications to the information
collected from the GPS units during matches throughout the season.
Who is conducting the study?
This study is being conducted by Victoria University.
For further information regarding this study, please contact the Principal Investigator, Dr Rob Aughey
on, 9919 5551 or email: [email protected] or Denise Jennings at the Essendon Football Club,
Physical Preparation Department on, 92300220 or email: [email protected] .
Any queries about your participation in this project may be directed to the Principal Researcher listed
above. If you have any queries or complaints about the way you have been treated, you may contact the
Secretary, Victoria University Human Research Ethics Committee, Victoria University, PO Box 14428,
Melbourne, VIC, 8001 phone (03) 9919 4781.

157
8.2.4 Study 3 & 4
3. International field hockey players perform more high intensity running than
national level counterparts,
4. GPS analysis of international field hockey tournament

158
INFORMATION TO PARTICIPANTS INVOLVED IN RESEARCH
You are invited to participate
You are invited to participate in a research project entitled:
A GPS analysis of physical demands in domestic and international field hockey
This project will be conducted within the School of Exercise Science Victoria University by
Dr Robert Aughey and Ms Denise Jennings. This study will form part of a PhD study
conducted by Ms Denise Jennings.
Project explanation
Analysis of team sport players during competition provides valuable information regarding
the physiological requirements of matches and activity profiles of players. This information
can subsequently be used to enhance the specificity of training programs to better prepare
athletes for the rigors of competition. There have been numerous attempts to determine the
physical demands of team sports during competition.
Until recently, it has been difficult to quantify player movement demands as it has required
manual analysis with only one player being analysed at a time. However, with recent
technological developments there are now many systems that can analyse movement patterns
of many players in team sports simultaneously, including manual and computer-assisted
video-based time-motion analysis systems, triangulation of miniature electronic transmitters
and global positioning system (GPS) devices. These advances have lead to the widespread use
of these technologies in many sports. Specifically, GPS technology is used by many sports to
quantify movement demands during training and competition.
In field hockey, there are few studies that have utilised this technology for analysis of
competition demands at the elite level. To date no studies have investigated or compared the
physiological demands of elite men’s national level competition or elite international

159
competitions. This information may be useful for coaches and conditioning staff in designing
appropriate training drills for specific role requirements of individual players and assist in the
progression of players from sub-elite to elite levels of competition.
An initial briefing session will provide an overview of the project and, if you agree to take
part, require completion of a consent form.
What will I be asked to do?
You will be asked for permission to analyse the GPS files collected during the 2008
Australian Hockey League (AHL) tournament to identify the physical and positional demands
of this competition.
How will the information I give be used?
Information collected will be downloaded and analysed to assess the following variables:
- TD travelled
- Meters covered per minute of play
- High intensity running distance
- High intensity running meters per minute of play
This information will subsequently be used to enhance the specificity of training programs to
better prepare athletes for the rigors of international competition
What are the potential risks of participating in this project?
There are no physical risks for participants involved with this study, as we are analysing
data already collected by sport science staff associated with the team.
How will this project be conducted?
The project will require analysis and data mining of GPS files already collected. Following
this analysis, results will be presented back to the group during an information session. The
results from this study may have implications to the design of your physical preparation
program for future tournaments.

160
Who is conducting the study?
This study is being conducted by Victoria University.
For further information regarding this study, please contact the Principal Investigator, Dr Rob
Aughey on, 9919 5551 or email: [email protected] or Denise Jennings at the
Essendon Football Club, Physical Preparation Department on, 92300220 or email:
Any queries about your participation in this project may be directed to the Principal
Researcher listed above.
If you have any queries or complaints about the way you have been treated, you may contact
the Secretary, Victoria University Human Research Ethics Committee, Victoria University,
PO Box 14428, Melbourne, VIC, 8001 phone (03) 9919 4781.
161
APPENDIX 2: INFORMED CONSENT FORM
8.2.5 Study 1 & 2
1. The validity and reliability of GPS units for measuring distance in team sport
specific running patterns
2.
Variability of GPS units for measuring distance in team sport movements

162
CONSENT FORM FOR PARTICIPANTS INVOLVED IN RESEARCH
INFORMATION TO PARTICIPANTS:
We would like to invite you to be a part of a study into the validity and reliability of GPS units
for measuring distance in team sport specific running.
The aims of this study are to assess the reliability and validity at both 1 Hz and 5 Hz of the
MinimaxX GPS device for the assessment of different movement patterns and distances
common to team sport play.
This information will be useful for coaches and conditioning staff in improving the accuracy
of the information used to describe performance during training and team sport competition.
CERTIFICATION BY SUBJECT
I,
of
certify that I am at least 18 years old* and that I am voluntarily giving my consent to
participate in the study:
The validity and reliability of GPS units for measuring distance in team sport specific running
patterns being conducted at Victoria University by: Dr Rob Aughey
I certify that the objectives of the study, together with any risks and safeguards associated with
the procedures listed hereunder to be carried out in the research, have been fully explained to
me by Denise Jennings and that I freely consent to participation involving the below
mentioned procedures:
• GPS data collection during 3 different movement patterns
• Analysis of GPS data collected during sampling session

163
I certify that I have had the opportunity to have any questions answered and that I understand
that I can withdraw from this study at any time and that this withdrawal will not jeopardise me
in any way.
I have been informed that the information I provide will be kept confidential.
Signed:
Date:
Any queries about your participation in this project may be directed to the researcher Dr. Rob
Aughey, ph. 03 9919 5551. If you have any queries or complaints about the way you have
been treated, you may contact the Secretary, Victoria University Human Research Ethics
Committee, Victoria University, PO Box 14428, Melbourne, VIC, 8001 phone (03) 9919 4781
[*please note: Where the participant/s are aged under 18, separate parental consent
is required; where the participant/s are unable to answer for themselves due to
mental illness or disability, parental or guardian consent may be required.]

164
CONSENT FORM FOR PARTICIPANTS INVOLVED IN RESEARCH
INFORMATION TO PARTICIPANTS:
We would like to invite you to be a part of a study into the analysis of physical
demands in domestic and international field hockey.
The aims of this study are:
(1) To determine the physical demands and positional differences in national level and
international field hockey competition
(2) To compare the physical demands of national level and international field hockey,
and
(3) To examine high intensity running demands during different competition levels
(domestic and international) for players in various playing positions.
This information will be useful for coaches and conditioning staff in designing
appropriate training drills for specific role requirements of individual players and
assist in the progression of players from sub-elite to elite levels of competition.
CERTIFICATION BY SUBJECT
I,
of
certify that I am at least 18 years old* and that I am voluntarily giving my consent to
participate in the study:
The GPS analysis of physical demands in domestic and international field hockey
being conducted at Victoria University by: Dr Rob Aughey
I certify that the objectives of the study, together with any risks and safeguards
associated with the procedures listed hereunder to be carried out in the research, have
been fully explained to me by Denise Jennings and that I freely consent to
participation involving the below mentioned procedures:

165
• Analysis of GPS data collected during the 2008 AHL tournament
• Analysis of GPS data collected during the 2009 Champions Trophy tournament
I certify that I have had the opportunity to have any questions answered and that I
understand that I can withdraw from this study at any time and that this withdrawal
will not jeopardise me in any way.
I have been informed that the information I provide will be kept confidential.
Signed:
Date:
Any queries about your participation in this project may be directed to the researcher
Dr. Rob Aughey, ph. 03 9919 5551. If you have any queries or complaints about the
way you have been treated, you may contact the Secretary, Victoria University Human
Research Ethics Committee, Victoria University, PO Box 14428, Melbourne, VIC,
8001 phone (03) 9919 4781
[*please note: Where the participant/s are aged under 18, separate parental consent is
required; where the participant/s are unable to answer for themselves due to mental
illness or disability, parental or guardian consent may be required.]