2013 Group Practice Reporting Option (GPRO) Web Interface ...
Upload
investorsgoproCategory
view
55download
0
Q1 2016
Preliminary Earnings
Results SummaryMay 5, 2016

Safe Harbor Statement
Some of the information in this presentation may contain projections or other forward-looking statements
regarding future events, including but not limited to, those regarding our business outlook for 2016.
These statements involve risks and uncertainties, and actual events or results may differ materially.
Among the important factors that could cause actual results to differ materially from those in the
forward-looking statements are our dependence on sales of our cameras and accessories for
substantially all of our revenue and the effect of a fall in sales during the holiday season; the fact that we
do not expect to continue to grow in the future at the same rate as we have in the past, that we may fail
to manage our growth, and profitability in recent periods might not be indicative of future performance;
any inability to successfully manage frequent product introductions and transitions or to anticipate
consumer preferences and successfully develop desirable products; the risks associated with our
expected entrance into the consumer drone market; the effects of the highly competitive market in which
we operate; the risks related to inventory, purchase commitments and long-lived assets; difficulty in
accurately predicting our future customer demand; the importance of maintaining the value and
reputation of our brand; and other factors detailed in the Risk Factors section of our Annual Report on
Form 10-K for the year ended December 31, 2015, which is on file with the Securities and Exchange
Commission. These forward-looking statements speak only as of the date hereof or as of the date
otherwise stated herein. GoPro disclaims any obligation to update these forward-looking statements.
2

Q1 2016 Summary Overview
• We estimate unit channel sell-thru exceeded unit sell-in by approximately 50%. Q1 2016 revenue of $183.5 million, down 49%
year-over-year and 58% sequentially
• Estimated unit sell-through down less than 10% when compared to Q1 2015 (which benefited from HERO4 launch)
• Average selling price of camera units shipped up 16% sequentially, excluding price protection related charges in both periods,
and down slightly year-over-year
• Our $399 and above cameras combined accounted for over 50% of units shipped; our $199 and below cameras accounted for
over 40% of units shipped
• According to NPD, HERO4 Silver remains the best-selling digital image camera* on a unit and dollar basis in North America.
HERO4 Session rose to the #2 Best-Selling digital image camera* on a unit basis in North America, up from #8 in Q4 2015.
• Launched GoPro Desktop App and acquired Replay and Splice, two mobile editing apps, for cash of slightly over $100 million
• Net inventory of $139.7 million, down 25.8% from year-end (lowest level of inventory since Q3 2014)
• Cash and investments of $388.7 million, down $85 million from year-end (including acquisition payments of $45 million)
• Secured $250 million asset-backed credit facility; no borrowings have been made to date
* Digital image camera includes camcorders, digital point & shoot and detachable lens cameras3

Use of Non-GAAP Metrics
We report gross profit, gross margin, operating expenses, operating income (loss), operating margin (loss), net
income (loss) and diluted net income (loss) per share in accordance with U.S. generally accepted accounting
principles (GAAP) and additionally on a non-GAAP basis. Non-GAAP items exclude, where applicable, the
effects of stock-based compensation, acquisition-related costs, restructuring costs and the tax impact of these
items. Additionally, we report non-GAAP adjusted EBITDA. We believe that non-GAAP information is useful
because it can enhance the understanding of our ongoing economic performance. We use non-GAAP
reporting internally to evaluate and manage our operations. We have chosen to provide this information to
investors to enable them to perform comparisons of operating results in a manner similar to how we analyze
our own operating results.
A full reconciliation of GAAP to non-GAAP financial data can be found in the appendix to this slide package
and in our Q1 2016 earnings press release issued on May 5, 2016, which should be reviewed in conjunction
with this presentation.
4

Q1 2016 Actuals vs. Guidance
5
($ in millions)ActualsQ1 2016
GuidanceQ1 2016
Actuals vs. Guidance Comments
Revenue (1) $183.5 $160.0 - $180.0 Above range Higher than anticipated shipments of HERO Session
Gross margin (2) 33.0% 36% +/- 100bps Below range Excluding charges totaling $8 million related to legacy products, gross margin would have been 36.8%
Operating expenses (2) $157.5 $165.0 - $170.0 Below range
Restructuring charges $6.5 $5.0 - $10.0 Within range
Adjusted EBITDA loss (2) ($86.8) $(95) +/- $2.5 Above range
(1) Revenue guidance for full year 2016 remains in the range of $1.35 - $1.5 billion.
(2) Non-GAAP metric. See reconciliation in Appendix.

Quarterly Non-GAAP Income Statement Summary
6
Q1 2016 vs. Q4 2015 Q1 2016 vs. Q1 2015
($ in millions, except EPS) Q1 2016 Q4 2015 Q1 2015 $ Change % Change $ Change % Change
Revenue $ 183.5 $ 436.6 $ 363.1 $ (253.1) (58.0)% $ (179.6) (49.5)%
Gross margin* 33.0% 29.6% 45.2% 340 bps (1,220) bps
Operating expenses* $ 157.5 $ 150.8 $ 115.1 $ 6.7 4.4% $ 42.4 36.8%
Operating income (loss)* $ (96.8) $ (21.6) $ 49.1 $ (75.2) 347.5% $ (145.9) (297.1)%
Operating margin (loss)* (52.8)% (5.0)% 13.5% (5,780) bps (6,630) bps
Net income (loss)* $ (86.7) $ (11.4) $ 35.6 $ (75.3) 661.1% $ (122.3) (343.5)%
Diluted earnings (loss) per share* $ (0.63) $ (0.08) $ 0.24 $ (0.55) 687.5% $ (0.87) (362.5)%
* Non-GAAP metric. See reconciliation in Appendix.
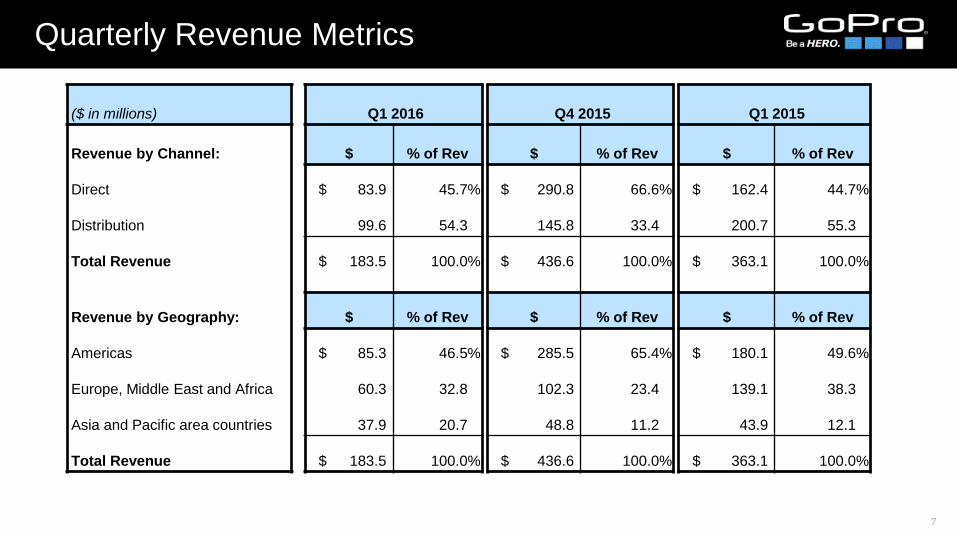
Quarterly Revenue Metrics
7
($ in millions) Q1 2016 Q4 2015 Q1 2015
Revenue by Channel: $ % of Rev $ % of Rev $ % of Rev
Direct $ 83.9 45.7% $ 290.8 66.6% $ 162.4 44.7%
Distribution 99.6 54.3 145.8 33.4 200.7 55.3
Total Revenue $ 183.5 100.0% $ 436.6 100.0% $ 363.1 100.0%
Revenue by Geography: $ % of Rev $ % of Rev $ % of Rev
Americas $ 85.3 46.5% $ 285.5 65.4% $ 180.1 49.6%
Europe, Middle East and Africa 60.3 32.8 102.3 23.4 139.1 38.3
Asia and Pacific area countries 37.9 20.7 48.8 11.2 43.9 12.1
Total Revenue $ 183.5 100.0% $ 436.6 100.0% $ 363.1 100.0%
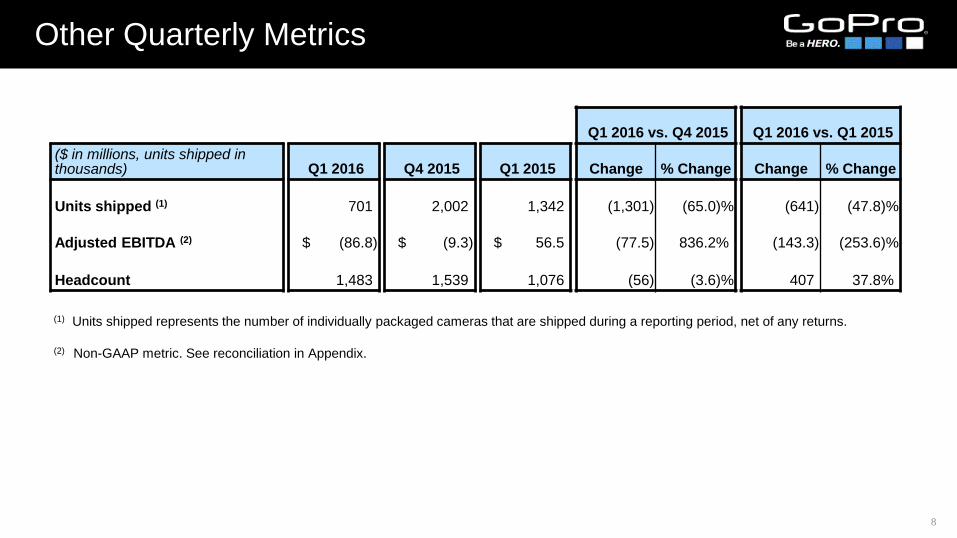
Other Quarterly Metrics
8
Q1 2016 vs. Q4 2015 Q1 2016 vs. Q1 2015
($ in millions, units shipped in thousands) Q1 2016 Q4 2015 Q1 2015 Change % Change Change % Change
Units shipped (1) 701 2,002 1,342 (1,301) (65.0)% (641) (47.8)%
Adjusted EBITDA (2) $ (86.8) $ (9.3) $ 56.5 (77.5) 836.2% (143.3) (253.6)%
Headcount 1,483 1,539 1,076 (56) (3.6)% 407 37.8%
(1) Units shipped represents the number of individually packaged cameras that are shipped during a reporting period, net of any returns.
(2) Non-GAAP metric. See reconciliation in Appendix.

Selected Balance Sheet Metrics
9
Q1 2016 vs. Q4 2015 Q1 2016 vs. Q1 2015
($ in millions) Q1 2016 Q4 2015 Q1 2015 Change % Change Change % Change
Cash, cash equivalents andmarketable securities $ 388.7 $ 474.1 $ 491.9 $ (85.4) (18.0)% $ (103.2) (21.8)%
Days sales outstanding 22.8 30.0 26.3 (7.2) (24.0)% (3.5) (13.3)%
Inventory $ 139.7 $ 188.2 $ 164.0 $ (48.5) (25.8)% $ (24.3) (14.8)%
Annualized inventory turns 3.0 5.1 5.0 (2.1) (41.2)% (2.0) (40.0)%
Inventory days 102.3 55.1 74.2 47.2 85.7% 28.1 37.9%

Appendix: GAAP to Non-GAAP Reconciliation
10
To supplement our unaudited selected financial data presented on a basis consistent with GAAP, we disclose certain non-GAAP
financial measures, including non-GAAP gross profit, gross margin, operating expenses, operating income (loss), operating margin
(loss), net income (loss), earnings (loss) per share and adjusted EBITDA. These non-GAAP measures are not in accordance with,
nor serve as an alternative for GAAP. We believe that these non-GAAP measures have limitations in that they do not reflect all of
the amounts associated with our GAAP results of operations. These non-GAAP measures should only be viewed in conjunction
with corresponding GAAP measures.
In calculating non-GAAP financial measures, we exclude certain items to facilitate a review of the comparability of our core
operating performance on a period-to-period basis. The excluded items represent stock-based compensation and charges that are
primarily driven by discrete events that we do not consider to be directly related to core operating performance. We use non-GAAP
measures to evaluate the core operating performance of our business, for comparison with forecasts and strategic plans and for
calculating return on investment. In addition, management’s incentive compensation is determined using non-GAAP measures.
Since we find these measures to be useful, we believe that investors benefit from seeing results reviewed by management in
addition to seeing GAAP results. We believe that these non-GAAP measures, when read in conjunction with our GAAP financials,
provide useful information to investors by facilitating:
• the comparability of our on-going operating results over the periods presented;
• the ability to identify trends in our underlying business; and
• the comparison of our operating results against analyst financial models and operating results of other public companies
that supplement their GAAP results with non-GAAP financial measures.

Appendix: GAAP to Non-GAAP Reconciliation
11
The following are explanations of each type of adjustment that we incorporate into non-GAAP financial measures:
● Stock-based compensation expense relates to equity awards granted primarily to our workforce. We exclude stock-based
compensation expense because we believe that the non-GAAP financial measures excluding this item provide meaningful
supplemental information regarding operational performance. In particular, we note that companies calculate stock-based
compensation expense for the variety of award types that they employ using different valuation methodologies and
subjective assumptions. These non-cash charges are not factored into our internal evaluation of net income as we believe
their inclusion would hinder our ability to assess core operational performance. We believe that excluding this expense
provides greater visibility to the underlying performance of our business operations, facilitates comparison of our results with
other periods, and may also facilitate comparison with the results of other companies in our industry.
● Acquisition-related costs include the amortization of acquired intangible assets (primarily consisting of acquired technology),
and third-party transaction costs incurred for legal and other professional services. These costs are not factored into our
evaluation of potential acquisitions, or of our performance after completion of the acquisitions, because they are not related
to our core operating performance, and the frequency and amount of such costs vary significantly based on the timing and
magnitude of our acquisition transactions and the maturities of the businesses being acquired.
● Restructuring costs primarily include severance-related costs recorded in connection with our global workforce reduction in
January 2016. We believe that excluding this expense provides greater visibility to the underlying performance of our
business operations, facilitates comparison of our results with other periods, and may also facilitate comparison with the
results of other companies in our industry.
● Adjustment for taxes relates to the tax effect of the adjustments that we incorporate into non-GAAP measures in order to
provide a more meaningful measure of non-GAAP net income. We believe that these adjustments provide us with the ability
to more clearly view trends in our core operating performance.

Appendix: GAAP to Non-GAAP Reconciliation
12
Three months ended
(in thousands, except per share data)March 31,
2016
March 31,
2015
GAAP net income (loss) $ (107,459) $ 16,752
Stock-based compensation:
Cost of revenue 357 283
Operating expenses 15,374 26,218
Total stock-based compensation 15,731 26,501
Acquisition-related costs:
Cost of revenue 222 222
Operating expenses 2,176 120
Total acquisition-related costs 2,398 342
Restructuring costs:
Cost of revenue 364 —
Operating expenses 6,144 —
Total restructuring costs 6,508 —
Income tax adjustments (3,918) (7,976)
Non-GAAP net income (loss) $ (86,740) $ 35,619
GAAP shares for diluted net income (loss) per share 137,543 148,573
Non-GAAP shares for diluted net income (loss) per share 137,543 148,573
Non-GAAP diluted net income (loss) per share $ (0.63) $ 0.24

Appendix: GAAP to Non-GAAP Reconciliation
13
Three months ended
($ in thousands)March 31,
2016
December 31,
2015
March 31,
2015
GAAP gross profit $ 59,714 $ 128,511 $ 163,733
Stock-based compensation 357 449 283
Acquisition-related costs 222 222 222
Restructuring costs 364 — —
Non-GAAP gross profit $ 60,657 $ 129,182 $ 164,238
GAAP gross profit as a % of revenue 32.5% 29.4% 45.1%
Stock-based compensation 0.2 0.1 0.1
Acquisition-related costs 0.1 0.1 —
Restructuring costs 0.2 — —
Non-GAAP gross profit as a % of revenue 33.0% 29.6% 45.2%
GAAP operating expenses $ 181,149 $ 169,805 $ 141,465
Stock-based compensation (15,374) (17,671) (26,218)
Acquisition-related costs (2,176) (1,323) (120)
Restructuring costs (6,144) — —
Non-GAAP operating expenses $ 157,455 $ 150,811 $ 115,127

Appendix: GAAP to Non-GAAP Reconciliation
14
Three months ended
($ in thousands)March 31,
2016
December 31,
2015
March 31,
2015
GAAP operating income (loss) $ (121,435) $ (41,294) $ 22,268
Stock-based compensation 15,731 18,120 26,501
Acquisition-related costs 2,398 1,545 342
Restructuring costs 6,508 — —
Non-GAAP operating income (loss) $ (96,798) $ (21,629) $ 49,111
GAAP operating income (loss) as a % of revenue (66.2)% (9.5)% 6.1%
Stock-based compensation 8.6 4.1 7.3
Acquisition-related costs 1.3 0.4 0.1
Restructuring costs 3.5 — —
Non-GAAP operating income (loss) as a % of revenue (52.8%) (5.0)% 13.5%

15
Appendix: Adjusted EBITDA Reconciliation
Three months ended
(in thousands)March 31,
2016
March 31,
2015
GAAP net income (loss) $ (107,459) $ 16,752
Income tax expense (benefit) (14,283) 3,272
Interest (income) expense, net (334) 65
Depreciation and amortization 8,323 5,369
POP display amortization 4,743 4,548
Stock-based compensation 15,731 26,501
Restructuring costs 6,508 —
Adjusted EBITDA $ (86,771) $ 56,507