GOVERNMENTS AS PARTNERS: THE ROLE OF COLLABORATION … · startup innovation extends openness and...
60
1 GOVERNMENTS AS PARTNERS: THE ROLE OF COLLABORATION IN CLEANTECH STARTUP INNOVATION Claudia Doblinger a,b* , Kavita Surana a , Laura Diaz Anadon a,c a Kennedy School of Government, Harvard University, Cambridge MA, 02138. b Department of Innovation and Technology Management, University of Regensburg, Germany c Department of Science, Technology, Engineering & Public Policy, University College London * Corresponding author: [email protected] NOT FOR CITATION OR DISTRIBUTION WITHOUT PERMISSION OF THE AUTHORS ABSTRACT Governments around the world are working towards accelerating innovation in clean energy technologies to meet rising energy demand and mitigate climate change. Policymakers shape the ecosystem in which startups innovate in various ways, ranging from R&D grants to technology and market collaborations. However, beyond government financing for R&D and the steering of market demand, there is little understanding of the role of governments as partners for joint technology development, for technology transfer through licenses, or as customers. We build on research on collaborative innovation and draw on resource dependence theory to highlight the role of collaboration with government organizations for startup innovation when compared with other firms, non-governmental research organizations and not-for-profit organizations. We develop a novel dataset of 783 US cleantech startups from 2008 to 2012 to quantify the innovation impact of technology development, licensing, and market collaborations between startups and government organizations as well as other partners. Our findings show that technology development and licensing with government organizations are associated with increased patenting activity and financial investments. Overall, the positive association between technology development, public licenses, and startup innovation extends openness and alliance perspectives on innovation and contributes to the emerging research on the role of governments in entrepreneurial ecosystems. Keywords: Cleantech, Startups, Innovation, Public Policy, Openness, Entrepreneurship, Collaboration, Ecosystems Acknowledgements This research was funded by the Energy Technology Innovation Policy (ETIP) group at the Belfer Center of Science and International Affairs at the Harvard Kennedy School. The authors are grateful to support from the i3 Cleantech Group for providing access to their database.
Transcript of GOVERNMENTS AS PARTNERS: THE ROLE OF COLLABORATION … · startup innovation extends openness and...

1
GOVERNMENTS AS PARTNERS: THE ROLE OF COLLABORATION IN CLEANTECH
STARTUP INNOVATION
Claudia Doblingera,b*
, Kavita Suranaa, Laura Diaz Anadon
a,c
a Kennedy School of Government, Harvard University, Cambridge MA, 02138.
b Department of Innovation and Technology Management, University of Regensburg, Germany
c Department of Science, Technology, Engineering & Public Policy, University College London
* Corresponding author: [email protected]
NOT FOR CITATION OR DISTRIBUTION WITHOUT PERMISSION OF THE AUTHORS
ABSTRACT
Governments around the world are working towards accelerating innovation in clean
energy technologies to meet rising energy demand and mitigate climate change. Policymakers
shape the ecosystem in which startups innovate in various ways, ranging from R&D grants to
technology and market collaborations. However, beyond government financing for R&D and
the steering of market demand, there is little understanding of the role of governments as
partners for joint technology development, for technology transfer through licenses, or as
customers. We build on research on collaborative innovation and draw on resource
dependence theory to highlight the role of collaboration with government organizations for
startup innovation when compared with other firms, non-governmental research organizations
and not-for-profit organizations. We develop a novel dataset of 783 US cleantech startups
from 2008 to 2012 to quantify the innovation impact of technology development, licensing,
and market collaborations between startups and government organizations as well as other
partners. Our findings show that technology development and licensing with government
organizations are associated with increased patenting activity and financial investments.
Overall, the positive association between technology development, public licenses, and
startup innovation extends openness and alliance perspectives on innovation and contributes
to the emerging research on the role of governments in entrepreneurial ecosystems.
Keywords: Cleantech, Startups, Innovation, Public Policy, Openness, Entrepreneurship,
Collaboration, Ecosystems
Acknowledgements This research was funded by the Energy Technology Innovation Policy (ETIP) group at the Belfer
Center of Science and International Affairs at the Harvard Kennedy School. The authors are
grateful to support from the i3 Cleantech Group for providing access to their database.
2
INTRODUCTION
Mitigating global climate change, reducing local air pollution from fossil powered electricity
and transportation, and providing reliable and affordable energy for all represent some of the major
challenges of the 21st century (United Nations, 2015). There is wide consensus in political,
academic, and economic arenas that technological innovation in the energy sector—and particularly
in the clean power and transportation, or cleantech sector—is essential for addressing these
challenges (Anadon, 2012; Mowery, Nelson, & Martin, 2010). The design of public policies to
accelerate cleantech innovation has become a priority in countries around the world, as reflected in
the 2015 Paris Agreement which recognizes that “accelerating, encouraging and enabling
innovation is critical for an effective, long-term global response to climate change” (UNFCC, 2015,
Article 10: 27). The high interest of governments in the cleantech sector is further explained by the
fact that the provision of reliable and affordable energy is also essential for wellbeing and economic
development (United Nations, 2015), even though the generation, supply and distribution of energy
is largely controlled by private firms in many countries, especially in the United States (Chu &
Majumdar, 2012; Koonin & Gopstein, 2011). The heterogeneity of technologies (e.g., from nuclear
power plants to refrigerators), markets (e.g., from centralized electricity to personal transport), and
organizations (e.g., large firms, government agencies, startups, universities) in the energy sector
(Anadon & Holdren, 2009), as well as the multiple policy goals (Anadon, 2012) and coordination
failures (Nanda, Younge, & Fleming, 2015) suggest that a multiplicity of policies, collaborations,
and coordination efforts are needed to stimulate innovation. The most recent example of the
recognition of the need for such collaboration was an initiative by the governments of 20 major
3
global economies and 27 investors from the private sector to support cleantech innovation,
announced in parallel to the Paris Agreement on climate.1
In the past, government-firm collaborations for innovation were characterized by a long-term
and relatively stable funding for public and large private actors, linkages to government and policy,
as well as close integration of R&D and use.2 More recently, governments are seeking to promote
innovation within high-risk startups—i.e., recently founded entrepreneurial firms—that are
perceived to be more agile and flexible in the near-term for developing novel solutions to market
opportunities (Guzman & Stern, 2015). However, while quickness and agility may be important in
sectors with short development cycles (e.g., IT) (Bettis & Hitt, 1995), the cleantech sector requires
a longer-term perspective due to technology development cycles that can take up to several decades
(Grubler, Nakićenović, & Victor, 1999; Markard, Raven, & Truffer, 2012). In the cleantech sector,
this long-term perspective is primarily offered by government organizations (e.g., National
Renewable Energy Laboratory (NREL) or the Department of Energy (DOE)),3
universities, and, to a
lesser extent, other established firms (Jones, Anadon, & Narayanamurti, 2014). Government
organizations have been engaged in cleantech innovation activities for decades and tend to have a
longer-term view (Anadon, Bunn, & Narayanamurti, 2014; Westwick, 2003). Given the short-term
imperative for achieving successful outcomes and the limited resources available to startups (Baum,
1996; Baum, Calabrese, & Silverman, 2000), 4
we consider that collaboration with government
organizations might be particularly important for increasing innovation activities of cleantech
1 This initiative is called Mission Innovation, committing the governments to accelerate public and private global clean technology
innovation and double their public research and development (R&D) investments by 2020. The private sector’s Breakthrough
Energy Coalition, initially comprising 27 private investors, committed to investing early in technologies that can help mitigate
climate change and bring in long-term ‘patient’ capital investments. 2 Examples of such projects in the US include the Apollo project that took men to the Moon in 1969, research on military
technologies at DARPA, or the large corporate R&D laboratories such as Bell Labs (Bonvillian, 2014; Narayanamurti &
Odumosu, 2016; Riordan & Hoddeson, 1998). 3 For example, governmental organizations such as the DOE or NREL provide assistance for technology and market readiness, and
the Department of Defense (DoD) orders or acquires certain products or technologies from startups. 4 Startup success may be indicated through new products, patents, financing deals, IPO that act as distinct signals to capital
markets to attract financing within few years after founding.

4
startups. Yet, despite the recognition of the importance of collaboration to foster private-sector
innovation in general (Powell, Koput, & Smith-Doerr, 1996) and the growing policy interest in how
to replicate the level of high-impact entrepreneurial innovation occurring in local clusters like
Silicon Valley, prior research on cleantech innovation has focused on the role of governments as
direct financiers of startup R&D through grants (e.g., Howell, 2015) or in supporting innovation
through the design of deployment (or market creation) policies for firms of all sizes (Choi &
Anadón, 2014; Doblinger, Dowling, & Helm, 2016; Hoppmann, Peters, Schneider, & Hoffmann,
2013; Nemet, 2009). Thus, the question of how governments can promote cleantech innovation by
being direct collaborators in terms of joint technology development, licensing, or as customers for
startups has largely remained unaddressed. 5
While the importance of collaboration in fostering innovation at the firm-level is a subject of
inquiry in several streams of literature, existing research has largely overlooked the specific role of
collaborating with governmental partners. These partners might not only possess key technological
resources but also have different goals, since their aim is to shape innovation to meet societal goals
rather than to obtain private returns. These streams of literature include research on firm openness
(e.g., Chesbrough, 2003; Laursen & Salter, 2006; Laursen & Salter, 2014), interorganizational
alliances (Baum et al., 2000; Powell et al., 1996), (technological) innovation systems (e.g., Bergek,
Jacobsson, Carlsson, Lindmark, & Rickne, 2008; Freeman, 1987; Hekkert, Suurs, Negro,
Kuhlmann, & Smits, 2007; Lundvall, 1992) , knowledge and innovation ecosystems (Adner, 2006;
Clarysse, Wright, Bruneel, & Mahajan, 2014; Iansiti & Levien, 2004), and, what has emerged more
recently as the concept of entrepreneurial ecosystems (e.g., Autio, Kenney, Mustar, Siegel, &
Wright, 2014). The common suggestion that holds across these research streams—often derived
5 We are interested in the effects of collaborative activities on knowledge generation and therefore do not explicitly investigate the
relationship between startups and relations to financial partners. However, as access to financing (e.g., venture capital, corporate
or government funding) is clearly vital for startups, we include prior financing deals as a control variable.
5
from empirical research in the biotech, manufacturing, or IT sectors—is that collective value
creation and joint innovation within (local) networks are more productive than firms or research
institutes working on their own. More specifically, research on openness and interorganizational
alliances suggests that firms could generally benefit from actively searching for knowledge from
many different types of knowledge channels, including those enabled by customers, suppliers, or
research institutes (Baum et al., 2000; Dyer & Singh, 1998; Laursen & Salter, 2014; Powell et al.,
1996). However, collaborations with suppliers, research institutes or government organizations, for
example, may require different resources, as such organizations are characterized by different sets
of institutional norms, habits, and rules. Thus, determining the most fruitful exchanges for firm
innovation requires research to look beyond partner diversity by exploring “the importance of
breadth and depth of external search to innovative performance within each channel or knowledge
domain” (Laursen & Salter, 2006: 133). In other words, a better understanding of the value of
different types of partners is needed. In a similar vein, research on entrepreneurial ecosystems
highlights the importance of the ‘context’ under which startups innovate (Autio et al., 2014).
Particularly key to the context is the collaborative environment of startups—i.e., their networks and
collaboration with top or ‘anchor’ firms or public and not-for-profit organizations such as
universities or research institutes (e.g., Adner, 2006; Adner & Kapoor, 2010; Clarysse et al., 2014;
Iansiti & Levien, 2004). However, little is known about the relative impact of different types of
partners, particularly government organizations, and of different types of collaboration on startup
innovation. Therefore, given the urgency of accelerating innovation in the cleantech sector, gaining
a better understanding of the relationship between different types of partners and collaborations is
not only critical for startups, investors, government organizations, or policymakers, but also
provides avenues for novel theoretical contributions to the openness, interorganizational alliances,
and ecosystems literatures.

6
These knowledge gaps give rise to two questions: (1) What role do collaborations with
governments—as compared to collaborations with research institutes and universities, not-for-profit
organizations, or other firms (startups and established firms)— play for cleantech startup innovation
activity? (2) What type of government collaborations—i.e., market- vs. technology-based—are
important for startup innovation and the ability to attract financial investments? To address these
questions, we develop a framework that separates knowledge flows from different types
collaborations and partners to startups and hypothesize that these different types of collaborations
and partners can have distinct effects. Our framework draws on resource dependence theory
(Hillman, Withers, & Collins, 2009; Pfeffer & Salancik, 1978) to posit that the most central
governmental partners hold the discretion over particularly large and useful knowledge and
technological resources valuable to cleantech startups. These central governmental partners are
defined as those that are established by the government to fulfill a key political mandate in their
area of expertise and that have created the strongest network represented by a high number of
connections to other well-connected partners.6 In addition to enabling access to critical knowledge
and technological resources (e.g., through user facilities (Koonin & Gopstein, 2011)), we argue that
collaborations with government organizations might also be less prone to the typical caveats of
collaboration such as appropriability concerns (Laursen & Salter, 2014) and unintended knowledge
outflows via opportunistic behavior of partners (Cox Pahnke, McDonald, Wang, & Hallen, 2015).
Using a novel dataset of the global collaborations of 783 US cleantech startups from 2008 to 2012,
our analysis also investigates the relative benefits of collaborations with network central
government organizations based on the type of collaboration, i.e., technology-based (joint
technology development or licensing), or market-based (e.g., customer or procurement).
6
We use the term network central government organization to express centrality in a network and not in terms of government
organizations that are active at a national level.

7
This paper contributes to research on collaborative innovation in four ways. First, we extend
openness and interorganizational alliance perspectives on startup innovation by providing a
dynamic evaluation of the distinct impacts of different partners and collaboration types while
accounting for the resource intensity of collaborating with a diverse set of partners. Our results
suggest that while collaborations between cleantech startups and network central government
organizations are generally more important for startup innovation than knowledge exchanges with
any other partner type, this positive effect only holds when it comes to joint technology
development or licensing and not for market collaborations (where governments are the customers
of the startups’ technologies or products). Second, in our analysis of collaborations we account
separately for the differences between codified knowledge exchanges from acquiring licenses from
governmental partners and more tacit exchanges from joint technology development. We are able to
do this by quantifying the relative impact of joint technology and licensing collaborations, which
have been analyzed at an aggregate level in prior research (Baum et al., 2000; Powell et al., 1996).
Third, this paper advances the literature on entrepreneurial ecosystems by contributing to the
theorization of this emerging perspective, pointing out that resource dependence theory may help
explain the relative importance of governmental collaborators. Our findings suggest that
governmental partners hold critical knowledge and technological resources for startups in the
cleantech space that stem from their long-term experience, expertise, and commitment to their
mandate to contribute to long-term societal benefit. Fourth, while most research on collaborative
innovation has had its empirical basis in the IT, manufacturing, or biotech sectors, we provide novel
insights that stem from the use of (a) a new type of data in (b) a new sector, cleantech. The
cleantech sector is different from other sectors in that it is associated with commoditized goods with
distinct institutional, investment, and time requirements. Our theory and empirical evidence on the
importance of collaboration between network central government organizations and cleantech
8
startups provide answers to pressing policy questions regarding the role of different governments’
interventions in the energy space, particularly in the wake of the 2015 Paris Agreement.
THEORY AND HYPOTHESES
Collaborative Innovation: The Role of Different Types of Partners
The importance of co-evolving, mutually-rewarding, and long-term collaborations for
innovation is supported by several streams of literature that emphasize on networks, openness, and
joint value creation among different types of organizations at different levels of analysis. These
streams of literature have emerged in the last decades as the understanding of innovation evolved
from models exploring Schumpeter’s lone and opportunity-seeking entrepreneur to models
exploring the dynamic and interactive character of innovation processes that result from
collaborative endeavors with distinct organizations—such as customers, suppliers, competitors, or
research institutes (Cox Pahnke et al., 2015). In macro- or systems-level analyses of technological
innovation systems, interorganizational collaboration represents one of many possible interactions
of a system that is described by interactions and feedbacks between different governments, firms,
entrepreneurs, etc. (i.e., organizations) and institutions (e.g., Bergek et al., 2008; Hekkert et al.,
2007). In firm-level analyses, interorganizational alliances and ‘ecosystems’—i.e., knowledge,
innovation, business, or, more recently, entrepreneurial ecosystems—have emerged as central to
innovation (Adner, 2006; Adner & Kapoor, 2010; e.g., Autio et al., 2014; Baum et al., 2000;
Clarysse et al., 2014; Iansiti & Levien, 2004; Powell et al., 1996; Zahra & Nambisan, 2012). The
literature on interorganizational alliances and knowledge ecosystems, which has been primarily
conducted using empirical evidence from the biotech and IT sectors, recognizes that innovation is
often a result of collaboration with different types of organizations primarily within local clusters.
This research suggests that the locus of innovation resides in local networks rather than within

9
individual firms (Baum et al., 2000; Clarysse et al., 2014; Powell et al., 1996), and that innovative
activities can further depend on the physical and global network position of the firms themselves
(Whittington, Jason, & Powell, 2009). The importance of collaboration with lead users and
suppliers for increased innovation activities are a key subject of analysis in literature on openness
and innovation or business ecosystems (Dyer & Singh, 1998; Laursen & Salter, 2006; von Hippel,
1988). The recently emerging literature on entrepreneurial ecosystems puts entrepreneurial
innovation at its core, emphasizing the importance of collaboration with key partners and a
supportive ecosystem for innovation within entrepreneurial firms or startups (Autio et al., 2014). In
short, Baum et al., (2000: 267)’s well-cited recommendation “Don’t Go At It Alone” nicely
summarizes the suggested importance of collaboration for firm innovation prevalent across these
various academic disciplines.
Firms can collaborate with several types of partners that enable distinct knowledge flows for
stimulating innovation. Interorganizational collaboration therefore typically occurs with suppliers,
customers, or even competitors (e.g., Adner & Kapoor, 2010; Lechner, Soppe, & Dowling, 2014;
von Hippel, 1988). These partners enable access to up-to-date industry developments and market
needs. Collaboration also occurs with non-private organizations such as universities, research
institutes, or national laboratories (Clarysse et al., 2014; Powell et al., 1996). These collaborations
typically enable boundary-spanning knowledge flows that, in combination with existing prior
knowledge or technologies, can lead to higher innovation activities by firms (Jung & Lee, 2015).
Overall, a greater diversity of partner types—or a firm’s openness to actively seek and exploit
external knowledge channels—generally increases firm innovation activities in terms of new
product introductions, diversity of the new product portfolio, or new patent applications (Demirkan
& Demirkan, 2012; Laursen & Salter, 2006).
10
However, the suggestion to ‘collaborate as much with as many diverse partners as possible’
may not be feasible for startups. Different types of partners typically require distinct resources as
they are characterized by varying institutional norms and practices. For example, on the one hand,
collaboration with suppliers and customers typically requires careful consideration of disclosure of
knowledge on products and technologies and extensive mutual coordination and commitment (Dyer
& Singh, 1998; von Hippel, 1988). On the other hand, collaborating with a government
organization, such as a national lab or a state-level energy agency, often involves a different type of
process resulting from higher levels of bureaucracy, distinct cultural attitudes, contractual rules, and
costs (Glauthier & Cohon, 2015). In order to deal with these differences and to absorb knowledge,
firms often need to go through a period of trial and error and develop time-intensive and costly
organizational practices (Laursen & Salter, 2014). Bringing in diversity in partners may therefore be
particularly challenging for startups that are generally subject to more resource constraints with
limited personnel or cash flow than larger firms, even though collaboration generally represents an
important approach to overcome resource constraints (Alvarez & Busenitz, 2001; Meyskens &
Carsrud, 2013).
Furthermore, collaboration may even result in diminished innovation activity. Recent studies
on startup innovation show that collaboration with other firms from the same industry, for example,
can reduce rather than promote innovation activity because this narrower type of collaboration may
contribute to startups missing important trends that are emerging outside of the industry boundaries
(Stam & Elfring, 2008). Ties to venture capitalists (VC) can further reduce startup innovation
activities because of information outflows to competitors and the opportunistic behavior of the VC
that serves as a shared intermediary (Cox Pahnke et al., 2015).
In this paper, we suggest that different partners and different types of collaboration may be
more (or less) important and have distinct effects on cleantech startup innovation activity. Prior

11
research that has emphasized the importance of collaboration with many and diverse partners for
firm innovation is often derived from research on larger firms or for biotech or IT startups. Our
framework provides a more detailed analysis of the value of different types of partners and
collaborations and focuses on startups. In doing so, this study is among the first to respond to the
call of Laursen and Salter (2006; 2014) to separate knowledge flows from different partner types. In
the following, we further extend these granular insights on partner and collaboration types by
drawing on resource dependence theory (Pfeffer & Salancik, 1978) to highlight the possibility that
startups may particularly benefit from collaboration with governmental partners.
Collaboration with Governmental Partners
Collaborating with specific types of partners offers startups avenues to access critical
resources. Collaboration therefore serves as an important means to overcome resource dependence
and to reduce uncertainty and complexity (Hillman et al., 2009; Pfeffer & Salancik, 1978). To
acquire critical resources and benefit from collaboration, firms need to manage their external
relations well, and forge relations with those partners that have the greatest discretion over valuable
and rare resources. Alongside physical products, these resources include technological knowledge
and social status or prestige (Pfeffer & Salancik, 1978). In the case of startups, the most valuable
type of partner—i.e., the partner that holds critical resources for increased innovation activities of
startups—largely depends on the structure and character of the startup’s sector. Three key
interlinked dimensions characterize the sector of cleantech startups: (1) electricity and fuels, or the
product, are commodities that are often regulated as energy and transportation are key to human
wellbeing and the functioning of a state; (2) the rate of innovation is slow, since new products in the
energy space take multiple decades to be developed and deployed; and (3) high capital intensity and
lumpiness of investments, path dependencies, and lock-ins with existing fossil fuel based

12
infrastructures mean that changes in infrastructure and institutions are needed to make new energy
sources available (Fouquet, 2013; Grubler et al., 2012; Koonin & Gopstein, 2011; Nanda et al.,
2015; Unruh, 2000). These characteristics of the cleantech sector suggest that the critical resources
required for startups may be held by organizations that have substantial research experience and
equipment, financial and human resources, and a longer-term perspective for their activities.
We suggest that network central government organizations, such as the US Department of
Energy (DOE), the US national laboratories (which are part of DOE) such as NREL, or NASA,
which forge direct collaboration with startups and other firms, may possess these critical resources.
In the following, we hypothesize that startups benefit in an outsized manner from collaborating with
such network central government organizations for three reasons. First, government organizations
and laboratories manage and receive funding for conducting research with longer time frames when
compared to private sector firms. These governmental partners possess technological expertise in
cleantech as well as related technologies that they have developed over decades (Anadon, 2012;
Bonvillian, 2014). Although collaboration with government organizations might involve higher
levels of bureaucracy and overhead costs than collaboration with other firms, we expect that the
technological expertise and knowledge from these central partners may be particularly beneficial
for subsequent startup innovation activities in the short-term. Recent studies have demonstrated that
many inventions took place as a result of research conducted in government organizations such as
national laboratories, which complemented the innovation activities of private-sector firms and
were then successfully used by those firms (Mazzucato, 2013). Hence, these resources might be
important for startups that typically only have a short time frame to achieve successful outcomes
such as new products, patents, financing deals or an IPO (Baum, 1996; Baum et al., 2000). Second,
collaboration with government organizations typically involves less conflict over knowledge and
concerns about appropriability. Appropriability is widely considered a barrier to collaboration in the

13
openness literature. For example, strict regulations from the legal departments of firms, complex
negotiations, compounded with mechanisms to ensure secrecy may even restrict emergent
collaboration (Laursen & Salter, 2014). Government organizations are explicitly mandated to
contribute to knowledge and technology transfer (DOE, 2014). The Bayh-Dole Act of 1980, for
instance, was put in place to promote private sector development and commercialization of
government funded R&D by facilitating licenses of patents obtained with government-funded
research to private firms (Schacht, 2009). Third, collaboration with government organizations
involves lower risk of information leakages and knowledge outflows to competitors which
otherwise represent serious threats for startups that typically depend on single technologies and
products. Even though these threats can be reduced through non-disclosure agreements and other
formal mechanisms to ensure IP ownership, recent research suggests that information can also leak
to competitors via shared intermediaries such as VCs, with negative implications for startup
innovation (Cox Pahnke et al., 2015). While collaboration with central governmental partners also
bears the risk of information outflows to competitors that are also partnering with the same
agencies, governments have less incentive for opportunistic behavior by leaking knowledge to
competitors as they are—unlike VCs—not profit-driven. In sum, based on these arguments, we
propose the following hypothesis:
Hypothesis 1: For startups in the cleantech sector, collaboration with central governmental
partners is more important for short-term innovation activities than collaboration with other
types of partners.
Market- vs. Technology-based Collaborations with Governmental Partners
Moreover, we submit that not all collaborations with central governmental partners are
associated with increased startup innovation activities. For example, while network central

14
government agencies such as DOE or NREL provide technological knowledge, agencies such as the
Department of Defense (DoD) can order or acquire certain products or technologies from startups
through mechanisms such as procurement (Bonvillian & Atta, 2011; Fuchs, 2010). Thus, to fully
understand the impact of government collaboration on short-term startup innovation activities, it is
important to further explore the impact of collaboration types.
Market-based Collaborations. Collaboration of startups with users or suppliers can enable
unique and up-to-date insights on future market demands or technological improvement
opportunities that can be important drivers of innovation. Innovation can also result and benefit
from the technological knowledge embedded in acquired products (Tang & Popp, 2014). Such
opportunities that are characteristically indirect and implicit can lead to higher innovation activities
by firms (Malecki & Poehling, 1999; Von Hippel, 1978). There can also be benefits that stem from
learning about the needs of the broader marketplace. Nevertheless, the level of technological
learning and value added from market-based collaborations is likely to be lower in the short-term
(over 1-2 years) as the primary goal of market relations is to deliver or acquire specific products or
services and not the transfer or exchange of technological knowledge. In the case of market-based
collaborations with government organizations, we expect startups that forge such collaborations to
not be associated with increased levels of innovation, at least in the required short-term time frame
for startups. Governmental partners typically serve as customers and not as suppliers of
technologies to startups. This limits startups’ learning opportunities to niche markets for
governmental applications, with often reduced commercial applicability. Moreover, while most
research on government-business collaborations focuses on public procurement from large,
established firms, the existing insights suggest that the value of collaboration between government
organizations and startups lies in its potential to increase government—and not startup—efficiency
(Lin, 2014). And finally, startups may only resort to investigating market-based collaborations with

15
government organizations after being unsuccessful in the marketplace. In sum, startups that engage
in market-based collaborations with network central government organizations typically supply
products to a stable niche market that may provide limited learning opportunities. Thus, we
propose:
Hypothesis 2: For startups in the cleantech sector, the effect of collaboration with central
governmental partners on short-term innovation activity changes for market-based
collaborations, such as that they are associated with reductions in innovation activity.
Technology-based Collaborations. Technology collaborations, such as when startups engage
in joint R&D, demonstration, or testing activities with other partners, enable the sharing and
exchange of technological knowledge, spreading of risk, and access to complementary resources.
As expected, prior research has shown how firms that forge technology collaborations with other
firms, research institutes, universities, or governmental laboratories experience increased levels of
innovation in terms of patenting activity and new product development (Clarysse et al., 2014;
Deeds & Hill, 1996; Li-Ying et al., 2014). 7
We hypothesize that this positive view on the impact of
technology collaborations on startup innovation also applies to collaborations with network central
governmental partners, given the provision of complementary technological resources and reduced
concerns of appropriability or of opportunistic behavior as outlined above.
However, in contrast to prior research on technology collaborations, we take a more nuanced
perspective on technology-based collaborations, and distinguish between (a) joint technology
development and (b) the provision of licenses for technology applications. These two collaborations
involve different forms of knowledge exchanges and possibilities for spillovers—i.e., more tacit for
joint technology development and more codified for licensing. Prior research shows that joint
7 Deeds and Hill, (1996) found an inverted U-shape relationship between the number of technology alliances and new product
development for established companies.
16
technology development collaborations primarily with universities or research institutes are
relatively more important for startup innovation than licensing collaborations in biotech startups
(Baum et al., 2000; Liebeskind, Oliver, Zucker, & Brewer, 1996).8
Baum et al. (2000: 273) further
suggest that technology collaborations are “a source of up-to-date information or knowledge critical
to success in patent races but too tacit to be effectively transferred through licensing.” While this
research has not empirically tested the relative benefits of licensing and joint technology
development, Chan (2015) found that licenses from national laboratories to private firms resulted in
increases in follow-on patenting activity of the licensee firms and also in follow-on patenting at
other firms.
We argue that startups acquiring technology licenses from government organizations not only
benefit from codified knowledge transfer but also from knowledge spillovers that are stronger when
compared to those emerging from joint technology development. We suggest that startups are more
likely to acquire licenses in areas that are farther from their own set of competencies when
compared to areas for joint technology development, which could be associated with a greater
potential to learn and to generate subsequent innovation. Thus, we suggest:
Hypothesis 3: For startups in the cleantech sector, the positive effect of collaboration with
central governmental partners on short-term innovation activity is greater for licensing than
for joint technology development.
8 While Powell et al., (1996) illustrated different relationship types in biotechnology (e.g., R&D, marketing, licensing,
supply/distribution, joint venture), they aggregated the relationships into R&D ties and non-R&D network experience for the
purpose of their study.

17
Signaling Effects of Technology-based Collaborations with Governmental Partners to Private
Investors
Next to the effects on startup innovation activities, technology-based collaborations in the
form of joint technology development activities or licensing from central governmental partners
may also increase the likelihood of startups to attract financial investments. Empirical studies have
applied resource dependence theory to explain the impact of political alignment and frequent
interactions with government organizations for firms to reduce dependencies or uncertainty,
eventually leading to financial benefits (see Hillman et al., 2009 for a recent overview). However,
besides research on the positive impact of the SBIR R&D grants from the DOE on startups’ ability
to acquire private sector investments (Howell, 2015), the signaling effects of technology
collaborations to investors—both joint technology development and licensing—with network
central government organizations are less clear.
In addition to physical and technological resources, access to social resources such as status
and prestige are important for reducing dependencies and uncertainty (Hillman et al., 2009; Pfeffer
& Salancik, 1978). As suggested above, government organizations might possess critical
technological resources in the cleantech sector that can help further technology development.
Furthermore, government reputation for technological expertise combined with direct access to
critical technological resources through technology-based collaborations might represent important
quality signals to investors and capital markets. Prior research suggests that technology
collaborations with other firms not only increase startup performance in terms of sales or net
income to sales ratio (Hagedoorn & Schakenraad, 1994; Lechner, Dowling, & Welpe, 2006), but
that the signaling effects of high connectedness to key partners that possess technological
knowledge can further build public confidence in the value of the startup (Stuart, 2000). Moreover,
licenses from key partners are also seen as important signaling effects for private sector investors
18
(Conti, Thursby, & Thursby, 2013; Hsu & Ziedonis, 2013). We expect similar positive signaling
effects for technology-based collaborations with governmental partners. However, the already
existing codified knowledge transferred through licenses might enable more predictable
assessments of the prospects of the startups than ongoing joint technology collaborations with more
uncertain outcomes. As investors are faced with high levels of uncertainty and typically rely on
patents or other codified forms of knowledge to assess the prospects of potential portfolio
companies (Haeussler, Harhoff, & Müller, 2009; Laursen & Salter, 2014), we expect that licensing
collaborations with governmental partners are stronger quality signals than joint technology
development collaborations. Moreover, as stated above, market collaborations with central
governmental partners might not result in increased innovation activities due to limited short-term
learning opportunities. Because of the additional niche market concerns and perceived inability to
sell products in the marketplace, we do not expect that market-based collaborations will result in
stronger increases in private investments from investors. Given this logic, we propose:
Hypothesis 4: For startups in the cleantech sector, the positive effect of government licensing
collaborations on the ability to attract private sector investments in the short-term is greater
than for government joint technology development or market-based collaborations.
METHODS
Data and Measures
Description of the US cleantech startup dataset. We constructed a novel, large, and
unbalanced panel of 783 US startups in the cleantech sector between 2008 and 2012. The panel
includes all US startups that interacted with other firms, government organizations, research
institutes, universities, and other not-for-profit organizations from the United States and globally.
The startups operate in one or more of the following 17 sub-sectors: solar, wind, biomass,

19
geothermal, hydro & marine power, nuclear, power storage, smart grid, power efficiency, advanced
materials, transportation, biofuels & biochemicals, conventional fuels, fuel cells & hydrogen, air,
recycling & waste, or water & wastewater. We considered a firm to be startup if it is younger than
10 years in year t, with t0 being 2008. 57% of the startups were founded before t0, and 43% entered
our sample during the reported time frame. In total, our sample encompasses 3,297 observations
from 783 startups over the five-year time frame (2008 to 2012). It provides very granular and time-
resolved information about the type of startup partners, the types of startup collaborations, and basic
firm information regarding size, age, location, and sector. We obtained the base data on the
collaborations of US cleantech startups from the i3 Cleantech Group database. This relatively new
database has hardly been used for research purposes in the past (see Zobel, Balsmeier, &
Chesbrough, 2016, for a recent example in the US solar industry) and is, to the best of our
knowledge, the richest and most thorough collection of information on the global cleantech sector.
It applies various mechanisms to collect information on firms, collaborations between firms,
industry development, and investments (i3 Cleantech Group, 2015). Information on collaborations
is collected and constantly updated and checked by a research team or directly by the firms, and
includes the names of the partners, collaboration types, a brief description of the purpose and goal
of the collaboration, and the source. Furthermore, information for all potential partner types is
collected using the same method, which implies that collaboration with government organizations is
certainly not overrepresented in the sample. i3 Cleantech Group provided us with the startup names
and collaboration information for the overall cleantech sector. We subsequently conducted manual
verifications of all pieces of information covered by the database, including the type of
collaboration, the year of the collaboration, and the name of the partners. We complemented the
name and information on US startups with data on founding year and size from FactSet, Orbis, and,
if not consistent, via an additional web search. We further expanded our dataset to include detailed

20
information for each startup on location, patents, and financial investments by using multiple data
sources (e.g., Orbis, FactSet, Thomson One, Derwent Innovation Index). Details on each of these
independent and dependent variables, and how they were operationalized for our statistical analysis
are described below. To examine the impact of partner and collaboration types on the dependent
variables innovation activity and financing deals of startups, we used the Stata (13) software.
Independent Variables
Type of partner. Each startup enters collaborations with different types of partners. These
partners were categorized into five different categories: (1) other cleantech startups, (2) other
private sector businesses, (3) government organizations (e.g., DOE, DOD) and governmental
laboratories or agencies (e.g., NREL, Fraunhofer), (4) universities (e.g., MIT or Princeton
University) and private research institutes (e.g., Rocky Mountain Institute), or (5) NGOs or
environmental groups (e.g., Sierra Club). These different partner types include organizations from
the US or other countries (globally).
The collaborations included in the dataset typically last for more than one year, but duration
data is only rarely reported. Thus, to evaluate the impact of these variables, it was necessary to
make assumptions about their duration. Prior research in this realm has used durations between one
and five years, mostly relying on three years (e.g., Choi & Anadón, 2014; Schilling & Phelps,
2007). In contrast to the majority of these panel studies that are based on established firm networks,
we took a more conservative approach for our startup context and created two-year (i.e., 2008-2009,
…, 2011-2012) and three-year windows (i.e., 2008-2010, …, 2010-2012) variables for each of the
collaborations to test the robustness of the findings to this assumption. These two- or three-year
moving windows for the annual network measures were used to account for the impact of prior
(including pre-sample) collaborations and their cumulative nature (Robinson & Stuart, 2007;

21
Schilling & Phelps, 2007). We tested all of our statistical models (see below) for both the two- and
three-year windows for the duration of the partnerships. As the results were very similar, we
decided to present results using the two-year time lag windows that might be more relevant in the
more short-term oriented startup context.
We used the network measure of eigenvector centrality to illustrate patterns in each two-year
window for each partner and collaboration type. The eigenvector centrality for each startup captures
patterns in a broader network by assigning weights to each collaboration based on the centrality
measures of the partner (Bonacich, 2007). Collaboration with a well-connected partner in the
strongest network thus has a higher weight than collaboration with a weakly connected partner. This
allowed us to explore whether a startup was part of the network and collaborated with the most
central government organizations. These startups received the highest eigenvector scores (between
0 and 1) (see Figures 1a and 1b). To check the robustness of the eigenvector centrality measures, we
conducted several steps including the evaluation of additional measures of centrality—power
centrality and average distance weighted reach (Bonacich, 1987; Schilling & Phelps, 2007).9 We
used the ‘igraph’ package in R to calculate all of the network measures (Csardi & Nepusz, 2006; R
Core Team, 2015).
-------------------------------------------
Insert Figures 1a and b about here
------------------------------------------
In Figure 2, we separated the full network of all global collaborations (from 2008 to 2012)
will all types of partners into two ecosystems: one larger, interconnected network where all
9 Power centrality assumes that centrality and ‘powerfulness’ of a firm are a function of the collaborations of a firm in its
neighborhood (or ecosystem) of partners depending on selected parameters, with more collaborations with well-connected
partners implying more centrality (note that the network analysis by itself is not accounting for local proximity). The power
centrality measure was parameterized to mimic eigenvector centrality. While different from centrality, distance weighted reach
also assigns greater value to more collaboration in that it assumes that firms collaborating with a large number of organizations
over a shorter average path enable improved knowledge flows through access to faster and greater information, compared to less
connected firms.

22
organizations are linked to the larger ecosystem, and one that is more diverse and characterized by
dyadic or triadic interactions of a few organizations. As access to knowledge and information flows
might differ based on the position of the startups within and outside of this larger ecosystem, we
controlled for this difference for the 59% of the startups that are all interconnected and therefore
part of the larger network and the 41% that operate outside of this network in the statistical models
that are outlined below.
----------------------------------
Insert Figure 2 about here
----------------------------------
Collaboration types. The i3 Cleantech Group database provided an initial classification into
collaboration types. We validated the information on collaborations with two researchers in our
team, who independently assessed the description provided by the i3 database. In doing so, we re-
coded some of the classifications to ensure a consistent matching of the 2,676 collaborations (2008
to 2012) to the following collaboration types for each startup in our dataset: technology-based (i.e.,
joint technology development or licensee) and market-based (i.e., procurement) (see Table 1 for
examples).10
----------------------------------
Insert Table 1 about here
----------------------------------
Dependent variables
Patents. To examine the impact of different types of partners and collaborations on startup
innovation activity, we use patents as a measure that is validated in an external examination process
(Griliches, 1990). Although using patents to measure innovation activity or knowledge creation is
not without challenges—for example, the propensity to patent and overall patenting activity might
10
We also included licensors, i.e., when the startup provides the license, and project development collaborations as controls.

23
vary between industries (Levin, Klevorick, Nelson, & Winter, 1987)—it is a commonly used
measure of innovation (Trajtenberg, 1987). This seems to be particularly true in our empirical
setting, as the patenting propensity of U.S. startups has been found to be very high. Among other
factors, patenting in cleantech is less contentious than in other sectors like IT and is considered to
provide a signaling effect to potential investors (e.g., Conti et al., 2013; Hsu & Ziedonis, 2013).
Furthermore, patent counts represent the most commonly applied measure for startup innovation
(Clarysse et al., 2014; Howell, 2015; Nanda, Younge, & Fleming, 2013). We measured innovation
as the number of patent applications for firm i in year t. The annual patent applications were
extracted from the Derwent Innovations Index database in their year of priority application.
Private Financing Deals. We used the number of annual financing deals that each startup
acquired per year to evaluate the signaling effects of collaborations on investors. The financing
deals were collected and aggregated from the Thomson One, FactSet and i3 Cleantech Group
databases, and primarily encompassed venture capital funding at different stages (seed, series A, B,
etc.) as well as other private investments (loans, bonds, etc.). Figure 3 provides an overview of the
distribution of the financial deals. We further included a measure of firm growth as a robustness
check to the annual number of financing deals. We measured firm growth as the likelihood of
achieving a desired growth outcome, i.e., an acquisition11
or an initial public offering (IPO) within
six years after the startup was founded (e.g., recently applied by Guzman & Stern, 2015). The data
on firm growth was collected from various sources, including the i3 Cleantech Group and the
FactSet database, and manually verified through a web search. Growth is operationalized as a
binary variable equaling 1 for an acquisition or IPO in year t, and 0 otherwise.
----------------------------------
Insert Figure 3 about here
11
Acquisitions after bankruptcy or liquidity constraints are not included in the variable.

24
----------------------------------
Control variables
Pre-sample patents. To account for the diminishing importance of earlier knowledge, we
included the pre-sample patent stock as a control variable, annually depreciated at a rate of 15%
(e.g., Popp, 2004; Qiu & Anadon, 2012). Following Schilling and Phelps (2007), we included the
annually depreciated value of pre-sample patents (before 2008) to control for unobserved
heterogeneity in firm patenting activity.
Prior private financing deals. We controlled for the impact of private investments by
including the number of prior financing deals of each startup for each year. We applied an annual
depreciation rate equal to the one we used for prior patents to account for the diminishing
importance of financial investments over time.
Prior public financing deals. Similar to private financial deals, we also included a measure
that accounted for whether the startup received prior grants or other forms of financial support from
public sources. As an additional robustness check on public financing and acknowledging the
central role of the DOE, we compiled information on the number of grants or other types of
financial support that the startups might have received from the DOE in the examined time frame.
We obtained the data from the USA Spending database and counted the number of financing deals
per startup. Overall, 96 of the cleantech startups in our sample (i.e., 12% of our sample) have
received one or more DOE grant or other financial assistance.12
Sub-sector, age, and size. Firm-level information on sub-sector, age, and size was extracted
from the i3 Cleantech Group, FactSet, and Orbis databases, and complemented and verified in a
web search. We included industry fixed-effects for the 17 sub-sectors in our statistical models.
12
These include direct payments or reimbursements.

25
Figure 4 shows the average number of patents per sub-sector. We measured firm size by the number
of employees, and age as the time interval since the founding year.
----------------------------------
Insert Figure 4 about here
----------------------------------
Location. While we look at the global collaborations of US startups, we also account for the
physical location of the startups, particularly in regional hotspots. For example, the Silicon Valley
and San Francisco area are together home to 168 of the 783 (i.e., 21% of our sample) cleantech
startups. We examined whether firms that are located in geographically dense areas have higher
propensities to innovate, achieve growth outcomes, or survive. We collected information on firm
addresses from the i3 Cleantech Group, FactSet, and Orbis databases, and mapped the zip codes to
the respective Metropolitan Statistical Area (MSA) 13 for 2011. We applied two different approaches
to account for locational influences. The first approach was to capture the variance in the
concentration of cleantech startups in the different MSA by using the percentage of total firms
located in the respective MSA (for a similar approach, see, for example, DeCarolis & Deeds, 1999;
Folta, Cooper, & Baik, 2006). As shown in Figure 5, around 40% of the firms are located in the San
Francisco-Oakland-Fremont, Boston-Cambridge-Quincy, New York-Northern New Jersey-Long
Island, San Jose-Sunnyvale-Santa Clara, and Los Angeles-Long Beach-Santa Ana region, and the
rest of the firms are spread across the country or located in smaller regional hubs. The second
approach was to directly include fixed effects for each MSA to check the robustness of the
concentration measure.
----------------------------------
Insert Figure 5 about here
13
We also included the same evaluation for Combined Statistical Area (CSA) distinction, which revealed similar results in our
statistical models.

26
----------------------------------
Figure 6 shows the average number of patents in the Top 15 MSAs. Not surprisingly, the San
Jose-Silicon Valley area is among the highest in average patents per firm. However, the MSAs of
Santa Rosa-Petaluma, CA, displayed an even higher average number of patents per startup.
----------------------------------
Insert Figure 6 about here
----------------------------------
RESULTS
A summary of the descriptive statistics and correlations for the 783 startups in our sample,
averaged over time, is provided in Table 2. Our dependent variables patenting activity and
financing deals are not highly correlated with any of the other variables. The startups in our sample
introduced an average of 1.8 patents every year (mean = 1.84 per firm-year), and, on average,
attracted more than one financing deal every two years (mean = 0.66 per firm-year). Overall, while
all of our startups had collaborations in at least one of the four two-year windows (2008-2009, …,
2011-2012), 13.75% of the startups collaborated with at least one government organization between
2008 and 2012.
----------------------------------
Insert Table 2 about here
----------------------------------
We analyze the data with negative binomial regressions for the count variables—patenting
activity and financing deals—because of overdispersion. We use robust standard errors and include
time- and sector-fixed effects in our models. For each outcome variable, we calculated three
different models: Models 1 and 2 for the overall impact of the controls and partner type variables
respectively, and Model 3 for the granular separation in collaboration types per partner. The
estimates for industry and time period effects are, although estimated, not reported to conserve

27
space.14
Table 3 reports the estimated coefficients of four negative binomial regression models on
patenting activity. The results indicate that—compared to startup collaborations with universities or
research institutes, not-for-profit partners, other public organizations, and other startups or
established firms—only the startups that collaborate with and are part of the network of the most
central government organizations are associated with larger cleantech startup patenting (β = 2.16, p-
value < 0.01, Model 2). As negative binomial regressions model the log of incident counts, this
estimate implies that a one-unit increase in centrality with governmental partners increases the log
of patenting activity by approximately 2.16.15
Thus, we found support for H1. As hypothesized in
H2, we found that market-based collaborations with governments are associated with reductions in
innovation activities (β = -1.71, p-value < 0.01, Model 3). H3 is only partially supported, as joint
technology development collaborations (β = 2.25, p-value < 0.01, Model 3) are associated with
more startup innovation than licensing collaborations (β = 0.63, n.s., Model 3). However, when the
analysis is conducted separately for the 59% of startups that are part of the larger ecosystem and for
the 41% of startups that are largely operating in smaller networks (dyads, triads, etc., see Figure 2),
we found that governmental licensing collaborations are associated with greater startup innovation
activities for those that operate outside of the larger, connected ecosystem (Model 4). This
interaction is depicted in Figure 6.
----------------------------------
Insert Table 3 about here
----------------------------------
----------------------------------
Insert Figure 6 about here
14 These estimates are available from the authors upon request. 15
This estimate can also be expressed in terms of a percentage increase, i.e., the incidence rate ratios (IRR), where percentage is
determined by the amount that the IRR is either below or above 1. The IRR for collaboration with central governmental partners
is 8.67 (IRR = eβ), which implies that patenting activity increases by approximately 767% with every one unit increase in
centrality. The centrality measure is a continuous variable between 0 and 1 (see Table 2), where a one unit increase implies a
large change from minimum to maximum levels of eigenvector centrality, which explains the large coefficient and IRR.

28
----------------------------------
The results on the impact of collaboration with governmental partners on the ability of
startups to attract financial investments are shown in Table 4 (private financing deals). The results
provide only partial support for H4, as both joint technology development and market
collaborations have no significant effect on subsequent financing deals. However, we found that
public licensing collaborations increase subsequent financing deals (β = 1.19, p-value < 0.01,
Model 3) and therefore could serve as an important signal to investors.
----------------------------------
Insert Table 4 about here
----------------------------------
Additional Analysis
To check the robustness of our results and to rule out alternative explanations, we specified
several alternative econometric models and measures of central partners that revealed similar
results, available upon request from the authors. The same models in a panel set-up using a fixed-
effect specification revealed robust coefficients and comparable results without inclusion of the
time-invariant variables (see Table 5). Models using a binary variable on whether the startups
achieved a growth outcome (IPO or M&A within 6 years after founding) in a logit regression
revealed similar results to the private financing deals models. To understand the impact of our
control variable on general public financing, all of the above models were calculated including a
count variable on the number of awards that the startups received from DOE in the time frame,
which also provided identical results. Finally, models using power centrality and average distance
weighted reach as alternatives to eigenvector centrality measures also revealed similar results.
----------------------------------
Insert Table 5 about here
----------------------------------

29
Furthermore, there may also be a concern that our dataset and the relationships we detected
could be inflated due to an endogeneity problem. The ability of startups to find a governmental
partner may be correlated to their innovation abilities, and we do not have access to a randomized
control trial or other quasi-experimental approach (e.g., IV or DID). But our hypothesis and
findings do not rely on a causal interpretation. Even if the results are explained by more innovative
or capable startups pursuing collaboration with governmental partners, our results indicate that the
more innovative startups see value in particular types of partners and collaborations. We further
conducted propensity score matching and tested the treatment effect on similar firms based on age
size, prior private and public financing deals, prior patents, and location. Our findings indicate
significant Average Treatment Effects (ATE) (p < 0.1) for patenting activity, such as that firms with
governmental partners showed a higher patenting activity. For private financing deals, our findings
revealed significantly (p < 0.05) higher ATE of private financing deals for startups with
governmental partner.
DISCUSSION
This study examines the impact of startup collaboration with network central government
organizations on the ability of startups to innovate and to attract financial investments, when
compared to collaboration with research institutes and universities, not-for-profit organizations, or
other startups or established firms. Following the call of Laursen and Salter (2006, 2014), we
develop a framework that separates the knowledge flows from these different partner types and
show that each of them can have different effects on startup innovation activities. Our framework
extends the emerging literature on entrepreneurial ecosystems by drawing on resource dependence
theory to highlight collaboration with governmental partners that hold key resources for startup
innovation. Our novel dataset on the global collaborations of 783 US cleantech startups between
2008 and 2012 enables the quantification of the relation between startup innovation outcomes and
30
different types of collaborations with governments, i.e., market-based vs. technology-based or tacit
from joint technology development vs. codified from acquiring public licenses. Overall, our study
extends openness and alliance perspectives on firm innovation and contributes to the ecosystems
literature in the following ways.
Openness and Alliances
Our study contributes to research on openness and interorganizational alliances with a focus
on startups. Though prior research has often emphasized the benefits of collaboration with as many
and diverse partners for innovation, we motivated a scenario that acknowledges that startups have
more limited resources than other firms and that collaborating with a diverse set of partners is a
resource intense endeavor. In this study, the relative impact of collaboration with all potential
partner types on startup innovation activities not only considered potentially distinct dynamics by
distinguishing knowledge flows and value appropriation from collaboration with network central
government organizations and other central startups or established firms, but also between
universities, private research institutes, and other not-for-profit partners such as NGOs or
environmental groups. Our findings provide novel empirical evidence on the importance of
collaboration with network central governmental partners that hold critical technological resources
in the cleantech sector resulting from their long-term experience, expertise, and commitment. These
technological resources might be highly complementary to the abilities of startups in identifying
and responding to market opportunities by developing novel solutions to market needs using jointly
developed or licensed technologies. Combined with the reduced concerns of appropriability and
opportunistic or exploitative behavior as opposed to other firms or VCs, these unique characteristics
make governments key, yet so far undervalued, partners.

31
Moreover, our findings on the types of collaborations and the importance of joint technology
development collaborations for innovation activity and of licensing collaborations with
governments for follow-on investments provide novel insights into when governmental partners are
beneficial for startups, and enrich research on openness by developing even more “fine-grained
items for each of the possible knowledge channels” (Laursen & Salter, 2006: 147). The
quantification of the relation between joint technology development, licensing collaborations and
startup innovation further provides a new perspective on the benefits of collaboration with
governments through different forms of knowledge exchanges and possibilities of spillovers. While
access to more implicit and tacit knowledge sources from joint technology development are more
important for subsequent innovation activities than codified knowledge from public licensing, the
latter is associated with an increased likelihood of attracting financial investments.
Entrepreneurial Ecosystems
Our study advances research on entrepreneurial ecosystems in two main ways. First, we
suggest an important theoretical grounding for determining the top or ‘anchor’ partners that are
associated with more entrepreneurial innovation by using resource dependence theory that takes an
ego-centric view on organizations. With its focus on organizations’ management of their external
relations to ensure access to those organizations in their environment that have greatest discretion
over the most valuable technological resources (Pfeffer & Salancik, 1978), resource dependence
theory offers avenues to understand which type of partner and collaboration is associated with
highest levels of startup innovation. Our findings show that joint technology development and
licensing collaborations with governments represent the most important components of the
ecosystem that contribute to increased innovation. Moreover, our dynamic perspective on
entrepreneurial innovation combined with a focus on the whole network of startups rather than
32
specific dyads contributes to the call for multiplex and dynamic applications of resource
dependence theory (Hillman et al., 2009).
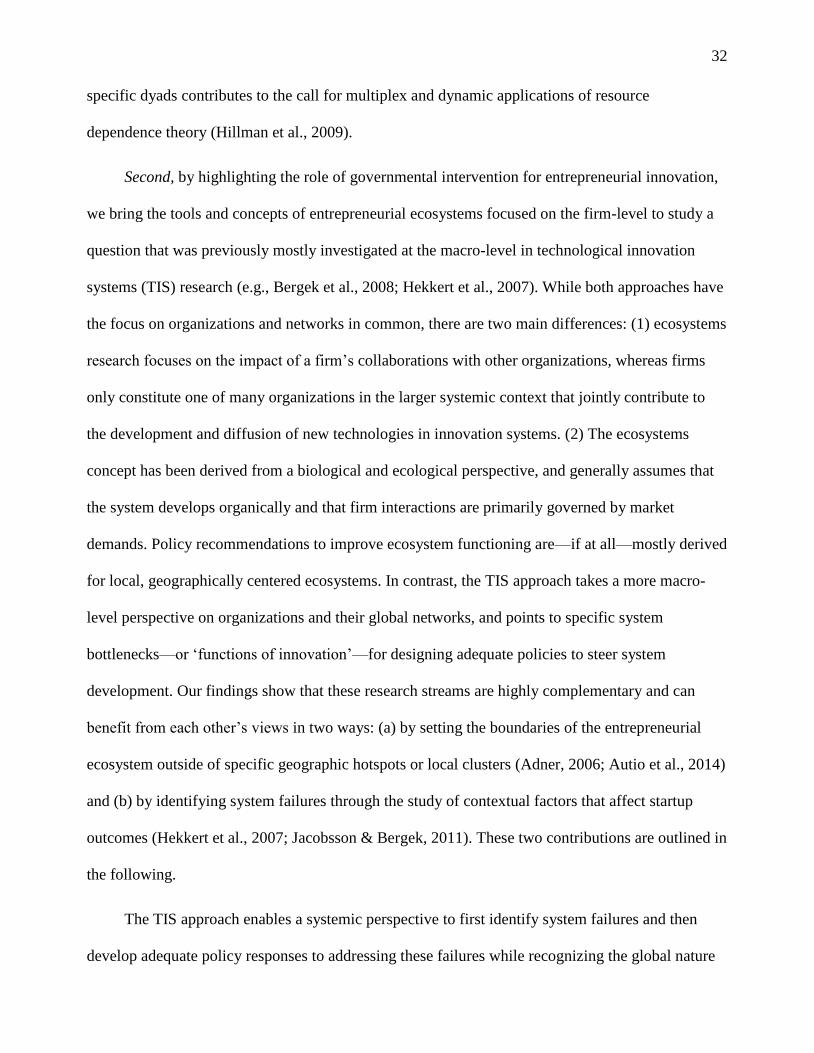
Second, by highlighting the role of governmental intervention for entrepreneurial innovation,
we bring the tools and concepts of entrepreneurial ecosystems focused on the firm-level to study a
question that was previously mostly investigated at the macro-level in technological innovation
systems (TIS) research (e.g., Bergek et al., 2008; Hekkert et al., 2007). While both approaches have
the focus on organizations and networks in common, there are two main differences: (1) ecosystems
research focuses on the impact of a firm’s collaborations with other organizations, whereas firms
only constitute one of many organizations in the larger systemic context that jointly contribute to
the development and diffusion of new technologies in innovation systems. (2) The ecosystems
concept has been derived from a biological and ecological perspective, and generally assumes that
the system develops organically and that firm interactions are primarily governed by market
demands. Policy recommendations to improve ecosystem functioning are—if at all—mostly derived
for local, geographically centered ecosystems. In contrast, the TIS approach takes a more macro-
level perspective on organizations and their global networks, and points to specific system
bottlenecks—or ‘functions of innovation’—for designing adequate policies to steer system
development. Our findings show that these research streams are highly complementary and can
benefit from each other’s views in two ways: (a) by setting the boundaries of the entrepreneurial
ecosystem outside of specific geographic hotspots or local clusters (Adner, 2006; Autio et al., 2014)
and (b) by identifying system failures through the study of contextual factors that affect startup
outcomes (Hekkert et al., 2007; Jacobsson & Bergek, 2011). These two contributions are outlined in
the following.
The TIS approach enables a systemic perspective to first identify system failures and then
develop adequate policy responses to addressing these failures while recognizing the global nature

33
of innovation (Grubler et al., 2012). The focus on public steering and the importance of central
partners underlines the importance of exploring cleantech innovation on a geographic scale that
moves beyond the regional clusters or ‘hotspots’ such as Silicon Valley. Our findings suggest that
central US government organizations associated with more positive outcomes for startups, i.e.,
primarily the national laboratories such as NREL located in Golden, Colorado (see Figure 1), were
not only acting away from regional hubs such as Silicon Valley, but collaborated with startups that
are physically dispersed across the US. Furthermore, we distinguished two larger ecosystems for
cleantech startup innovation. We found that the codified knowledge exchanges in the form of public
licenses only affected the innovation activities of those startups that did not have access to the
knowledge flows within the larger ecosystem. Thus, these findings highlight the importance for
future research to set ecosystem boundaries outside of specific geographic hotspots or local clusters
for studying outcomes at the firm (startup) level.
By putting the contextual factors that support increased levels of short-term entrepreneurial
innovation at the center of analysis (most prominently on the types of partners and types of
collaborations), the insights from entrepreneurial ecosystems research provide an avenue to account
for the missing focus on entrepreneurial outcomes in TIS research (Ács, Autio, & Szerb, 2014).
Much of the extant analyses on the function of ‘entrepreneurial activities’ in TIS are based on the
pure number of new firm founding (i.e., quantity) with the implicit assumption that all startups
innovate or have equal probabilities of success (e.g., Hekkert et al., 2007; Pacheco, York, &
Hargrave, 2014; Sine, Haveman, & Tolbert, 2005). Resonating with the recent contribution of
Guzman and Stern (2015)—highlighting the importance of studying entrepreneurial outcomes, or
‘quality’ rather than ‘quantity’—our findings indicate that cleantech startups show different levels
of innovation activities, and that the level of innovation is associated with very specific
characteristics of their collaborative environment. In turn, collaboration with government

34
organizations, which are studied at a macro-level in TIS but were largely absent from the
entrepreneurial ecosystems literature, seem to be important for startup outcomes in the US
cleantech sector.
Practical Implications
Our findings are important for policymakers, entrepreneurs, and investors involved in the
cleantech sector. Policymakers can benefit from our results to understand what types of
governmental partners and collaborations are associated with more innovative startups and follow
on investments. Our results highlighting the potential role of government organizations as partners
complement existing research on the role of governments as financiers of innovation activities
through supply-push or demand-pull policies, providing relevant information for resource
allocation. Entrepreneurs and investors can benefit from our findings that may help support
resource-constrained startups in identifying the type of partner and collaboration that is associated
with the highest innovation and funding outcomes.
Our findings underscore the need for policymakers to provide sufficient and stable funding
for longer-term research activities for government organizations. We found that central
governmental partners are the most important drivers of startup innovation activities, particularly in
the form of joint technology collaborations. We proposed that government organizations possess
critical technological resources for startup innovation activities that result from their long-term
experience and expertise in the clean power and transportation sector. Furthermore, reduced
concerns of appropriability and opportunistic behavior make government organizations key partners
for startup innovation. Hence, our results point towards an approach for stimulating cleantech
innovation that recognizes the importance of collaboration between historically-dominant
centralized laboratories focused on national capabilities—e.g., R&D laboratories at public

35
incumbent firms such as Bell Labs, or governmental laboratories such as NREL—with private
sector activities and more recent and smaller-scale phenomenon of startups.
Our findings also indicate that access to central partners by being part of their ecosystem
enables increased innovative activities—regardless of geographical proximity—at least in the
cleantech sector. Hence, despite the recognized importance of geographical concentration in
specific technological hotspots or physical proximity to these regions (Jaffe, 1986; Krugman, 1991;
Owen-Smith & Powell, 2008; Powell et al., 1996; Saxenian, 1996), co-location in technology
hotspots might be more important for startups operating in sectors that are characterized by frequent
changes, high-turnover rates, and smaller capital requirements than in the energy space, such as in
IT. This could be explained by the fact that clean technologies are more heterogeneous than those in
other sectors (such as IT or biotech), with different technologies having very different knowledge
bases ranging from semiconductor electronics and materials in solar, to aerodynamics and
composite materials in wind, to enzymes and combustion in biofuels. The heterogeneity in the types
of technologies in the cleantech sector may mean that different locations may be better for startups
active in different technology areas; this would imply that having a critical mass of resources
(including expertise) in one place for all of them might be more difficult. Hence, cleantech startups
may have to resort more to collaboration, which in turn may be more geographically dispersed.
Moreover, the importance of public licenses for innovation activities for those startups that are not
part of the larger inter-connected network (see Figure 2) suggests that the value of public licenses
differs based on the network position of the startup as compared to the geographical location of
startups. Nevertheless, independent of network position or geographical location, public licenses are
associated with improved follow-on investment outcomes, which could be a reflection of the fact
that investors reward a particular technology ‘in hand’ more than a joint technology development
collaboration.

36
Limitations and Future Research
As with all empirical studies, ours is not without limitations. First, while we look at the global
collaborations of startups, we only study the impact on cleantech startups located within the US.
Nevertheless, our findings regarding the value of different types of partners and collaborations
provide a relatively complete picture of the cleantech startup sector given that a large majority of
cleantech startups are located in the US, our sample comprises the whole country, and we consider
startup collaborations to global partners. However, we see exciting opportunities for future research
to conduct comparative studies and explore the impact of different types of partners and
collaborations in a different country context, as cleantech startups become more prevalent outside
of the United States. Second, while we explore the impact of collaboration types on innovation in
terms of increases in the number of patents, we do not use the approach of counting patent citations
to address novelty or radicalness for two reasons. (1) Patent citations are an insufficient measure of
novelty as citations are often added by patent examiners rather than the inventors, and tend to also
depend on the sector and expertise of examiners in addition to the quality of the patent in itself (e.g.,
Lemley & Sampat, 2012; Nelson, 2009). (2) While our sample is unique in its newness, the time
period from 2008 to 2012 includes very recent patents for relatively new firms for which citations
may not a valid measure. Third, our focus on the short-term impact of collaboration on startups is
driven by the short-term imperative for startups to achieve successful outcomes. However, future
research could extend our findings and evaluate the impact of collaboration over a longer-term
focus than our time frame from 2008 to 2012. In addition, while we were able to show that
particular collaborations are associated with better innovation outcomes, further knowledge of what
types of resources and collaborations the ‘more successful’ firms are searching can greatly benefit
entrepreneurs, investors, and policymakers alike. Additionally, even if more capable and innovative
firms are those that are more likely to identify and secure such collaboration, future work may be

37
able to determine more definitively the extent to which better partners are far-sighted enough to
seek value in government collaborations or whether the collaborations themselves make partners
more innovative. Future work may be able to use regression discontinuity approaches to separate
firm quality from direct collaboration impact, for example, or even study the reciprocal effects.
Integrating a resource dependence theoretical lens into the entrepreneurial ecosystems literature
may provide important further insights into such reciprocal effects besides the outlined theoretical
grounding to determine the top partners and partnerships for increased innovation. According to
resource dependence theory, next to managing resources, organizations can successfully deal with
uncertainty by trying to shape governmental regulations for a more favorable environment. While
this strategy is typically reserved for larger, established firms that have sufficient resources for
engaging in political activities, the access to the relevant governmental bodies through technology
and licensing collaborations can provide a more realistic opportunity for resource-constrained
startups to also shape governmental regulations (Lin, 2014 provide similar arguments for why
startups should forge relationships with governmental bodies). Fourth, while this study already
provides a fine-grained analysis of partner types by splitting network measures into collaboration
types, future research could look more explicitly at the interorganizational network and explore
differences in terms of collaboration with suppliers, customers, or competitors. Fifth, while our
results point to the value of collaboration, we look at the relationship between collaboration and
startup innovation activity in a specific period (2008 – 2012) that faced a global financial crisis.
Although we control for time-changes in the statistical models and our results emphasize on
collaboration in a time of financial resource constraints, additional research on either other sectors
during the financial crisis, or on the cleantech sector in less constrained periods, could test the
extent to which the results are specific to a time of limited financing.

38
REFERENCES
Ács, Z. J., Autio, E., & Szerb, L. 2014. National systems of entrepreneurship: Measurement issues
and policy implications. Research Policy, 43(3): 476-494.
Adner, R. 2006. Match your innovation strategy to your innovation ecosystem. Harvard Business
Review, 84(4): 98-107.
Adner, R. & Kapoor, R. 2010. Value creation in innovation ecosystems: How the structure of
technological interdependence affects firm performance in new technology generations.
Strategic Management Journal, 31(3): 306-333.
Alvarez, S. A. & Busenitz, L. W. 2001. The entrepreneurship of resource-based theory. Journal of
Management, 27(6): 755-775.
Anadon, L. D. & Holdren, J. P. 2009. Policy for energy technology innovation. In K. S. Gallagher
(Ed.), Acting in time on energy policy: 89-127. Washington, DC: Brookings Institution Press.
Anadon, L. D. 2012. Missions-oriented RD&D institutions in energy between 2000 and 2010: A
comparative analysis of China, the United Kingdom, and the United States. Research Policy,
41(10): 1742-1756.
Anadon, L. D., Bunn, M., & Narayanamurti, V. 2014. Transforming US energy innovation.
Cambridge, UK: Cambridge University Press.
Autio, E., Kenney, M., Mustar, P., Siegel, D., & Wright, M. 2014. Entrepreneurial innovation: The
importance of context. Research Policy, 43(7): 1097-1108.
Baum, J. A. C. 1996. Organizational ecology. In S. Clegg & C. Hardy & W. Nord (Eds.),
Handbook of organization studies: 77-114. London: SAGE.
Baum, J. A. C., Calabrese, T., & Silverman, B. S. 2000. Don't go it alone: Alliance network
composition and startups' performance in Canadian biotechnology. Strategic Management
Journal, 21(3): 267-294.
Bergek, A., Jacobsson, S., Carlsson, B., Lindmark, S., & Rickne, A. 2008. Analyzing the functional
dynamics of technological innovation systems: A scheme of analysis. Research Policy, 37(3):
407-429.
Bettis, R. A. & Hitt, M. A. 1995. The new competitive landscape. Strategic Management Journal,
16(1): 7-19.
Bonacich, P. 1987. Power and centrality: A family of measures. American Journal of Sociology,
92(5): 1170-1182.
Bonacich, P. 2007. Some unique properties of eigenvector centrality. Social Networks, 29(4): 555-
564.
Bonvillian, W. B. & Atta, R. 2011. ARPA-E and DARPA: Applying the DARPA model to energy
innovation. The Journal of Technology Transfer, 36(5): 469-513.

39
Bonvillian, W. B. 2014. The new model innovation agencies: An overview. Science and Public
Policy, 41: 425-437.
Chan, G. 2015. The commercialization of publicly funded science:How licensing federal laboratory
inventions affects knowledge spillovers. Harvard Kennedy School Working Paper. Available
at: https://drive.google.com/file/d/0B-RCEGY3RGj7a09raGhaanhZSlU/view?pref=2&pli=1.
Chesbrough, H. W. 2003. Open innovation: The new imperative for creating and profiting from
technology. Boston: Harvard Business Press.
Choi, H. & Anadón, L. D. 2014. The role of the complementary sector and its relationship with
network formation and government policies in emerging sectors: The case of solar
photovoltaics between 2001 and 2009. Technological Forecasting and Social Change, 82(2):
80-94.
Chu, S. & Majumdar, A. 2012. Opportunities and challenges for a sustainable energy future.
Nature, 488(7411): 294-303.
Clarysse, B., Wright, M., Bruneel, J., & Mahajan, A. 2014. Creating value in ecosystems: Crossing
the chasm between knowledge and business ecosystems. Research Policy, 43(7): 1164-1176.
Conti, A., Thursby, J., & Thursby, M. 2013. Patents as signals for startup financing. The Journal of
Industrial Economics, 61(3): 592-622.
Cox Pahnke, E., McDonald, R., Wang, D., & Hallen, B. 2015. Exposed: Venture capital, competitor
ties, and entrepreneurial innovation. Academy of Management Journal, 58(5): 1334-1360.
Csardi, G. & Nepusz, T. 2006. The igraph software package for complex network research.
InterJournal, Complex Systems: 1695.
DeCarolis, D. M. & Deeds, D. L. 1999. The impact of stocks and flows of organizational
knowledge on firm performance: An empirical investigation of the biotechnology industry.
Strategic Management Journal, 20(10): 953-968.
Deeds, D. L. & Hill, C. W. L. 1996. Strategic alliances and the rate of new product development:
An empirical study of entrepreneurial biotechnology firms. Journal of Business Venturing,
11(1): 41-55.
Demirkan, I. & Demirkan, S. 2012. Network characteristics and patenting in biotechnology, 1990-
2006. Journal of Management, 38(6): 1892-1927.
Doblinger, C., Dowling, M., & Helm, R. 2016. An institutional perspective of public policy and
network effects in the renewable energy industry: Enablers or disablers of entrepreneurial
behaviour and innovation? Entrepreneurship & Regional Development, 28(1-2): 126-156.
DOE. 2014. Strategic plan 2014-2018; Accessed June 8, 2016:
http://www.energy.gov/sites/prod/files/2014/04/f14/2014_dept_energy_strategic_plan.pdf.
Dyer, J. H. & Singh, H. 1998. The relational view: Cooperative strategy and sources of
interorganizational competitive advantage. Academy of Management Review, 23(4): 660-
679.

40
Folta, T. B., Cooper, A. C., & Baik, Y.-S. 2006. Geographic cluster size and firm performance.
Journal of Business Venturing, 21(2): 217-242.
Fouquet, R. 2013. Handbook on energy and climate change. Cheltenham, UK and Northampton,
MA: Edward Elgar Publications.
Freeman, C. 1987. Technology policy and economic performance: Lessons from Japan. London:
Pinter Publishers.
Fuchs, E. R. H. 2010. Rethinking the role of the state in technology development: DARPA and the
case for embedded network governance. Research Policy, 39(9): 1133-1147.
Glauthier, T. J. & Cohon, J. L. 2015. Securing America's future: Realizing the potential of the
Department of Energy's national laboratories. Accessed May 20, 2016:
http://energy.gov/sites/prod/files/2015/10/f27/Final%20Report%20Volume%201.pdf.
Griliches, Z. 1990. Patent statistics as economic indicators: A survey. Journal of Economic
Literature, 28(4): 1661-1707.
Grubler, A., Nakićenović, N., & Victor, D. G. 1999. Dynamics of energy technologies and global
change. Energy Policy, 27(5): 247-280.
Grubler, A., Aguayo, F., Gallagher, K., Hekkert, M., Jiang, K., Mytelka, L., Neij, L., Nemet, G., &
Wilson, C. 2012. Chapter 24 - Policies for the energy technology innovation system (ETIS),
Global energy assessment - Toward a sustainable future: 1665-1744. Cambridge, UK, New
York, USA, and Laxenburg, Austria: Cambridge University Press and International Institute
for Applied Systems Analysis.
Guzman, J. & Stern, S. 2015. Where is Silicon Valley? Science, 347(6222): 606-609.
Haeussler, C., Harhoff, D., & Müller, E. 2009, To be financed or not . . .: The role of patents for
venture capital financing. ZEW - Centre for European Economic Research Discussion Paper
No. 09-003. Available at SSRN: http://ssrn.com/abstract=1393725.
Hagedoorn, J. & Schakenraad, J. 1994. The effect of strategic technology alliances on company
performance. Strategic Management Journal, 15(4): 291-309.
Hekkert, M. P., Suurs, R. A. A., Negro, S. O., Kuhlmann, S., & Smits, R. E. H. M. 2007. Functions
of innovation systems: A new approach for analysing technological change. Technological
Forecasting and Social Change, 74(4): 413-432.
Hillman, A. J., Withers, M. C., & Collins, B. J. 2009. Resource dependence theory: A review.
Journal of Management, 35(6): 1404-1427.
Hoppmann, J., Peters, M., Schneider, M., & Hoffmann, V. H. 2013. The two faces of market
support: How deployment policies affect technological exploration and exploitation in the
solar photovoltaic industry. Research Policy, 42(4): 989-1003.
Howell, S. 2015. Financing constraints as barriers to innovation: Evidence from R&D grants to
energy startups. Harvard Kennedy School Working Paper. Available at:
http://scholar.harvard.edu/files/showell/files/howell_innovation_finance_jmp_jan17.pdf.
41
Hsu, D. H. & Ziedonis, R. H. 2013. Resources as dual sources of advantage: Implications for
valuing entrepreneurial-firm patents. Strategic Management Journal, 34(7): 761-781.
i3 Cleantech Group. 2015. i3 cleantech database. Accessed January 11th, 2015:
https://i3connect.com/front_page?ref=%2F.
Iansiti, M. & Levien, R. 2004. The keystone advantage: What the new dynamics of business
ecosystems mean for strategy, innovation, and sustainability. Cambridge, MA: Harvard
Business School Press.
Jacobsson, S. & Bergek, A. 2011. Innovation system analyses and sustainability transitions:
Contributions and suggestions for research. Environmental Innovation and Societal
Transitions, 1(1): 41-57.
Jaffe, A. B. 1986. Technological opportunity and spillovers of R & D: Evidence from firms' patents,
profits, and market value. The American Economic Review, 76(5): 984-1001.
Jones, C., Anadon, L. D., & Narayanamurti, V. 2014. Encouraging private-sector energy
technology innovation and public-private cooperation. In L. D. Anadon & M. Bunn & V.
Narayanamurti (Eds.), Transforming US Energy Innovation: 125-168. Cambridge, UK:
Cambridge University Press.
Jung, H. J. & Lee, J. 2015. The quest for originality: A new typology of knowledge search and
breakthrough inventions. Academy of Management Journal, Forthcoming.
Koonin, S. E. & Gopstein, A. M. 2011. Accelerating the pace of energy change. Issues in Science
and Technology, XXVII(2): Winter 2011. Available at: http://issues.org/2027-2012/koonin/.
Krugman, P. 1991. Increasing returns and economic geography. Journal of Political Economy,
99(3): 483-499.
Laursen, K. & Salter, A. 2006. Open for innovation: The role of openness in explaining innovation
performance among U.K. manufacturing firms. Strategic Management Journal, 27(2): 131-
150.
Laursen, K. & Salter, A. J. 2014. The paradox of openness: Appropriability, external search and
collaboration. Research Policy, 43(5): 867-878.
Lechner, C., Dowling, M., & Welpe, I. 2006. Firm networks and firm development: The role of the
relational mix. Journal of Business Venturing, 21(4): 514-540.
Lechner, C., Soppe, B., & Dowling, M. 2014. Vertical coopetition and the sales growth of young
and small firms. Journal of Small Business Management, 54(1): 67-84.
Lemley, M. A. & Sampat, B. 2012. Examiner characteristics and patent office outcomes. Review of
Economics and Statistics, 94(3): 817-827.
Levin, R., Klevorick, A., Nelson, R., & Winter, S. 1987. Appropriating the returns from industrial
research and development. Brookings Papers on Economic Activity, 3: 783–820.

42
Li-Ying, J., Wang, Y., Salomo, S., Li-Ying, J., Wang, Y., & Salomo, S. 2014. An inquiry on
dimensions of external technology search and their influence on technological innovations:
Evidence from Chinese firms. R & D Management, 44(1): 53-74.
Liebeskind, J. P., Oliver, A. L., Zucker, L., & Brewer, M. 1996. Social networks, learning, and
flexibility: Sourcing scientific knowledge in new biotechnology firms. Organization Science,
7(4): 428-443.
Lin, H. 2014. Government–business partnership formation for environmental improvements.
Organization & Environment, 27(4): 383-398.
Lundvall, B.-Å. 1992. National systems of innovation: Towards a theory of innovation and
interactive learning. London: Pinter.
Malecki, E. J. & Poehling, R. M. 1999. Extroverts and introverts: Small manufacturers and their
information sources. Entrepreneurship & Regional Development, 11(3): 247-268.
Markard, J., Raven, R., & Truffer, B. 2012. Sustainability transitions: An emerging field of research
and its prospects. Research Policy, 41(6): 955-967.
Mazzucato, M. 2013. The entrepreneurial state – Debunking public vs. private sector myths.
London, UK: Anthem Press.
Meyskens, M. & Carsrud, A. 2013. Nascent green-technology ventures: A study assessing the role
of partnership diversity in firm success. Small Business Economics, 40(3): 739-759.
Mowery, D. C., Nelson, R. R., & Martin, B. R. 2010. Technology policy and global warming: Why
new policy models are needed (or why putting new wine in old bottles won’t work). Research
Policy, 39(8): 1011-1023.
Nanda, R., Younge, K., & Fleming, L. 2015. Innovation and entrepreneurship in renewable energy.
In A. Jaffe & B. Jones (Eds.), The changing frontier: Rethinking science and innovation
policy: 199-232. Chicago: University of Chicago Press.
Narayanamurti, V. & Odumosu, T. 2016. Cycles of invention and discovery. Cambridge, MA:
Harvard University Press.
Nelson, A. J. 2009. Measuring knowledge spillovers: What patents, licenses and publications reveal
about innovation diffusion. Research Policy, 38(6): 994-1005.
Nemet, G. F. 2009. Demand-pull, technology-push, and government-led incentives for non-
incremental technical change. Research Policy, 38(5): 700-709.
Owen-Smith, J. & Powell, W. W. 2008. Networks and institutions. In R. Greenwood & C. Oliver &
K. Sahlin & R. Suddaby (Eds.), The SAGE handbook of organizational institutionalism:
596-624. London, Thousand Oaks, New Delhi, Singapore: SAGE Publications.
Pacheco, D. F., York, J. G., & Hargrave, T. J. 2014. The coevolution of industries, social
movements, and institutions: Wind power in the United States. Organization Science, 25(6):
1609-1632.

43
Pfeffer, J. & Salancik, G. R. 1978. The external control of organizations: A resource dependence
perspective. New York: Harper & Row.
Popp, D. 2004. ENTICE: Endogenous technological change in the DICE model of global warming.
Journal of Environmental Economics and Management, 48(1): 742-768.
Powell, W. W., Koput, K. W., & Smith-Doerr, L. 1996. Interorganizational collaboration and the
locus of innovation: Networks of learning in biotechnology. Administrative Science
Quarterly, 41(1): 116-145.
Qiu, Y. & Anadon, L. D. 2012. The price of wind power in China during its expansion: Technology
adoption, learning-by-doing, economies of scale, and manufacturing localization. Energy
Economics, 34(3): 772-785.
R Core Team. 2015. R: A language and environment for statistical computing. Vienna, Austria: R
Foundation for Statistical Computing.
Riordan, M. & Hoddeson, L. 1998. Crystal fire: The invention of the transistor and the birth of
the information age. New York et al.: Norton.
Robinson, D. T. & Stuart, T. E. 2007. Network effects in the governance of strategic alliances.
Journal of Law, Economics, and Organization, 23(1): 242-273.
Saxenian, A. 1996. Regional advantage: Culture and competition in Silicon Valley and Route
128. Cambridge, MA: Harvard University Press.
Schacht, W. H. 2009, The Bayh-Dole Act: Selected issues in patent policy and the
commercialization of technology; Accessed May 5, 2016:
https://fas.org/sgp/crs/misc/RL32076.pdf.
Schilling, M. A. & Phelps, C. C. 2007. Interfirm collaboration networks: The impact of large-scale
network structure on firm innovation. Management Science, 53(7): 1113-1126.
Sine, W. D., Haveman, H. A., & Tolbert, P. S. 2005. Risky business? Entrepreneurship in the new
independent-power sector. Administrative Science Quarterly, 50(2): 200-232.
Stam, W. & Elfring, T. 2008. Entrepreneurial orientation and new venture preformance: The
moderating role of intra- and extraindustry social capital. Academy of Management Journal,
51(1): 97-111.
Stuart, T. E. 2000. Interorganizational alliances and the performance of firms: A study of growth
and innovation rates in a high-technology industry. Strategic Management Journal, 21(8):
791-811.
Tang, T. & Popp, D. 2014. The learning process and technological change in wind power: Evidence
from China’s CDM wind projects. National Bureau of Economic Research Working Paper
Series 0–47, Available at: http://www.nber.org/papers/w19921.
Trajtenberg, M. 1987. Patents, citations, and innovations: Tracing the links. Cambridge, MA:
National Bureau of Economic Research Working Paper 2457.

44
UNFCC. 2015. Adoption of the Paris Agreement; Accessed June 20, 2016:
http://unfccc.int/files/essential_background/convention/application/pdf/english_paris_agreem
ent.pdf.
United Nations. 2015. Transforming our World: The 2030 Agenda for Sustainable Development.
Accessed July 10, 2016:
http://www.un.org/ga/search/view_doc.asp?symbol=A/RES/70/1&Lang=E.
Unruh, G. C. 2000. Understanding carbon lock-in. Energy Policy, 28(12): 817.
Von Hippel, E. 1978. A customer-active paradigm for industrial product idea generation. Research
Policy, 7(3): 240-266.
von Hippel, E. 1988. The sources of innovation. New York: Oxford University Press.
Westwick, P. J. 2003. The national labs: Science in an American system, 1947 - 1974. Cambridge,
MA: Harvard University Press.
Whittington, K. B., Jason, O.-S., & Powell, W. W. 2009. Networks, propinquity, and innovation in
knowledge-intensive industries. Administrative Science Quarterly, 54(1): 90-122.
Zahra, S. A. & Nambisan, S. 2012. Entrepreneurship and strategic thinking in business ecosystems.
Business Horizons, 55(3): 219-229.
Zobel, A.-K., Balsmeier, B., & Chesbrough, H. 2016. Does patenting help or hinder open
innovation? Evidence from new entrants in the solar industry. Industrial and Corporate
Change, 25(2): 307-331.

45
FIGURE 1
Network graphs
Startup – Government
2009
Startup – Government
2010
Startup – Government
2011
Startup – Government
2012
Graph of start-up (black) collaborations with governmental partners (grey) weighted by the
eigenvector centrality from 2009 (top left) to 2012 (bottom-right). The collaborations are
technology-based (red) or market-based (blue). The most central governmental partners with the
highest eigenvector centralities are labeled.
NREL
Sandia
NASA
ORNL
CAS
NREL
PNNL
NREL
PNNL

46
Startup – Other Firm
2009
Startup – Other Firm
2010
Startup – Other Firm
2011
Startup – Other Firm
2012
Graph of start-up (black) collaborations with other firms (grey) weighted by the eigenvector
centrality from 2009 (top left) to 2012 (bottom-right). The collaborations are technology-based
(red) or market-based (blue).

47
FIGURE 2
Differentiation of larger, well-connected ecosystem
Larger Ecosystem
(59% of the US cleantech startups)
Outside of LargerEcosystem
(41% of US cleantech startups)
Total Network

48
FIGURE 3
Overview of Private Investments
0%
5%
10%
15%
20%
25%
30%
35%
40%
Per
cen
tage
of
Inves
tmen
t R
ou
nd
s
Investment Types

49
FIGURE 4
Average patenting activity per firm per sector
0
0.5
1
1.5
2
2.5
3
3.5
0%
5%
10%
15%
20%
25%
30%
Av
erage
nu
mb
er o
f
pate
nts
Per
cen
tage
of
clea
n e
ner
gy a
nd
tran
sport
ati
on
sta
rt-u
ps
Sector
Average number of firms Average patenting activity per sector
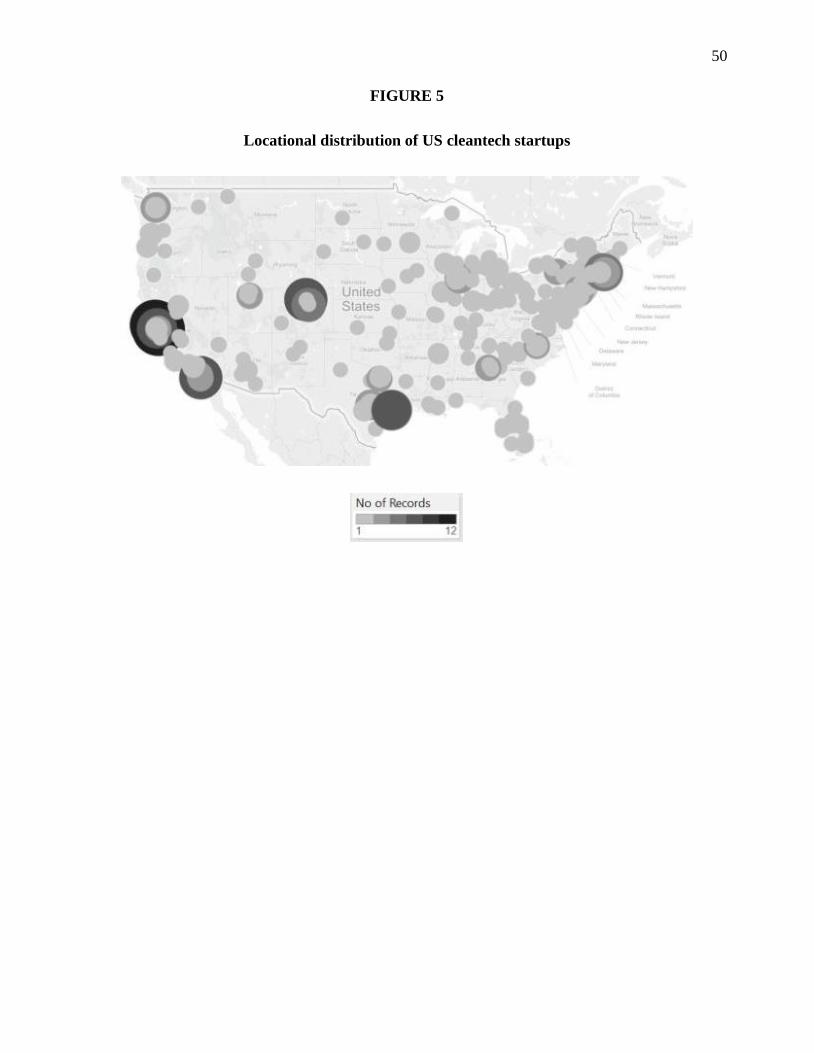
50
FIGURE 5
Locational distribution of US cleantech startups

51
FIGURE 6
Average patenting activity per firm per Metropolitan Statistical Area (MSA) 16
16
For the CSA results, the patenting activity in Dayton-Springfield-Sidney, OH, Phoenix-Mesa-Scottsdale, AZ, Jackson-
Vicksburg-Brookhaven, MS Springfield-Greenfield Town, MA, and Kansas City-Overland Park-Kansas City, MO-KS, Cleveland-
Akron-Canton, OH was also higher than in the San Jose-San Francisco-Oakland, CA CSA.
0
1
2
3
4
5
6
7
0%
2%
4%
6%
8%
10%
12%
14%
16%
Aver
age
nu
mb
er o
f
pate
nts
Per
cen
tage
of
clea
n e
ner
gy a
nd
tran
sport
ati
on
sta
rt-u
ps
Sector
Average number of firms Average patenting activity per MSA

52
FIGURE 7
Interaction Effect
010
20
30
Pate
nting
Activity
0 .05 .1 .15 .2 .25 .3 .35 .4 .45 .5 .55 .6 .65 .7 .75 .8 .85 .9 .95 1Eigenvector Centrality: Government Licensing Alliances
Outside of large ecosystem Inside large ecosystem
Interaction: Government Licensing Alliance x Ecosystem

53
TABLE 1
Overview and explanation of the five collaboration types in the startup-database
Collaboration Type Example
Technology-based
collaboration
joint technology
development
Arcos Silicon and Broadcom Corporation partnered to
improve the interoperability of their power-over-ethernet
(PoE) products.
Sapphire Power has partnered with University of California,
San Diego to demonstrate the viability of saltwater algae in
the production of biofuels.
licensee Natcore has been granted a patent license agreement from
NREL to develop and commercialize a line of black silicon
PV products.
Market-based
collaboration
procurement or
customer
As part of a purchase agreement, Sustainable Green will
become exclusive distributor of MagneGas fuel over a two
year period in Pacific Northwest.
Avista Corp. is buying the power produced by the Palouse
Wind project under a 30-year power purchase agreement
and will take delivery of the power through a direct
interconnect to the Avista 230 kV Benewah-to-Shawnee
transmission line.
Additional forms
of collaboration
licensor ABB has signed a licensing agreement with ECOtality to use
ECOtality's technology for ABB's EV charging network.
project
development
Obsidian Renewables partnered with Swinerton Builders to
develop the Black Cap Solar facility.

54
TABLE 2
Descriptive Statistics and Correlations of Variables Used in Regression Analysis
N n Mean S.D. Min Max 1 2 3 4 5 6 7 8 9 10 11 12 13 14 15
1 Patenting activity 2724 767 1.835 4.979 0 69 1
2 Private financing deals 2738 771 0.666 1.175 0 13 0.21 1
3 EC1: Government partner 3297 783 0.003 0.036 0 1 0.04 0.04 1
4 EC1: University/research partner 3297 783 0.002 0.04 0 1 0.00 0.00 0.16 1
5 EC1: Nonprofit partner 3297 783 0.002 0.04 0 1 -0.01 -0.01 0.00 0.00 1
6 EC1: Other public partner 3297 783 0.002 0.035 0 1 0.00 -0.01 0.00 0.00 0.00 1
7 EC1: Cleantech startup partner 3297 783 0.004 0.054 0 1 0.08 0.06 0.02 0.00 0.00 0.00 1
8 EC1: Other inter-firm partner 3297 783 0.002 0.03 0 1 0.00 0.05 0.00 0.02 0.00 0.00 0.04 1
9 Pre-sample patents 3297 783 3.868 11.004 0 94.42 0.33 0.08 -0.01 -0.01 0.00 0.04 0.02 0.01 1
10 Prior private financing 3297 783 1.42 2.079 0 15.57 0.34 0.45 0.05 0.04 0.03 0.02 0.08 0.07 0.26 1
11 Prior public financing 3297 783 0.051 0.258 0 3.15 0.00 0.02 0.01 0.10 0.01 0.01 -0.02 -0.01 -0.01 0.04 1
12 DOE grants 3297 783 0.042 0.242 0 4 0.08 0.03 0.07 0.08 -0.01 -0.01 0.04 0.01 0.08 0.1 0.05 1
13 IPO or M&A 2739 771 0.015 0.123 0 1 0.08 0.01 -0.01 -0.01 -0.01 0.03 -0.01 -0.01 0.04 0.07 -0.02 0.00 1
14 Age 3297 783 3.873 2.794 0 10 0.17 0.06 0.02 0.02 0.03 0.01 0.03 0.03 0.29 0.32 0.08 0.03 0.08 1
15 Size (log) 3042 716 3.13 1.612 0 8.92 0.32 0.23 0.00 -0.01 0.01 -0.01 0.05 0.08 0.28 0.36 -0.04 0.06 0.09 0.28 1
16 Location (log MSA density) 3297 783 3.094 1.456 0 4.78 0.12 0.14 0.00 0.00 0.03 -0.03 0.01 0.06 0.06 0.16 -0.06 -0.01 0.00 -0.01 0.08
1 EC = Eigenvector Centrality

55
TABLE 3
Estimated Coefficients from Negative Binomial Regressions
(Robust Standard Errors in Parentheses)
Patenting activity Model 1:
Controls
Model 2:
Partner Type
Model 3:
Partner and Collaboration
Types
Model 3a:
Ecosystems
Interaction
Controls Pre-sample patents 0.06 0.07 0.07 0.07
(0.01)** (0.01)** (0.01)** (0.01)**
Prior private financing deals 0.19 0.19 0.18 0.18
(0.02)** (0.02)** (0.02)** (0.022)**
Prior public financing deals 0.09 0.10 0.10 0.10
(0.11) (0.109) (0.112) (0.112)
Part of large ecosystem 0.12 0.12 0.13 0.14
(0.10) (0.10) (0.10) (0.10)
Age -0.04 -0.04 -0.04 -0.04
(0.02)+ (0.02)+ (0.02)+ (0.02)+
Size (log) 0.34 0.35 0.35 0.35
(0.04)** (0.04)** (0.04)** (0.04)**
Location (log MSA density) 0.13 0.14 0.14 0.13
(0.03)** (0.03)** (0.03)** (0.03)**
Partner Types
Government partner 2.16
(0.83)**
University/research partner -0.94
(0.58)
Nonprofit partner -0.60
(0.76)
Other public partner -4.60
(1.11)**
Cleantech startup partner 0.18
(0.55)
Other inter-firm partner -1.99
(0.92)*
Partner and Collaboration Types
Government technology collaboration 2.25 2.24
(0.65)** (0.65)**
Government licensee collaboration 0.63 1.60
(0.46) (0.27)**
Government market collaboration -1.71 -1.71
(0.51)** (0.51)**
Interaction Effect
Government licensing collaboration x
Ecosystem
-2.34
(0.47)**
University/research technology collaboration 0.89 0.89
(0.77) (0.77)
University/research licensee collaboration 0.41 0.40
(0.35) (0.34)
University/research market collaboration -1.79 -1.78
(0.62)** (0.62)**
Inter-firm technology collaboration -0.16 -0.17
(0.46) (0.46)
Inter-firm licensee collaboration 0.96 0.81
(0.34)** (0.34)*
Inter-firm market collaboration 0.56 0.56
(0.81) (0.81)
Additional Collaborations as Control
Nonprofit partner -0.31 -0.32

56
(0.70) (0.70)
Other public partner -5.15 -5.13
(1.39)** (1.37)**
Project development collaboration -29.87 -29.89
(8.74)** (8.73)**
Licensor collaboration -1.80 -1.63
(1.21) (1.24)
Time-fixed effects included Y Y Y Y
Sector-fixes effects included Y Y Y Y
Constant -2.04 -2.08 -2.10 -2.11
(0.19)** (0.19)** (0.20)** (0.20)**
lnalpha Constant 1.07 1.06 1.04 1.04
(0.05)** (0.05)** (0.05)** (0.05)**
Observations 2,503 2,503 2,503 2,503
Cragg & Uhler's R21 0.083 0.085 0.088 0.088
McFadden's R2 0.240 0.245 0.252 0.253
Log likelihood -3,605.74 -3,598.85 -3,587.16 -3,586.04
Prob > chi2 0.000 0.000 0.000 0.000
+ p<0.1; * p<0.05; ** p<0.01
1 We reported pseudo R2 (Cragg & Uhler and McFadden) as a means to compare model fit. We are aware of the fact that pseudo R2 does not provide similar information as the R2 reported after
OLS.

57
TABLE 4
Estimated Coefficients from Negative Binomial Regressions
(Robust Standard Errors in Parentheses)
Private financing deals Model 1:
Controls
Model 2:
Partner Type
Model 3:
Partner and
Collaboration Types
Controls
Prior patents -0.00 -0.00 -0.00
(0.00) (0.00) (0.00)
Pre-sample private financing deals1 0.25 0.24 0.25
(0.02)** (0.02)** (0.02)**
Prior public financing deals 0.08 0.08 0.09
(0.15) (0.15) (0.15)
Part of large ecosystem 0.16 0.16 0.17
(0.07)* (0.07)* (0.07)*
Age -0.10 -0.10 -0.10
(0.02)** (0.02)** (0.02)**
Size (log) 0.18 0.18 0.18
(0.02)** (0.02)** (0.02)**
Location (log MSA density) 0.12 0.13 0.13
(0.02)** (0.02)** (0.02)**
Partner Types
Government partner 1.11
(0.81)
University/research partner -0.38
(0.62)
Nonprofit partner -1.75
(1.33)
Other public partner -0.84
(0.70)
Cleantech startup partner 0.21
(0.39)
Other inter-firm partner 0.04
(0.52)
Partner and Collaboration Types
Government technology collaboration 0.87
(0.73)
Government licensee collaboration 0.91
(0.35)**
Government market collaboration -1.44
(0.91)
University/research technology collaboration -3.03
(1.57)+
University/research licensee collaboration 0.42
(0.44)
University/research market collaboration 0.21
(0.53)
Inter-firm technology collaboration 0.20
(0.56)
Inter-firm licensee collaboration 0.70
(0.21)**
Inter-firm market collaboration -0.51
(0.65)
Additional Collaborations as Control
Nonprofit partner -1.55
(1.41)
Other public partner -1.23

58
(0.73)+
Project development collaboration -3.80
(1.20)**
Licensor collaboration -0.60
(0.47)
Time-fixed effects included Y Y Y
Sector-fixes effects included Y Y Y
Constant -1.82 -1.83 -1.85
(0.14)** (0.14)** (0.14)**
lnalpha Constant -0.12 -0.13 -0.16
(0.10) (0.10) (0.10)
Observations 2,507 2,507 2,507
Cragg & Uhler's R21 0.150 0.153 0.160
McFadden's R2 0.063 0.064 0.067
Log likelihood -2,732.82 -2,729.38 -2,719.99
Prob > chi2 0.000 0.000 0.00
+ p<0.1; * p<0.05; ** p<0.01 1 Similar to the patenting activity models, we changed the prior financing variable to include only pre-sample private financing deals to control for unobserved
heterogeneity in firm patenting (e.g., Schilling and Phelps, 2007). However, including the same variable as in the patenting models (of the previous year) revealed
similar results.

59
TABLE 5
Estimated Coefficients from Fixed-Effects Negative Binomial Regressions
(Standard Errors in Parentheses)
Patenting activity Private financing deals
Model 1:
Partner Type
Model 2: Partner and
Collaboration Types
Model 1:
Partner Type
Model 2: Partner and
Collaboration Types
Partner Types
Government partner 0.80 0.24
(0.41)+ (0.62)
University/research partner 0.08 -0.97
(0.57) (0.744)
Nonprofit partner -0.82 -1.80
(0.71) (0.97)+
Other public partner -2.13 -0.08
(1.34) (1.04)
Cleantech startup partner 0.19 0.15
(0.32) (0.38)
Other inter-firm partner 0.34 0.52
(0.93) (0.73)
Partner and Collaboration
Types
Government joint
technology development
collaboration
0.76
0.52
(0.41)+ (0.66)
Government licensee
collaboration
0.11
0.01
(0.43) (0.48)
Government market
collaboration
-0.23
-0.39
(0.78) (1.11)
University/research
technology collaboration
0.12
-3.81
(0.46) (2.01)+
University/research
licensee collaboration
0.44
-0.52
(0.35) (0.49)
University/research market
collaboration
0.18
0.85
(0.55) (0.76)
Inter-firm joint technology
development collaboration
0.12
-0.29
(0.40) (0.66)
Inter-firm licensee
collaboration
0.36
0.61
(0.25) (0.30)*
Inter-firm market
collaboration
0.26
0.22
(0.47) (0.74)
Additional Collaborations as Control
Nonprofit partner
-0.67 -1.67
(0.71) (0.99)+

60
Other public partner -2.30 -0.32
(1.31)+ (1.03)
Project development
collaboration
-4.91
-1.72
(7.75) (2.51)
Licensor collaboration
-2.14 -0.13
(1.30)+ (0.77)
Time-fixed effects included Y Y Y Y
Sector-fixes effects
included N N N N
Constant 0.74 0.73 1.33 1.37
(0.12)** (0.12)** (0.24)** (0.24)**
Observations 1,459 1,459 1,695 1,695
Log likelihood -1,645.68 -1,641.50 -1,310.41 -1,302.66
Wald chi2 28.37 33.82 21.20 29.80
Prob > chi2 0.001 0.006 0.012 0.020