Government Securities Management - djppr.kemenkeu.go.id fileLaunch a new primary dealer system...
29
Directorate of Government Debt Securities Directorate General of Debt Management Ministry of Finance of The Republic of Indonesia Government Securities Management February 2 nd, 2015
Transcript of Government Securities Management - djppr.kemenkeu.go.id fileLaunch a new primary dealer system...

Directorate of Government Debt Securities Directorate General of Debt Management Ministry of Finance of The Republic of Indonesia
Government Securities Management February 2nd, 2015

OUTLINE
1. Government Securities Management and Financing
Strategy
2. Government Securities Performance
3. Crisis Management Protocol & Bond Stabilization
Framework
4. Debt Outstanding & Risk Profile
2

Government Securities
Management and Financing Strategy

Key Initiatives to Develop Domestic Gov. Securities
Market
Facilitating the development of derivative instrument and Government securities repo:
• Develop a deep and liquid repo market, coordinate with FSA
• Facilitating the development of Government Bond Futures
Focused on a few benchmark series with large outstanding
Introduction of an electronic trading platform (ETP)
Strengthening Investor Relations (IR)
Launch a new primary dealer system
Increase domestic participation from key investors
Continuously improving bond stabilization framework
4
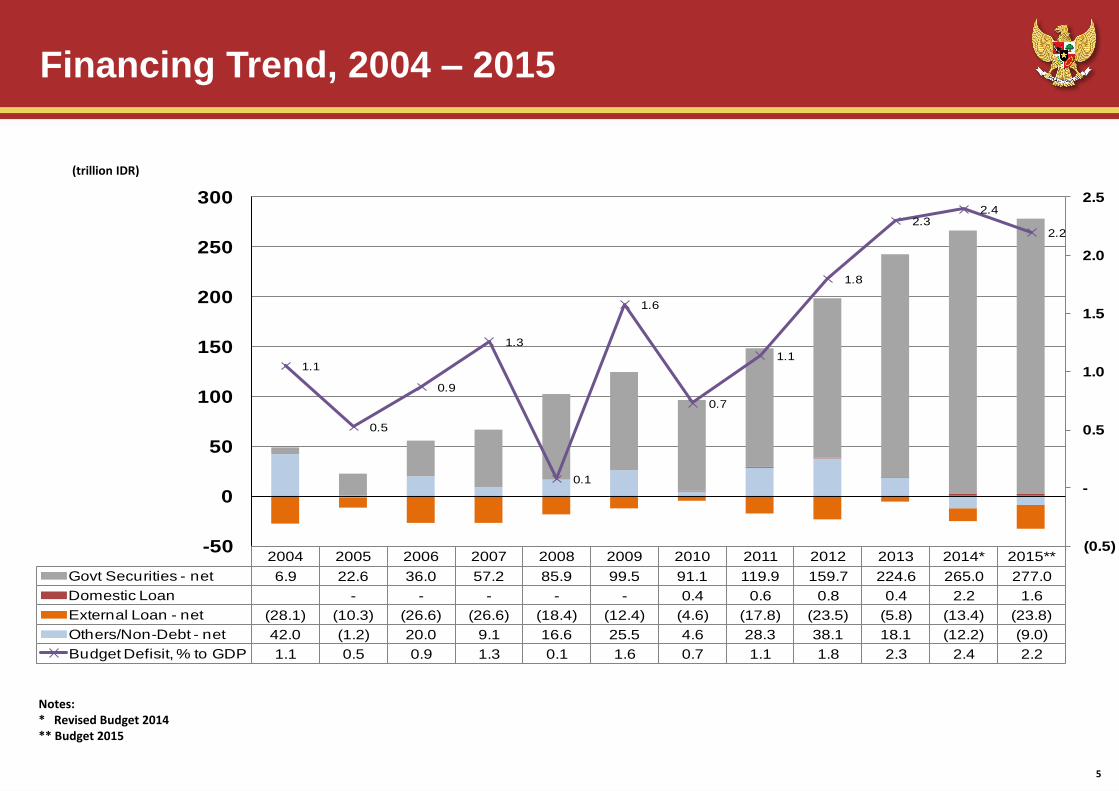
Financing Trend, 2004 – 2015
(trillion IDR)
Notes: * Revised Budget 2014 ** Budget 2015
5
2004 2005 2006 2007 2008 2009 2010 2011 2012 2013 2014* 2015**
Govt Securities - net 6.9 22.6 36.0 57.2 85.9 99.5 91.1 119.9 159.7 224.6 265.0 277.0
Domestic Loan - - - - - 0.4 0.6 0.8 0.4 2.2 1.6
External Loan - net (28.1) (10.3) (26.6) (26.6) (18.4) (12.4) (4.6) (17.8) (23.5) (5.8) (13.4) (23.8)
Others/Non-Debt - net 42.0 (1.2) 20.0 9.1 16.6 25.5 4.6 28.3 38.1 18.1 (12.2) (9.0)
Budget Defisit, % to GDP 1.1 0.5 0.9 1.3 0.1 1.6 0.7 1.1 1.8 2.3 2.4 2.2
1.1
0.5
0.9
1.3
0.1
1.6
0.7
1.1
1.8
2.3 2.4
2.2
(0.5)
-
0.5
1.0
1.5
2.0
2.5
-50
0
50
100
150
200
250
300

Securities Financing Realization 2015
*Adjusted by changes in Cash Management & Debt Switch
6
*(Million IDR)
Budget 2015*Realization
(ao Jan 30, 2015)*
% Realization to
Budget 2015
Government Securities Net 277,049,800 84,862,000 30.63%
Government Securities Maturing in 2015 153,612,324 6,875,000 4.48%
-Buyback 3,000,000 - 0.00%
Issuance Need 2015* 430,662,124 91,737,000 21.30%
Government Debt Securities (GDS) 82,672,000
Domestic GDS 32,300,000
-Coupon GDS 21,300,000
-Conventional T-Bills 8,000,000
-Private Placement 3,000,000
-Retail Bonds -
International Bonds 50,372,000
-USD GMTN 50,372,000
-Euro GMTN -
-Samurai Bonds -
Government Islamic Debt Securities 9,065,000
Domestic Government Islamic Debt Securities 9,065,000
- IFR/PBS/T-Bills Sukuk (Islamic Fixed Rated Bond/Project Based Sukuk) 9,065,000
- Retail Sukuk -
Global Sukuk -

General Strategy for Debt Financing 2015
1. Optimizes Governments securities (SBN) issuance from domestic sources to fulfill Budget need and uses
foreign debts as complimentary;
2. Determines debt instrument by taken into account of market need in regard to market development and
portfolio management;
3. Issues Retail Bond for instrument diversification and financial inclusion;
4. Optimizes foreign and domestic loan instrument to fulfill Budget need on capital expenditure;
5. Conducts active portfolio management of Government securities through, among others, debt buyback
and debt switch, in order to promote market liquidity and stability;
6. Strengthens the function of Investor Relations Unit, among others, through the proactive dissemination of
information, rapid and effective responses, and effective communication with investors and other stakeholders.
7

Government Budget FY 2015
8
In billion IDR
Note: *) Subject to Parliament Approval
In the proposed Revised Budget of
2015 (RAPBN-P 2015), deficit is
narrowing from 2.21% of GDP to
1.91% of GDP
To maintain resilience and fiscal sustainability
Despite lower budget deficit, net
debt in 2015 is slightly higher
Government injects capital to SOE’s to
increase their capacity to support the
achievement of the national priority agenda
Stand-by loans are in place to
anticipate adverse situations
A. Total Revenue 1,793,588.9 16.1 1,768,970.7 14.9
B. Total Expenditure 2,039,483.6 18.3 1,994,888.7 16.8
Interest Payment 151,968.3 1.4 155,388.2 1.3
C. Primary Balance (93,926.4) (0.8) (70,529.8) (0.6)
D. Deficit (245,894.7) (2.2) (225,918.0) (1.9)
E. Financing 245,894.7 2.2 225,918.0 1.9
I. Non Debt (8,961.2) (0.1) (65,474.6) (0.6)
II. Debt 254,855.9 2.3 291,392.5 2.5
1. Government Securities (Net) 277,049.8 2.5 308,321.0 2.6
i. Issuance 430,662.1 3.9 462,433.0 3.9
ii. Principal Refinancing and (153,612.3) (1.4) (154,112.0) (1.3)
2. Loan (Net) (22,193.9) (0.2) (16,928.5) (0.1)
i. Foreign Loan (Net) (23,815.1) (0.2) (18,619.1) (0.2)
Disbursement 47,037.1 0.4 49,232.9 0.4
- Program Loan 7,140.0 0.1 7,320.0 0.1
- Project Loan 39,897.1 0.4 41,912.9 0.4
On Lending (4,319.4) (0.0) (4,395.7) (0.0)
Foreign Loan Principal Payment (66,532.8) (0.6) (63,456.3) (0.5)
ii. Domestic Loan (Net) 1,621.2 0.0 1,690.6 0.0
Disbursement 2,000.0 0.0 2,000.0 0.0
Domestic Loan Principal Payment (378.8) (0.0) (309.4) (0.0)
Assumptions :
GDP (trillion IDR) (Y.o.Y) 11,146,943.0 11,881,207.0
Growth (%) 5.8 5.8
Inflation (%) y-o-y 4.4 5.0
3-month-SPN (%) 6.0 6.2
IDR/USD (average) 11,900 12,200
% to
GDPBudget
Proposed
Revised
Budget*)
% to
GDP
2015
Description

Government Securities Financing (Gross) 2015
9
Domestic:
Auction:
conventional securities: 23 x
Islamic securities: 22 x
Non-Auction:
retail bonds: ORI + Sukuk
Retail.
International Bonds:
Issuance of International
Bonds as complement to
avoid crowding out in
domestic market and provide
benchmark for corporate
issuance, consist of USD,
YEN or EURO global bonds
Maximum issuance
international bond 20% from
target gross
Issuance targets for
GDS, Sukuk and ATM
target: – GDS (SUN): 81.7%
– Sukuk: 18.3%
– ATM for auctions: 8.7
year
Front Loading strategy:
• in the first semester is
targeted at 57%.
• for domestic issuance is
also targeted at first
semester at 54%
(in trillion Rp)
Instruments
Indicative
Target
Govt Securities (net) 277.0
Redemption 135.6
Cash Management 15.0
Buyback 3.0
Govt Securities (gross) 430.7
Domestic 80%
Retail 9%
Auctions 71%
International Bond 20%
FR 69 – 5 Y
FR 70 – 10 Y
FR 71 – 15 Y
FR 68 – 20 Y
Benchmark Series for 2014 & 2015

Government Securities Performance

0%
10%
20%
30%
40%
50%
60%
-
20,000
40,000
60,000
80,000
100,000
120,000
Jan-14 Feb-14 Mar-14 Apr-14 May-14 Jun-14 Jul-14 Aug-14 Sept-14 Oct-14 Nov-14 20-Jan-15
Incoming Bids Awarded Bids Foreign Incoming Bids Foreign Awarded Bids % Foreign Incoming Bids (RHS)
11 11
• Foreign incoming bids 2015 (YTD) is 29,7% of total bids vs 33,6% of total foreign incoming bids in 2014
• Average incoming bids 2015 = Rp27,39T, increased from average incoming bids 2014 = Rp23,37T
• Average awarded bid 2015 = Rp8,65T, while average awarded bid 2014 = Rp11,29 T.
*as of January 27,2015
Average incoming bids
2014 = Rp23,37T/auction
Average awarded bids
2014 = Rp11,29T/auction
Government Debt Securities Primary Market
Performance 2015

0%
10%
20%
30%
40%
50%
60%
-
20,000
40,000
60,000
80,000
100,000
120,000
Jan-14 Feb-14 Mar-14 Apr-14 May-14 Jun-14 Jul-14 Aug-14 Sep-14 Oct-14 Nov-14 27 Jan 15
Incoming Bids Awarded Bids Foreign Incoming Bids Foreign Awarded Bids % Foreign Incoming Bids (RHS)
12 12
• Average Foreign incoming bids 2015 is Rp8,73T vs Rp8,93T of average foreign incoming bids in 2014
• Average incoming bids 2015 = Rp27,62, increased from average incoming bids 2014 = Rp14,19T
• Average awarded bid 2015 = Rp9,59 T, while average awarded bid 2014 = Rp6,59T.
*as of January 27, 2015
Avr . Awarded bids
2014 = 6,59T Avr. Incoming Bid
2014: 14,19T
Avr. Foreign Incoming Bid 2014:
8,93T
Government Securities Primary Market
Performance 2015

2468
10121416182022
Apr'0
8
Jul'0
8
Oct'0
8
Jan'0
9
Apr'0
9
Jul'0
9
Oct'0
9
Jan'1
0
Apr'1
0
Jul'1
0
Oct'1
0
Jan'1
1
Apr'1
1
Jul'1
1
Oct'1
1
Jan'1
2
Apr'1
2
Jul'1
2
Oct'1
2
Jan'1
3
Apr'1
3
Jul'1
3
Oct'1
3
Jan'1
4
Apr'1
4
Jul'1
4
Oct'1
4
Jan'1
5
5Y 10Y 15Y 20Y
6.82 (5Y), 7.01 (10Y), 7.26 (15Y), 7.37 (20Y)
(IDR Trilion)
Global Financial
Crisis
Eurozone sovereign debt crisis
[In Percentage]
As of Jan 30, 2015
Activities of the domestic bonds are growing Yields of Benchmark Series steadily decrease
Bid Ask Spread 10 Y Government Bond Turn Over 10 Y Government Bond
As of Jan 30, 2015
As of Jan 30, 2015
Secondary Market Performance
Spread 7.4 bps
(ask 6.989%%,
bid 7.063%)
13
5.12
7.04
5.15
14.12 12.88
10.75 10.53
-
3.00
6.00
9.00
12.00
15.00
2008 2009 2010 2011 2012 2013 2014
0
10
20
30
40
50
60
70
Jan
-09
Ma
y-0
9
Se
p-0
9
Jan
-10
Ma
y-1
0
Se
p-1
0
Jan
-11
Ma
y-1
1
Se
p-1
1
Jan
-12
Ma
y-1
2
Se
p-1
2
Jan
-13
Ma
y-1
3
Se
p-1
3
Jan
-14
Ma
y-1
4
Se
p-1
4
Jan
-15
5.73 5.31 5.82 7.83
10.31
6.62 7.10 8.42 7.45 6.44
9.27 8.61 8.45 8.23 7.91
10.91 0.38 0.41 0.96
0.57
1.27
1.18 0.35
0.91 1.04
0.79
0.36 0.41 0.39 0.98 0.76
1.14
3.07 6.30
9.39 8.69
7.90
7.13 6.95
6.19 8.59 10.76
11.49
9.93 8.81 9.12
8.80
7.45
-
5.00
10.00
15.00
20.00
25.00
Trili
un
OUTRIGHT BANKS REPO BI REPO

LCY 10 Year
Government
Bonds
Latest Yield YTD Change (BP) MTD Change
(BP)
HK 1.417 -44.2 -44.2
ID 7.168 -62.8 -62.8
JP 0.278 -5.1 -5.1
KR 2.240 -36.5 -36.5
MY 3.831 -31.6 -31.6
PH 3.164 -70.0 -70.0
SG 1.880 -40.0 -40.0
TH 2.616 -11.3 -11.3
US 1.641 -53.1 -53.1
VN 6.600 -63.0 -63.0
• Market Watch as of Jan 30, 2015
• Source: Asian Bonds Online
Yield GS on peer’s market (a.o. January 30, 2015)
14
-
2.0
4.0
6.0
8.0
10.0
12.0
14.0
16.0
18.0
20.0
22.0
1Y 2Y 3Y 4Y 5Y 6Y 7Y 8Y 9Y 10Y 15Y 20Y 30Y
30 Jan '15 23 Jan '15
30 Dec '14 9 Feb '12
23 Sep '11 27 Oct '08
13 Sep'05
[in percentage]
Tenor 30-Jan-15 23-Jan-15 30-Dec-14 9-Feb-12 23-Sep-11 27-Oct-08 13 Sep'05
1Y 5.64 5.65 6.46 3.30 5.29 19.37
2Y 6.27 6.51 7.21 4.21 6.01 17.35 14.59
3Y 6.59 6.77 7.51 4.33 6.13 19.93
4Y 6.72 6.93 7.73 4.39 6.54 17.17 14.14
5Y 6.81 6.88 7.70 4.44 6.69 17.46 14.96
6Y 6.92 7.04 7.83 4.79 6.81 17.05 15.24
7Y 6.96 7.07 7.88 4.88 7.08 17.06 16.17
10Y 7.03 7.09 7.84 5.02 7.43 20.91 15.75
15Y 7.29 7.37 8.19 5.47 7.83 16.65 14.12
20Y 7.40 7.52 8.30 5.96 8.20 20.27
30Y 7.78 7.92 8.64 6.17 8.29 20.37
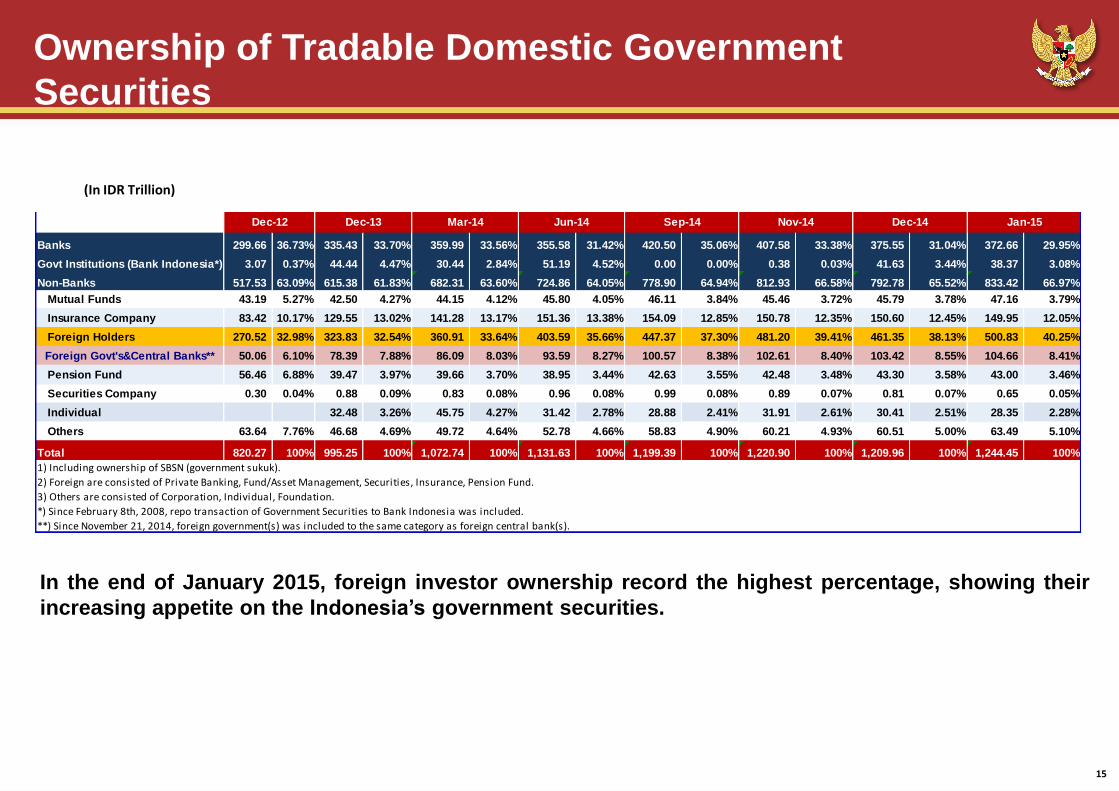
Ownership of Tradable Domestic Government
Securities
In the end of January 2015, foreign investor ownership record the highest percentage, showing their
increasing appetite on the Indonesia’s government securities.
(In IDR Trillion)
15
`
Banks 299.66 36.73% 335.43 33.70% 359.99 33.56% 355.58 31.42% 420.50 35.06% 407.58 33.38% 375.55 31.04% 372.66 29.95%
Govt Institutions (Bank Indonesia*) 3.07 0.37% 44.44 4.47% 30.44 2.84% 51.19 4.52% 0.00 0.00% 0.38 0.03% 41.63 3.44% 38.37 3.08%
Non-Banks 517.53 63.09% 615.38 61.83% 682.31 63.60% 724.86 64.05% 778.90 64.94% 812.93 66.58% 792.78 65.52% 833.42 66.97%
Mutual Funds 43.19 5.27% 42.50 4.27% 44.15 4.12% 45.80 4.05% 46.11 3.84% 45.46 3.72% 45.79 3.78% 47.16 3.79%
Insurance Company 83.42 10.17% 129.55 13.02% 141.28 13.17% 151.36 13.38% 154.09 12.85% 150.78 12.35% 150.60 12.45% 149.95 12.05%
Foreign Holders 270.52 32.98% 323.83 32.54% 360.91 33.64% 403.59 35.66% 447.37 37.30% 481.20 39.41% 461.35 38.13% 500.83 40.25%
Foreign Govt's&Central Banks** 50.06 6.10% 78.39 7.88% 86.09 8.03% 93.59 8.27% 100.57 8.38% 102.61 8.40% 103.42 8.55% 104.66 8.41%
Pension Fund 56.46 6.88% 39.47 3.97% 39.66 3.70% 38.95 3.44% 42.63 3.55% 42.48 3.48% 43.30 3.58% 43.00 3.46%
Securities Company 0.30 0.04% 0.88 0.09% 0.83 0.08% 0.96 0.08% 0.99 0.08% 0.89 0.07% 0.81 0.07% 0.65 0.05%
Individual 32.48 3.26% 45.75 4.27% 31.42 2.78% 28.88 2.41% 31.91 2.61% 30.41 2.51% 28.35 2.28%
Others 63.64 7.76% 46.68 4.69% 49.72 4.64% 52.78 4.66% 58.83 4.90% 60.21 4.93% 60.51 5.00% 63.49 5.10%
Total 820.27 100% 995.25 100% 1,072.74 100% 1,131.63 100% 1,199.39 100% 1,220.90 100% 1,209.96 100% 1,244.45 100%
1) Including ownership of SBSN (government sukuk).
2) Foreign are consisted of Private Banking, Fund/Asset Management, Securities, Insurance, Pension Fund.
3) Others are consisted of Corporation, Individual, Foundation.
*) Since February 8th, 2008, repo transaction of Government Securities to Bank Indonesia was included.
**) Since November 21, 2014, foreign government(s) was included to the same category as foreign central bank(s).
Jan-15Dec-14Nov-14Mar-14Dec-13Dec-12 Jun-14 Sep-14

Domestic Institutional Investors
Pension Fund Insurance Company
Mutual Fund
Rp241.67
Rp326.23Rp356.45 Rp361.37
Rp497.03 Rp497.99
Rp545.54Rp567.13
27.09%
24.01%
21.77%
24.11%
19.74%21.02%
12.95%13.98%
0.00%
10.00%
20.00%
30.00%
0
100
200
300
400
500
600
2008 2009 2010 2011 2012 2013 Mar-14 Jun-14
Govt. Securities (GS) Bond
Deposit Stock
Mutual Funds Others
Rp90.11
Rp108.39
Rp141.51 Rp136.53
Rp156.45
Rp169.53 Rp164.15 Rp167.23
27.91% 27.43%
21.90%22.64%
19.68%18.36%
19.46%18.33%
0.00%
10.00%
20.00%
30.00%
0
30
60
90
120
150
180
2008 2009 2010 2011 2012 2013 Mar-14 Jun-14
Govt. Securities (GS) BondDeposit StockMutual Funds Others
45%
37%
33%
28%25%
20%
0%
10%
20%
30%
40%
50%
60%
0
30
60
90
120
150
180
210
240
270
Government Securities (GS) Deposit Bond Stock Others % SBN (RHS)
71.48
110.13
180.28
159
142.97
244.32
Source: Financial Service Authority (OJK), data
processsed
16

Individual & Retail Investors
Retail Govt Securities investors in primary market Individual Ownership
17
16,561
33,546
47,434
23,617
15,239 15,198
23,127
34,776 32,638
14,295 17,231 15,487 17,606 17,783
34,692
6,412
-
5,000
10,000
15,000
20,000
25,000
30,000
35,000
40,000
45,000
50,000
2006 2007 2008 2009 2010 2011 2012 2013 2014
ORI SR SBR
3.09%2.82%
2.51%2.27%
4.20%
3.24%3.28%3.12%2.78%
2.69%
2.58%2.41%
3.86%
2.61%2.51%2.28%
0
5
10
15
20
25
30
35
40
45
50
0.00%
0.50%
1.00%
1.50%
2.00%
2.50%
3.00%
3.50%
4.00%
4.50%Nominal (IDR Trillion) RHS
Percent

Foreign Investor Activity 2014
Net Buyer (Seller) - Non Resident Foreign Ownership - Proportion by Tenor
[In IDR Trillion]
Foreign investors mostly dominated by high quality long term investors
18
10% 12% 8% 5% 6% 7% 7% 7% 6% 6% 5% 5% 5% 5% 5%
5%8%
3% 5% 5% 4% 5% 3% 3% 3% 4% 4% 4% 4% 4%
18%17%
16% 13% 11% 15% 15% 15% 16% 15% 15% 15% 16% 15% 14%
21%
25%
28% 32% 38% 34% 33% 33% 33% 34% 34% 34% 33% 34% 34%
46% 38% 45% 44% 41% 40% 41% 41% 42% 43% 42% 43% 42%43%
43%
30.53% 30.80%32.98% 32.54%
33.64%34.59% 35.72% 35.66% 36.33%36.81%37.30% 37.80% 39.41% 38.13%
40.25%
-15.00%
5.00%
25.00%
45.00%
0%
20%
40%
60%
80%
100%
Dec-10 Dec-11 Dec-12 Dec-13 Mar-14 Apr-14 May-14 June 14 July 14 Aug 14 Sep-14 Oct-14 Nov-14 Dec-14 Jan-15
>10 >5-10 >2-5 >1-2 0-1 % Foreign Ownership to Total (RHS)
(1.49)
(29.29)
1.69
(4.99)
8.06
13.11
(8.99)
(2.27)
4.15
(4.37)
(0.08)
10.13
(1.41)
7.83 9.35
19.52
0.68 2.68
8.44
(0.88)
17.97
4.22
(19.98)
2.81
(1.76)
10.13
23.98
6.08
(0.37)
4.82
16.49
15.77 16.10
20.15
6.43
14.67
15.95
13.17 12.49
21.34
(19.84)
39.48
(0.15)
(0.10)
(0.05)
0.00
0.05
0.10
(40.00)
(30.00)
(20.00)
(10.00)
0.00
10.00
20.00
30.00
40.00
50.00
Au
g-1
1Se
p-1
1O
ct-
11
No
v-1
1D
ec-1
1Ja
n-1
2Fe
b-1
2M
ar-
12
Ap
r-1
2M
ay-1
2Ju
n-1
2Ju
l-1
2A
ug
-12
Se
p-1
2O
ct-
12
No
v-1
2D
ec-1
2Ja
n-1
3Fe
b-1
3M
ar-
13
Ap
r-1
3M
ay-1
3Ju
n-1
3Ju
l-1
3A
ug
-13
Se
p-1
3O
ct-
13
No
v-1
3D
ec-1
3Ja
n-1
4Fe
b-1
4M
ar-
14
Ap
r-1
4M
ay-1
4Ju
n-1
4Ju
l-1
4A
ug
-14
Se
p-1
4O
ct-
14
No
v-1
4D
ec-1
4Ja
n-1
5
Capital Inflows Capital inflows over total foreign holders

Crisis Management Protocol &
Bond Stabilization Framework
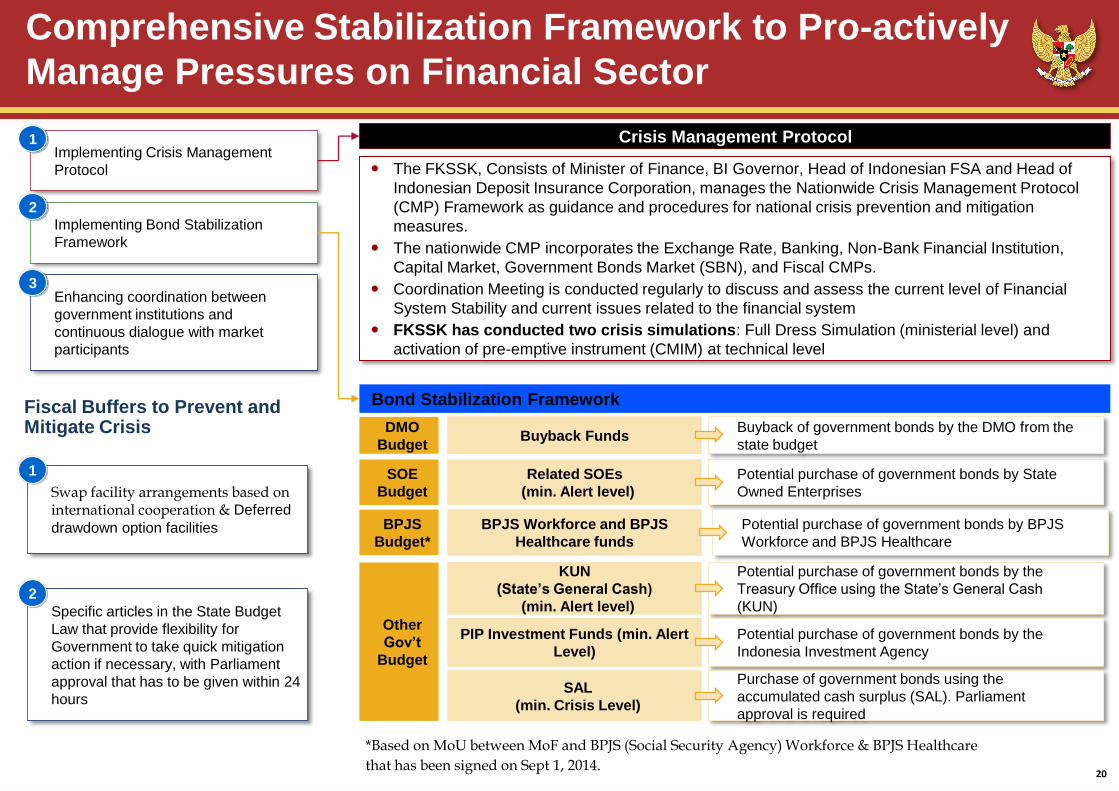
Comprehensive Stabilization Framework to Pro-actively
Manage Pressures on Financial Sector
Swap facility arrangements based on international cooperation & Deferred
drawdown option facilities
Implementing Crisis Management
Protocol
Implementing Bond Stabilization
Framework
Enhancing coordination between
government institutions and
continuous dialogue with market
participants
Specific articles in the State Budget
Law that provide flexibility for
Government to take quick mitigation
action if necessary, with Parliament
approval that has to be given within 24
hours
Fiscal Buffers to Prevent and Mitigate Crisis
The FKSSK, Consists of Minister of Finance, BI Governor, Head of Indonesian FSA and Head of
Indonesian Deposit Insurance Corporation, manages the Nationwide Crisis Management Protocol
(CMP) Framework as guidance and procedures for national crisis prevention and mitigation
measures.
The nationwide CMP incorporates the Exchange Rate, Banking, Non-Bank Financial Institution,
Capital Market, Government Bonds Market (SBN), and Fiscal CMPs.
Coordination Meeting is conducted regularly to discuss and assess the current level of Financial
System Stability and current issues related to the financial system
FKSSK has conducted two crisis simulations: Full Dress Simulation (ministerial level) and
activation of pre-emptive instrument (CMIM) at technical level
Crisis Management Protocol
Potential purchase of government bonds by State
Owned Enterprises
Buyback Funds DMO
Budget
SOE
Budget
Other
Gov’t
Budget
Buyback of government bonds by the DMO from the
state budget
Related SOEs
(min. Alert level)
KUN
(State’s General Cash)
(min. Alert level)
Potential purchase of government bonds by the
Treasury Office using the State’s General Cash
(KUN)
Potential purchase of government bonds by the
Indonesia Investment Agency
PIP Investment Funds (min. Alert
Level)
SAL
(min. Crisis Level)
Purchase of government bonds using the
accumulated cash surplus (SAL). Parliament
approval is required
Bond Stabilization Framework
Potential purchase of government bonds by BPJS
Workforce and BPJS Healthcare
BPJS
Budget*
BPJS Workforce and BPJS
Healthcare funds
*Based on MoU between MoF and BPJS (Social Security Agency) Workforce & BPJS Healthcare
that has been signed on Sept 1, 2014.
1
2
3
1
2
20

Debt Outstanding & Risk Profile

12488 89
6696
62 5274 69
125
4322
48 5374
29 31 47 53 71
6 10 23 23 8 10 2457
76
73 7692
103
83 9284
67
74
2622
19 1614
13 1212 12
8
24 321
26
11
1
76
020406080
100120140160180200220240
2015
2016
2017
2018
2019
2020
2021
2022
2023
2024
2025
2026
2027
2028
2029
2030
2031
2032
2033
2034
2035
2036
2037
2038
2039
2040
2041
2042
-206
0
Foreign Denominated
Domestic Denominated
13699 107 101
143
93 98118
100
169
4322
48 5374
29 31 47 53 7126 10
42 488 10 24
128
64
62 58 57
56
52 4640
36
31
26
22
19 1614
13 1212 12
8
53
21
11 1
4
020406080
100120140160180200220240
2015
2016
2017
2018
2019
2020
2021
2022
2023
2024
2025
2026
2027
2028
2029
2030
2031
2032
2033
2034
2035
2036
2037
2038
2039
2040
2041
2042
-206
0
Gov't Sec Loan
Maturity Profile Central Government Debt
as of End of Dec 2014
Maturity Profile of Central Debt Government by Currency (in trillion Rp)
Maturity Profile of Central Government Debt by Instruments (in trillion Rp)
22
25.9%
74.1%
Loan
Gov't Sec
43.3%
56.7%
ForeignDenominated
DomesticDenominated

Outstanding Central Gov’t Debt by Instrument
23
Nominal %
a. Foreign Loan (in billion USD) 65.0 68.6 68.4 63.6 58.4 53.9 25.8%
Bilateral 41.3 42.3 42.1 37.2 31.2 26.7 12.8%
Multilateral 21.5 23.2 23.5 23.8 23.6 23.5 11.2%
Commercial 2.2 3.0 2.8 2.5 3.2 3.7 1.8%
Suppliers 0.1 0.1 0.1 0.0 0.0 0.0 0.0%
b Domestic Loan (in billion USD) - 0.0 0.1 0.19 0.2 0.2 0.1%
c. Government Securities (in billion USD) 104.2 118.4 131.0 140.8 136.3 155.2 74.1%
Foreign Currency Denominated 15.2 18.0 21.6 27.4 32.8 36.7 17.5%
Rupiah Denominated 89.0 100.4 109.4 113.4 103.5 118.5 56.6%
Total Central Government Debt
(in billion USD)169.2 187.0 199.5 194.89 209.4
Total Central Government Debt
(in trilion IDR)1,590.9 1,681.7 1,808.9 2,375.5 2,604.9
Exchange Rate Assumption (IDR/USD1) 9,400.0 8,991.0 9,068.0 12,189.0 12,440.0
GDP (in trillion IDR) 5,613.4 6,422.9 7,427.1 9,084.0
Debt to GDP Ratio 28.3% 26.2% 24.4% 24.0% 26.2%
Dec'14
2011 2012 2013Description 2009
9,670.0
2010
1,977.7
204.5
8,241.9

Outstanding Central Gov’t Debt by Currency
24
2010 2011
Original Currency
IDR (in trillion) 902.6 993.0 1,098.0 1,263.9 1,477.5
USD (in billion) 39.6 43.9 49.8 56.8 61.0
JPY (in billion) 2,689.8 2,589.8 2,498.8 2,395.3 2,204.0
EUR (in billion) 5.4 5.0 4.5 4.2 5.1
Other currencies
Equivalent in Billion USD
IDR 100.4 109.5 113.5 103.7 118.8 56.7%
USD 39.8 43.9 49.8 56.8 61.0 29.1%
JPY 33.1 33.4 29.1 22.8 18.5 8.8%
EUR 7.2 6.4 6.0 5.8 6.2 3.0%
Other currencies 6.5 6.3 6.1 5.8 5.0 2.4%
Total Eq. in Billion USD 187.0 199.5 204.5 194.9 209.4
Equivalent in Trillion IDR
IDR 902.8 993.0 1,098.0 1,263.9 1,477.5
USD 357.6 397.9 481.9 692.0 758.3
JPY 297.6 302.5 281.2 278.3 229.8
EUR 65.0 58.5 57.5 71.1 76.9
Other currencies 58.6 57.1 59.1 70.2 62.4
Total Eq. in Trillion IDR 1,681.7 1,808.9 1,977.7 2,375.5 2,604.9
Foreign Currency Portion 46.3% 45.1% 44.5% 46.8% 43.3%
Exchange Rate Assumption USD/IDR 8,991 9,068 9,670 12,189.0 12,440.0
Dec-14
- - - - - - - - - - - - - - - - - - - - - - - Multiple Currencies - - - - - - - - - - - - - -
20132012

Central Government Debt Ratios
Debt to GDP Ratio Interest Payment to Revenue and
Expenditure Ratio
Debt Service to GDP Ratio Interest Payment to Tax Revenue &
Central Government Expenditure Ratio
25
Notes: • * Preliminary Figures • ** Estimate; based on Budget 2015
26.2%24.4% 24.0%
26.2% 25.7% 25.2%
0%
5%
10%
15%
20%
25%
30%
2010 2011 2012 2013 2014* 2015**
8.9%
7.7%
7.5%
7.9% 8.7%
8.5%
8.5%
7.2%
6.7%
6.8%
7.6%
7.5%
0%
1%
2%
3%
4%
5%
6%
7%
8%
9%
10%
2010 2011 2012 2013 2014* 2015**
Interest to Revenue Interest to Expenditure
12.2
%
10.7
%
10.8
%
10.5
%
11.7
%
11.0
%
12.7
%
10.6
%
9.9%
9.9%
11.2
%
10.9
%
0%
2%
4%
6%
8%
10%
12%
14%
2010 2011 2012 2013 2014* 2015**to Tax Revenue to Central Gov't Expenditure
3.4%
3.1%
3.3%
3.0%
3.5%
3.4%
3%
3%
3%
3%
3%
4%
2010 2011 2012 2013 2014* 2015**

Risk indicators are improving amidst pressure from rupiah depreciation Risk indicators show improvements in interest rate risk and stability in exchange and refinancing risks
Risk Indicators
26
Interest Rate Risk Exchange Rate Risk
Debt Maturing in 1,3, and 5 years Average Time To Maturity (ATM) - Years
22.0 20.3
18.8 16.2 16.0
14.8
28.2 26.1 25.9
22.5 23.2 21.0
2009 2010 2011 2012 2013 2014*
Variable rate ratio [%] Refixing rate [%]
13.4 12.1 11.0 10.6 12.2 11.1
47.4 46.2 45.1 44.4 46.7
43.3
2009 2010 2011 2012 2013 2014* FX Debt to GDP ratio (%) FX Debt to total debt ratio (%)
7.6 7.1 8.2 7.2 8.6 7.7
20.3 20.8 22.7 21.5 21.8 20.2
33.2 34.2 34.6 32.4 33.4 33.9
2009 2010 2011 2012 2013 2014*
Maturity debt portion < 1 year (%) Maturity debt portion < 3 year (%)
Maturity debt portion < 5 year (%)
*Preliminary Figures
9.7
9.5
9.3
9.7
9.6
9.8
2009 2010 2011 2012 2013 2014*
Average Time to Maturity (in year)
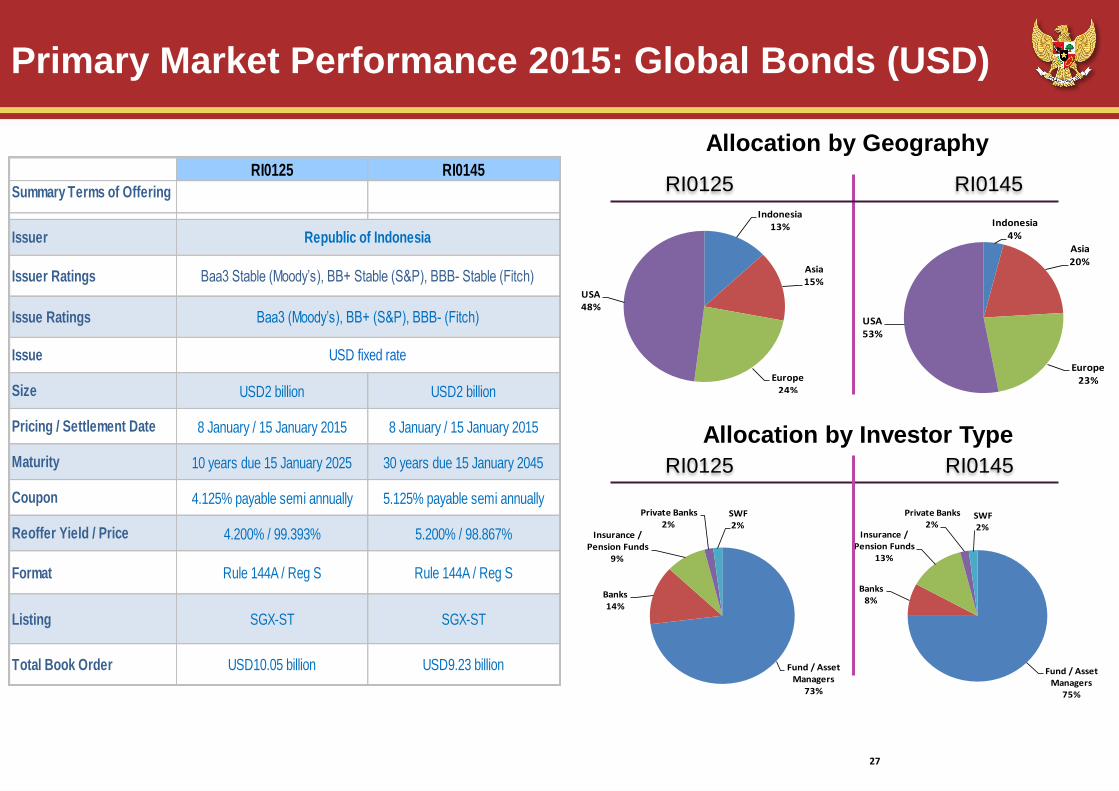
Primary Market Performance 2015: Global Bonds (USD)
27
RI0125 RI0145
Summary Terms of Offering
Issuer
Issuer Ratings
Issue Ratings
Issue
Size USD2 billion USD2 billion
Pricing / Settlement Date 8 January / 15 January 2015 8 January / 15 January 2015
Maturity 10 years due 15 January 2025 30 years due 15 January 2045
Coupon 4.125% payable semi annually 5.125% payable semi annually
Reoffer Yield / Price 4.200% / 99.393% 5.200% / 98.867%
Format Rule 144A / Reg S Rule 144A / Reg S
Listing SGX-ST SGX-ST
Total Book Order USD10.05 billion USD9.23 billion
Republic of Indonesia
Baa3 Stable (Moody’s), BB+ Stable (S&P), BBB- Stable (Fitch)
Baa3 (Moody’s), BB+ (S&P), BBB- (Fitch)
USD fixed rate
Allocation by Geography
Allocation by Investor Type
Indonesia13%
Asia15%
Europe24%
USA48%
RI0125
Indonesia4%
Asia20%
Europe23%
USA53%
RI0145RI0125
RI0125
RI0145
RI0145
Fund / Asset Managers
73%
Banks14%
Insurance / Pension Funds
9%
Private Banks2%
SWF2%
Fund / Asset Managers
75%
Banks8%
Insurance / Pension Funds
13%
Private Banks2%
SWF2%

END OF PRESENTATION Directorate General of Debt Management Ministry of Finance of Republic of Indonesia Directorate of Government Debt Securities Frans Seda building, 4th floor, Jl. Wahidin Raya No. 1, Jakarta Pusat – Postal Code: 10710 Phone: +6221 3810175 Fax. : +6221 3846516 Site: www.djpu.kemenkeu.go.id

Securities Financing Realization 2014
*Adjusted by changes in Cash Management & Debt Switch
29
*(Million IDR)
Revised Budget
2014*
Realization
(ao Dec 31, 2014)*
% Realization to
Revised Budget
2014
Remaining target*
Government Securities Net 264,983,700 264,978,114 100.00% -
Government Securities Maturing in 2014 163,151,013 163,151,013 100.00% -
-Buyback 1,350,968 1,350,968 100.00% -
Issuance Need 2014* 428,134,713 428,129,127 100.00% 5,586
Government Debt Securities (GDS) 352,588,379
Domestic GDS 284,376,795
-Coupon GDS (Auction, Private Placement) 199,870,000
-Conventional T-Bills (Auction, Private Placement) 48,500,000
-SPNNT 20140303 12,400,000
-Retail Bonds 23,606,795
International Bonds 68,211,584
-USD Global Bonds 48,466,366
-USD Domestic Bonds 3,985,450
-Euro Denominated Bonds 15,759,767
-Samurai Bonds -
Government Islamic Debt Securities 75,540,748
Domestic Government Islamic Debt Securities 57,794,345
- IFR/PBS/T-Bills Sukuk (Islamic Fixed Rated Bond/Project Based Sukuk) 38,471,000
- Retail Sukuk 19,323,345
Global Sukuk 17,746,403