
Government Opposition or Left Right? The Determinants of...
32
1 Government‐Opposition or Left‐Right? The Institutional Determinants of Voting in Legislatures 12 June 2014 Simon Hix London School of Economics and Political Science Abdul Noury New York University Abu Dhabi We would like to thank Gary Cox, Brian Crisp, John Carey, Torun Dewan, John Huber, Amie Kreppel, Nolan McCarty, Slava Mikhaylov and seminar participants at LSE, Princeton, the University of Tokyo, and the European Political Science Association 2011 conference for helpful comments. All the remaining errors are our own. We are also grateful to John Carey, Scott Desposato, Keith Poole, Yael Shomer, Elena Mielcova and the Voteworld project for sharing their data or making their data publicly available.
Transcript of Government Opposition or Left Right? The Determinants of...
1
Government‐Opposition or Left‐Right?
The Institutional Determinants of Voting in Legislatures
12 June 2014
Simon Hix
London School of Economics and Political Science
Abdul Noury
New York University Abu Dhabi
We would like to thank Gary Cox, Brian Crisp, John Carey, Torun Dewan, John Huber, Amie Kreppel, Nolan McCarty, Slava Mikhaylov and seminar participants at LSE, Princeton, the University of Tokyo, and the European Political Science Association 2011 conference for helpful comments. All the remaining errors are our own. We are also grateful to John Carey, Scott Desposato, Keith Poole, Yael Shomer, Elena Mielcova and the Voteworld project for sharing their data or making their data publicly available.

2
Abstract
We use roll-call voting data from 16 legislatures to investigate how the institutional context of politics – such
as whether a country is a parliamentary or presidential regime, or has a single-party, coalition or minority
government – shapes coalition formation and voting behaviour in parliaments. We use a geometric scaling
metric to estimate the ‘revealed space’ in each of these legislatures and a vote-by-vote statistical analysis to
identify how much of this space can be explained by government-opposition dynamics as opposed to (left-
right) policy positions of parties. We find that government-opposition interests rather than parties’ policy
positions are the main drivers of voting behaviour in most institutional contexts. In contrast, we find that
issue-by-issue coalition-building along a single policy dimension only exists under restrictive institutional
constraints; namely presidential regimes with coalition governments or parliamentary systems with minority
governments. Put another way, voting in most legislatives is more like Westminster than Washington, DC.
3
Introduction: What Drives Voting in Legislatures?
Voting in legislatures is a central process in representative democracies. Parliamentary or congressional votes
enable politicians to express their preferences on legislation and other issues as well as demonstrate their
support for or opposition to the government. The standard spatial model assumes that legislators’ and parties’
policy positions are the main drivers of their legislative voting behaviour and that, as a result, the median
legislator usually decides (under simple majority rule) whether a majority forms to the right or to the left of
her position. Some recent models assume some role for government-opposition dynamics in legislative
voting, for example with governing parties able to restrict the agenda, or with opposition parties able to pre-
commit to vote against government-sponsored bills.1 Nevertheless, it is usually assumed that such
government-opposition dynamics are only likely to be the norm under specific institutional contexts, for
example where a single party controls a legislative majority in a parliamentary system.
In this paper we analyse legislative voting in various parliaments from different institutional contexts.
In particular we look at whether politicians vote mainly on the basis of their personal or party (left-right)
policy preferences or mainly along government-opposition lines. We first apply a scaling method to map the
‘revealed positions’ of parties and individual MPs in each parliament. We then undertake a vote-by-vote
analysis, to explore whether left-right policy positions, or government-opposition dynamics, or some
combination of the two explain party behaviour in roll-call votes. We refer to the outputs of our scaling
models as ‘revealed positions’ rather than ‘ideal points’ as we assume that how legislators vote in roll-calls is
influenced as much by institutional factors as by their personal ideological preferences. Whereas the scaling
analysis is at the individual level, the vote-by-vote regression analysis is at the party level. We hence see these
two analyses as complementary; as a way of cross-checking the empirical regularities identified in each of the
analyses.
Rather than directly test a particular theoretical model or set of theoretical propositions, our primary
aim is to identify some empirical regularities which raise some questions about existing and future theoretical
1 Cox and McCubbins 2005, Dewan and Spirling 2011.

4
work on legislative behaviour. For example, what are the main dimensions of political conflict in modern
democratic legislatures? How do the (left-right) policy preferences of legislators and parties influence how
they vote? Is legislative conflict primarily between members of governing parties and members of opposition
parties, irrespective of their policy preferences? And, how does the institutional design of a democracy – such
as whether a country has a presidential or a parliamentary regime, or whether there is a single-party, a coalition
or a minority government – influence the pattern of parliamentary voting?
Since the late 1990s there has been an explosion of empirical research on legislative voting. The
impetus came from new scaling methods.2 Armed with these new technologies, the increased availability of
roll-call data on the internet from other legislatures, and the development of computer power, scholars began
to study voting in legislatures outside the United States. Although there are some exceptions, such as Carey,
Cox and McCubbins, Hansen, and Morgenstern, who look at roll-call voting in several parliaments, most of
this new research has looked at single parliaments.3 Our goal is to fill this gap by producing spatial maps of
several legislatures from the same information (roll-call votes) and broadly the same time period, and using the
same methodology and analysis.
We look at 16 legislatures: Australia, Belgium, Brazil, Canada, Chile, Czech Republic, the European
Parliament, France, Israel, Mexico, New Zealand, Peru, Poland, South Korea, United Kingdom, and the USA.
We use these cases for two reasons. First, roll-call voting data are publicly available only for a limited number
of legislatures, and there is considerable variance in the quality and quantity of available data for many cases.
In addition to the data in the public domain, we have collected new data from the Czech Republic, Belgium,
and the European Parliament. Despite some differences in quality and quantity, the data from these
legislatures are reliable and include a sufficient number of votes to allow us to estimate legislators’ positions
using a standard scaling metric. Second, these legislatures include cases of all possible combinations of two
key institutional variables: regime type (parliamentary or presidential); and form of government (single-party
majority, multi-party majority, and minority). Of course, other institutional variables, such as the electoral
2 E.g. Poole and Rosenthal 1997; Poole 2005. 3 Carey 2007a; Cox and McCubbins 2011; Morgenstern 2004; Hansen 2006a,b.

5
system, also shape the number of parties and voting behaviour inside parliaments.4 However, in this paper we
only focus on regime type and form of government and postpone the relevance of other important factors to
future research.
Our main empirical finding is that the standard spatial (median-voter) model fits legislative voting in a
particular institutional contexts: in presidential systems with coalition governments or parliamentary systems
with minority governments, where coalitions have to be built issue by issue. In contrast, in all other
institutional contexts, government-opposition splits dominate policy-based voting by parties or legislators.
These results raise some questions about how theories of legislative politics might be adapted to better fit
empirical regularities. We also find that the existing scaling methods can be used to estimate the revealed
positions of legislators across the democratic world and that two dimensions are sufficient to explain a large
fraction of the variance of voting behaviour in most parliaments.
The rest of the paper is organized as follows. In the next section we discuss some of the existing
theories of legislative voting. We then investigate the dimensionality of voting in our 16 cases by looking at
the ‘voting maps’ produced by a standard geometric scaling technique. We subsequently look at how much of
the voting in each parliament can be explained by the government-opposition status of an MP as opposed to
his/her left-right policy position. We also consider the case of the Czech Republic, where the shift between
minority and majority status in successive parliaments led to a significant change in the structure of voting.
Theories of Legislative Politics
Most existing theories of legislative politics, as well as the scaling methods for testing these theories, were
developed in the context of the US Congress. Any attempt to apply these theories beyond the US Congress
can only be done with great caution. Nonetheless, the existing theories do provide some useful benchmarks.
Most current theoretical models of legislative politics start with the standard assumptions of spatial
voting in the legislative context.5 One such model is the median-voter model with randomly assigned
4 E.g. Carey and Shugart 1995; Hix 2004; Shomer 2009.
6
proposal power, which is sometimes called the ‘floor agenda model’ (FAM).6 In this model one of the
legislators makes a proposal and the other legislators are free to propose amendments. Amendments are
voted on one by one and then a final vote is taken on the amended bill, all by a simple majority vote. In any
vote, each legislator (with single-peaked preferences) has a binary choice: between a policy represented by a
bill, and the status quo reversion point. If the distance between a legislator’s ideal point and the bill is smaller
than the distance between the legislator’s ideal point and the status quo, the legislator votes for the bill,
otherwise she votes for the status quo.
A crucial assumption of this model is that legislators are not constrained by parties. They may belong
to parties, but parties are not able to enforce cohesion in votes. Instead, each legislator votes for whichever of
the status quo or the proposal is closest to her ideal point. Members of the same party might vote together,
but this is because their ideal points are on the same side of a cut-point in a vote and not because the party has
forced them to vote together.7
The floor agenda model predicts that final votes, in a one-dimensional policy space, will come down
to a choice between the location of the status quo and the policy proposed by the median floor member.
Hence, cut-points should be located at the mid-point between the legislator who prefers the position of the
median floor member to the status quo by the smallest margin and the legislator who prefers the status quo to
the position of the median floor member by the smallest margin. If status quos are evenly distributed in a
policy space, cut-points should also be evenly distributed, which would then allow the ‘ideal points’ of
legislators on an underlying policy dimension to be identified from roll-call votes.8
A variation of the standard floor agenda model is the ‘cartel agenda model’ (CAM), as proposed by
Gary Cox and Mathew McCubbins.9 In this model a particular legislator or group of legislators can restrict
the agenda. For example, in the US Congress the majority party can decide which proposals are put to the
5 Cf. Black 1948, 1958; Romer and Rosenthal 1978; Shepsle 1979; Shepsle and Weingast 1981; Tsebelis 2002; Poole 2005. 6 Cf. Romer and Rosenthal 1978; Krehbiel 1998; Cox and McCubbins 2005, 38-41. 7 Krehbiel 1993. 8 Poole 2005. 9 Cox and McCubbins 2005.
7
floor of the House or Senate. Similarly, in parliamentary systems, if the party or parties in government control
a majority of parliamentary seats, then the government has a de facto monopoly on agenda control.10
Adding agenda-control restricts the set of viable policy outcomes. This is because the median-
member of the agenda-cartel will prevent an issue from being placed on the agenda if the outcome on the
floor will be further from this legislator’s most-preferred policy than the status quo. Specifically, there should
be no proposals on any issue where the status quo is closer to the position of the median member of the floor
than to the position of the median member of the agenda-cartel.11 Nevertheless, the agenda-cartel will still
allow votes to be taken on the plenary floor if the distance between the median member of the legislature and
the position of the agenda-cartel is smaller than the distance between the status quo and the position of the
agenda-cartel. As a result, some legislative votes will divide the members of the agenda-cartel (e.g. the
governing parties) against the members of the non-agenda cartel (e.g. the opposition parties), while others will
still split along left-right lines. Hence, the cartel agenda model predicts a mix of majority-bloc (government)
vs. minority-bloc (opposition) voting and policy-based (left-right) voting.
Finally, several other theoretical ideas underpin what can be called a ‘Westminster model’ (WM) of
legislative politics.12 On one side is the governing party, which can enforce party cohesion in votes via a
variety of ‘carrots and sticks’. As carrots, the governing party can offer promotion to ministerial office or key
committee positions.13 As a stick, the main weapon is the threat of a vote-of-confidence.14 Faced with the
possibility of cabinet resignation and/or an early election, a governing party ‘backbencher’ will vote for a
government proposal even when the policy on offer is further from her ideal point than the status quo.
On the opposition side, Dewan and Spirling add an assumption that opposition legislators can
credibly pre-commit to oppose the government in most legislative votes.15 Although members of each party
have similar policy preferences on most issues, there is sufficient heterogeneity within the governing and
10 Döring 2001. 11 Clinton (2009) argues that if no votes make it to the floor in the blackout zone, there should, in fact, be no difference between the positions of legislators in either side of this zone. 12 Cf. Lijphart 1999. 13 Benedetto and Hix 2007; Kam 2009. 14 Huber 1996; Diermeier and Feddersen 1998. 15 Dewan and Spirling 2011.

8
opposition members such that on some policies members of the opposition find themselves closer to the
government than the opposition leadership. With sincere voting, some members of the opposition are hence
likely to prefer a proposal of the government (the agenda-setter) to the status quo. However, if the opposition
members can pre-commit to vote cohesively against a government proposal, then the government will be
forced to make a proposal closer to the status quo than would be the case with sincere voting. This is because
with all the opposition members voting to keep the status quo, the de facto pivotal member is closer to the
status quo than the median floor member under sincere voting. In all Westminster-style systems, some votes,
such as ‘non-whipped’ votes, will not follow this strict government-opposition divide. Nevertheless, the
Westminster model, as we have characterized it here, predicts that most cutting-lines will split governing
members against opposition members, and not between individual members or parties along a left-right policy
dimension.16
There are numerous other models of legislative politics.17 However, the models we describe here are
particularly useful for our purpose because they make specific and different assumptions about the
institutional context of legislative politics, as Figure 1 shows.18
First, whereas the Westminster model assumes that parties can enforce legislative cohesion, the floor
agenda model and the cartel agenda model assume that parties cannot. This difference fits the difference
between parliamentary and presidential systems.19 In parliamentary systems, governing and opposition leaders
can offer promotion to the cabinet or opposition leadership positions, respectively. Also, the possibility of
parliamentary dissolution is a threat against legislative rebellion on the government side and an incentive to
vote collectively to try to defeat the government on the opposition side. In contrast, in presidential systems,
where there is independent election of the chief executive and the legislature, a president might be able to
promote some people to cabinet positions, but a defeat of the governing party by the opposition on a
particular bill does not threaten the survival of the executive. There is some empirical support for this
16 Cf. Laver, 2006; Spirling and McLean 2007. 17 E.g. Baron and Ferejohn 1989. 18 When comparing these systems, we refer to the ‘governing’ parties are the parties that hold ministerial portfolios in the executive. 19 Cf. Carey 2007a; Cheibub 2007, 116-135; Samuels and Shugart 2010.
9
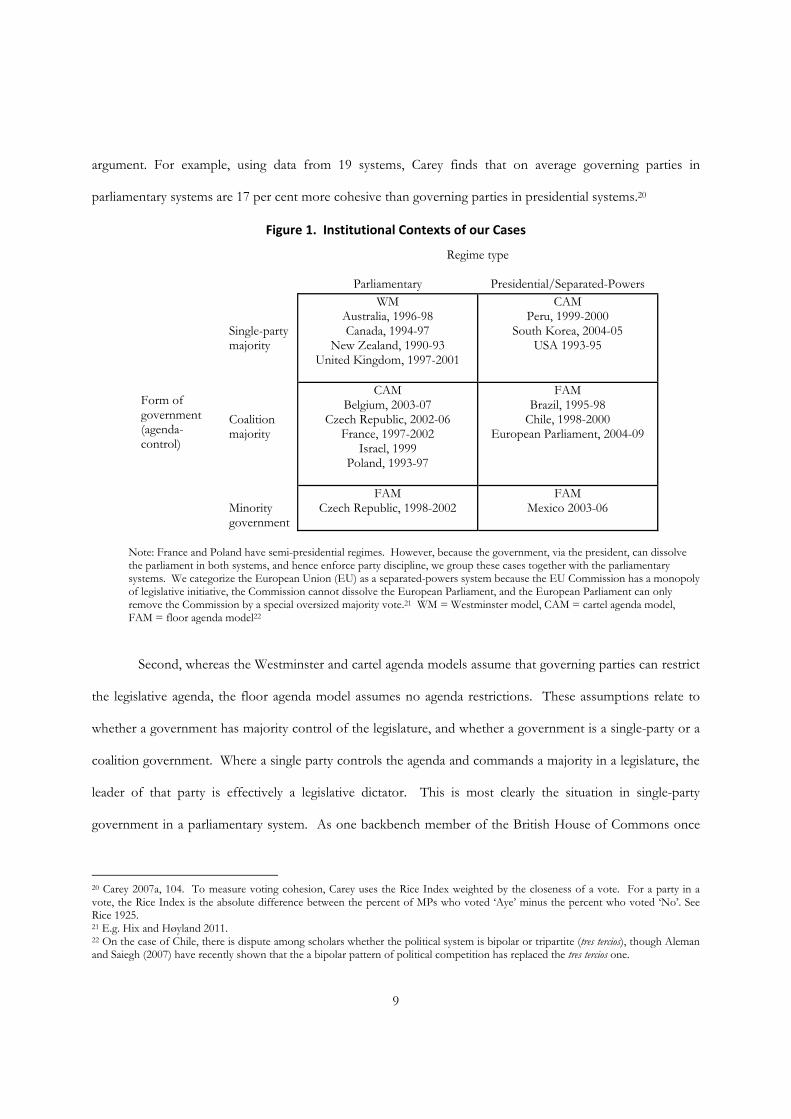
argument. For example, using data from 19 systems, Carey finds that on average governing parties in
parliamentary systems are 17 per cent more cohesive than governing parties in presidential systems.20
Figure 1. Institutional Contexts of our Cases
Regime type
Form of government (agenda-control)
Parliamentary Presidential/Separated-Powers Single-party majority
WMAustralia, 1996-98 Canada, 1994-97
New Zealand, 1990-93 United Kingdom, 1997-2001
CAM Peru, 1999-2000
South Korea, 2004-05 USA 1993-95
Coalition majority
CAMBelgium, 2003-07
Czech Republic, 2002-06 France, 1997-2002
Israel, 1999 Poland, 1993-97
FAM Brazil, 1995-98
Chile, 1998-2000 European Parliament, 2004-09
Minority government
FAMCzech Republic, 1998-2002
FAM Mexico 2003-06
Note: France and Poland have semi-presidential regimes. However, because the government, via the president, can dissolve the parliament in both systems, and hence enforce party discipline, we group these cases together with the parliamentary systems. We categorize the European Union (EU) as a separated-powers system because the EU Commission has a monopoly of legislative initiative, the Commission cannot dissolve the European Parliament, and the European Parliament can only remove the Commission by a special oversized majority vote.21 WM = Westminster model, CAM = cartel agenda model, FAM = floor agenda model22
Second, whereas the Westminster and cartel agenda models assume that governing parties can restrict
the legislative agenda, the floor agenda model assumes no agenda restrictions. These assumptions relate to
whether a government has majority control of the legislature, and whether a government is a single-party or a
coalition government. Where a single party controls the agenda and commands a majority in a legislature, the
leader of that party is effectively a legislative dictator. This is most clearly the situation in single-party
government in a parliamentary system. As one backbench member of the British House of Commons once
20 Carey 2007a, 104. To measure voting cohesion, Carey uses the Rice Index weighted by the closeness of a vote. For a party in a vote, the Rice Index is the absolute difference between the percent of MPs who voted ‘Aye’ minus the percent who voted ‘No’. See Rice 1925. 21 E.g. Hix and Høyland 2011. 22 On the case of Chile, there is dispute among scholars whether the political system is bipolar or tripartite (tres tercios), though Aleman and Saiegh (2007) have recently shown that the a bipolar pattern of political competition has replaced the tres tercios one.

10
put it: ‘we are reduced to throwing paper airplanes at the government bulldozer’.23 In a presidential system, in
contrast, where one party controls a majority of seats in the legislature and the agenda is set by this majority,
the party can use this agenda control power to restrict the legislative agenda. However, because of the
separation of executive and legislative elections, the majority party will have few powers to enforce cohesion.
Contrast this monopoly of agenda-setting power in a single actor with the sharing of agenda-setting
between several actors: as is often the case in presidential regimes (where the executive and legislature both
have agenda-setting power) as well as under coalition government in both parliamentary and presidential
systems.24 In these contexts it is more difficult for a single actor to restrict the set of issues that come to the
legislative floor. In a coalition government different parties will have different ministerial portfolios, which
can lead to different actors proposing to move policies in different directions.25 Related to this, in legislatures
with coalition governments, legislative committee chairs are usually shared between several parties who then
each have access to the agenda.26 As a result, with coalition government a wider range of issues are likely to
be voted on than with single-party government. Nonetheless, majority coalitions in parliamentary regimes are
more likely to be able to enforce party discipline than majority coalitions in presidential regimes.27 This
suggests that government-opposition dynamics should be stronger in our cases of majority coalitions in
parliamentary regimes than in our cases of majority coalitions in presidential regimes.
Finally, minority governments, regardless of their regime type, are forced to build legislative coalitions
issue-by-issue.28 This is not to say that government-opposition conflicts do not exists under minority
government, but rather to recognise that minority governments cannot adopt policy without the help of some
opposition legislators. In practice this suggests that under minority government, on any given policy issue the
median legislator or party is pivotal, for both government bills and bills or amendments proposed by
opposition members. As a result, in this context legislative voting is likely to be dominated by
23 This quote is allegedly attributed to Austin Mitchell, who has been the Labour MP for Grimsby since 1977. 24 Cf. Cheibub 2007. 25 Laver and Shepsle 1996; Tsebelis 1999; Strøm et al. 2011. 26 Mattson and Strøm 1995; Döring 2001. 27 Lupia and Strøm 1995; Diermeier and Feddersen 1998. 28 Strøm 1990; Tsebelis 2002, 97-99.
11
parties’/legislators’ (left-right) policy positions rather than by government-opposition splits. Nevertheless,
because of the ability of parties to discipline their members in parliamentary systems as compared to
presidential systems, there is again likely to be a difference in how this works across the two types of regimes:
with parties as the units of analysis under minority government in parliamentary systems, and individual legislators
the units of analysis under minority government in presidential systems.
In sum, the main theories of legislative politics suggest the following: (1) that left-right policy
positions should be more correlated with roll-call voting than government-opposition dynamics where there
are minority governments (in either parliamentary and presidential regimes) and also where there are majority
coalition governments in a presidential regime (the contexts which fit the floor agenda model); (2) that
government-opposition dynamics should dominate voting where there are majority single-party governments
in a parliamentary regime (under the Westminster model); and (3) that both government-opposition voting
and left-right voting should exist where there are majority coalition governments in a parliamentary regime
and majority single-party governments in a presidential regime (the contexts which most closely fit the cartel
agenda model).
Estimation of the Voting Space in 16 Legislatures
To investigate these propositions we apply a standard scaling metric to the roll-call votes in a range of
parliaments: Clinton, Jackman and Rivers’ IDEAL. IDEAL is a leading Markov Chain Monte Carlo-based
method of ideal point estimation. Like other scaling methods, IDEAL provides a good way of data reduction,
and produces model based estimates. IDEAL, like other scaling methods, needs identification restrictions,
such as determining the polarity of each dimension, normalization, and rotation of dimensions. We fix the
polarity of each dimension by constraining the location of a known left-wing (right-wing) legislator or political
party to the negative (positive) value on a dimension. We also rescaled the estimated ideal points such that
they all lie within a unit circle. Finally, we rotated the estimated ideal points so that the first dimension is the

12
one associated with the largest variance (or eigenvalue). Using those identification restrictions for our 16 cases
we obtained legislators maps that are directly comparable.
As robustness check we also use Poole and Rosenthal’s NOMINATE.29 NOMINATE has become
an ‘industry standard’ for estimating legislators’ revealed preferences from roll-call votes because it is relatively
easy to apply, and requires only a limited computer capacity to produce estimates on several dimensions.
Although each method has its advantage or disadvantages, in our cases the results we obtained are highly
correlated and largely comparable.30 Given that the results from the two methods are highly correlated, we
report only the IDEAL results.31
Roll-call votes have been collected and analysed in either published or publicly-available research for
over thirty legislatures.32 However, raw roll-call data are only in the public domain for a limited number of
legislatures, and for many of these cases the data are not suitable for applying a scaling metric, as either there
is an insufficient number of votes (as with the data from many of the Latin American parliaments and Japan),
or the votes are heavily lop-sided (as in the Russian case).
There is, of course, considerable variance in the meaning of the roll-call votes in legislatures where
good quality roll-call data exists, and hence questions about their comparability. Some legislatures, as in the
Czech Republic and the European Parliament, have over 2,000 votes in a session while others, such as the
Peru or France, have fewer than 200 votes in a similar period. There is also a potential problem of selection
bias: where roll-call votes are strategically requested by parties to enforce certain types of behaviour.33 The
subject of votes varies across parliaments, with some legislatures having more votes on budgetary issues than
29 Clinton et al. 2004; Poole and Rosenthal 1997. 30 A discussion of similarities and differences between IDEAL and NOMINATE methods is given by Carrol et al. 2009, and Clinton and Jackman 2009. 31 An alternative strategy to identify the ideal points is used by Zucco and Lauderdale 2011, who use an anonymous survey of Brazilian legislators to identify party positions on a left-right ideology dimension. For more of our cases, comparable surveys of legislators’ ideological positions do not exist. 32 A non-exhaustive list includes Stjernquist and Bjurulf 1970; Clausen and Holmberg 1977; Saalfeld 1990; Myagkov and Kiewiet 1996; Lanfranchi and Lüthi 1999; Skjaeveland 1999, 2001; Noury 1999; Rasch 1999; Cox et al. 2000; Figueiredo and Limongi 2000; Jensen 2000; Londregan 2000; Müller et al. 2001; Andrews 2002; Noury and Roland 2002; Schonhardt-Bailey 2003; Ferrara 2004; Morgenstern 2004; Rahat 2004; Rosenthal and Voeten 2004; Landi and Pelizzo 2005; Noury and Mielcova 2005; Pajala et al. 2005; Chiou 2006; Hansen 2006a,b; Hix et al. 2006, 2007; Carey 2007a,b; Hug and Schulz 2007; Spirling and McLean 2007; Jun and Hix 2009. 33 E.g. Hug 2006.

13
others, and some periods being dominated by particular nationally-specific issues. The number of roll-call
votes also varies across country, which is in part related to the rules governing what issues get to a vote.34
And, the legislative rules of procedure of course vary considerably across country. All in all, one might think
that because so many such factors co-vary with country that little systematic can be identified from studying
roll-call voting across country.
Nevertheless, the data at hand cover real world legislative votes on important public policies such as
institutional reforms, foreign policies, fiscal policies, and budget. Also, because we scale each legislature
separately,35 we do not need to weight the analysis by the number of roll-call votes in each legislature.
Moreover, the sample size in each case is not correlated with the frequency of government-opposition splits.
And, conceptually, it is not clear why selection effects (or selective recording of votes) should lead to more
government-opposition voting. We also show that the standard scaling methods can be applied to produce, at
least to some extent, comparable ideological maps in different legislatures. Furthermore, we illustrate that our
findings hold when looking at cross-time variation in the Czech Republic. By focusing on cross-time variation
in this case, we try to isolate the effect of a change in agenda-control (between majority and minority
government), while keeping constant the underlying regime structure, party system, legislative rules, strategic
incentives, and even perhaps issues.
For the legislatures where good quality roll-call data are available we proceeded as follows. We first
chose one full term of the legislature in either the late 1990s or early 2000s, or a part of term if the data from a
full-term were not available (in the Israeli case).36 We then applied the same criteria to decide which votes and
parliamentarians to exclude from the analysis: we dropped all lopsided votes (where less than 10 per cent of
legislators were on the minority side), and all legislators who voted less than 25 times. We then applied the
same optimization algorithm: the latest versions of IDEAL and W-NOMINATE. We estimated two-
dimensional models for each parliament for two reasons. First, dimensions higher than the first two rarely
34 Carey 2009. 35 Unlike Carey 2007a. 36 To avoid using very different sample sizes, for the Czech Republic we used the first 2000 votes out of a population of over 13000 roll call votes.

14
have a clear interpretation. Second, the increase in the goodness-of-fit statistics, such as the correct
classification scores, is negligible for higher dimensions. In addition, estimating a two-dimensional policy
space is a standard practice in the literature.37
Table 1. Dimensionality in Parliaments: Goodness‐of‐Fit Statistics
Legislature
Chamber size
Period
Scalable votes
Scalable legislators
Eigenvalues: first/second/third
dimensions
APRE dimension1/ dimension2
APRE dim.1 minus
dim.2
Single-Party Parliamentary Australia 148 1996-98 446 149 85 / 4 / 1 99.2 / 99.2 0.0 Canada 295 1994-97 696 297 49 / 15 / 2 73.0 / 96.0 22.1 New Zealand 97 1990-93 570 97 80 / 3 / 1 94.3 / 96.2 1.9 United Kingdom 651 1997-2001 1165 655 62 / 8 / 2 92.0 / 93.9 1.9
Coalition Parliamentary Belgium 150 2003-07 663 178 53 / 7 / 3 89.5 / 92.9 3.4 France 577 1997-2002 105 594 81 / 4 / 1 97.0 / 97.0* 0.0 Israel 120 1999 584 121 37 / 18 / 8 53.7 / 74.1 20.4 Poland 460 1993-97 1050 445 30 / 18 / 6 48.1 / 65.9 17.8
Single-Party Presidential Peru 120 1999-2000 235 122 60 / 4 / 3 82.7 / 87.7 5.0 South Korea 299 2004-05 136 304 23 / 8 / 3 37.1 / 51.6 14.5 USA 435 1993-95 947 438 70 / 4 / 2 65.7 / 69.2 3.5
Coalition Presidential Brazil 513 1995-98 428 610 30 / 6 / 2 72.8 / 75.3 2.5 Chile 120 1998-2000 522 121 50 / 4 / 3 73.0 / 77.9 4.9 Eurpean Parliament 732 2004-09 2204 906 20 / 9 / 5 51.9 / 56.8 4.9
Minority Parliamentary/Pres. Czech Republic 200 1998-2001 2049 201 45 / 15 / 12 68.5 / 74.7 6.2 Mexico 500 2003-06 138 532 47/7/2 77.3/83.2 5.9
Note: * This number actually slightly decreased, indicating that the second dimension did not have any explanatory power. APRE = aggregate proportional reduction in error, where the classification errors of the model are compared to that of a naïve benchmark assuming that all MPs vote with the majority.
Table 1 summarizes the datasets and the goodness-of-fit statistics associated with our cases. The first
noteworthy finding is that the scaling results in most legislatures indicate a predominantly one-dimensional
policy space. Nevertheless, there is some variation between the cases. For example, the second dimension
explains a significant amount of variance in the Canadian, Israeli, Polish and South Korean legislatures.
37 E.g. Poole and Rosenthal 1997; Londregan 2000; Morgenstern 2004. This low-dimensionality finding is partly due to the fact that in each legislature our analysis aggregated a large number of roll-call votes. An equally important question, though beyond the scope of this paper, is the extent to which legislative behaviour across political systems differs when legislatures vote on similar issues. See Aldrich et al. 2011, who show that low-dimensional scaling results do not necessarily imply low dimensionality in the actual political world.
15
Eigenvalues reported in Table 1 also suggest a third dimension in the Czech legislature, and to a lesser extent
in the Polish and Israeli legislatures and in the European Parliament, but not in any of the other cases. At the
other extreme, the Australian, French and New Zealand legislatures look essentially one-dimensional, as the
second and higher dimensions explain very little in these cases.
Figures 2-5 show the ‘voting maps’ of the two-dimensional estimates produced by IDEAL for each
legislature.38 In each map, the distance between any two legislators illustrates how often they voted the same
way in the roll-call votes in a given period. So, if any two legislators voted the same way in every vote, they
would be located in exactly the same place, while if they voted on opposite sides in every vote, they would be
located on opposite sides somewhere around the rim of the unit circle in the figure. A note of caution,
however: because each legislature is scaled independently, distances in one figure cannot be compared to
distances in another figure. Hence, within a legislature, if one party’s members are close together while
another party’s members are dispersed, we can infer that the former party voted more cohesively than the
later. However, across two legislatures, if a party’s members in one legislature are close together while another
party’s members in another legislature are more dispersed, we cannot infer that the former is more cohesive
than the later, as there may simply have been a higher number of inter-party vote splits in the former than the
later legislature.
Nevertheless, the maps do provide suggestive evidence of whether voting inside a legislature is mainly
driven by government-opposition splits or by left-right policy positions of parties. In each voting map, the
members of the governing party are indicated by an ellipse and a possible left-right dimension is indicated by a
dotted line from the most left-wing major party to the most right-wing major party (the names of the parties
and their political affinities are listed in the Appendix).
Let us stress again what we mean by government-opposition voting. When legislators vote based on
whether they are member of a governing or opposition party, we say that voting takes place along a
38 To estimate the ideal points, we ran IDEAL with 50,000 iterations, and we used the approach proposed by Geweke to check for convergence. We use the starting values generated by IDEAL. The results do not change much when using alternative scaling methods. Moreover, our results are not qualitatively different from the spatial maps in previous research using IDEAL or other methods for some of our cases, e.g. USA, European Parliament, Mexico, Brazil, South Korea, and Belgium.

16
government-opposition “dimension”. That is, government-opposition dynamics are at work when a majority
of members belonging to government parties vote against a majority opposition parties members. By
government-opposition, we do not mean a continuous policy dimension always independent of a left-right
policy-based dimension. In many cases, the two dimensions are highly correlated as coalitions form based on
the left-right ideologies of the parties. Only when the two dimensions are uncorrelated can we investigate
whether voting is shaped by left-right policy preferences rather than by government-opposition dynamics.
Figure 2 shows the four cases of single-party majority government in parliamentary regimes. The first
dimension in all these maps clearly captures the government-opposition divide. With the two-party systems in
the 1996-98 Australian House of Representatives and the 1990-93 New Zealand House of Representatives it
Figure 2. Parliamentary Regimes with Single‐Party Governments
Australia, 1996-98 Canada, 1994-97
New Zealand, 1990-93 United Kingdom, 1997-2001
Dim
ensi
on
2
Dimension 1
Left
Right
Lab
Nat-Lib
Ind D
imen
sio
n 2
Dimension 1
Government
Left
Right
Lib
NDP
Reform
BQ
PC Ind
Dim
ensi
on
2
Dimension 1
Government
Left Right
Lab
All
Ind
Nat Dim
ensi
on
2
Dimension 1
Government
Left
Right
LabCon
LD
SNP
PC
SDLP
UUP
UKUP
Ind
DUP

17
is impossible to identify government-opposition voting independently from the left-right policy preferences of
the parties. In contrast, in the 1994-97 Canadian House of Commons and the 1997-2001 British House of
Commons while the first dimension is clearly a government-opposition split, the second dimension appears to
capture left-right divisions within the opposition group of parties.
The maps of the four cases of coalition-government in parliamentary regimes, in Figure 3, are more
varied. Voting in the 2003-07 Belgian Federal Chamber of Representatives was similar to the single-party
government cases, in that the legislators from the parties in the governing coalition are on the left while the
legislators from the opposition parties are on the right, and the second dimension captures left-right divisions
within both the opposition bloc and the governing coalition. Within each bloc, on the second dimension we
also observe some conflicts between the Dutch-speaking parties (on the upper part) and the French-speaking
Figure 3. Parliamentary Regimes with (Majority) Coalition Governments
Belgium, 2003-07 France, 1997-2002
Israel, 1999 Poland, 1993-97
Dim
ensi
on
2
Dimension 1
Government
Left
Right
CD&V
CDH
Ecolo
VB
FN
NVA
SP.A
PS
VLD
MR
Dim
ensi
on
2
Dimension 1
Government
Right
RPR
UDF
PS
CRV
COM
Dim
ensi
on
2
Dimension 1
Government
Left
Right
Lab
Likud
Shinui
Shas
Meretz & Am Ehad
Balad & Hadash
UAL
NRP
UTJ
YBA
Agudat
Nat. Union
Dim
ensi
on
2
Dimension 1
Government
Left
Right
SLD
PSL
UW
UP
KPN
BBWR
Ind

18
parties (on the lower part). In the 1997-2002 French National Assembly and the 1999 Israeli Knesset, the
government-opposition split correlates with the left-right positions of parties. The meaning of the second
dimension is less clear in these cases. In Israel, for example, the location of the parties on the second
dimension within the government and opposition blocs suggests that the second dimension captured several
issues, such as religious parties versus secular parties. Meanwhile, in the 1993-97 Poland Sejm there was
variation within the government and opposition blocs on both dimensions, and while the more left-wing party
in the opposition is lower on the second dimension, the more left-wing party on the governing side is higher
on the second dimension.
Turning to the presidential regimes, Figures 4 shows the three cases of single-party majority
government (where one party holds the presidency, all the cabinet seats, and a majority in the legislature) in
these systems along with the one case of minority government in a presidential regime (where a party that
holds the presidency does not command a majority in the legislature) (e.g. Cheibub 2007). Again, there are a
variety of patterns. In both the 1999-2000 Peruvian Congress and the 2004-07 South Korean National
Assembly, the first dimensions seems to be mainly related to government-opposition while the second
dimension captures left-right policy differences between the parties in opposition. Meanwhile, the two-party
system in the US means that government-opposition voting and left-right policy preferences of the parties
cannot be separated for the US House of Representatives. In contrast, in the 2003-06 Mexican Chamber of
Deputies the first dimension captures left-right policy preferences and government-opposition dynamics, with
the conservative National Action Party (PAN) in government on the right, but with a minority of seats, the
centrist Institutional Revolutionary Party (PRI) in the centre, and the left-wing Party of the Democratic
Revolution (PRD) on the left. The relative positions of the parties suggests that the minority PAN
government relied more on the party closest to it on the left-right dimension (PRI) to build majority coalitions
in the legislature.

19
Figure 5 shows the three cases of coalition governments in presidential/separated-powers regimes
and the one case of minority government in a parliamentary regime. In all four of these cases the first
dimension appears to be correlated with the left-right positions of parties. In the 1995-98 Brazilian Chamber
of Deputies the government-opposition camps are identifiable, but there was some variance within the
government and opposition blocs. Similarly, in the 2004-09 European Parliament, the political groups are
lined up from left-right on the first dimension, while the political groups who have members in the European
Union executive (the Commission) are close together on the second dimension but divided on the first
dimension. In contrast, the 1998-2000 Chilean Chamber of Deputies looks similar to some of the patterns of

20
voting under coalition governments in parliamentary systems, with a clear divide along government-
opposition lines.
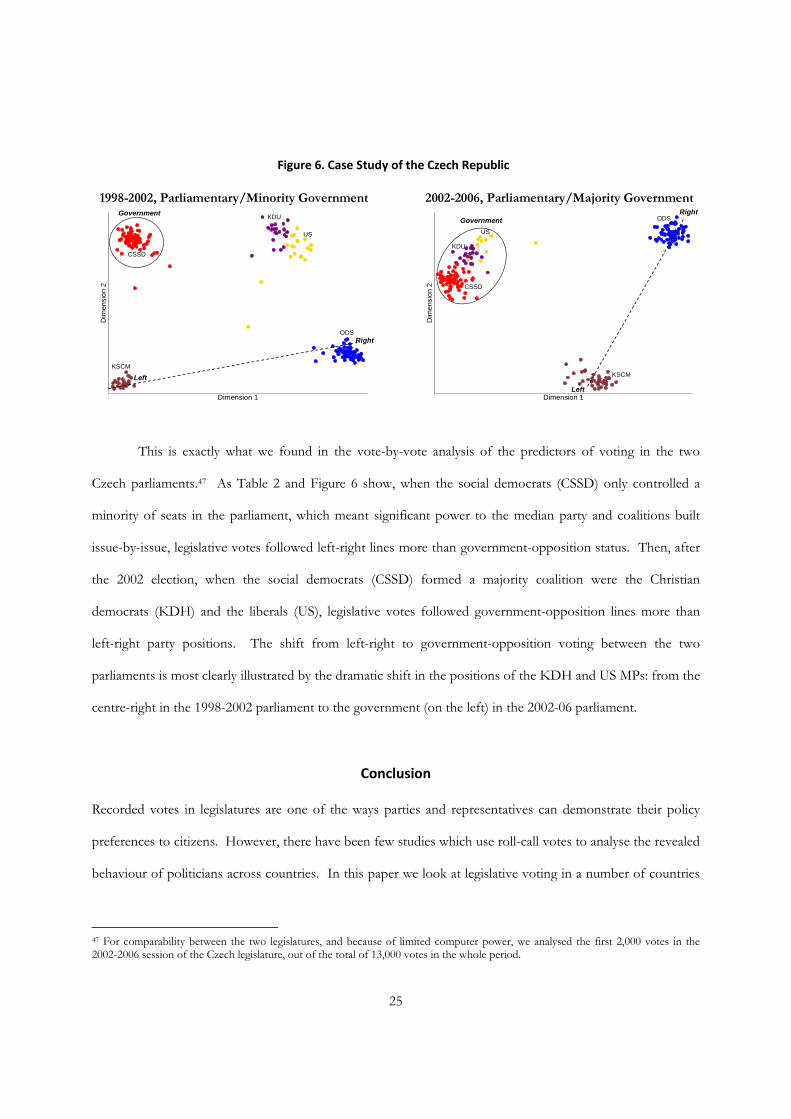
Finally, voting in the 1998-2001 Czech Chamber of Deputies was clearly along party lines, with
cohesive party-line voting and the parties lined up from left to right on the first dimension. The positions of
the parties in the map also show that the minority governing party (CSSD) built coalitions issue by issue,
either with the former communists (KSCM), or sometimes with the Christian democrats (KDU) and liberals
(US), and less often with the conservatives (ODS), who are far from the governing party on both dimensions.
Figure 5. Presidential (Separated‐Powers) Regimes with Coalition Governments
Brazil, 1995-98 Chile, 1998-2000
European Parliament, 2004-09 Czech Republic, 1998-2002 (Parliamentary/Minority Government)
Dim
ensi
on
2
Dimension 1
Government
Left
Right
PT
PCdoB
PDT PSB
PFL
PSDB
PMDB
PL
PTB
Ind
Dim
ensi
on
2
Dimension 1
Government
Left
Right
DC
PS
PPD
Ind
UCC
RN
UDI
Dim
ensi
on
2
Dimension 1
Government
Left
Right
SOC
ALDE EPP
UEN
G/EFA
EUL/NGL
IND/DEM Ind
Dim
ensi
on
2
Dimension 1
Government
Left
RightODS
US
KSCM
CSSD
KDU

21
Estimating the Relative Significance of Left‐Right and Government‐Opposition Voting
These maps consequently allow some inferences to be drawn about the substantive meaning of the revealed
dimensions of voting in these 16 legislatures. However, these inferences rely on rather ad hoc understandings
of the left-right positions of the parties. We consequently try to interpret the relative significance of left-right
and government-opposition voting in a more systematic way. One estimation strategy would be to regress
each dimension of IDEAL as a function of left-right party positions and government-opposition variables.39
An important shortcoming with such exercise would be that pooling data from different countries cannot be
logically justified without strong assumptions. As a result, we follow an approach that does not require
pooling of votes from different countries. We thus look at every vote in each legislature and estimate how
much of the behaviour of each individual legislator in each vote can be explained by his/her government-
opposition status or left-right policy position.40
For each of the approximately 11,000 votes we estimate the following cross-sectional specification:
where i indicates a member of legislature J and r refers to a specific roll-call vote in that legislature. is the
left-right position of legislator i’s party in parliament J, while is a dummy variable indicating whether the
legislator’s party in parliament J is in government (coded 1) or opposition (coded 0). Finally, is the error
term. We estimate the model using the linear probability model with heteroskedasticity-robust standard
errors. Given that legislators belonging to a given party vote similarly we cluster the observations by political
party.41
39 The results of such analysis largely confirmed the findings based on visual inspection of the ideological maps: the government-opposition and left-right variables were both statistically significant on the first dimension with the government-opposition variable dominating the left-right variable both in terms of significance and in terms of magnitude. The second dimension, in contrast, was mainly explained by the left-right location of parties. 40 Cf. Main, Sufi and Trebbi 2011. 41 The linear probability models are easy to estimate and interpret. Its main shortcomings include heteroskedasticity and the fact that it can produce predicted probabilities that are less than zero or greater than one. Since we are not making predictions, we ignore that the predicted probabilities can be negative or greater than one. To address the potentially important heteroskedasticity problem, we estimate robust regressions. Using Logit or Probit would be an even better option but note that it is extremely time-consuming to non-linearly estimate a very large number of votes, even if technical issues like convergence were not an issue.
Vote ir,J r,J r,J LRJ r,JGOJ i
r,J
LRJ
GOJ
ir,J

22
Ideally, we would like to have exogenous measures of individual legislators’ left-right policy
preferences rather than aggregated at the level of political parties. However, except for a few cases – such as
the US Congress or the European Parliament – individual-level measures either do not exist or are
unreliable.42 In contrast, there are reliable exogenous measures of party positions on a range of policy issues,
and previous research has found that these measures correlate with party voting behaviour inside legislatures.43
So, for the left-right location of each party, we use the ‘expert estimates’ of parties’ left-right positions in the
Benoit-Laver and Wiesehomeier-Benoit datasets.44
Our approach will not provide meaningful results if the left-right and government-opposition
variables are highly correlated. Given that our explanatory variables are party-level data, and do not vary
within a given party, perfect multicolinearity is an issue in some cases. In particular, in two-party legislatures
(US and New-Zealand) we have perfect multicolinearity. In addition, in a few other cases (Australia, Chile,
France, Peru, and, to a lesser extent, Brazil and Mexico) we observed high correlation between left-right and
government-opposition.
Another limit of our approach is a potential measurement error in our left-right variable.
Measurement errors do not always affect the properties of OLS. But if potential measurement errors are
correlated with our left-right variable then our estimates will suffer from an attenuation bias and the other
variables will be estimated with some bias as a result. To address this potential problem we use Carroll et al.’s
(2006) error correction method known as simulation extrapolation (Simex) (cf. Benoit at al. 2009). For each
vote we look at whether each explanatory variable is significant at 5%. For each legislature we report the
number and proportion of cases where left-right is significant and compare it to the number and proportion
of cases where government-opposition is significant.
42 Laver 2006. 43 E.g. Hix, Noury and Roland 2006; Zucco and Power 2009. 44 Benoit and Laver 2007; Wiesehomeier and Benoit 2007. South Korea is not in the Benoit-Laver or Wiesenhomeier-Benoit datasets. For this case we use the estimates of the policy positions of the parties that Jun and Hix generate from surveys of the Korean National Assembly members, scaled to the same scale used by Benoit-Laver and Wiesenhomeier-Benoit. See Jun and Hix 2009.

23
As indicated by Mian et al. (2012), the approach we use has some useful features and some evident
drawbacks.45 One useful feature is that we are able to directly aggregate a large number of heterogeneous
votes. In addition, by focusing on statistical significance as opposed to the direction and size of coefficients,
we can abstract from arbitrarily classifying roll-call votes as pro-government or in a right-wing direction. A
disadvantage, though, is that all the important legislative information contained in specific bills and
amendments is lost. In particular, votes on important policy issues are treated identically to votes on trivial
issues.
Table 2. Left‐Right and Government‐Opposition Determinants of Legislative Voting
No. ofvotes
LR & GO correlation
No. of sign. coefficients
Proportion of sign. Coefficients
Proportion of sign. Coefficients (Simex)
Country LR GO LR GO LR GO
Single-Party Parliamentary Canada, 1994-97 500 -0.01 299 449 0.59 0.89 0.57 0.95 U.Kingdom, 1997-2001 1279 -0.54 874 1080 0.68 0.84 0.61 0.80
Coalition Parliamentary Belgium, 2003-07 1222 -0.31 22 893 0.02 0.73 0.45 0.98 Czech Rep., 2002-06 1150 0.24 644 937 0.56 0.81 0.79 0.87 France, 1997-2002 104 -0.64 72 76 0.69 0.73 - - Israel, 1999 753 -0.66 535 636 0.71 0.84 0.25 0.61 Poland, 1993-97 1329 -0.22 563 655 0.42 0.49 0.76 0.76
Single-Party Presidential Peru, 1999-2000 127 0.94 31 73 0.24 0.57 0.04 0.79 South Korea, 2004-05 131 -0.75 114 125 0.87 0.95 - -
Coalition Presidential Brazil, 1995-98 449 0.75 276 328 0.61 0.73 0.88 0.84 Chile, 1998-2000 144 0.93 26 55 0.18 0.38 0.29 0.58 Eur. Parliament, 2004-09 1942 0.06 1018 673 0.52 0.35 0.91 0.84
Minority Parliamentary/Pres. Czech Rep., 1998-02 1498 0.52 1045 582 0.70 0.39 0.65 0.56 Mexico, 2003-06 138 0.79 116 122 0.84 0.88 0.78 0.94 Note: The method used is linear probability (OLS) with clustered standard errors. Australia, New Zealand and USA and are excluded because of almost perfect collinearity between left-right and government-opposition. The last two columns report the estimates by simulation extrapolation method for error correction.
The results of our vote-by-vote regressions are reported in Table 2. They indicate the relative
importance of our left-right variable versus government-opposition variable. For Canada, for example, the
government-opposition split was significant in 449 out of 500 regressions, whereas the left-right dimension
45 Mian et al. 2011.
24
was significant in 299 regressions. We, therefore, infer that in Canada in this period the government-
opposition split was a more important driver of legislative voting than left-right party policy positions. In only
one case, one variable explains the voting behaviour: in Belgium, where votes are overwhelmingly explained
by government-opposition status. In all other cases, both left-right policy positions of parties and the
government-opposition status of a legislator’s party are important.
To check whether measurement errors affect our estimates, we used standard error data reported by
Benoit and Laver (2007) to correct for measurement error of the left-right variable. The results reported in
Table 2 are qualitatively similar to the estimates produced by simple OLS regression analysis. However, we
found different estimates for two cases. After error correction, we find that for Poland left-right and
government-opposition are equally important. For Brazil, however, we find that left-right is now more
important that government-opposition.
Nevertheless, another key finding is that government-opposition status generally trumps left-right
policy positions in almost all cases. Only in the European Parliament and the Czech Republic case of
minority government do we find that left-right policy positions are stronger predictors of legislative voting
than government-opposition status.46 Government-opposition status dominates left-right preferences across
all institutional contexts. These finding hence corroborate the inferences from the voting ‘maps’.
Finally, the findings for the two legislatures in the Czech Republic are particularly interesting. In the
Czech Republic, the minority CSSD government in 1998-2002 was replaced by a majority CSSD-KDU-US
coalition government in 2002-2006. If the institutional context of legislative voting – whether a majority or a
minority government controls the agenda – matters, we should expect a shift in the pattern of voting in the
two parliaments. Specifically, we should expect mainly left-right voting under the period of minority
government in 1998-2002 and mainly government-opposition voting under the majority coalition government
in 2002-2006.
46 Our estimation based on Simex method suggests that left-right is also important in the case Brazil.
25
This is exactly what we found in the vote-by-vote analysis of the predictors of voting in the two
Czech parliaments.47 As Table 2 and Figure 6 show, when the social democrats (CSSD) only controlled a
minority of seats in the parliament, which meant significant power to the median party and coalitions built
issue-by-issue, legislative votes followed left-right lines more than government-opposition status. Then, after
the 2002 election, when the social democrats (CSSD) formed a majority coalition were the Christian
democrats (KDH) and the liberals (US), legislative votes followed government-opposition lines more than
left-right party positions. The shift from left-right to government-opposition voting between the two
parliaments is most clearly illustrated by the dramatic shift in the positions of the KDH and US MPs: from the
centre-right in the 1998-2002 parliament to the government (on the left) in the 2002-06 parliament.
Conclusion
Recorded votes in legislatures are one of the ways parties and representatives can demonstrate their policy
preferences to citizens. However, there have been few studies which use roll-call votes to analyse the revealed
behaviour of politicians across countries. In this paper we look at legislative voting in a number of countries
47 For comparability between the two legislatures, and because of limited computer power, we analysed the first 2,000 votes in the 2002-2006 session of the Czech legislature, out of the total of 13,000 votes in the whole period.
Figure 6. Case Study of the Czech Republic
1998-2002, Parliamentary/Minority Government 2002-2006, Parliamentary/Majority Government
Dim
ensi
on
2
Dimension 1
Government
Left
RightODS
US
KSCM
CSSD
KDU
Dim
ensi
on 2
Dimension 1
Right
Left
KSCM
ODS
CSSD
US
KDU
Government

26
using a consistent set of measures: looking at roll-call votes, applying the same scaling method, applying the
same identification strategy, and applying the same restriction criteria.
Our results suggest that different theories of legislative politics fit different institutional contexts.
Where legislative coalitions have to be built issue-by-issue – as in presidential regimes with coalition
governments and in parliamentary or presidential regimes with minority governments – the standard spatial
(median-voter) model fits the observed legislative voting patterns relatively well. Nevertheless, in all other
institutional contexts, the dominant feature of legislative voting appears to be the battle between those parties
and politicians who are in government and those who are in opposition, rather than policy-based (left-right)
divisions between parties or legislators.
Sometimes this government-opposition divide correlates with a left-right ideological dimension.
More often than not, though, the government-opposition divide cuts across the left-right dimension.
Regardless of their policy promises and ideological affinities, parties in opposition usually vote together
against the party or parties in government. When government-opposition voting breaks down, governing and
opposition parties then tend to split along left-right lines, hence producing a second dimension which
correlates with left-right positions of parties. Put another way, legislative politics in most democracies looks
more like Westminster than Washington, DC.
This finding challenges the widespread assumption that legislative behaviour is primarily driven by
actors’ preferences in a single continuous (left-right) policy space. We do have several models of government-
opposition politics in parliamentary regimes.48 However, we do not yet have a good understanding of why
government-opposition splits are common across presidential and parliamentary regimes, irrespective of
whether a government is a single-party or coalition government. For example, is the empirical regularity we
observe driven by agenda-setting rules common to all regimes, the power of parties, career incentives of
politicians, electoral positioning of parties, or some combination of these factors?
48 E.g. Huber 1996; Diermeier and Feddersen 1998; Dewan and Spirling 2011.
27
There is, of course, much still to be done. Our cases are a small sample of all democracies and all
possible variations in the institutional design of government. With better quality data from more legislatures a
wider variety of institutional variables could be taken into account, such as rules on the selection of roll-call
votes, electoral systems, committee powers, and so on. With more data it would also be possible to look at
how changes over time affect legislative voting, such as changing party policy positions, government turnover,
length of term in office, the changing make-up of coalitions, shifts from unified to divided government in
presidential systems, other cases of shifts from minority to majority government, and so on.

28
Appendix. Party Abbreviations
Australia Ind Independent Lab Labor Party (social democratic) Lib Liberal Party (liberal/conservative) Nat National Party (conservative)
Belgium CD&V Christen-Democratisch en Vlaams (Flemish, Chr.dem.) CDH Centre démocrate humaniste (Walloon, Chr.democratic) Ecolo Écologistes confédérés pour l’organisation de luttes originales (Walloon, green) FN Front national (Walloon, radical right) NVA Nieuw-Vlaamse Alliantie (Flemish, left-regionalist) MR Mouvement Réformateur (Walloon, liberal) PS Parti Socialiste (Walloon, social democratic) SP.A Socialistische Partij Anders (Flemish, social democratic) VB Vlaams Belang (Flemish, radical right) VLD Vlaamse Liberalen en Democraten (Flemish, liberal)
Brazil Ind Independent PCdoB Partido Comunista do Brasil (radical left) PDT Partido Democratico Trabalhista (social democratic) PFL Partido da Frente Liberal (conservative) PL Partido Liberal (liberal) PMDB Partido do Movimento Democrático Brasileiro (centrist) PSB Partido Socialista Brasileiro (social democratic) PSDB Partido da Social Democracia Brasileiro (centrist) PT Partido dos Trabalhadores (social democratic) PTB Partido Trabalhista Brasileiro (conservative)
Canada BQ Bloc Québécois (left-regionalist) Ind Independent Lib Liberal Party (liberal) NDP New Democratic Party (social democratic) PC Conservative Party (conservative) Reform Reform Party (conservative)
Chile RN Renovación Nacional (conservative) UCC Unión del Centro Centro Progresista (centrist) Ind Independent PPD Partido Por la Democracia (social democratic) PS Partido Socialista de Chile (social democratic) DC Demócrata Cristiano (Christian democratic) UDI Unión Demócrata Independiente (conservative)
Czech Republic KSCM Komunistická strana Čech a Moravy (radical left) ODS Občanská demokratická strana (conservatives) US Unie svobody (liberal) KDU Křest’anská a demokratická unie (Christian democrats) CSSD Česká strana socálnĕ demokratická (social democrats)
European Parliament SOC Party of European Socialists (social democrat) EPP European People’s Party (Chr. democrat and conservative) ALDE Alliance of Liberals and Democrats for Europe (liberal) G/EFA Greens/European Free Alliance (green, left-regionalist) EUL/NGL European United Left/Nordic Green Left (radical left) Ind Independent IND/DEM Independence/Democracy (anti-European) UEN Union for Europe of the Nations (nationalist)
France COM Parti communiste français (radical left) CRV Groupe des citoyens, radical et verts (left-radical-green) PS Parti Socialiste (social democratic) RPR Rassemblement pour la République (conservative) UDF Union des Démocrates pour la République (conservative)
Israel Agudat Agudat Yisrael (religious) Am Ehad One Nation (social democratic) Balad Brit Le’umit Demokratit (Arabic, social democratic) Hadash HaHazit HaDemokratit LeShalom VeLeShivion (Arabic, social dem.) Lab Labor Party (social democratic) Likud Likud (conservative) Meretz Meretz (social democratic) Nat. Union National Union (radical right) NRP National Religious Party (religious) Shas Shas (religious) Shinui Shunui (liberal-secularist) UAL United Arab List (Arabic, religious) UTJ United Torah Judaism (religious) YBA Yisrael Be’aliyah (conservative)
Mexico CD Convergencia por la Democracia (social democratic) PAN Partido Acción Nacional (conservative) PRD Partido de la Revolución Democrática (social democratic) PRI Partido Revolucionario Institucional (centrist) PT Partido del Trabajo (radical left) PVEM Partido Verde Ecologista de México (green)
New Zealand All Alliance Party (social democratic) Ind Independent Lab Labour Party (social democratic) Nat National Party (conservative)
Peru APRA Alianza Popular Revolucionaria Americana (social dem.) FIM Frente Independiente Moralizador (centrist) AP-CD Acción Popular – Coordinatora Democratica (Chr.dem.) Ind Independent UPP Unión por el Perú (social democratic) PPC-R Partido Popular Cristiano – Renovación (Chr. democratic) NM Nueva Mayoria (conservative)
Poland SLD Sojusz Lewicy Demokratycznej (social democratic) PSL Polskie Stronnictwo Ludowe (Christian democratic) UP Unia Pracy (social democratic) Ind Independent KPN Konfederacja Polski Niepodleglej (nationalist) BBWR Bezpartyjny Blok Wzpierania Reform (independents) UW Unia Wolności (liberal)
South Korea UP Uri Party (progressive) Ind Independent GNP Grand National Party (conservative) MDP New Millennium Democratic Party (progressive) LDU Liberal Democratic Union (liberal) DLP Democratic Labor Party (radical left)
United Kingdom Con Conservative Party (conservative) LD Liberal Democrats (liberal) DUP Democratic Unionist Party (N.Ireland, conservative) Ind Independent Lab Labour Party (social democratic) PC Plaid Cymru (Welsh, social democratic) SDLP Social Democratic and Labour Party (N.Ireland, social dem.) SNP Scottish National Party (Scottish, social democratic) UKUP United Kingdom Unionist Party (N.Ireland,conservative) UUP Ulster Unionist Party (N.Ireland, conservative)
United States of America Dem Democratic Party (liberal) Ind Independent Rep Republican Party (conservative)

29
References
Aldrich, John, Jacob Montgomery, and David Sparks. 2011. Dimensionality in Congress: Alternative Sources of Low-Dimensionality in Scaled Roll-Call Analyses. Mimeo, Duke University.
Andrews, Josephine T. 2002. When Majorities Fail: The Russian Parliament, 1990-1993. Cambridge: Cambridge University Press.
Baron, David, and John Ferejohn. 1989. Bargaining in Legislatures. American Political Science Review 83:1181-1206.
Benedetto, Giacomo, and Simon Hix. 2007. The Rejected, the Dejected and the Ejected: Explaining Government Rebels in the 2001-2005 British House of Commons. Comparative Political Studies 40:755-781.
Benoit, Kenneth, Michael Laver, and Slava Mikhaylov. "Treating words as data with error: Uncertainty in text statements of policy positions." American Journal of Political Science 53.2 (2009): 495-513.
Black, Duncan. 1948. On the Rationale of Group Decision-making. Journal of Political Economy 56:23-34.
Black, Duncan. 1958. The Theory of Committee and Elections. Cambridge: Cambridge University Press.
Carey, John M. 2007a. Competing Principals, Political Institutions, and Party Unity in Legislative Voting. American Journal of Political Science 51:92-107.
Carey, John M. 2007b. Carey Data Archive. www.dartmouth.edu/~jcarey.
Carey, John M. 2009. Legislative Voting and Accountability. Cambridge: Cambridge University Press.
Carey, John M., and Matthew S. Shugart. 1995. Incentives to Cultivate a Personal Vote: A Rank Ordering of Electoral Formulas. Electoral Studies 14:417-439.
Carroll, Raymond J., David Ruppert, Leonard A. Stefanski, and Ciprian M. Crainiceanu. 2006. Measurement Error in Nonlinear Models: A Modern Perspective. Number 105 in “Monographs on Statistics and Applied Probability.” 2nd ed. Boca Raton , FL : Chapman and Hall/CRC.
Carroll, Royce, James Lo, Jeffrey Lewis, Keith Poole, and Howard Rosenthal. 2009. Comparing NOMINATE and IDEAL: Points of Difference and Monte Carlo Tests. Legislative Studies Quarterly. 34:593-591.
Cheibub, José Antonio. 2007. Presidentialism, Parliamentarism, and Democracy. Cambridge: Cambridge University Press.
Chiou, Fang-Yi. 2005. Jointly Estimating Party Effects and Ideologies. Mimeo, Princeton University.
Clausen, Aage R., and Soren Holmberg. 1977. Legislative Voting Analysis in Disciplined Multi-Party Systems: The Swedish Case. In The History of Parliamentary Behavior, edited by William Adelotte. Princeton, NJ: Princeton University Press.
Clinton, Joshua, Simon Jackman, and Douglas Rivers. 2004. The Statistical Analysis of Roll Call Data. American Political Science Review 98: 355-370.
Clinton, Joshua, and Simon Jackman 2009. To Simulate or to NOMINATE? Legislative Studies Quarterly 34:593-621.
Cox, Gary W., and Mathew D. McCubbins. 1993. Legislative Leviathan: Party Government in the House. Berkeley, CA: University of California Press.
Cox, Gary W., and Mathew D. McCubbins. 2005. Setting the Agenda: Responsible Party Government in the US House of Representatives. Cambridge: Cambridge University Press.
30
Cox, Gary W., and Mathew D. McCubbins. 2011. Managing Plenary Time: The U.S. Congress in Comparative Context. In The Oxford Handbook of the American Congress, edited by Eric Schickler and Frances E. Lee, Oxford: Oxford University Press.
Cox, Gary W., Mikitaka Masuyama, and Mathew D. McCubbins. 2000. Agenda Power in the Japanese House of Representatives. Japanese Journal of Political Science 1:1-22.
Dewan, Torun, and Arthur Spirling. 2011. Strategic Opposition and Government Cohesion in Westminster Democracies. American Political Science Review 105:337-358.
Diermeier, Daniel, and Timothy J. Feddersen. 1998. Cohesion in Legislatures and the Vote of Confidence Procedure. American Political Science Review 92:611-621.
Döring, Herbert. 2001. Parliamentary Agenda Control and Legislative Outcomes in Western Europe. Legislative Studies Quarterly 26:145-165.
Ferrara, Federico. 2004. Frogs, Mice, and Mixed Electoral Institutions. Journal of Legislative Studies 10:1-22.
Figueiredo, Argelina, and Fernando Limongi. 2000. Presidential Power, Legislative Organization, and Party Behavior in Brazil. Comparative Politics 32:151-170.
Hansen, Martin Ejnar. 2006a. Explaining Parliamentary Dimensionality through Institutions?. Paper presented at the Midwest Political Science Association, Chicago, 20-23 April 2006.
Hansen, Martin Ejnar. 2006b. The Dimensionality of European Parliaments: Comparing Denmark, Norway and Ireland. Paper presented at the IPSA World Congress, Fukuoka, 9-13 July 2006.
Heckman, James J., and James M. Snyder, Jr. 1997. Linear Probability Models of the Demand for Attributes with an Empirical Application to Estimating Preferences of Legislators. RAND Journal of Economics 28:142-189.
Huber, John. 1996. The Vote of Confidence in Parliamentary Democracies. American Political Science Review 90:269-282.
Hix, Simon. 2004. Electoral Institutions and Legislative Behavior: Explaining Voting Defection in the European Parliament. World Politics 56:194-223.
Hix, Simon, and Bjørn Høyland. 2011. The Political System of the European Union, 3rd edn, London: Palgrave.
Hix, Simon, Abdul Noury, and Gérard Roland. 2006. Dimensions of Politics in the European Parliament. American Journal of Political Science 50:494-511.
Hix, Simon, Abdul Noury, and Gérard Roland. 2007. Democratic Politics in the European Parliament. Cambridge: Cambridge University Press.
Hug, Simon. 2010. Selection Effects in Roll Call Votes. British Journal of Political Science 40:225-235.
Hug, Simon, and Tobias Schulz. 2007. Left-Right Positions of Political Parties Switzerland. Party Politics 13:305-330.
Jensen, Torben K. 2000. Party Cohesion. In Beyond Westminster and Congress: The Nordic Experience, edited by Peter Esaiasson and Knut Heidar. Columbus, OH: Ohio State University Press.
Jun, Hae-Won, and Simon Hix. 2009. Party Competition in the Parliamentary Arena: The Case of the Korean National Assembly. Party Politics 15:667-694.
Kam, Christopher J. 2009. Party Discipline and Parliamentary Politics. Cambridge: Cambridge University Press.
Krehbiel, Keith. 1993. Where’s the Party? British Journal of Political Science 23:235-266.
Krehbiel, Keith. 1998. Pivotal Politics: A Theory of U.S. Lawmaking. Chicago, IL.: University of Chicago Press.

31
Landi, Massimiliano, and Riccardo Pelizzo. 2005. A Spatial Analysis of the XIII Italian Legislature. Working Paper Series 16-2005, SMU.
Lanfranchi, Prisca, and Ruth Lüthi. 1999. Cohesion of Party Groups and Interparty Conflict in the Swiss Parliament. In Party Discipline and Parliamentary Government, edited by Shaun Bowler, David M. Farrell and Richard S. Katz. Columbus, OH: Ohio State Press.
Laver, Michael. 2006. Legislatures and Parliaments in Comparative Context. In The Oxford Handbook of Political Economy, edited by Barry Weingast and Donald Wittman. Oxford: Oxford University Press.
Laver, Michael, and Kenneth Shepsle. 1996. Making and Breaking Governments. Cambridge: Cambridge University Press.
Lijphart, Arend. 1999. Patterns of Democracy: Government Forms and Performance in Thirty-Six Countries. New Haven, CT: Yale University Press.
Londregan, John B. 2000. Legislative Institutions and Ideology in Chile. Cambridge: Cambridge University Press.
Lupia, Arthur, and Kaare Strøm. 1995. Coalition Termination and the Strategic Timing of Parliamentary Elections. American Political Science Review 89:648-666.
Martin, Andrew D., and Kevin M. Quinn. 2006. Applied Bayesian Inference in R using MCMCpack. R News 6:2-7.
Mattson, Ingvar, and Kaare Strøm. 1995. Parliamentary Committees. In Parliaments and Majority Rule in Western Europe, edited by Herbert Döring. New York: St.. Martin’s Press.
Mian, Atif, Amir Sufi, and Francesco Trebbi. 2012. The Political Economy of the Subprime Mortgage Credit Expansion. NBER WP 16107.
Morgenstern, Scott. 2004. Patterns of Legislative Politics. Cambridge: Cambridge University Press.
Müller Wolfgang C., Wilfried Philipp, and Marcelo Jenny. 2001. Die Rolle der parlamentarischen Fraktionen. In Die Österreichischen Abgeordneten: Individuelle Präferenzen und politisches Verhalten, edited by Wolfgang Müller, Marcelo Jenny, Barbara Steininger, Martin Dolezal, Wilfried Philipp, and Sabine Preisl-Westphal. Wein: Wien UV.
Myagkov, Mikhail G., and D. Roderick Kiewiet. 1996. Czar Rule in the Russian Congress of People’s Deputies?. Legislative Studies Quarterly 21:3-40.
Noury, Abdul. 1999. Decision-Making in Transition: Voting Behavior in the Polish Parliament. Mimeo, ULB.
Noury, Abdul, and Elena Mielcova. 2005. Electoral Performance and Voting Behavior in the Czech Republic. Working Paper 2005-14, Institute of Government Studies, UC Berkeley.
Noury, Abdul, and Gérard Roland. 2002. More Power to the European Parliament? Economic Policy 35:280-319.
Pajala, Antti, Aleks Jakulin, and Wray Buntine. 2005. Parliamentary Group and Individual Voting Behaviour in the Finnish Parliament in Year 2003. Mimeo, University of Turku.
Poole, Keith T. 2000. Non-Parametric Unfolding of Binary Choice Data. Political Analysis 8:211-232.
Poole, Keith T. 2005. Spatial Models of Parliamentary Voting. Cambridge: Cambridge University Press.
Poole, Keith T., and Howard Rosenthal. 1997. Congress: A Political-Economic History of Roll Call Voting. Oxford: Oxford University Press.
Poole, Keith T., and Howard Rosenthal. 2007. Ideology and Congress. New Brunswick, NJ: Transaction Publishers.
Rahat, Gideon. 2004. Party Cohesion in the Israeli Parliament 1949-2003. Mimeo, Hebrew University of Jerusalem.
32
Rasch, Bjørn Erik. 1999. Electoral Systems, Parliamentary Committees, and Party Discipline. In Party Discipline and Parliamentary Government, edited by Shaun Bowler, David M. Farrell and Richard S. Katz. Columbus, OH: Ohio State Press.
Rice, Stuart A. 1925. The Behavior of Legislative Groups. Political Science Quarterly 40:60-72.
Romer, Thomas, and Howard Rosenthal. 1978. Political Resource Allocation, Controlled Agendas, and the Status Quo. Public Choice 33:27-43.
Rosenthal, Howard, and Erik Voeten. 2004. Analyzing Roll Calls with Perfect Spatial Voting. American Journal of Political Science 48:620-632.
Saalfeld, Thomas. 1990. The West German Bundestag after 40 Years. West European Politics 13:68-89.
Samuels, David J., and Matthew S. Shugart. 2010. Presidents, Parties, and Prime Ministers: How the Separation of Powers Affects Party Organization and Behavior. Cambridge: Cambridge University Press.
Schonhardt-Bailey, Cheryl. 2003. Ideology, Party and Interests in the British Parliament of 1841-47. British Journal of Political Science 33:581-605.
Shepsle, Kenneth A. 1979. Institutional Arrangements and Equilibrium in Multidimensional Voting Models. American Journal of Political Science 23:27-59.
Shepsle, Kenneth A., and Barry R. Weingast. 1981. Structure Induced Equilibrium in Legislative Choice. Public Choice 37:509-519.
Shomer, Yael. 2009. Electoral Systems and Intra-Party Candidate Selection Effects on Legislators’ Behavior. Paper presented at the Annual Conference of the American Political Science Association, 3-6 September 2009, Toronto, Canada.
Shugart, Matthew S., and John M. Carey. 1992. Presidents and Assemblies: Constitutional Design and Electoral Systems. Cambridge: Cambridge University Press.
Skjaeveland, Asbjørn. 1999. A Danish Party Cohesion Cycle. Scandinavian Political Studies 22:121-136.
Skjaeveland, Asbjørn. 2001. Party Cohesion in the Danish Parliament. Journal of Legislative Studies 7:35-56.
Spirling, Arthur, and Iain McLean. 2007. UK OC OK? Interpreting Optimal Classification Scores for the U.K. House of Commons. Political Analysis 15:85-96.
Stjernquist, Nils, and Bo Bjurulf. 1970. Party Cohesion and Party Cooperation in the Swedish Parliament in 1964 and 1966. Scandinavian Political Studies 5:129-64.
Strøm, Kaare. 1990. Minority Government and Majority Rule. Cambridge: Cambridge University Press.
Strøm, Kaare, Wolfgang C. Muller, and Torbjorn Bergman, eds. 2011. Cabinets and Coalition Bargaining: The Democractic Life Cycle in Western Europe. Oxford: Oxford University Press.
Tsebelis, George. 1999. Veto Players and Law Production in Parliamentary Democracies: An Empirical Analysis. American Political Science Review 93:591-608.
Tsebelis, George. 2002. Veto Players: How Political Institutions Work. Princeton, NJ: Princeton University Press.
Wiesehomeier, Nina, and Kenneth Benoit. 2007 Parties and Presidents in Latin America. Dataset, Dublin: Trinity College.
Zucco, Cesar, and Timothy Power. 2009. Estimating Ideology of Brazilian Legislative Parties, 1990-2005. Latin American Research Review 44:218-246.
Zucco, Cesar, and Benjamin E. Lauderdale. 2011. Distinguishing Between Influences on Brazilian Legislative Behavior. Legislative Studies Quarterly 36:363-396.