Water Pollution arising from land containing chemical contaminants:

Report no. WST 6February 2009
Looking after all our water needs
technical seriesWaterScience
A baseline study of contaminants in the sediments of the Swan and Canning estuaries
Government of Western AustraliaDepartment of Water


A baseline study of contaminants in the sediments of the Swan and Canning estuaries
Department of Water
Water Science technical series report no. 6
February 2009

A baseline study of contaminants in the sediments of the Swan and Canning estuaries
ii Department of Water
Department of Water 168 St Georges Terrace Perth Western Australia 6000 Telephone +61 8 6364 7600 Facsimile +61 8 6364 7601 www.water.wa.gov.au
© Government of Western Australia 2009
February 2009
This work is copyright. You may download, display, print and reproduce this material in unaltered form only (retaining this notice) for your personal, non-commercial use or use within your organisation. Apart from any use as permitted under the Copyright Act 1968, all other rights are reserved. Requests and inquiries concerning reproduction and rights should be addressed to the Department of Water.
ISSN: 1836-2869 (print) ISSN: 1836-2877 (online)
ISBN: 978-1-921549-55-7 (print) ISBN: 978-1-921549-56-4 (online)
Acknowledgements
This project was funded by the Government of Western Australia through the Swan River Trust (SRT) with collaborative links to the Baigup Reserve Action Plan and the Natural Heritage Trust and National Action Plan for Salinity and Water Quality (NHT/NAP) funded project Tackling acid sulfate soils on the WA coast. The study was designed and this report written by H. Nice. Editorial review and technical advice was provided by M. Robb and S. Fisher. Sampling was conducted by numerous Water Science Branch staff. Maps were prepared by L. Riley. Figure 15 was prepared by K. Kilminster (symbols courtesy of the Integration and Application Network (ian.umces.edu/symbols/). Cover photo: Swan Estuary by D. Tracey.
Citation details
The recommended citation for this publication is:
Nice, HE 2009 A baseline study of contaminants in the sediments of the Swan and Canning estuaries, Water Science technical series report no. 6, Department of Water, Western Australia.
For more information about this study, contact Dr. H. Nice, Water Science Branch, Department of Water.

A baseline study of contaminants in the sediments of the Swan and Canning estuaries
Department of Water iii
Contents Summary .................................................................................................................................. v
1 Introduction..........................................................................................................................1
1.1 Background to the Non-Nutrient Contaminants Program (NNCP)............................................1 1.2 Scope of the overall NNCP .......................................................................................................2 1.3 Background to this study...........................................................................................................2 1.4 Objective of the study................................................................................................................3 1.5 Contaminant selection...............................................................................................................4 1.6 Application of guidelines ...........................................................................................................4
2 Methods...............................................................................................................................6
2.1 Site selection.............................................................................................................................6 2.2 Sampling procedure ..................................................................................................................9 2.3 Sediment parameters................................................................................................................9 2.4 Field parameters .....................................................................................................................11 2.5 Quality control .........................................................................................................................11 2.6 Data analysis...........................................................................................................................11
3 Results...............................................................................................................................12
3.1 Metals......................................................................................................................................14 3.2 Polycyclic aromatic hydrocarbons (PAHs) ..............................................................................19 3.3 Organochlorine (OC) pesticides..............................................................................................24 3.4 Physico-chemical data ............................................................................................................27
4 Discussion .........................................................................................................................29
4.1 Metal contaminants .................................................................................................................30 Metals of concern in the Swan Canning system ....................................................................................31 Other local studies, site history and potential contributing factors .........................................................33 The wider Australian context .................................................................................................................35 Specific application of the guidelines to metals in the NNCP.................................................................35
4.2 Organic contaminants .............................................................................................................36 PAHs .....................................................................................................................................................36 OC pesticides ........................................................................................................................................37 OC pesticides of concern in the Swan Canning system ........................................................................37 Other local studies, site history and potential contributing factors .........................................................38 The wider Australian context and overseas ...........................................................................................38 Specific application of the guidelines to organic contaminants in the NNCP .........................................39
4.3 Physico-chemical parameters.................................................................................................39 Particle size ...........................................................................................................................................39 Redox (Eh) ............................................................................................................................................39
5 Conclusions .......................................................................................................................40
6 Recommendations.............................................................................................................42
Appendix A – Salinity, pH and dissolved oxygen data ...........................................................44
Salinity ...............................................................................................................................................44 pH ..... ................................................................................................................................................44 Dissolved oxygen ..............................................................................................................................45
Appendix B - Background information on toxicity tests, bioaccumulation studies and ecological studies proposed ..............................................................................................46
References .............................................................................................................................48

A baseline study of contaminants in the sediments of the Swan and Canning estuaries
iv Department of Water
Figures Figure 1 Prioritisation of sites in the Swan Canning system..............................................................6 Figure 2 Sample sites.........................................................................................................................7 Figure 3 Median bioavailable zinc, mercury, lead and copper concentrations (mg/kg dry weight)
in sediments at 20 sites within the Swan Canning system. ...............................................15 Figure 4 Median bioavailable arsenic, cadmium, nickel and chromium concentrations (mg/kg
dry weight) in sediments at 20 sites within the Swan Canning system. ............................16 Figure 5 Median bioavailable selenium, manganese, aluminium and cobalt concentrations
(mg/kg dry weight) in sediments at 20 sites within the Swan Canning system. ................17 Figure 6 Median bioavailable iron concentrations (mg/kg dry weight) in sediments at 20 sites
within the Swan Canning system.......................................................................................18 Figure 7 Median Low Molecular Weight PAH concentrations (µg/kg dry weight normalised to
1% organic carbon) in sediments at 20 sites within the Swan Canning system................20 Figure 8 Median Low Molecular Weight PAH concentrations cont’d (µg/kg dry weight
normalised to 1% organic carbon) in sediments at 20 sites within the Swan Canning system................................................................................................................................21
Figure 9 Median High Molecular Weight PAH concentrations (µg/kg dry weight normalised to 1% organic carbon) in sediments at 20 sites within the Swan Canning system................22
Figure 10 Median High Molecular Weight PAH concentrations cont’d (µg/kg dry weight normalised to 1% organic carbon) in sediments at 20 sites within the Swan Canning system................................................................................................................................23
Figure 11 Median OC pesticide concentrations (µg/kg dry weight normalised to 1% organic carbon) in sediments at 20 sites within the Swan Canning system...................................25
Figure 12 Median aldrin concentration (µg/kg dry weight normalised to 1% organic carbon) in sediments at 20 sites within the Swan Canning system....................................................26
Figure 13 Sediment and water column redox potential (mV) at 20 sites within the Swan Canning system................................................................................................................................28
Figure 14 Prioritisation of sites in the Swan Canning system............................................................41 Figure 15 Conceptual diagram of recommended follow-up work in the Swan Canning system........43
Tables Table 1 Site selection........................................................................................................................3 Table 2 Guidelines applied and supporting information....................................................................5 Table 3 Site information. ...................................................................................................................8 Table 4 Sediment parameter information........................................................................................10 Table 5 Field parameters. ...............................................................................................................11 Table 6 Sites and corresponding Environmental Guideline and Environmental Quality
Standard information..........................................................................................................13 Table 7 Particle size analysis of sediment from each site. .............................................................27 Table 8 Prioritisation of sites...........................................................................................................30

A baseline study of contaminants in the sediments of the Swan and Canning estuaries
Department of Water v
Summary This baseline assessment of contaminants in the sediments of the Swan and Canning estuaries was a snapshot study conducted in November 2007 as part of the Non-Nutrient Contaminants Program (NNCP). Twenty sites were assessed for metals, organochlorine (OC) pesticides and polycyclic aromatic hydrocarbons (PAHs) bound to the surficial sediments (top 3cm). Both sites and contaminants were selected based on information generated from earlier components of the NNCP and other local studies.
Sites in this study were generally located downstream from stormwater drains and/or in the vicinity of disused waste disposal sites that were identified as priority areas in the previous phases of the NNCP (A baseline study of contaminants in the Swan and Canning catchment drainage system and A baseline study of contaminants in groundwater at disused waste disposal sites in the Swan Canning catchment).
Contaminants from all three groups were detected in the sediments across the 20 sites. Interim Sediment Quality Guidelines (ISQGs: Low and High Trigger Values - ANZECC & ARMCANZ 2000) were applied to the data and sites were prioritised into three categories (Priority 1, Priority 2 and Low Priority) based on the number of contaminants that exceeded guidelines and the level of the guideline exceeded. Figure 1 shows the spatial distribution of the three priority groups across the 20 sites monitored in the Swan Canning system.
The middle portion of the Swan River comprising Claisebrook, Maylands, Belmont Race Course, Burswood and Central Business District sites was the highest priority area along with the Bull Creek and the Lower Canning sites in the Canning River. Of these seven Priority 1 sites, Claisebrook was considered the most contaminated as the sediment concentrations were consistently the highest for all PAHs, all OC pesticides (except one); and among the highest for the metals targeted in this study. Additionally, the greatest number of ISQGs was exceeded for this site.
Prioritisation of the 20 sites in this way facilitates management decisions. Recommendations for further investigation have been made following the principles of the ANZECC and ARMCANZ Guidelines (2000). These comprise a combination of toxicity and/or in-situ bioaccumulation studies in the first instance for the Claisebrook site, followed by ecological investigations if relevant. Knowledge gained from the Claisebrook study can then be applied to the other Priority 1 and 2 sites using a targeted approach, specific to relevant contaminants and test organisms.
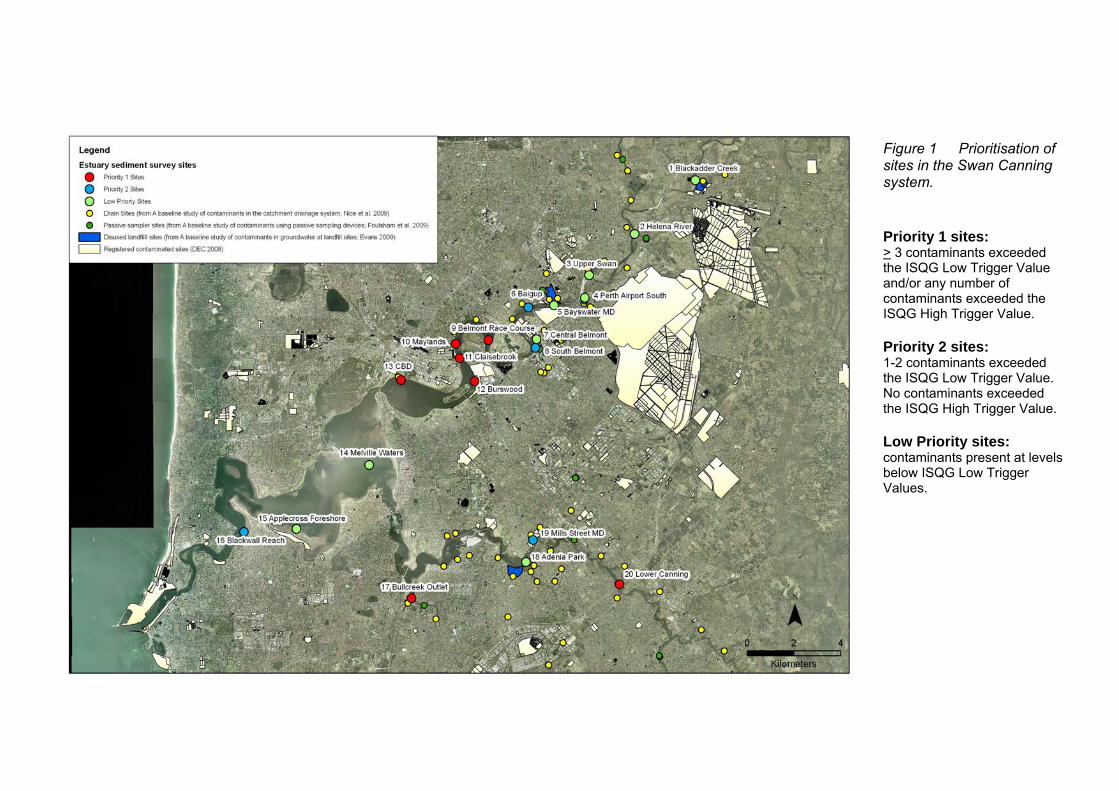
Figure 1 Prioritisation of sites in the Swan Canning system.
Priority 1 sites: > 3 contaminants exceeded the ISQG Low Trigger Value and/or any number of contaminants exceeded the ISQG High Trigger Value. Priority 2 sites: 1-2 contaminants exceeded the ISQG Low Trigger Value. No contaminants exceeded the ISQG High Trigger Value. Low Priority sites: contaminants present at levels below ISQG Low Trigger Values.

A baseline study of contaminants in the sediments of the Swan and Canning estuaries
Department of Water 1
1 Introduction
1.1 Background to the Non-Nutrient Contaminants Program (NNCP)
The Non-Nutrient Contaminants Program (NNCP) was a three year project to determine the nature of contaminants (other than nutrients) delivered to and present in the Swan Canning system. The Swan Canning system comprises the Swan and Canning rivers and estuaries. Non-nutrient contaminants assessed as part of this program included pathogens, heavy metals, low-level persistent organic compounds such as pesticides and herbicides, polycyclic aromatic hydrocarbons (PAHs), polychlorinated biphenyls (PCBs) and anionic surfactants.
The need to conduct a ‘non-nutrient’ assessment of contaminants within the system was identified by earlier Swan River Trust (SRT) programs and investigations conducted by the Water and Rivers Commission operating within the Department of Environment (DoE) during the period 1990 - 1999. In 1999 the SRT established the Swan Canning Cleanup Program (SCCP) to reduce nutrient loads entering the Swan Canning system. The aim was to reduce the extent and frequency of algal blooms. Contaminants other than nutrients were not a focus of this program.
The SCCP Action Plan (SRT 1999a) and the SCCP review of contaminants in the Swan Canning system (SRT 1999b) recommended an assessment of non-nutrient contaminants within the Swan Canning system itself (the receiving environment), within existing drainage networks that discharge directly to the Swan Canning system; and in groundwater from disused waste disposal sites adjacent to the Swan Canning system’s waterways and drains.
Major findings from the 1999 SCCP review of contaminants in the Swan Canning system (SRT 1999b) were that metal data in water, sediment and biota were spatially and temporally irregular. Data were also found to be compromised by inconsistent sampling and analysis methods and unsuitable limits of reporting. In addition, there was a paucity of data for persistent organic compounds such as pesticides, herbicides, PAHs and PCBs within the Swan Canning system.
The need for a more comprehensive understanding of the non-nutrient component of contaminants both within and entering the Swan Canning system was also highlighted by subsequent drainage impact studies conducted by the Water and Rivers Commission (operating as the DoE) in relation to fish kills in the vicinity of drain outfalls to the Swan Canning system (DoE 2003a; DoE 2003b). As such, the NNCP was developed to measure contaminants other than nutrients in the estuaries, rivers and drains of the Swan Canning system to complement existing nutrient-focused monitoring.

A baseline study of contaminants in the sediments of the Swan and Canning estuaries
2 Department of Water
1.2 Scope of the overall NNCP The Non-Nutrient Contaminants Program (NNCP) was a three year program that commenced in January 2006. The objective of the overall program was:
To determine the nature (types, concentrations and spatial variability) of non-nutrient contaminants delivered to and present in the Swan Canning system.
The NNCP comprised a series of studies:
A baseline study of contaminants in the Swan and Canning catchment drainage system (Nice et al. 2009),
A baseline study of contaminants in groundwater at disused waste disposal sites in the Swan Canning catchment (Evans 2009),
A baseline study of organic contaminants in the Swan and Canning catchment drainage system using passive sampling devices (Foulsham et al. 2009),
A baseline study of contaminants in the sediments of the Swan and Canning estuaries (this study).
1.3 Background to this study A Baseline Study of Contaminants in the Swan and Canning Catchment Drainage System (Nice et al. 2009) identified and quantified a range of contaminants entering the Swan Canning receiving environment through the drainage system. From this baseline information, subcatchments of potential concern were identified and prioritised for further investigation. The prioritisation of subcatchments was based on the number of parameters that exceeded guidelines and/or where concentrations were consistently high, in addition to the potential for ecological harm based on the type of parameter.
In addition, the parallel study A baseline study of contaminants in groundwater at disused waste disposal sites in the Swan Canning catchment (Evans 2009) showed that some metals and PAHs were present in groundwater associated with these sites at levels that warranted further investigation in the adjacent estuarine environment.
As such, it was decided to perform a spatial assessment of the sediments within the Swan Canning system downstream from the high-priority stormwater drains and adjacent to the three disused waste disposal sites. An additional five sites were selected based on historic data (for example, DoW 2007b; City of Bayswater 2004) and to provide a relatively even spread throughout the system. The 20 sites selected and the rationale for their inclusion in this assessment is provided in Table 1.

A baseline study of contaminants in the sediments of the Swan and Canning estuaries
Department of Water 3
Table 1 Site selection.
Site name Reason for inclusion
Helena River
Lower Canning
Upper Swan
Mills Street Main Drain
Central Belmont Main Drain
Maylands
Identified as Priority 1 sites in A baseline study of contaminants in the Swan and Canning catchment drainage system (Nice et al. 2009).
Blackadder Creek Identified as a Priority 1 site in A baseline study of contaminants in the Swan and Canning catchment drainage system (Nice et al. 2009). Also adjacent to the Woodbridge Riverside Park disused waste disposal site where metal and PAH concentrations in the groundwater exceeded guidelines (Evans 2009).
Bayswater Main Drain
Identified as a Priority 2 site in A baseline study of contaminants in the Swan and Canning catchment drainage system (Nice et al. 2009). Also adjacent to Bayswater Riverside Gardens disused waste disposal site where metal concentrations in the groundwater exceeded guidelines (Evans 2009).
South Belmont
Central Business District
Perth Airport South
Bull Creek
Identified as Priority 2 and 3 sites in A baseline study of contaminants in the Swan and Canning catchment drainage system (Nice et al. 2009).
Adenia Park
Adjacent to Bicentennial Adenia Park disused waste disposal site where metal concentrations in the groundwater exceeded guidelines (Evans 2009).
Baigup Adjacent to Baigup Reserve, a known acid sulphate site with suspected estuarine impact (City of Bayswater 2004).
Claisebrook Adjacent to registered Contaminated Site (Contaminated Site ID: 110; DEC 2008).
Belmont Adjacent to extensive lawns of Belmont racecourse (potential site for pesticide runoff).
Burswood Adjacent to registered Contaminated Sites (Site IDs: 76 & 1705; DEC 2008) and golf course (potential site for pesticide runoff).
Blackwall Reach High mercury concentrations have been recorded in the sediments at this site (DoW 2007b).
Applecross Adjacent to a disused waste disposal site.
Melville Waters Included to provide an even spatial distribution of sites in the lower Swan portion of the system.
1.4 Objective of the study The baseline study of contaminants in the sediments of the Swan and Canning estuaries is one component of the overall Non-Nutrient Contaminants Program. The objective of this study was:
To determine the nature (type, concentration and spatial variability) of non-nutrient contaminants present in the sediments of the Swan Canning system.
A baseline study of contaminants in the sediments of the Swan and Canning estuaries
4 Department of Water
1.5 Contaminant selection Representatives from the following contaminant groups were selected for analyses within sediment samples:
metals (bioavailable)
polycyclic aromatic hydrocarbons (PAHs)
organochlorine pesticides (OC pesticides)
These contaminant groups were selected based on their occurrence within the sediments of Priority Sites from A baseline study of contaminants in the Swan and Canning catchment drainage system (Nice et al. 2009), information from other DoW studies (for example, DoW 2007b) and their relative toxicity to organisms inhabiting the benthic environment.
Bioavailable metal concentrations were determined using a dilute acid extraction at a 50:1 sediment:acid ratio in order to more closely represent the concentration of metals that would be available to biota in contact with the sediment (Simpson et al. 2005). This method provides more meaningful information regarding the risk that these metals may pose to aquatic life than the concentrated acid extraction used to determine total metal concentrations.
1.6 Application of guidelines Data were compared to the Australian and New Zealand Environment and Conservation Council and Agriculture and Resource Management Council of Australia and New Zealand (ANZECC & ARMCANZ 2000) Interim Sediment Quality Guideline Trigger Values (ISQGs). At the request of the SRT, data were also compared to Cockburn Sound Environmental Quality Criteria for the protection of marine ecosystems (EPA 2005a) to provide an additional level of information within a local south-west Western Australian context. Table 2 summarises the guidelines and their application and limitations within this study.

Table 2 Guidelines applied and supporting information.
Parameter Guidelines selected Application and limitations of guidelines applied
1. Australian and New Zealand Environment and Conservation Council (ANZECC) and Agriculture and Resource Management Council of Australia and New Zealand (ARMCANZ) (2000): Interim Sediment Quality Guideline Trigger Values: Low and High.
(ANZECC & ARMCANZ 2000).
1. Interim Sediment Quality Guideline (ISQG) – Low or Low Trigger Value is a threshold concentration. Below this concentration the frequency of adverse biological effects is expected to be very low.
ISQG – High or High Trigger Value is intended to represent a concentration above which, adverse biological effects are expected to occur more frequently.
Bioavailable Metals, OC Pesticides and PAHs: median concentrations were compared to Trigger Values. Adverse biological effects will not necessarily occur in the sediments if Trigger Values are exceeded. However, further investigations should be undertaken (ANZECC & ARMCANZ 2000).
For OC pesticides and PAHs, data were normalised to 1% organic carbon prior to comparison with the guidelines (according to Simpson et al. 2005).
Contaminants in sediments:
Metals (bioavailable)
Organochlorine (OC) pesticides
Polycyclic aromatic hydrocarbons (PAHs)
2. Cockburn Sound Environmental Quality Criteria for protecting the marine ecosystem from the effects of toxicants in sediments (2003-2004): Environmental Quality Standards for High and Moderate Protection.
(EPA 2005a)
2. Environmental Quality Standard for High protection:
Bioavailable metals: The 80th percentile concentration from the defined sampling area should not exceed the Environmental Quality Guidelines (ISQG Trigger Values).
OC pesticides and PAHs: The median concentration from the defined sampling area should not exceed the Environmental Quality Guidelines (ISQG Trigger Values).
Environmental Quality Standard for Moderate protection:
Bioavailable metals: The median concentration from the defined sampling area should not exceed the Environmental Quality Guidelines (ISQG Trigger Values).
OC pesticides and PAHs: The 40th percentile concentration from the defined sampling area should not exceed the Environmental Quality Guidelines (ISQG Trigger Values).
Note: Cockburn Sound Environmental Quality Standards were applied to the data at the request of the SRT to provide an additional level of information regarding the health of a particular site within a local South West Western Australian context (these standards were developed for the Cockburn Sound, a protected body of coastal water, also in the Perth region). These standards were compared to the data (Results Section of this report), but no detailed interpretation has been provided in relation to them because they were designed for comparison with predefined zones consisting of a minimum of 3-5 sites. In the current study, the standards were compared to single sites (comprising 5 replicates).
Note: for individual contaminants where ISQGs have not yet been established, alternative guidelines were applied: Canadian Sediment Quality Guidelines (Canadian Council of Ministers of the Environment 2002) and Ontario Sediment Quality Guidelines (Ontario Ministry of Environment and Energy 1993).

A baseline study of contaminants in the sediments of the Swan and Canning estuaries
6 Department of Water
2 Methods
2.1 Site selection Twenty sites were selected throughout the Swan Canning system as displayed in Figure 2 and detailed in Table 3.

Figure 2 Sample sites
A baseline study of contaminants in the sediments of the Swan and Canning estuaries
8 Department of Water
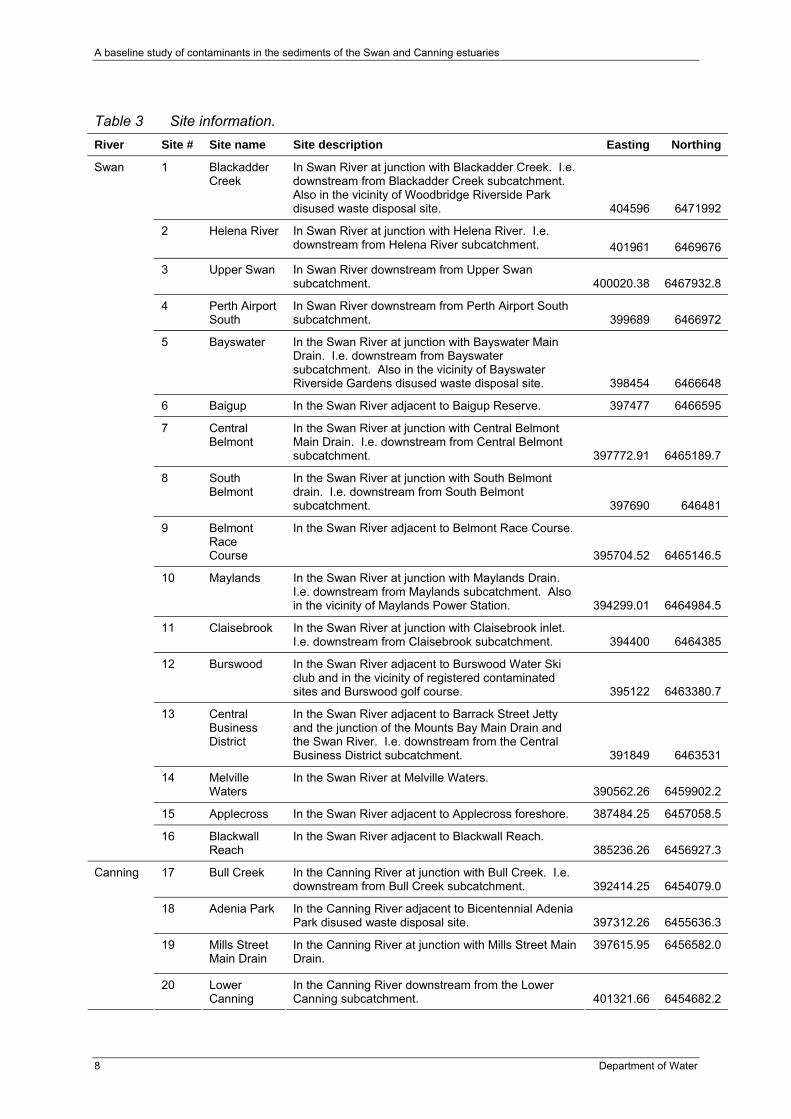
Table 3 Site information.
River Site # Site name Site description Easting Northing
1 Blackadder Creek
In Swan River at junction with Blackadder Creek. I.e. downstream from Blackadder Creek subcatchment. Also in the vicinity of Woodbridge Riverside Park disused waste disposal site.
404596 6471992
2 Helena River In Swan River at junction with Helena River. I.e. downstream from Helena River subcatchment. 401961 6469676
3 Upper Swan In Swan River downstream from Upper Swan subcatchment. 400020.38 6467932.8
4 Perth Airport South
In Swan River downstream from Perth Airport South subcatchment. 399689 6466972
5 Bayswater In the Swan River at junction with Bayswater Main Drain. I.e. downstream from Bayswater subcatchment. Also in the vicinity of Bayswater Riverside Gardens disused waste disposal site.
398454 6466648
6 Baigup In the Swan River adjacent to Baigup Reserve. 397477 6466595
7 Central Belmont
In the Swan River at junction with Central Belmont Main Drain. I.e. downstream from Central Belmont subcatchment. 397772.91 6465189.7
8 South Belmont
In the Swan River at junction with South Belmont drain. I.e. downstream from South Belmont subcatchment. 397690 646481
9 Belmont Race Course
In the Swan River adjacent to Belmont Race Course.
395704.52 6465146.5
10 Maylands In the Swan River at junction with Maylands Drain. I.e. downstream from Maylands subcatchment. Also in the vicinity of Maylands Power Station. 394299.01 6464984.5
11 Claisebrook In the Swan River at junction with Claisebrook inlet. I.e. downstream from Claisebrook subcatchment. 394400 6464385
12 Burswood In the Swan River adjacent to Burswood Water Ski club and in the vicinity of registered contaminated sites and Burswood golf course. 395122 6463380.7
13 Central Business District
In the Swan River adjacent to Barrack Street Jetty and the junction of the Mounts Bay Main Drain and the Swan River. I.e. downstream from the Central Business District subcatchment. 391849 6463531
14 Melville Waters
In the Swan River at Melville Waters. 390562.26 6459902.2
15 Applecross In the Swan River adjacent to Applecross foreshore. 387484.25 6457058.5
Swan
16 Blackwall Reach
In the Swan River adjacent to Blackwall Reach. 385236.26 6456927.3
17 Bull Creek In the Canning River at junction with Bull Creek. I.e. downstream from Bull Creek subcatchment. 392414.25 6454079.0
18 Adenia Park In the Canning River adjacent to Bicentennial Adenia Park disused waste disposal site. 397312.26 6455636.3
19 Mills Street Main Drain
In the Canning River at junction with Mills Street Main Drain.
397615.95
6456582.0
Canning
20 Lower Canning
In the Canning River downstream from the Lower Canning subcatchment. 401321.66 6454682.2

A baseline study of contaminants in the sediments of the Swan and Canning estuaries
Department of Water 9
2.2 Sampling procedure In summary, five replicate samples were taken at each site at positions randomly selected within a 10 m x 10 m area. Each replicate sample comprised 5 composite samples (collected from each corner and the centre of a 1 m x 1 m quadrat), according to the Cockburn Sound Manual of Standard Operating Procedures (EPA 2005b).
Sediment cores were collected by divers using PerspexTM corers of 9.5 cm internal diameter. The top 3 cm of each core was composited in the field for chemical analysis in the laboratory. Homogenisation was conducted within a controlled environment at the laboratory in accordance with method: AS 4482.1-1997 (Standards Australia, 1997). A sixth composited sample was collected from each site for particle size analyses.
A detailed account of the sampling procedure is provided in the Sampling and Analysis Plan – Non-Nutrient Contaminants Program: Swan and Canning Estuary Sediment Survey (DoW 2007a).
2.3 Sediment parameters Table 4 lists the parameters that were measured within the sediment at the laboratory and the associated methods and limits of reporting.

A baseline study of contaminants in the sediments of the Swan and Canning estuaries
10 Department of Water
Table 4 Sediment parameter information.
Parameter Description Analysis method Limit of reporting
Particle size analysis Determination of the particle size distribution of sediment. Particles grouped into the following size classes according to the Wentworth scale: <4 µm (clay) <62 µm (silt) <250 µm (fine sand) <500 µm (medium sand) <2,000 µm (coarse sand) <10,000 µm (gravel)
Sieving followed by laser diffraction (Mudroch et al. 1997).
n/a
Moisture content Determination of the percentage of water present in the sediment sample.
Gravimetric measurement of weight loss. n/a
Bioavailable metals
Measurement of bioavailable metals suite: Al, As, Cd, Co, Cr, Cu, Fe, Hg, Mn, Ni, Pb, Se, Zn Units: mg/kg dry sediment.
Analysis of dried sediment sample for a range of metals using a cold dilute acid extraction (0.5-1.0 M hydrochloric acid in a sediment:acid ratio of 1:50 for 1 hour - according to ANZECC & ARMCANZ 2000).
Lowest available (0.2 mg/kg for mercury; 0.5 mg/kg for other metals)
Polycyclic aromatic hydrocarbons (PAHs)
Measurement of PAH suite: Naphthalene Acenaphthylene Acenaphthene Fluorene Phenanthrene Anthracene Fluoranthene Pyrene Benz[a]anthracene Chrysene Benzo[b]and[k]fluoranthene Benzo[a]pyrene Indeno[1,2,3-cd]pyrene Dibenz[ah]anthracene Benzo[ghi]perylene Units: mg/kg dry sediment.
GC-MS, GC-FID analysis (USEPA 8080/8140 1983, 1996e; APHA 1998).
Lowest available (0.01 mg/kg)
Organochlorine (OC) pesticides
Measurement of OC pesticide suite: HCB HCH(BHC) Lindane (gamma-BHC) Heptachlor Heptachlor Epoxide Chlordane Alpha Endosulphan Beta Endosulphan Endosulphan Sulphate Aldrin Dieldrin Endrin DDE-p,p DDD-p,p DDT-p,p Methoxychlor Total OCs Units: mg/kg dry sediment.
GC-MS, GC-ECD analysis (USEPA 8080/8140 1983, 1996e; APHA 1998).
Lowest available (0.01 mg/kg)
Total organic carbon (TOC)
Measurement of TOC within the sediments. Required for normalisation of organic compound data to 1% organic carbon in accordance with guidelines (ANZECC & ARMCANZ 2000). Units: mg/kg dry sediment.
n/a

A baseline study of contaminants in the sediments of the Swan and Canning estuaries
Department of Water 11
2.4 Field parameters Table 5 lists the parameters that were measured in the field at the time of sample collection. These parameters were measured once at each site.
Table 5 Field parameters.
Parameter Method (instrument) Type of sample
Redox potential in sediment IJ64 IONODE redox electrode
sediment (top 3 cm)
Redox potential in water column
Hydrolab MS5 water column (5-20cm above sediment surface) according to Simpson et al. 2005.
Dissolved oxygen in water column Hydrolab MS5 water column (5-20cm above sediment surface) according to Simpson et al. 2005.
pH in water column Hydrolab MS5 water column (5-20cm above sediment surface) according to Simpson et al. 2005.
2.5 Quality control Each batch of samples included one duplicate sample in every ten (randomly selected), one blank matrix test per batch of samples and one recovery from a blank reagent. Quality control and field blank results were reviewed to confirm data integrity.
2.6 Data analysis Contaminant data from all sites were graphed and compared to the most appropriate guidelines available, the ANZECC and ARMCANZ: Interim Sediment Quality Guideline Trigger Values (ANZECC & ARMCANZ 2000). Data were also compared to Cockburn Sound Environmental Quality Criteria for protection of marine ecosystems (EPA 2005a). Refer to Section 1.6 - Application of Guidelines.
Bioavailable metal data are presented as median concentrations. Bars indicate the data range and boxes indicate the 20th - 80th percentile range.
PAH and OC pesticide data (dry weight normalised to 1% organic carbon according to ANZECC & ARMCANZ 2000) were presented as median concentrations. Bars indicate the data range and boxes indicate the 40th - 60th percentile range.
The percentile ranges were selected according to the Cockburn Sound Manual of Standard Operating Procedures (EPA 2005b) for these contaminants so that data could also be compared to the Cockburn Sound Environmental Quality Standards (EQSs).

A baseline study of contaminants in the sediments of the Swan and Canning estuaries
12 Department of Water
3 Results In summary, contaminants from each of the three groups, bioavailable metals, PAHs and OC pesticides were detected in the sediments sampled in this study. Guidelines were exceeded and EQSs were not met for some contaminants at some sites. This information is summarised in Table 6 and presented in Figures 3 to 12.

A baseline study of contaminants in the sediments of the Swan and Canning estuaries
Department of Water 13
Table 6 Sites and corresponding Environmental Guideline and Environmental Quality Standard information.
Site code
Site name Contaminants that exceed ISQG Low
Contaminants that exceed ISQG High
Contaminants that exceed an alternative guideline *
EQS for Moderate Protection was not met for the following contaminants:
EQS for High Protection was not met for the following contaminants:
1 Blackadder Creek
2 Helena River
3 Upper Swan
4 Perth Airport South
5 Bayswater
6 Baigup dieldrin manganese dieldrin zinc dieldrin
7 Central Belmont
8 South Belmont
dieldrin dieldrin dieldrin
9 Belmont Race Course
zinc lead dieldrin
zinc lead dieldrin
zinc lead dieldrin
10 Maylands zinc lead DDE-p,p dieldrin
zinc lead dieldrin
zinc, lead, DDE-p,p dieldrin
11 Claisebrook zinc lead copper DDE-p,p dieldrin,
zinc zinc lead copper DDE-p,p dieldrin
zinc lead copper DDE-p,p Dieldrin
12 Burswood zinc lead dieldrin
zinc lead dieldrin
zinc lead dieldrin
13 Central Business District
zinc lead
zinc zinc lead
zinc lead
14 Melville Waters
15 Applecross
16 Blackwall Reach
mercury lead
mercury lead
mercury lead
17 Bull Creek zinc mercury lead
selenium zinc mercury lead
zinc mercury lead
18 Adenia Park
19 Mills Street zinc lead
zinc lead
zinc lead
20 Lower Canning
zinc lead
selenium zinc lead
zinc lead
* Alternative guideline applied only for contaminants for which no ANZECC guideline is established.

A baseline study of contaminants in the sediments of the Swan and Canning estuaries
14 Department of Water
3.1 Metals Bioavailable metal data are presented for 20 sites in Figures 3 to 6 and a summary of metal data provided below.
Summary
Most metals targeted by the analyses were reported at the majority of sites. However, mercury was reported only at Blackwall Reach, Bull Creek and Mills Street. Cadmium was reported only at Baigup, Central Business District, Bull Creek and Mills Street.
Concentrations of metals in the sediments were generally highly variable.
ISQGs were exceeded and/or EQSs were not met for zinc at the following sites: Baigup, Belmont Race Course, Maylands, Claisebrook, Burswood, Central Business District, Bull Creek, Mills Street and Lower Canning.
ISQGs were exceeded and/or EQSs were not met for lead at the following sites: Belmont Race Course, Maylands, Claisebrook, Burswood, Central Business District, Blackwall Reach, Bull Creek, Mills Street and Lower Canning.
ISQGs were exceeded and/or EQSs were not met for copper at Claisebrook only.
ISQGs were exceeded and/or EQSs were not met for mercury at Blackwall Reach and Bull Creek.
In the absence of ISQGs and Cockburn Sound EQSs for manganese and selenium, alternative guidelines were applied and were exceeded for manganese at Baigup and for selenium at Bull Creek and Lower Canning.

Figure 3 Median bioavailable zinc, mercury, lead and copper concentrations (mg/kg dry weight) in sediments at 20 sites within the Swan Canning system. Sites 1-16: Swan sites; Sites 17-20: Canning sites. Bars indicate data range; box indicates 20th - 80th percentile range. ISQG Low: Trigger Value for adverse biological effects; ISQG High: adverse biological effects expected to occur more frequently.
1 2 3 4 5 6 7 8 9 10 11 12 13 14 15 16 17 18 19 20
Site code
0
100
200
300
400
500
600
Zin
c
ISQG Low : 200 mg/kg
ISQG High: 410 mg/kg
1 2 3 4 5 6 7 8 9 10 11 12 13 14 15 16 17 18 19 20
Site code
0.0
0.2
0.4
0.6
0.8
1.0
1.2
1.4
Mer
cury
ISQG Low : 0.15 mg/kg
ISQG High: 1 mg/kg
1 2 3 4 5 6 7 8 9 10 11 12 13 14 15 16 17 18 19 20
Site code
0
20
40
60
80
100
120
140
160
180
Lead
ISQG Low : 50 mg/kg
(ISQG High: 220 mg/kg)
1 2 3 4 5 6 7 8 9 10 11 12 13 14 15 16 17 18 19 20
Site code
0
10
20
30
40
50
60
70
80
Cop
per
(ISQG High: 270 mg/kg)
ISQG Low : 65 mg/kg

Figure 4 Median bioavailable arsenic, cadmium, nickel and chromium concentrations (mg/kg dry weight) in sediments at 20 sites within the Swan Canning system. Sites 1-16: Swan sites; Sites 17-20: Canning sites. Bars indicate data range; box indicates 20th - 80th percentile range. ISQG Low: Trigger Value for adverse biological effects; ISQG High: adverse biological effects expected to occur more frequently.
1 2 3 4 5 6 7 8 9 10 11 12 13 14 15 16 17 18 19 20
Site code
0.0
0.1
0.2
0.3
0.4
0.5
0.6
0.7
Cad
miu
m
(ISQG High: 10 mg/kg)
(ISQG Low : 1.5 mg/kg)
1 2 3 4 5 6 7 8 9 10 11 12 13 14 15 16 17 18 19 20
Site code
0
2
4
6
8
10
12
14
16
18
20
22
24
Chr
omiu
m
(ISQG High: 370 mg/kg)
(ISQG Low : 80 mg/kg)
1 2 3 4 5 6 7 8 9 10 11 12 13 14 15 16 17 18 19 20
Site code
0
2
4
6
8
10
12
14
Ars
enic
(ISQG High: 70mg/kg)
(ISQG Low : 20 mg/kg)
1 2 3 4 5 6 7 8 9 10 11 12 13 14 15 16 17 18 19 20
Site code
0
1
2
3
4
5
6
7
8
9
Nic
kel
(ISQG High: 52 mg/kg)
(ISQG Low : 21 mg/kg)

Figure 5 Median bioavailable selenium, manganese, aluminium and cobalt concentrations (mg/kg dry weight) in sediments at 20 sites within the Swan Canning system. Sites 1-16: Swan sites; Sites 17-20: Canning sites. Bars indicate data range; box indicates 20th - 80th percentile range. ANZECC ISQGs do not currently exist for selenium, manganese, aluminium, and cobalt. Alternative guidelines have been provided.
1 2 3 4 5 6 7 8 9 10 11 12 13 14 15 16 17 18 19 20
Site code
0
2
4
6
8
10
Cob
alt
(Ontario Sediment Quality Guideline severe effect level = 50 mg/kg)
1 2 3 4 5 6 7 8 9 10 11 12 13 14 15 16 17 18 19 20
Site code
0
1000
2000
3000
4000
5000
6000
Alu
min
ium
(Canadian Sediment Quality Guideline: 15,900 mg/kg)
1 2 3 4 5 6 7 8 9 10 11 12 13 14 15 16 17 18 19 20
Site code
0.0
0.5
1.0
1.5
2.0
2.5
3.0
3.5
4.0
4.5
Sel
eniu
m
Low Hazard concentration: 2-3 mg/kg(Lemly, 1996)
Moderate Hazard conentration: 3-4 mg/kg(Lemly, 1996)
1 2 3 4 5 6 7 8 9 10 11 12 13 14 15 16 17 18 19 20
Site code
0
100
200
300
400
500
600
700
800
900
Man
gane
se
Ontario Sediment QualityGuideline low est effect level = 460 mg/kg
(Ontario Sediment Quality Guideline severe effect level = 1100 mg/kg)

1 2 3 4 5 6 7 8 9 10 11 12 13 14 15 16 17 18 19 20
Site code
0
5000
10000
15000
20000
25000
30000
35000
Iron
no gudieline available
Figure 6 Median bioavailable iron concentrations (mg/kg dry weight) in sediments at 20 sites within the Swan Canning system. Sites 1-16:
Swan sites; Sites 17-20: Canning sites. Bars indicate data range; box indicates 20th - 80th percentile range. Guidelines do not currently exist for iron.

A baseline study of contaminants in the sediments of the Swan and Canning estuaries
Department of Water 19
3.2 Polycyclic aromatic hydrocarbons (PAHs) Polycyclic aromatic hydrocarbon (PAH) data are presented for 20 sites in Figures 7 to 10. A summary is provided below.
Summary
Each of the individual PAH compounds targeted by the analyses were reported across the sites.
Concentrations of PAHs in the sediments were generally highly variable.
Claisebrook consistently had the highest PAH concentrations.
Generally, those sites located downstream and nearest to Claisebrook i.e. Maylands, Burswood and Central Business District in the middle portion of the Swan River also consistently had higher concentrations of each of the individual PAHs compared with the lower and upper reaches of the Swan. An exception was Blackwall Reach (the lowermost site in the Swan), which also had higher concentrations compared with other sites.
Despite higher concentrations at and downstream from the Claisebrook site, the ISQGs were not exceeded and the EQSs were met.
The Canning sites had relatively low concentrations of PAHs. However, the Lower Canning site had one sample (out of the five) with comparatively high concentrations of several PAHs (e.g. Phenanthrene).

Low molecular weight PAHs
Figure 7 Median Low Molecular Weight PAH concentrations (µg/kg dry weight normalised to 1% organic carbon) in sediments at 20 sites within the Swan Canning system. Sites 1-16: Swan sites; Sites 17-20: Canning sites. Bars indicate data range; box indicates 40th - 60th percentile range. ISQG Low: Trigger Value for adverse biological effects; ISQG High: adverse biological effects expected to occur more frequently.
1 2 3 4 5 6 7 8 9 10 11 12 13 14 15 16 17 18 19 20
Site code
0
50
100
150
200
250
300
350
sum
of L
MW
PA
Hs
(ISQG High: 3160 ug/kg)
(ISQG Low : 552 ug/kg)
1 2 3 4 5 6 7 8 9 10 11 12 13 14 15 16 17 18 19 20
Site code
0
10
20
30
40
50
60
70
80
90
Ace
naph
thal
ene
ISQG Low : 44 ug/kg
(ISQG High: 640 ug/kg)
1 2 3 4 5 6 7 8 9 10 11 12 13 14 15 16 17 18 19 20
Site code
0
2
4
6
8
10
12
14
16
18
Ace
napt
hene
ISQG Low : 16 ug/kg
(ISQG High: 500 ug/kg)
1 2 3 4 5 6 7 8 9 10 11 12 13 14 15 16 17 18 19 20
Site code
0
10
20
30
40
50
60
70
Ant
hrac
ene
(ISQG High: 1100 ug/kg)
(ISQG Low : 85 ug/kg)

1 2 3 4 5 6 7 8 9 10 11 12 13 14 15 16 17 18 19 20
Site code
0
2
4
6
8
10
12
14
16
18
Flu
oren
e
(ISQG High: 540 ug/kg)
(ISQG Low : 19 ug/kg)
1 2 3 4 5 6 7 8 9 10 11 12 13 14 15 16 17 18 19 20
Site code
0
5
10
15
20
25
30
35
40
45
Nap
thal
ene
(ISQG High: 2100 ug/kg)
(ISQG Low : 160 ug/kg)
1 2 3 4 5 6 7 8 9 10 11 12 13 14 15 16 17 18 19 20
Site code
0
10
20
30
40
50
60
70
80
90
100
Phe
nant
hren
e
(ISQG High: 1500 ug/kg)
(ISQG Low : 240 ug/kg)
Figure 8 Median Low Molecular Weight PAH concentrations cont’d (µg/kg dry weight normalised to 1% organic carbon) in sediments at 20 sites within the Swan Canning system. Sites 1-16: Swan sites; Sites 17-20: Canning sites. Bars indicate data range; box indicates 40th - 60th percentile range. ISQG Low: Trigger Value for adverse biological effects; ISQG High: adverse biological effects expected to occur more frequently.

1 2 3 4 5 6 7 8 9 10 11 12 13 14 15 16 17 18 19 20
Site code
0
200
400
600
800
1000
1200
1400
1600
1800
sum
of H
MW
PA
Hs
(ISQG High: 9600 ug/kg)
ISQG Low : 1700 ug/kg
1 2 3 4 5 6 7 8 9 10 11 12 13 14 15 16 17 18 19 20
Site code
0
20
40
60
80
100
120
140
160
Ben
zo(a
)ant
hrac
ene
(ISQG High: 1600 ug/kg)
(ISQG Low : 261 ug/kg)
1 2 3 4 5 6 7 8 9 10 11 12 13 14 15 16 17 18 19 20
Site code
0
20
40
60
80
100
120
140
160
180
200
220
240
Ben
zo(a
)pyr
ene
(ISQG High:1600 ug/kg)
(ISPG Low : 430 ug/kg)
1 2 3 4 5 6 7 8 9 10 11 12 13 14 15 16 17 18 19 20
Site code
0
20
40
60
80
100
120
140
Chr
ysen
e
(ISQG High: 2800 ug/kg)
(ISQG Low : 384 ug/kg)
High Molecular Weight PAHs
Figure 9 Median High Molecular Weight PAH concentrations (µg/kg dry weight normalised to 1% organic carbon) in sediments at 20 sites within the Swan Canning system. Sites 1-16: Swan sites; Sites 17-20: Canning sites. Bars indicate data range; box indicates 40th - 60th percentile range. ISQG Low: Trigger Value for adverse biological effects; ISQG High: adverse biological effects expected to occur more frequently.

1 2 3 4 5 6 7 8 9 10 11 12 13 14 15 16 17 18 19 20
Site code
0
50
100
150
200
250
300
350
Ben
zo(b
)&(k
)flu
oran
then
e
Ontario Sediment Quality Guideline low est effect level = 240 ug/kg
(Ontario Sediment Quality Guidelinesevere effect level = 1340000 ug/kg)
1 2 3 4 5 6 7 8 9 10 11 12 13 14 15 16 17 18 19 20
Site code
0
20
40
60
80
100
120
140
160
180
200
220
240
260
Flu
oran
then
e
(ISQG High: 5100 ug/kg)
(ISQG Low : 600 ug/kg)
1 2 3 4 5 6 7 8 9 10 11 12 13 14 15 16 17 18 19 20
Site code
0
50
100
150
200
250
300
350
400
Pyr
ene
(ISQH High: 2600 ug/kg)
(ISQG Low : 665 ug/kg)
Figure 10 Median High Molecular Weight PAH concentrations cont’d (µg/kg dry weight normalised to 1% organic carbon) in sediments at 20 sites within the Swan Canning system. Sites 1-16: Swan sites; Sites 17-20: Canning sites. Bars indicate data range; box indicates 40th - 60th percentile range. ISQG Low: Trigger Value for adverse biological effects; ISQG High: adverse biological effects expected to occur more frequently. ANZECC ISQGs do not currently exist for Benzo(b)&(k)fluoranthene. An alternative guideline has been provided.

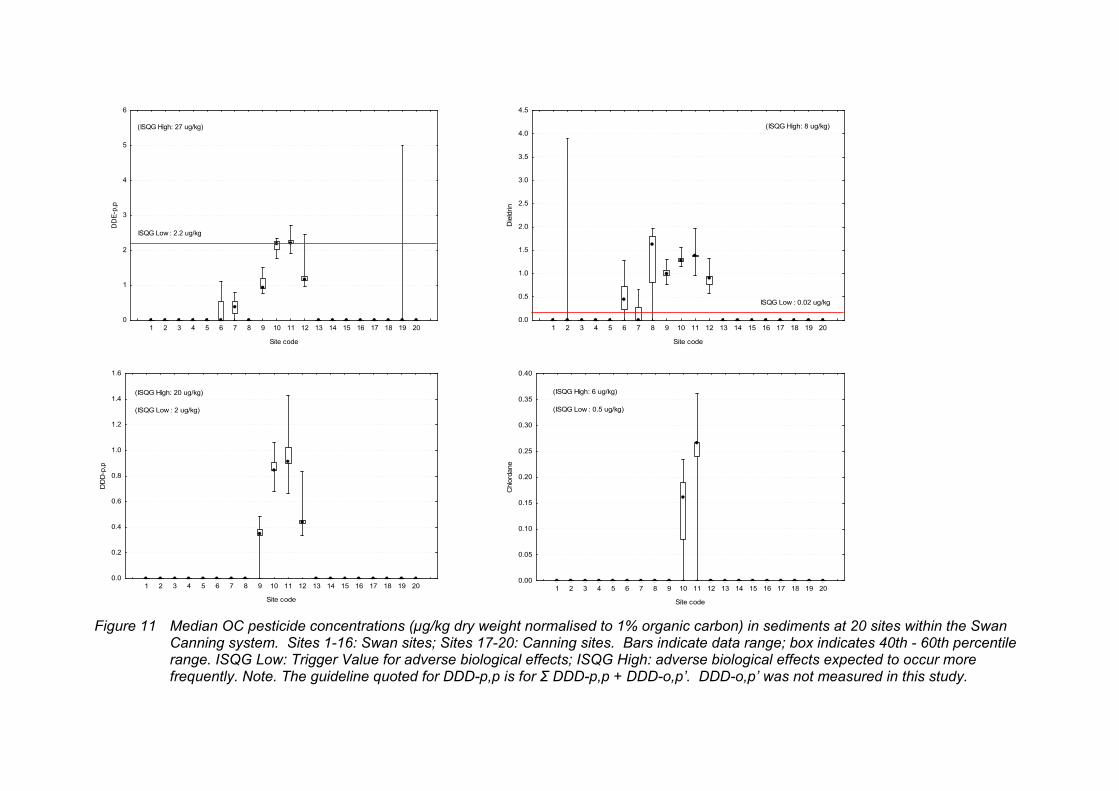
3.3 Organochlorine (OC) pesticides Organochlorine (OC) pesticide data are presented for 20 sites in Figures 11 and 12. A summary of OC pesticide data is provided below.
Summary
Of the suite of 16 OC pesticides targeted by the analyses, five were detected: DDE-p,p, DDD-p,p, dieldrin, chlordane and aldrin.
ISQGs were exceeded and EQSs were not met for dieldrin at Baigup, South Belmont, Belmont Race Course, Maylands, Claisebrook and Burswood.
ISQGs were exceeded and/or EQSs were not met for DDE-p,p at Maylands and Claisebrook.
Guidelines were not exceeded for DDD-p,p, chlordane and aldrin.
1 2 3 4 5 6 7 8 9 10 11 12 13 14 15 16 17 18 19 20
Site code
0.0
0.2
0.4
0.6
0.8
1.0
1.2
1.4
1.6
DD
D-p
,p
(ISQG High: 20 ug/kg)
(ISQG Low : 2 ug/kg)
1 2 3 4 5 6 7 8 9 10 11 12 13 14 15 16 17 18 19 20
Site code
0.00
0.05
0.10
0.15
0.20
0.25
0.30
0.35
0.40
Chl
orda
ne
(ISQG High: 6 ug/kg)
(ISQG Low : 0.5 ug/kg)
1 2 3 4 5 6 7 8 9 10 11 12 13 14 15 16 17 18 19 20
Site code
0
1
2
3
4
5
6D
DE
-p,p
ISQG Low : 2.2 ug/kg
(ISQG High: 27 ug/kg)
1 2 3 4 5 6 7 8 9 10 11 12 13 14 15 16 17 18 19 20
Site code
0.0
0.5
1.0
1.5
2.0
2.5
3.0
3.5
4.0
4.5
Die
ldrin
(ISQG High: 8 ug/kg)
ISQG Low : 0.02 ug/kg
Figure 11 Median OC pesticide concentrations (µg/kg dry weight normalised to 1% organic carbon) in sediments at 20 sites within the Swan Canning system. Sites 1-16: Swan sites; Sites 17-20: Canning sites. Bars indicate data range; box indicates 40th - 60th percentile range. ISQG Low: Trigger Value for adverse biological effects; ISQG High: adverse biological effects expected to occur more frequently. Note. The guideline quoted for DDD-p,p is for Σ DDD-p,p + DDD-o,p’. DDD-o,p’ was not measured in this study.

1 2 3 4 5 6 7 8 9 10 11 12 13 14 15 16 17 18 19 20
Site code
0.0
0.2
0.4
0.6
0.8
1.0
1.2
1.4
1.6
1.8
2.0
2.2
2.4
2.6
Ald
rin
Canadian Sediment QualityGuideline: 2ug/kg
Figure 12 Median aldrin concentration (µg/kg dry weight normalised to 1% organic carbon) in sediments at 20 sites within the Swan Canning system. Sites 1-16: Swan sites; Sites 17-20: Canning sites. Bars indicate data range; box indicates 40th - 60th percentile range. ANZECC ISQGs do not currently exist for aldrin. An alternative guideline has been provided.

A baseline study of contaminants in the sediments of the Swan and Canning estuaries
Department of Water 27
3.4 Physico-chemical data
Particle size
All sediment samples consisted of particles from all size categories. The dominant fraction was fine sand for the majority of sites. The exceptions were Blackadder Creek, Bayswater, Applecross and Adenia Park, which were dominated by coarse sand (Table 7).
Table 7 Particle size analysis of sediment from each site.
Clay (<4 µm)
Silt (4-62 µm)
Fine sand (62-250
µm)
Medium sand
(250-500 µm)
Coarse sand
(500-2000 µm)
Gravel (2000-
10000 µm)
Site code
Site name
Proportion of sediments (% by weight)
1 Blackadder Creek
1.94 4.57 22.25 0.54 53.50 17.20
2 Helena River 6.52 15.34 74.64 1.80 0.90 0.80
3 Upper Swan 6.39 15.03 73.12 1.76 3.50 0.20
4 Perth Airport South
6.55 15.42 75.02 1.81 0.90 0.30
5 Bayswater 1.19 2.81 13.67 0.33 81.70 0.30
6 Baigup 5.36 12.61 61.35 1.48 14.50 4.70
7 Central Belmont
6.27 14.75 71.75 1.73 5.30 0.20
8 South Belmont
4.12 9.69 47.15 1.14 37.40 0.50
9 Belmont Race Course
6.52 15.32 74.56 1.80 0.30 1.50
10 Maylands 6.48 15.23 74.11 1.79 1.20 1.20
11 Claisebrook 6.07 14.28 69.48 1.68 0.90 7.60
12 Burswood 5.83 13.70 66.67 1.61 0.50 11.70
13 Central Business District
5.87 13.81 67.20 1.62 7.40 4.10
14 Melville Waters
3.96 9.32 45.33 1.09 29.80 10.50
15 Applecross 2.33 5.48 26.65 0.64 63.10 1.80
16 Blackwall Reach
6.55 15.42 75.02 1.81 0.90 0.30
17 Bull Creek 4.25 10.00 48.67 1.17 32.60 3.30
18 Adenia Park 2.85 6.69 32.57 0.79 55.80 1.30
19 Mills Street 3.74 8.79 42.75 1.03 40.40 3.30
20 Lower Canning
6.05 14.23 69.25 1.67 4.70 4.10
Note: bold text indicates the dominant fraction at each site.

A baseline study of contaminants in the sediments of the Swan and Canning estuaries
28 Department of Water
Redox (Eh)
Redox potentials relative to hydrogen (Eh) measured in the sediment and the water column at each site are presented in Figure 13. Eh in sediment ranged from -98 mV to +195 mV. Eh in the water column was less variable and ranged from +370 mV to +523 mV.
-100
0
100
200
300
400
500
600
1 2 3 4 5 6 7 8 9 10 11 12 13 14 15 16 17 18 19 20
Site code
Eh
Figure 13 Sediment and water column redox potential (mV) at 20 sites within the Swan
Canning system. Eh = measured redox potential relative to hydrogen. Red bars represent Eh in sediment; blue bars represent Eh in water column.
Salinity, pH and dissolved oxygen data are presented in Appendix A .

A baseline study of contaminants in the sediments of the Swan and Canning estuaries
Department of Water 29
4 Discussion Contaminants were detected at all sites. In general, the contaminant data presented were highly variable even within the same site. This is not uncommon for sediment investigations of this nature (Simpson et al. 2005), since sediments are typically very heterogeneous. Spatial heterogeneity both in grain size and contaminant distribution, as observed in this study has been shown to result in microniches with high concentrations of contaminants (Shuttleworth et al. 1999). The migration of sediment contaminants is influenced by particle size and by the behaviour of organisms, for example, bioturbation (from burrowing and feeding) and bioirrigation (introduction of overlying water into burrows) (Simpson & Batley 2003; Rasmussen et al. 2000; Forster 1996).
The varied feeding and burrowing behaviours of sediment dwelling organisms affect how they introduce oxygen, sort particles, enrich or deplete organic matter and alter contaminant fluxes from sediments (Simpson et al. 2005). Each of these processes (along with physical characteristics such as tidal movement, temperature and salinity) may explain the often highly patchy nature of contaminants within sediments.
Notwithstanding the relatively high degree of variability, ISQGs (ANZECC & ARMCANZ 2000) were exceeded for some contaminants at some sites. For contaminants where ISQGs have not yet been established, an alternative guideline was sought (and in some cases this was also exceeded).
As a general observation, for all three contaminant groups, there was a spike in concentrations around the middle portion of the Swan River. Typically, the sediments from Maylands, Claisebrook, Burswood and Central Business District sites consistently contained relatively higher concentrations of contaminants.
From the summary information presented in Table 6 of the Results Section, it was possible to prioritise sites for further investigation (Table 8). The rationale for the prioritisation of sites was as follows:
Priority 1: > 3 contaminants exceeded the ISQG Low Trigger Value (and the alternative Canadian guideline value where relevant) and/or any number of contaminants exceeded the ISQG High Trigger Value.
Priority 2: 1-2 contaminants exceeded the ISQG Low Trigger Value (and the alternative Canadian guideline value where relevant). No contaminants exceeded the ISQG High Trigger Value.
Low Priority: contaminants present at levels below ISQG Low Trigger Values (or alternative guideline values where relevant).

A baseline study of contaminants in the sediments of the Swan and Canning estuaries
30 Department of Water
Table 8 Prioritisation of sites.
Priority
Site code
Site name
Contaminants of concern
1 11 Claisebrook zinc*, lead, copper, DDE-p,p, dieldrin
1 10 Maylands zinc, lead, DDE-p,p, dieldrin
1 17 Bull Creek zinc, mercury, lead, selenium
1 9 Belmont Race Course zinc, lead, dieldrin
1 12 Burswood zinc, lead, dieldrin
1 20 Lower Canning zinc, lead, selenium
1 13 Central Business District zinc*, lead
2 16 Blackwall Reach mercury, lead
2 6 Baigup dieldrin, manganese
2 19 Mills Street zinc, lead
2 8 South Belmont dieldrin
3 1 Blackadder Creek
3 2 Helena River
3 3 Upper Swan
3 4 Perth Airport South
3 5 Bayswater
3 7 Central Belmont
3 14 Melville Waters
3 15 Applecross
3 18 Adenia Park
Contaminants present but did not exceed guidelines (ANZECC & ARMCANZ 2000)
* indicates contaminants that exceeded both High and Low ISQGs.
To provide additional information the Cockburn Sound EQSs (EPA 2005a) were also applied to the data at the request of the SRT. However, as noted in Section 1.6, there are limitations in their application to this dataset, largely because they were designed to be compared to data collected from a given pre-defined “zone” consisting of several sites. In the current study they were compared to each site individually (which comprised five replicate samples). As such, these standards were not used in the prioritisation of the sites displayed above, but merely to provide further contextual information on a local south-west Western Australian scale (Table 6 - Results section).
4.1 Metal contaminants Of the metals assessed in this study, zinc, lead, copper and mercury were considered to have the potential to cause environmental harm, as these were present in concentrations that exceeded the ISQG Low Trigger Values (ANZECC & ARMCANZ 2000) and, in the case of zinc, also the ISQG High Trigger Value (ANZECC & ARMCANZ 2000). Selenium and manganese were also considered to have the potential to cause environmental harm because their concentrations exceeded the Moderate Hazard concentration (Lemly 1996) and the Ontario Sediment Quality Guideline (Ontario Ministry of Environment and Energy 1993) respectively (in the absence of ISQGs for these contaminants).

A baseline study of contaminants in the sediments of the Swan and Canning estuaries
Department of Water 31
Generally, organisms have the ability to bioregulate metals that are essential to their survival (such as manganese and copper). However, toxicity can manifest if the rate of metabolic breakdown and excretion of the metal is exceeded by the rate of uptake. The bioaccumulation of non-essential metals (such as lead, mercury and cadmium) is usually a greater threat to biota as they are not typically regulated. Thus excretion is relatively minimal and rate of bioaccumulation is often close to rate of uptake (Phillips and Rainbow 1994). Where bioaccumulation occurs, metal concentrations have the potential to increase across trophic levels (Phillips and Rainbow 1994).
Metals of concern in the Swan Canning system
The metals of concern identified in the current study have been shown to cause a variety of detrimental effects on aquatic biota. Some of which, are presented here:
Zinc
At concentrations orders of magnitude lower than those reported in this study, zinc has been shown to cause chronic responses in the benthic oligochaete worm, Limnodrilus hoffmeisteri. It has been reported that at concentrations ranging from 0.03 to 0.98 mg/kg, the production of adenosine triphosphate (transporter of chemical energy within cells for metabolism), protein and haemoglobin was disrupted (Martinez-Tabache et al. 2000). In addition, at the community level, concentrations of zinc above 100 mg/kg in the sediments of Norwegian fjords resulted in marked decreases in faunal diversity (Rygg 1985). In the current study, 11 of the 20 sites had median zinc concentrations in excess of 100 mg/kg. However, with regard to acute toxic responses, the benthic amphipod Melita awa, demonstrated 26% survival when compared with control organisms upon exposure to the comparatively high concentration of 4000 mg/kg zinc (King, et al. 2006).
Lead
Lead contaminated sediments have been shown to cause mortality in water birds (Heinz et al. 1999). Although the concentration of 3400 mg/kg was at least an order of magnitude higher than that found in the current study (maximum median concentration: 175 mg/kg). Given this, perhaps more relevant than acutely toxic responses are the long-term chronic responses resulting from bioaccumulation. Sediment lead concentrations ranging from 17 to 24.8 mg/kg were shown to result in bioaccumulation in a range of benthic fauna and fish, with molluscs demonstrating the highest degree of lead bioaccumulation followed by crustaceans, annelids and fish, in descending order (Ali & Fishar 2005).
Lead has also been shown to bioaccumulate in the livers of aquatic birds exposed to lead-contaminated sediment, resulting in a range of effects including atrophy of the breast muscles, green staining of the feathers, viscous bile and kidney damage (Hoffman et al. 2000; Heinz et al. 1999). In addition, as discussed for zinc, at the community level, concentrations of lead above 100 mg/kg in the sediments of Norwegian fjords resulted in marked decreases in faunal diversity (Rygg 1985).
Copper
Copper is not particularly acutely toxic, although as little as 14% survival was observed in the benthic amphipod, Melita plumulosa when exposed to the relatively high concentration of 1300 mg/kg (King et al. 2006). However, copper is known to bioaccumulate (King et al. 2005). Thus chronic detrimental effects would be likely at much lower exposure

A baseline study of contaminants in the sediments of the Swan and Canning estuaries
32 Department of Water
concentrations. As for zinc and lead, at the community level, sediment concentrations of copper above 100 mg/kg in the Norwegian fjords resulted in marked decreases in faunal diversity (Rygg 1985).
Median copper concentrations at all sites in the current study were below 100 mg/kg. However at the Claisebrook site, the median copper concentration of 69 mg/kg exceeded the ISQG Low Trigger Value, which indicates that adverse biological effects may occur (ANZECC & ARMCANZ 2000).
Mercury
Mercury, although only detected at three sites, was present at concentrations that have been shown to reduce the survival of rainbow trout eggs (Birge et al. 1979). Concentrations of 0.18 and 1.05 mg/kg resulted in a reduction in oyster larval survival of 45% and 70% respectively and abnormalities in oyster larvae at concentrations of 0.59 mg/kg (PTI 1988). In addition to these acute toxicity responses, a sediment concentration of 0.46 mg/kg mercury resulted in behavioural responses such as burrowing avoidance in the clam, Macoma balthica (McGreer 1979). This is important ecologically, because avoidance of the sediment directly affects the organism’s ability to remain protected from predators and adverse environmental conditions, its ability to relocate and ultimately, the ability for larvae to settle. Thus, resulting in a decrease in population size and a change to overall community composition. Concentrations of up to 1.2 mg/kg were reported in the current study for Bull Creek and 0.4 mg/kg for Blackwall Reach.
Mercury readily bioaccumulates in aquatic plants, invertebrates, fish and mammals and concentrations are often magnified in higher trophic level organisms. Exposure pathways to organisms can either be directly from the sediment (through direct contact or ingestion), or from the water (including the porewater) (NOAA 1996).
Due to its harmful nature, mercury (and its compounds) was placed on the Initial Priority Red List of the United Kingdom (1988) by the UK Department of Environment (Phillips and Rainbow 1994).
Selenium
ISQGs for selenium have not yet been established and there is a paucity of information on acute toxicity of selenium in sediments. However, like mercury, selenium bioaccumulates readily in aquatic organisms to concentrations of at least one order of magnitude greater than the concentrations in water or food (Lemly & Smith 1987) resulting in high concentrations in higher trophic level organisms. Selenium bioaccumulation has been demonstrated to result in reproductive failure and survival in young fish (Hamilton & Buhl 1990) and birds (Ohlendorf et al. 1986). Complete reproductive failure has been shown to occur with virtually no pathology or mortality in adult fish (Lemly & Smith 1987). In the absence of ISQGs, guidelines proposed by Lemly (1996) have been used in the current study. These guidelines were derived, taking into account the bioaccumulation potential of selenium from sediments into the benthic food chain, with resultant dietary toxicity (Lemly & Smith 1987). Based on the Lemly and Smith studies, the concentration of selenium in the sediments at Lower Canning is likely to pose a low hazard to aquatic organisms (median concentration in the range 2 to 3 mg/kg); and that at Bull Creek is likely to pose a moderate hazard (median concentration in the range 3 to 4 mg/kg).
A baseline study of contaminants in the sediments of the Swan and Canning estuaries
Department of Water 33
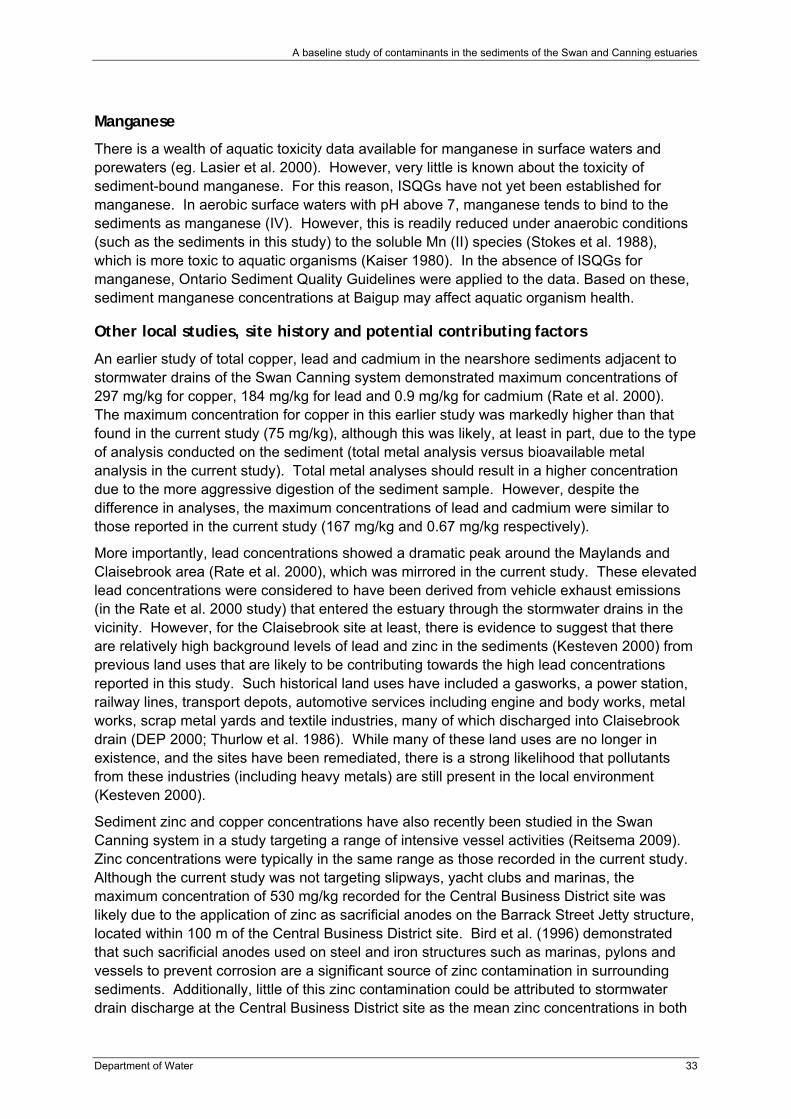
Manganese
There is a wealth of aquatic toxicity data available for manganese in surface waters and porewaters (eg. Lasier et al. 2000). However, very little is known about the toxicity of sediment-bound manganese. For this reason, ISQGs have not yet been established for manganese. In aerobic surface waters with pH above 7, manganese tends to bind to the sediments as manganese (IV). However, this is readily reduced under anaerobic conditions (such as the sediments in this study) to the soluble Mn (II) species (Stokes et al. 1988), which is more toxic to aquatic organisms (Kaiser 1980). In the absence of ISQGs for manganese, Ontario Sediment Quality Guidelines were applied to the data. Based on these, sediment manganese concentrations at Baigup may affect aquatic organism health.
Other local studies, site history and potential contributing factors
An earlier study of total copper, lead and cadmium in the nearshore sediments adjacent to stormwater drains of the Swan Canning system demonstrated maximum concentrations of 297 mg/kg for copper, 184 mg/kg for lead and 0.9 mg/kg for cadmium (Rate et al. 2000). The maximum concentration for copper in this earlier study was markedly higher than that found in the current study (75 mg/kg), although this was likely, at least in part, due to the type of analysis conducted on the sediment (total metal analysis versus bioavailable metal analysis in the current study). Total metal analyses should result in a higher concentration due to the more aggressive digestion of the sediment sample. However, despite the difference in analyses, the maximum concentrations of lead and cadmium were similar to those reported in the current study (167 mg/kg and 0.67 mg/kg respectively).
More importantly, lead concentrations showed a dramatic peak around the Maylands and Claisebrook area (Rate et al. 2000), which was mirrored in the current study. These elevated lead concentrations were considered to have been derived from vehicle exhaust emissions (in the Rate et al. 2000 study) that entered the estuary through the stormwater drains in the vicinity. However, for the Claisebrook site at least, there is evidence to suggest that there are relatively high background levels of lead and zinc in the sediments (Kesteven 2000) from previous land uses that are likely to be contributing towards the high lead concentrations reported in this study. Such historical land uses have included a gasworks, a power station, railway lines, transport depots, automotive services including engine and body works, metal works, scrap metal yards and textile industries, many of which discharged into Claisebrook drain (DEP 2000; Thurlow et al. 1986). While many of these land uses are no longer in existence, and the sites have been remediated, there is a strong likelihood that pollutants from these industries (including heavy metals) are still present in the local environment (Kesteven 2000).
Sediment zinc and copper concentrations have also recently been studied in the Swan Canning system in a study targeting a range of intensive vessel activities (Reitsema 2009). Zinc concentrations were typically in the same range as those recorded in the current study. Although the current study was not targeting slipways, yacht clubs and marinas, the maximum concentration of 530 mg/kg recorded for the Central Business District site was likely due to the application of zinc as sacrificial anodes on the Barrack Street Jetty structure, located within 100 m of the Central Business District site. Bird et al. (1996) demonstrated that such sacrificial anodes used on steel and iron structures such as marinas, pylons and vessels to prevent corrosion are a significant source of zinc contamination in surrounding sediments. Additionally, little of this zinc contamination could be attributed to stormwater drain discharge at the Central Business District site as the mean zinc concentrations in both

A baseline study of contaminants in the sediments of the Swan and Canning estuaries
34 Department of Water
sediment and water being discharged from this drain were found to be comparatively low (approximately 20 mg/kg and 0.025 mg/L respectively) in A Baseline study of contaminants in the Swan and Canning Catchment Drainage System (Nice et al. 2009).
Alternatively, copper concentrations were generally lower in the current study than those found in the sediments at the yacht and sailing club sites (Reitsema 2009). However, they were typically in the same range as those found at other sites of the Reitsema (2009) study, which were attributed at least in part to stormwater discharge. This is also consistent with the findings of the Baseline study of contaminants in the Swan and Canning Catchment Drainage System (Nice et al. 2009), which reported mean copper concentrations ranging between 5 and 130 mg/kg in the sediments of the stormwater drains. The downstream sediment copper concentrations in the current study ranged between 1 and 69 mg/kg. This would suggest that a proportion of the copper reported in the current study might also be attributed to stormwater discharge. Although in the case of the Claisebrook site, there is evidence to suggest that there are residual storages of copper in the sediments that are likely to be contributing towards the high copper concentrations at this site (Kesteven 2000) in the current study, as was also observed for zinc.
In another recent study (DoW 2007b) total mercury was found in unexpectedly high concentrations at the Blackwall Reach site, exceeding the ISQG High Trigger Value. For this reason, it was decided to include this site in the current study for further investigation. As anticipated, sediments collected from Blackwall Reach in the current study (which examined bioavailable metals) were also found to contain elevated levels of mercury, in this case exceeding the ISQG Low Trigger Value. These elevated mercury levels may be at least in part linked to historical land use in the area. For example, the river foreshore near McCabe Street was formerly an industrial area containing a fertiliser plant which imported pyrite to make sulphuric acid. In this process, gold was also extracted from the pyrite using cyanide and mercury. Large amounts of pyrite cinders contaminated with heavy metals including mercury remained onsite after plant closure, leading to widespread soil contamination (Appleyard et al. 1999). Bull Creek also had elevated mercury levels (exceeding both High and Low Trigger Values).
Interestingly, a study conducted adjacent to the Bayswater Main Drain (SRT 1990) revealed zinc and chromium in high concentrations in the sediments, exceeding the Australian Guidelines for the Management of Contaminated Soils (prior to ISQGs being established). However, in the current study, neither of these contaminants was found to be an issue for the Bayswater site. In fact none of the metals were found to exceed the ISQGs at this site. The metals may be present, but not extracted as bioavailable metals under the comparatively mild digestion process used in the current study. An additional factor contributing to the relatively low concentrations of metals in the sediments at this site, despite there being high concentrations of metals in the water component being discharged from the drain (Nice et al. 2009), is that upon examination of the particle sizes present, the dominant fraction was coarse sand (500-2000 µm). Coarse sand is typically less likely to be contaminated than fine sediment because the particles collectively have a smaller surface area and fewer binding sites (Simpson et al. 2005). The Bayswater site had the highest proportion of coarse sand of all 20 sites examined. The majority of sites had a dominant fraction of fine sand (62-250 µm), with a comparatively greater binding capacity. It should be noted that a contaminant bound to sediment with coarse particles will have a greater ability to partition to porewater (Simpson et al. 2005), which was not measured as part of this study. This also perhaps explains why there were generally higher concentrations of metals in the water than the

A baseline study of contaminants in the sediments of the Swan and Canning estuaries
Department of Water 35
associated sediments at Bayswater Main Drain, reported in the Baseline Study of Contaminants in the Swan and Canning Catchment Drainage System (Nice et al. 2009).
The wider Australian context
A recent study conducted in another South West Western Australian estuary system, the Vasse-Wonnerup, assessed the same suite of metals in the sediments, using the same extraction technique for bioavailable metals. However, all concentrations were below the ISQG Low Trigger Values (Wilson et al. 2008). Further afield, although still within Australia, an assessment of sediment metal concentrations in Lake Macquarie, an estuarine system in New South Wales reported mean copper concentrations between 17 and 79 mg/kg (Roach 2005). This range was very similar to that reported in the current study. Although not so closely matched, the ranges for mercury, lead, selenium and zinc were also fairly consistent with those reported for the current study.
Sediments in Port Jackson estuary (Sydney Harbour) were found to be contaminated with a wide range of toxicants and concentrations were considered to be among the highest reported for any major harbour in the world (Birch & Taylor 2002). Lead and zinc were the metals considered most likely to cause adverse biological effects in the Birch and Taylor study, although these were present in concentrations orders of magnitude higher than those reported in the Swan Canning system for the current study. For example, in Port Jackson, zinc concentrations of up to 8000 mg/kg were reported (Birch & Taylor 2002) as opposed to a maximum of 540 mg/kg in the sediments at the Central Business District site investigated in the current study.
High concentrations of copper, zinc and manganese in the Upper Hawkesbury-Nepean River system in NSW, were considered to be associated with sewage discharge into the river (Simonovski et al. 2003). The concentrations of each of these were similar to those reported in the current study, although there is no intentional sewage discharge into the Swan Canning system, so those reported in the current study are likely to have been derived from an alternative source.
Specific application of the guidelines to metals in the NNCP
According to the ANZECC and ARMCANZ Guidelines (2000), an assessment of contaminated sediments for metals should begin with total metals analysis. Total metal concentrations were assessed in the first two components of the NNCP, A baseline study of contaminants in the Swan and Canning catchment drainage system (Nice et al. 2009) and also in A baseline study of contaminants in groundwater at disused waste disposal sites in the Swan Canning catchment (Evans, 2009). This was considered appropriate for these baseline studies because they were assessing the potential sources of contaminants within the system (stormwater drains and disused waste disposal sites). The current study was designed to examine the receiving environment downstream from these potential sources and so bioavailable metal analyses were performed for this stage of the program (according to ANZECC and ARMCANZ Guidelines, 2000), because the aim was to determine whether the contaminants present are likely to pose a threat to ecosystem health. The assessment of bioavailable metal concentrations (according to methods by Simpson et al. 2005), equates more closely to the concentration of metals likely to pose a threat to organisms feeding on and living within the sediments. Once factors such as bioavailability have been addressed, if contaminants are still exceeding Trigger Values, it is suggested that toxicity testing be performed on the contaminated sediment ( ANZECC & ARMCANZ 2000) in order to

A baseline study of contaminants in the sediments of the Swan and Canning estuaries
36 Department of Water
determine whether the concentrations present are actually causing, or likely to cause harm to biota. As such, recommendations have been made for toxicity testing at particular sites (refer to Section 6).
4.2 Organic contaminants Of the two groups of organic contaminants assessed in this study, the OC pesticides and the PAHs, only OC pesticides were present in concentrations that exceeded the ISQG Low Trigger Values. None exceeded the ISQG High Trigger Values.
PAHs
Although ISQG levels were not exceeded for PAHs, it is noteworthy that the Claisebrook site consistently had the highest PAH concentrations in the sediments. Generally, those sites located downstream and nearest to the Claisebrook site (Maylands, Burswood and Central Business District) in the middle portion of the Swan River, also consistently had higher concentrations of each of the individual PAHs compared with the lower and upper reaches of the Swan. An exception to this was Blackwall Reach (the lowermost site in the Swan), which also had relatively high concentrations of most PAHs.
Historically, the Claisebrook area associated with the former East Perth gasworks site has been known to have high levels of PAHs in the sediments (Bowman Bishaw Gorham Environmental Management Consultants 1992). During an Environmental Assessment of the site, elevated PAHs were shown to occur throughout Claisebrook drain and also downstream from the drain in the nearshore sediments of the Swan River adjacent to and downstream from the old gasworks site. The distribution of the contaminated river sediments was found to clearly implicate the gasworks site as the primary source of contamination (Bowman Bishaw Gorham Environmental Management Consultants 1992).
The site has since been remediated and redeveloped. However, the results from the current study, particularly, the elevated acenaphthalene concentration, which does not exceed but is close to the ISQG Low Trigger Value (median concentration: 43 µg/kg; ISQG Low: 44 µg/kg), may indicate a continuing source of contamination because acenaphthalene is a low molecular weight PAH, which typically degrades more rapidly in water and sediments than its high molecular weight counterparts. Of all 20 sites assessed in the current study, the Claisebrook site consistently had the highest concentrations of all the low and high molecular weight PAHs measured. The high molecular weight PAHs are not acutely toxic, but are highly persistent and cause significant chronic toxicity at low concentrations (e.g. Varanasi et al. 1985), causing effects such as carcinomas in wild fish populations (Murchelano & Wolfe 1985).
As part of the Newcastle Port expansion in NSW, a series of geochemical and toxicity investigations were conducted adjacent to a former steelworks site. Many of the sediments were found to be acutely toxic to aquatic organisms. Those sediments with total PAH concentrations greater than 15 mg/kg (normalised to 1% total organic carbon) were considered unsuitable for ocean disposal without prior treatment (Heise et al. 2005). By comparison, the total PAH concentration in the current study is approximately 2 mg/kg for the Claisebrook site.

A baseline study of contaminants in the sediments of the Swan and Canning estuaries
Department of Water 37
OC pesticides
As noted for metals and PAHs, there was a general spike in OC pesticide concentrations around the middle portion of the Swan River. Specifically, pesticides were detected in the sediments of the Baigup, Central Belmont, South Belmont, Belmont Race Course, Maylands, Claisebrook and Burswood sites. Additionally there was a single detection on one occasion at the Helena River site. The ISQG Low Trigger Value for dieldrin was exceeded at all of these sites except Central Belmont and Helena River. Additionally, the ISQG Low Trigger Value for DDE-p,p was exceeded for Maylands and Claisebrook. The Claisebrook site had the highest median concentration of four of the five pesticides detected.
Dieldrin was the most frequently reported OC pesticide in the current study, a finding that was mirrored in A Baseline Study of Contaminants in the Swan and Canning Catchment Drainage System (Nice et al. 2009). Additionally, the sites where pesticides were reported in the sediments of the current study were generally associated with the drains that were prioritised for OC pesticides in A Baseline Study of Contaminants in the Swan and Canning Catchment Drainage System (Nice et al. 2009), which provides an indication as to the source of the contaminants (at least in part). The exceptions were Belmont Race Course, Burswood and Claisebrook, for which associated drains were not assessed in A Baseline Study of Contaminants in the Swan and Canning Catchment Drainage System (Nice et al. 2009).
In 1995, the Governing Council of the United Nations Environment Programme called for global action to be taken regarding persistent organic pollutants. Following this, the 12 most harmful persistent organic pollutants were nominated. All of the OC pesticides detected in the current study are either on the list of nominees (dieldrin, aldrin, chlordane), or are metabolites of DDT (DDE-p,p and DDD-p,p) which itself is on the list. The Stockholm Convention, an internationally legally binding agreement for persistent organic pollutants was enacted on 17 May 2004. All of the OC pesticides on the list were banned with the exception of DDT (which can only be used as malaria control in certain countries). As a result, the importation, manufacture and use of all OC pesticides has been banned in Australia since 2004. DDT was banned in Australia in 1987 (DEWHA 1997). Despite this, OC pesticides and their metabolites can still be present in the environment due to their highly persistent nature (DEH 2004).
OC pesticides of concern in the Swan Canning system
Of the OC pesticides assessed in this study, dieldrin and DDE-p,p were considered to have the potential to cause environmental harm as these were present in concentrations that exceeded the ISQG Low Trigger Values ( ANZECC & ARMCANZ 2000). These compounds have been shown to cause a variety of detrimental effects to aquatic biota, some of which are presented here.
DDE-p,p
DDE-p,p is a metabolite of DDT, and is more resistant to degradation than the parent compound (Porter et al. 2005), which perhaps explains its presence in the sediments, even though the use of DDT has been banned in Australia since 1987 (DEWHA 1997). There is a wealth of toxicity information on DDT and its metabolites including the well-documented egg-shell thinning condition experienced in aquatic birds exposed to trace levels of DDE-p,p (e.g. Lundholm 1997). A range of endocrine disrupting responses have been reported in the European frog, Rana temporaria exposed to environmentally relevant concentrations of DDE and bone density was negatively affected following exposure (Arukwe 2006; Lundberg et al.

A baseline study of contaminants in the sediments of the Swan and Canning estuaries
38 Department of Water
2006). DDE-p,p bioaccumulates in the fatty tissues of aquatic organisms such as fish and biomagnifies in higher trophic level organisms (Connolly & Glaser 2002). In addition to endocrine disrupting responses, DDT and its metabolites can be carcinogenic, mutagenic and teratogenic, causing a range of chronic effects such as immune system damage (Fox 1995; MAFF 1981).
Dieldrin
Dieldrin is a metabolite of aldrin. This conversion readily occurs in the environment during microbial degradation (Ramamoorthy & Ramamoorthy 1997). Like DDE-p,p, dieldrin has been shown to induce teratogenic responses in a range of frog species (Schuytema et al. 1991). Acute and chronic effects have also been reported for environmentally relevant concentrations such as gross spinal deformities in larvae of the African clawed frog, Xenopus laevis at concentrations of 1.3 ppb (Schuytema et al. 1991). Dieldrin produces adverse enzymatic and endocrine disrupting responses in fish, leading to impaired reproductive ability (WFPHA 2000). Dieldrin also bioaccumulates in aquatic organisms and is highly persistent with a half life1 of five years in temperate latitudes (WHO 1989).
Other local studies, site history and potential contributing factors
Organochlorine pesticides have been used historically in the Perth region for insect control. However, the presence of OC pesticides was found to be low in a survey of the groundwater of the Perth Basin (Hirschberg & Appleyard, 1996). Therefore, groundwater contribution is an unlikely source for the OC pesticides detected in the sediments of the current study.
An earlier study assessing water quality in the Mills Street Main Drain as part of the Swan Canning Cleanup Program (SRT 2003) reported the OC pesticides, DDT and dieldrin in the surface waters of the drain. The site downstream from the Mills Street Main Drain in the current study has not been shortlisted in the prioritisation of sites for OC pesticides in sediments because median concentrations of OC pesticides were relatively low or not detected. This may be attributable to the relatively high proportion (43.7%) of coarse sand and gravel at this site compared with many of the other sites. As discussed previously, coarse sand and gravel (i.e. particle sizes above 500 µm) is typically less contaminated than fine sediment because the particles collectively have a smaller surface area and fewer binding sites and therefore will not retain the OC pesticides as efficiently as silt or clay (Simpson et al. 2005).
The wider Australian context and overseas
A recent study conducted in another south-west Western Australian estuary system, the Vasse-Wonnerup, also assessed OC pesticides in the sediments. However, all concentrations were below the limits of reporting (Wilson et al. 2008). Alternatively, a study conducted in Port Jackson (Sydney Harbour) shortlisted DDD and its metabolite, DDE as among those sediment contaminants most likely to cause adverse biological effects, based on comparisons with guidelines (Birch & Taylor 2002).
Additionally, similar to the current study, DDE-p,p was found to be the most abundant of the DDT congeners in the sediments of the Salton Sea, a manmade lake in California (Sapozhnikova et al. 2004). Dieldrin was among a range of OC pesticides considered to be contentious, for exceeding the local guidelines. More importantly, Sapozhnikova’s study 1 The half life of a substance is the time required for the quantity of the substance to decay to half its initial value.

A baseline study of contaminants in the sediments of the Swan and Canning estuaries
Department of Water 39
revealed DDE-p,p was present in all fish tissues sampled from the lake (i.e. livers, gonads, gills and muscles - relative concentrations in these tissues in descending order). Dieldrin was also detected in all of the livers analysed. The concentrations of dieldrin in the sediments in Sapozhnikova’s study were generally in the same range as those reported in the current study. However, the concentrations of DDE-p,p were approximately one order of magnitude higher in the Sapozhnikova study.
Specific application of the guidelines to organic contaminants in the NNCP
For organic contaminants such as the PAHs and the OC pesticides assessed in the current study, a similar approach to that outlined previously for metals is recommended. However, the data are normalised to 1% total organic carbon for organic contaminants prior to comparison with the guidelines. If Trigger Values are exceeded once factors controlling bioavailability (such as organic carbon) have been examined, toxicity testing should be performed on the contaminated sediment (ANZECC & ARMCANZ 2000). This will determine whether the concentrations present are likely to cause harm to biota. As such, recommendations have been made for toxicity testing at particular sites (refer to Section 6).
4.3 Physico-chemical parameters
Particle size
All sediment samples comprised particles from all size categories although the dominant fraction was fine sand for the majority of sites (16 out of 20). It is typical for sediment particle sizes to range through all the size classes used here: clay, silt, fine sand, medium sand, coarse sand and gravel. The surface areas of particles within each of these categories vary by orders of magnitude (Simpson et al. 2005).
Interestingly, of the nine sites not identified as Priority Sites (i.e. guidelines were not exceeded for any contaminant), four had the dominant fraction comprised of coarse sand as opposed to fine sand. As discussed for the surprisingly low levels of metals at the Bayswater site, a contributing factor is likely to be the particle size and comparatively fewer binding sites. If this is the case, it is likely that a higher proportion of contaminants present at the site exist in soluble form in the porewater, and hence have not been detected in the sediment analyses of this study, which should be taken into account in follow up ecotoxicological investigations (refer to Section 6).
Redox (Eh)
Redox potential (Eh) was measured within the water column 5 to 20 cm above the sediment surface (according to Simpson et al. 2005); and within the sediments themselves. The difference in Eh between the two media for the same sites indicates that it is not sufficient to rely on water column Eh alone. There was no indication of sulphate-reducing conditions (according to Simpson et al. 2005) because all Eh values were greater than -150 mV. However, because this sample was homogenised through the depth of 30 mm it is likely that some components were sulphate-reducing while in-situ but were mixed with less-reducing sediments during the homogenisation process.

A baseline study of contaminants in the sediments of the Swan and Canning estuaries
40 Department of Water
5 Conclusions The 20 sites investigated in the current study were sorted into three categories: Priority 1, Priority 2 and Low Priority, based on the number and type of guidelines exceeded for different contaminants. Figure 14 shows the spatial distribution of the three priority types.
The middle portion of the Swan River comprising Claisebrook, Maylands, Belmont Race Course, Burswood and Central Business District sites was the highest priority area along with the Bull Creek and the Lower Canning sites in the Canning River. Of these seven Priority 1 sites, Claisebrook was considered the most contaminated because the sediment concentrations were consistently the highest for all PAHs, all OC pesticides (except one); and among the highest for metals. Additionally, the greatest number of ISQGs (Low Trigger Values) was exceeded for this site (five). As was the ISQG (High Trigger Value) for one contaminant (zinc). The Priority 2 sites: Blackwall Reach, Baigup, South Belmont and Mills Street were fairly evenly distributed throughout the system with the Low Priority sites: Blackadder Creek, Helena River, Upper Swan, Perth Airport South, Bayswater, Central Belmont, Melville Waters, Applecross and Adenia Park.
Finally, it is concluded that further investigation is required at sites according to the priority category allocated. Detailed recommendations follow in Section 6.

Figure 14 Prioritisation of sites in the Swan Canning system.
Priority 1 sites: > 3 contaminants exceeded the ISQG Low Trigger Value and/or any number of contaminants exceeded the ISQG High Trigger Value. Priority 2 sites: 1-2 contaminants exceeded the ISQG Low Trigger Value. No contaminants exceeded the ISQG High Trigger Value. Low Priority sites: contaminants present at levels below ISQG Low Trigger Values.

6 Recommendations It is recommended that:
1 a comprehensive investigation incorporating whole-sediment toxicity tests and in-situ bioaccumulation studies be conducted initially for the Claisebrook site only. These studies should target the potential sources of contamination at this site (including the Claisebrook Main Drain) and downstream sites from the source(s) following a gradient study design.
2 if toxicity and/or bioaccumulation is observed at Claisebrook, benthic community surveys be conducted, also following a gradient study design away from the source to determine the extent of the impact.
3 following the Claisebrook assessment (and depending on the results), whole-sediment toxicity tests and/or in-situ bioaccumulation studies should be conducted for all or some of the other Priority 1 and Priority 2 sites (following a Risk Assessment approach). This phase of assessment should incorporate information gained from the Claisebrook study regarding the most suitable toxicity tests and in-situ organisms for the types of contaminants found and the local environment. Thus, this round of toxicity testing and/or bioaccumulation studies is likely to be less intensive and more targeted, based on knowledge gained from the proposed Claisebrook investigation.
4 pending the results from these studies, decisions be made regarding the necessity for follow up ecological studies (such as benthic and pelagic community surveys) at some or all of these Priority sites.
5 Low Priority sites do not require further targeted action at this time. However, it is acknowledged that while environmental guidelines were not exceeded for the contaminants investigated, the presence of contaminants at these sites indicates that the local environments are degraded to some extent. Therefore, it is recommended that a degree of high-level ongoing surveillance is conducted to detect further potential degradation of these sites.
A conceptual diagram (Figure 15) demonstrates the recommended follow-up work within the context of contaminant exposure routes for biota. Background information on the toxicity tests, bioaccumulation studies and ecological studies proposed is provided in Appendix B.
Integrating chemical, ecotoxicological and ecological studies into an assessment of the impacts of contaminants on the Swan Canning system follows a weight of evidence approach, the underlying principle of which is that multiple lines of evidence reduce uncertainty in impact assessments (Chapman et al. 1997). This will lead to better informed decisions and targeted management actions in addressing the identified issues.

Figure 15 Conceptual diagram of recommended follow-up work in the Swan Canning system.
1: whole-sediment toxicity testing; 2: in-situ bioaccumulation studies; 3: ecological studies

A baseline study of contaminants in the sediments of the Swan and Canning estuaries
44 Department of Water
Appendix A – Salinity, pH and dissolved oxygen data
Salinity Site code
Site name Water column salinity (ppt)
Classification (according to DoW 2006)
1 Blackadder Creek 4.28 Fresh 2 Helena River 7.2 Brackish 3 Upper Swan 9.18 Brackish 4 Perth Airport South 12.13 Brackish 5 Bayswater 7.92 Brackish 6 Baigup 12.83 Brackish 7 Central Belmont 14.6 Brackish 8 South Belmont 14.7 Brackish 9 Belmont Race Course 18.82 Brackish 10 Maylands 20.24 Brackish 11 Claisebrook 21.71 Brackish 12 Burswood 22.5 Brackish 13 Central Business District 26.03 Saline 14 Melville Waters 29.1 Saline 15 Applecross (no data) - 16 Blackwall Reach 34.34 Saline 17 Bull Creek 27.99 Saline 18 Adenia Park 11.91 Brackish 19 Mills St Main Drain 13.18 Brackish 20 Lower Canning 0.62 Fresh
pH ..... Site code Site name pH 1 Blackadder Creek 7.31 2 Helena River 7.09 3 Upper Swan 7.24 4 Perth Airport South 7.13 5 Bayswater 7.45 6 Baigup 7.33 7 Central Belmont 7.48 8 South Belmont 7.38 9 Belmont Race Course 7.49 10 Maylands 7.54 11 Claisebrook 7.63 12 Burswood 7.77 13 Central Business District 8.00 14 Melville Waters 8.15 15 Applecross (no data) 16 Blackwall Reach 8.12 17 Bull Creek 7.87 18 Adenia Park 7.58 19 Mills St Main Drain 7.42 20 Lower Canning 7.23

A baseline study of contaminants in the sediments of the Swan and Canning estuaries
Department of Water 45
Dissolved oxygen Site code
Site name Dissolved oxygen (% saturation)
Classification (according to DoW 2006)
1 Blackadder Creek 78.6 Well oxygenated 2 Helena River 44.5 Moderately oxygenated 3 Upper Swan 61.5 Moderately oxygenated 4 Perth Airport South 37.7 Hypoxic 5 Bayswater 79.1 Well oxygenated 6 Baigup 65.6 Moderately oxygenated 7 Central Belmont 85.0 Well oxygenated 8 South Belmont 63.8 Moderately oxygenated 9 Belmont Race Course 67.9 Moderately oxygenated 10 Maylands 70.3 Well oxygenated 11 Claisebrook 75.7 Well oxygenated 12 Burswood 83.0 Well oxygenated 13 Central Business District 92.8 Well oxygenated 14 Melville Waters 96.3 Well oxygenated 15 Applecross (no data) - 16 Blackwall Reach 83.2 Well oxygenated 17 Bull Creek 59.4 Moderately oxygenated 18 Adenia Park 66.1 Moderately oxygenated 19 Mills St Main Drain 38.7 Hypoxic 20 Lower Canning 54.7 Moderately oxygenated

A baseline study of contaminants in the sediments of the Swan and Canning estuaries
46 Department of Water
Appendix B - Background information on toxicity tests, bioaccumulation studies and ecological studies proposed Whole-sediment toxicity tests
Whole-sediment toxicity tests assess the effects of contaminants from several potential routes of exposure including contaminants bound to sediment particles, contaminants dissolved in porewater and contaminants dissolved in the overlying water (ASTM 2003). Such testing is accepted worldwide as a line of evidence in monitoring programs designed to assess the potential toxicity of contaminated sediments (Adams et al. 2005; Ingersoll et al. 1997). The testing regime should comprise both acute and chronic endpoints such as survival, growth, reproduction and emergence.
Selection of toxicity test organisms
A summary of criteria for the selection of appropriate test organisms follows:
A suite of test organisms (e.g. algae, amphipods, bivalves and polychaete worms) with a range of exposure pathways should be used for ecotoxicological assessment of contaminated sediments because different organisms respond differently to different contaminants (Simpson et al. 2005).
Test organisms should ideally be indigenous in the area (either present or historically present), or have a niche similar to organisms of concern (for example, similar feeding guild or behaviour to the indigenous organisms).
Test organisms should be tolerant of a broad range of sediment physico-chemical characteristics such as grain size (ASTM 2003).
Test organisms should be in direct contact with the sediment (ASTM 2003).
Test organisms should be compatible with selected exposure methods and endpoints (ASTM 2003).
Test organisms should ideally have their response confirmed with responses of natural populations of benthic organisms (ASTM 2003).
Further test organism criteria and examples of current recognised Australian whole-sediment estuarine toxicity tests are available in the Handbook for Sediment Quality Assessment (Simpson et al. 2005).
Bioaccumulation studies
As discussed for many of the metals, PAHs and OC pesticides examined in the current study, chemicals in sediments may be directly toxic to aquatic life and/or be bioaccumulated in the food chain (Simpson et al. 2005). It would be preferable to conduct bioaccumulation studies on a suite of organisms comprising different trophic levels, given that the concentrations of many of the contaminants reported in the current study have the potential to magnify across trophic levels (Phillips & Rainbow 1994). It should be noted that for most sediment-dwelling organisms, sediments, porewaters and overlying waters may all contribute to the bioaccumulation of metal contaminants (Griscom & Fisher 2002; Wang & Fisher 1999).

A baseline study of contaminants in the sediments of the Swan and Canning estuaries
Department of Water 47
Benefits of conducting toxicity tests and bioaccumulation studies
Information gained from such tests can be used to:
determine whether the contaminants detected are likely to have an impact on the biota.
determine spatial and temporal distribution of contamination.
rank areas for remediation or other management action.
estimate the effectiveness of remediation or management practices.
investigate interactions among complex mixtures of chemicals.
determine the relationship between toxic effects and bioavailability.
compare the sensitivities of different organisms.
Ecological studies
While toxicity testing and bioaccumulation studies are useful tools in determining likely exposure routes and modes of action related to particular contaminants, ecological studies are necessary to confirm what is actually occurring in the receiving environment at a community level. This is important because in the receiving environment, numerous other stressors are present (such as competition) that may result in organisms becoming more or less sensitive to the presence of contaminants. It is recommended in the Handbook for Sediment Quality Assessment, that test organisms should ideally have their response confirmed with responses of natural populations of organisms (ASTM 2003).

A baseline study of contaminants in the sediments of the Swan and Canning estuaries
48 Department of Water
References Adams, WJ, Green, AS, Ahlf, W, Brown, SS, Burton, GA, Chadwick, B, Crane, M, Gouget, R,
Ho, KT, Hogstand, C, Reynoldson, TB, Ringwood, AH, Savitz, JD & Sibley, PK 2005, ‘Using sediment assessment tools and a weight of evidence approach’, in RJ Wenning, GE Batley, CG Ingersoll & DW Moore(eds), Use of sediment quality guidelines and related tools for the assessment of contaminated sediments, SETAC Press, Pensacola, Florida.
Ali, MHH & Fishar, MRA 2005, ‘Accumulation of trace metals in some benthic invertebrate and fish species relevant to their concentration in water and sediment of Lake Qaran, Egypt’, Egyptian Journal of Aquatic Research, vol. 31(1), pp. 1110–354.
ANZECC & ARMCANZ 2000, Australian and New Zealand guidelines for fresh and marine water quality, Australia and New Zealand Environment and Conservation Council & Agriculture and Resource Management Council of Australia and New Zealand.
Appleyard, S, Baddock, L & Davis, G 1999, ‘Technical tour notes’ in 1999 Contaminated site remediation conference: challenges posed by urban and industrial contaminants, Centre for Groundwater Studies, Australia.
Arukwe A 2006, ‘Organ-specific patterns of P450arom gene isoforms are modulated by p,p′-DDE in adult male European common frog, Rana temporaria’, Marine Environmental Research, vol. 62, pp. S215–S218.
ASTM 2003, Standard test method for measuring the toxicity of sediment-associated contaminants with estuarine and marine invertebrates, ASTM Designation: E 1367-03. American Society for Testing and Materials.
Birch, GF & Taylor, SE 2002, ‘Application of sediment quality guidelines in the assessment and management of contaminated surficial sediments in Port Jackson (Sydney Harbour), Australia’, Environmental Management, vol. 29(6), pp. 860–70.
Bird, P, Comber, SW, Gardner, MJ & JE Ravenscroft 1996, ‘Zinc inputs to coastal waters from sacrificial anodes’, Science of the Total Environment, vol. 181(3), pp. 257–64.
Birge, WJ, Black, A., Westerman, AG & Hudson, JE 1979, ‘The effects of mercury on reproduction of fish and amphibians’, in JO Nriagu (ed.), The Biogeochemistry of Mercury in the Environment, pp. 629–55, Elsevier/North Holland Biomedical Press, New York.
Bowman Bishaw Gorham Environmental Management Consultants 1992, Environmental assessment of polyaromatic hydrocarbon contamination of river sediments near the East Perth gasworks, Report No. RI1140, Perth, Australia.
Canadian Council of Ministers of the Environment (2002) Canadian sediment quality guidelines for the protection of aquatic life, retrieved February 2008, <www.ccme.ca/assets/pdf/sedqg_summary_table.pdf>.
Chapman, PM, Anderson, BS, Carr, RS, Engle, V, Haverland, P, Hameedi, J, Hyland, J, Ingersool, C, Long, E, Rodgers, J, Sibley, S, Smith, P, Swartz, R, Thompson, B & Windom, H 1997, ‘General guidelines for using the sediment quality triad (SQT)’, Marine Pollution Bulletin, vol. 34, pp. 368–72.

A baseline study of contaminants in the sediments of the Swan and Canning estuaries
Department of Water 49
City of Bayswater 2004, Baigup wetland reserve management plan, 2004–2014. Draft for public comment, Regeneration Technology Pty Ltd, Perth, Australia.
Connolly, JP & Glaser, D 2002, ‘p, p'-DDE bioaccumulation in female sea lions of the California Channel Islands’, Continental Shelf Research, vol. 22(6–7), pp. 1059–78.
DEC 2008, Database for contaminated reported sites, 19 June 2008, Department of Environment and Conservation, Western Australia.
DEH 2004, National chemical reference guide – standards in the Australian environment. Australian Government, Canberra.
DEP 2000, Potentially contaminating activities, industries and land uses, Contaminated sites management series, Department of Environmental Protection, Western Australia.
DEWHA 1997, Some previous uses of organochlorine pesticides in Australia, Scheduled wastes fact sheet No. 4, Department of the Environment, Water, Heritage and the Arts, Australian Government, Canberra.
DoE 2003a, Summary report on water and sediment quality in Brookdale drain, Department of Environment, Western Australia.
DoE 2003b, Assessment of water, sediment and fish quality in the Bayswater drains and adjacent Swan River, Department of Environment, Western Australia.
DoW 2006, Sampling and analysis plan: Swan River estuary sampling, Swan Canning Cleanup Program, Water Science Branch, Department of Water, Western Australia.
DoW 2007a, Sampling and analysis plan: Non-Nutrient Contaminants Program: Swan and Canning estuary sediment survey, Water Science Branch, Department of Water, Western Australia.
DoW 2007b, Marine Quality Monitoring Program. Annual Report 2007, Department of Water Report for Fremantle Ports, Fremantle, Department of Water, Western Australia.
EPA 2005a, Environmental quality criteria reference document for Cockburn Sound (2003–2004). A supporting document to the State Environmental (Cockburn Sound) Policy, Environmental Protection Authority, Western Australia.
EPA 2005b, Manual of standard operating procedures for environmental monitoring against the Cockburn Sound environmental quality criteria (2004). A supporting document to the State Environmental (Cockburn Sound) Policy, Environmental Protection Authority, Western Australia.
Evans, SJ 2009, A baseline study of contaminants in groundwater at disused waste disposal sites in the Swan Canning catchment, Water Science Technical Series Report No. 4, Department of Water, Western Australia.
Forster, S 1996, ‘Spatial and temporal distribution of oxidation events occurring below the sediment-water interface’, Marine Ecology, vol. 17, pp. 309–19.
Foulsham, G, Nice, HE, Fisher, S, Mueller, J, Bartkow, M, & Komorova, T 2009, A baseline study of organic contaminants in the Swan and Canning catchment drainage system using passive sampling devices, Water Science Technical Series Report No. 5, Department of Water, Western Australia.
Fox, R 1995 ‘Male reproductive health and environmental oestrogens’, Lancet, vol. 345, pp. 933–35.

A baseline study of contaminants in the sediments of the Swan and Canning estuaries
50 Department of Water
Griscom, SB & Fisher, NS 2002, ‘Uptake of dissolved Ag, Cd and Co by the clam, Macoma balthica: relative importance of overlying water, toxic porewater, and burrow water’, Environmental Science and Technology, vol. 36, pp. 2471–8.
Hamilton, SJ & Buhl, KJ 1990, ‘Acute toxicity of boron, molybdenum and selenium to fry of Chinook salmon and coho salmon’, Archives of Environmental Contamination and Toxicology, vol. 19, pp. 366–73.
Heinz, GH, Hoffman, DJ, Sileo, L, Audet, DJ & Lecaptain, LJ 1999, ‘Toxicity of lead-contaminated sediments to Mallards’, Archives of Environmental Contamination and Toxicology, vol. 36(3), pp. 323–33.
Heise, T, Britton, G, Stone, A & Simpson, S 2005, ‘Newcastle Port sediment toxicity investigations to identify sediment suitable for unconfined sea disposal’, Coasts and Ports: Coastal Living; Australasian Conference 2005 Proceedings, Australia.
Hirschberg, K-JB & Appleyard, SJ 1996, A baseline survey of non-point source groundwater contamination in the Perth Basin, Western Australia, Technical report, Geological Survey of Western Australia, Department of Minerals and Energy, Western Australia.
Hoffman, DJ, Heinz, GH, Sileo, L, Audet, DJ, Campbell, JK & Obrecht III, HH 2000, ‘Developmental toxicity of lead-contaminated sediment in Canada Geese (Branta canadesis),’ Environmental Health Part A, vol. 59(4), pp. 235–52.
Ingersoll, CG, Dillon, T & Biddinger, G (1997), ‘Ecological risk assessment of contaminated sediments’, SETAC Pellston workshop on sediment ecological risk assessment, 1995, Pacific Grove, California, SETAC, Pensacola, Florida.
Kaiser, KLE 1980, ‘Correlation and prediction of metal toxicity to aquatic biota’, Canadian Journal of Fisheries and Aquatic Science, vol. 37, pp. 211–18.
Kesteven, C 2000, Water Pollution in the Claisebrook Catchment: sources, types and recommendations for future monitoring, thesis (Hons), Department of Geography, University of Western Australia, Nedlands.
King, CK, Gale, SA, Hyne, RV, Stauber, JL, Simpson, SL & Hickey, CW 2006, ‘Sensitivities of Australian and New Zealand amphipods to copper and zinc in waters and metal-spiked sediments’, Chemosphere, vol. 63, pp. 1446–76.
King, CK, Simpson, SL, Smith, S, Stauber, JL & Batley, GE 2005, Short-term accumulation of Cd and Cu from water, sediment and algae by the amphipod Melita plumulosa and the bivalve Tellina deltoidalis, Marine Ecology Progress Series, vol. 287, pp. 177–88.
Lasier, P, Winger, PV & Bogenrieder, KJ 2000, ‘Toxicity of manganese to Ceriodaphnia dubia and Hyalella azteca’, Archives of Environmental Contamination and Toxicology, vol. 38, pp. 298–304.
Lemly, AD 1996, ‘Assessing the toxic threat of selenium to fish and aquatic birds’, Environmental Monitoring and Assessment, vol. 43, pp. 19–35.
Lemly, AD & Smith, GJ 1987, Aquatic cycling of selenium: Implications for fish and wildlife, Fish and Wildlife Leaflet 12, United States Department of the Interior, Fish and Wildlife Service, Washington D.C.

A baseline study of contaminants in the sediments of the Swan and Canning estuaries
Department of Water 51
Lundberg, R, Leiva-Presa, A, Jenssen, BM, Rönn, M, Hernhag, C, Wejheden, C, Larsson, S, Örberg, J & Lind, PM 2006, ’Effects of short-term exposure to the DDT metabolite p,p’-DDE on bone tissue in male common frog (Rana Temporaria)’, Journal of Toxicology and Environmental Health, vol. 228, pp. 33–40.
Lundholm, CE 1997, ‘DDE-induced eggshell thinning in birds: effects of p,p, and unknown – DDE on the calcium and prostaglandin metabolism of the eggshell gland’, Comparative Biochemistry and Physiology – Part C: Pharmacology, Toxicology and Endocrinology, vol. 118(2), pp. 113–28.
MAFF 1981, Pesticide residues (1977–1981), ninth report of the Steering Group on Food Surveillance, Ministry of Agriculture Fisheries and Food, Steering Group on Food Surveillance, Working Party on Pesticide Residues, United Kingdom.
Martinez-Tabache, L, Cabrera, IG, Olivan, LG, Martinez, MG & Faz, CG 2000, ‘Toxic effects of zinc from trout farm sediments on ATP, protein and haemoglobin concentrations of Limnodrilus hoffmeisteri’, Journal of Toxicology and Environmental Health, Part A, vol. 59, pp. 575–83.
McGreer, EIR 1979, ‘Sublethal effects of heavy metal contaminated sediments on the bivalve Macoma balthica (L)’, Marine Pollution Bulletin, vol. 10, pp. 259–62.
Mudroch, A, Azcue, JM & Mudroch, P 1997, Manual of physico-chemical analysis of aquatic sediments. Environmental science – environmental chemistry and toxicology, Lewis Publishers, Florida.
Murchelano, RA & Wolfe, RE 1985, ‘Epizootic carcinoma in the winter flounder, Pseudopleuronectes americanus’. Science, vol. 228, pp. 587–89.
Nice, HE, Grassi, M, Foulsham, G, Morgan, B, Evans, SJ, Robb, M 2009, A baseline study of contaminants in the Swan and Canning Catchment Drainage System, Water Science Technical Series Report No. 3, Department of Water, Western Australia.
NOAA 1996, Contaminants in aquatic habitats at hazardous waste sites: mercury, National Oceanographic and Atmospheric Administration Technical memorandum NOS ORCA 100, Seattle, Washington.
Ohlendorf, HM, Hoffman, DJ, Saiki, MJ & Aldrich, TW 1986, ‘Embryonic mortality and abnormalities of aquatic birds: apparent impacts of selenium from irrigation drainwater’, Science of the Total Environment, pp. 52, 49.
Ontario Ministry of Environment and Energy 1993, Guidelines for the protection and management of aquatic sediment quality in Ontario, retrieved February 2008, <www.ene.gov.on.ca/envision/gp/B1-3pdf>.
Phillips, DJH & Rainbow, PS 1994, Biomonitoring of trace aquatic contaminants, Environmental Management Series. Chapman and Hall, United Kingdom.
Porter, RD & Weimeyer, SN 2005, ‘DDE at low dietary levels kills captive American kestrels’, Bulletin of Environmental Contamination and Toxicology, vol. 8(4), pp. 193–9.
PTI 1988, The apparent effects threshold approach, Environmental Protection Agency, Region 10, Office of Puget Sound, Seattle, United States.

A baseline study of contaminants in the sediments of the Swan and Canning estuaries
52 Department of Water
Ramamoorthy, S & Ramamoorthy, S 1997, ‘Chlorinated organic compounds in the environment – regulatory and monitoring assessment’, in S Ramamoorthy and S Ramamoorthy, Lewis Publishers, New York, CRC Press, USA.
Rasmussen, AD, Banta, GT & Andersen, O 2000, ‘Cadmium dynamics in estuarine sediments: effects of salinity and lugworm bioturbation’, Environmental Toxicology and Chemistry, vol. 19, pp. 380–86.
Rate, AW, Robertson, AE & Borg, AT 2000, ‘Distribution of heavy metals in near-shore sediments of the Swan River estuary, Western Australia’, Water, Air and Soil Pollution, vol. 124, pp. 155–68.
Reitsema, T 2009, Antifouling biocides in Perth coastal waters: a snapshot at selected areas of vessel activity, Water Science Technical Series Report No. 1 Department of Water, Western Australia.
Roach, AC 2005, ‘Assessment of metals in sediments from Lake Macquarie, New South Wales, Australia, using normalisation models and sediment quality guidelines’, Marine Environmental Research, vol. 59, pp. 453–72.
Rygg, B 1985, ‘Effects of sediment copper on benthic fauna’, Marine Ecology Progress Series, vol. 25, pp. 83–9.
Sapozhnikova, Y, Bawardi, O & Schlenk, D 2004, ‘Pesticides and PCBs in sediments and fish from the Salton Sea, California, USA’, Chemosphere, vol. 55, pp. 797–809.
Schuytema, GS, Nebeker, AV, Griffis, WL & Wilson, KN 1991, ‘Teratogenesis, toxicity and bioconcentration in frogs exposed to dieldrin’, Archives of Environmental Contamination and Toxicology, vol. 21(3), pp. 332–50.
Shuttleworth, SM, Davison, W & Hamilton-Taylor, J 1999, ‘Two dimensional and fine structure in the concentrations of iron and manganese in sediment pore-waters’, Environmental Science and Technology, vol. 33, pp. 4169–75.
Simonovski, J, Owens, C & Birch, G 2003, ‘Heavy metals in sediments of the Upper Hawkesbury–Nepean River’, Australian Geographical Studies, vol. 41(2), pp. 196–207.
Simpson, SL & Batley, GE 2003, ‘Disturbances to metal partitioning during toxicity testing Fe(II)-rich estuarine porewaters and whole-sediments’, Environmental Toxicology and Chemistry, vol. 22, pp. 414–32.
Simpson, SL, Batley, GE, Charton, AA, Stauber, JL, King, CK, Chapman, JC, Hyne, RV, Gale, SA, Roach, AC & Maher, WA 2005, Handbook for sediment quality assessment, CSIRO, Bangor, New South Wales.
SRT 1990, Pesticide and metal pollution of the Swan River adjacent to the Bayswater Main Drain, Swan River Trust, Department of Environment and Conservation, Western Australia.
SRT 1999a, Swan Canning Cleanup Program – action plan, Swan River Trust, Department of Environment and Conservation, Western Australia.
SRT 1999b, Swan Canning Cleanup Program: Contaminants in the Swan Canning rivers and estuary, a supporting document to the Swan Canning Cleanup Program action plan, Swan River Trust, Department of Environment and Conservation, Western Australia.
A baseline study of contaminants in the sediments of the Swan and Canning estuaries
Department of Water 53
SRT 2003, Swan Canning Cleanup Program – action plan: Nutrient and contaminant assessment for the Mills Street Main Drain catchment, Swan River Trust, Department of Environment and Conservation, Western Australia.
Standards Australia 1997, Australian standard guide to the sampling and investigation of potentially contaminated soil: Part 1: non-volatile and semi volatile compounds. AS4482.1-1997, Standards Australia, Sydney.
Stokes, PM, Campbell, PGC, Schroeder, WH, Trick, C, France, RL, Puckett, KJ, LaZerte, B, Speyer, M, Hanna, JE & Donaldson, J 1998, Manganese in the Canadian environment, Publication No. NRCC 26193, National Research Council of Canada, NRCC Associate Committee on Scientific Criteria for Environmental Quality, Canada.
Thurlow, BH, Chamber, J & Klemm, V 1986, Swan Canning estuarine system – environment, use and the future, Report 9, Waterways Commission, Western Australia.
Varanasi, U, Reichert, WL, Stein, JE, Brown, DW & Sanborn, HR 1985, ‘Bioavailability and biotransformation of aromatic hydrocarbons in benthic organisms exposed to sediment from an urban estuary’, Environmental Science and Technology, vol. 19, pp. 836–41.
Wang, WX & Fisher, NS 1999, ‘Delineating metal accumulation pathways for marine invertebrates’, Science of the Total Environment, vol. 238, pp. 459–72.
WFPHA 2000, World Federation of Public Health Associations. <www.wfpha.org/pg_projects_pops.htm>.
WHO 1989, Aldrin and dieldrin in drinking water. Background document for development of World Health Organisation Guidelines for drinking water quality, Technical report, Geneva.
Wilson, C, Wienczugow, K, Chambers, JM & Paling, EI 2008, Sediment characterisation of the Vasse-Wonnerup lagoons 2008, Report No. MAFRL 08/4, Marine and Freshwater Research Laboratory Environmental Science, Murdoch University, Murdoch, Australia.

A baseline study of contaminants in the sediments of the Swan and Canning estuaries
54 Department of Water
Disclaimer The maps in this publication were produced by the Department of Water with the intent that they be used for A baseline study of contaminants in the sediments of the Swan and Canning estuaries at the scale of approximately 1:119 000 when printing at A4.
While the Department of Water has made all reasonable efforts to ensure the accuracy of these data, it accepts no responsibility for any inaccuracies, and persons relying on them do so at their own risk.
The Department of Water acknowledges the following datasets and their custodians in the production of the map:
Contaminated reported sites – DEC – 19 June 2008 Drains, Metropolitan Area – WC – 16 April 2002
Information derived from the maps should be confirmed with the data custodian acknowledged by the agency acronym above.
The map has been produced using the following data and projection information:
Vertical Datum: AHD (Australian Height Datum) Horizontal Datum: GDA 94 (Geocentric Datum of Australia 1994) Projection System: Map Grid of Australia (MGA) 1994 Zone 50


Looking after all our water needs
Department of Water168 St Georges Terrace, Perth, Western Australia
PO Box K822 Perth Western Australia 6842Phone: (08) 6364 7600
Fax: (08) 6364 7601www.water.wa.gov.au
technical seriesWaterScience