GOVERNMENT OF ST. LUCIA P R O S P E C T U S ST. LUCIA - GOSL St Lucia - July.pdf · GOVERNMENT OF...
27
GOVERNMENT OF ST. LUCIA P R O S P E C T U S FOR EC$100.0 MILLION BOND Ministry of Finance, International Financial Services & Economic Affairs Financial Center Bridge Street Castries ST. LUCIA Telephone: 1 758 468 5500/1 Fax: 1 758 453 1648 Email: [email protected] PROSPECTUS DATE: JULY 2004 The Prospectus has been drawn up in accordance with the rules of the Regional Government Securities Market. The Regional Debt Co-ordinating Committee and Eastern Caribbean Central Bank accept no responsibility for the content of this Prospectus, make no representations as to its accuracy or completeness and expressly disclaim any liability whatsoever for any loss whatsoever arising from or reliance upon the whole or any part of the contents of this Prospectus. If you are in doubt about the contents of this document or need financial or investment advice you should consult a person licensed under the Securities Act or any other duly qualified person who specializes in advising on the acquisition of government instruments or other securities.
Transcript of GOVERNMENT OF ST. LUCIA P R O S P E C T U S ST. LUCIA - GOSL St Lucia - July.pdf · GOVERNMENT OF...

GOVERNMENT OF ST. LUCIA
P R O S P E C T U S
FOR EC$100.0 MILLION BOND
Ministry of Finance, International Financial Services & Economic Affairs Financial Center
Bridge Street Castries
ST. LUCIA
Telephone: 1 758 468 5500/1 Fax: 1 758 453 1648
Email: [email protected]
PROSPECTUS DATE: JULY 2004
The Prospectus has been drawn up in accordance with the rules of the Regional Government Securities Market. The Regional Debt Co-ordinating Committee and Eastern Caribbean Central Bank accept no responsibility for the content of this Prospectus, make no representations as to its accuracy or completeness and expressly disclaim any liability whatsoever for any loss whatsoever arising from or reliance upon the whole or any part of the contents of this Prospectus. If you are in doubt about the contents of this document or need financial or investment advice you should consult a person licensed under the Securities Act or any other duly qualified person who specializes in advising on the acquisition of government instruments or other securities.

TABLE OF CONTENTS
NOTICE TO INVESTORS ..............................................................................................1
ABSTRACT .......................................................................................................................2
I. GENERAL INFORMATION OF BOND ISSUE...............................................2
II. INFORMATION ABOUT THE BOND ISSUE..................................................3
III. FINANCIAL ADMINISTRATION AND MANAGEMENT .................................5 1. DEBT MANAGEMENT OBJECTIVES ..............................................................................5 2. DEBT MANAGEMENT STRATEGY .................................................................................5 3. TRANSPARENCY AND ACCOUNTABILITY......................................................................5 4. INSTITUTIONAL FRAMEWORK ......................................................................................5 5. RISK MANAGEMENT FRAMEWORK...............................................................................5
IV. ECONOMIC PERFORMANCE AND BOND ISSUE EVALUATION ..............7 1. MACRO-ECONOMIC OVERVIEW......................................................................7 2. SECTORAL DEVELOPMENTS.............................................................................7
a. Agriculture...............................................................................................................7 b. Manufacturing .........................................................................................................8 c. Construction ............................................................................................................9 d. Tourism....................................................................................................................9
3. BALANCE OF PAYMENTS ...................................................................................10 4. FINANCIAL INDICATORS....................................................................................11 5. DEMOGRAPHY ......................................................................................................12
V. CENTRAL GOVERNMENT FISCAL OPERATIONS.........................................13
VI. PUBLIC FINANCES/DEBT ....................................................................................16
VII. CURRENT ISSUES OF GOVERNMENT SECURITIES ..................................18 1. TREASURY BILLS .......................................................................................................18 2. BONDS .......................................................................................................................18 3. DEBT RATING ............................................................................................................18
VIII. SECURITY ISSUANCE PROCEDURES, CLEARANCE
AND SETTLEMENT AND SECONDARY MARKET ACTIVITIES ......................19
APPENDIX I – KEY ECONOMIC INDICATORS....................................................... I
APPENDIX II–SUMMARY MEDIUM TERM PROJECTIONS ...............................II
APPENDIX III - LIST OF LICENSED INTERMEDIARIES................................... IV

NOTICE TO INVESTORS
This Prospectus is issued for the purpose of giving information to the public. The Government of Saint Lucia accepts full responsibility for the accuracy of the information given and confirm having made all reasonable inquiries, that to the best of its knowledge and belief there are no other facts, the omission of which would make any statement in this Prospectus misleading. The Bank of Saint Lucia Limited (BOSL) has prepared this Prospectus solely from information provided by the issuer, the Government of Saint Lucia. Although the information contained in this prospectus is considered reliable, BOSL makes no representation as to the accuracy or completeness of any information contained herein or otherwise provided with respect to this Bond offering. Statements contained in this Prospectus describing documents are provided in summary form only and such documents are qualified in their entirety by reference to such documents. The ultimate decision and responsibility to proceed with any transaction with respect to this offering rests solely with you. Therefore, prior to entering into the proposed investment, you should determine, without reliance upon BOSL or any affiliates, the economic risks and merits, as well as the legal, tax and accounting characteristics and consequences of this Bond offering, and that you are able to assume those risks. This Prospectus and its content are confidential and may not be reproduced or otherwise disseminated in whole or in part for any other purpose.

2
ABSTRACT
The Government of Saint Lucia (thereafter referred to as GOSL) proposes to raise one hundred million Eastern Caribbean dollars (EC$100 million) through the issue of two (2) series of bonds, as follows:
• EC$50 million as a five (5) year debenture with a maximum coupon of 6.5% per annum (Tax Free) payable semi-annually.
• EC$50 million as a ten (10) year debenture with a maximum coupon rate of 7.5% per annum (Tax Free) payable semi-annually.
These bonds are being issued to refinance a portion of existing short-term liabilities and create debt securities with longer maturity profiles, and to finance part of the Central Government’s 2004/2005 Annual Budget. The bonds are being raised under the authority of the National Savings and Development Bond Act No. 7 of 1982 as amended by the National Savings and Development Bonds (Amendment) Act No. 4 of 2004 and through a Parliamentary resolution Statutory Instrument No. 49 of 2004. Under the Constitution of Saint Lucia, the interest and principal repayments are a direct charge on the Consolidated Fund. The GOSL has not been rated by any Regional or International Rating Agency. However, GOSL assigns very high priority to honouring its debt commitments. It has an unblemished track record in meeting debt service obligations in a timely manner, and in complying with the terms and conditions of debentures and loan agreements. No sinking fund is being established for the redemption of these bonds as the GOSL has every confidence that more cost effective alternative arrangements would permit the redemption of the bond at maturity. Additionally, the GOSL has overdraft facilities amounting to EC$25 million to assist in meeting its interest obligations, in the event of shortfall in revenues. These Bonds will be issued in the Regional Government Securities Market (RGSM) and will be traded on the Eastern Caribbean Securities Exchange Ltd (ECSE) under the trading symbols LCN230709 and LCG100714. The Bond issues will be opened for bidding over a two (2) days commencing at 9:00 a.m. on 21st July and closing at 2:00 p.m. and will re open at 9:00 a.m. on 22nd July and close at 2:00 p.m. A competitive uniform price auction will be run at 2:00 p.m. on 22nd July and the coupon for each series will be set at the highest winning yield for that series. These bonds will be issued in multiples of $1,000 and the minimum bid amount is $5,000.00. Settlement for successful bids will take place on 23rd July 2004.
I. GENERAL INFORMATION OF BOND ISSUE Issuer: The Government of the Saint Lucia (GOSL) Address: The Ministry of Finance, International Financial Services & Economics Affairs
Financial Center Bridge Street
3
Castries St. Lucia (WI)
Email: [email protected] Telephone No.: 1-758-468-5500/1 Facsimile No.: 1-758-453-1648
Contact persons: Mr. Trevor Brathwaite, Permanent Secretary Mr. Isaac Anthony, Director of Finance Mr. Francis Fontenelle, Deputy Director of Finance
Date of Publication: July 2004 Purpose of Issue: $50.0M to refinance short-term debt obligations, and create debt
securities with longer maturity profiles and $50.0M to finance part of the Central Government’s 2004/2005 Annual Budget.
Amount of Issue: One Hundred Million Eastern Caribbean Dollars
($100,000,000.00) in two series as follows:
• EC$50 million as a five (5) year debenture with a coupon to a maximum of 6.5% per annum (Tax Free) payable semi-annually;
• EC$50 million as a ten (10) year debenture with a coupon rate to a maximum of 7.5% per annum (Tax Free) payable semi-annually.
Legislative Authority: The National Savings and Development Bond Act No. 7 of 1982 as
amended by the National Savings and Development Bonds (Amendment) Act No. 4 of 2004 and through a Parliamentary resolution Statutory Instrument No. 49 of 2004.
II. INFORMATION ABOUT THE BOND ISSUE a. The GOSL proposes a two series bond issue – a 5 -year, fifty (EC$50) Million Dollar series
and a 10 -year, fifty (EC$50) Million Dollar series. b. The coupon rate payable for the 5-year bond will be to a maximum of 6.5% and for the 10-
year bond a coupon to a maximum 7.5%. No taxes are payable on the income from these bonds.
c. Coupon payments will be payable semi-annually, on 23rd January and 23rd July for the
duration of the bonds. d. The bond issue will be settled on 23rd July 2004.
4
e. The maturity date of the series of issue will be on 23rd July 2009 for the 5-year series and 23rd
July 2014 for the 10-year series consistent, with the maturity terms of the bond issue. f. The series of Bonds will be issued in the Regional Government Securities Market (RGSM)
and will be traded on the Eastern Caribbean Securities Exchange Ltd (ECSE). g. The method of the issue will be a Competitive Uniform Price Auction with open bidding. h. The series of bonds will be identified by their trading symbols LCN230709 and LCG100714. i. The Bond issues will be opened for bidding over a two-day period commencing at 9:00 a.m.
on 21st July 2004 and closing at 2:00 p.m. and will re open at 9:00 a.m. on 22nd July and close at 2:00 p.m. A competitive uniform price auction will be run at 2:00 p.m. on 22nd July, 2004 and the coupon for each series will be set at the highest winning yield for that series.
j. Each investor is allowed one (1) bid per series with the option of increasing the amount being
tendered for up until the close of the bidding period. k. The minimum bid amount is $5,000. l. The Bid Multiplier will be set at $1,000. m. Investors will participate in the auction through the services of any of the licensed
intermediaries for a fee. n. The current list of licensed intermediaries is as follows:
• Antigua & Barbuda Investment Bank Ltd. • Antigua Commercial Bank Ltd. • St. Kitts Nevis Anguilla National Bank Ltd. • Bank of Nevis Ltd. • Bank of St Lucia Ltd. • National Commercial Bank (SVG) Ltd • National Mortgage Finance Company Ltd (Dominica) • FINCOR (Grenada)
o. All currency references will be the Eastern Caribbean Dollar unless stated otherwise.

5
III. FINANCIAL ADMINISTRATION AND MANAGEMENT 1. Debt Management Objectives
The objective of the GOSL is to ensure that the proceeds of debt are used in the most effective manner and that the terms and conditions of debt, including maturity and interest rate, result in the most efficient repayment schedules that are compatible with the periodic cash flows of the Government. 2. Debt Management Strategy
The debt management strategy of the Government is an integral part of its programme of fiscal consolidation. The key elements of the GOSL’s debt management strategy include:
• Maintaining a satisfactory and prudent debt structure; • Refinancing high cost loans to reduce debt servicing and to adjust the maturity profile of
Central Government Debt in a way that balances lower financing cost and risk; • To support the development of a well functioning market to provide low cost funds for
the government. 3. Transparency and Accountability
The GOSL is continuously seeking ways of improving its systems of accountability and transparency. With a view to adopting more prudent and transparent fiscal management practices as well as enhancing the functioning of the Regional Government Securities Market (RGSM), the GOSL intends to borrow using a variety of instruments. As a consequence, disclosure of information on the cash flow and debt stock will be made more frequently to all investors, consistent with the rules of the Regional Debt Coordinating Committee (RDCC). 4. Institutional Framework
The Debt & Investment Unit (DIU) of the Ministry of Finance (MOF) of the GOSL is charged with the responsibility of administering the Government debt portfolio on a day-to-day basis and in implementing Government borrowing strategy. The unit is directly accountable to the Director of Finance. 5. Risk Management Framework The establishment of an effective and efficient debt management system as a major element of economic management is of paramount importance to the Government of St. Lucia (GOSL). Accordingly, attempts have been made to strengthen the capacity of the Debt & Investment Unit (DIU) and a Deputy Director of Finance who has responsibility for the unit has been appointed. Consequently, the DIU’s functions has been broadened to include:
• Assisting in the formulation of debt management policies and strategies;

6
• Managing the debt portfolio to minimize cost with an acceptable risk profile; • Conducting risk analysis and developing risk management policies; and • Conducting debt sustainability analysis to assess optimal borrowing levels.
7
IV. ECONOMIC PERFORMANCE AND BOND ISSUE EVALUATION 1. MACRO-ECONOMIC OVERVIEW
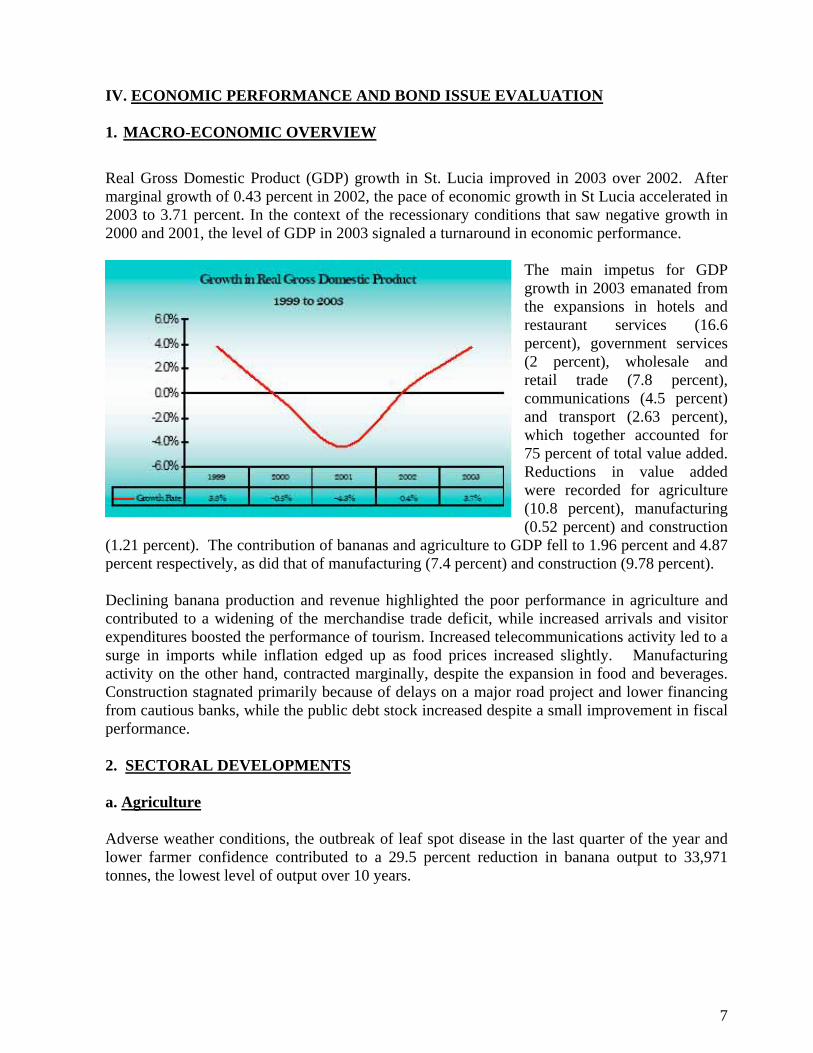
Real Gross Domestic Product (GDP) growth in St. Lucia improved in 2003 over 2002. After marginal growth of 0.43 percent in 2002, the pace of economic growth in St Lucia accelerated in 2003 to 3.71 percent. In the context of the recessionary conditions that saw negative growth in 2000 and 2001, the level of GDP in 2003 signaled a turnaround in economic performance.
The main impetus for GDP growth in 2003 emanated from the expansions in hotels and restaurant services (16.6 percent), government services (2 percent), wholesale and retail trade (7.8 percent), communications (4.5 percent) and transport (2.63 percent), which together accounted for 75 percent of total value added. Reductions in value added were recorded for agriculture (10.8 percent), manufacturing (0.52 percent) and construction
(1.21 percent). The contribution of bananas and agriculture to GDP fell to 1.96 percent and 4.87 percent respectively, as did that of manufacturing (7.4 percent) and construction (9.78 percent). Declining banana production and revenue highlighted the poor performance in agriculture and contributed to a widening of the merchandise trade deficit, while increased arrivals and visitor expenditures boosted the performance of tourism. Increased telecommunications activity led to a surge in imports while inflation edged up as food prices increased slightly. Manufacturing activity on the other hand, contracted marginally, despite the expansion in food and beverages. Construction stagnated primarily because of delays on a major road project and lower financing from cautious banks, while the public debt stock increased despite a small improvement in fiscal performance. 2. SECTORAL DEVELOPMENTS a. Agriculture Adverse weather conditions, the outbreak of leaf spot disease in the last quarter of the year and lower farmer confidence contributed to a 29.5 percent reduction in banana output to 33,971 tonnes, the lowest level of output over 10 years.

8
Saint Lucia’s share of the Windwards’ group output of 67,301 tonnes increased however from 41 to 49 percent as a result of larger declines in production from the other two main producers. Market conditions were characterized by price competition among the UK supermarket chains, which depressed prices, and in conjunction with the lower output, led to a 25.7 percent fall in banana revenue to $43.6 million. Farmers’ returns from
the industry were constrained despite the appreciation of the Pound Sterling and due to the increased transaction costs associated with requirements to gain EUREP-GAP certification. Available data indicate that an expansion of export demand led to an increase in output in nontraditional crops. While the volume of total production, which includes exports and purchases by supermarkets and hotels increased by 5.5 percent to 5,703.5 tonnes, unfavourable prices caused a decline in the value of production by 1.8 percent to $11.2 million. There were contrasting movements in the level of purchases by hotels and supermarkets, the former increasing more than two-fold in line with increased tourism activity and the latter falling by 24.3 percent as one of two major retail chains experienced financial difficulties. Exports expanded by 11.9 percent but poor prices, especially for green bananas, led to a reduction in export revenue. Fish landing experienced a 13.7 percent reduction to 1,028.9 tonnes (ex-vessel value $11.4 million) from January to July 2003, while production and consumption of chicken increased by 2.2 percent to 904.6 tonnes (value $6.9 million) or 11.9 percent of the domestic market. b. Manufacturing The value of manufacturing output is estimated to have declined in 2003 by 1 percent to $135.8 million. The overall sector’s performance was restrained due to the closure of some plants as a
result of lower demand. Total exports by the industry increased by 15.8 percent to $60.8 million and accounted for 45 percent of total production. Approximately, 74 percent of the value of output came from three sub-sectors; food and beverages (45 percent), electrical products (14 percent) and
9
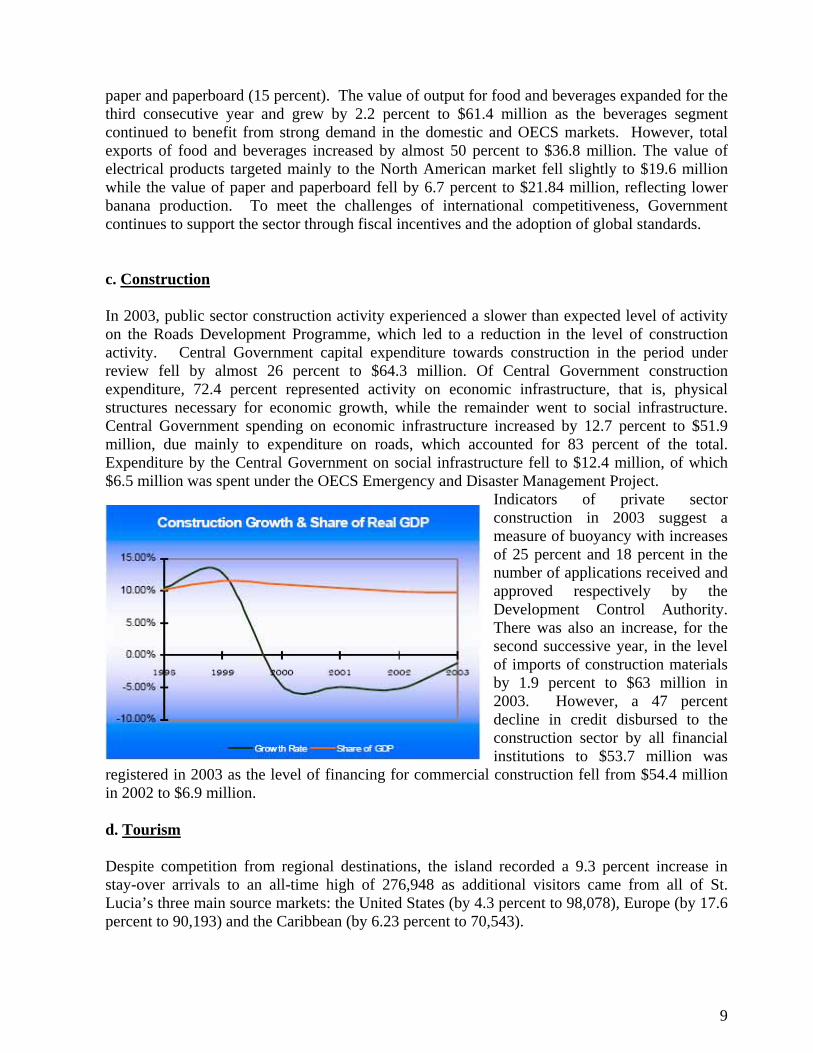
paper and paperboard (15 percent). The value of output for food and beverages expanded for the third consecutive year and grew by 2.2 percent to $61.4 million as the beverages segment continued to benefit from strong demand in the domestic and OECS markets. However, total exports of food and beverages increased by almost 50 percent to $36.8 million. The value of electrical products targeted mainly to the North American market fell slightly to $19.6 million while the value of paper and paperboard fell by 6.7 percent to $21.84 million, reflecting lower banana production. To meet the challenges of international competitiveness, Government continues to support the sector through fiscal incentives and the adoption of global standards. c. Construction In 2003, public sector construction activity experienced a slower than expected level of activity on the Roads Development Programme, which led to a reduction in the level of construction activity. Central Government capital expenditure towards construction in the period under review fell by almost 26 percent to $64.3 million. Of Central Government construction expenditure, 72.4 percent represented activity on economic infrastructure, that is, physical structures necessary for economic growth, while the remainder went to social infrastructure. Central Government spending on economic infrastructure increased by 12.7 percent to $51.9 million, due mainly to expenditure on roads, which accounted for 83 percent of the total. Expenditure by the Central Government on social infrastructure fell to $12.4 million, of which $6.5 million was spent under the OECS Emergency and Disaster Management Project.
Indicators of private sector construction in 2003 suggest a measure of buoyancy with increases of 25 percent and 18 percent in the number of applications received and approved respectively by the Development Control Authority. There was also an increase, for the second successive year, in the level of imports of construction materials by 1.9 percent to $63 million in 2003. However, a 47 percent decline in credit disbursed to the construction sector by all financial institutions to $53.7 million was
registered in 2003 as the level of financing for commercial construction fell from $54.4 million in 2002 to $6.9 million. d. Tourism Despite competition from regional destinations, the island recorded a 9.3 percent increase in stay-over arrivals to an all-time high of 276,948 as additional visitors came from all of St. Lucia’s three main source markets: the United States (by 4.3 percent to 98,078), Europe (by 17.6 percent to 90,193) and the Caribbean (by 6.23 percent to 70,543).
10
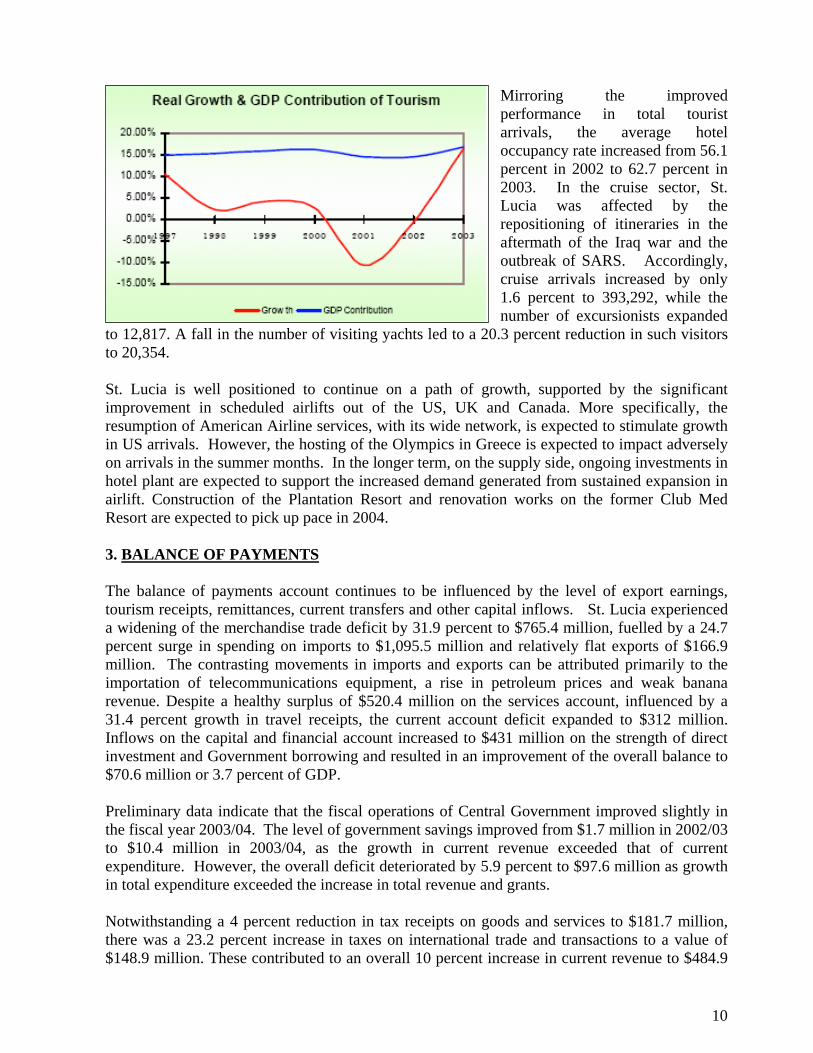
Mirroring the improved performance in total tourist arrivals, the average hotel occupancy rate increased from 56.1 percent in 2002 to 62.7 percent in 2003. In the cruise sector, St. Lucia was affected by the repositioning of itineraries in the aftermath of the Iraq war and the outbreak of SARS. Accordingly, cruise arrivals increased by only 1.6 percent to 393,292, while the number of excursionists expanded
to 12,817. A fall in the number of visiting yachts led to a 20.3 percent reduction in such visitors to 20,354. St. Lucia is well positioned to continue on a path of growth, supported by the significant improvement in scheduled airlifts out of the US, UK and Canada. More specifically, the resumption of American Airline services, with its wide network, is expected to stimulate growth in US arrivals. However, the hosting of the Olympics in Greece is expected to impact adversely on arrivals in the summer months. In the longer term, on the supply side, ongoing investments in hotel plant are expected to support the increased demand generated from sustained expansion in airlift. Construction of the Plantation Resort and renovation works on the former Club Med Resort are expected to pick up pace in 2004. 3. BALANCE OF PAYMENTS The balance of payments account continues to be influenced by the level of export earnings, tourism receipts, remittances, current transfers and other capital inflows. St. Lucia experienced a widening of the merchandise trade deficit by 31.9 percent to $765.4 million, fuelled by a 24.7 percent surge in spending on imports to $1,095.5 million and relatively flat exports of $166.9 million. The contrasting movements in imports and exports can be attributed primarily to the importation of telecommunications equipment, a rise in petroleum prices and weak banana revenue. Despite a healthy surplus of $520.4 million on the services account, influenced by a 31.4 percent growth in travel receipts, the current account deficit expanded to $312 million. Inflows on the capital and financial account increased to $431 million on the strength of direct investment and Government borrowing and resulted in an improvement of the overall balance to $70.6 million or 3.7 percent of GDP. Preliminary data indicate that the fiscal operations of Central Government improved slightly in the fiscal year 2003/04. The level of government savings improved from $1.7 million in 2002/03 to $10.4 million in 2003/04, as the growth in current revenue exceeded that of current expenditure. However, the overall deficit deteriorated by 5.9 percent to $97.6 million as growth in total expenditure exceeded the increase in total revenue and grants. Notwithstanding a 4 percent reduction in tax receipts on goods and services to $181.7 million, there was a 23.2 percent increase in taxes on international trade and transactions to a value of $148.9 million. These contributed to an overall 10 percent increase in current revenue to $484.9

11
million. However, there was a smaller increase of 7.9 percent in current expenditure to a value of $474.5 million which was primarily a consequence of an 11 percent increase in wages and salaries to $235.1 million which accompanied a 14.7 percent increase in expenditure on goods and services to $89.5 million. Capital expenditure fell by 2 percent to $146.9 million. This reflected the absence of significant financing from local revenue in the context of the small surplus; the share of loan financing in capital expenditure remained at 83 percent. In 2003/04, debt of Central Government increased by 17.2 percent to $968.15 million as Government sought to stimulate the economy. Although Government Guaranteed debt slipped by 4.71 percent to $187.86 million, the total outstanding liabilities of the public sector increased by 13.3 percent to $1,237.87 million or approximately 65 percent of GDP at the end of December 2003. External debt (75 percent of the total) increased by 32 percent to $910.14 million while domestic debt fell by 21 percent to $303 million, as Government refinanced some of its domestic debt in order to reduce servicing costs in 2003/04. In keeping with higher amortization associated with the refinancing of 2002/03 there was a 20.4 percent reduction in Central Government debt servicing in 2003/04 to $71.7 million, of which interest payments rose by 18.5 percent to $55.2 million. As a result, for 2003/04, the debt service to current revenue ratio fell to 0.2 percentage points below the prudential benchmark of 15 percent. 4. FINANCIAL INDICATORS Developments in the financial sector for 2003 mirrored the level of activity in the real economy. Liquidity, as measured by the loans to deposit ratio, improved by 10.07 percentage points from the year-end 2002 to 81.88 at year end 2003, as the growth in deposits accompanied a slower reduction in loans and advances. This was as a result of contrasting movements in the growth of deposits and the provision of loans and advances to the economy. Total deposits increased at a faster rate of 8.1 percent to $2,022.76 million compared to a decrease in loans and advances of 3.8 percent to $1,656.3 million. In an effort to reduce the non-performing loans portfolio, banks remained cautious in their approach to new lending. As a result, the level of domestic credit fell by 7.6 percent to $1,323.4 million. Credit to the private sector increased by 4.5 percent to $1,483.06 million as the combined deposits of the other sectors, including Central Government exceeded their credit. Of private sector credit, which received the bulk of domestic credit, household credit increased by 4.3 percent to $762.35 million while business credit fell significantly by 12.4 percent to $720.72 million. The behaviour of credit by economic activity revealed that there were reductions in credit to all sectors except personal and tourism. Personal financing, comprising mainly acquisition of property and durable consumer goods accounted for the largest share of total credit (47 percent) and increased by 2.5 percent to $76.84 million, partly as a result of a slight reduction in mortgage lending rates. Favourable developments within tourism resulted in the attraction of 6.8 percent additional financing to $203.1 million from the banking system.
12
Total savings and deposit liabilities of the banking system increased to $2,022.76 million or 78 percent of total domestic liabilities. The general increase in the level of thrift in the economy saw deposits by residents increase by almost 7 percent to $1,871.45 million, while deposits by non-residents fell by 1.3 percent to $145.31 million. From the other perspective of the monetary aggregate, there were increases in both the narrow measure of the money supply (M1), due to increases in private sector demand deposits, and quasi-money, on the strength of increases in savings deposits. There were a few downward changes to the level of interest rates over the period, due primarily to a combination of weak credit demand and excess liquidity. The rate of inflation, as measured by the percentage change in the 12-month moving average of Domestic Consumer Price Index to December 2003, increased slightly to 1 percent on account of a 2.1 percent increase in the food index; the most heavily weighted category. 5. DEMOGRAPHY According to preliminary estimates, Saint Lucia’s population grew by 0.9 percent to 160,620 in 2003. This reflects the decreasing population growth rate since 1992. Women continue to be in the slight majority, accounting for 51 percent of the population. The natural increase of the population (the difference between the number of live births and the number of deaths) was 1,848 or 61 fewer than 2002. The continued deceleration in population growth in 2003 is explained by a reduction in the birth rate from 18.1 to 17.6 per thousand, while the death rate remained constant at 6.1. Male live births equaled female live births, whilst male deaths accounted for 53 percent of total deaths. The increase of the population over the same land area resulted in population density (the number of residents per square mile) increasing to 772 from 765 in 2002. All administrative districts recorded increases in their respective populations with the most populous being Castries (41 percent of the total), Gros Islet (13 percent) and Micoud (10 percent). The share of economically active adults (individuals aged 15-64) in St Lucia’s population increased in 2003 to 63.2 percent from 62.3 in 2002, while the share of dependent children (aged below 15 years) and dependent adults (aged over 64) fell to 29.6 percent and 7.2 percent respectively. This resulted in a dependency ratio (the ratio of dependent adults and children to economically active individuals) of 1:1.7, a slight improvement over 2002’s ratio of 1:1.6, and indicates that there are marginally more economically active adults to each dependent member of the population.
13
V. CENTRAL GOVERNMENT FISCAL OPERATIONS Overview and Policy Strategy The measures introduced in the fiscal year 2002/2003 and 2003/04 were aimed at ensuring stability and consolidation over the medium term. The budget outlined reforms focused on freeing the economy from excessive bureaucratic controls which serve as hindrances to investment, revitalizing the rural economy and encouraging private sector participation in developing industrial and service oriented activities. It was expected that those measures would accelerate the growth momentum and cause a revival of the economy. In the fiscal consolidation process the government has given priority to reforming the tax system, broadening the tax base and strengthening the tax administration to enhance collection. To address the weakness in the existing tax administration and to improve efficiency, the government announced the establishment of a Revenue Authority which will combine the administration of Inland Revenue and Customs and Excise departments under one authority. A tax policy unit has also been established with assistance from Eastern Caribbean Economic Management Programme (ECEMP) to undertake a review of the tax structure in order to broaden the tax base. On the expenditure side, the containment of recruitment to the public service was implemented to curtail current expenditure. Reforms to the public service pension scheme were also announced as a means of improving future overall fiscal performance. It was recognized that a noncontributory pension scheme would not be sustainable in the long term and would dampen fiscal consolidation efforts in the future. Effective February 1 2003, all new entrants in the public service are required to contribute to a pension fund managed by the National Insurance Scheme. Currently, the Government of St. Lucia is receiving assistance from Caribbean Technical Assistance Centre (CARTAC) and ECCB in conducting a financial programming exercise, which would inform the government’s fiscal policy strategy for the period 2004 to 2007. Overall Developments Central Government’s efforts aimed at stimulating economic growth through fiscal expansion led to an overall deficit of $97.6 million in 2003/04, a marginal deterioration over the previous fiscal year. The overall result reflects a faster growth in total expenditure vis-à-vis that of total revenue and grants. The impact of improved economic performance and the implementation of new revenue generating measures in 2003/04 outweighed the effects of tax incentives and other tax reducing measures and helped increase total revenue and grants by 5.2 percent to $523.78 million. Total expenditure increased by 5.4 percent to $621.4 million due to contrasting movements in capital and current expenditure. The level of Government savings improved from $1.7 million in 2002/03 to $10.4 million in 2003/04 as the growth in current revenue exceeded that of current expenditure.

14
During 2003, the operations of the Central Government led to favourable performances against the initial fiscal targets that were set at the beginning of the fiscal year. The current revenue to GDP is projected to be 1.8 percentage points above the initial target while current expenditure as a percent of GDP is estimated to be 0.9 percentage points below the approved estimates of 25.8 percent. As a result, there is an anticipated current account surplus of 0.5 percent as against the targeted deficit of 0.01 percent of GDP. Revenue Performance The growth in total revenue and grants reflects growth of current revenue by 9.8 percent to $ 484.9 million that outweighed the reduction in grant funding and capital revenue. During 2003/04, a number of revenue enhancing measures were introduced. These include:
• Continuation of the 1st phase of the tax arrears payment plan • An increase in driver’s license fees by 100 percent; • An increase in the service charge from 4 percent to 5 percent; • An increase in the consumption tax to 5 percent on selected items; and • The introduction of the Security Charge.
However, as Government sought to improve the equity and progressivity of the tax system and provide incentives to households and businesses, the following tax reducing measures were introduced:
• An increase in the personal income tax threshold from $14,000 to $16,000; • A reduction in the corporate tax rate by one third of a percentage point (the effect will be
felt in 2004/05 as taxes are paid on profits with a one-year lag); • A reduction in stamp duty for mortgage refinancing; • A reduction in excise tax on motor vehicles; and • An exemption of pensioners from land and house taxes.
The performance of total revenue and grants continues to reflect the behaviour of tax revenue which accounted for 84.8 percent of the former. Tax revenue increased by 9.7 percent to $444.5 million and reflected improved performance in taxes from international trade, taxes on goods and services and to a lesser extent, taxes on income and profits. The increased revenues from taxes on income and profits to $110.0 million reflected improved business performance and large receipts to settle arrears despite the increase in the threshold of chargeable income to $16,000.

15
Expenditure Performance The continued focus on investment to improve social and economic infrastructure and the recurrent components of capital programmes drove the growth of total expenditure by 0.7 percent to $621.4million. Capital expenditure fell by 2.1 percent to $146.9 million. On the other hand, current expenditures rose by 7.9 percent to $474.5 million due to increases in interest payments, consumption of goods and services, salaries and wages and retirement benefits. Current Expenditure With the exception of transfers, all major categories of current expenditure recorded increases. Wages and salaries, which accounted for 49.5 percent of current expenditure, grew by 11.1 percent to $235.1million on account of a 3 percent increase in salaries in January 2004 and payment of a bonus upon the finalization of the bargaining process between unions and the Government of Saint Lucia. Government’s consumption of goods and services, which accounts for the second largest share of current expenditure (18.9 percent), increased by 14.7 percent to $89.5 million reflecting increases in most components of this category. Rental of property recorded the largest increase (39.5 percent) to $17.2 million or 19.1 percent of expenditure on goods and services with the commencement of lease payments upon the completion of major projects by the Ministry of Home Affairs. Interest payments grew by 18.5 percent to $55.2 million owing to increased disbursement for new and existing project requirements. Domestic interest payments fell by 13.0 percent to $19 million, while external interest commitments increased by 46.3 percent to $36.2 million. The reduction in domestic payments was due to the refinancing of the majority of domestic debt with relatively cheaper external instruments. The increase in external payments mirrored the increased commitments for refinancing and for disbursements for the implementation of major capital projects. Current transfers fell by 17.6 percent to $56.3 million, as a large transfer to a private sector entity during the previous year was not repeated. Capital Expenditure In the review period, capital expenditure decreased by 2.1 percent to $146.9 million. The actual expenditure on capital projects is usually below allocations as most projects have very low implementation rates due to:
• Delays in receipt of grant funds; • Inadequate project preparation and planning; and • Poor institutional capacity.
For the three years prior to the current fiscal year the overall implementation rate averaged less than 50 percent. An analysis of the composition of capital expenditure reveals a significant shift

16
in the allocations across agencies in the fiscal year 2003/04. Government investments shifted primarily to road improvement projects implemented by the Ministry of Communications, Works, Transport and Public Utilities. Capital expenditure incurred by this Ministry stood at $42.6 million, representing an increase to 29.2 percent of capital expenditure from approximately 8 percent in the last fiscal year. Expenditure by the Ministry of Physical Development, Environment and Housing was the second largest component despite a reduction of 39 percent to $19.2 million. The major capital projects included the Black Mallet Landslide and the OECS Disaster Recovery projects. The total expenditure for investments made in the Ministry of Tourism for the promotion of tourism increased by 48 percent to $16.7 million. Capital expenditure by the Ministry of Education, Human Resource Development, Youth and Sports increased to $12.2 million from $2 million in the previous fiscal year in keeping with the continuation of major projects including the OECS Education Development and Technical/Vocational Projects. Investments by the Ministry of Home Affairs slowed to $2.5 million following the completion of the major fire and prison projects in the previous fiscal years. The performance of Central Government is expected to improve over the next fiscal year 2004/05, in line with anticipated growth in real GDP, assuming there are no severe internal and external shocks. However, revenue and expenditure performance for the coming fiscal year is likely to depend largely on changes in policies. In the absence of changes in policy, revenue growth is expected to lag behind economic growth given the current tax system’s limited coverage in major growth sectors. Growth in expenditure will be influenced by decisions that affect the growth of essential components such as expenditure on goods and services and salaries as well as the decision on the degree of expansion of the capital program. VI. PUBLIC FINANCES/DEBT The GOSL adopted an expansionary fiscal stance that led to acceleration in the growth of public debt levels in 2003/04. Public sector debt increased by 13.3 percent to $1,237.9 million mainly from the growth in Central Government’s debt and to a lesser extent non-guaranteed debt. Central Government debt increased by 17 percent to $968.2 million and government guaranteed debt fell by 4.7 percent to $187.9 million. Increased self-sufficiency of a few statutory corporations contributed to the growth of non-guaranteed public debt by 7 percent to $57.2 million. Debt Indicators Public debt as a percent of GDP grew at the end of 2003/04, to 63.8 percent from 54.5 percent at the end of 2002. The ratio of Central Government debt to GDP increased to 9 percentage points, below the 60 prudential threshold. The external debt service ratio increased by 1.4 percentage points to 7 percent, while the Central Government debt service to current revenue ratio decreased by 20 percentage points to 16.4 percent because in the previous year there were large payments for the refinancing of the domestic debt. Domestic Debt

17
There was a 21.7 percent decline in the stock of domestic debt held by the public sector to $303 million, which mirrored Government’s movement to external debt sources this led to:
• Increased liquidity in the domestic financial sector and possibly pressure to reduce domestic interest rates; and
• A reduction in the future stream of debt servicing. Central government debt decreased by 27.4 percent, while government guaranteed debt grew by 3.8 percent. Likewise, the share of central government domestic debt fell from 82.3 percent to 76.3 percent, while that of guaranteed debt increased from 11.8 percent to 15.6 percent. The non-guaranteed component increased from 5.9 percent to 8.1 percent of domestic debt. The refinancing of domestic loans with external debt contributed to a decline of Central Government domestic debt to $231.2 million. Consequently, the proportion of loans fell from 31 percent to 17 percent and that of treasury bills increased to 47 percent as Government continued to rely heavily on the latter as a form of short term financing. Bonded debt increased by $10 million to $82.9 million resulting in an increased share to 36 percent. The stock of debt guaranteed by Central Government to public corporations increased by 3.8 percent to $47.4 million reflecting mixed movements. However, the increased indebtedness associated with new projects by a few statutory bodies outweighed the reduction of others. The increased self-sufficiency of two major statutory organizations and the reduction in government participation in another institution has made it possible for the acquisition and the conversion of loans to non-guaranteed status. As a result, the stock of public non-guaranteed domestic debt increased 6.5 percent to $24.5 million. External Debt The stock of external debt grew by 32 percent to $910.14 million, reflecting the expansion of the public sector’s capital programme and government’s preference for external financing. Central Government debt increased by 45.2 percent to $737 million in 2003. Consequently, its share of public debt rose to 75 percent in 2003 from 66 percent in the previous year. Most of the inflows were used for deficit financing while $34.6 million was for refinancing existing debt. The stock of debt guaranteed by the Government of Saint Lucia fell by 7.3 percent to $140.5million, down from 22 percent of the external debt stock. On the other hand, the stock of non-guaranteed public debt increased by 7.5 percent to $32.65 million.

18
VII. CURRENT ISSUES OF GOVERNMENT SECURITIES 1. Treasury Bills
• Issues Outstanding EC$112,426,000 • Type of Issue Saint Lucia Government Treasury Bills • Maturity in days 91 days • Bills issued on RGSM EC$27,000,000 • Type of Issue Saint Lucia Government Treasury Bills • Maturity in days 365 days
2. Bonds
• Issues Outstanding 3 issues totaling $82,885,800.00 • Type of Issue Saint Lucia Government Debentures • Maturity in Years 10 years respectively • Year of subscription 1996, 1997 and 2002 respectively • Redemption Date 2006, 2007 and 2012 respectively
3. Debt Rating The GOSL has not been rated by any International or Regional rating agency. The GOSL has never defaulted on its repayment of contracted debt. It has maintained a strong relationship with its creditors and has been consistent in its debt servicing both domestically and internationally.

19
VIII. SECURITY ISSUANCE PROCEDURES, CLEARANCE AND SETTLEMENT AND SECONDARY MARKET ACTIVITIES
The series of bonds will be issued and listed on the Regional Government Securities Market (RGSM). This market will operate on the Eastern Caribbean Securities Exchange (ECSE) trading platform for both primary issuance and secondary trading. The pricing methodology to be used for selling the securities will be a competitive uniform auction with open bidding. The ECSE is responsible for dissemination of market information, providing intermediaries with market access, administering the auction process and monitoring and surveillance of the auctions. The ECSE, through the Eastern Caribbean Central Securities Depository (ECCSD), will be responsible for facilitating clearance and settlement for the securities allotted. The ECCSD will ensure that funds are deposited to the account of the Government of Saint Lucia. The ECSE, through the Eastern Caribbean Central Securities Registry (ECCSR), will record and maintain ownership of the government securities in electronic book-entry form. The ECCSR will mail confirmation of proof of ownership letters to all investors who were successful in the auction. The ECCSR will also process corporate action on behalf of issuing governments.
Intermediaries will be responsible for interfacing with prospective investors, collecting applications for subscription and processing the same for bidding on the ECSE platform. Investors must provide the intermediaries with funds to cover the cost of the transaction. For this particular offering, investors will pay the applicable brokerage fees to the intermediaries.
A list of licensed intermediaries is provided in Appendix 111. Clients that are successful will be informed of their payment obligations and funds deducted from their respective accounts with the intermediary.
As an issuer in the RGSM, the Government of Saint Lucia will be subject to the rules,
guidelines and procedures developed by the Regional Debt Coordinating Committee
(RDCC) for the operation of the market including ongoing reporting and disclosure
requirements.
i
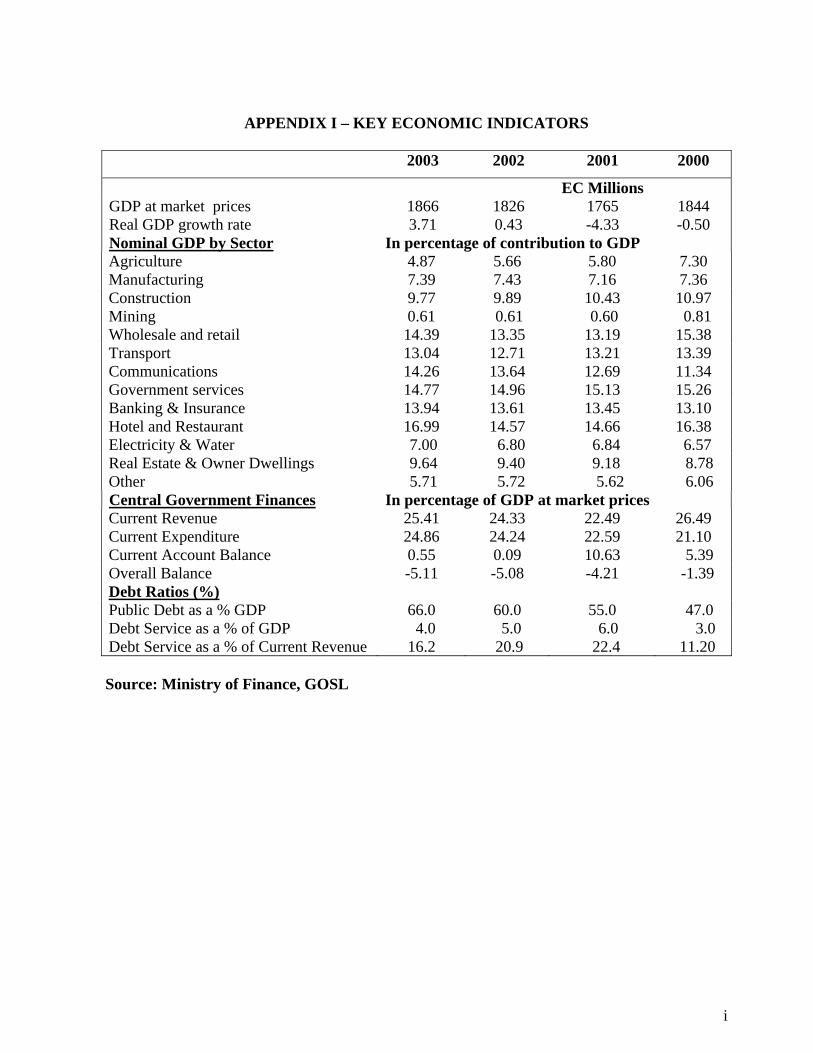
APPENDIX I – KEY ECONOMIC INDICATORS 2003 2002 2001 2000
EC Millions GDP at market prices 1866 1826 1765 1844 Real GDP growth rate 3.71 0.43 -4.33 -0.50 Nominal GDP by Sector In percentage of contribution to GDP Agriculture 4.87 5.66 5.80 7.30 Manufacturing 7.39 7.43 7.16 7.36 Construction 9.77 9.89 10.43 10.97 Mining 0.61 0.61 0.60 0.81 Wholesale and retail 14.39 13.35 13.19 15.38 Transport 13.04 12.71 13.21 13.39 Communications 14.26 13.64 12.69 11.34 Government services 14.77 14.96 15.13 15.26 Banking & Insurance 13.94 13.61 13.45 13.10 Hotel and Restaurant 16.99 14.57 14.66 16.38 Electricity & Water 7.00 6.80 6.84 6.57 Real Estate & Owner Dwellings 9.64 9.40 9.18 8.78 Other 5.71 5.72 5.62 6.06 Central Government Finances In percentage of GDP at market prices Current Revenue 25.41 24.33 22.49 26.49 Current Expenditure 24.86 24.24 22.59 21.10 Current Account Balance 0.55 0.09 10.63 5.39 Overall Balance -5.11 -5.08 -4.21 -1.39 Debt Ratios (%) Public Debt as a % GDP 66.0 60.0 55.0 47.0 Debt Service as a % of GDP 4.0 5.0 6.0 3.0 Debt Service as a % of Current Revenue 16.2 20.9 22.4 11.20 Source: Ministry of Finance, GOSL
ii
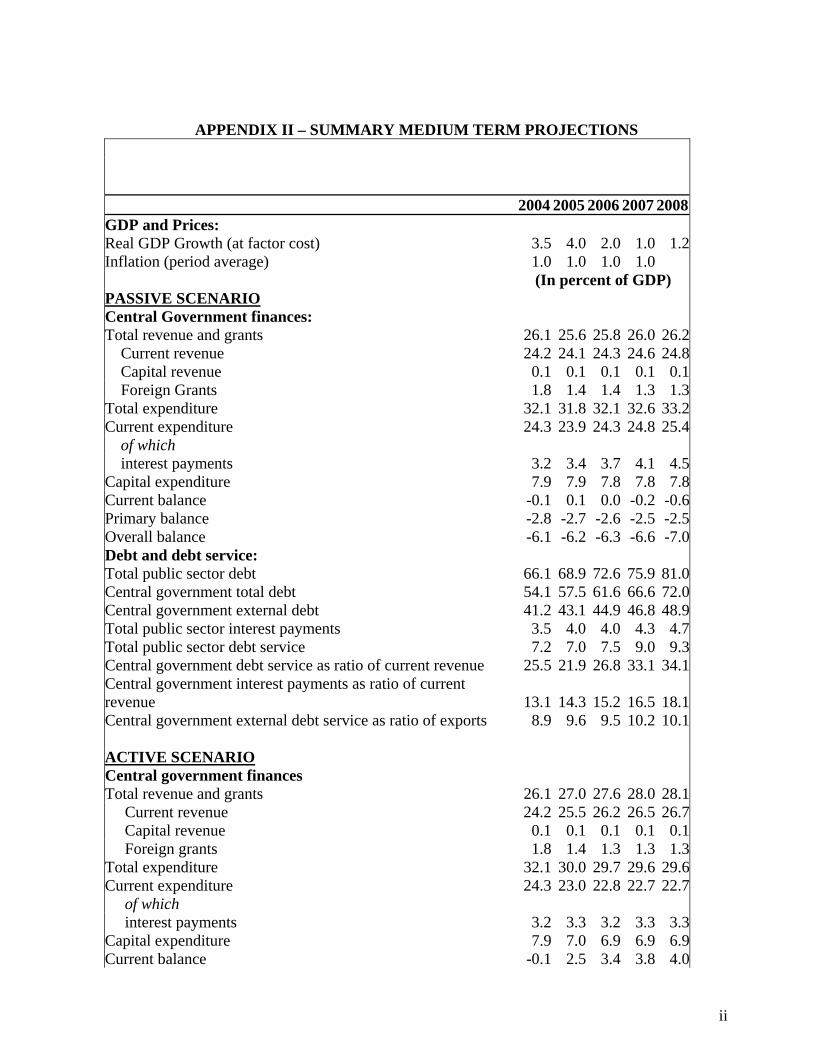
APPENDIX II – SUMMARY MEDIUM TERM PROJECTIONS
2004 2005 2006 2007 2008GDP and Prices: Real GDP Growth (at factor cost) 3.5 4.0 2.0 1.0 1.2Inflation (period average) 1.0 1.0 1.0 1.0 (In percent of GDP) PASSIVE SCENARIO Central Government finances: Total revenue and grants 26.1 25.6 25.8 26.0 26.2 Current revenue 24.2 24.1 24.3 24.6 24.8 Capital revenue 0.1 0.1 0.1 0.1 0.1 Foreign Grants 1.8 1.4 1.4 1.3 1.3Total expenditure 32.1 31.8 32.1 32.6 33.2Current expenditure 24.3 23.9 24.3 24.8 25.4 of which interest payments 3.2 3.4 3.7 4.1 4.5Capital expenditure 7.9 7.9 7.8 7.8 7.8Current balance -0.1 0.1 0.0 -0.2 -0.6Primary balance -2.8 -2.7 -2.6 -2.5 -2.5Overall balance -6.1 -6.2 -6.3 -6.6 -7.0Debt and debt service: Total public sector debt 66.1 68.9 72.6 75.9 81.0Central government total debt 54.1 57.5 61.6 66.6 72.0Central government external debt 41.2 43.1 44.9 46.8 48.9Total public sector interest payments 3.5 4.0 4.0 4.3 4.7Total public sector debt service 7.2 7.0 7.5 9.0 9.3Central government debt service as ratio of current revenue 25.5 21.9 26.8 33.1 34.1Central government interest payments as ratio of current revenue 13.1 14.3 15.2 16.5 18.1Central government external debt service as ratio of exports 8.9 9.6 9.5 10.2 10.1 ACTIVE SCENARIO Central government finances Total revenue and grants 26.1 27.0 27.6 28.0 28.1 Current revenue 24.2 25.5 26.2 26.5 26.7 Capital revenue 0.1 0.1 0.1 0.1 0.1 Foreign grants 1.8 1.4 1.3 1.3 1.3Total expenditure 32.1 30.0 29.7 29.6 29.6Current expenditure 24.3 23.0 22.8 22.7 22.7 of which interest payments 3.2 3.3 3.2 3.3 3.3Capital expenditure 7.9 7.0 6.9 6.9 6.9Current balance -0.1 2.5 3.4 3.8 4.0

iii
Primary balance -2.8 0.3 1.1 1.6 1.8Overall balance (after grants) -6.1 -3.0 -2.1 -1.7 -1.5Debt and debt service: Total public sector (including government guaranteed debt) 66.1 64.8 64.3 63.0 63.0Central government total debt (excluding guaranteed debt) 54.1 53.6 53.5 53.9 54.1Central government external debt 41.2 40.9 40.8 41.0 41.0Total public sector interest payments 3.5 4.0 4.0 4.3 4.7Total public sector debt service 7.2 6.7 6.9 8.1 8.1Central government debt service as ratio of current revenue 25.5 19.9 22.9 27.3 26.9Central government interest payments as ratio of current revenue 13.1 12.8 12.4 12.3 12.3Central government external debt service as ratio of exports 8.9 9.5 9.1 9.7 9.3
(In millions of EC
dollars) External Sector:
Current account of BOP
-220.
0
-246.
5
-271.
8
-235.
3
-222.
7In per cent of GDP -10.9-11.4-12.1-10.2 -9.4
Official net imputed int'l reserves (end of period) 293.
2300.
9308.
5317.
5 Memorandum item:
GDP at market prices GDP (EC$M) 2020
.02156
.22247
.72306
.62359
.7 Source: Ministry of Finance, GOSL

iv
APPENDIX III - LIST OF LICENSED INTERMEDIARIES Institution Contact Addresses Associated Persons Antigua
Antigua Barbuda Investment Bank
Ltd.
P O Box W 1137 Woods Centre Friars Hill Road St John’s Tel: 268 480 2824 Fax: 268 480 2765 Email: [email protected]
Principals Casroy James Representative Laura Abraham
Antigua Commercial Bank Ltd.
ACB Financial Centre P. O. Box 3089 St John’s Tel: 268 481 4200 Fax: 268 481 4229 E Mail: [email protected]
Principals Geoffrey Joseph Representatives Sharon Nathaniel Barbara Martin Dorothea Blackman-Brown
Dominica
National Mortgage Finance
Company of Dominica Ltd.
64 Hillsborough Street Roseau Tel: 767 448 4401/4405 Fax: 767 448 3982 Email: [email protected]
Principals Ralph Blaize Representatives Dawn Yankey Marilyn Edwards
St Kitts and Nevis St Kitts Nevis Anguilla
National Bank P O Box 343 Central Street Basseterre Tel: 869 465 2204 Fax: 869 465 1050 Email: [email protected]
Principals Anthony Galloway Winston Hutchinson Representatives Marlene Nisbett Desilu Smithen
Bank of Nevis Ltd.
P O Box 450 Charlestown Nevis Tel: 869 469 5564 Fax: 869 469 5798 E mail: [email protected]
Principal Rawlinson Isaac Hanzel Manners Representative Lisa Jones Wanda Pinney
St Lucia
Bank of St Lucia P O Box 1862 Principals

v
Institution Contact Addresses Associated Persons Ltd. Bridge Street
Castries Tel: 758 456 6000 Fax: 758 456 6190 Email: bankofsaintlucia.candw.lc
Jean Francois Sonson Sharmaine Rosemond Representative Trevor Lamontagne Lawrence Jean
St. Vincent National Commercial
Bank (SVG) Ltd. P O Box 880 Cnr. Bedford and Grenville Streets Kingstown Tel: 784 457 1844 Fax: 784 456 2612 Email: [email protected]
Principals Keith Inniss Jacqueline Quashie Representative Patricia John
Grenada Republic Finance and Merchant Bank Ltd.
NCB House Grand Anse St. Georges Tel: 1-473-444-1875 Fax: 1-473-444-1879 Email: [email protected]
Principals Bernard McClean Heather Titus Wilma Williams Representative Tarlie Francis Bernard McClean Heather Titus Wilma Williams