GOVERNMENT OF GUJARATpaggujarat.nic.in/reports/Commercial-10-11.pdf · Premature investment 3.4 114...
190
REPORT OF THE COMPTROLLER AND AUDITOR GENERAL OF INDIA FOR THE YEAR ENDED 31 MARCH 2011 No. 4 (COMMERCIAL) GOVERNMENT OF GUJARAT http://saiindia.gov.in
Transcript of GOVERNMENT OF GUJARATpaggujarat.nic.in/reports/Commercial-10-11.pdf · Premature investment 3.4 114...

REPORT OF THE COMPTROLLER AND AUDITOR GENERAL
OF INDIA
FOR THE YEAR ENDED 31 MARCH 2011
No. 4 (COMMERCIAL)
GOVERNMENT OF GUJARAT
http://saiindia.gov.in

Table of contents
i
TABLE OF CONTENTS
Reference to Particulars
Paragraphs Pages Preface v Overview vii - xiii Chapter – I Overview of Government companies and Statutory corporations 1 Introduction 1.1-1.3 1 Audit Mandate 1.4-1.6 1 - 2 Investment in State PSUs 1.7-1.9 2 - 4 Budgetary outgo, grants/subsidies, guarantees and loans 1.10-1.12 4 - 5 Reconciliation with Finance Accounts 1.13-1.14 5 - 6 Performance of PSUs 1.15-1.21 6 - 8 Arrears in finalisation of accounts 1.22-1.27 8 -10 Winding up of non-working PSUs 1.28-1.30 10 - 11 Accounts Comments and Internal Audit 1.31-1.42 11 - 14 Recoveries at the instance of Audit 1.43 14 Status of placement of Separate Audit Reports 1.44 14 - 15 Disinvestment, Privatisation and Restructuring of PSUs 1.45 15 Reforms in Power Sector 1.46-1.47 15 - 16 Chapter – II Performance audits relating to Government Company
2
Dakshin Gujarat Vij Company Limited and Paschim Gujarat Vij Company Limited
Performance Audit of Power Distribution Utilities 2.1 Executive Summary 17 - 19 Introduction 2.1.1-2.1.3 19 - 20 Scope and Methodology of Audit 2.1.4 20 - 21 Audit objectives 2.1.5 21 Audit criteria 2.1.6 21 - 22 Financial Position and Working Results of the selected DISCOMs
2.1.7-2.1.12 22 - 27
Audit Findings 2.1.13-2.1.76 27 - 70 Distribution Network Planning 2.1.14-2.1.16 28 - 30 Implementation of Centrally Sponsored Schemes Rural Electrification 2.1.17-2.1.19 31 - 34 Restructured Accelerated Power Development Reforms Programme 2.1.20-2.1.25 34 - 38 Operational efficiency 2.1.26 38
Audit Report No.4 (Commercial) for the year ended 31 March 2011
ii
Reference to Particulars Paragraphs Pages
Purchase of Power 2.1.27 38 Sub-transmission & Distribution Losses 2.1.28-2.1.45 39 - 50 Billing Efficiency 2.1.46-2.1.50 50 - 51 Revenue collection efficiency 2.1.51-2.1.60 52 - 58 Financial Management 2.1.61-2.1.65 58 - 61 Subsidy Support and Cross Subsidisation 2.1.66-2.1.68 61 - 63 Tariff Fixation 2.1.69-2.1.72 64 - 67 Consumer Satisfaction 2.1.73-2.1.74 67 - 69 Energy Conservation 2.1.75 69 Energy Audit 2.1.76 69 - 70 Acknowledgement 71 Conclusion 71 Recommendations 72 Gujarat State Petroleum Corporation Limited Functioning of Gujarat State Petroleum Corporation Limited
2.2
Executive Summary 73 - 74 Introduction 2.2.1-2.2.2 75 Scope of Audit 2.2.3 75 Audit objectives 2.2.4 76 Audit criteria 2.2.5 76 Audit methodology 2.2.6 77 Financial Position and Working Results 2.2.7-2.2.8 77 - 78 Audit Findings 2.2.9-2.2.50 78 - 106 Bidding for the hydrocarbon blocks and its acquisition 2.2.10-2.2.17 79 - 85 Exploration 2.2.18-2.2.32 85 - 96 Development 2.2.33-2.2.37 96 - 99 Production 2.2.38-2.2.39 99 Marketing 2.2.40-2.2.42 100 - 102 Finance 2.2.43-2.2.48 102 - 106 Internal Control and Monitoring Mechanism 2.2.49 106 Acknowledgement 106 Conclusion 106 - 107 Recommendations 107 Chapter – III Transaction Audit Observations 3 Government Companies Gujarat State Civil Supplies Corporation Limited Imprudent decision for re-inviting tender 3.1 109 - 110 Sardar Sarovar Narmada Nigam Limited Unfruitful investment 3.2 111 - 112
Table of contents
iii
Reference to Particulars Paragraphs Pages
Avoidable payment of interest on enhanced compensation 3.3 112 - 114 Premature investment 3.4 114 - 115 Gujarat State Electricity Corporation Limited Non commissioning of Ash Collection System 3.5 116 - 117 Avoidable expenditure 3.6 117 - 119 Alcock Ashdown (Gujarat) Limited Loss due to non safeguarding of financial interest 3.7 119 - 120 GSPC Gas Company Limited Non-synchronisation of activities in setting up of CNG stations 3.8 120 - 122
Gujarat State Petronet Limited Undue benefit to a firm 3.9 122 - 124 Avoidable payment of non-utilisation penalty and other charges 3.10 124 - 125
Gujarat Energy Transmission Corporation Limited Loss due to delay in finalisation of tender 3.11 126 - 127 Dahej SEZ Limited Loss of interest due to non adherence to Government instructions
3.12 127 - 128
Gujarat Urja Vikas Nigam Limited Irregular payment 3.13 128 - 130 Statutory Corporations Gujarat State Financial Corporation Short recovery of dues under OTS Scheme 3.14 130 - 131 Gujarat State Road Transport Corporation Avoidable expenditure 3.15 132 - 133 General Follow-up action on Audit Reports 3.16 133 - 135

Audit Report No.4 (Commercial) for the year ended 31 March 2011
iv
Reference to Particulars Annexure Pages
Annexures Statement showing particulars of up to date paid-up capital, loans outstanding and manpower as on 31 March 2011 in respect of Government companies and Statutory corporations
1 137 - 144
Summarised financial results of Government companies and Statutory corporations for the latest year for which accounts were finalised
2 145 - 151
Statement showing grants and subsidy received/receivable, guarantees received, waiver of dues, loans written off and loans converted into equity during the year and guarantee commitment at the end of March 2011
3 152 - 155
Statement showing investments made by State Government in PSUs whose accounts are in arrears
4 156
Statement showing financial position of Statutory corporations 5 157 - 158 Statement showing working results of Statutory corporations 6 159 - 160 Statement showing particulars of distribution network planned vis-à-vis achievement there against for the DISCOMs as a whole and also DGVCL and PGVCL during 2006-07 to 2010-11
7 161 - 162
Statement showing loss of revenue due to slow replacement of conventional meters with static/quality meters in selected DISCOMs
8 163
Statement showing loss of revenue due to non-metering of Un-metered Agricultural consumers
9 164 - 165
Statement showing targets and actual performance of checking, theft cases detected, assessment made and amount realised for the five years ending 31 March 2011
10 166
Statement showing gross subsidies in major sectors of consumers in DGVCL and PGVCL as approved in tariff orders by GERC for 2006-11
11 167
Statement showing the time taken for pre drilling Environment Impact Studies
12 168
Status of testing of wells in Blocks 13 169 Statement showing erroneous calculation of amount under One Time Settlement scheme by Gujarat State Financial Corporation
14 170
Statement showing paragraph/performance audit reports for which explanatory notes were not received
15 171
Statement showing the department-wise outstanding Inspection Reports (IRs)
16 172
Statement showing the department-wise draft paragraphs/ performance audit reports reply to which are awaited as on 30 November 2011
17 173

v
Preface
Government commercial concerns, the accounts of which are subject to audit by the Comptroller and Auditor General of India (CAG), fall under the following categories:
• Government companies,
• Statutory corporations, and
• Departmentally managed commercial undertakings.
2. This Report deals with the results of audit of Government companies and Statutory corporations and has been prepared for submission to the Government of Gujarat under Section 19A of the Comptroller and Auditor General’s (Duties, Powers and Conditions of Service) Act, 1971, as amended from time to time. The results of audit relating to departmentally managed commercial undertakings are included in the Report of the Comptroller and Auditor General of India (Civil) - Government of Gujarat.
3. Audit of the accounts of Government companies is conducted by the CAG under the provisions of Section 619 of the Companies Act, 1956.
4. In respect of Gujarat State Road Transport Corporation, which is a Statutory Corporation, the CAG is the sole auditor. As per the State Financial Corporations (Amendment) Act, 2000, CAG has the right to conduct the audit of accounts of Gujarat State Financial Corporation in addition to the audit conducted by the Chartered Accountants, appointed by the Corporation out of the panel of auditors approved by the Reserve Bank of India. In respect of Gujarat State Warehousing Corporation, CAG has the right to conduct the audit of accounts in addition to the audit conducted by the Chartered Accountants, appointed by the State Government in consultation with CAG. The audit of accounts of Gujarat Industrial Development Corporation was entrusted to the CAG under Section 19(3) of the Comptroller and Auditor General’s (Duties, Powers and Conditions of Service) Act, 1971 for a period of five years from 1977-78 and has been extended from time to time up to the accounts for the year 2011-12. In respect of Gujarat Electricity Regulatory Commission, CAG is the sole auditor. The Audit Reports on the annual accounts of all these Corporations/Commission are forwarded separately to the State Government.
5. Audits have been conducted in conformity with the Auditing Standards issued by the CAG.
6. The cases mentioned in this Report are those which came to notice in the course of audit during the year 2010-11 as well as those which came to notice in earlier years but were not dealt with in the previous Reports. Matters relating to the period subsequent to 2010-11 have also been included, wherever necessary.

Audit Report No.4 (Commercial) for the year ended 31 March 2011
vi
Overview
vii
Overview
1. Overview of Government Companies and Statutory Corporations
Audit of Government companies is governed by Section 619 of the Companies Act, 1956. The accounts of Government companies are audited by Statutory Auditors appointed by CAG. These accounts are also subject to supplementary audit conducted by CAG. Audit of Statutory corporations is governed by their respective legislations. As on 31 March 2011, the State of Gujarat had 60 working PSUs (56 companies and four Statutory corporations) and 13 non-working PSUs (all companies). The working PSUs which employed 1.09 lakh employees, had registered a turnover of ` 63008.20 crore for 2010-11 as per their latest finalised accounts as on 30 September 2011. This turnover was equal to 12.24 per cent of State GDP indicating an important role played by State PSUs in the State economy. During 2010-11, the working PSUs earned an overall aggregate profit of ` 2,662.94 crore as per their latest finalised accounts as on 30 September 2011. The aggregate accumulated profits of all PSUs were ` 169.34 crore as per their latest finalised accounts.
Investments in PSUs
As on 31 March 2011, the investment (capital and long term loans) in 73 PSUs was ` 67,351.96 crore. It grew by 44.64 per cent from ` 46,563.67 crore in 2005-06. Besides the Miscellaneous sector, the thrust of PSU investment was mainly in Power sector in which percentage share of investment increased from 31.44 in 2005-06 to 31.88 in 2010-11. The Government contributed ` 9,266.03 crore towards equity, loans and grants/ subsidies to State PSUs during 2010-11.
Performance of PSUs
During the year 2010-11, out of 60 working PSUs, 41 PSUs earned profit of ` 3,145.83 crore and eight PSUs incurred loss of ` 482.89 crore as per their latest finalised accounts as on 30 September 2011. Major contributors to the profit were Gujarat State Petronet
Limited (` 765.00 crore), Gujarat Mineral Development Corporation Limited (` 584.61 crore) and Gujarat State Petroleum Corporation Limited (` 403.62 crore). The heavy losses were incurred by Gujarat State Road Transport Corporation (` 159.74 crore), Gujarat State Financial Corporation (` 156.91 crore) and Alcock Ashdown (Gujarat) Limited (` 131.44 crore).
Though the PSUs were earning profits, there were instances of various deficiencies in the functioning of PSUs. A review of three years’ Audit Reports of CAG shows that the State PSUs’ losses of ` 4,216.53 crore and infructuous investment of ` 300.98 crore were controllable with better management. Thus, there is tremendous scope to improve the functioning and enhance profits/ minimise losses. The PSUs can discharge their role efficiently only if they are financially self reliant. There is a need for greater professionalism and accountability in the functioning of PSUs.
Quality of accounts
The quality of accounts of PSUs needs improvement. Eighteen out of 58 accounts finalised during October 2010 to September 2011 received qualified certificates. There were 24 instances of non-compliance with Accounting Standards in 10 accounts. Reports of Statutory Auditors on internal control of the companies indicated several weak areas.
Arrears in accounts and winding up
Twenty seven working PSUs had arrears of 38 accounts as of September 2011. The arrears need to be cleared by setting targets for PSUs and outsourcing the work relating to preparation of accounts. There were 13 non-working companies. As no purpose is served by keeping these PSUs in existence, they need to be wound up quickly.
(Chapter 1)

Audit Report No. 4 (Commercial) for the year ended 31 March 2011
viii
2. Performance audits relating to Government Companies
Performance audits relating to ‘Power Distribution Utilities’ and ‘Functioning of Gujarat State Petroleum Corporation Limited’ were conducted.
Executive summary of performance audit on ‘Power Distribution Utilities in Gujarat viz., Dakshin Gujarat Vij Company Limited and Paschim Gujarat Vij Company Limited’ are given below:
The distribution system of the power sector constitutes the final link between the power sector and the consumers. The efficiency of the power sector is judged by the consumers on the basis of performance of this segment. However, it constitutes the weakest part of the sector, which is incurring large losses. In view of the above, the real challenge of reforms in the power sector lies in efficient management of the distribution system. Hence, the National Electricity Policy (NEP) also gives emphasis for the efficiency improvements and recovery of cost of services provided to consumers to make power sector sustainable at reasonable and affordable prices besides others.
Network planning and execution
The creation of distribution network and up-keep of existing network to ensure efficient distribution system for covering maximum population in the State is an important work of Power Distribution Companies (DISCOMs). As on 31 March 2011, the four DISCOMs in Gujarat had a total distribution network of 5,21,157 CKM, 1,190 substations and 4,41,095 transformers for catering supply of power to 1.13 crore consumers. The increase in the distribution capacity during 2006-11 could not match the pace of growth in consumer demand in all the DISCOMs as a whole as well as in Dakshin Gujarat Vij Company Limited (DGVCL) and Paschim Gujarat Vij Company Limited (PGVCL). The inadequacy of available transformers capacity of DISCOMs to meet the connected load as on 31 March 2011 led to overloading of network and consequential rotational cuts in distribution of electricity. In selected three divisions of PGVCL, due to improper management of feeders, the connected load was very low compared to the transformer capacity which led to the loss
of 104.92 million units valuing ` 42.08 crore in the form of iron and copper losses.
Implementation of central schemes
The NEP envisages supply of electricity to all areas including rural areas. Accordingly, Rajiv Gandhi Grameen Vidyutikaran Yojana (RGGVY) of Government of India (GoI) was being implemented. Overall funds of ` 135.33 crore under RGGVY remained unutilised by four DISCOMs (March 2011). Further, the deficiencies viz., delay in execution of work, non-synchronisation of activities, poor workmanship in execution of work, etc., were noticed in implementation of the scheme.
Under GoI’s Restructured Accelerated Power Development Reforms Programme (R-APDRP), the DISCOMs were to establish IT enabled system (Part A) for the distribution management and also to strengthen sub-transmission and distribution system (Part B). As on 31 March 2011, out of ` 23.28 crore and ` 75.26 crore sanctioned (June 2009) to DGVCL and PGVCL respectively under Part A, ` 7.01 crore and ` 41.67 crore were released. Against this, ` 6.54 crore and ` 7.17 crore was actually utilised by DGVCL and PGVCL respectively. Further, though funds of ` 50.14 crore and ` 140.58 crore were sanctioned in March/December 2010 for Part B for DGVCL and PGVCL respectively, the works were not started even after a lapse of nine months (DGVCL) and 18 months (PGVCL) since sanction of loans. During 2006-11, the AT&C losses ranged between 20.59 and 18.35 per cent and 33.77 to 29.03 per cent in DGVCL and PGVCL respectively against the envisaged norm of 15 per cent under R-APDRP.

Overview
ix
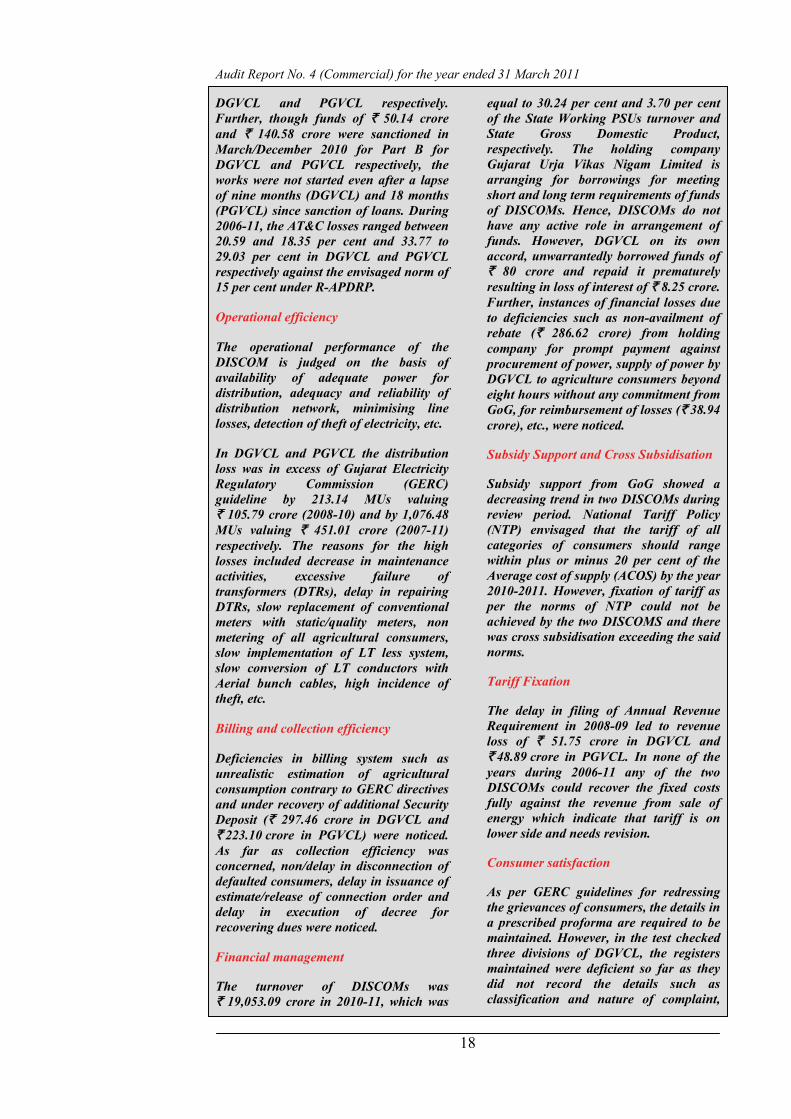
Operational efficiency
The operational performance of the DISCOM is judged on the basis of availability of adequate power for distribution, adequacy and reliability of distribution network, minimising line losses, detection of theft of electricity, etc.
In DGVCL and PGVCL the distribution loss was in excess of Gujarat Electricity Regulatory Commission (GERC) guideline by 213.14 MUs valuing ` 105.79 crore (2008-10) and by 1,076.48 MUs valuing ` 451.01 crore (2007-11) respectively. The reasons for the high losses included decrease in maintenance activities, excessive failure of transformers (DTRs), delay in repairing DTRs, slow replacement of conventional meters with static/quality meters, non metering of all agricultural consumers, slow implementation of LT less system, slow conversion of LT conductors with Aerial bunch cables, high incidence of theft, etc.
Billing and collection efficiency
Deficiencies in billing system such as unrealistic estimation of agricultural consumption contrary to GERC directives and under recovery of additional Security Deposit (` 297.46 crore in DGVCL and ` 223.10 crore in PGVCL) were noticed. As far as collection efficiency was concerned, non/delay in disconnection of defaulted consumers, delay in issuance of estimate/release of connection order and delay in execution of decree for recovering dues were noticed.
Financial management
The turnover of DISCOMs was ` 19,053.09 crore in 2010-11, which was equal to 30.24 per cent and 3.70 per cent of the State Working PSUs turnover and State Gross Domestic Product, respectively. The holding company Gujarat Urja Vikas Nigam Limited is arranging for borrowings for meeting short and long term requirements of funds of DISCOMs. Hence, DISCOMs do not have any active role in arrangement of funds. However, DGVCL on its own accord, unwarrantedly borrowed funds of ` 80 crore and repaid it prematurely resulting in loss of interest of ` 8.25 crore. Further, instances of financial losses due to deficiencies such as non-availment of
rebate (` 286.62 crore) from holding company for prompt payment against procurement of power, supply of power by DGVCL to agriculture consumers beyond eight hours without any commitment from GoG, for reimbursement of losses (` 38.94 crore), etc., were noticed.
Subsidy Support and Cross Subsidisation
Subsidy support from GoG showed a decreasing trend in two DISCOMs during review period. National Tariff Policy (NTP) envisaged that the tariff of all categories of consumers should range within plus or minus 20 per cent of the Average cost of supply (ACOS) by the year 2010-2011. However, fixation of tariff as per the norms of NTP could not be achieved by the two DISCOMS and there was cross subsidisation exceeding the said norms.
Tariff Fixation
The delay in filing of Annual Revenue Requirement in 2008-09 led to revenue loss of ` 51.75 crore in DGVCL and ` 48.89 crore in PGVCL. In none of the years during 2006-11 any of the two DISCOMs could recover the fixed costs fully against the revenue from sale of energy which indicate that tariff is on lower side and needs revision.
Consumer satisfaction
As per GERC guidelines for redressing the grievances of consumers, the details in a prescribed proforma are required to be maintained. However, in the test checked three divisions of DGVCL, the registers maintained were deficient so far as they did not record the details such as classification and nature of complaint, time and date of redressal of grievances, etc.
Energy Conservation
DGVCL and PGVCL did not conduct energy audit during 2006-11 which would have, otherwise, enabled them to identify the areas of energy losses and take steps to reduce the same through system improvements, besides accurately accounting for the units purchased/sold and losses at each level.

Audit Report No. 4 (Commercial) for the year ended 31 March 2011
x
Further, the fund provided (2006-11) by GoG for energy conservation activities were not fully utilised by the two DISCOMs.
Conclusion
The distribution reforms envisaged under National Electricity Policy/Plans were not fully achieved by the two DISCOMs. The improper management of feeders in PGVCL led to excessive distribution losses. The implementation of various GoI Schemes for rural electrification and system upgradation/controlling of AT&C losses were sub-optimal on account of several reasons like, poor workmanship/non-synchronisation of activities, inadequate maintenance activities, slow replacement of conventional meters with static/quality meters, failure in cent percent metering of agricultural consumers, slow implementation of LT less system, etc.
Non-collection of additional security deposits, lack of financial autonomy, etc affected the financial health of the DISCOMs. The guidelines of GERC were not strictly adhered to as far as addressing the consumer grievances and conducting energy audits were concerned.
Recommendations
The performance audit contains seven recommendations for timely implementation of GoI Schemes, strengthening the distribution network, expediting the cent percent metering of the agricultural consumers and other measures for controlling the AT&C losses, taking corrective measures for timely recovery of dues from consumers, financial autonomy to DISCOMs, timely redressal of consumer complaints and conducting energy audit.
(Chapter 2.1)
Executive summary of performance audit on ‘Functioning of Gujarat State Petroleum Corporation Limited’ are given below: The Company was incorporated on 29 January 1979 for exploration, development and production of petroleum and carrying on business of all chemicals derived from hydrocarbons. The Company ventured in exploration activities under Pre-NELP in 1994 and participated in bidding with introduction of New Exploration Licensing Policy (NELP) from 1999. The Company is also engaged in gas trading activity and caters to industries engaged in power generation, steel and city gas distribution.
Blocks and hydrocarbon reserves
After surrender of four blocks (2006-10), the Company, as on 31 March 2011, had 64 blocks, of which 53 blocks are in India and 11 blocks are overseas. Of the 53 domestic blocks, the Company is operator in nine blocks and non operator in 44 blocks. The Company has 14 producing blocks which are domestic.
The proved and probable (2P) reserves in 11 out of 14 producing blocks are 3,376.9 MBbl of oil and 19.6 BCF of gas. Of the remaining 39 domestic blocks which are under exploration stage, one offshore block viz., Krishna Godavari (KG) block
entered development stage and 2P of KG block is 18,303.7 MBbl of oil and 947.3 BCF of gas.
Bidding for hydrocarbon blocks
The Company with its consortium submitted bid for acquiring KG block without properly assessing related technical and financial issues. As a result, against the estimated drilling cost of US $ 102.23 million and the total depth committed of 45,348 meter in the minimum work programme (MWP), the actual drilling cost incurred was US $ 1,302.88 million (` 5,920.27 crore) and the total depth drilled was of 77,395.07 meters.
The main reason for the incorrect estimation was adoption of deficient geological model prepared by a joint venture (JV) partner, Geo Global Resources Inc., Canada (GGR). The Company on the ground that GGR was a technical expert, admitted GGR in the JV without taking any financial contribution from him during the exploration phase of KG block. As a result, the Company incurred GGR’s share of US $ 175.07 million (` 780.81 crore) towards the

Overview
xi
exploration cost and suffered loss of interest of ` 104.14 crore during 2007-11.
Exploration
An unreasonable time of 14 to 106 months was taken (2006-11) for completing the environment impact studies (EIS) in eight out of nine domestic blocks where the Company was operator.
Against the estimated drilling rate of 27.76 meters per day, the actual rate was 22.49 meters per day in drilling (July 2004 to April 2010) 16 wells in KG offshore block. This resulted in extension of tenure of drilling activity and consequential avoidable expenditure of ` 180.91crore on drilling work.
Reliance Industries Limited (RIL) a private sector enterprise, installed Control and Riser Platform unilaterally in the part area of KG block licensed to the Company on which no other operator has any right without the consent of the Company/GoI. As per the mining lease conditions of GoI, the Company would be responsible for safety and security of all structures in its block including RIL’s structure for its life period.
Further, in exploration activities, instances such as, drilling of well in area belonging to other operator, acceptance of material against specifications, incurring of imprudent expenditure and payment of idle charges were noticed. Consequently, the Company incurred avoidable expenditure of ` 13.23 crore and also suffered loss of ` 12.45 crore.
Twenty-six unviable wells were not abandoned even after expiry of 166 to 1,610 days since completion of test (November 2006 to October 2010), so as to bring the wells area to the pre-existing local environment as per the Regulation 59 of Oil Mines Regulations, 1984.
Development
The Company incurred total expenditure of ` 104.29 crore on drilling of wells without obtaining approval of the Management Committee/GoI for the Field Development Plan (FDP). In absence of necessary approval, the said expenditure could not qualify for recovery as ‘cost
petroleum’. Further, delay of 12 months in finalisation of construction contract from the date of approval of FDP would have corresponding impact in commencement of production activities in KG block.
Marketing
During 2006-11, the total revenue from trading of gas was ` 19,245.39 crore and the revenue from sale of its own production of gas and oil was ` 1,563.63 crore which indicated that Company was focusing mainly on trading rather than production activity. In trading activities the Company failed to safeguard its interest due to non-insertion of clause for recovery of Take or Pay (ToP) charges in the contracts for sale of gas with 25 to 36 customers out of 38 to 47 customers. This led to potential revenue loss of ` 502.19 crore in selected cases.
Though the Company purchased (2006-09) gas on spot price, it sold gas at a price which was lesser than the purchase price by ` 5.23 to ` 430.79 per MMBTU which resulted in extension of undue benefit of ` 70.54 crore to a private entrepreneur, Adani Energy (Gujarat) Limited.
Finance
Though exploration, development and production activities are of high risk and capital intensive nature and requires long gestation period, the Company largely utilised (2006-11) short term loans (constituting 38 per cent of the total borrowings) on these activities. The dependence on short term loans for these activities was not a prudent financial practice.
Instances of losses due to financial deficiencies such as, interest loss (` 3.14 crore) due to delay in raising claims for recovery of dues from JV partners and avoidable payment of penal interest (` 4.17 crore) due to short remittance of advance tax were noticed.
Internal Control and Monitoring Mechanism
The internal control and monitoring mechanism of the Company was weak in several areas like non-submission of annual budget to Board of Directors,
Audit Report No. 4 (Commercial) for the year ended 31 March 2011
xii
absence of Management Information System with regard to taking up of exploration and development activities as per the commitments made in Minimum Work Programme of Profit Sharing Contracts and as per the approved FDP, etc.
Conclusion
Proper assessment of technical and financial issues was not done before bidding for acquisition of KG block. Unreasonable time was taken in completing environment impact study and wells were drilled beyond exploration period. Improper management of exploration and development activities led to incurring of avoidable expenditure/ losses. Financial interest of the Company was not safeguarded due to non insertion
of clause for recovery of ToP charges in all the contracts for sale of gas. Proper internal control and monitoring system was not in existence.
Recommendations
The review contains five recommendations which inter alia include properly assessing both financial and technical issues before bidding for the blocks, devising mechanism for improving the efficiency in the management of activities related to exploration and development, insertion of the clause for recovery of Take or Pay charges in all the contracts for sale of gas and improving the internal control and monitoring system.
(Chapter 2.2)
3. Transaction Audit Observations
Transaction audit observations included in this Report highlight deficiencies in the management of PSUs which resulted in serious financial implications. The irregularities pointed out are broadly of the following nature:
Loss of ` 17.66 crore in four cases due to non-compliance with rules, directives, procedures and terms and conditions of contracts.
(Paragraphs 3.9, 3.12, 3.14, and 3.15)
Loss of ` 98.74 crore in three cases due to non-safeguarding the financial interests of organization.
(Paragraphs 3.1, 3.6 and 3.7)
Loss of ` 14.60 crore in five cases due to defective/deficient planning.
(Paragraphs 3.2, 3.4, 3.8, 3.10 and 3.16)
Loss of ` 1.69 crore in two cases due to inadequate/deficient monitoring.
(Paragraphs 3.3 and 3.11)
Loss of ` 9.95 crore in one case due to non-realisation of objective.
(Paragraph 3.5)
Overview
xiii
Gist of the major observations is given below.
Alcock Ashdown (Gujarat) Limited is exposed to probable loss of ` 96.42 crore by imprudently accepting a ship building contract.
(Paragraph 3.7)
Gujarat State Petronet Limited passed undue benefit of ` 12.02 crore to Essar Steel Limited by way of waiver of capacity charges contrary to the provisions of gas transmission agreement.
(Paragraph 3.9)
Gujarat State Electricity Corporation Limited incurred avoidable expenditure of ` 9.95 crore due to imprudent selection of a firm and non-commissioning of Ash Collection System.
(Paragraph 3.5)
Audit Report No. 4 (Commercial) for the year ended 31 March 2011
xiv

Chapter I, Overview of State Public Sector Undertakings
1
Chapter I
1. Overview of State Public Sector Undertakings
Introduction
1.1 The State Public Sector Undertakings (PSUs) consist of State Government companies and Statutory corporations. The State PSUs are established to carry out the activities of commercial nature while keeping in view the welfare of people. In Gujarat, the State PSUs occupy an important place in the State economy. The working State PSUs registered a turnover of ` 63,008.20 crore for 2010-11 as per their latest finalised accounts as of September 2011. This turnover was equal to 12.24 per cent of State Gross Domestic Product (GDP) for 2010-11. Major activities of Gujarat State PSUs are concentrated in the power sector. The working State PSUs earned an overall aggregate profit of ` 2,662.94 crore for 2010-11 as per their latest finalised accounts as of September 2011. They had employed 1.09 lakh1 employees as of 31 March 2011.
1.2 As on 31 March 2011, there were 73 PSUs as per the details given below. Of these, three PSUs2 were listed on the stock exchange(s).
Type of PSUs Working PSUs Non-working PSUs3 Total
Government companies4 56 13 69 Statutory corporations 4 - 4
Total 60 13 73
1.3 During the year 2010-11, three PSUs viz., Gujarat Livelihood Promotion Company Limited, Metro Link Express for Gandhinagar and Ahmedabad (MEGA) Company Limited and Gujarat State Mining and Resources Corporation Limited5 were established. One PSU viz., Gujarat State Fertilizers and Chemicals Limited went out of Audit purview during this year due to reduction in the shareholdings held by Central/State PSUs below 51 per cent.
Audit Mandate
1.4 Audit of Government companies is governed by Section 619 of the Companies Act, 1956. According to Section 617, a Government company is one in which not less than 51 per cent of the paid up capital is held by Government(s). A Government company includes a subsidiary of a Government company. Further, a company in which 51 per cent of the paid up capital is held in any combination by Government(s), Government companies and corporations controlled by Government(s) is treated as if it
1 As per the details provided by 59 working PSUs. 2 Sl. No. A-25, A-46 and B-2 of Annexure-1. 3 Non-working PSUs are those which have ceased to carry on their operations. 4 Includes 619-B companies. 5 A subsidiary of Gujarat Mineral Development Corporation Limited

Audit Report No.4 (Commercial) for the year ended 31 March 2011
2
were a Government company (deemed Government company) as per Section 619-B of the Companies Act.
1.5 The accounts of the State Government companies (as defined in Section 617 of the Companies Act, 1956) are audited by Statutory Auditors, who are appointed by the Comptroller and Auditor General of India (CAG) as per the provisions of Section 619(2) of the Companies Act, 1956. These accounts are also subject to supplementary audit conducted by CAG as per the provisions of Section 619 of the Companies Act, 1956.
1.6 Audit of Statutory corporations is governed by their respective legislations. Out of four Statutory corporations, CAG is the sole auditor for Gujarat Industrial Development Corporation and Gujarat State Road Transport Corporation. In respect of Gujarat State Warehousing Corporation and Gujarat State Financial Corporation, the audit is conducted by Chartered Accountants and supplementary audit by CAG.
Investment in State PSUs
1.7 As on 31 March 2011, the investment (capital and long-term loans) in 73 PSUs (including 619-B companies) was ` 67,351.96 crore as per details given below.
(` in crore) Government companies Statutory corporations Type of
PSUs Capital Long Term Loans
Total Capital Long Term Loans
Total
Grand Total
Working PSUs
39,578.72 24,116.72 63,695.44 812.45 2,033.87 2,846.32 66,541.76
Non-working PSUs
98.64 711.56 810.20 0 0 0 810.20
Total 39,677.36 24,828.28 64,505.64 812.45 2,033.87 2,846.32 67,351.96
A summarised position of government investment in State PSUs is detailed in Annexure 1.
1.8 As on 31 March 2011, of the total investment in State PSUs, 98.80 per cent was in working PSUs and the remaining 1.20 per cent in non-working PSUs. This total investment consisted of 60.12 per cent towards capital and 39.88 per cent in long-term loans. The investment has grown by 44.64 per cent from ` 46,563.67 crore in 2005-06 to ` 67,351.96 crore in 2010-11 as shown in the graph below:

Chapter I, Overview of State Public Sector Undertakings
3
67,351.96
49,018.2246,563.6750,793.35
48,137.78
60,396.37
35,000.00
40,000.00
45,000.00
50,000.00
55,000.00
60,000.00
65,000.00
70,000.00
2005
-06
2006
-07
2007
-08
2008
-09
2009
-10
2010
-11
Investment (Capital and long-term loans) (` in crore)
1.9 The investment in various important sectors and percentage thereof at the end of 31 March 2006 and 31 March 2011 are indicated below in the bar chart.
14,6
38.8
1
21,4
68.7
2
1,88
8.17
2,21
2.07
2,51
3.28
6,00
5.92
27,5
23.4
1
3766
5.25
0.002,500.005,000.007,500.00
10,000.0012,500.0015,000.0017,500.0020,000.0022,500.0025,000.0027,500.0030,000.0032,500.0035,000.0037,500.00
2005-06 2010-11
Power Finance Manufacturing Miscellaneous
(31.88)
(31.44)
(4.05)(8.92)
(3.28)(5.40)
(59.11)
(55.92)
(Figures in brackets show the sector percentage to total investment)
It can be observed from the above chart that the thrust of PSUs investment during the six years was mainly in Power sector and Miscellaneous sector. Percentage share in power sector increased from 31.44 per cent in 2005-06 to 31.88 per cent in 2010-11 and share in Miscellaneous sector decreased from 59.11 per cent in 2005-06 to 55.92 per cent in 2010-11. The investment in power sector had grown mainly due to increase of ` 6,829.91 crore in the equity/loans investments in state PSUs engaged in power generation and

Audit Report No.4 (Commercial) for the year ended 31 March 2011
4
transmission activities. While in case of ‘Miscellaneous’ sector, the investment was increased by ` 10,141.84 crore of which an amount of ` 8,357.26 crore was attributable to Sardar Sarovar Narmada Nigam Limited during the said period of six years in the form of equity/loans.
Budgetary outgo, grants/subsidies, guarantees and loans
1.10 The details regarding budgetary outgo towards equity, loans, grants/ subsidies, guarantees issued, loans written off, loans converted into equity and interest waived in respect of State PSUs are given in Annexure 3. The summarised details are given below for three years ended 2010-11.
(Amount: ` in crore) 2008-09 2009-10 2010-11 Sl.
No. Particulars
No. of PSUs
Amount No. of PSUs
Amount No. of PSUs
Amount
1. Equity Capital outgo from budget
11 3,378.02 12 2,352.61 11 2,909.95
2. Loans given from budget
9 867.72 7 288.78 8 1,006.52
3. Grants/Subsidy received
28 4,955.36 27 5,437.52 29 5,349.56
4. Total Outgo (1+2+3)
9,201.10 8,078.91 9,266.03
5. Loans converted into equity
- - - - - -
6. Loans written off - - - - 1 7.00
7. Interest/Penal interest written off
1 13.70 - - 1 2.31
8. Total Waiver (6+7)
13.70 - - 9.31
9. Guarantees issued 1 150.00 1 0.30 0 0.00
10. Guarantee Commitment
9 6,694.00 17 5,427.81 12 4,960.25
Out of ` 2,909.95 crore of equity capital outgo during the year 2010-11, the major portion i.e. ` 2,191.54 crore was extended to Sardar Sarovar Narmada Nigam Limited. Likewise, out of ` 5,349.56 crore of grants and subsidy given during the year 2010-11, ` 3,126.43 crore was given to seven power sector PSUs.
1.11 The details regarding budgetary outgo towards equity, loans and grants/ subsidies for past six years are given in a graph below.

Chapter I, Overview of State Public Sector Undertakings
5
9,266.03
8,078.91
9,201.10
7,021.84
5,927.75
4,289.84
3,000.00
4,000.00
5,000.00
6,000.00
7,000.00
8,000.00
9,000.00
10,000.00
2005
-06
2006
-07
2007
-08
2008
-09
2009
-10
2010
-11
Budgetary outgo towards Equity, Loans and Grants/ Subsidies (` incrore)
It can be observed that after recording an all time low of ` 4,289.84 crore (2005-06) during the preceding six years period, the budgetary outgo to State PSUs gradually increased each year and registered the highest outgo of ` 9,266.03 crore in 2010-11.
1.12 In order to enable PSUs to obtain financial assistance from Banks and Financial Institutions, State Government gives guarantee under Gujarat State Guarantee Act, 1963 subject to the limits prescribed by the Constitution of India, for which the guarantee fee is being charged. This fee may vary between 0.5 per cent and 2 per cent as decided by the State Government depending upon the loanees. The guarantee commitment decreased to ` 4,960.25 crore during 2010-11 from ` 6,694.00 crore during 2008-09 and ` 5,427.81 crore during 2009-10. Further, nine6 PSUs paid guarantee fee to the tune of ` 51.96 crore and the guarantee fee of ` 0.20 crore was yet to be paid by two7 PSUs, for the year 2010-11 to the State Government.
Reconciliation with Finance Accounts
1.13 The figures in respect of equity, loans and guarantees outstanding as per records of State PSUs should agree with that of the figures appearing in the Finance Accounts of the State. In case the figures do not agree, the concerned PSUs and the Finance Department should carry out reconciliation of differences. The position in this regard as on 31 March 2011 is stated below.
6 Sl.No. A-5, A-33, A-35, A-36, A-37, A-38, A-39, A-40 and A-55 of Annexure-1 7 Sl.No. B-2 and B-3 of Annexure-1
Audit Report No.4 (Commercial) for the year ended 31 March 2011
6
(` in crore) Outstanding in
respect of Amount as per
Finance Accounts
Amount as per records of PSUs
Difference
Equity 33,747.90 34,580.62 832.72Loans 2,803.48 4,138.70 1,335.22
Guarantees 7,512.26 4,960.25 2,552.01
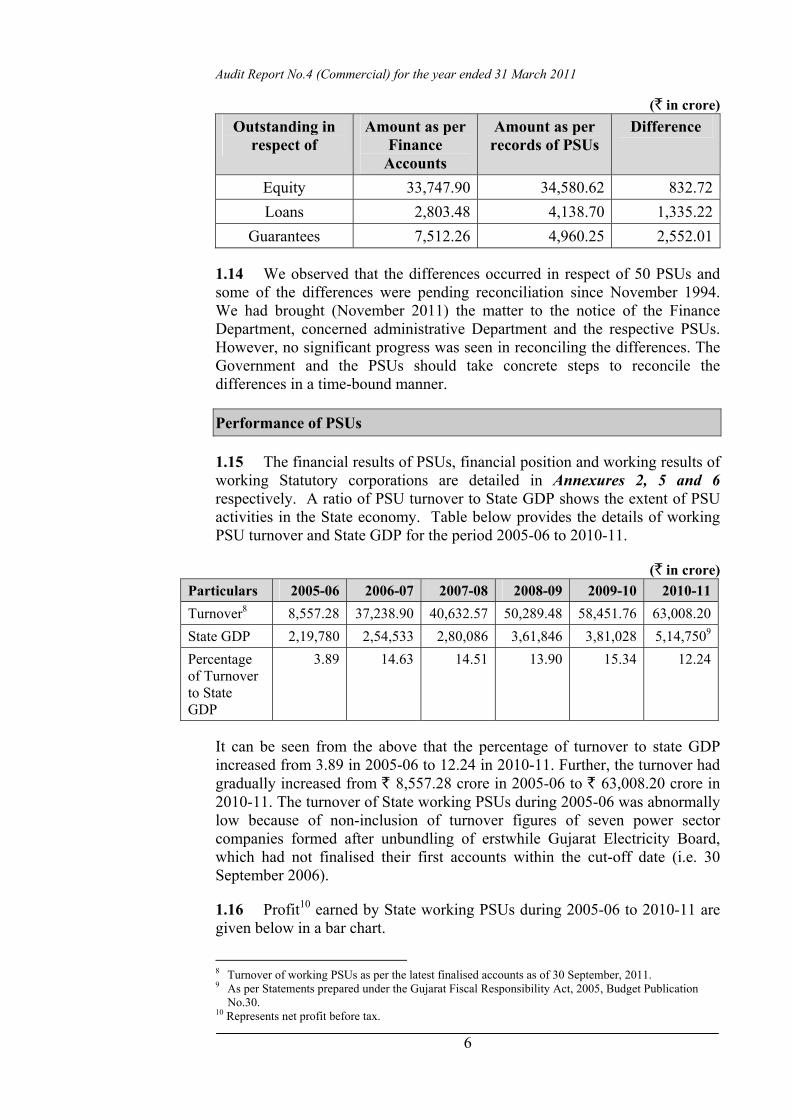
1.14 We observed that the differences occurred in respect of 50 PSUs and some of the differences were pending reconciliation since November 1994. We had brought (November 2011) the matter to the notice of the Finance Department, concerned administrative Department and the respective PSUs. However, no significant progress was seen in reconciling the differences. The Government and the PSUs should take concrete steps to reconcile the differences in a time-bound manner.
Performance of PSUs
1.15 The financial results of PSUs, financial position and working results of working Statutory corporations are detailed in Annexures 2, 5 and 6 respectively. A ratio of PSU turnover to State GDP shows the extent of PSU activities in the State economy. Table below provides the details of working PSU turnover and State GDP for the period 2005-06 to 2010-11.
(` in crore) Particulars 2005-06 2006-07 2007-08 2008-09 2009-10 2010-11Turnover8 8,557.28 37,238.90 40,632.57 50,289.48 58,451.76 63,008.20State GDP 2,19,780 2,54,533 2,80,086 3,61,846 3,81,028 5,14,7509
Percentage of Turnover to State GDP
3.89 14.63 14.51 13.90 15.34 12.24
It can be seen from the above that the percentage of turnover to state GDP increased from 3.89 in 2005-06 to 12.24 in 2010-11. Further, the turnover had gradually increased from ` 8,557.28 crore in 2005-06 to ` 63,008.20 crore in 2010-11. The turnover of State working PSUs during 2005-06 was abnormally low because of non-inclusion of turnover figures of seven power sector companies formed after unbundling of erstwhile Gujarat Electricity Board, which had not finalised their first accounts within the cut-off date (i.e. 30 September 2006).
1.16 Profit10 earned by State working PSUs during 2005-06 to 2010-11 are given below in a bar chart.
8 Turnover of working PSUs as per the latest finalised accounts as of 30 September, 2011. 9 As per Statements prepared under the Gujarat Fiscal Responsibility Act, 2005, Budget Publication
No.30. 10 Represents net profit before tax.

Chapter I, Overview of State Public Sector Undertakings
7
1,37
1.60
1,82
6.32
2,66
2.94
2404
.22
2404
.89
2,03
5,72
600.00
900.00
1,200.00
1,500.00
1,800.00
2,100.00
2,400.00
2,700.00
3,000.00
2005-06 2006-07 2007-08 2008-09 2009-10 2010-11
Overall Profit earned during the year by working PSUs (` in crore)
(60)
(49)
(50)(56)
(57) (58)
(Figures in brackets show the number of working PSUs in respective years)
It can be observed from the above chart that the working of PSUs improved over the period. During the year 2010-11, out of 60 working PSUs, 41 PSUs earned profit of ` 3,145.83 crore and eight PSUs incurred loss of ` 482.89 crore as per their latest finalised accounts as on 30 September 2011. One11 working PSU had capitalised excess of expenditure over income, two12 PSUs had not prepared their first accounts, seven13 were under construction and one14 had transferred excess of expenditure to non-plan grant. The major contributors to the profit were Gujarat State Petronet Limited (` 765.00 crore), Gujarat Mineral Development Corporation Limited (` 584.61 crore) and Gujarat State Petroleum Corporation Limited (` 403.62 crore). The heavy losses were incurred by Gujarat State Road Transport Corporation (` 159.74 crore), Gujarat State Financial Corporation (` 156.91 crore) and Alcock Ashdown (Gujarat) Limited (` 131.44 crore).
1.17 Though the PSUs were earning profits, there were instances of deficiencies in financial management, planning, implementation of projects, running their operations and monitoring. A review of latest Audit Reports of CAG shows that the State PSUs incurred losses to the tune of ` 4,216.53 crore and infructuous investment of ` 300.98 crore, which were controllable with better management. Year wise details from Audit Reports are given below.
(` in crore) Particulars 2008-09 2009-10 2010-11 Total
Net Profit 2,404.89 2,404.22 2,662.94 7,472.05Controllable losses as per CAG’s Audit Report
1,058.86 813.11 2,344.56 4,216.53
Infructuous Investment 145.26 152.86 2.86 300.98
1.18 The above losses pointed out by Audit Reports of CAG are based on test check of records of PSUs. The actual controllable losses would be much
11 Sl.No. A-19 of Annexure-2. 12 Sl.No. A-24 and A-30 of Annexure 2. 13 Sl.No. A-28, A-29, A-31, A-41, A-42, A-50 and A-55 of Annexure-2. 14 Sl.No. A-8 of Annexure-2.

Audit Report No.4 (Commercial) for the year ended 31 March 2011
8
more. The above table shows that with better management, the controllable losses can be minimised and the profits can be enhanced substantially. The PSUs can discharge their role efficiently only if they are financially self-reliant. The above situation points towards a need for professionalism and accountability in the functioning of PSUs.
1.19 Some other key parameters pertaining to State PSUs are given below.
(` in crore) Particulars 2005-06 2006-07 2007-08 2008-09 2009-10 2010-11
Return on Capital Employed (Per cent)
4.4 6.34 5.43 3.95 5.24 5.24
Debt 23,239.60 22,376.93 20,564.74 13,048.33 23,734.37 26,862.15Turnover15 8,557.28 37,238.90 40,632.57 50,289.48 58,451.76 63,008.20Debt/ Turnover Ratio
2.72:1 0.60:1 0.51:1 0.26:1 0.41:1 0.43:1
Interest Payments
491.42 1,552.64 1,702.33 2,021.74 2,255.99 2,423.60
Accumulated Profits (losses)
(1,860.01) (1,164.22) (524.66) (814.56) (595.03) 169.34
(Above figures pertain to all PSUs except for turnover which is for working PSUs).
1.20 The turnover figures of PSUs had increased gradually after 2005-06 from ` 37,238.90 crore (2006-07) to ` 63,008.20 crore in 2010-11. The debt-turnover ratio was abnormally high at 2.72:1 during 2005-06 due to non-inclusion of turnover figures of newly formed Power Sector Companies as these companies did not finalise their first accounts within the cut off date (viz., by 30 September 2006). The debt-turnover ratio had shown gradual improvement up to 2008-09 but deteriorated thereafter and reached from 0.26:1 (2008-09) to 0.43:1 in 2010-11. This was mainly due to increase in borrowings by ` 3162.02 crore in manufacture and power sectors during 2010-11. Further, the overall accumulated profit/loss figures of State PSUs have shown gradual improvement over the period of six years and accumulated loss of ` 1,860.01 crore for 2005-06 has turned into accumulated profits of ` 169.34 crore during 2010-11.
1.21 The State Government had not formulated any dividend policy regarding payment of minimum return by PSUs on paid-up share capital contribution by State Government by way of dividend. As per their latest finalised accounts as on 30 September 2011, 41 PSUs earned an aggregate profit of ` 3,145.83 crore and only eight PSUs16 declared dividend of ` 224.05 crore of which the State Government’s share was Rs.114.30 crore.
Arrears in finalisation of accounts
1.22 The accounts of the companies for every financial year are required to be finalised within six months from the end of the relevant financial year 15 Turnover of working PSUs as per the latest finalised accounts as of 30 September. 16 A-9, A-10, A-25, A-26, A-34, A-46, A-48 and B-1 of Annexure 2.

Chapter I, Overview of State Public Sector Undertakings
9
under Sections 166, 210, 230, 619 and 619-B of the Companies Act, 1956. Similarly, in case of statutory corporations, their accounts are finalised, audited and presented to the Legislature as per the provisions of their respective Acts. The table below provides the details of progress made by working PSUs in finalisation of accounts by September 2011.
Sl. No.
Particulars 2006-07 2007-08 2008-09 2009-10 2010-11
1. Number of Working PSUs 50 56 57 58 602. Number of accounts
finalised during the year 48 45 58 73 583. Number of accounts in
arrears 41 52 51 36 384. Average arrears per PSU
(3/1) 0.82 0.93 0.89 0.62 0.63
5. Number of Working PSUs with arrears in accounts
25 38 34 25 27
6. Extent of arrears 1 to 3 years
1 to 5 years
1 to 6 years
1 to 4 years
1 to 4 years
1.23 It can be observed that the number of accounts in arrears has decreased from 52 (2007-08) to 38 (2010-11) with corresponding decrease in average arrears per PSU from 0.93 (2007-08) to 0.63 (2010-11), which is indicative of the efforts made by State PSUs in clearing the backlog of accounts. The increase in the number of PSUs from 50 (2006-07) to 60 (2010-11) also contributed towards decrease in the average arrear per PSU. The accumulation of arrears, however, was mainly due to inadequacy of accounts personnel in the PSUs.
1.24 In addition to above, there were also arrears in finalisation of accounts by non-working PSUs. Out of 13 non-working PSUs, seven17 had gone into liquidation process. Of the remaining six non-working PSUs, three PSUs18 had arrears of accounts for one to 12 years.
1.25 The State Government had invested ` 7,172.93 crore (20 PSUs) (Equity: ` 2,295.29 crore (six PSUs), loans: ` 724.80 crore (six PSUs) and grants: ` 4,152.84 crore (17 PSUs) in PSUs during the years for which accounts have not been finalised as detailed in Annexure 4. Delay in finalisation of accounts of the said PSUs may result in risk of fraud and leakage of public money extended to these PSUs by way of equity, loans and grants apart from violation of the provisions of the Companies Act, 1956.
1.26 The administrative departments have the responsibility to oversee the activities of these entities and to ensure that the accounts are finalised and adopted by these PSUs within the prescribed period. Though we had informed the concerned administrative departments and officials of the Government of the arrears in finalisation of accounts on quarterly basis, no remedial measures were taken. As a result of this, the net worth of these PSUs could not be assessed in audit. We had also taken up (19 July 2010, 22 November 2010, 17 Serial no. C-3, C-4, C-7, C-9, C-11, C-12 and C-13 of Annexure 2. 18 Serial no.C-1, C-5 and C-6 of Annexure 2

Audit Report No.4 (Commercial) for the year ended 31 March 2011
10
24 January 2011 and 18 April 2011) the matter of arrears in accounts with the Chief Secretary/ Finance Secretary to expedite the backlog of arrears in accounts in a time bound manner.
1.27 In view of above state of arrears, it is recommended that:
• The Government may set up a cell to oversee the clearance of arrears and set the targets for individual companies which would be monitored by the cell.
• The Government may consider outsourcing the work relating to preparation of accounts wherever the staff is inadequate or lack necessary expertise.
Winding up of non-working PSUs
1.28 There were 13 non-working companies as on 31 March 2011. Of these, seven PSUs have commenced liquidation process. The numbers of non-working companies at the end of each year during the past five years are given below.
Particulars 2006-07 2007-08 2008-09 2009-10 2010-11 No. of non-working companies
14 14 13 13 13
The non-working PSUs are required to be closed down as their existence is not going to serve any purpose. During 2010-11, two non-working PSUs19 incurred an expenditure of ` 0.07 crore towards establishment expenditure. This expenditure was financed by the Holding Company (` 0.01 crore) and through sale of assets (` 0.06 crore).
1.29 The stages of closure in respect of non-working PSUs are given below.
Sl. No.
Particulars No. of Companies
1. Total No. of non-working PSUs 13 2. Of (1) above, the No. under (a) liquidation by Court (liquidator appointed)20 6 (b) Voluntary winding up (liquidator appointed)21 1 (c) Winding up after clearance of arrear in accounts22. 1 (d) Closure, i.e. closing orders/ instructions not issued. 5
1.30 The process of voluntary winding up under the Companies Act is much faster and needs to be adopted/ pursued vigorously. The Government may 19 C-8 and C-10 of Annexure 2. 20 C-4, C-7, C-9, C-11, C-12 and C-13 of Annexure 2 21 C-3 of Annexure 2 22 C-6 of Annexure 2, the name of the Company was struck off from the register of Registrar of the
Companies on 14 August 2011 under section 560 (5) of the Companies Act, 1956 under Easy Exit Scheme 2011.

Chapter I, Overview of State Public Sector Undertakings
11
consider setting up a cell to expedite closing down its non-working companies. The Government may make a decision regarding winding up of five non-working PSUs where no decision about their continuation or otherwise has been taken after they became non-working.
Accounts Comments and Internal Audit
1.31 Forty-seven working companies forwarded 54 accounts to PAG during the year 2010-11 which were selected for supplementary audit. The audit reports of Statutory auditors appointed by CAG and the supplementary audit of CAG indicate that the quality of maintenance of accounts needs to be improved substantially. The details of aggregate money value of comments of Statutory auditors and CAG are given below.
(Amount ` in crore) 2008-09 2009-10 2010-11 Sl.
No. Particulars
No. of accounts
Amount No. of accounts
Amount No. of accounts
Amount
1. Decrease in profit 6 72.85 11 107.32 9 20.412. Increase in loss - - 1 0.02 1 0.353. Non-disclosure of
material facts 12 457.52 4 7.98 6 71.99
4. Errors of classification 16 4,567.03 17 5,179.16 7 4,913.43
1.32 It can be observed from the above that money value objections for decrease in profit and non disclosure of material facts decreased from ` 72.85 crore in 2008-09 to ` 20.41 crore in 2010- 11 and ` 457.52 crore in 2008-09 to ` 71.99 crore in 2010-11 respectively. However, errors of classification increased from ` 4,567.03 crore in 2008-09 to ` 4,913.43 crore in 2010-11.
1.33 During the year, the statutory auditors had given unqualified certificates for 39 accounts and qualified certificates for 15 accounts. Additionally, CAG offered adverse comments on 12 accounts. The compliance of companies with the Accounting Standards (AS) remained poor as there were 24 instances of non-compliance in 10 accounts during the year.
Some of the important comments in respect of accounts of companies are stated below.
1.34 Gujarat State Road Development Corporation Limited (2009-10)
• The Company treats the grant received for various purposes as its liabilities and debits any expenses incurred for the respective purpose to the said grants. Contrary to the disclosed accounting policy, the company wrongly charged an amount of ` 10.60 crore, incurred in execution of Railway Over bridge Projects of the State Government to the profit and loss account instead of to respective grants. Further, the above cost of works included an amount of ` 5.05 crore to be borne by the Indian Railways, being their share in the costs of the projects executed and not booked as receivables by the company. This had resulted in understatement of profit by ` 10.60 crore, understatement
Audit Report No.4 (Commercial) for the year ended 31 March 2011
12
of current assets by ` 5.05 crore with overstatement of current liabilities (grants) by ` 5.55 crore.
1.35 Gujarat Water Resources Development Corporation Limited (2009-10)
• The Company had accounted net amount of Grant/Subsidy receivable from State Government of ` 49.33 crore by adjusting ‘Payable to State Government’ of ` 79.47 crore with Grant/Subsidy receivable from State Government amounting to ` 128.80 crore for which final approval is pending from State Government. Thus, inappropriate recognition of Grants in violation of AS-12 by the Company had resulted in overstatement of Grant Receivable by ` 49.33 crore, understatement of payable to State Government by ` 79.47 crore and understatement of accumulated loss by ` 128.80 crore.
1.36 Gujarat Energy Transmission Corporation Limited. (2009-10)
• The fixed asset was overstated by ` 7.70 crore due to erroneous capitalisation of interest amount for the period beyond the date of commercial commissioning. This resulted in understatement of Interest and Financial Charges (net after capitalisation) by ` 4.16 crore, understatement of ‘Net Prior Period expenses’ by ` 3.54 crore with corresponding overstatement of profit carried forward to Balance Sheet by ` 7.70 crore.
1.37 Madhya Gujarat Vij Company Limited. (2009-10)
• The Company overstated employee costs by ` 1.90 crore, being provision made during the year towards third installment of Sixth Pay Commission arrears which was already provided for in 2008-09. Consequent to the double booking for expenses, the liability is overstated and profit is understated to that extent.
1.38 Sardar Sarovar Narmada Nigam Limited (2009-10)
• The Company had commissioned five units of Canal Head Power House and six units of Riverbed Powerhouse during August 2004 to June 2006. Instead of capitalising the expenditure of ` 4,683.78 crore incurred on power houses, the Company continued to show the said expenditure under works-in-progress. This had resulted in understatement of completed assets and overstatement of capital works-in-progress by ` 4,683.78 crore.
1.39 Similarly, four working Statutory corporations forwarded their four accounts for the years 2008-09 to 2010-11 to PAG during the year 2010-11. Of these, two accounts pertained to two Statutory corporations (Sl. No. B-3 and B-4 of Annexure 2) where CAG is sole auditor. Audit of one of these accounts of one corporation (Sl.No.B-3 of Annexure-2) has been completed. Of the remaining two accounts pertaining to other two Statutory corporations, audit was completed for one corporation (Sl. No. B-1 of Annexure 2), while the audit of the accounts of other corporation (Sl. No. B-2 of Annexure 2) was

Chapter I, Overview of State Public Sector Undertakings
13
in progress. The details of aggregate money value of comments of statutory auditors and CAG are given below.
(Amount ` in crore) 2008-09 2009-10 2010-11 Sl.
No.Particulars
No. of accounts
Amount No. of accounts
Amount No. of accounts
Amount
1. Decrease in profit 1 11.11 2 14.13 2 16.442. Increase in loss 3 21.76 2 257.56 1 55.983. Non-disclosure of
material facts 1 15.53 2 232.17 1 123.724. Errors of classification 3 276.23 3 153.80 1 70.98
It can be observed from the average money value per account audited increased from `.11.11 crore (2008-09) to ` 8.22 crore (2010-11) and from ` 7.25 crore (2008-09) to ` 55.98 crore (2010-11) for ‘Decrease in profit’ and ‘Increase in loss’ categories respectively. The average money value per account under ‘non-disclosure of material facts’ also showed increasing trend in three years period.
During the year, all the three accounts23 received qualified certificates.
Some of the important comments in respect of accounts of Statutory corporations are stated below.
1.40 Gujarat State Financial Corporation (2009-10)
• The Corporation had not provided liability of Sales tax on Hire Purchase transaction even after rejection (April 2001) of the Corporation’s appeal before Sales Tax Commissioner (Litigation). This led to understatement of loss as well as current liability and provision by ` 55.98 crore.
1.41 Gujarat Industrial Development Corporation (2009-10)
• The liability towards payment of price escalation, solatium and interest had been overstated by ` 3.55 crore with corresponding over-statement of expenditure for the year to that extent. This resulted in understatement of excess of income over expenditure by the same amount.
• The Capital works-in-progress had been overstated by ` 49.24 crore on account of non capitalisation of three works which were completed and the final payments were also made to contractors. This had correspondingly resulted in understatement of Fixed Assets to that extent and depreciation.
• The Corporation up to 2008-09 had shown expenditure on power lines, sub-stations etc. as assets in Balance Sheet and from subsequent year 2009-10 charged the same to Profit and loss account. The expenditure included ` 122.32 crore and ` 1.40 crore towards creation of power lines and sub-stations for the period up to 2008-09 and during 2009-10
23 Including one account (2010-11) of Gujarat State Financial Corporation (Sl.No.B-2 of Annexure-2)
audit of which is completed by Statutory Auditors but audit by CAG is in progress.

Audit Report No.4 (Commercial) for the year ended 31 March 2011
14
respectively. The change in accounting policy to treat the expenditure as revenue item and its impact has not been disclosed by the Corporation under ‘Notes to Accounts’.
1.42 The Statutory Auditors (Chartered Accountants) are required to furnish a detailed report upon various aspects including internal control/ internal audit systems in the companies audited in accordance with the directions issued by the CAG to them under Section 619(3) (a) of the Companies Act, 1956 and to identify areas which needed improvement. An illustrative resume of major comments made by the Statutory Auditors on possible improvement in the internal audit/ internal control system in respect of 12 companies24 for the year 2009-10 and 12 companies25 for the year 2010-11 are given below. Sl. No.
Nature of comments made by Statutory Auditors
Number of companies where recommendations
were made
Reference to serial number of the
companies as per Annexure 2
1. Non-fixation of minimum/ maximum limits of store and spares
1 A-3
2. Non maintenance of proper records showing full particulars including quantitative details, situations, identity number, date of acquisitions, depreciated value of fixed assets and their locations
5 A-3, A-6, A-38, A-43, C-10
3. Internal control needs to be strengthened
3 A-3, A-15, A-53
4. Internal Audit required to be strengthened
9 A-3, A-6, A-11, A-13, A-15, A-21, A-25, A-32, A-38
Recoveries at the instance of audit
1.43 During the course of propriety audit in 2010-11, recoveries of ` 64.47 crore were pointed out to the Management of various PSUs of which, recoveries of ` 0.24 crore were admitted and recovered by PSUs during the year 2010-11.
Status of placement of Separate Audit Reports
1.44 The following table shows the status of placement of various Separate Audit Reports (SARs) issued by the CAG on the accounts of Statutory corporations in the Legislature by the Government.
24 Sl.No.A-2, A-3, A-6, A-23, A-26, A-27, A-34, A-39, A-44, A-55, A-56 and C-13 of Annexure 2 25 Sl. No. A-3, A-6, A-11, A-13, A-15, A-21, A-25, A-32, A-38, A-43, A-53 and C-10 of Annexure 2.
Chapter I, Overview of State Public Sector Undertakings
15
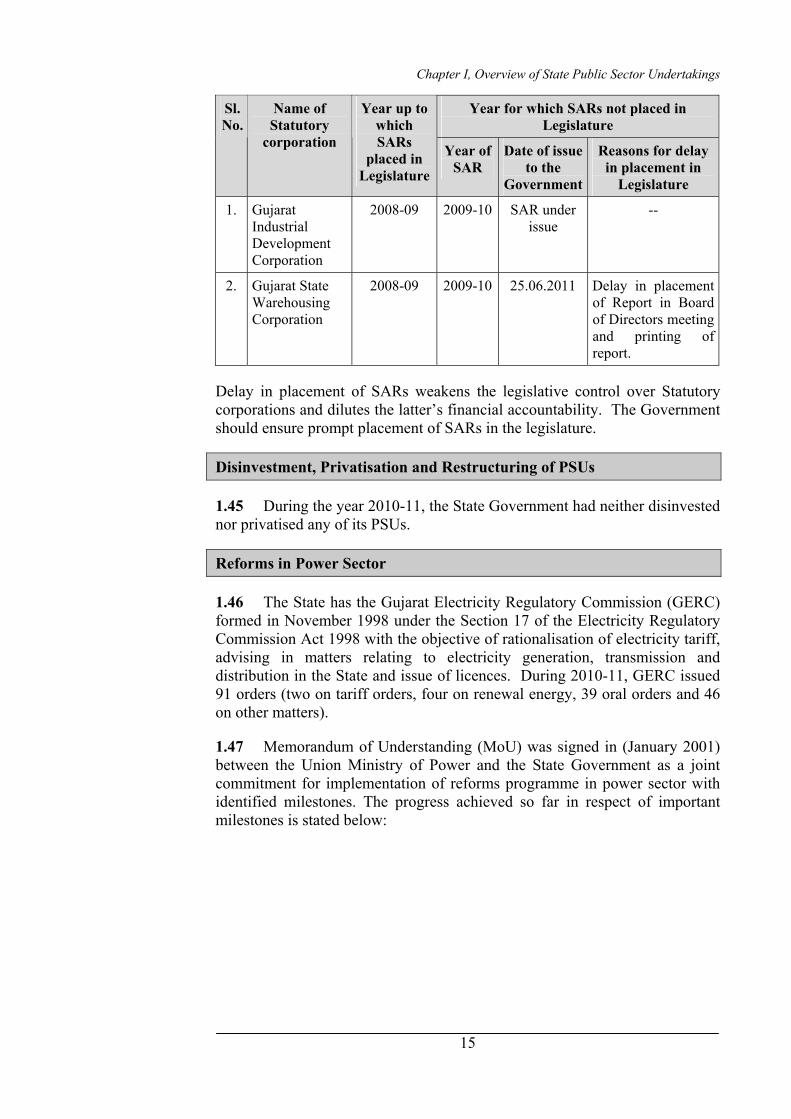
Year for which SARs not placed in Legislature
Sl. No.
Name of Statutory
corporation
Year up to which SARs
placed in Legislature
Year of SAR
Date of issue to the
Government
Reasons for delay in placement in
Legislature
1. Gujarat Industrial Development Corporation
2008-09 2009-10 SAR under issue
--
2. Gujarat State Warehousing Corporation
2008-09 2009-10 25.06.2011 Delay in placement of Report in Board of Directors meeting and printing of report.
Delay in placement of SARs weakens the legislative control over Statutory corporations and dilutes the latter’s financial accountability. The Government should ensure prompt placement of SARs in the legislature.
Disinvestment, Privatisation and Restructuring of PSUs
1.45 During the year 2010-11, the State Government had neither disinvested nor privatised any of its PSUs.
Reforms in Power Sector
1.46 The State has the Gujarat Electricity Regulatory Commission (GERC) formed in November 1998 under the Section 17 of the Electricity Regulatory Commission Act 1998 with the objective of rationalisation of electricity tariff, advising in matters relating to electricity generation, transmission and distribution in the State and issue of licences. During 2010-11, GERC issued 91 orders (two on tariff orders, four on renewal energy, 39 oral orders and 46 on other matters).
1.47 Memorandum of Understanding (MoU) was signed in (January 2001) between the Union Ministry of Power and the State Government as a joint commitment for implementation of reforms programme in power sector with identified milestones. The progress achieved so far in respect of important milestones is stated below:

Audit Report No.4 (Commercial) for the year ended 31 March 2011
16
Sl. No.
Milestone Achievement26 as at March 2011
1. Reduction in T&D losses (No target fixed)
Instead of reduction, T&D losses remained at 20.13 per cent during 2010-11 as was prevailed at the time of signing of MoU during 2001-02.
2. 100 per cent electrification of all villages.
Achieved (March 2002).
3. 100 per cent metering of all distribution feeders.
Achieved (March 2002).
4. 100 per cent metering of agriculture consumers
Only 42.42 per cent metering of agriculture consumers was completed (March 2011).
5. Securitised outstanding dues of Central Public Sector Undertakings (CPSUs).
The dues of CPSUs were reconciled and bonds of ` 1,628.71 crore were issued by State Government against the dues.
26 Status as furnished by Gujarat Urja Vikas Nigam Limited, holding company of four State Power
Distribution Companies.

17
Chapter II
Performance audits relating to Government companies
Dakshin Gujarat Vij Company Limited and Paschim Gujarat Vij Company Limited
2.1 Performance Audit of Power Distribution Utilities
Executive summary The distribution system of the power sector constitutes the final link between the power sector and the consumers. The efficiency of the power sector is judged by the consumers on the basis of performance of this segment. However, it constitutes the weakest part of the sector, which is incurring large losses. In view of the above, the real challenge of reforms in the power sector lies in efficient management of the distribution system. Hence, the National Electricity Policy (NEP) also gives emphasis for the efficiency improvements and recovery of cost of services provided to consumers to make power sector sustainable at reasonable and affordable prices besides others.
Network planning and execution
The creation of distribution network and up-keep of existing network to ensure efficient distribution system for covering maximum population in the State is an important work of Power Distribution Companies (DISCOMs). As on 31 March 2011, the four DISCOMs in Gujarat had a total distribution network of 5,21,157 CKM, 1,190 substations and 4,41,095 transformers for catering supply of power to 1.13 crore consumers.. The increase in the distribution capacity during 2006-11 could not match the pace of growth in consumer demand in all the DISCOMs as a whole as well as in Dakshin Gujarat Vij Company Limited (DGVCL) and Pashchim Gujarat Vij Company Limited (PGVCL). The inadequacy of available transformers capacity of DISCOMs to meet the connected load as on 31 March
2011 led to overloading of network and consequential rotational cuts in distribution of electricity. In selected three divisions of PGVCL, due to improper management of feeders, the connected load was very low compared to the transformer capacity which led to the loss of 104.92 million units valuing ` 42.08 crore in the form of iron and copper losses.
Implementation of central schemes
The NEP envisages supply of electricity to all areas including rural areas. Accordingly, Rajiv Gandhi Grameen Vidyutikaran Yojana (RGGVY) of Government of India (GoI) was being implemented. Overall funds of ` 135.33 crore under RGGVY remained unutilised by four DISCOMs (March 2011). Further, the deficiencies viz., delay in execution of work, non-synchronisation of activities, poor workmanship in execution of work, etc., were noticed in implementation of the scheme.
Under GoI’s Restructured Accelerated Power Development Reforms Programme (R-APDRP), the DISCOMs were to establish IT enabled system (Part A) for the distribution management and also to strengthen sub-transmission and distribution system (Part B). As on 31 March 2011, out of ` 23.28 crore and ` 75.26 crore sanctioned (June 2009) to DGVCL and PGVCL respectively under Part A, ` 7.01 crore and ` 41.67 crore were released. Against this, ` 6.54 crore and ` 7.17 crore was actually utilised by
Audit Report No. 4 (Commercial) for the year ended 31 March 2011
18
DGVCL and PGVCL respectively. Further, though funds of ` 50.14 crore and ` 140.58 crore were sanctioned in March/December 2010 for Part B for DGVCL and PGVCL respectively, the works were not started even after a lapse of nine months (DGVCL) and 18 months (PGVCL) since sanction of loans. During 2006-11, the AT&C losses ranged between 20.59 and 18.35 per cent and 33.77 to 29.03 per cent in DGVCL and PGVCL respectively against the envisaged norm of 15 per cent under R-APDRP.
Operational efficiency
The operational performance of the DISCOM is judged on the basis of availability of adequate power for distribution, adequacy and reliability of distribution network, minimising line losses, detection of theft of electricity, etc.
In DGVCL and PGVCL the distribution loss was in excess of Gujarat Electricity Regulatory Commission (GERC) guideline by 213.14 MUs valuing ` 105.79 crore (2008-10) and by 1,076.48 MUs valuing ` 451.01 crore (2007-11) respectively. The reasons for the high losses included decrease in maintenance activities, excessive failure of transformers (DTRs), delay in repairing DTRs, slow replacement of conventional meters with static/quality meters, non metering of all agricultural consumers, slow implementation of LT less system, slow conversion of LT conductors with Aerial bunch cables, high incidence of theft, etc.
Billing and collection efficiency
Deficiencies in billing system such as unrealistic estimation of agricultural consumption contrary to GERC directives and under recovery of additional Security Deposit (` 297.46 crore in DGVCL and ` 223.10 crore in PGVCL) were noticed. As far as collection efficiency was concerned, non/delay in disconnection of defaulted consumers, delay in issuance of estimate/release of connection order and delay in execution of decree for recovering dues were noticed.
Financial management
The turnover of DISCOMs was ` 19,053.09 crore in 2010-11, which was
equal to 30.24 per cent and 3.70 per cent of the State Working PSUs turnover and State Gross Domestic Product, respectively. The holding company Gujarat Urja Vikas Nigam Limited is arranging for borrowings for meeting short and long term requirements of funds of DISCOMs. Hence, DISCOMs do not have any active role in arrangement of funds. However, DGVCL on its own accord, unwarrantedly borrowed funds of ` 80 crore and repaid it prematurely resulting in loss of interest of ` 8.25 crore. Further, instances of financial losses due to deficiencies such as non-availment of rebate (` 286.62 crore) from holding company for prompt payment against procurement of power, supply of power by DGVCL to agriculture consumers beyond eight hours without any commitment from GoG, for reimbursement of losses (` 38.94 crore), etc., were noticed.
Subsidy Support and Cross Subsidisation
Subsidy support from GoG showed a decreasing trend in two DISCOMs during review period. National Tariff Policy (NTP) envisaged that the tariff of all categories of consumers should range within plus or minus 20 per cent of the Average cost of supply (ACOS) by the year 2010-2011. However, fixation of tariff as per the norms of NTP could not be achieved by the two DISCOMS and there was cross subsidisation exceeding the said norms.
Tariff Fixation
The delay in filing of Annual Revenue Requirement in 2008-09 led to revenue loss of ` 51.75 crore in DGVCL and ` 48.89 crore in PGVCL. In none of the years during 2006-11 any of the two DISCOMs could recover the fixed costs fully against the revenue from sale of energy which indicate that tariff is on lower side and needs revision.
Consumer satisfaction
As per GERC guidelines for redressing the grievances of consumers, the details in a prescribed proforma are required to be maintained. However, in the test checked three divisions of DGVCL, the registers maintained were deficient so far as they did not record the details such as classification and nature of complaint,

Chapter II, Performance audits relating to Government Companies
19
time and date of redressal of grievances, etc.
Energy Conservation
DGVCL and PGVCL did not conduct energy audit during 2006-11 which would have, otherwise, enabled them to identify the areas of energy losses and take steps to reduce the same through system improvements, besides accurately accounting for the units purchased/sold and losses at each level.
Further, the fund provided (2006-11) by GoG for energy conservation activities were not fully utilised by the two DISCOMs.
Conclusion
The distribution reforms envisaged under National Electricity Policy/Plans were not fully achieved by the two DISCOMs. The improper management of feeders in PGVCL led to excessive distribution losses. The implementation of various GoI Schemes for rural electrification and system upgradation/controlling of AT&C losses were sub-optimal on account of several reasons like, poor
workmanship/non-synchronisation of activities, inadequate maintenance activities, slow replacement of conventional meters with static/quality meters, failure in cent percent metering of agricultural consumers, slow implementation of LT less system, etc. Non-collection of additional security deposits, lack of financial autonomy, etc affected the financial health of the DISCOMs. The guidelines of GERC were not strictly adhered to as far as addressing the consumer grievances and conducting energy audits were concerned.
Recommendations
The performance audit contains seven recommendations for timely implementation of GoI Schemes, strengthening the distribution network, expediting the cent percent metering of the agricultural consumers and other measures for controlling the AT&C losses, taking corrective measures for timely recovery of dues from consumers, financial autonomy to DISCOMs, timely redressal of consumer complaints and conducting energy audit.
Introduction
2.1.1 The distribution system of the power sector constitutes the final link between the power sector and the consumer. The efficiency of the power sector is judged by the consumers on the basis of performance of this segment. However, it constitutes the weakest part of the sector, which is incurring large losses. In view of the above, the real challenge of reforms in the power sector lies in efficient management of the distribution system. The National Electricity Policy (NEP) in this regard inter alia emphasises on the adequate transition from financing support to aid restructuring of distribution utilities, efficiency improvements and recovery of cost of services provided to consumers to make the power sector sustainable at reasonable and affordable prices besides others.
2.1.2 As part of power sector reforms, the erstwhile Gujarat Electricity Board (GEB) was unbundled (1 April 2005) into seven1 companies consisting of one holding company dealing with power purchase and other functions on
1 (i) Holding Company viz., Gujarat Urja Vikas Nigam Limited (GUVNL) –deals with power purchase
and other functions on behalf of all the subsidiary companies viz., Power Generation Company (ii) Gujarat state Electricity Corporation Limited (GSECL) Power Transmission Company (iii) Gujarat Energy Transmission Corporation Limited (GETCO) Power Distribution companies (iv) Uttar Gujarat Vij Company Limited (UGVCL) –in north Gujarat (v) Dakshin Gujarat Vij Company Limited (DGVCL) –in south Gujarat (vi) Paschim Gujarat Vij Company Limited (PGVCL) –in west Gujarat and (vii) Madhya Gujarat Vij Company Limited (MGVCL) –in central Gujarat.

Audit Report No. 4 (Commercial) for the year ended 31 March 2011
20
behalf of all the six subsidiaries, including one power generation company, one transmission company and four power distribution companies. All the four Distribution companies (DISCOMs) were incorporated on 15 September 2003 under the Companies Act 1956. The DISCOMs are under the administrative control of Energy and Petrochemicals Department of Government of Gujarat (GoG). The management of each DISCOM is vested with a Board of Directors (BoD) comprising Chairman, Managing Director (MD) and the directors appointed by GoG. The day-to-day operations are carried out by the MD, who is the Chief Executive of DISCOM with the assistance of functional heads (Technical, Finance, Human Recourses, Civil and the Company Secretary). During 2006-07, 33,189 Million Units (MUs) of energy were sold by all four DISCOMs which increased to 45,974 MUs during 2010-11, i.e. an increase of 38.52 per cent during 2006-11. As on 31 March 2011, the DISCOMs had a distribution network of 5,21,157 Circuit Kilometers (CKM), 1,190 substations (under the control of GETCO2) and 4,41,095 transformers of various categories while total number of consumers was 1.13 crore. The turnover of DISCOMs was ` 19,053.09 crore in 2010-11, which was equal to 30.24 per cent and 3.70 per cent of the State working PSUs turnover3 and State Gross Domestic Product4, respectively. The DISCOMs employed 30,405 employees as on 31 March 2011.
2.1.3 The NEP aims to bring about reforms in the Power Distribution Sector with focus on system upgradation, controlling and reduction of Transmission and Distribution (T&D) losses including power thefts and making the sector commercially viable besides putting an effective financing strategy in place so as to generate adequate resources. It further aims to bring out the conservation strategy to optimise utilisation of electricity with focus on demand side management and load management. In view of the above, it was proposed to conduct a performance review on the working of two selected Power Distribution Utilities, viz., Dakshin Gujarat Vij Company Limited (DGVCL) and Paschim Gujarat Vij Company Limited (PGVCL) in the State sector to ascertain whether they were able to adhere to the aims and objectives stated in the National Electricity Policy and Plan and how far the distribution reforms have been achieved.
Scope and Methodology of Audit
2.1.4 The present performance audit conducted during December 2010 to June 2011 covers the performance of DISCOMs during the period from 2006-07 to 2010-11. The performance audit mainly deals with Network Planning and execution, implementation of Central Schemes, Operational Efficiency, Billing and Collection efficiency, Financial Management, Consumer Satisfaction, Energy Conservation and Monitoring. The audit examination of two selected DISCOMs involved scrutiny of records at the Head Office (HO) and five5 out of 17 divisions (29 per cent) under three
2 Gujarat Energy Transmission Corporation Limited, a State PSU which involved in transmission of
power to all DISCOMs. 3 ` 63,008.20 crore. 4 ` 5,14,750 crore. 5 Vapi O&M, Vapi Industrial, Vyara O&M, Ankleshwar Industrial and Surat Industrial
Chapter II, Performance audits relating to Government Companies
21
circles of DGVCL and 146 out of 41 divisions (34 per cent) under 11 circles of PGVCL. The divisions were selected based on highest revenue, highest transmission and distribution (T&D) losses and highest spending on implementation of Government schemes. The records of 23 and 76 sub-divisions of five and 14 selected Divisions of DGVCL and PGVCL respectively were also examined in Audit.
The methodology adopted for attaining the audit objectives with reference to audit criteria consisted of explaining audit objectives to top management, scrutiny of records at HO and selected units, interaction with the auditee personnel, analysis of data with reference to audit criteria, raising of audit queries, discussion of audit findings with the Management and issue of draft performance audit to the Management and the concerned Department for comments.
Audit Objectives
2.1.5 The objectives of the performance audit were to assess whether:
• aims and objectives of National Electricity Policy/Plans were adhered to and distribution reforms achieved;
• the central schemes such as, Revised Accelerated Power Development & Reform Programme (RAPDRP) and Rajiv Gandhi Grameen Vidyutikaran Yojana (RGGVY) were implemented efficiently and effectively;
• the power demand of the consumers in the state was met through efficient operation;
• the billing and collection of revenue from consumers were efficient;
• the financial management was effective and surplus funds, if any, were judiciously invested;
• an appropriate system is in place to assess consumer satisfaction and redressal of grievances;
• energy conservation measures were undertaken; and
Audit Criteria
2.1.6 The audit criteria adopted for assessing the achievement of the audit objectives were:
• Provisions of Electricity Act 2003;
6 Surendranagar I, Surendranagar II, Savarkundla, Una, Botad, Bhavanagar Rural, Morbi, Bhuj O&M,
Anjar, Jamnagar City 2, Porbandar City, Veeraval, Rajkot City 1 and Rajkot Rural Division.

Audit Report No. 4 (Commercial) for the year ended 31 March 2011
22
• National Electricity Policy, Plan and norms concerning distribution network of DISCOMs and Planning criteria fixed by the SERC,
• Terms and conditions contained in the Central Scheme Documents;
• Standard procedures for award of contract and reference to principles of economy, efficiency and effectiveness;
• Norms prescribed by various agencies with regard to operational activities;
• Norms of technical and non-technical losses; and
• Guidelines/instructions/directions of GoG/SERC.
Financial Position and Working Results of the selected DISCOMs
2.1.7 The financial position of DGVCL for the last five years ending 2010-11 is given below:
(` in crore) Particulars 2006-07 2007-08 2008-09 2009-10 2010-11A. Liabilities Paid-up Capital 0.05 0.05 267.73 267.73 267.73Share Capital Suspense account 291.58 291.58 0 0 0Reserve & Surplus 30.33 31.87 253.55* 275.12 337.87Deferred Govt. grants, subsidies and consumer contributions
306.52 282.60 409.23 517.52 667.33
Borrowings (Loan Funds) Secured 29.87 404.81 340.03 295.92 171.51Unsecured 626.19 253.37 298.07 240.34 149.16Current Liabilities & Provisions 678.60 759.29 884.81 986.19 1,104.07Total 1,963.14 2,023.57 2,453.42 2,582.82 2,697.67B. Assets Gross Block 1,287.16 1,502.88 1,716.53 1,893.75 2,070.46Less: Depreciation 192.85 255.60 329.21 411.74 503.71Net Fixed Assets 1,094.31 1,247.28 1,387.32 1,482.01 1,566.75Capital works-in-progress 9.06 13.19 8.80 21.39 49.17Investments 0.00 0.00 0.00 0.00 0.00Current Assets, Loans and Advances
859.77 763.10 1,057.30 1,079.42 1,081.75
Total 1,963.14 2,023.57 2,453.42 2,582.82 2,697.67Net Worth7 321.96 323.50 521.28 542.85 605.60
* Includes Security Premium amount of ` 218.68 crore Source: Annual Accounts of DGVCL
It may be seen from the above that the Net worth of DGVCL increased from ` 321.96 crore to ` 605.60 crore during the audit period. The Share Capital Suspense Account (` 291.58 crore) above represents the amount transferred by the GoG to DGVCL after unbundling (April 2005) of erstwhile GEB but pending issue of share capital. During 2008-09, the GoG bifurcated the said
7 Net worth includes Paid-up capital, share capital suspense account and Reserves and Surplus

Chapter II, Performance audits relating to Government Companies
23
amount of share capital suspense account into equity share capital (` 72.90 crore) and share premium account (` 218.68 crore) which was grouped under Reserves and Surplus. In addition to that, in the same year (2008-09), the GoG had further infused ` 164.78 crore as equity capital and ` 30 crore as share application money which was converted into equity capital in 2009-10. As a consequential impact, the Paid-up capital and Reserves and Surplus increased from ` 0.05 crore (2007-08) to ` 267.73 crore (2008-09) and from ` 31.87 crore (2007-08) to ` 253.55 crore (2008-09) respectively. The increase in the equity capital during 2008-09 has the corresponding impact of increasing the net worth of the Company from ` 323.50 crore (2007-08) to ` 521.28 crore (2008-09).
2.1.8 The particulars of cost of electricity vis-à-vis revenue realisation per unit of DGVCL are indicated below in the working results:
(` in crore) Sl. No.
Description 2006-07 2007-08 2008-09 2009-10 2010-11
1 Income (i) Revenue from Sale of Power 3,138.46 3,324.59 4,148.22 4,384.36 5,210.31(ii) Revenue subsidy & grants 49.28 49.38 49.70 48.98 46.66(iii) Other income 174.11 133.14 84.75 88.62 119.47(iv) Total Income 3,361.85 3,507.11 4,282.67 4,521.96 5,376.442 Distribution (In MUs) (i) Total power purchased 9,525 9,918 10,331 11,266 11,704(ii) Less: Transmission losses, if available 473 483 590 701 482(iii) Net Power available for Sale 9,052 9,435 9,741 10,565 11,222
(iv) Less: Sub-transmission & distribution losses 1,495 1,456 1,436 1,606 1,385
(v) Net power sold 7,557 7,979 8,305 8,959 9,837
3 Expenditure on Distribution of Electricity
(a) Fixed cost (i) Employees cost 143.65 124.61 147.21 173.90 174.48(ii) Administrative and General expenses 22.53 24.49 26.42 30.89 31.13
(iii) Depreciation 53.59 64.58 75.57 85.20 92.97(iv) Interest and finance charges 80.37 73.29 89.42 92.69 86.45(v) Other Expenses (Capitalised expenses) (50.78) (42.88) (40.85) (38.55) (38.68)(vi) Total fixed cost 249.36 244.09 297.77 344.13 346.35(b) Variable cost (i) Purchase of Power 3,030.39 3,194.76 3,953.55 4,048.68 4,880.88(ii) Repairs & Maintenance 21.58 35.67 20.33 16.40 20.31(iii) Other debits 32.98 30.57 7.32 71.82 40.81(iv) Total variable cost 3,084.95 3,261.00 3,981.20 4,136.90 4,942.00(c) Total cost 3(a) + (b) 3,334.31 3,505.09 4,278.97 4,481.03 5,288.35
4 Realisation (` per unit sold) (including revenue subsidy) ((1(i) + 1(ii) )/ 2(v) X10) 4.22 4.23 5.05 4.95 5.34
5 Fixed cost ( ` per unit) (3(a) (vi) / 2(v) X10) 0.33 0.30 0.36 0.38 0.35
6 Variable cost (` per unit) (3(b) (iv) / 2(v) X10) 4.08 4.09 4.79 4.62 5.02
7 Total cost per unit (in `) (5+6) 4.41 4.39 5.15 5.00 5.378 Contribution (4-6) (` per unit) 0.14 0.14 0.26 0.33 0.329 Profit (+)/Loss(-) per unit (in `) (4-7) -0.19 -0.16 -0.10 -0.05 -0.03
Source: Annual Accounts and Information furnished by DGVCL

Audit Report No. 4 (Commercial) for the year ended 31 March 2011
24
It may be seen from the above that while the realisation per unit increased from ` 4.22 to ` 5.34 during 2006-11 (26.54 per cent), the total cost per unit also increased from ` 4.41 to ` 5.37 (21.77 per cent) during the corresponding period. The contribution per unit had increased by around 128 per cent from ` 0.14 to ` 0.32 during the period 2006-2011 with corresponding decrease in loss per unit from ` 0.19 (2006-07) to ` 0.03 (2010-11), viz., more than 84 per cent. The main reason behind the significant decrease in loss per unit was upward revision in tariff structure during the year 2008-09.
Recovery of cost of operations
2.1.9 DGVCL was not able to recover its cost of operations. During the last five years ending 2010-11, the loss per unit is as given in the graph below:
4.22
4.23
5.05
4.95
5.34
4.41
4.39
5.15
5.00
5.37
-0.1
9
-0.1
6
-0.0
3
-0.1
0
-0.0
5
-1.00
0.00
1.00
2.00
3.00
4.00
5.00
6.00
2006-07 2007-08 2008-09 2009-10 2010-11
Realisation per Unit Cost per Unit Loss per Unit
It may be seen from the working results that there had been a revenue gap8 of ` 146.57 crore in 2006-07 (even after including revenue subsidies and grants), which decreased to ` 31.38 crore in 2010-11. Though the revenue gap has recorded significant reduction during 2006-11, the same needs attention of GoG for necessary remedial action.
8 Total Income (Excluding other income) less Total Cost
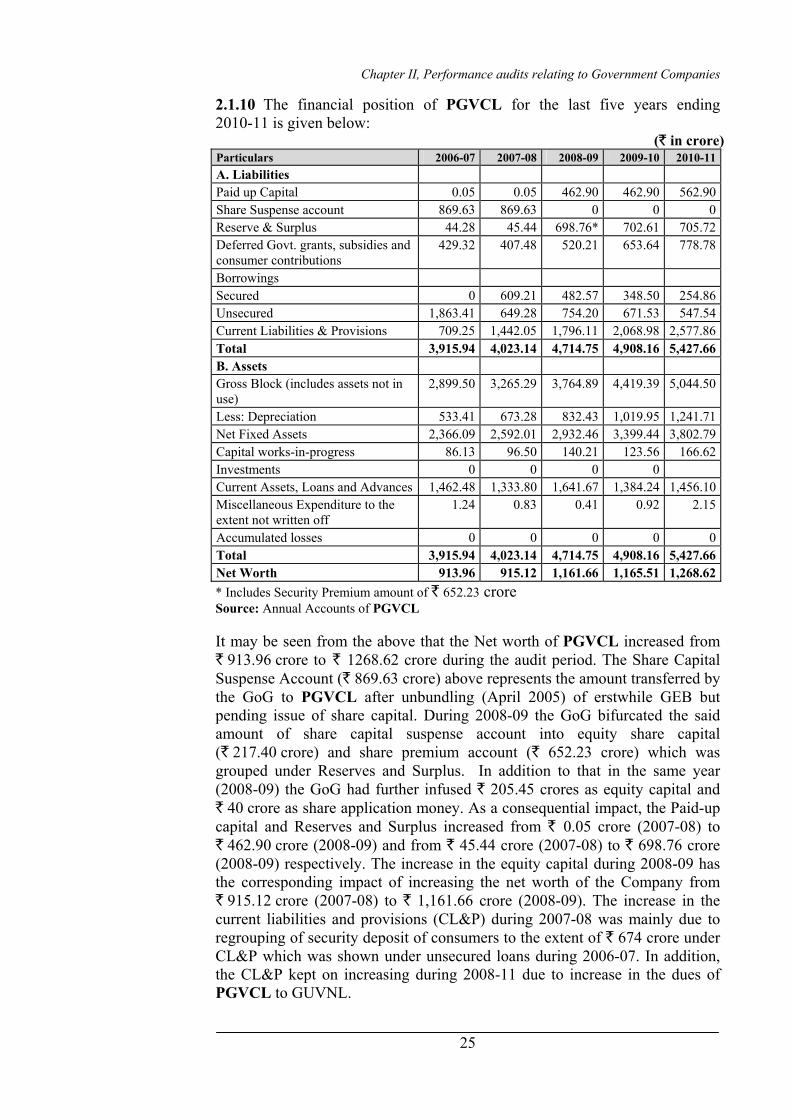
Chapter II, Performance audits relating to Government Companies
25
2.1.10 The financial position of PGVCL for the last five years ending 2010-11 is given below:
(` in crore) Particulars 2006-07 2007-08 2008-09 2009-10 2010-11A. Liabilities Paid up Capital 0.05 0.05 462.90 462.90 562.90Share Suspense account 869.63 869.63 0 0 0Reserve & Surplus 44.28 45.44 698.76* 702.61 705.72Deferred Govt. grants, subsidies and consumer contributions
429.32 407.48 520.21 653.64 778.78
Borrowings Secured 0 609.21 482.57 348.50 254.86Unsecured 1,863.41 649.28 754.20 671.53 547.54Current Liabilities & Provisions 709.25 1,442.05 1,796.11 2,068.98 2,577.86Total 3,915.94 4,023.14 4,714.75 4,908.16 5,427.66B. Assets Gross Block (includes assets not in use)
2,899.50 3,265.29 3,764.89 4,419.39 5,044.50
Less: Depreciation 533.41 673.28 832.43 1,019.95 1,241.71Net Fixed Assets 2,366.09 2,592.01 2,932.46 3,399.44 3,802.79Capital works-in-progress 86.13 96.50 140.21 123.56 166.62Investments 0 0 0 0Current Assets, Loans and Advances 1,462.48 1,333.80 1,641.67 1,384.24 1,456.10Miscellaneous Expenditure to the extent not written off
1.24 0.83 0.41 0.92 2.15
Accumulated losses 0 0 0 0 0Total 3,915.94 4,023.14 4,714.75 4,908.16 5,427.66Net Worth 913.96 915.12 1,161.66 1,165.51 1,268.62* Includes Security Premium amount of ` 652.23 crore Source: Annual Accounts of PGVCL
It may be seen from the above that the Net worth of PGVCL increased from ` 913.96 crore to ` 1268.62 crore during the audit period. The Share Capital Suspense Account (` 869.63 crore) above represents the amount transferred by the GoG to PGVCL after unbundling (April 2005) of erstwhile GEB but pending issue of share capital. During 2008-09 the GoG bifurcated the said amount of share capital suspense account into equity share capital (` 217.40 crore) and share premium account (` 652.23 crore) which was grouped under Reserves and Surplus. In addition to that in the same year (2008-09) the GoG had further infused ` 205.45 crores as equity capital and ` 40 crore as share application money. As a consequential impact, the Paid-up capital and Reserves and Surplus increased from ` 0.05 crore (2007-08) to ` 462.90 crore (2008-09) and from ` 45.44 crore (2007-08) to ` 698.76 crore (2008-09) respectively. The increase in the equity capital during 2008-09 has the corresponding impact of increasing the net worth of the Company from ` 915.12 crore (2007-08) to ` 1,161.66 crore (2008-09). The increase in the current liabilities and provisions (CL&P) during 2007-08 was mainly due to regrouping of security deposit of consumers to the extent of ` 674 crore under CL&P which was shown under unsecured loans during 2006-07. In addition, the CL&P kept on increasing during 2008-11 due to increase in the dues of PGVCL to GUVNL.
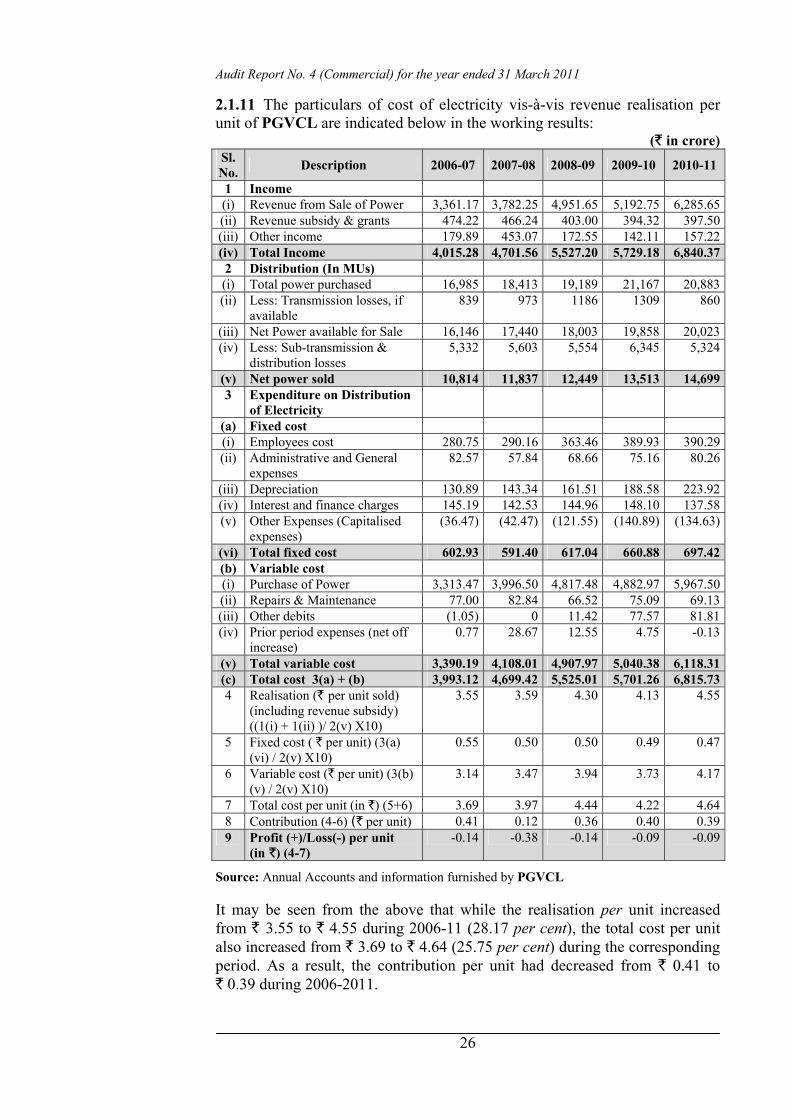
Audit Report No. 4 (Commercial) for the year ended 31 March 2011
26
2.1.11 The particulars of cost of electricity vis-à-vis revenue realisation per unit of PGVCL are indicated below in the working results:
(` in crore) Sl. No. Description 2006-07 2007-08 2008-09 2009-10 2010-11
1 Income (i) Revenue from Sale of Power 3,361.17 3,782.25 4,951.65 5,192.75 6,285.65(ii) Revenue subsidy & grants 474.22 466.24 403.00 394.32 397.50(iii) Other income 179.89 453.07 172.55 142.11 157.22(iv) Total Income 4,015.28 4,701.56 5,527.20 5,729.18 6,840.372 Distribution (In MUs) (i) Total power purchased 16,985 18,413 19,189 21,167 20,883(ii) Less: Transmission losses, if
available 839 973 1186 1309 860
(iii) Net Power available for Sale 16,146 17,440 18,003 19,858 20,023(iv) Less: Sub-transmission &
distribution losses 5,332 5,603 5,554 6,345 5,324
(v) Net power sold 10,814 11,837 12,449 13,513 14,6993 Expenditure on Distribution
of Electricity
(a) Fixed cost (i) Employees cost 280.75 290.16 363.46 389.93 390.29(ii) Administrative and General
expenses 82.57 57.84 68.66 75.16 80.26
(iii) Depreciation 130.89 143.34 161.51 188.58 223.92(iv) Interest and finance charges 145.19 142.53 144.96 148.10 137.58(v) Other Expenses (Capitalised
expenses) (36.47) (42.47) (121.55) (140.89) (134.63)
(vi) Total fixed cost 602.93 591.40 617.04 660.88 697.42(b) Variable cost (i) Purchase of Power 3,313.47 3,996.50 4,817.48 4,882.97 5,967.50(ii) Repairs & Maintenance 77.00 82.84 66.52 75.09 69.13(iii) Other debits (1.05) 0 11.42 77.57 81.81(iv) Prior period expenses (net off
increase) 0.77 28.67 12.55 4.75 -0.13
(v) Total variable cost 3,390.19 4,108.01 4,907.97 5,040.38 6,118.31(c) Total cost 3(a) + (b) 3,993.12 4,699.42 5,525.01 5,701.26 6,815.734 Realisation (` per unit sold)
(including revenue subsidy) ((1(i) + 1(ii) )/ 2(v) X10)
3.55 3.59 4.30 4.13 4.55
5 Fixed cost ( ` per unit) (3(a) (vi) / 2(v) X10)
0.55 0.50 0.50 0.49 0.47
6 Variable cost (` per unit) (3(b) (v) / 2(v) X10)
3.14 3.47 3.94 3.73 4.17
7 Total cost per unit (in `) (5+6) 3.69 3.97 4.44 4.22 4.648 Contribution (4-6) (` per unit) 0.41 0.12 0.36 0.40 0.399 Profit (+)/Loss(-) per unit
(in `) (4-7) -0.14 -0.38 -0.14 -0.09 -0.09
Source: Annual Accounts and information furnished by PGVCL
It may be seen from the above that while the realisation per unit increased from ` 3.55 to ` 4.55 during 2006-11 (28.17 per cent), the total cost per unit also increased from ` 3.69 to ` 4.64 (25.75 per cent) during the corresponding period. As a result, the contribution per unit had decreased from ` 0.41 to ` 0.39 during 2006-2011.

Chapter II, Performance audits relating to Government Companies
27
Recovery of cost of operations
2.1.12 PGVCL was not able to recover its cost of operations during the last five years ending 2010-11; the loss ranged from ` 0.38 in 2007-08 to ` 0.09 in 2010-11 per unit as given in the graph below:
3.55 3.59
4.30
4.13 4.
55
3.69 3.
97
4.44
4.22 4.
64
-0.1
4
-0.3
8
-0.1
4
-0.0
9
-0.0
9
-1
0
1
2
3
4
5
2006-07 2007-08 2008-09 2009-10 2010-11
Realisation per Unit Cost per Unit Loss per Unit
It may be seen from the working results that there had been a revenue gap of ` 157.73 crore in 2006-07 (even after including revenue subsidies and grants), which decreased to ` 132.58 crore in 2010-11. The revenue gap recorded during 2010-11 is significant and needs attention of GoG for necessary remedial action.
Our analysis revealed that main reasons for low realisation per unit in DGVCL and PGVCL were low agricultural tariff, failure in cent per cent metering of agricultural consumers and slow replacement of electro-mechanical meters with static/quality meters, as discussed in the succeeding paragraphs.
Audit Findings
2.1.13 We explained the audit objectives to the selected DISCOMs during an ‘Entry Conference’ held on 8 March 2011 (PGVCL) and 10 March 2011 (DGVCL). Subsequently, audit findings were reported to both the DISCOMs and the GoG in July 2011 and discussed in an ‘Exit Conference’ held with the Management of PGVCL on 4 August 2011 and DGVCL on 9 September 2011 which was attended by MD and heads of the departments of both the DISCOMs. The Management of both the DISCOMs replied to the audit findings in August 2011 which were endorsed (September 2011) by the State Government. The views expressed by them have been duly considered while finalising this performance audit. The audit findings are discussed in subsequent paragraphs.
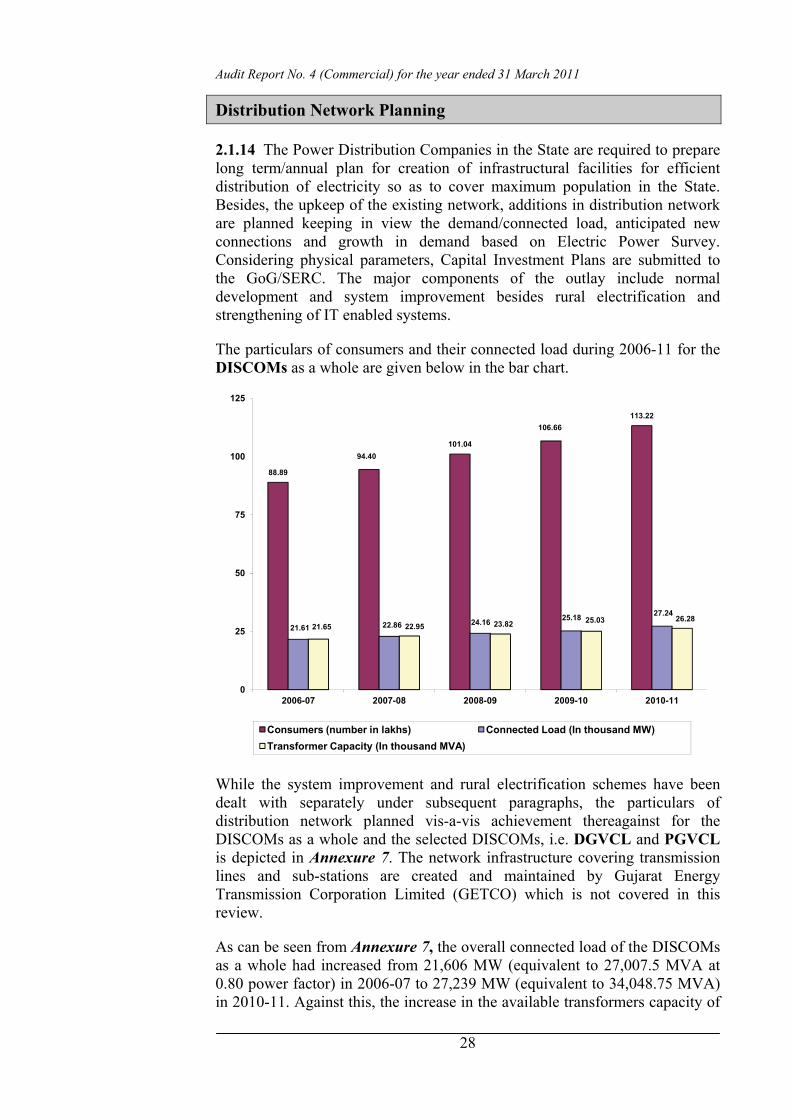
Audit Report No. 4 (Commercial) for the year ended 31 March 2011
28
Distribution Network Planning
2.1.14 The Power Distribution Companies in the State are required to prepare long term/annual plan for creation of infrastructural facilities for efficient distribution of electricity so as to cover maximum population in the State. Besides, the upkeep of the existing network, additions in distribution network are planned keeping in view the demand/connected load, anticipated new connections and growth in demand based on Electric Power Survey. Considering physical parameters, Capital Investment Plans are submitted to the GoG/SERC. The major components of the outlay include normal development and system improvement besides rural electrification and strengthening of IT enabled systems.
The particulars of consumers and their connected load during 2006-11 for the DISCOMs as a whole are given below in the bar chart.
88.89
94.40101.04
106.66113.22
21.61 22.86 24.16 25.18 27.24
21.65 22.95 23.82 25.03 26.28
0
25
50
75
100
125
2006-07 2007-08 2008-09 2009-10 2010-11
Consumers (number in lakhs) Connected Load (In thousand MW)Transformer Capacity (In thousand MVA)
While the system improvement and rural electrification schemes have been dealt with separately under subsequent paragraphs, the particulars of distribution network planned vis-a-vis achievement thereagainst for the DISCOMs as a whole and the selected DISCOMs, i.e. DGVCL and PGVCL is depicted in Annexure 7. The network infrastructure covering transmission lines and sub-stations are created and maintained by Gujarat Energy Transmission Corporation Limited (GETCO) which is not covered in this review.
As can be seen from Annexure 7, the overall connected load of the DISCOMs as a whole had increased from 21,606 MW (equivalent to 27,007.5 MVA at 0.80 power factor) in 2006-07 to 27,239 MW (equivalent to 34,048.75 MVA) in 2010-11. Against this, the increase in the available transformers capacity of

Chapter II, Performance audits relating to Government Companies
29
DISCOMs as a whole was from 21,645 MVA (2006-07) to 26,277 MVA (2010-11) as depicted in the graph. Thus, the increase in distribution capacity could not match the pace of growth in consumer demand. As such, the available transformers capacity of 34,048.75 MVA of the four DISCOMs as on 31 March 2011 was inadequate to meet the connected load of 27,239 MW (equivalent to 34,048.75 MVA) as on that date.
In DGVCL and PGVCL also, against the connected load of 5,335 MW (equivalent to 6,668.75 MVA) and 10,141 MW (equivalent to 12,676.25 MVA) as on 31 March 2011, the available transformers capacity was 4,086 MVA and 10,347 MVA respectively. Thus, the available transformers capacity in both the DISCOMs selected in the review was also inadequate to meet the connected load as on 31 March 2011, which led to overloading of network and consequential rotational cuts in power distribution by the DISCOMs.
Management of feeders
2.1.15 The power supply from the substation reaches the consumer through the feeders and the transformers. The management of feeder inter alia includes proper allocation of transformers under each feeder and also ensuring the optimum utilization of transformers by proper allocation of connected load (contracted load) under it. A review of management of feeders in selected three divisions (Jamnagar, Porbandhar and Veraval) of PGVCL relating to 2007-08 to 2009-10 revealed that the total connected load (contracted load) was very low as compared to stipulated load of 80 per cent of the transformer capacity causing significant energy loss.
Test check of records of 260 out of 2,003 feeders, conducted during the period, showed that in 2,601 transformers of 53 feeders, the connected load was less than 80 per cent as detailed below:
Percentage of connected load to Transformer capacity Total number of feeders/transformers less than 30 30 to 50 50 to 60 60-70 70-80
53/2,601 15/834 22/1,286 6/181 6/153 4/147
We observed thOat though the connected load was low, PGVCL used higher capacity transformers viz., 25, 63, 100 and 200 KVA under the above feeders instead of using lower capacity transformers viz., 5, 10, and 16 KVA. As a result of not using the transformer capacity commensurate with the connected load led to loss of 104.92 million units valuing ` 42.08 crore (calculated at the average realisation rate of ` 4.01 for 2007-10) in the form of Iron and Copper loss9. 9 Iron loss is also called core loss or excitation loss. It is the power used in the process of exciting the
core of a transformer. Copper losses are an undesirable transfer of energy, as are core losses, which result from induced currents in adjacent components. The term is applied regardless of whether the windings are made of copper or another conductor such as aluminium. Iron – 1,15,00,124 units and Copper - 9,34,25,671 units (Standard value of iron/copper loss (in watts) x no. of transformers = Total iron/copper loss (in watts)/1000 = Loss in KW x 24 hrs x 365 days = Annual loss.)
Improper management of feeders led to loss of 104.92 million units valuing ` 42.08 crore (2007-10)

Audit Report No. 4 (Commercial) for the year ended 31 March 2011
30
At the same time, however, we observed that PGVCL as a whole was facing a large number of Distribution Transformers (DTRs) failure ranging from 91.90 to 97.53 per cent on account of overloading of DTRs as discussed under paragraph 2.1.34.
Thus, the Company needs to commission the feeders and DTRs of the capacity commensurate with the connected load based on the study/assessment of region-wise actual consumer demand.
PGVCL stated (August 2011) that very low connected load to the transformers was due to using of higher capacity transformers as against the lower contracted load, since the lower capacity transformers were not available in the market. However, now it had started using lower capacity transformers.
The reply is not tenable. Since PGVCL did not attempt to purchase lower capacity transformers in the past, their contention that lower capacity transformers were not available in the market could not be established by PGVCL.
Implementation of Jyoti Gram Yojana
2.1.16 The GoG launched (2004-05) the Jyoti Gram Yojana (JGY) with the aim to provide continuous power supply for agriculture and domestic use in rural areas and to reduce the distribution losses of rural sector. Under the scheme, the power supply to rural areas is given through installation of separate JGY feeders, for agricultural use (three phase feeders) and domestic use (single phase feeders) with a view to provide uninterrupted supply for 8 to 10 hours per day for agricultural use and 24 hours supply for domestic use. The JGY was implemented till 2007-08 in the state as a whole at a total cost of ` 1,290 crore by incurring expenditure on feeders, HT/LT lines, transformers, poles, etc.
We observed that in DGVCL and PGVCL, though the main objective of 24 hours supply to rural areas was achieved, no significant achievement was noticed in reduction of distribution losses in JGY feeders. The distribution loss in JGY feeders after implementation (2008-11) was ranging from 52 to 60 per cent as against 60 to 66 per cent before implementation (2007-08) of JGY. The reasons for high losses were theft and pilferage of power, non replacement of defective conductors and non-replacement of conventional meters with static/quality meters.
While accepting the facts of the case, PGVCL stated (August 2011) that it had taken corrective measures by replacing the conductors, providing quality meters, de-augmentation of transformers etc., during 2008-10 thereby reducing the distribution losses from 66 to 52 per cent during 2008-11. The fact, however, remains that PGVCL failed to reduce distribution losses in JGY feeders to the norms prescribed by GERC (26 to 30 per cent).
Chapter II, Performance audits relating to Government Companies
31
Implementation of Centrally Sponsored Schemes
Rural Electrification
2.1.17 The NEP states that the key objective of development of the power sector is to supply electricity to all areas including rural areas for which the GoI and the GoG would jointly endeavour to achieve this objective. Accordingly, the Rajiv Gandhi Grameen Vidhyutikaran Yojana (RGGVY) was launched in April 2005, which aimed at providing access to electricity for all households in five years for which the Government provides 90 per cent capital subsidy.
As per the scheme guidelines, a village is considered to be electrified if following conditions are fulfilled:
• basic infrastructure such as Distribution Transformer and Distribution lines are provided in the inhabited locality as well as the Dalit Basti hamlet where it exists;
• electricity is provided at all public places like Schools, Panchayat Office, Health Centers, Dispensaries, Community centers etc.; and
• at least 10 per cent of the total number of households in the village are electrified.
Besides, the GoI notified the Rural Electrification Policy (REP) in August 2006. The REP inter alia aims at providing access to electricity for all households by 2009 and minimum lifeline consumption of one Unit per household per day as a merit good by the year 2012. The other RE schemes viz., Accelerated Electrification of one lakh villages and one crore households, Minimum Needs Programme were merged into RGGVY. The features of the erstwhile ‘Kutir Jyoti Programme’ were also suitably integrated into this scheme.
Total villages falling under the jurisdictions of four DISCOMs were 18,065 (as per 2001 Census10). In respect of DGVCL and PGVCL, out of 3,683 and 5,629 villages as on 31 March 2006, 3,505 and 5,613 villages were electrified which was 95.17 and 99.72 per cent of total villages respectively (31 March 2011).
Funds available and its utilization
2.1.18 For implementation of the scheme, a Tripartite Agreement was entered between Rural Electrification Corporation (REC), GoG and respective DISCOMs for availing financial assistance from GOI. Of the total project cost, 90 per cent of the cost was given as subsidy and remaining 10 per cent in the form of loan carrying interest at the rate of five per cent. The loan was repayable in 15 years inclusive of five years moratorium. As per the condition 10 Figures of 2001 census was considered in absence of figures of 2011 census
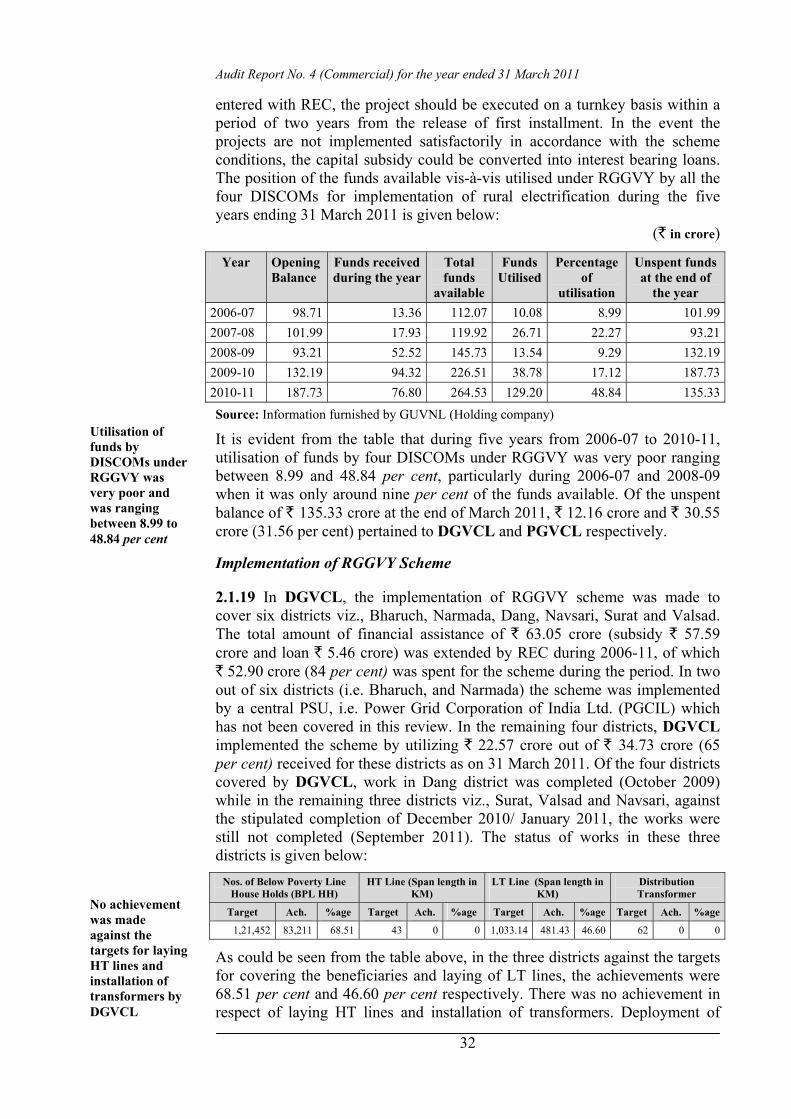
Audit Report No. 4 (Commercial) for the year ended 31 March 2011
32
entered with REC, the project should be executed on a turnkey basis within a period of two years from the release of first installment. In the event the projects are not implemented satisfactorily in accordance with the scheme conditions, the capital subsidy could be converted into interest bearing loans. The position of the funds available vis-à-vis utilised under RGGVY by all the four DISCOMs for implementation of rural electrification during the five years ending 31 March 2011 is given below:
(` in crore)
Source: Information furnished by GUVNL (Holding company)
It is evident from the table that during five years from 2006-07 to 2010-11, utilisation of funds by four DISCOMs under RGGVY was very poor ranging between 8.99 and 48.84 per cent, particularly during 2006-07 and 2008-09 when it was only around nine per cent of the funds available. Of the unspent balance of ` 135.33 crore at the end of March 2011, ` 12.16 crore and ` 30.55 crore (31.56 per cent) pertained to DGVCL and PGVCL respectively.
Implementation of RGGVY Scheme
2.1.19 In DGVCL, the implementation of RGGVY scheme was made to cover six districts viz., Bharuch, Narmada, Dang, Navsari, Surat and Valsad. The total amount of financial assistance of ` 63.05 crore (subsidy ` 57.59 crore and loan ` 5.46 crore) was extended by REC during 2006-11, of which ` 52.90 crore (84 per cent) was spent for the scheme during the period. In two out of six districts (i.e. Bharuch, and Narmada) the scheme was implemented by a central PSU, i.e. Power Grid Corporation of India Ltd. (PGCIL) which has not been covered in this review. In the remaining four districts, DGVCL implemented the scheme by utilizing ` 22.57 crore out of ` 34.73 crore (65 per cent) received for these districts as on 31 March 2011. Of the four districts covered by DGVCL, work in Dang district was completed (October 2009) while in the remaining three districts viz., Surat, Valsad and Navsari, against the stipulated completion of December 2010/ January 2011, the works were still not completed (September 2011). The status of works in these three districts is given below:
Nos. of Below Poverty Line House Holds (BPL HH)
HT Line (Span length in KM)
LT Line (Span length in KM)
Distribution Transformer
Target Ach. %age Target Ach. %age Target Ach. %age Target Ach. %age
1,21,452 83,211 68.51 43 0 0 1,033.14 481.43 46.60 62 0 0
As could be seen from the table above, in the three districts against the targets for covering the beneficiaries and laying of LT lines, the achievements were 68.51 per cent and 46.60 per cent respectively. There was no achievement in respect of laying HT lines and installation of transformers. Deployment of
Year Opening Balance
Funds received during the year
Total funds
available
Funds Utilised
Percentage of
utilisation
Unspent funds at the end of
the year 2006-07 98.71 13.36 112.07 10.08 8.99 101.992007-08 101.99 17.93 119.92 26.71 22.27 93.212008-09 93.21 52.52 145.73 13.54 9.29 132.192009-10 132.19 94.32 226.51 38.78 17.12 187.732010-11 187.73 76.80 264.53 129.20 48.84 135.33
Utilisation of funds by DISCOMs under RGGVY was very poor and was ranging between 8.99 to 48.84 per cent
No achievement was made against the targets for laying HT lines and installation of transformers by DGVCL

Chapter II, Performance audits relating to Government Companies
33
inexperienced personnel by the contractor and consequential poor workmanship in the work executed led to the slow progress in achievement of the target. We observed that among the three districts, in Surat district, the progress of achievement against the targets for number of beneficiaries to be covered and laying of LT lines were 59.26 per cent and 39.76 per cent respectively.
DGVCL stated that (September 2011) the slow progress in the work was caused mainly due to prolonged monsoon during the year 2010. However, necessary actions were taken to expedite the work and the company was hopeful of completing the project by 30 November 2011 as per the extended time limit of REC.
The reply is not tenable. The duration of 18 months for execution of work was stipulated in the contract after reckoning the uncontrollable forces including monsoon. The non completion of works in all the three districts even after lapse of nine months since the scheduled date of completion indicates the poor monitoring and management of the contract by DGVCL.
In PGVCL, all the eight districts were selected for implementation of the scheme during 2006-11. During 2008-11, PGVCL had utilized ` 41.43 crore (58 per cent) out of the total funds of ` 71.98 crore made available from REC. The stipulated date of completion of scheme works was May 2009 in Bhavanagar district and was June 2011 in remaining seven districts viz., Rajkot, Porbandar, Junagadh, Jamnagar, Kutch, Amreli and Surendranagar districts. Except Amreli district, in other seven districts the works were not completed (September 2011). The status of completion of works in these districts is given below:
Nos. of Below Poverty Line House Holds (BPL HH)
HT Line (Span length in KM)
LT Line (Span length in KM)
Distribution Transformer
Target Ach. %age Target Ach. %age Target Ach. %age Target Ach. %age
2,19,978 1,45,670 66.22 600.4 292.4 48.70 2,140.0 1,347.8 62.98 1,323 1,180 89.19
As could be seen from the table above, as against the targets for covering the beneficiaries, laying of HT lines, LT lines and installation of transformers, the achievements were 66.22 per cent, 48.70 per cent, 62.98 per cent and 89.19 per cent respectively.
The main reasons for the delay in execution of works were inadequate deployment of man power, non-completion of detailed survey, delay in procurement of material by the contractor and also poor monitoring of the project activities by PGVCL.
In the implementation of electrification schemes, the HT and LT lines were to be laid first in order to charge the transformers which in turn would be used to service BPL HH beneficiaries. However, we noticed that in three11 out of eight districts covered by PGVCL, though 48 per cent and 52 per cent of HT and LT line respectively were yet to be laid, cent per cent of the planned transformers were installed and charged by utilising the HT/LT lines already
11 Jamnagar, Junagadh and Rajkot districts.
No synchronisation between the activities of laying of lines and installing of transformers under RGGVY in PGVCL

Audit Report No. 4 (Commercial) for the year ended 31 March 2011
34
created under a separate centrally/state sponsored scheme viz Sagar Khedu scheme on the plea of servicing the BPL HH beneficiaries on urgent basis. This indicated that the entire network of laying line and installing of transformers under RGGVY were not synchronised.
Restructured Accelerated Power Development Reforms Programme
2.1.20 The Government of India (GoI) approved the Accelerated Power Development Reforms Programme (APDRP) to leverage the reforms in power sector through the GoG. This scheme was implemented by the power sector companies through the GoG with the objective of up-gradation of sub-transmission and distribution system including energy accounting and metering, for which financial support was provided by GOI.
In order to carry on the reforms further, the GOI launched the Restructured APDRP (R-APDRP) in July 2008 as a Central Sector Scheme for XI Plan. The R-APDRP scheme comprises Part A and B. Part A was dedicated to establishment of IT enabled system for achieving reliable and verifiable baseline data system in all towns, besides, installation of SCADA12/Distribution Management System. For this, 100 per cent loan is provided, and was convertible into grant on completion and verification of the scheme work by Third Party independent evaluating agencies.
The Part B of the scheme deals with strengthening of regular sub-transmission and distribution system and upgradation projects. Under the scheme the financial assistance to the extent of 25 per cent of the approved project cost (Part-B) was to be provided in the form of loan through Power Finance Corporation Limited (PFC), a central PSU, which was the nodal agency appointed by the GoI for implementation of scheme. Remaining 75 per cent of project cost is to be arranged by DISCOM through GUVNL from financial institutions.
As per terms of sanction of loan, if DISCOMs successfully complete the projects within the time schedule and achieve the target of reducing the aggregate technical and commercial (AT&C) losses to 15 per cent on a sustainable basis for a period of five years, then 50 per cent of the entire loan (i.e. loan availed from GoI and FIs) would be converted into grant. The conversion of loan into grants would be allowed in equal tranches, every year during five years starting from first year in which the baseline data system under Part-A of project area concerned is established and verified by an agency appointed by the GOI.
12 Supervisory Control And Data Acquisition – It generally refers to industrial control systems:
computer systems that monitor and control industrial, infrastructure, or facility-based processes.

Chapter II, Performance audits relating to Government Companies
35
Financial Performance 2.1.21 The details of the funds released by GOI, mobilised from other agencies (including REC/ PFC/Commercial Banks), utilisation thereagainst and balances in respect of all the DISCOMs in the State are depicted below.
(` in crore) Year Funds received Fund available Funds utilised
APDRP 2006-07 0 0 0 2007-08 400.00 400.00 400.00 2008-09 193.73 193.73 193.73
R-APDRP (Part A & B) 2009-10 68 68 14.5 2010-11 130.94 184.44 23.31 Source: Information furnished by GUVNL
During 2006-08 GUVNL received ` 593.73 crore (grant ` 15.75 crore and incentive ` 577.98 crore) for all its subsidiaries. The DISCOMs came into existence from 1 April 2005; however, the activities relating to planning, mobilisation of funds and monitoring of implementation of APDRP was carried out by erstwhile GEB/the holding company viz., GUVNL on behalf of all its power subsidiary companies including DISCOMs, hence not covered in the performance audit.
As regards implementation of R-APDRP by DGVCL and PGVCL, the observations based on our analysis are discussed below:
Establishment of IT enabled system (Part A) 2.1.22 Part – A of the R-APDRP scheme is dedicated to establishment of IT enabled system and SCADA/ Distribution Management System. The work mainly consisted of consumer indexing, geographic information system (GIS) mapping, metering of distribution transformers, adoption of IT applications for meter reading, billing and collection, energy accounting, redressal of consumer grievances, etc. Under Part-A scheme, Power Finance Corporation (PFC), the nodal agency of GOI, was to sanction and release the funds to DISCOMs. The release of funds by PFC against sanctions was linked with actual utilisation of funds by DISCOMs against achievement of identified milestones. We observed that under part-A of the scheme, PFC sanctioned (June 2009) ` 23.38 crore and ` 75.26 crore to DGVCL and PGVCL during 2009-11 and released thereagainst ` 7.01 crore (30 per cent) and ` 41.67 crore (55 per cent) to DGVCL and PGVCL respectively.
The details of fund received and utilised during 2009-11 by DGVCL and PGVCL are summarized below:
(` in crore) Amount Received Fund available Funds utilized Unutilised Balance Percentage of
unutilised balance to funds available
Year
DGVCL PGVCL DGVCL PGVCL DGVCL PGVCL DGVCL PGVCL DGVCL PGVCL
2008-09 Funds not received
2009-10 7.01 22.57 7.01 22.57 1.72 4.03 5.29 18.54 75.46 82.14
2010-11 0 19.10 5.29 37.64 4.82 3.14 0.47 34.50 8.88 91.66
Source: Information furnished by DGVCL and PGVCL
DGVCL and PGVCL utilised 30 and 55 per cent respectively against the funds sanctioned for Part A under R-APDRP

Audit Report No. 4 (Commercial) for the year ended 31 March 2011
36
It can be noticed from the table that against an amount of ` 7.01 crore and ` 41.67 crore received during 2009-11, ` 6.54 crore (93 per cent) and ` 7.17 crore (17 per cent) only were utilized by DGVCL and PGVCL respectively. Further, in terms of the sanction, the entire works under Part-A should be completed by DGVCL and PGVCL by February 2012 and June 2012 respectively. As against this, we observed that out of 11 towns and 36 towns to be covered by DGVCL and PGVCL under Part-A, DGVCL could complete the works in three towns (27 per cent) only while PGVCL could not complete the works in any of the 36 towns (September 2011).
The slow progress of works by DGVCL and PGVCL resulted in non-release of funds by PFC causing consequential delays in implementation of the scheme.
DGVCL/PGVCL replied (August 2011) that initially there was a delay in appointment of the IT implementing agency (ITIA). Even after appointment, the agency took time for the development of the software. Further, there was slow progress in the area of completion of GIS and in the field activity of consumer indexing. However, now the ITIA has accelerated the activity by deploying enough manpower and is hopeful of completing the project by December 2011.
Reply is not convincing as the reasons for the delays put forth by the DISCOMs were controllable with effective monitoring and prompt corrective actions.
Strengthening of sub-transmission and distribution system (Part-B)
2.1.23 Under Part-B of R-APDRP scheme, the focus was on reduction of AT&C losses by DISCOMs on sustainable basis through strengthening of distribution systems by renovation and modernisation of transformer centers, re-conductoring of lines, load bifurcation, feeder separation, aerial bunched conductoring in dense areas etc. GOI was providing 25 per cent of the approved project cost as loan and DISCOMs were required to arrange for the finance to meet the remaining 75 per cent of the project cost from financial institutions (FIs).
In DGVCL, against the total project cost of ` 200.56 crore approved for eight towns to be covered under Part-B, PFC had sanctioned loan of ` 45.80 crore in March 2010 and ` 4.34 crore in December 2010, out of which only ` 30.08 crore (60 per cent) was released (September 2010/March 2011). In PGVCL, out of the total project cost of ` 562.31 crore approved for 36 towns to be covered, PFC sanctioned (March 2010) loan of ` 140.58 crore and released (September 2010/March 2011) ` 99.84 crore (71 per cent). We, however, observed that none of the two DISCOMs had initiated any action for executing the scheme works even after lapse of nine months (DGVCL) and 18 months (PGVCL) since sanction of loan (September 2011).
DGVCL/PGVCL replied that the initial works relating to inviting of tenders for award of different works have been started and they are expecting to complete all the works by March 2013 (DGVCL)/December 2012 (PGVCL).
DGVCL and PGVCL did not initiate execution of Part-B of R-APDRP even after nine and 18 months respectively since sanctioning of loans
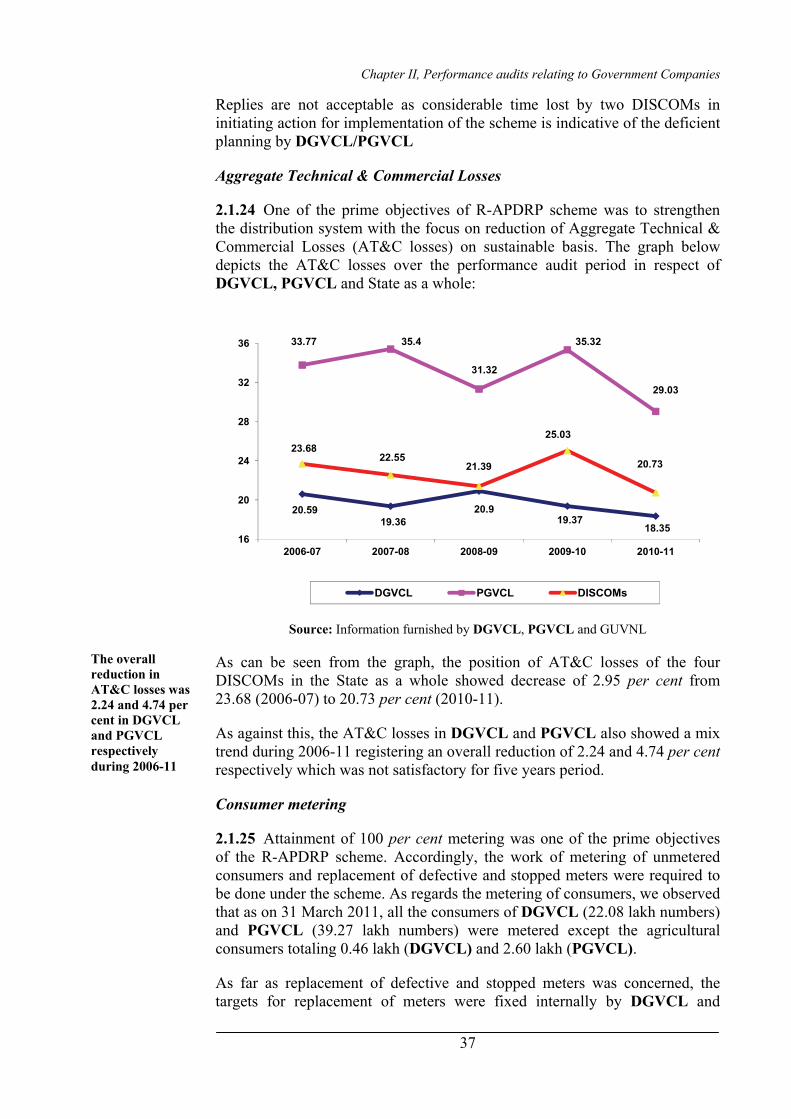
Chapter II, Performance audits relating to Government Companies
37
Replies are not acceptable as considerable time lost by two DISCOMs in initiating action for implementation of the scheme is indicative of the deficient planning by DGVCL/PGVCL
Aggregate Technical & Commercial Losses
2.1.24 One of the prime objectives of R-APDRP scheme was to strengthen the distribution system with the focus on reduction of Aggregate Technical & Commercial Losses (AT&C losses) on sustainable basis. The graph below depicts the AT&C losses over the performance audit period in respect of DGVCL, PGVCL and State as a whole:
20.5919.36
20.919.37
18.35
33.77 35.4
31.32
35.32
29.03
23.6822.55
21.39
25.03
20.73
16
20
24
28
32
36
2006-07 2007-08 2008-09 2009-10 2010-11
DGVCL PGVCL DISCOMs
Source: Information furnished by DGVCL, PGVCL and GUVNL
As can be seen from the graph, the position of AT&C losses of the four DISCOMs in the State as a whole showed decrease of 2.95 per cent from 23.68 (2006-07) to 20.73 per cent (2010-11).
As against this, the AT&C losses in DGVCL and PGVCL also showed a mix trend during 2006-11 registering an overall reduction of 2.24 and 4.74 per cent respectively which was not satisfactory for five years period.
Consumer metering
2.1.25 Attainment of 100 per cent metering was one of the prime objectives of the R-APDRP scheme. Accordingly, the work of metering of unmetered consumers and replacement of defective and stopped meters were required to be done under the scheme. As regards the metering of consumers, we observed that as on 31 March 2011, all the consumers of DGVCL (22.08 lakh numbers) and PGVCL (39.27 lakh numbers) were metered except the agricultural consumers totaling 0.46 lakh (DGVCL) and 2.60 lakh (PGVCL).
As far as replacement of defective and stopped meters was concerned, the targets for replacement of meters were fixed internally by DGVCL and
The overall reduction in AT&C losses was 2.24 and 4.74 per cent in DGVCL and PGVCL respectively during 2006-11

Audit Report No. 4 (Commercial) for the year ended 31 March 2011
38
PGVCL. The details of year wise target fixed and achievement made thereagainst is indicated below:
DGVCL PGVCL Year
Target for replacement of
defective/ stopped meters during the year
Actual meters
replaced during the
year
Percentage of
achievement against the
target
Target for replacement of defective/
stopped meters during
the year
Actual meters
replaced during
the year
Percentage of
achievement against the
target
2006-07 1,25,000 1,14,302 91.44 1,34,443 1,42,317 105.86
2007-08 1,25,000 3,01,095 240.88 1,54,892 1,34,899 87.09
2008-09 1,25,000 1,12,267 89.81 NA 1,93,562 NA
2009-10 1,25,000 75,937 60.75 2,34,550 1,64,915 70.31
2010-11 1,25,000 41,415 33.13 2,34,670 2,26,362 96.46
Source: Information furnished by DGVCL and PGVCL
It could be seen from the above table that the DGVCL could not achieve the target in any of the years except 2007-08, during which DGVCL had to urgently replace more number of defective/stopped meters due to damage of large number of meters by flood. In PGVCL, no target was fixed in 2008-09; however, in 2007-08, 2009-10 and 2010-11, the targets fixed were not achieved.
DGVCL replied (August 2011) that there was shortfall in achieving target during 2009-11 due to non availability of static meters in the market. Reply is not convincing as in case of difficulties in procuring the static meters, DGVCL had the option to procure and install the high precision electromechanical meters (quality meters) in place of damaged/defective meters, which are equally accurate in recording the power consumption. As per the study of the erstwhile GEB, it was conclusively recommended that quality meters were equally efficient and result in more inflow of revenue by increasing the consumption reading to the extent of more than 19.06 units per month.
Operational efficiency
2.1.26 The operational performance of the DISCOM is judged on the basis of availability of adequate power for distribution, adequacy and reliability of distribution network, minimizing line losses, detection of theft of electricity, etc. These aspects have been discussed later in the subsequent paragraphs.
Purchase of Power
2.1.27 In Gujarat, purchase of power on behalf of all the four DISCOMs is carried out by the holding Company i.e. GUVNL and the DISCOMS do not have any role in the purchase of power and hence the aspects relating to purchase of power have not been covered in the performance audit.

Chapter II, Performance audits relating to Government Companies
39
Sub-transmission & Distribution Losses
2.1.28 The distribution system is an important and essential link between the power generation source and the ultimate consumer of electricity. For efficient functioning of the system, it must be ensured that there are minimum losses in sub-transmission and distribution of power. While energy is carried from the generation source to the consumer, some energy is lost in the network. The losses at 33 KV stage are termed as sub-transmission losses while those at 11 KV and below are termed as distribution losses. The distribution networks consisting of 11 KVA and below are maintained by the DISCOMs and so the differences between the energy received (paid for) by the DISCOMs and energy billed to consumers are termed as distribution losses. The percentage of losses to available power indicates the effectiveness of the distribution system. The losses occur mainly on two counts, i.e. technical and commercial. Technical losses occur due to inherent character of the equipment used for transmitting and distributing power and resistance in conductors through which the energy is carried from one place to another. On the other hand, commercial losses occur due to theft of energy, defective meters and drawal of unmetered supply, etc.
Energy losses in DGVCL and PGVCL
2.1.29 The energy losses of DGVCL for last five years up to 2010-11 are given below:
(In Million Units) Sl.No. Particulars 2006-07 2007-08 2008-09 2009-10 2010-11
1. Energy purchased 9,525 9,918 10,331 11,266 11,7042. Transmission losses 473 483 590 701 482
3. Energy available for sale 9,052 9,435 9,741 10,565 11,2224. Energy sold 7,557 7,979 8,305 8,959 9,8375. Energy losses (3 – 4) 1,495 1,456 1,436 1,606 1,3856. Percentage of energy losses
(per cent) {(5 / 3) x 100} 16.52 15.43 14.74 15.20 12.34
7. Percentage of losses allowed by GERC (per cent)
16.59 15.45 14.45 13.45 12.45
8. Excess losses (in MUs) (-) 6.34 (-) 1.89 28.25 184.89 (-)12.349. Average realization rate per unit
(in ` ) 4.22 4.23 5.05 4.95 5.34
10. Value of excess losses (` in crore) (Sl. No.8 x Sl. No.9 /10)
(-) 2.68 (-) 0.80 14.27 91.52 (-)6.59
Source: Information furnished by DGVCL
It would be seen from the above table that energy losses ranged between 12.34 and 16.52 per cent during the last five years ending 31 March 2011. The losses in DGVCL were within the norms in 2006-08 and 2010-11, while the loss was in excess of norms by 0.29 per cent in 2008-09 and by 1.75 per cent in 2009-10, causing revenue loss of ` 14.27 crore and ` 91.52 crore in two years respectively.
Distribution loss in excess of norms led to revenue loss of ` 105.79 crore during 2008-10 in DGVCL

Audit Report No. 4 (Commercial) for the year ended 31 March 2011
40
2.1.30 Further, our observations on a review of feeder wise analysis of three13 out of 17 divisions of DGVCL for the period 2007-11 are summarised below:
Particulars 2007-08 2008-09 2009-10 2010-11 Units sent out (In MUs) 108.52 114.05 131.13 136.31 Units sold out (In MUs) 64.65 68.27 79.29 84.34 Distribution Loss (In percent) 40.43 40.14 39.53 38.13 Total number of feeders (In number) 232 235 238 247 Feeders having losses more than GERC norms (In number)
161 153 163 160
Feeders having losses more than 30 percent (In number)
125 118 131 121
It could be seen from the table that in the above three Divisions, during 2007-11, of the total number of 232 to 247 feeders, 153 to 163 feeders were having distribution losses in excess of GERC norms and 118 to 125 feeders were having losses even more than 30 per cent. Further, out of 247 feeders as at the end of 2010-11, 131 feeders (53 per cent) were persistently having losses in excess of GERC norms, whereas, in 48 feeders (19 per cent) losses were showing increasing trend during 2007-11.
2.1.31 The energy losses of PGVCL for last five years up to 2010-11 are given below:
(In Million Units) S.No. Particulars 2006-07 2007-08 2008-09 2009-10 2010-11 1. Energy purchased 16,985 18,413 19,189 21,167 20,8832. Transmission losses 839 973 1,186 1,309 8603. Energy available for sale 16,146 17,440 18,003 19,858 20,0234. Energy sold 10,814 11,837 12,449 13,513 14,6995. Energy losses (3 – 4) 5,332 5,603 5,554 6,345 5,3246. Percentage of energy losses
(per cent) {(5 / 3) x 100} 33.02 32.12 30.85 31.95 26.59
7. Percentage of losses allowed by GERC (per cent)
34.22 32.00 30.00 28.00 26
8. Excess losses (in MUs) (-) 193.75 20.93 153.02 784.39 118.149. Average realisation rate per
unit (in ` ) 3.55 3.59 4.30 4.13 4.55
10. Value of excess losses (` in crore) (Sl. No.8 x Sl.No.9 /10)
(-) 68.78 7.51 65.80 323.95 53.75
Source: Information furnished by PGVCL
It would be seen from the above table that energy losses ranged between 26.59 and 33.02 per cent during the period 2006-11. Reduction in these losses is the most significant step towards making the Company financially self-sustaining. It could be seen from the above table that the PGVCL suffered loss of ` 451.01 crore during the period 2007-11 due to excess energy losses over the limit prescribed by GERC.
The importance of reducing losses can be gauged from the fact that a one per cent decrease in losses could add ` 59.93 crore14 and ` 91.10 crore15 to the annual profits of DGVCL and PGVCL respectively. 13 Vyara O&M , Vapi O&M and Ankleshwar O&M Division 14 Energy available for sale 11,222 MUs x one per cent x Average realisation rate ` 5.34 =
` 59.93 crore (DGVCL). 15 Energy available for sale 20,023 MUs x one per cent X Average Realisation Rate ` 4.55 per unit =
` 91.10 crore. (PGVCL).
Distribution loss in excess of norms led to revenue loss of ` 451.01 crore during 2007-11 in PGVCL

Chapter II, Performance audits relating to Government Companies
41
Reasons for high energy losses
The main reasons for such high energy losses were decrease in maintenance activity of distribution network, excess failure of distribution transformers (DTRs), delay in repairing the DTRs, theft of electricity, non replacement of conventional meters with static/quality meters, high percentage of LT/HT ratio, etc., as discussed below:
Decrease in maintenance activity
2.1.32 For proper maintenance of distribution network in DGVCL, the yearly targets were fixed mainly for carrying out the maintenance of HT lines (11 KV), LT lines and DTRs (11/22 KVs). We observed that against the target fixed for the maintenance of HT lines, the achievement was ranging between 58 and 69 per cent during 2008-11. Whereas, in case of LT lines and DTRs the achievement decreased from 67 to 27 per cent (2006-11) and 57 to 30 per cent (2007-11) respectively.
In PGVCL, we observed that against the target fixed for the maintenance of HT lines, the achievement was ranging between 42 and 69 per cent during 2006-11, whereas, in case of LT lines and DTRs the achievement decreased from 45 to 40 per cent and 53 to 37 per cent (2006-11) respectively. However, both DISCOMs did not take any corrective action for achieving the targets.
We observed that the available manpower were mostly engaged in attending to the increasing work load on account of release of new connections; complaints from consumers etc., the target for maintenance activity could not be achieved.
Performance of Distribution Transformers 2.1.33 The GERC had fixed the norms regarding failure of DTRs in its tariff orders. The details of norms fixed, actual DTRs failed and the expenditure incurred on their repairs related to DGVCL is depicted in the table below: Sl. No
Particulars 2006-07 2007-08 2008-09 2009-10 2010-11
1 Existing DTRs at the close of the year(in Number)
35,924 39,654 43,254 48,456 53,493
2 DTR Failures (in Number) 5,992 6,269 6,099 6,251 6,9963 Percentage of failures 16.68 15.81 14.1 12.9 13.084 Norm allowed by GERC (in
percentage) -- 10 10 10 10
5 Excess failure percentage over norms
-- 5.81 4.1 2.9 3.08
6 Expenditure on repair of failed DTRs (` in crore)
4.61 4.78 5.62 4.74 4.91
7 Average expenditure incurred on repair of one transformer (in `)
7,693.59 7,624.82 9,214.63 7,582.79 7,018.30
8 Extra16 expenditure incurred in excess of GERC norms (` in crore)
---- 1.76 1.63 1.07 1.16
Source: Information furnished by DGVCL
16 Total transformer X excess failure percentage over norms X average repairing cost of one
transformer.
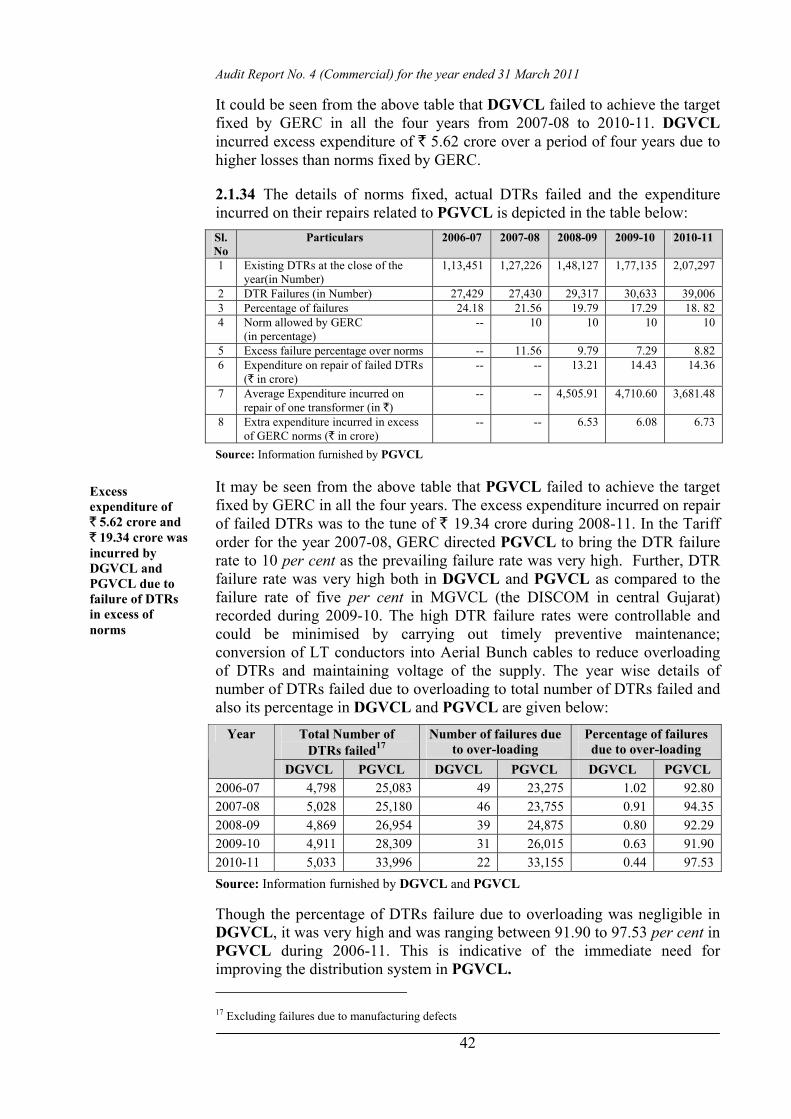
Audit Report No. 4 (Commercial) for the year ended 31 March 2011
42
It could be seen from the above table that DGVCL failed to achieve the target fixed by GERC in all the four years from 2007-08 to 2010-11. DGVCL incurred excess expenditure of ` 5.62 crore over a period of four years due to higher losses than norms fixed by GERC.
2.1.34 The details of norms fixed, actual DTRs failed and the expenditure incurred on their repairs related to PGVCL is depicted in the table below:
Source: Information furnished by PGVCL
It may be seen from the above table that PGVCL failed to achieve the target fixed by GERC in all the four years. The excess expenditure incurred on repair of failed DTRs was to the tune of ` 19.34 crore during 2008-11. In the Tariff order for the year 2007-08, GERC directed PGVCL to bring the DTR failure rate to 10 per cent as the prevailing failure rate was very high. Further, DTR failure rate was very high both in DGVCL and PGVCL as compared to the failure rate of five per cent in MGVCL (the DISCOM in central Gujarat) recorded during 2009-10. The high DTR failure rates were controllable and could be minimised by carrying out timely preventive maintenance; conversion of LT conductors into Aerial Bunch cables to reduce overloading of DTRs and maintaining voltage of the supply. The year wise details of number of DTRs failed due to overloading to total number of DTRs failed and also its percentage in DGVCL and PGVCL are given below:
Total Number of DTRs failed17
Number of failures due to over-loading
Percentage of failures due to over-loading
Year
DGVCL PGVCL DGVCL PGVCL DGVCL PGVCL 2006-07 4,798 25,083 49 23,275 1.02 92.80 2007-08 5,028 25,180 46 23,755 0.91 94.35 2008-09 4,869 26,954 39 24,875 0.80 92.29 2009-10 4,911 28,309 31 26,015 0.63 91.90 2010-11 5,033 33,996 22 33,155 0.44 97.53 Source: Information furnished by DGVCL and PGVCL
Though the percentage of DTRs failure due to overloading was negligible in DGVCL, it was very high and was ranging between 91.90 to 97.53 per cent in PGVCL during 2006-11. This is indicative of the immediate need for improving the distribution system in PGVCL. 17 Excluding failures due to manufacturing defects
Sl. No
Particulars 2006-07 2007-08 2008-09 2009-10 2010-11
1 Existing DTRs at the close of the year(in Number)
1,13,451 1,27,226 1,48,127 1,77,135 2,07,297
2 DTR Failures (in Number) 27,429 27,430 29,317 30,633 39,006 3 Percentage of failures 24.18 21.56 19.79 17.29 18. 82 4 Norm allowed by GERC
(in percentage) -- 10 10 10 10
5 Excess failure percentage over norms -- 11.56 9.79 7.29 8.82 6 Expenditure on repair of failed DTRs
(` in crore) -- -- 13.21 14.43 14.36
7 Average Expenditure incurred on repair of one transformer (in `)
-- -- 4,505.91 4,710.60 3,681.48
8 Extra expenditure incurred in excess of GERC norms (` in crore)
-- -- 6.53 6.08 6.73
Excess expenditure of ` 5.62 crore and ` 19.34 crore was incurred by DGVCL and PGVCL due to failure of DTRs in excess of norms

Chapter II, Performance audits relating to Government Companies
43
PGVCL stated (August 2011) that it had taken strenuous corrective measures viz., feeder bifurcation work, review of the working of distribution transformer centre, replacement of deteriorated conductors, conversion of LT to HT lines, installation checking, etc. for minimising the transformer failure due to overloading. However, the fact remains that despite the corrective measures stated to have been taken by PGVCL, the percentage of DTR failure due to overloading to the total failures continued to be abnormally high in all five years and also showed an increasing trend in the years 2007-08 and 2010-11.
Delay in repair of Distribution Transformers
2.1.35 As per the general terms and conditions of purchase order, the suppliers were required to guarantee the performance of DTRs for five years from the date of supply/installation. If the DTRs failed after the expiry of the guarantee period, the same could be got repaired through outside agencies since both DGVCL and PGVCL were not having any in-house facility to repair the DTRs. For DTRs that failed within the guarantee period, the supplier should repair and return the DTRs within 30 days from the date of receipt of damaged DTRs by him, whereas if the DTR failed after the expiry of the guarantee period, it should be repaired and returned by the repairing agency within 45 days from the date of approval of estimate18 or the receipt of transformer oil.
In DGVCL, it was observed that during the performance audit period, 7,380 DTRs failed within the guarantee period. Delays ranging from six months to two years were noticed in returning the repaired transformers by the suppliers/repairing agency. On a review of three divisions19, it was noticed that in 76 cases, the suppliers had not yet returned (June 2011) the DTRs (valuing ` 28.25 lakh) which were given for repair during the period between October 2000 and September 2010. In PGVCL, it was observed that during the performance audit period, 1,695 DTRs (valuing ` 9.36 crore) failed within the guarantee period and were awaiting for repair/replacement for more than one month to six months at the end of 2010-11. Both DGVCL and PGVCL, however, failed to encash the performance guarantee (PG) furnished by the suppliers by invoking tender condition clause 49 against them. Since the DTRs had strategic value in the distribution network, the Management should have ensured an effective mechanism in place for ensuring the timely repair and return of the damaged DTRs by the suppliers and repairing agencies.
PGVCL stated (August 2011) that during monsoon most of the transformer suppliers could not repair and return the failed transformers within stipulated time of 30 days as per tender clause 49. However, it was withholding the payments against the bills of the defaulting suppliers. The reply is not tenable. The very purpose of inserting the clause for encashing of PG in the contract
18 The failed transformer would be inspected by the repairing agency in the presence of DISCOM
officials and the agency would prepare an estimate for items to be repaired as per approved item rate before approval of estimate.
19 Vyara, Vapi (O&M) Division and Vapi Industrial Division.
Repair of 7,380 DTRs in DGVCL and 1,695 DTRs in PGVCL failed within the guarantee period was abnormally delayed

Audit Report No. 4 (Commercial) for the year ended 31 March 2011
44
would be defeated if the same was not invoked at the appropriate time against the defaulting suppliers.
Poor performance of repaired DTRs
2.1.36 As per the terms of the agreement of repair, while attending repairs of the transformer the repairing agency should ensure that guaranteed technical parameters and performance thereagainst were maintained even after repairing of transformers. The fact that in DGVCL, 5,746 numbers of repaired DTRs failed within the guarantee period (maximum 18 months) showed the poor workmanship of the repairing agencies.
Slow replacement of conventional meters with static/quality meters
2.1.37 In the detailed project report of APDRP Scheme, the DISCOMs estimated that replacement of old conventional meters with static/quality meters would increase energy reading by 19.06 units per month per meter replaced. Further, Central Electricity Authority (CEA) instructed (March 2006) that all interface meters, consumers and energy accounting and audit meters should be of static type. However, it was observed that both DGVCL and PGVCL were not able to replace all the conventional meters even by the end of March 2011.
In DGVCL, out of 14,47,971 consumer connections (March 2004) having old conventional meters, 2,22,644 meters (15.38 per cent) were not yet replaced by quality/static meters (March 2011). DGVCL purchased (2006) 4.75 lakh electro-mechanical high precision (quality) meters within a span of eight months. Considering the availability of bulk quantity of quality meters in the market, DGVCL could have purchased and replaced minimum of 4,75,000 meters per annum from the year 2004-05 onwards and thereby it could have completely replaced the entire lot of old conventional meters by the end of March 2007. However, due to slow progress in replacement of conventional meters, DGVCL suffered a loss of revenue20 of ` 144.40 crore on the estimated under recording of consumption of energy of 301.84 MUs (2007-11) (Annexure-8) in conventional meters. In PGVCL, it was observed that from 2006-07 to 2010-11, out of 14,23,297 meters, only 8,58,829 conventional meters were replaced. As at March 2011, 5,64,468 conventional meters (39.66 per cent) were still to be replaced by static/quality meters. Thus, slow replacement of conventional meters with static/quality meters led to revenue loss of 782.64 MUs worth ` 317.39 crore (2007-11) (Annexure-8).
DGVCL and PGVCL stated (August 2011) that as the static meters were of new concept during that period, problems were faced with the quality of meters being offered by the suppliers. However, in order to meet the demand, the conventional meters were also purchased along with the static meters. Accordingly, replacement of conventional meters with static meters was being carried out gradually.
20 Year wise loss units X realisation rate of the relevant year.
Slow replacement of conventional meters led to estimated revenue loss of ` 144.40 crore to DGVCL and ` 317.39 crore to PGVCL
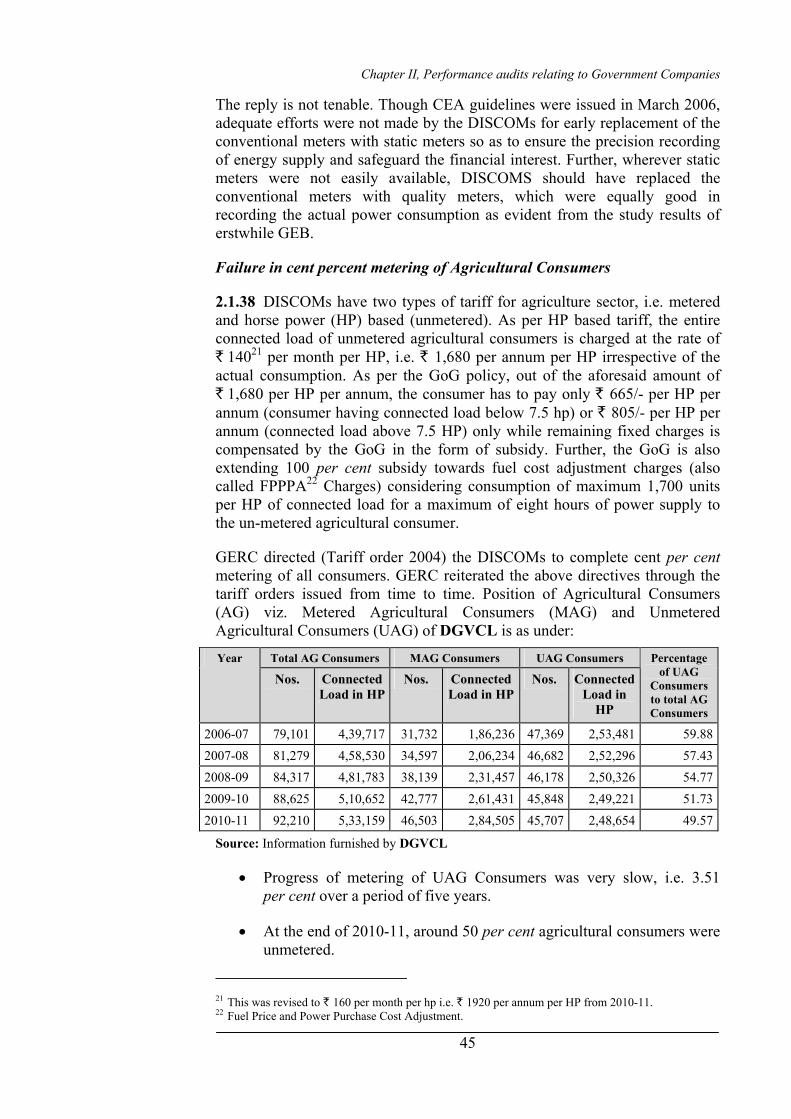
Chapter II, Performance audits relating to Government Companies
45
The reply is not tenable. Though CEA guidelines were issued in March 2006, adequate efforts were not made by the DISCOMs for early replacement of the conventional meters with static meters so as to ensure the precision recording of energy supply and safeguard the financial interest. Further, wherever static meters were not easily available, DISCOMS should have replaced the conventional meters with quality meters, which were equally good in recording the actual power consumption as evident from the study results of erstwhile GEB.
Failure in cent percent metering of Agricultural Consumers
2.1.38 DISCOMs have two types of tariff for agriculture sector, i.e. metered and horse power (HP) based (unmetered). As per HP based tariff, the entire connected load of unmetered agricultural consumers is charged at the rate of ` 14021 per month per HP, i.e. ` 1,680 per annum per HP irrespective of the actual consumption. As per the GoG policy, out of the aforesaid amount of ` 1,680 per HP per annum, the consumer has to pay only ` 665/- per HP per annum (consumer having connected load below 7.5 hp) or ` 805/- per HP per annum (connected load above 7.5 HP) only while remaining fixed charges is compensated by the GoG in the form of subsidy. Further, the GoG is also extending 100 per cent subsidy towards fuel cost adjustment charges (also called FPPPA22 Charges) considering consumption of maximum 1,700 units per HP of connected load for a maximum of eight hours of power supply to the un-metered agricultural consumer.
GERC directed (Tariff order 2004) the DISCOMs to complete cent per cent metering of all consumers. GERC reiterated the above directives through the tariff orders issued from time to time. Position of Agricultural Consumers (AG) viz. Metered Agricultural Consumers (MAG) and Unmetered Agricultural Consumers (UAG) of DGVCL is as under:
Total AG Consumers MAG Consumers UAG Consumers Year
Nos. Connected Load in HP
Nos. Connected Load in HP
Nos. Connected Load in
HP
Percentage of UAG
Consumers to total AG Consumers
2006-07 79,101 4,39,717 31,732 1,86,236 47,369 2,53,481 59.882007-08 81,279 4,58,530 34,597 2,06,234 46,682 2,52,296 57.432008-09 84,317 4,81,783 38,139 2,31,457 46,178 2,50,326 54.772009-10 88,625 5,10,652 42,777 2,61,431 45,848 2,49,221 51.732010-11 92,210 5,33,159 46,503 2,84,505 45,707 2,48,654 49.57
Source: Information furnished by DGVCL
• Progress of metering of UAG Consumers was very slow, i.e. 3.51 per cent over a period of five years.
• At the end of 2010-11, around 50 per cent agricultural consumers were unmetered.
21 This was revised to ` 160 per month per hp i.e. ` 1920 per annum per HP from 2010-11. 22 Fuel Price and Power Purchase Cost Adjustment.
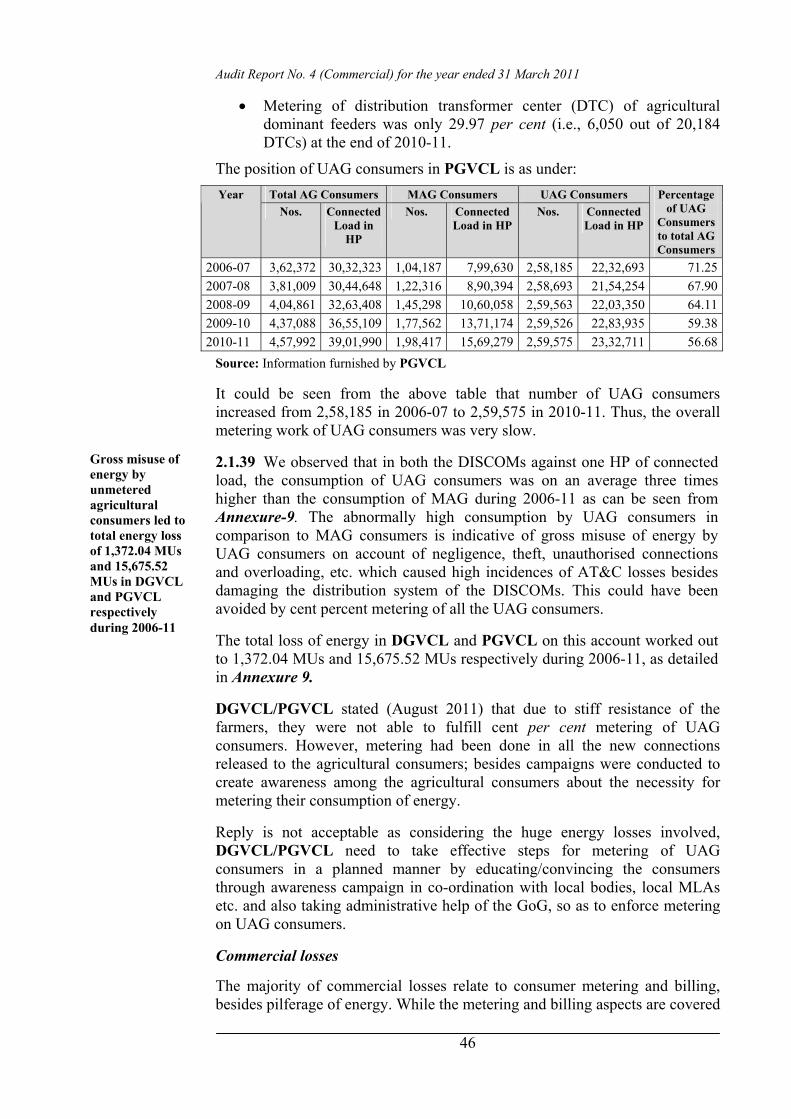
Audit Report No. 4 (Commercial) for the year ended 31 March 2011
46
• Metering of distribution transformer center (DTC) of agricultural dominant feeders was only 29.97 per cent (i.e., 6,050 out of 20,184 DTCs) at the end of 2010-11.
The position of UAG consumers in PGVCL is as under: Total AG Consumers MAG Consumers UAG Consumers Year
Nos. Connected Load in
HP
Nos. Connected Load in HP
Nos. Connected Load in HP
Percentage of UAG
Consumers to total AG Consumers
2006-07 3,62,372 30,32,323 1,04,187 7,99,630 2,58,185 22,32,693 71.252007-08 3,81,009 30,44,648 1,22,316 8,90,394 2,58,693 21,54,254 67.902008-09 4,04,861 32,63,408 1,45,298 10,60,058 2,59,563 22,03,350 64.112009-10 4,37,088 36,55,109 1,77,562 13,71,174 2,59,526 22,83,935 59.382010-11 4,57,992 39,01,990 1,98,417 15,69,279 2,59,575 23,32,711 56.68
Source: Information furnished by PGVCL
It could be seen from the above table that number of UAG consumers increased from 2,58,185 in 2006-07 to 2,59,575 in 2010-11. Thus, the overall metering work of UAG consumers was very slow.
2.1.39 We observed that in both the DISCOMs against one HP of connected load, the consumption of UAG consumers was on an average three times higher than the consumption of MAG during 2006-11 as can be seen from Annexure-9. The abnormally high consumption by UAG consumers in comparison to MAG consumers is indicative of gross misuse of energy by UAG consumers on account of negligence, theft, unauthorised connections and overloading, etc. which caused high incidences of AT&C losses besides damaging the distribution system of the DISCOMs. This could have been avoided by cent percent metering of all the UAG consumers.
The total loss of energy in DGVCL and PGVCL on this account worked out to 1,372.04 MUs and 15,675.52 MUs respectively during 2006-11, as detailed in Annexure 9.
DGVCL/PGVCL stated (August 2011) that due to stiff resistance of the farmers, they were not able to fulfill cent per cent metering of UAG consumers. However, metering had been done in all the new connections released to the agricultural consumers; besides campaigns were conducted to create awareness among the agricultural consumers about the necessity for metering their consumption of energy.
Reply is not acceptable as considering the huge energy losses involved, DGVCL/PGVCL need to take effective steps for metering of UAG consumers in a planned manner by educating/convincing the consumers through awareness campaign in co-ordination with local bodies, local MLAs etc. and also taking administrative help of the GoG, so as to enforce metering on UAG consumers.
Commercial losses
The majority of commercial losses relate to consumer metering and billing, besides pilferage of energy. While the metering and billing aspects are covered
Gross misuse of energy by unmetered agricultural consumers led to total energy loss of 1,372.04 MUs and 15,675.52 MUs in DGVCL and PGVCL respectively during 2006-11

Chapter II, Performance audits relating to Government Companies
47
under implementation of R-APDRP scheme in previous paragraphs and billing efficiency under subsequent paragraphs respectively, the other observations relating to commercial losses are discussed below.
Implementation of LT less system
2.1.40 High voltage distribution system is an effective method for reduction of technical losses, prevention of theft, improved voltage profile and better consumer service. The GOI had also stressed (February 2001) upon the need of adopting LT less system of distribution through replacement of existing LT lines by HT lines so as to reduce the distribution losses. The HT-LT ratio in DGVCL and PGVCL over the review period is depicted in the graph below:
0.71 0.70 0.700.72 0.73
0.820.78 0.79 0.78
0.81
0.860.84 0.84 0.84
0.85
0.6
0.7
0.8
0.9
2006-07 2007-08 2008-09 2009-10 2010-11
DGVCL PGVCL DISCOMs
Source: Information furnished by all DISCOMs.
It may be seen from the above graph read with Annexure 7 that in DGVCL the HT/LT ratio improved from 0.71 (2006-07) to 0.73 (2010-11) while it deteriorated in PGVCL from 0.82 to 0.81 respectively.
We observed that in DGVCL the total LT lines converted into HT lines during 2006-11 were 18.14 CKM which worked out to a meager 0.06 per cent of the HT lines as on 31 March 2011. In PGVCL the conversion was only in AG dominant feeders (2,153.84 CKM) under high voltage distribution scheme (HVDS) during 2008-11. Both the DISCOMs did not have any plan showing milestones for converting the LT lines into HT lines.
Conversion of LT Conductors into Aerial Bunch Cables
2.1.41 Aerial Bunch cables prevent illegal tapping of low voltage distribution lines and help in reducing overloading of DTRs and maintain voltage of the supply. The progress in conversion of LT conductors into aerial bunch cables in both DISCOMs were very slow as could be seen from the table given below:
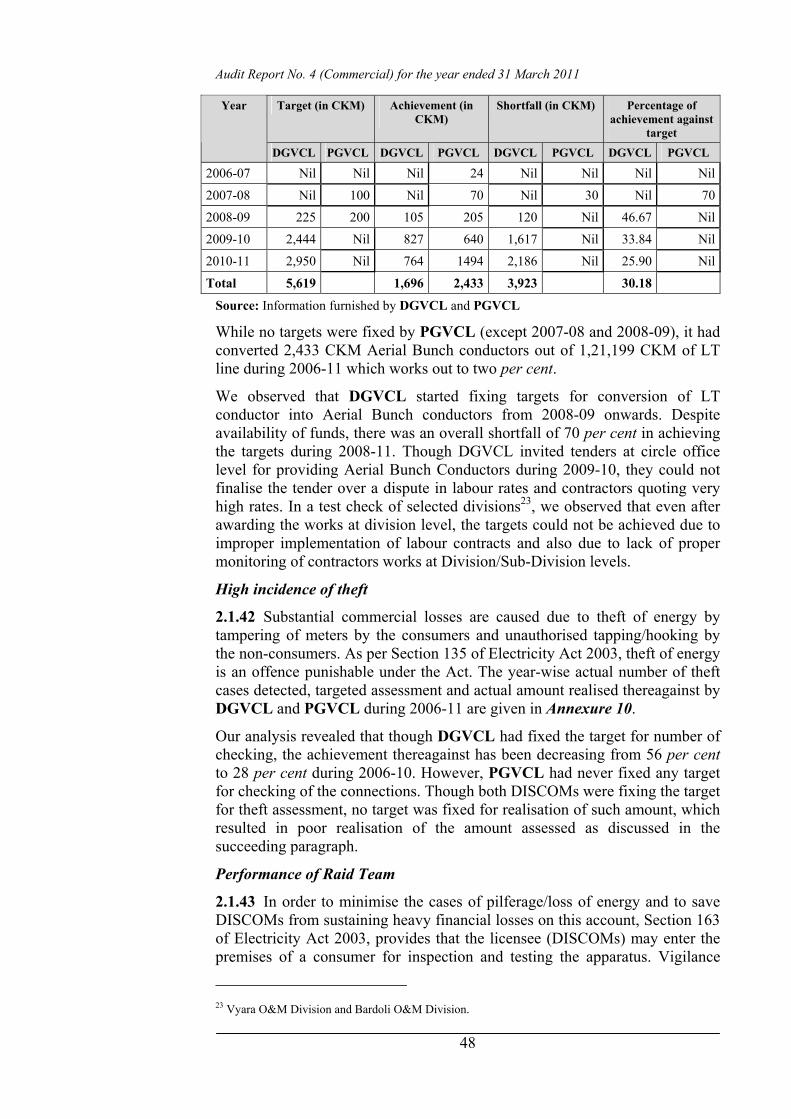
Audit Report No. 4 (Commercial) for the year ended 31 March 2011
48
Target (in CKM) Achievement (in CKM)
Shortfall (in CKM) Percentage of achievement against
target
Year
DGVCL PGVCL DGVCL PGVCL DGVCL PGVCL DGVCL PGVCL
2006-07 Nil Nil Nil 24 Nil Nil Nil Nil
2007-08 Nil 100 Nil 70 Nil 30 Nil 70
2008-09 225 200 105 205 120 Nil 46.67 Nil
2009-10 2,444 Nil 827 640 1,617 Nil 33.84 Nil
2010-11 2,950 Nil 764 1494 2,186 Nil 25.90 Nil
Total 5,619 1,696 2,433 3,923 30.18
Source: Information furnished by DGVCL and PGVCL
While no targets were fixed by PGVCL (except 2007-08 and 2008-09), it had converted 2,433 CKM Aerial Bunch conductors out of 1,21,199 CKM of LT line during 2006-11 which works out to two per cent.
We observed that DGVCL started fixing targets for conversion of LT conductor into Aerial Bunch conductors from 2008-09 onwards. Despite availability of funds, there was an overall shortfall of 70 per cent in achieving the targets during 2008-11. Though DGVCL invited tenders at circle office level for providing Aerial Bunch Conductors during 2009-10, they could not finalise the tender over a dispute in labour rates and contractors quoting very high rates. In a test check of selected divisions23, we observed that even after awarding the works at division level, the targets could not be achieved due to improper implementation of labour contracts and also due to lack of proper monitoring of contractors works at Division/Sub-Division levels.
High incidence of theft
2.1.42 Substantial commercial losses are caused due to theft of energy by tampering of meters by the consumers and unauthorised tapping/hooking by the non-consumers. As per Section 135 of Electricity Act 2003, theft of energy is an offence punishable under the Act. The year-wise actual number of theft cases detected, targeted assessment and actual amount realised thereagainst by DGVCL and PGVCL during 2006-11 are given in Annexure 10.
Our analysis revealed that though DGVCL had fixed the target for number of checking, the achievement thereagainst has been decreasing from 56 per cent to 28 per cent during 2006-10. However, PGVCL had never fixed any target for checking of the connections. Though both DISCOMs were fixing the target for theft assessment, no target was fixed for realisation of such amount, which resulted in poor realisation of the amount assessed as discussed in the succeeding paragraph.
Performance of Raid Team
2.1.43 In order to minimise the cases of pilferage/loss of energy and to save DISCOMs from sustaining heavy financial losses on this account, Section 163 of Electricity Act 2003, provides that the licensee (DISCOMs) may enter the premises of a consumer for inspection and testing the apparatus. Vigilance
23 Vyara O&M Division and Bardoli O&M Division.
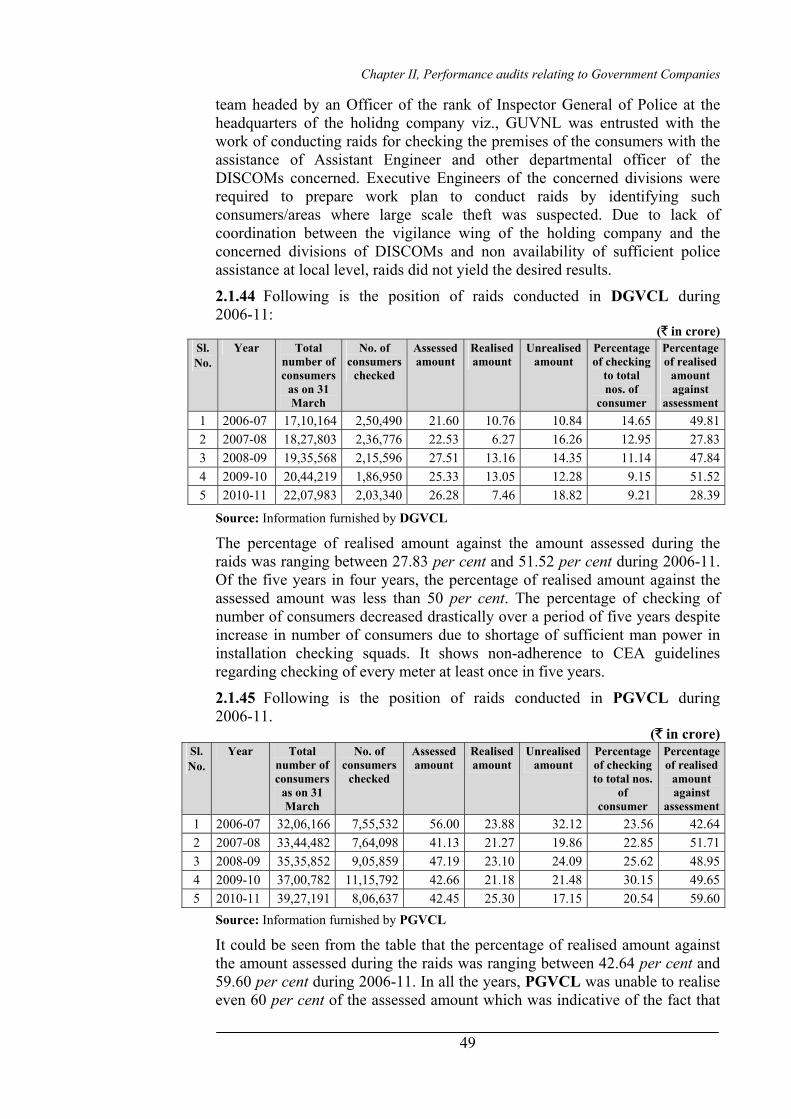
Chapter II, Performance audits relating to Government Companies
49
team headed by an Officer of the rank of Inspector General of Police at the headquarters of the holidng company viz., GUVNL was entrusted with the work of conducting raids for checking the premises of the consumers with the assistance of Assistant Engineer and other departmental officer of the DISCOMs concerned. Executive Engineers of the concerned divisions were required to prepare work plan to conduct raids by identifying such consumers/areas where large scale theft was suspected. Due to lack of coordination between the vigilance wing of the holding company and the concerned divisions of DISCOMs and non availability of sufficient police assistance at local level, raids did not yield the desired results.
2.1.44 Following is the position of raids conducted in DGVCL during 2006-11:
(` in crore) Sl. No.
Year Total number of consumers
as on 31 March
No. of consumers
checked
Assessed amount
Realised amount
Unrealised amount
Percentage of checking
to total nos. of
consumer
Percentage of realised
amount against
assessment 1 2006-07 17,10,164 2,50,490 21.60 10.76 10.84 14.65 49.812 2007-08 18,27,803 2,36,776 22.53 6.27 16.26 12.95 27.833 2008-09 19,35,568 2,15,596 27.51 13.16 14.35 11.14 47.844 2009-10 20,44,219 1,86,950 25.33 13.05 12.28 9.15 51.525 2010-11 22,07,983 2,03,340 26.28 7.46 18.82 9.21 28.39
Source: Information furnished by DGVCL The percentage of realised amount against the amount assessed during the raids was ranging between 27.83 per cent and 51.52 per cent during 2006-11. Of the five years in four years, the percentage of realised amount against the assessed amount was less than 50 per cent. The percentage of checking of number of consumers decreased drastically over a period of five years despite increase in number of consumers due to shortage of sufficient man power in installation checking squads. It shows non-adherence to CEA guidelines regarding checking of every meter at least once in five years.
2.1.45 Following is the position of raids conducted in PGVCL during 2006-11.
(` in crore) Sl. No.
Year Total number of consumers
as on 31 March
No. of consumers
checked
Assessed amount
Realised amount
Unrealised amount
Percentage of checking to total nos.
of consumer
Percentage of realised
amount against
assessment1 2006-07 32,06,166 7,55,532 56.00 23.88 32.12 23.56 42.642 2007-08 33,44,482 7,64,098 41.13 21.27 19.86 22.85 51.713 2008-09 35,35,852 9,05,859 47.19 23.10 24.09 25.62 48.954 2009-10 37,00,782 11,15,792 42.66 21.18 21.48 30.15 49.655 2010-11 39,27,191 8,06,637 42.45 25.30 17.15 20.54 59.60
Source: Information furnished by PGVCL It could be seen from the table that the percentage of realised amount against the amount assessed during the raids was ranging between 42.64 per cent and 59.60 per cent during 2006-11. In all the years, PGVCL was unable to realise even 60 per cent of the assessed amount which was indicative of the fact that

Audit Report No. 4 (Commercial) for the year ended 31 March 2011
50
though raids were conducted, their effectiveness could not be ensured in terms of realisation. Considering the huge amount remaining unrealised by DGVCL/PGVCL during five years from 2006-11, both DISCOMs need to enhance the effectiveness of the mechanism for early realisation of the assessed amount.
Billing Efficiency
2.1.46 As per the practice followed, DISCOMs take the reading of energy consumption of each consumer at the end of the notified billing cycle. Sale of energy to metered categories consists of two parts viz., metered and assessed units. The assessed units refer to the units billed to consumers in case meter reading is not available due to meter defects, door lock etc. After obtaining the meter readings, DISCOMs issue bill to the consumers for consumption of energy. High Tension consumers (having contract demand of 100 KVA and above) and Low Tension Industrial consumers are billed on monthly basis, while other consumers are billed on bi-monthly basis. As per the schedule of billing, monthly bills are to be issued within 30 days from previous bill and bi-monthly bills are to be issued within 60 days from previous billing with a variation of maximum two days. The efficiency in billing of energy lies in distribution/sale of maximum energy by the DISCOMs to its consumers and realise the revenue therefrom in time.
We observed that DGVCL and PGVCL are issuing bills relating to defective meters and door lock cases based on the average consumption of energy for last three months. However, the details of assessed units in such cases were not maintained by both the DISCOMs. In respect of un-metered agriculture consumers also, bills are issued based on assessment which is discussed in subsequent paragraph.
Non adherence to GERC directive
2.1.47 The GoG had appointed a committee viz. Mishra committee to study the actual power consumption in agricultural sector based on meters already installed on agricultural distribution transformer centres (DTCs). The committee, based on the study of the consumption pattern of AG consumers available on the installed transformers concluded (March 1999) that estimated agricultural consumption should be considered at 1,700 units24 per year per HP of connected load. The same criteria was approved by GERC (1999) and adopted by the DISCOMs to assess consumption of UAG consumers. As DISCOMS have since stopped releasing new connections without meters and feeders of agricultural loads have also been separated, the GERC directed (2006) DISCOMs to evolve a suitable methodology for assessing realistic consumption by UAG consumers under the changed circumstances. However, DISCOMs had not devised any methodology for assessment of consumption by UAG consumers to the satisfaction of GERC so far (September 2011). Further, the DISCOMs also did not comply with the GERC (in ARR petition-2008-09) directive for expediting metering of DTCs so as to have realistic data
24 One horse power x 0.746 Kw x 8 hours x 285 days excluding 80 monsoon days = 1,700.88 kwh.
Methodology was not devised for realistic estimation of agricultural consumption as per GERC directive
Chapter II, Performance audits relating to Government Companies
51
on actual consumption of energy at each DTC, which could help in assessing unmetered consumption. No justification was on record for the non compliance to the GERC directives.
Under recovery of Additional Security Deposit
2.1.48 GERC notified (31 March 2005) that LT consumers with bi-monthly billing cycle should at all times maintain with the licensee (i.e. DISCOMs) an amount equivalent to three months of their consumption charges as security deposit against any default in payment towards the electricity supplied/to be supplied to them during the period, till the agreement for supply of energy is in force. In case of LT consumers with monthly billing cycle, however, the security deposit should be equal to one and half month’s consumption. Further the DISCOMs need to review the adequacy of amount of security deposit (SD) once in a year based on the consumers’ average consumption during the previous 12 months. The DISCOMs were liable to pay interest on SD of consumers at the Bank Rate (as on 1 April of every year) notified by Reserve Bank of India (RBI) or such higher rate as may be fixed by the GERC from time to time.
2.1.49 A reference is invited to the paragraph 4.14 of Audit Report (Commercial) 2008-09, Government of Gujarat, wherein short recovery of SD from LT consumers and consequential loss of interest of ` 21.67 crore up to the year 2008-09 in ten divisions of DGVCL was pointed out.
Further, test check of the records for the year 2009-10 relating to a review of adequacy of SD of LT consumers revealed that even after highlighting this lapse in our previous report, DGVCL was not able to collect SD as per the directive of GERC. During the year 2009-10, against 14,96,855 out of the 20,44,219 consumers, an amount of ` 297.46 crore was short collected towards SD for the year which led to further loss of interest (net) of ` 12.64 crore (calculated at 4.25 per cent25) for the year.
2.1.50 In PGVCL, the system of assessment and recovery of SD was not at all followed as per the directive of GERC. Only in September 2010, PGVCL initiated action by directing the sub-divisions to assess and collect the shortfall in SD till November 2010. We noticed that in PGVCL, an amount of ` 223.10 crore was short collected from consumers towards SD for the year 2009-10 which led to loss of interest (net) of ` 9.48 crore (calculated at 4.25 per cent) (March 2011). The above included 49 sub-divisions falling under 10 divisions26 which did not collect any SD from 3,98,869 consumers.
PGVCL stated (August 2011) that though it had initiated action for collecting SD, the same could not be collected due to resistance of consumers. The fact, however, remains that PGVCL initiated action only after lapse of five years since issue of GERC notification and the action taken was also not effective.
25 Interest on working capital @ 10.25 per cent as approved by GERC less interest payable on SD at the
rate of 6.00 per cent 26 Una, Kodinar, Anjar, Savarkundla, Rajkot City-I, Rajkot City-II, Porbandar, Veraval, Jamnagar and
Bhavnagar (Rural).
SD was short collected by ` 297.46 crore in DGVCL and ` 223.10 crore in PGVCL

Audit Report No. 4 (Commercial) for the year ended 31 March 2011
52
Revenue collection efficiency
2.1.51 As revenue from sale of energy is the main source of income of DISCOM, prompt collection of revenue assumes great significance. The salient features of the collection mechanism being followed by the DISCOM are as follows:
• Consumers may make payments of the bills by cash, cheques or by demand draft.
• Revenue billed in respect of HT services is collected at collection counters located at every circle office.
• In respect of LT services, electricity bills are generally collected by the revenue cashiers (RC) except in some areas where collection work is entrusted to certain private collection agencies.
• Both HT and LT consumers are required to pay electricity charges within 10 days from the date of the bills, failing which the consumers are liable for payment of delayed payment charges at the rate of 1.5 per cent per month on the amount of the bill for the period of the delay.
2.1.52 The table below indicates the balance outstanding in DGVCL at the beginning of the year, revenue assessed during the year, revenue collected and the balance outstanding at the end of the year during last five years ending 2010-11.
DGVCL (` in crore)
Sl. No.
Particulars 2006-07 2007-08 2008-09 2009-10 2010-11
1 Balance outstanding at the beginning of the year
467.26 439.78 393.74 358.19 361.08
2 Revenue assessed/Billed during the year
3,576.08 3,759.39 4,466.64 5,030.54 5,445.49
3 Total amount due for realisation (1+2)
4,043.34 4,199.17 4,860.38 5,388.73 5,806.57
4 Amount realised during the year 3,603.40 3,805.43 4,502.19 5,026.45 5,443.515 Amount written off during the
year 0.16 0 0 1.2 0.36
6 Balance outstanding at the end of the year (3 – (4+5)
439.78 393.74 358.19 361.08 362.70
7 Percentage of amount realised to total dues ((4/3)x100)
89.12 90.62 92.63 93.28 93.75
8 Arrears in terms of No. of months assessment (6/(2/12 months)
1.48 1.26 0.96 0.86 0.80
Source: Information furnished by DGVCL
2.1.53 Similar details of the balance outstanding in PGVCL at the beginning of the year, revenue assessed during the year, revenue collected and the balance outstanding at the end of the year during last five years ending 2010-11 are given in the table below.

Chapter II, Performance audits relating to Government Companies
53
PGVCL (` in crore)
Sl. No.
Particulars 2006-07 2007-08 2008-09 2009-10 2010-11
1 Balance outstanding at the beginning of the year
779.89 719.53 635.78 609.80 590.71
2 Revenue assessed/Billed during the year
3,602.46 4,015.78 4,897.60 5,381.66 5,902.75
3 Total amount due for realisation (1+2)
4,382.35 4,735.31 5,533.38 5,991.46 6,493.46
4 Amount realised during the year
3,662.82 4,099.53 4,923.58 5,400.75 5,980.43
5 Amount written off during the year
- - - - -
6 Balance outstanding at the end of the year (3 – (4+5)
719.53 635.78 609.80 590.71 513.03
7 Percentage of amount realised to total dues (4/3)
83.58 86.57 88.98 90.14 92.10
8 Arrears in terms of No. of months assessment (6/(2/12 months)
2.40 1.90 1.49 1.32 1.04
Source: Information furnished by PGVCL
We observed from the above details that in both DISCOMs, during 2006-11 the balance dues outstanding at the end of the year 2010-11 have reduced significantly as compared to the outstanding dues at the close of 2006-07. The arrears at the end of each year in two DISCOMs in terms of number of months assessment also showed decreasing trend, which is indicative of improvement in the revenue collection. However the dues outstanding from Permanently Disconnected consumers (PDC) included under total outstanding for each year had increased during 2006-11 from ` 352.09 crore (2006-07) to ` 364.51 crore (2010-11) and ` 477.30 crore (2006-07) to ` 493.74 crore (2010-11) in DGVCL and PGVCL respectively, which showed inefficiency of two DISCOMs in collection of dues against PDC.
Non disconnection of power supply of defaulted consumers
2.1.54 As per provisions of Payment of Bill of the Electricity Supply and related matters regulations (Notification No.11 of 2005) issued by GERC distribution, licensee has to allow a period of 10 days for payment of Electricity Bills from the date of billing. If the consumers fail to pay within that period, a notice has to be issued on the 11th day to pay the bill along with delayed payment charges (DPC) within the next 15 days. Otherwise, electricity supply would be disconnected temporarily on the 26th day from the date of billing. Further, reconnection of the supply would be made only after receipt of bill amount along with the DPC and reconnection charges.
Review of records in DGVCL for the period 2006-2011 revealed that:
• DGVCL issued notice for disconnection only to 51.92 lakh (i.e. an average 58 per cent) out of 89.34 lakh of consumers who were defaulters in making the payments and were liable for disconnection.
Outstanding dues from PDC had increased in DGVCL and PGVCL indicating the inefficiency in collection of dues of two DISCOMs
Audit Report No. 4 (Commercial) for the year ended 31 March 2011
54
• Of 51.92 lakh, actual disconnections were made only in case of 31.69 lakh consumers. Thus, percentage of disconnection made to the total defaulters worked out to 35.47. Non disconnection of supply to 57.65 lakh defaulting consumers had not only resulted in slow recovery of dues but also in loss of revenue by way of reconnection charges of ` 80.25 crore27 from them.
In PGVCL, out the 152.84 lakh defaulting consumers, the actual disconnection of supply was made in case of 43.76 lakh consumers only. Non disconnection of supply to 109.08 lakh defaulting consumers had not only resulted in slow recovery of dues leading to accumulation of loss but also in loss of revenue by way of reconnection charges of ` 128.90 crore28 from them.
DGVCL and PGVCL stated (August 2011) that the number of defaulting consumers who were not disconnected as commented in audit was not correct since it did not reckon the defaulting consumers to whom installments were allowed, who have gone on appeal, whose dues were less than one rupee, etc. Further, considering the priority of other works and availability of manpower, suitable actions were taken from time to time for disconnection of supply of defaulting consumers.
The reply is not tenable. We had taken the details of defaulting consumers from the revenue management information system (MIS) of DISCOMs. Further, the reply does not provide the details of the numbers of consumers liable for disconnection after reckoning such cases which according to them were not liable for disconnection. To safeguard the financial interest, the DISCOMs should also give due priority for timely action for disconnection of defaulting consumers.
Delay in permanent disconnection of defaulted consumers
2.1.55 As per provisions of GERC Notification, in case electricity dues are not deposited by the consumers within the due date indicated in the Bill, the supply shall be disconnected temporarily as discussed above. Even after disconnection of power supply if the consumers failed to pay the bill, the supply would be disconnected permanently. Thus, outstanding dues from any PDC should not be of more than two bills (Original first bill + bill for next 25 days consumption). Our analysis of the position of arrears from PDC consumers in DGVCL as on 31 March 2011, revealed that out of total arrears of ` 181.61 crore from 2.97 lakh PDC consumers, an amount of ` 148.58 crore related to cases where more than two months bills29 were outstanding. In PGVCL, out of total arrears of ` 121.49 crore, an amount of ` 83.62 crore related to cases where more than two months bills were outstanding.
27 57,65,148 consumers x average reconnection charges at ` 139.19. 28 1,09,08,841consumers x average reconnection charges at ` 118.16. 29 As the amount of outstanding against first two bills was not made available to audit the arrears against
latest two bills have been excluded to arrive at the outstanding beyond two billing cycles.
Delay in permanent disconnection of defaulting consumers led to blocking up of funds of ` 148.58 crore in DGVCL and ` 83.62 crore in PGVCL

Chapter II, Performance audits relating to Government Companies
55
It shows the inefficiency of DISCOMs in prompt disconnection of supply of defaulted consumers as well as allowing further consumption of electricity in subsequent period despite non payment of bills. Thus, the defaulted consumer eventually turned into PDC consumers and realisation of outstanding dues would take very long period as settlement of such cases by Civil Suit/Lok Adalat would take more time. Had DISCOMs disconnected the supply of the above PDC consumers in time, blocking up of ` 148.58 crore in DGVCL and ` 83.62 crore in PGVCL could have avoided.
DGVCL replied that the number of defaulted consumers not disconnected beyond two billing cycles did not reckon the PDC cases where arrears were agreed to be recovered in installments or where PDCs preferred appeal etc.
Reply is not acceptable as the data of PDC cases pending for disconnection for periods beyond two billing cycles has been adopted only from the Management Information System (MIS) of DGVCL. Further, in response to our request for providing data in support of the reply, DGVCL had shown its inability for the same in absence of required software/system with them.
Non-disconnection of supply of consumers with heavy arrears
It was observed in case of PGVCL that consumers having huge arrears, did not make payment of electricity dues in time, but their supply was not disconnected as per provisions of GERC Notification of 2005. The cases of huge arrears are given below:
Heavy outstanding receivables from Nagarpalikas
2.1.56 In PGVCL a review of the electricity charges recoverable from the various consumers for the period 2006-07 to 2010-11 revealed that an amount of ` 153.07 crore from Nagarpalikas was outstanding as on 31 March 2011. Of this, an amount of ` 147.94 crore remained outstanding for a period of five years. This indicates that PGVCL did not make adequate efforts for timely recovery of the dues.
PGVCL stated (August 2011) that they were constantly pursuing the matter of recovery of dues with Nagarpalikas. Stringent action could not be possible for disconnecting the supply as it would create public unrest. However, at the top level, the matter was taken up with the District Collector, Municipal Finance Board and GoG for expediting the payment of dues by the Nagarpalikas. The fact, however, remains that huge amount is pending affecting the financial interest of PGVCL.
Undue favour extended to Extra High Tension consumer
In the following instances, undue favour was shown to the defaulting HT industrial consumers by the divisions of PGVCL:
Audit Report No. 4 (Commercial) for the year ended 31 March 2011
56
2.1.57 PGVCL had allowed an extra HT (EHT) Consumer30 in Anjar division having contracted load of 22,500 KVA to pay energy bills in installments from August 2008. As the consumer was irregular in payment of dues, the supply was temporarily disconnected in March 2009. PGVCL, however, restored the supply to the consumer in July 2009 and allowed him to pay the dues in eight installments and collected post dated cheques instead of permanently disconnecting the supply. The supply was continued till November 2009; thereafter the supply was permanently disconnected in June 2010. None of the cheques given by the consumer was honoured. The dues from the consumer mounted from ` 1.56 crore (October 2008) to ` 6.17 crore (November 2009) due to supply of power during that period. The total dues inclusive of minimum charges till the date of permanent disconnection was ` 8.48 crore; however, PGVCL initiated legal action against the consumer only in March 2010. Thus, allowing the consumer to pay the dues in installments contrary to the provisions of GERC notification and also continuing the power supply by PGVCL despite mounting defaults resulted in accumulation of arrears to ` 8.48 crore.
2.1.58 In case of another EHT consumer31, PGVCL disconnected the supply in May 2008 since the consumer defaulted in payment of bill of ` 3.11 crore and issued PDC notice as per prescribed rules. On the request (September 2008) of the consumer, PGVCL restored supply in October 2008 and also allowed the consumer to make payment of 25 per cent of the arrears as down payment and the balance in eight installments. Though PGVCL was aware that the consumer had already applied (August 2008) to BIFR for registering his Unit as a Sick unit, it had restored (October 2008) the supply ignoring DISCOM’s own financial interests. Based on the consumer reference, BIFR also directed (December 2008) PGVCL to continue the supply of power. Only in June 2010, BIFR dismissed the consumer’s reference for registering it as a sick unit on the ground that the consumer manipulated his accounts for availing the benefit of sick unit. Since the supply to the consumer was continued during this period, the arrears from the consumer also mounted to ` 9.30 crore till the supply was permanently disconnected in July 2010. The action of the PGVCL in restoring the supply to the defaulting consumer by allowing instalments to pay arrears in violation of GERC guidelines and thereto even after being aware of the consumer’s reference to BIFR led to accumulation of arrears of ` 9.30 crore.
PGVCL stated (August 2011) that since the EHT and HT consumers were significantly contributing to the revenue of PGVCL, in the instant cases the request of the consumers were considered and installments were allowed without disconnection of power supply. However, the fact remains that instalments were allowed to the defaulting consumers in violation of GERC guidelines, which ultimately proved to be detrimental to the financial interests of PGVCL.
30 Extra HT consumer is one who draws power directly from 66 KV line and above. M/s Banian and
Berry Alloys Private Limited. 31 M/s.New Tech Forge & Foundry Limited, Rajkot.
Undue favour extended to two defaulting consumers in repayment of dues led to accumulation of arrears to ` 17.78 crore

Chapter II, Performance audits relating to Government Companies
57
Delay in issuance of estimate/release of connection order
2.1.59 GERC has laid down various standards for DISCOMS to provide better and timely services to consumers vide Notification No. 10 of 2005 – “Standard of performance of Distribution Licensees”. Clause 9.3 of Chapter IX of the Notification stipulates that “Bulk Power connections are to be released in a time bound manner.”
As per the time limit prescribed therein, maximum 60 days32 in case of HT connections up to 2,500 KVA and 210 days33 in case of HT connections above 2,500 KVA is permissible for issuance of connection release order on completion of all the administrative and technical formalities.
However, detailed scrutiny of records of three Industrial Divisions (Vapi, Surat and Ankleshwar) of DGVCL relating to new HT connections released between April 2006 and March 2011 revealed that there was delay in (i) issuance of demand notice (estimate) and (ii) issuance of connection release order. The table below shows the delay in release of new HT connections.
Days Taken Division Prescribed time limit
(Days)
Total Connection
Released
Total connections
released with delay
Minimum Maximum
Ankleshwar Industrial (up to 2,500 KVA)
60 98 56 73 422
Ankleshwar Industrial (above 2,500 KVA)
210 4 3 251 614
Vapi Industrial (up to 2,500 KVA)
60 168 77 61 247
Surat Industrial (Up to 2500 KVA)
60 199 164 61 462
Such delay in release of connection order not only indicates violation of GERC notification but also deprived the consumers of the desired level of services as per standards, besides causing potential revenue loss to DGVCL. Had the above connection release orders been issued in time, DGVCL could have earned at least the minimum demand charges of ` 3.17 crore to the extent of delay occurred.
DGVCL stated (August 2011) that various works prior to release of connection viz., verifying the ownership /other documents of the new consumer, survey by field office to assess for the point of supply, obtaining approval from GETCO, etc. had taken considerable time in releasing the connection. In respect of three cases of consumers with contract demand of above 2,500 KVA, the delays were mainly attributable to Transmission Company (GETCO) in granting the approval for technical feasibility in releasing the connection.
32 15 days from the date of application for issuance of estimate and 45 days from the date of receipt of
estimate amount for issuance of connection release order. 33 30 days from the date of application for issuance of estimate and 180 days from the date of receipt of
estimate amount for issuance of connection release order.
Delay in release of new connection led to revenue loss of ` 3.17 crore

Audit Report No. 4 (Commercial) for the year ended 31 March 2011
58
The reply is not tenable. GERC fixed the time limit after reckoning the reasonable requirement of time for completing the above works including obtaining the approval from GETCO prior to release of connection.
Delay in execution of decree 2.1.60 In case of legal suit filed against the defaulting consumers for recovery of dues, the DISCOM after the receipt of court decree in favour of it, should file Darkhast in the court for executing the decree. It was observed that in DGVCL, neither the Darkhast was filed after the receipt of decree nor execution of the decree was carried out due to laxity on the part of DGVCL. Circle wise detail of status of execution of court decrees are tabulated below:
Total Pending decrees Decrees received in favor of the Company but
Darkhast yet to be filed
Sl. No.
Year Name of circle
Numbers ` in lakh Numbers ` in lakh
1 Surat 117 85.05 94 59.012 Bharuch 495 132.56 340 91.333
2006-07
Valsad 613 712.50 427 159.33 Total 1,225 930.11 861 309.67
1 Surat 188 402.81 98 260.702 Bharuch 1,113 723.83 270 98.093
2010-11
Valsad 477 686.89 93 14.36 Total 1,778 1,813.53 461 373.15
Source: Information furnished by DGVCL
It could be seen from the above table that 1,778 decrees worth ` 18.14 crore received in favour of DGVCL is pending (March 2011) of which 461 decrees worth ` 3.73 crore were pending due to non filing of Darkhast (petition) by the Company for decree execution. No justification was on record for the said delay.
DGVCL stated (August 2011) that receiving the decree in favour of DGVCL and filing of Darkhast and execution of the decree was a continuous process and it had been continuously making efforts for timely execution of decrees. However, some pending decrees were very old and the whereabouts of the consumers and other relevant details could not be traced out. In some cases, the financing company of the consumers had first right over the properties of the consumers.
Thus, the fact remains that due to lack of adequate efforts in filing Darkhast in time by DGVCL, execution of decree and recoveries thereagainst had correspondingly delayed.
Financial Management
2.1.61 Efficient fund management serves as a tool for decision making, for optimum utilisation of available resources and borrowings at favourable terms at appropriate time. The financial management of DISCOMs includes revenue collection, billing, borrowings, grants, transfer of funds, interest recovery/payments, security deposits, bank reconciliations and other related

Chapter II, Performance audits relating to Government Companies
59
transactions. While the revenue and billing have been dealt with in the preceding paragraphs, the other areas are discussed below.
The Fund Management of the all the DISCOMs are carried out by GUVNL, which includes raising of loans and their repayment along with interest. The DISCOMs broadly maintain two type of accounts viz., Non-operative collection account and Operative accounts both at HO and at field office level. The revenue realised against sale of energy is being deposited by sub-division, division and circle offices in the Non-operative account. The HO of DISCOM meets their fund requirements for payments to suppliers/employees payment etc., by adjusting against the fund collected under Non-operative account and remits the balance fund to GUVNL on a day to day basis. Under the operative account, funds are being made available to sub-division, division, and circle offices by HO to enable them to meet their expenditure. In addition, GUVNL makes arrangement with banks for providing cash credit (CC) facility to HO of each DISCOM for meeting their additional fund requirements. The funds available under Non-operative account would also be used to repay the dues under CC account before remitting to GUVNL. However, matters relating to the borrowings for long term requirements and working capital arrangements with banks are being taken care of by GUVNL. Hence, as far as fund management is concerned, DISCOMs have no active role. However, few instances of avoidable losses in DGVCL and PGVCL were noticed and have been discussed as under:
Unwarranted borrowings from Bank
2.1.62 In an isolated instance, instead of availing loans through GUVNL, DGVCL directly availed (September 2009) a long term loan of ` 80 crore from Bank of Baroda for implementing system improvement scheme. As per terms of agreement, the loan was repayable within 42 months including the moratorium period of six months in monthly installments at an interest rate of 9.50 per cent. DGVCL received ` 80.00 crore in five installments during September 2009 to June 2010. However, in February 2011 DGVCL repaid the loan amount inclusive of interest amounting to ` 88.25 crore on the plea that the bank did not reduce interest rate to the then prevailing rate of 8.5 per cent. Thus, the Company had incurred an interest of ` 8.25 crore for the period of 17 months.
We observed that even after adjusting all the fund requirements including power purchase cost, huge amounts of surplus funds of DGVCL were available with GUVNL. In March 2009, when the Management of DGVCL decided to avail the loan, it was aware that it had a surplus fund of ` 333.25 crore with GUVNL. Further, as per the arrangement made, GUVNL was to raise the funds for the DISCOMs. In view of the above, borrowing by DGVCL from the bank was unwarranted and had led to avoidable expenditure of ` 8.25 crore.
DGVCL stated (August 2011) that as the net cash and cash equivalent was reduced during 2009-10 and also for incurring the capital expenditure under system improvement scheme, the fund was required to be raised on long term basis. Hence the above loan was borrowed. Further, the extra expenditure of
Unwarranted borrowings led to avoidable payment of interest of ` 8.25 crore in DGVCL
Audit Report No. 4 (Commercial) for the year ended 31 March 2011
60
` 8.25 crore pointed out by Audit was erroneous as the whole amount of interest paid was taken instead of the differential rate between the actual interest rate on the loan and the average cash credit rate that prevailed.
The reply is not tenable as there was only marginal reduction of ` 5.41 crore in cash and cash equivalent of DGVCL during 2009-10, which did not justify huge borrowings of ` 80 crore. Besides, DGVCL had surplus of ` 333.25 crore (September 2009) with the holding company (GUVNL), which did not warrant fresh borrowings by DGVCL.
Non-availment of rebate on Procurement of power
2.1.63 DGVCL entered into (April 2006) Bulk Supply Agreement (BSA) with the holding company viz., GUVNL for the supply of electricity in bulk which was approved by the GERC. As per article 7.5 of the BSA, if DGVCL makes payment of dues for the purchase of power to GUVNL within seven days of raising the provisional invoice, then DGVCL would be eligible for a rebate at the rate of 1.5 per cent on such payment.
A review of monthly invoices of GUVNL and payments made by DGVCL for the period 2006-10 revealed that during the said period, DGVCL purchased 52,644 MUs of energy valued at ` 19,108.26 crore. As per practice, DGVCL was transferring all its collected revenue after deduction of the expenses, other than the expenditure for purchase of power on daily basis to GUVNL and the surplus fund of DGVCL with GUVNL remained between ` 105.05 crore to ` 324.19 crore at the end of each year during 2006-11. This is indicative of the fact that all the invoices of the GUVNL were paid by DGVCL within a period of seven days. Hence it was entitled to get the rebate of 1.5 per cent i.e. ` 286.62 crore on the payments made for purchase of power. However, DGVCL did not avail the benefit of rebate.
DGVCL replied (August 2011) that GUVNL availed rebate for prompt payment made by them from their suppliers and the purchase cost was arrived after reckoning the rebate availed. Accordingly, the rebate was passed on to the DISCOMs in the form of lesser purchase cost.
The reply is not tenable. GUVNL, based on the PPA made with the suppliers, was availing the rebate. Whereas for the invoice raised against the DISCOMS for the power sold, GUVNL through BSA, agreed to pass on the rebate to the DISOCMs on the sale price against prompt payment of the DISCOMs. However, in the case of DGVCL, GUVNL did not pass on the benefit of rebate even though they had made the payment within the time stipulated as per the agreement defeating the very purpose of the incentive for prompt payment prescribed in the agreement.
Supply of energy beyond stipulation of eight hours to agriculture consumers
2.1.64 As per GoG policy, DISCOMs supply power for eight hours to agriculture consumers. In cases of drought spells or specific need for water for longer hours for agriculture in order to save the crops, the power shall be supplied as per specific directives of GoG from time to time. Accordingly,
DGVCL suffered a loss of ` 286.62 crore due to non availment of rebate for prompt payment as per agreement

Chapter II, Performance audits relating to Government Companies
61
during July to September 2009, DGVCL supplied power to agriculture sector for more than eight hours. The power supplied to the unmetered agricultural consumers was on an average 9.13 hours. During the period, per HP of connected load energy availability for the unmetered AG consumers was 2,152 units as against the earmarked 1,700 units (for eight hours supply). Neither GUVNL nor DGVCL ever demanded/received any subsidy from the GoG for the supply of energy made to agricultural consumers for above eight hours at a lower rate. Thus, supply of energy for more than eight hours by DGVCL without any commitment/assurance from GoG/GUVNL for release of additional subsidy for power supplied beyond eight hours resulted in loss of ` 38.94 crore (108.18 MUs34) at an average purchase cost of ` 3.6035 per unit.
DGVCL stated (August 2011) that the power was supplied more than eight hours due to drought condition, to save the paddy crop as a social obligation as per instructions of GoG.
The fact, however, remains that the Company should have claimed reimbursement of losses suffered by it on this account from the GoG/GUVNL as the power for additional hours was supplied at the instance of the GoG/GUVNL.
Non installation of DTC meters
2.1.65 The Chairman, GUVNL directed (February 2008) PGVCL to complete the metering of all the distribution transformer centres (DTC) by December 2008. However, it was observed that PGVCL procured 72,203 numbers of 100/5 ampere CT operated static meters and 34,849 numbers of 200/5 Ampere CT operated static meters during July 2008 to January 2009 and installed 24,572 numbers and 19,891 numbers respectively till 31 March 2011. Thus, 47,631 numbers (66 per cent) and 14, 958 numbers (43 per cent) of the above meters respectively valued at ` 15.17 crore were not installed (March 2011) due to lack of effort on the plea of lack of manpower, which led to locking up of funds to that extent and consequential loss of interest of ` 3.37 crore at 10.25 per cent36 for 26 months (February 2009 to March 2011).
Subsidy Support and Cross Subsidisation
2.1.66 There is an urgent need for ensuring recovery of cost of service from consumers to make the power sector sustainable. The GoG is providing subsidy with a view to ensure supply of power to specific category of consumers at concessional rates of tariff.
Subsidy Support
As per the mechanism in place, GUVNL is directly dealing with the GoG for Government subsidy and is maintaining a subsidy account showing the
34 Consumption during the year 2009-10 (526.81 MUs) less consumption during the year 2008-09
(418.63 MUs) for connected load of 2,44,810 HP. 35 Cost of power purchase ` 4,048.68 crore / Total units purchased 11,266 million units 36 Based on interest on working capital approved by GERC for 2010-11.
DGVCL did not claim subsidy of ` 38.94 crore for supply of energy beyond eight hours to agricultural consumers

Audit Report No. 4 (Commercial) for the year ended 31 March 2011
62
opening balance, subsidy due and received for the year and the closing balances at the end of the year, i.e. receivable from the government for the DISCOMs as a whole. Based on the agricultural consumers in each DISCOM, the share of subsidy of each DISCOMs are worked out and booked in respective DISCOMs accounts. Details in this regard for all the DISCOMs are given below:
(` in crore) Particulars 2006-07 2007-08 2008-09 2009-10 2010-11
Opening balance 11.97 72.16 252.27 596.20 727.73
Add: Due from GoG during the year
1,830.19 1,934.35 3,214.97 2,831.04 2,862.90
Less: Received during the year
1,770.00 1,754.24 2,871.04 2,699.51 2,662.00
Closing balance 72.16 252.27 596.20 727.73 928.63
As can be seen from the table, in none of the years the subsidy due to the four DISCOMs were received from the Government in the year itself which led to accumulation of ` 928.63 crore towards subsidy receivable from the Government as at the end of March 2011.
2.1.67 Year wise details of amount of subsidy and the amount of sale of energy excluding the amount of subsidy for the selected DISCOMs are given below:
(` in crore) DGVCL PGVCL Year
Sales Subsidy Percentage Sales Subsidy Percentage
2006-07 3,138.46 49.28 1.57 3,361.17 474.22 14.10
2007-08 3,324.59 49.38 1.48 3,782.25 466.24 12.32
2007-09 4,148.22 49.70 1.19 4,951.65 403.00 8.13
2009-10 4,384.36 48.98 1.11 5,192.75 394.32 7.59
2010-11 5,210.31 46.66 0.89 6,285.66 397.50 6.32
Source: Information furnished by GUVNL and annual accounts of DGVCL and PGVCL
The graph below indicates revenue subsidy support from GoG (against concessional tariff) as a percentage of sales37 by DGVCL and PGVCL for the last five years ending 31 March 2011.
37 The figures of total revenue from sale of energy here is excluding revenue subsidy from
GoG for concessional tariff.
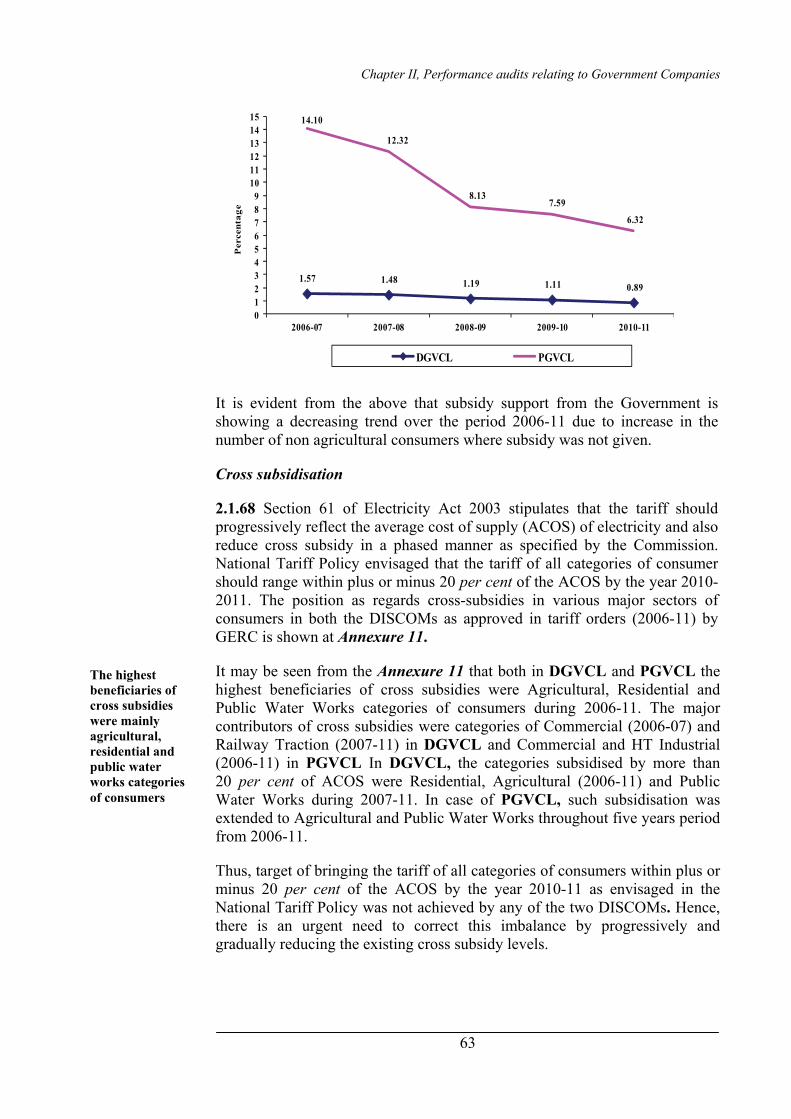
Chapter II, Performance audits relating to Government Companies
63
1.57 1.48 1.19 1.11 0.89
14.10
12.32
8.137.59
6.32
0123456789
101112131415
2006-07 2007-08 2008-09 2009-10 2010-11
DGVCL PGVCL
Per
cent
age
It is evident from the above that subsidy support from the Government is showing a decreasing trend over the period 2006-11 due to increase in the number of non agricultural consumers where subsidy was not given.
Cross subsidisation
2.1.68 Section 61 of Electricity Act 2003 stipulates that the tariff should progressively reflect the average cost of supply (ACOS) of electricity and also reduce cross subsidy in a phased manner as specified by the Commission. National Tariff Policy envisaged that the tariff of all categories of consumer should range within plus or minus 20 per cent of the ACOS by the year 2010- 2011. The position as regards cross-subsidies in various major sectors of consumers in both the DISCOMs as approved in tariff orders (2006-11) by GERC is shown at Annexure 11.
It may be seen from the Annexure 11 that both in DGVCL and PGVCL the highest beneficiaries of cross subsidies were Agricultural, Residential and Public Water Works categories of consumers during 2006-11. The major contributors of cross subsidies were categories of Commercial (2006-07) and Railway Traction (2007-11) in DGVCL and Commercial and HT Industrial (2006-11) in PGVCL In DGVCL, the categories subsidised by more than 20 per cent of ACOS were Residential, Agricultural (2006-11) and Public Water Works during 2007-11. In case of PGVCL, such subsidisation was extended to Agricultural and Public Water Works throughout five years period from 2006-11.
Thus, target of bringing the tariff of all categories of consumers within plus or minus 20 per cent of the ACOS by the year 2010-11 as envisaged in the National Tariff Policy was not achieved by any of the two DISCOMs. Hence, there is an urgent need to correct this imbalance by progressively and gradually reducing the existing cross subsidy levels.
The highest beneficiaries of cross subsidies were mainly agricultural, residential and public water works categories of consumers

Audit Report No. 4 (Commercial) for the year ended 31 March 2011
64
Tariff Fixation
2.1.69 The financial viability of DISCOMs depends upon generation of surplus (including fair returns) from the operations to finance their operating needs and future capital expansion programmes by adopting prudent financial practices. Revenue collection is the main source of generation of funds for DISCOMs. While other aspects relating to revenue collection have been discussed in preceding paragraphs, the issues relating to tariff are discussed hereunder.
The tariff structure of the DISCOMs are subject to revision approved by the respective State Electricity Regulatory Commission (SERC) after the objections, if any, received against Aggregate Revenue Requirement (ARR) petition filed by them within the stipulated date. The Company was required to file the ARR for each year 120 days before the commencement of the respective year. The SERC accepts the application filed by the Company with such modifications/conditions as may be deemed just and appropriate and after considering all suggestions and objections from public and other stakeholders. The due date for filing ARR, actual date of filing, date of approval of tariff petition and the effective date of the revised tariff in respect of all the DISCOMs are the same, the details of which are given below:
Year Due date of filing
Actual date of filing
Delay in days
Date of approval
Effective date
2006-07 30.11.2005 06.01.2006 37 06.05.2006 01.04.2006 2007-08 30.11.2006 28.12.2006 28 31.03.2007 01.04.2007 2008-09 31.01.2008 31.07.2008 181 17.01.2009 01.02.2009 2009-10 30.11.2008 26.08.2009 269 14.12.2009 14.12.2009 2010-11 30.11.2009 23.12.2009 23 31.03.2010 01.04.2010
Source: Information furnished by all DISCOMs
It could be seen from the above table that the DISCOMs failed to file the ARR petition before the due date in all the years under review. For the year 2008-09, being the first year for filing the ARR under Multi Year Tariff (MYT) basis, GERC allowed the DISCOMs to file the ARR up to 31 January 2008 instead of November 2007. Despite that, there was an inordinate delay of 181 days in filing the ARR for the year 2008-09. Further, filing of the ARR by the DISCOMs for the year 2009-10 also, was abnormally delayed by 269 days which lacked justification.
DGVCL stated (August 2011) that the delay in filing of ARR for the year 2008-09 was mainly due to compilation of various data for preparation of ARR due to introduction of MYT system by GERC. So far as filing of ARR 2009-10 was concerned, it was delayed due to deputation of majority of staff for General Election work.
The reply is not tenable. GERC brought to the notice of DISCOMs draft MYT regulation well in advance in August 2007 itself; further, against the schedule of 30 November 2007, extension was granted by GERC till 31 January 2008 for filing the ARR for 2008-09. As the filing of ARR has priority, DISCOMs should have made adequate efforts for timely filing of ARR in 2009-10 also.
ARR were filed with a delay of 23 to 269 days by DISCOMs during 2006-11
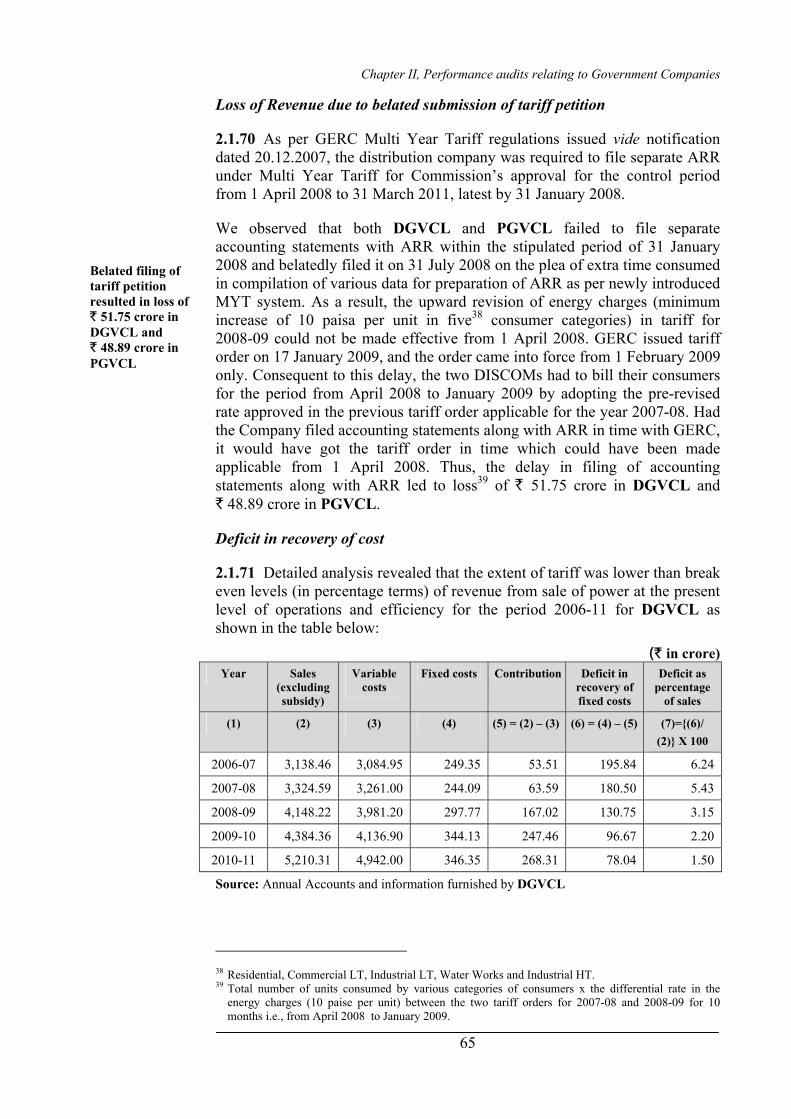
Chapter II, Performance audits relating to Government Companies
65
Loss of Revenue due to belated submission of tariff petition
2.1.70 As per GERC Multi Year Tariff regulations issued vide notification dated 20.12.2007, the distribution company was required to file separate ARR under Multi Year Tariff for Commission’s approval for the control period from 1 April 2008 to 31 March 2011, latest by 31 January 2008.
We observed that both DGVCL and PGVCL failed to file separate accounting statements with ARR within the stipulated period of 31 January 2008 and belatedly filed it on 31 July 2008 on the plea of extra time consumed in compilation of various data for preparation of ARR as per newly introduced MYT system. As a result, the upward revision of energy charges (minimum increase of 10 paisa per unit in five38 consumer categories) in tariff for 2008-09 could not be made effective from 1 April 2008. GERC issued tariff order on 17 January 2009, and the order came into force from 1 February 2009 only. Consequent to this delay, the two DISCOMs had to bill their consumers for the period from April 2008 to January 2009 by adopting the pre-revised rate approved in the previous tariff order applicable for the year 2007-08. Had the Company filed accounting statements along with ARR in time with GERC, it would have got the tariff order in time which could have been made applicable from 1 April 2008. Thus, the delay in filing of accounting statements along with ARR led to loss39 of ` 51.75 crore in DGVCL and ` 48.89 crore in PGVCL.
Deficit in recovery of cost
2.1.71 Detailed analysis revealed that the extent of tariff was lower than break even levels (in percentage terms) of revenue from sale of power at the present level of operations and efficiency for the period 2006-11 for DGVCL as shown in the table below:
(` in crore) Year Sales
(excluding subsidy)
Variable costs
Fixed costs Contribution Deficit in recovery of fixed costs
Deficit as percentage
of sales
(1) (2) (3) (4) (5) = (2) – (3) (6) = (4) – (5) (7)={(6)/ (2)} X 100
2006-07 3,138.46 3,084.95 249.35 53.51 195.84 6.24
2007-08 3,324.59 3,261.00 244.09 63.59 180.50 5.43
2008-09 4,148.22 3,981.20 297.77 167.02 130.75 3.15
2009-10 4,384.36 4,136.90 344.13 247.46 96.67 2.20
2010-11 5,210.31 4,942.00 346.35 268.31 78.04 1.50
Source: Annual Accounts and information furnished by DGVCL
38 Residential, Commercial LT, Industrial LT, Water Works and Industrial HT. 39 Total number of units consumed by various categories of consumers x the differential rate in the
energy charges (10 paise per unit) between the two tariff orders for 2007-08 and 2008-09 for 10 months i.e., from April 2008 to January 2009.
Belated filing of tariff petition resulted in loss of ` 51.75 crore in DGVCL and ` 48.89 crore in PGVCL

Audit Report No. 4 (Commercial) for the year ended 31 March 2011
66
Position in respect of PGVCL for the period 2006-11 is tabulated below: (` in crore)
Year Sales (excluding subsidy)
Variable costs
Fixed costs
Contribution Deficit in recovery of fixed costs
Deficit as percentage of
sales (1) (2) (3) (4) (5) = (2) – (3) (6) = (4) – (5) (7)={(6)/
(2)} X 100 2006-07 3,361.17 3,390.19 602.93 (-)29.02 631.95 18.80 2007-08 3,782.25 4,108.01 591.4 (-)325.76 917.16 24.25 2008-09 4,951.65 4,907.97 617.04 43.68 573.36 11.58 2009-10 5,192.75 5,040.38 660.88 152.37 508.51 9.79 2010-11 6,285.65 6,118.31 697.42 167.34 530.08 8.43
Source: Annual Accounts and information furnished by PGVCL
It could be seen that during 2006-11, while DGVCL was able to cover its variable cost, PGVCL could not fully recover even the variable cost during 2006-07 and 2007-08 against the revenue from sale of energy (excluding the subsidy). As far as fixed cost was concerned, in none of the years, DGVCL and PGVCL could recover it fully against the revenue from sale of energy. It appears that the tariff is on lower side and needs to be revised for recovery of the cost. Further, the costs could be brought down by improving operational efficiency, viz., reduction in AT&C losses, conversion of LT lines to HT lines, metering of unmetered connections, replacement of defective meters, improving billing and collection efficiency etc., which have been discussed separately in the performance audit. Moreover, efforts should also be made to reduce cross subsidisation among various sectors (categories) of consumers.
Loss due to non-request for enhancement of Tariff Rate
2.1.72 As per GERC (Terms and Conditions of Tariff) Regulation 2004, the DISCOMs were allowed to have full amount of return on equity (ROE) of 14 per cent. Ministry of Power (MOP), GoI had also instructed (February 2008) the GoG to ensure full ROE to power utilities. Accordingly, DGVCL and PGVCL while filing the ARR petition for the year 2007-08 had demanded (December 2006) ROE of ` 47.09 crore and ` 138.46 crore respectively at the admissible rate of 14 per cent. The projected ROE could be achieved either by way of increase in tariff or by reducing the cost or both. However, both the DISCOMS did not ask GERC for revision of tariff. Considering the lesser scope for minimising the cost coupled with absence of request for revision of tariff by DISCOMs, GERC approved the ARR reckoning the ROE at lower rate of seven per cent only (` 23.55 crore and ` 69.23 crore respectively).
Had the DISCOMs requested for revision of Tariff to get 14 per cent ROE (which they were eligible as per GERC regulations), it would have got the projected ROE of ` 47.09 crore and ` 138.46 crore respectively. Since the DISCOMs did not ask for revision of tariff, they were left with no other option but to minimise the cost. However, DISCOMs failed to decrease the cost; on the contrary DGVCL and PGVCL incurred a loss40 of ` 127.66 crore and ` 449.81 crore respectively against the 14 per cent ROE of ` 47.09 crore and ` 138.46 crore during 2007-08. In subsequent financial years (i.e., 2008-09 to 40 Loss per unit X Net power sold

Chapter II, Performance audits relating to Government Companies
67
2010-11), however, the GERC approved ROE at the rate of 14 per cent and also approved the revision of tariff accordingly.
Consumer Satisfaction
2.1.73 One of the key elements of the Power Sector Reforms was to protect the interest of the consumers and to ensure better quality of service to them. The consumers often face problems relating to supply of power such as non-availability of distribution system for release of new connections or extension of connected load, frequent tripping of lines and/ or transformers and improper metering and billing.
DISCOMs were required to introduce consumer friendly environment like introduction of computerised billing, online bill payment, establishment of customer care centres, etc. to enhance satisfaction of consumers and reduce the advent of grievances among them. The billing issues have already been discussed in the preceding paragraphs. The redressal of grievances is discussed below.
Redressal of Grievances
2.1.74 The GERC specified the mode and time frame for redressal of grievances vide its Notification No.4 of 2004 “Establishment of forum for redressal of grievances of consumer regulations” in pursuance of the Electricity Act, 2003. GERC had also prescribed (vide its Notification No. 10 of 2005) the Standard of Performance (SOP) for DISCOMs, the time limit for rendering services to the consumers and compensation payable for not adhering to the same. The nature of services contained in the SOP inter alia includes line breakdowns, distribution meter complaints, installation of new meters/ connections or shifting thereof, etc.
There is a three tier system for redressal of consumer grievances comprising Consumer Redressal Committees (CRC) at Division and Circle Level and Consumer Grievances Redressal Forum (CGRF) at Corporate Level. The consumer shall register grievances before concerned Division level CRC who shall dispose of the complaint within one month. Circle level CRC and Corporate level CGRF act as an appellate body above Division CRC and Circle CRC respectively. Further, GERC has appointed an Ombudsman as an authority for hearing appeals against the decisions of corporate level CGRF. In this regard, scrutiny of records of DGVCL revealed the following:
• GERC in SOP regulation prescribed specific proforma for maintenance of the complaint register. However, on a test check of three divisions41, we observed that the registers maintained were deficient as far as they did not record the mandatory details such as classification and nature of complaint, time and date of redressal of complaint etc.
41 Vyara, Vapi (Rural) and Vapi (Industrial)
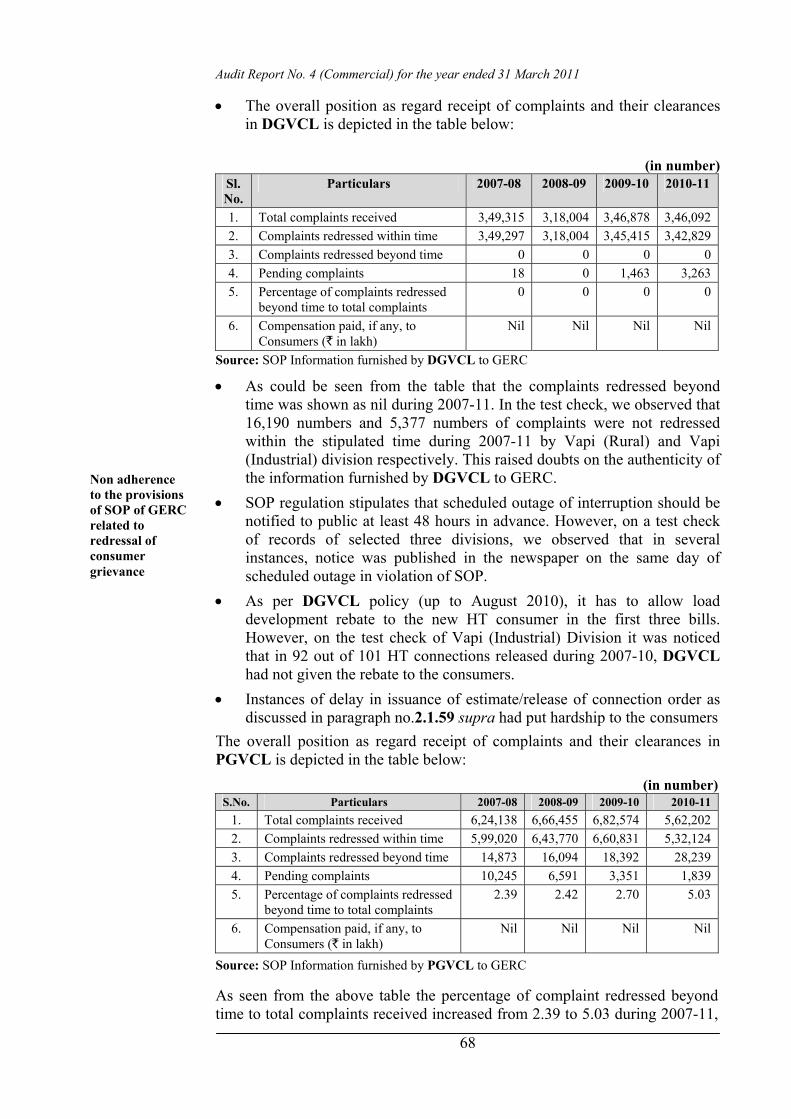
Audit Report No. 4 (Commercial) for the year ended 31 March 2011
68
• The overall position as regard receipt of complaints and their clearances in DGVCL is depicted in the table below:
(in number) Sl. No.
Particulars 2007-08 2008-09 2009-10 2010-11
1. Total complaints received 3,49,315 3,18,004 3,46,878 3,46,092 2. Complaints redressed within time 3,49,297 3,18,004 3,45,415 3,42,829 3. Complaints redressed beyond time 0 0 0 0 4. Pending complaints 18 0 1,463 3,263 5. Percentage of complaints redressed
beyond time to total complaints 0 0 0 0
6. Compensation paid, if any, to Consumers (` in lakh)
Nil Nil Nil Nil
Source: SOP Information furnished by DGVCL to GERC
• As could be seen from the table that the complaints redressed beyond time was shown as nil during 2007-11. In the test check, we observed that 16,190 numbers and 5,377 numbers of complaints were not redressed within the stipulated time during 2007-11 by Vapi (Rural) and Vapi (Industrial) division respectively. This raised doubts on the authenticity of the information furnished by DGVCL to GERC.
• SOP regulation stipulates that scheduled outage of interruption should be notified to public at least 48 hours in advance. However, on a test check of records of selected three divisions, we observed that in several instances, notice was published in the newspaper on the same day of scheduled outage in violation of SOP.
• As per DGVCL policy (up to August 2010), it has to allow load development rebate to the new HT consumer in the first three bills. However, on the test check of Vapi (Industrial) Division it was noticed that in 92 out of 101 HT connections released during 2007-10, DGVCL had not given the rebate to the consumers.
• Instances of delay in issuance of estimate/release of connection order as discussed in paragraph no.2.1.59 supra had put hardship to the consumers
The overall position as regard receipt of complaints and their clearances in PGVCL is depicted in the table below:
(in number) S.No. Particulars 2007-08 2008-09 2009-10 2010-11
1. Total complaints received 6,24,138 6,66,455 6,82,574 5,62,202 2. Complaints redressed within time 5,99,020 6,43,770 6,60,831 5,32,124 3. Complaints redressed beyond time 14,873 16,094 18,392 28,239 4. Pending complaints 10,245 6,591 3,351 1,839 5. Percentage of complaints redressed
beyond time to total complaints 2.39 2.42 2.70 5.03
6. Compensation paid, if any, to Consumers (` in lakh)
Nil Nil Nil Nil
Source: SOP Information furnished by PGVCL to GERC
As seen from the above table the percentage of complaint redressed beyond time to total complaints received increased from 2.39 to 5.03 during 2007-11,
Non adherence to the provisions of SOP of GERC related to redressal of consumer grievance
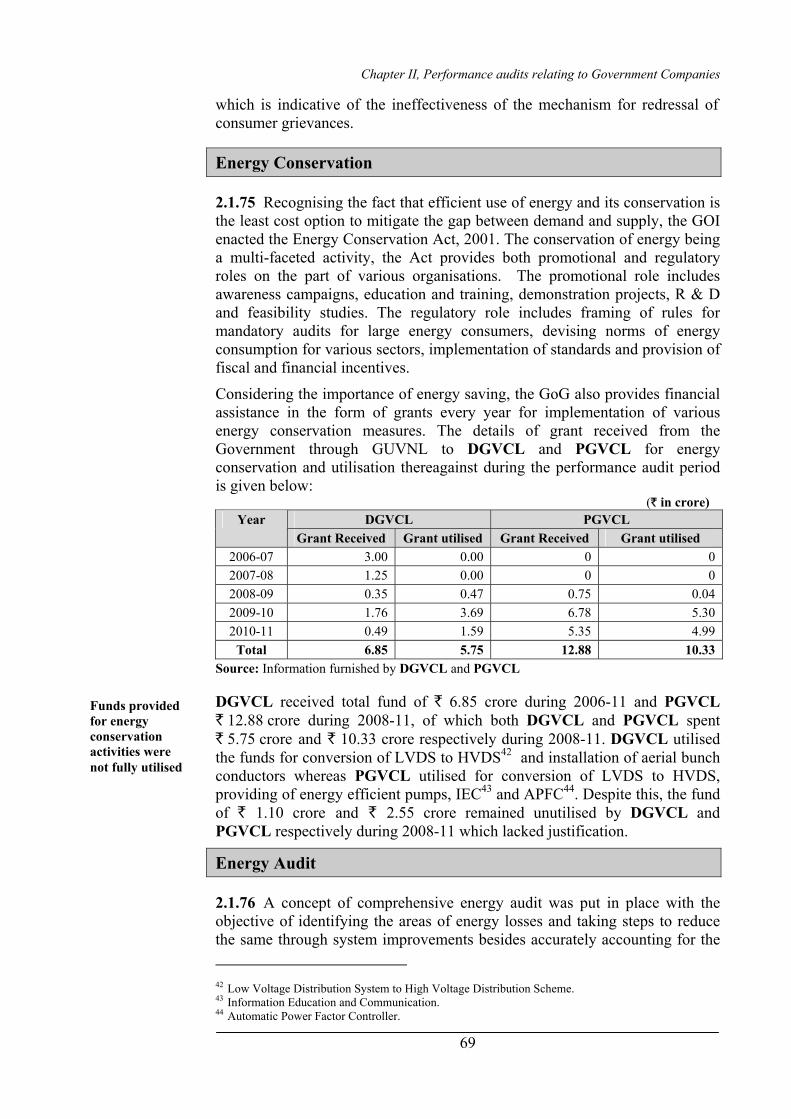
Chapter II, Performance audits relating to Government Companies
69
which is indicative of the ineffectiveness of the mechanism for redressal of consumer grievances.
Energy Conservation
2.1.75 Recognising the fact that efficient use of energy and its conservation is the least cost option to mitigate the gap between demand and supply, the GOI enacted the Energy Conservation Act, 2001. The conservation of energy being a multi-faceted activity, the Act provides both promotional and regulatory roles on the part of various organisations. The promotional role includes awareness campaigns, education and training, demonstration projects, R & D and feasibility studies. The regulatory role includes framing of rules for mandatory audits for large energy consumers, devising norms of energy consumption for various sectors, implementation of standards and provision of fiscal and financial incentives.
Considering the importance of energy saving, the GoG also provides financial assistance in the form of grants every year for implementation of various energy conservation measures. The details of grant received from the Government through GUVNL to DGVCL and PGVCL for energy conservation and utilisation thereagainst during the performance audit period is given below:
(` in crore) DGVCL PGVCL Year
Grant Received Grant utilised Grant Received Grant utilised 2006-07 3.00 0.00 0 0 2007-08 1.25 0.00 0 0 2008-09 0.35 0.47 0.75 0.04 2009-10 1.76 3.69 6.78 5.30 2010-11 0.49 1.59 5.35 4.99
Total 6.85 5.75 12.88 10.33 Source: Information furnished by DGVCL and PGVCL
DGVCL received total fund of ` 6.85 crore during 2006-11 and PGVCL ` 12.88 crore during 2008-11, of which both DGVCL and PGVCL spent ` 5.75 crore and ` 10.33 crore respectively during 2008-11. DGVCL utilised the funds for conversion of LVDS to HVDS42 and installation of aerial bunch conductors whereas PGVCL utilised for conversion of LVDS to HVDS, providing of energy efficient pumps, IEC43 and APFC44. Despite this, the fund of ` 1.10 crore and ` 2.55 crore remained unutilised by DGVCL and PGVCL respectively during 2008-11 which lacked justification.
Energy Audit
2.1.76 A concept of comprehensive energy audit was put in place with the objective of identifying the areas of energy losses and taking steps to reduce the same through system improvements besides accurately accounting for the 42 Low Voltage Distribution System to High Voltage Distribution Scheme. 43 Information Education and Communication. 44 Automatic Power Factor Controller.
Funds provided for energy conservation activities were not fully utilised
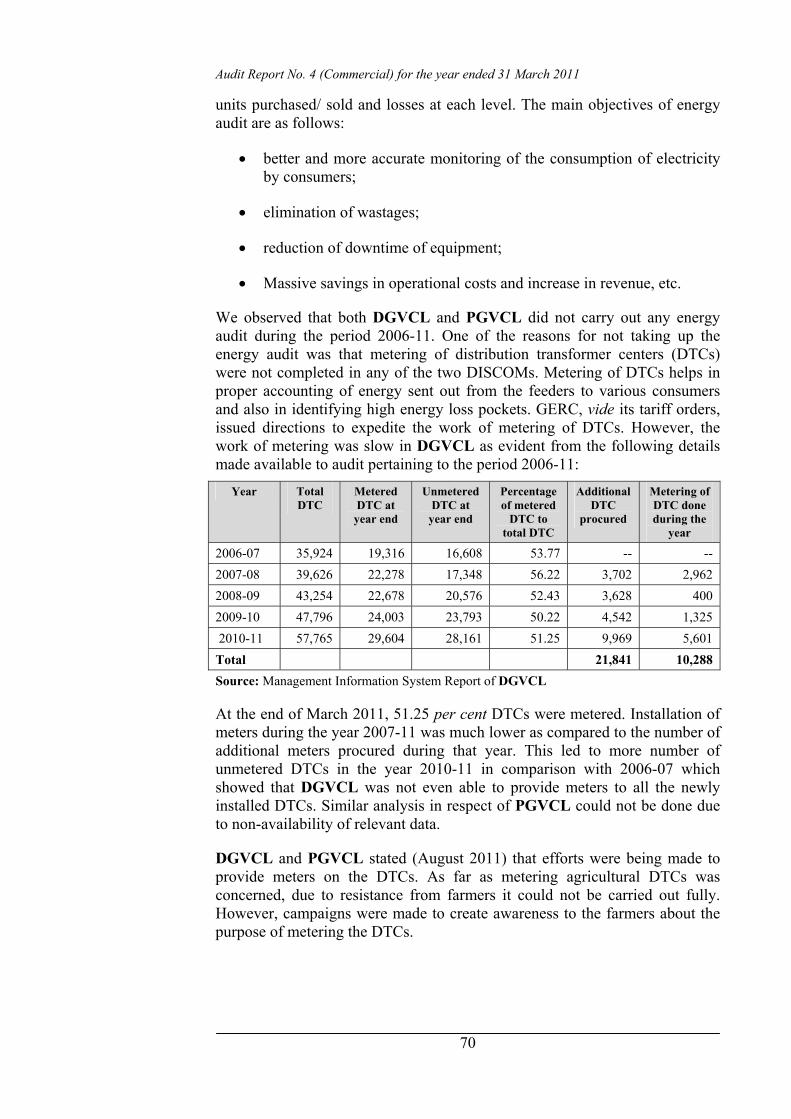
Audit Report No. 4 (Commercial) for the year ended 31 March 2011
70
units purchased/ sold and losses at each level. The main objectives of energy audit are as follows:
• better and more accurate monitoring of the consumption of electricity by consumers;
• elimination of wastages;
• reduction of downtime of equipment;
• Massive savings in operational costs and increase in revenue, etc.
We observed that both DGVCL and PGVCL did not carry out any energy audit during the period 2006-11. One of the reasons for not taking up the energy audit was that metering of distribution transformer centers (DTCs) were not completed in any of the two DISCOMs. Metering of DTCs helps in proper accounting of energy sent out from the feeders to various consumers and also in identifying high energy loss pockets. GERC, vide its tariff orders, issued directions to expedite the work of metering of DTCs. However, the work of metering was slow in DGVCL as evident from the following details made available to audit pertaining to the period 2006-11:
Year Total DTC
Metered DTC at year end
Unmetered DTC at
year end
Percentage of metered
DTC to total DTC
Additional DTC
procured
Metering of DTC done during the
year
2006-07 35,924 19,316 16,608 53.77 -- -- 2007-08 39,626 22,278 17,348 56.22 3,702 2,962 2008-09 43,254 22,678 20,576 52.43 3,628 400 2009-10 47,796 24,003 23,793 50.22 4,542 1,325 2010-11 57,765 29,604 28,161 51.25 9,969 5,601 Total 21,841 10,288 Source: Management Information System Report of DGVCL
At the end of March 2011, 51.25 per cent DTCs were metered. Installation of meters during the year 2007-11 was much lower as compared to the number of additional meters procured during that year. This led to more number of unmetered DTCs in the year 2010-11 in comparison with 2006-07 which showed that DGVCL was not even able to provide meters to all the newly installed DTCs. Similar analysis in respect of PGVCL could not be done due to non-availability of relevant data.
DGVCL and PGVCL stated (August 2011) that efforts were being made to provide meters on the DTCs. As far as metering agricultural DTCs was concerned, due to resistance from farmers it could not be carried out fully. However, campaigns were made to create awareness to the farmers about the purpose of metering the DTCs.
Chapter II, Performance audits relating to Government Companies
71
Acknowledgement
We acknowledge the cooperation and assistance extended by different levels of the Management at various stages of conducting the performance audit.
Conclusion
• The distribution reforms as envisaged under National Electricity Policy/Plans were not fully achieved by DGVCL/PGVCL; the feeders/DTRs commissioned by PGVCL in test checked regions were not commensurate with the connected load;
• Implementation of centrally sponsored schemes (R-APDRP, RGGVY) by DGVCL/PGVCL was not efficient and effective. Several deficiencies like, under utilisation of scheme funds, delayed completion/non-synchronisation of works, etc. were noticed which had adverse effects on implementation of schemes;
• AT&C losses of DGVCL and PGVCL stood between 20.59 and 18.35 per cent and 33.77 and 29.03 per cent respectively as against R-APDRP stipulated norm of 15 per cent on account of various deficiencies like, excessive failure of DTRs due to inadequate maintenance activities, avoidable delays in repairs of DTRs, slow replacement of conventional meters with quality/static meters, non-metering of all agricultural consumers, slow implementation of LT less system, slow conversion of LT conductors with Aerial Bunch Cables, etc.
• Deficiencies in the billing system, such as incorrect estimation of agricultural consumption and under recovery of additional Security Deposit were noticed. The collection activities of two DISCOMs also had several shortcomings like, mounting arrears against permanent disconnected consumers, non-disconnection of power supply to defaulting consumers and consumer with heavy arrears, revenue loss due to delay in issue of estimate/release of connection order, avoidable delay in execution of decree against defaulting consumers, etc.
• The DISCOMs did not have financial autonomy in management of funds and raising loans. Instances of unwarranted borrowings and non-claiming of rebate from holding company for prompt payment were noticed in DGVCL.
• There was no effective system in place in DGVCL/PGVCL to assess consumer satisfaction and redressal of grievances.
• No effective energy conservation measures were undertaken by DGVCL/PGVCL. None of the two DISCOMs conducted energy audit during 2006-11.

Audit Report No. 4 (Commercial) for the year ended 31 March 2011
72
Recommendations
• DISCOMs should focus on proper management of feeders so that feeders/DTRs commissioned would commensurate with the connected load of the consumers;
• DISCOMs should implement the GoI schemes meant for rural electrification and system augmentation within the time schedule fixed, so as to achieve the envisaged objectives of the schemes;
• DISCOMs should strive to achieve the norms of AT&C losses by strengthening the efficiency of distribution system through evolving adequate maintenance system, proper management of DTRs, expeditious replacement of conventional meters with quality/static meters, etc.
• Corrective measures such as, conducting awareness campaign and metering all the agricultural consumers, prompt disconnection of defaulting consumers, timely recovery of dues, prompt execution of court decrees for recovery of dues from defaulting consumers etc., need to be taken;
• GUVNL should give sufficient financial autonomy to the DISCOMs for efficient performance of their activities;
• The guidelines of GERC regarding redressal of consumer grievances should be adhered to by the DISCOMs.
• DISCOMs should conduct energy audits as per the directives of GERC.

Chapter II, Performance audits relating to Government companies
73
Gujarat State Petroleum Corporation Limited 2.2 Functioning of Gujarat State Petroleum Corporation Limited Executive summary The Company was incorporated on 29 January 1979 for exploration, development and production of petroleum and carrying on business of all chemicals derived from hydrocarbons. The Company ventured in exploration activities under Pre-NELP in 1994 and participated in bidding with introduction of New Exploration Licensing Policy (NELP) from 1999. The Company is also engaged in gas trading activity and caters to industries engaged in power generation, steel and city gas distribution.
Blocks and hydrocarbon reserves
After surrender of four blocks (2006-10), the Company, as on 31 March 2011, had 64 blocks, of which 53 blocks are in India and 11 blocks are overseas. Of the 53 domestic blocks, the Company is operator in nine blocks and non operator in 44 blocks. The Company has 14 producing blocks which are domestic.
The proved and probable (2P) reserves in 11 out of 14 producing blocks are 3,376.9 MBbl of oil and 19.6 BCF of gas. Of the remaining 39 domestic blocks which are under exploration stage, one offshore block viz., Krishna Godavari (KG) block entered development stage and 2P of KG block is 18,303.7 MBbl of oil and 947.3 BCF of gas.
Bidding for hydrocarbon blocks
The Company with its consortium submitted bid for acquiring KG block without properly assessing related technical and financial issues. As a result, against the estimated drilling cost of US $ 102.23 million and the total depth committed of 45,348 meter in the minimum work programme (MWP), the actual drilling cost incurred was US $ 1,302.88 million (` 5,920.27 crore) and the total depth drilled was of 77,395.07 meters.
The main reason for the incorrect estimation was adoption of deficient
geological model prepared by a joint venture (JV) partner, Geo Global Resources Inc., Canada (GGR). The Company on the ground that GGR was a technical expert, admitted GGR in the JV without taking any financial contribution from him during the exploration phase of KG block. As a result, the Company incurred GGR’s share of US $ 175.07 million (` 780.81 crore) towards the exploration cost and suffered loss of interest of ` 104.14 crore during 2007-11.
Exploration
An unreasonable time of 14 to 106 months was taken (2006-11) for completing the environment impact studies (EIS) in eight out of nine domestic blocks where the Company was operator.
Against the estimated drilling rate of 27.76 meters per day, the actual rate was 22.49 meters per day in drilling (July 2004 to April 2010) 16 wells in KG offshore block. This resulted in extension of tenure of drilling activity and consequential avoidable expenditure of ` 180.91croreon drilling work.
Reliance Industries Limited (RIL) a private sector enterprise, installed Control and Riser Platform unilaterally in the part area of KG block licensed to the Company on which no other operator has any right without the consent of the Company/GoI. As per the mining lease conditions of GoI, the Company would be responsible for safety and security of all structures in its block including RIL’s structure for its life period.
Further, in exploration activities, instances such as, drilling of well in area belonging to other operator, acceptance of material against specifications, incurring of imprudent expenditure and payment of idle charges were noticed. Consequently, the Company incurred avoidable expenditure of ` 13.23 crore and also suffered loss of ` 12.45 crore.

Audit Report No. 4 (Commercial) for the year ended 31 March 2011
74
Twenty-six unviable wells were not abandoned even after expiry of 166 to 1,610 days since completion of test (November 2006 to October 2010), so as to bring the wells area to the pre-existing local environment as per the Regulation 59 of Oil Mines Regulations, 1984.
Development
The Company incurred total expenditure of ` 104.29 crore on drilling of wells without obtaining approval of the Management Committee/GoI for the Field Development Plan (FDP). In absence of necessary approval, the said expenditure could not qualify for recovery as ‘cost petroleum’. Further, delay of 12 months in finalisation of construction contract from the date of approval of FDP would have corresponding impact in commencement of production activities in KG block.
Marketing
During 2006-11, the total revenue from trading of gas was ` 19,245.39 crore and the revenue from sale of its own production of gas and oil was ` 1,563.63 crore which indicated that Company was focusing mainly on trading rather than production activity. In trading activities the Company failed to safeguard its interest due to non-insertion of clause for recovery of Take or Pay (ToP) charges in the contracts for sale of gas with 25 to 36 customers out of 38 to 47 customers. This led to potential revenue loss of ` 502.19 crore in selected cases.
Though the Company purchased (2006-09) gas on spot price, it sold gas at a price which was lesser than the purchase price by ` 5.23 to ` 430.79 per MMBTU which resulted in extension of undue benefit of ` 70.54 crore to a private entrepreneur, Adani Energy (Gujarat) Limited.
Finance
Though exploration, development and production activities are of high risk and capital intensive nature and requires long gestation period, the Company largely utilised (2006-11) short term loans (constituting 38 per cent of the total borrowings) on these activities. The dependence on short term loans for these activities was not a prudent financial practice.
Instances of losses due to financial deficiencies such as, interest loss (` 3.14 crore) due to delay in raising claims for recovery of dues from JV partners and avoidable payment of penal interest (` 4.17 crore) due to short remittance of advance tax were noticed.
Internal Control and Monitoring Mechanism
The internal control and monitoring mechanism of the Company was weak in several areas like non-submission of annual budget to Board of Directors, absence of Management Information System with regard to taking up of exploration and development activities as per the commitments made in Minimum Work Programme of Profit Sharing Contracts and as per the approved FDP, etc.
Conclusion
Proper assessment of technical and financial issues was not done before bidding for acquisition of KG block. Unreasonable time was taken in completing environment impact study and wells were drilled beyond exploration period. Improper management of exploration and development activities led to incurring of avoidable expenditure/ losses. Financial interest of the Company was not safeguarded due to non insertion of clause for recovery of ToP charges in all the contracts for sale of gas. Proper internal control and monitoring system was not in existence.
Recommendations
The review contains five recommendations which inter alia include properly assessing both financial and technical issues before bidding for the blocks, devising mechanism for improving the efficiency in the management of activities related to exploration and development, insertion of the clause for recovery of ToP charges in all the contracts for sale of gas and improving the internal control and monitoring system.

Chapter II, Performance reviews relating to Government companies
75
Introduction 2.2.1 Gujarat State Petroleum Corporation Limited1 (the Company) was incorporated on 29 January 1979. The main objectives of the Company inter alia includes exploration, development and production of petroleum, carrying on business of all chemicals derived from hydrocarbons, generate energy in any form for sale and supply from available fuel and other inputs, etc. The Company actually ventured in the exploration activities under Pre-NELP in 1994 and participated in bidding with introduction of New Exploration Licensing Policy (NELP) from 1999. The Company is also engaged in gas trading activity and caters to industries engaged in power generation, steel and city gas distribution. As on 31 March 2011, Government of Gujarat (GoG) was holding 89.83 per cent of equity stake in the Company.
2.2.2 The Management of the Company is vested in the Board of Directors (BoD) comprising a Chairman and the Managing Director (MD) and nine Directors. The MD is the chief executive officer who is assisted by 15 heads of department of the Company. The BoD has constituted various sub-committees viz., Project Committee, Human Resource Committee, Audit Committee, and Shareholders/ Investors Grievance Committee to assist BoD in performing their duties.
Scope of Audit
2.2.3 The performance audit was conducted from December 2010 to July 2011 and covers various activities of the Company relating to bidding for and acquisition of hydrocarbon blocks, exploration, development and production of petroleum including environmental issues, marketing of oil/ natural gas and financial management during the period of five years up to 2010-11. For the detailed checking of records related to exploration, development, production of petroleum, seven2 out of 18 hydrocarbon blocks (the blocks) (38 per cent) where the Company was operator were selected for test check. Of the seven blocks, five were onshore in which Company’s stake was more than 50 per cent and two were offshore blocks, one each in domestic and overseas. In case where Company was non-operator, seven3 out of 46 blocks (15 per cent) were selected. Of the seven blocks, four blocks in which the Company had stake of more than 60 per cent and three blocks (including one overseas block) with smaller stake of the Company were selected. Further, we test checked the records relating to the transactions under other activities of the Company based on their importance in terms of money value, compliance to statutes, etc.
1 It was called Gujarat State Petrochemicals Corporation Limited prior to November 1994. 2 Tarapur, Ahmedabad, KG block, Sanand-Miroli, Ankleshwar, Unawa and North Hapy blocks. 3 North Kathana, Kanawara, Allora, Hazira, Mumbai offshore, CB-ONN-2005/ 10 and WA-388
Australia.

Audit Report No. 4 (Commercial) for the year ended 31 March 2011
76
Audit objectives
2.2.4 The objectives of performance audit were to assess whether:
• bidding for acquisition of the hydrocarbon blocks was made in the most competitive manner based on proper study of prospective oil and gas acreage and evaluation of geological and economical risks;
• different phases involved in exploration, development and production related activities were carried out timely in an efficient and effective manner with due observance to the provisions of relevant Rules and Regulations;
• the trading activities relating to sale of gas were carried out efficiently and effectively duly safeguarding the interests of the Company;
• management of finances of the Company was efficient and effective; and
• internal control system and monitoring mechanism was effective and efficient.
Audit criteria
2.2.5 The following audit criteria were adopted for assessing the performance of the Company:
• Guidelines/circulars issued by Directorate General of Hydrocarbon (DGH)/ Government;
• New Exploration Licensing Policy – 1999;
• Conditions in the Petroleum Exploration License and Oil Mines Regulations, 1984;
• Production Sharing Contracts (PSC) entered into with Ministry of Petroleum and Natural Gas (MoPNG);
• Minimum Work Programme (MWP);
• Agenda and minutes of Operating Committee/ Management Committee/ BoD; and
• Contracts with consultancy firms, rig operators, suppliers and other service providers.
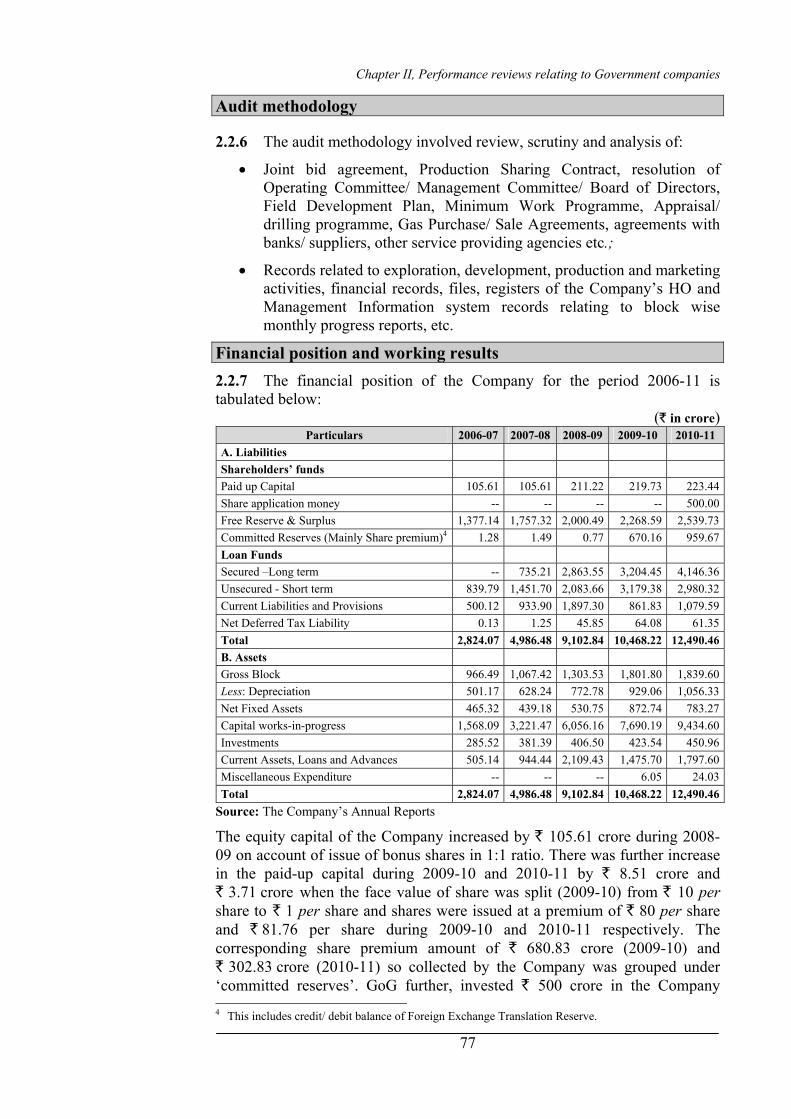
Chapter II, Performance reviews relating to Government companies
77
Audit methodology
2.2.6 The audit methodology involved review, scrutiny and analysis of:
• Joint bid agreement, Production Sharing Contract, resolution of Operating Committee/ Management Committee/ Board of Directors, Field Development Plan, Minimum Work Programme, Appraisal/ drilling programme, Gas Purchase/ Sale Agreements, agreements with banks/ suppliers, other service providing agencies etc.;
• Records related to exploration, development, production and marketing activities, financial records, files, registers of the Company’s HO and Management Information system records relating to block wise monthly progress reports, etc.
Financial position and working results 2.2.7 The financial position of the Company for the period 2006-11 is tabulated below:
(` in crore) Particulars 2006-07 2007-08 2008-09 2009-10 2010-11
A. Liabilities Shareholders’ funds Paid up Capital 105.61 105.61 211.22 219.73 223.44Share application money -- -- -- -- 500.00Free Reserve & Surplus 1,377.14 1,757.32 2,000.49 2,268.59 2,539.73Committed Reserves (Mainly Share premium)4 1.28 1.49 0.77 670.16 959.67Loan Funds Secured –Long term -- 735.21 2,863.55 3,204.45 4,146.36Unsecured - Short term 839.79 1,451.70 2,083.66 3,179.38 2,980.32Current Liabilities and Provisions 500.12 933.90 1,897.30 861.83 1,079.59Net Deferred Tax Liability 0.13 1.25 45.85 64.08 61.35Total 2,824.07 4,986.48 9,102.84 10,468.22 12,490.46B. Assets Gross Block 966.49 1,067.42 1,303.53 1,801.80 1,839.60Less: Depreciation 501.17 628.24 772.78 929.06 1,056.33Net Fixed Assets 465.32 439.18 530.75 872.74 783.27Capital works-in-progress 1,568.09 3,221.47 6,056.16 7,690.19 9,434.60Investments 285.52 381.39 406.50 423.54 450.96Current Assets, Loans and Advances 505.14 944.44 2,109.43 1,475.70 1,797.60Miscellaneous Expenditure -- -- -- 6.05 24.03Total 2,824.07 4,986.48 9,102.84 10,468.22 12,490.46
Source: The Company’s Annual Reports
The equity capital of the Company increased by ` 105.61 crore during 2008-09 on account of issue of bonus shares in 1:1 ratio. There was further increase in the paid-up capital during 2009-10 and 2010-11 by ` 8.51 crore and ` 3.71 crore when the face value of share was split (2009-10) from ` 10 per share to ` 1 per share and shares were issued at a premium of ` 80 per share and ` 81.76 per share during 2009-10 and 2010-11 respectively. The corresponding share premium amount of ` 680.83 crore (2009-10) and ` 302.83 crore (2010-11) so collected by the Company was grouped under ‘committed reserves’. GoG further, invested ` 500 crore in the Company 4 This includes credit/ debit balance of Foreign Exchange Translation Reserve.

Audit Report No. 4 (Commercial) for the year ended 31 March 2011
78
through Gujarat State Investments Limited at ` 81 per share, which is being shown as ‘share application money’, pending allotment during 2010-11.
The Company’s total borrowings increased from ` 839.79 crore to ` 7,126.68 crore during 2006-11 so as to meet the fund requirements against capital expenditure incurred on exploration activities, which also caused corresponding increase in the capital work-in-progress during the said period. Since the Company has been persistently earning profits during 2006-11, the free reserves and surplus have also increased from ` 1,377.14 crore (2006-07) to ` 2,539.73 crore (2010-11).
2.2.8 The working results of the Company for the period 2006-11 are tabulated below:
(` in crore) Particulars 2006-07 2007-08 2008-09 2009-10 2010-11 Income Sales5 2,632.13 4,117.49 5,476.18 3,868.55 4,767.39Other income 19.04 25.72 31.25 26.98 38.66Increase/ (Decrease) in stock 0.77 2.28 (1.66) 1.27 149.78Total 2,651.94 4,145.49 5,505.77 3,896.80 4,955.83Expenditure Purchase of gas/ petroleum products 2,055.79 3,128.22 4,406.09 3,112.94 4,207.73Prod. selling and operational exp. 171.57 155.98 175.34 127.23 141.08Payments to and provisions for Employees 1.92 3.25 8.82 7.51 8.50Administrative and other expenses 14.03 94.04 135.02 64.89 21.39Interest and finance charges 0.63 6.53 7.43 27.14 41.66Miscellaneous Expenditure (written off) -- -- -- -- 1.70Total 2,243.94 3,388.02 4,732.70 3,339.71 4,422.06Profit before depreciation 408.00 757.47 773.07 557.09 533.77Depreciation, Amortisation and depletion 104.17 129.47 142.30 154.07 130.15Profit for the year 303.83 628.00 630.77 403.02 403.62Provision for tax 76.66 222.24 255.86 83.40 80.99Profit after tax 227.17 405.76 374.91 319.62 322.63
Source: The Company’s Annual Reports
Reduction in sales from ` 5,476.18 crore in 2008-09 to ` 3,868.55 crore in 2009-10 was mainly due to (i) decrease in gas production due to depletion of gas from Hazira block; (ii) crash in gas price in international market causing corresponding downward impact in the purchase and sale value of gas; and (iii) availability of cheaper gas from Reliance Industries Limited (RIL). These aspects have been discussed in detail under succeeding paragraph nos. between 2.2.39 and 2.2.40.
Audit findings
2.2.9 We explained the audit objectives to the Company during an ‘Entry Conference’ held on 24 March 2011. Subsequently the audit findings were reported to the Company and the State Government in August 2011 and discussed in an ‘Exit conference’ held on 2 September 2011, which was attended by the Managing Director, Executive Director and Sectional heads of the Company. The Management replied to the audit findings in September 2011. The views expressed by them have duly been considered while finalising the performance audit report. The audit findings are discussed in the succeeding paragraphs. 5 This includes sale of electricity-windmill of ` 21.53 crore and ` 31.19 crore for 2009-10 and 2010-11
respectively.

Chapter II, Performance reviews relating to Government companies
79
Bidding for the hydrocarbon blocks and its acquisition 2.2.10 The Government of India (GoI) mainly allotted hydrocarbon blocks (blocks) between 1994 and 1998 to National Oil Companies (NOCs) on nomination basis. During the same period, GoI also offered blocks to private entities under Production Sharing Contracts (PSC) entered with them after following open bidding process and such blocks were called ‘Pre-New Exploration Licensing Policy (NELP) blocks’.
The Directorate General of Hydrocarbon (DGH), the oil and gas regulatory body of GoI, formulated and implemented the GoI’s NELP-1999 schemes I to VIII. The procedure for bidding under NELP involved the process of invitation of bids, data viewing by the bidders, purchase of data package by willing bidders, submission of bids by bidders to DGH, evaluation of bids by DGH, award of block for specified period, signing of Production Sharing Contract (PSC) and grant of petroleum exploration license (PEL).
During 2006-11, of the 72 onshore blocks offered by GoI under NELP VI to VIII, the Company along with its Joint Venture (JV) partners participated in 30 blocks and succeeded in acquisition of 11 blocks (37 per cent), of which the Company was operator6 in two blocks. As far as acquisition of offshore blocks were concerned, of the 115 offshore blocks offered, the Company and its JV partners had participated in 31 blocks and succeeded in acquisition of 22 blocks (71 per cent) of which the Company was operator in one block. Thus, the success rate in getting award of domestic blocks has been fairly good. Further, the Company had also acquired 11 overseas blocks which included five onshore blocks (Egypt, Yemen and Indonesia) and six offshore blocks (Australia and Egypt). Of these, the Company is operator in nine blocks and non operator in two blocks.
Acquisition of blocks 2.2.11 The year-wise details of blocks acquired, surrendered and in hand by the Company till 31 March 2011 is tabulated below:
(Figures in number of blocks) Acquired Surrender In hand Year of
acquisition Domestic Overseas Domestic Overseas Domestic Overseas 1994-95 4 - - - 4 - 1996-97 1 - - - 1 - 2001-02 3 - - - 3 - 2002-03 3 - - - 3 - 2003-04 4 - - - 4 - 2004-05 3 - - - 3 - 2005-06 2 1 - - 2 1 2006-07 1 1 1 - - 1 2007-08 20 3 - - 20 3 2008-09 7 4 1 1 6 3 2009-10 4 - 1 - 3 - 2010-11 4 3 - - 4 3 Total 56 12 3 1 53 11
Source: Information as provided by the Company
As could be seen from the above table, the Company acquired participating interest (PI) in 68 blocks (56 domestic and 12 overseas blocks) till 2010-11. 6 An operator is a company or individual leading and responsible for managing exploration,
development and production operation in a block.

Audit Report No. 4 (Commercial) for the year ended 31 March 2011
80
Of these, four blocks (3 domestic and 1 overseas blocks) where the Company was non operator, were surrendered (2006-10) at the instance of the operator, as the commercial success in those blocks could not be achieved.
2.2.12 Break-up of blocks acquired during pre-NELP and NELP based on various categories viz., operatorship, and location along with present status of the blocks as on 31 March 2011 is given below:
(Figures in number of blocks in hand) Located in Where Company is Under NELP round/
Month of issue of notice inviting offer
TotalOn
shoreOff
shoreDeep water
Operator Non operator
Explo-ration
Produ-ction
Domestic Block Pre-NELP 13 12 1 -- 2 11 -- 13 NELP-II December 2000 1 1 -- -- 1 -- -- 1 NELP III March 2002 1 -- 1 -- 1 -- 1 -- NELP IV May 2003 3 3 -- -- 1 2 3 -- NELP V January 2005 2 2 -- -- 1 1 2 -- NELP VI February 2006 19 6 2 11 2 17 19 -- NELP VII December 2007 10 4 4 2 1 9 10 -- NELP VIII April 2009 4 1 1 2 -- 4 4 -- Total (A) 53 29 9 15 9 44 39 14 Overseas blocks (All acquired during 2006-11) Australia 2 -- 2 -- -- 2 2 -- Egypt 5 1 3 1 5 -- 5 -- Yemen 3 3 -- -- 3 -- 3 -- Indonesia 1 1 -- -- 1 -- 1 -- Total (B) 11 5 5 1 9 2 11 -- Total (A+B) 64 34 14 16 18 46 50 14
Source: Information as provided by the Company
As could be seen from the table, of the 64 blocks in hand, 53 blocks are located in India and 11 blocks are located overseas. Of the 53 domestic blocks, only 14 are producing blocks7 and balance 39 blocks are in exploration stage. Further, out of the 53 blocks, the Company is the operator only for nine blocks and non operator8 for the balance 44 blocks. Of the 14 producing blocks, the Company is operator only for 3 blocks and non operator for the balance 11 blocks. In respect of 11 overseas blocks which are all in exploration stage, the Company is operator in nine blocks and non operator in two blocks.
GoI allots block to a consortium of bidders that form an unincorporated joint venture9 for undertaking exploration and production activity in the block. A separate PSC for each block between the consortium (the consortium includes joint venture (JV) partners and the Company) on one part and MoPNG (GoI) on other part were entered into for the above blocks. Further, Joint Operating Agreement (JOA) was also signed among the (JV) partners including the Company for the blocks, whereby the members of the consortium arrived at an understanding with the object to conduct and perform their rights and obligations pursuant to the PSC in a manner which would be consistent with the provisions of the contract. The position of blocks is also shown in the diagram given below: 7 Allora, Asjol, Bhandut, Cambay, Dholasan, Hazira, Ingoli, Kanwara, North Balol, North Kathana,
Pramoda, Sabarmati, Tarapur and Unawa. 8 A non operator is a company or individual in a block having a participating interest without being
responsible for managing the exploration, development, or production operation in the block. 9 A joint venture is where the parties do not form any legal entity. An unincorporated joint venture is
either an ad hoc project or legally structured as a partnership.

Chapter II, Performance reviews relating to Government companies
81
Proved and probable reserves
2.2.13 Of the 39 domestic blocks which are under exploration stage, 38 are still under exploration and balance one i.e., Krishna Godavari basin (KG block) has completed the exploration stage and entered development stage for which Field Development Plan was approved (October 2009) and proved and probable (2P) reserve assessed. Out of 14 producing blocks, in 11 blocks, 2P reserves were assessed and the remaining three blocks viz., Cambay, Dholasan and Unawa, did not pass the Economic Limit Test10 for 2P reserves. As such, during 2006-11, in the two blocks (Cambay and Dholasan) where the Company is non operator, the income was not adequate to cover the expenses and the aggregate loss was ` 4.37 crore during four out of five years. In the remaining one block (Unawa), the income was adequate to cover the expenses during four out of five years and the aggregate profit was ` 2.92 crore as on 31 March 2011.
The total 2P reserves of both oil and gas in KG block (Development stage block) and 11 producing blocks are tabulated below:
Proved and probable (2P) reserves Sl. No.
Particulars Oil (in MBbl – million
barrels of Oil) Gas (in BCF-billion
cubic feet) 1 KG Block 18,303.7 947.3 2 Eleven Producing block11 3,376.9 19.6 Total 21,680.6 966.9
Source: Draft Red Herring Prospectus prepared by the Company for its proposed Initial Public Offer
The proved and probable reserve of gas12 was 966.9 billion cubic feet and crude oil was 21,680.6 million barrel in four13 and eleven14 blocks respectively 10 A well is said to reach an “economic limit” when its production rate covers the expenses including
taxes. 11 Allora, Asjol, Hazira, Ingoli (Ahmedabad block) & Sanand East (Sanand-Miroli block), Kanawara,
North Kathana, Pramoda, Sabarmati, North Balol and Tarapur. 12 As certified by Gaffney, Cline and Associates, an independent international energy advisory group
(September 2009). 13 KG block, Hazira, Kanawara, and North Balol. 14 KG block, Allora, Asjol, Hazira, Ingoli (Ahmedabad block) & Sanand East (Sanand-Miroli block),
Kanawara, North Kathana, Pramoda, Sabarmati, and Tarapur.
minus
Operator 9
Domestic Blocks 53
Total blocks 68
Surrendered blocks 4
Blocks Held 64
Non operator 44
Producing 14
Exploration 39
Exploration 11
Producing Nil
Operator 9
Non operator 2
Overseas Blocks 11

Audit Report No. 4 (Commercial) for the year ended 31 March 2011
82
(September 2009). The 2P reserves of both crude oil and gas were higher in KG block. Our observations relating to bidding for KG block are discussed below.
Bidding for KG block
2.2.14 The blocks in Krishna Godavari basin were offered (March 2002) under NELP-III. The Company submitted the bid (August 2002) in consortium with Jubilant Enpro Limited (JEL), New Delhi and Geo Global Resources Inc., Canada (GGR). As per the joint bidding agreement entered with JEL and GGR, the Company would be operator for the block and its participating interest (PI) was 80 per cent while PI of JEL and GGR was 10 per cent each. KG-OSN-2001/3 (KG Block) was awarded and PSC was entered (February 2003) between GoI and the consortium.
As per terms of PSC, the period of exploration was six and half years consisting of three phases. The Minimum Work Programme (MWP) consisted of acquisition, processing and interpreting (API) of 3D seismic data, reprocessing of seismic data and drilling of exploratory wells. The details of MWP are tabulated below:
Period Estimated cost in MWP. million US $
Phase From To
3D (Sq. km)
Reproc-essing
(Line km)
No. of
wells Drilling Seismic Total
Total meter of drilling depth
committed
I Feb. 2003 Aug. 2005 1,250 2,298.4 1415 52.23 7.00 59.23 33,098 II Aug. 2005 Feb. 2008 -- -- 416 32.00 0.12 32.12 8,750 III Feb. 2008 Aug.2009 -- -- 217 18.00 0.35 18.35 3,500 Total 1,250 2,298.4 20 102.23 7.47 109.70 45,348
Source: Information as provided by the Company
It can be seen from the table that the Company was to drill 20 wells with total depth committed of 45,348 meter during February 2003 to August 2009. As per the GoI policy for merger of exploration/phases under NELP-III and IV introduced in June 2007, the contractor (the Company) would be entitled to have a substitution of additional meterage drilled in deeper wells against the aggregate meterage committed under MWP. Against the committed depth of 45,348 meters in 20 wells, the Company, till August 2008 drilled 12 wells with a total depth of 48,360 meters and hence, in terms of GoI policy, the Company’s exploration phase was declared completed (October 2008). The Company, however, continued to deploy rig till August 2009 and completed drilling of totally 16 wells by April 2010 with total depth of 77,395.07 meters, incurring aggregate drilling cost of US $ 1,302.88 million (` 5,920.27 crore at the average of annual rate, i.e., ` 45.44/US $). We observed the following:
Wrong estimation of cost for bidding
2.2.15 As per the bid evaluation criteria, the financial capability of the bidder based on the net worth should be at least equal to or more than the cost of 15 Drill in the range of 900–4,118 meters. 16 Drill in the range of 1,100–2,850 meters. 17 Drill in the range of 1,550–1,950 meters.
Chapter II, Performance reviews relating to Government companies
83
MWP of phase I. The consortium net worth18 was US $ 60.05 million (` 291.18 crore at prevailing rate of ` 48.49/US $) against the estimated cost (both drilling and seismic) of phase I of US $ 59.23 million (` 287.21 crore at prevailing rate of ` 48.49/US $). We, however, observed that the estimated cost of phase I was worked out at lower side and, if the cost of hiring rig and associated services that prevailed at the time of submission of bid (August 2002) was considered realistically, the estimated cost would have been US $ 169.270 million19 (` 820.79 crore at prevailing rate of ` 48.49/US $) i.e., almost three times more than the cost projected (US $ 59.23 million) at the time of submission of bid. Further, the Company was supposed to have considered the possible escalation in the cost for the wells to be drilled over the period of two and half years for phase I. If cost of phase I work was estimated properly, then the estimated cost would have been much higher than what was quoted at the bidding stage and the consortium would have been ineligible for bidding. Further, the actual average cost incurred by the Company for drilling per meter was seven times higher at US $ 16,834 (` 7.65 lakh at prevailing rate of ` 45.44/US $), against the estimated cost US $ 2,254 (` 1.02 lakh at prevailing rate of ` 45.44/US $). This confirms the fact that the proper estimation of cost for the phase I was not made at the time of bidding. Though the Company had no experience as operator of an offshore block, it had hastily committed to drill wells with a depth ranging from 900 to 4,118 meters and had finally drilled 16 wells with depths ranging from 2,535 to 6,007 meters (i.e., 1.46 to 2.81 times than the estimated depth). The actual time taken against estimate and related extra expenditure are discussed in paragraph no. 2.2.20.
The actual total cost incurred including cost of seismic study (US $ 101.98 million) was US $ 1,404.86 million (` 6,265.68 crore at the average rate of ` 44.60/US $) for exploration activity of all the three phases which was 12.81 times (in terms of US $) the estimated cost of US $ 109.70 million (` 531.94 crore at prevailing rate of ` 48.49/US $). This indicated the aggressive approach adopted by the Company while bidding for the block, which in turn reveals the undue risk taken by the Company in the high risk prone oil exploration activity.
The Management stated (September 2011) that the KG block was offered under NELP-III in March 2002 by which time the Company had an experience of 10 years in the field and was looking to expand its acreage base for carrying out further exploration activity. Accordingly, having assessed the high potential of KG offshore block with an estimated reserve of 45 TCF, keeping in view the interest shown by other bidders such as ONGC, RIL, etc, and the 60 per cent weightage assigned to MWP in evaluation of bidding, the Company adopted aggressive bidding in terms of MWP and could secure the block for the consortium. If aggressive bidding had not been adopted, the consortium would not have got the high potential KG block.
18 Net worth – the Company US $ 52.70 million; GGR US $ 1.30 million and JEL US $ 6.05 million. 19 Cost of hiring a rig US $ 61,800 per day plus Cost of associated services US $ 30,900 per day × 2 rigs
× 913 days required to drill 33,098 meter as per Minimum Work Programme submitted at the time of bidding.
Against the estimated exploration cost of US $ 109.70 million the actual cost was US $ 1,404.86 million which was 12.81 times higher than the estimated cost

Audit Report No. 4 (Commercial) for the year ended 31 March 2011
84
Thus, the fact remains that aggressive bidding for KG block was made without properly assessing the technical and financial issues before bidding for the block. Further, due to adopting aggressive bidding in obtaining KG block, the Company was not only exposed to high risks in exploration activity but it also had to highly depend on borrowing. The unsecured borrowings of the Company on this account, have already increased by ` 2,140.53 crore during 2006-11.
Incorrect geological model for bidding for KG block
2.2.16 Having succeeded in bidding for the KG block, the Company, JEL and GGR entered into (August 2003) a joint operating agreement (JOA) among themselves. Further, the Company as Operator of the block admitted GGR into consortium with 10 per cent PI in the block on the ground that GGR was a technical expert in the exploration field. On behalf of GGR, the Company contributed GGR’s share of 10 per cent to the venture fund set up for the exploration expenditure of KG block. The said contribution made by the Company in the form of advance was recoverable from GGR only if the activities in the block succeeded. Otherwise, GGR would not be paying their share of contribution. Though the services of technical expert could be measured and determined in monetary terms, the Company admitted GGR with 10 per cent PI without any basis. Further, the Company also suffered a loss of interest of ` 11.43 crore (August 2003 to March 2007) due to remitting the GGR’s share of cost (` 149.53 crore) into the venture fund till March 2007. These aspects had already been reported vide paragraph 3.5 of the Audit Report 2006-07 (Commercial)-Government of Gujarat.
Our analysis further revealed that the bidding for KG block was made as per the geological model prepared by GGR. As per the geological model, of the 20 wells planned under MWP, four wells having High Pressure High Temperature (HPHT) (i.e., deeper than 4,000 meter) were to be drilled. But in reality, Company had to drill total 12 HPHT wells as against the four wells estimated. This was indicative of the deficient geological model prepared by GGR, which led to escalation in the cost of exploration phase from US $ 109.70 million (` 531.94 crore) to US $ 1,404.86 million (` 6,265.68 crore).
2.2.17 In order to review the geological model of GGR and also to provide technical services for KG block, the Company had to engage (April 2004) another technical expert viz., Petrotel, USA at a cost of US $ 0.60 million i.e. ` 2.64 crore (` 44/US $ as in April 2004). Thus, admitting GGR into the consortium without any financial risk, but only on the strength of their technical expertise did not yield the desired purpose.
Further, the terms agreed with GGR in JOA, did not permit the Company to recover the share of GGR on the exploration cost incurred during the currency of exploration phase, even though the actual exploration cost incurred for the block was 12.81 times more than the estimated cost, as discussed in the previous paragraph. Moreover, the Company suffered a loss of interest of ` 104.14 crore20 due to remitting the share of cost of US $ 175.07 million 20 Calculated at the Company’s year-wise average borrowing rate prevailed during 2007-11.
Incorrect geological model of GGR led to escalation in exploration cost from US $ 109.70 million to US $ 1,404.86 million
Incurring of exploration cost without receiving the share of JV partner led to loss of interest of ` 104.14 crore
Chapter II, Performance reviews relating to Government companies
85
(` 780.81 crore at the average rate of ` 44.60/US $) of GGR into the venture fund during April 2007 to March 2011. As per the Company’s estimate, the production in the KG block would start in the year 2013.
The Management stated (September 2011) that at the time of NELP-III bidding, the Company was looking for an expert who could evaluate the block and recommend a potential block for bidding. Mr. Jean Paul Roy of GGR, being a technical expert in the field, was admitted as a JV partner for the block. He would not have agreed to solely carry out a technical evaluation of the block for bidding without being offered a Participating Interest (PI) in the block. Further, based on then existing 2D seismic and well data, GGR prepared a geological model which demonstrated the possibility of establishing significant hydrocarbon resources in KG basin and the model was the basis for the Company bidding.
Regarding the reasons for the escalation in the exploration cost based on the geological model of GGR, it was stated that against the estimated four HPHT wells, while drilling the Company encountered HPHT conditions in 12 wells leading to increase in the drilling cost. Further, increase in the crude oil price led to severe shortage of rig which had also led to increase in the hiring cost. For engaging Petrotel to review the geological model of GGR, it was stated that as an established industrial practice, second opinion was also obtained on the model in the context of 3D seismic data subsequently acquired.
The reply is not tenable. The Company’s contention that Mr. Roy would not have agreed to carry out the technical evaluation without a PI being offered to him was an invalid apprehension not supported by any documents. The Company’s record clearly indicated that the geological model of GGR had failed in respect of well depth estimate, its location and exploration cost estimates. Hence, Petrotel was engaged to thoroughly revise the geological model of GGR.
Exploration
2.2.18 Based on the commitments made in the MWP of PSC and also on the basis of his rights and responsibilities as defined in the Joint Operating Agreement entered with his JV partners, the operator of a block undertakes the activities during exploration phase with the approval of the Members of Operating Committee (OC)21 and Management Committee (MC)22. The exploration phase covers the activities starting from (i) conducting of preliminary environment impact study (EIS) for preventing/ minimising the environmental damages and also the consequential effects thereof on property and people caused by the effect of petroleum operation prior to taking up the work of acquisition, processing and interpreting (API) seismic data in the 21 Operating committee (OC) is formed as per the provisions of JOA which specifies procedure for
decision making and frequency and place of meetings. OC consists of representative of operator and non-operating partners of JV. OC will review and approve the work programme and budget and also review the progress of work and submit to MC.
22 Management committee (MC) consists of two GoI nominees and one nominee each from each member of the consortium; in case of no consortium, two members shall be nominated. The main function of MC is to approve the work programme, budget, review the progress of activities and advise the consortium.

Audit Report No. 4 (Commercial) for the year ended 31 March 2011
86
contract area (the awarded block), (ii) reprocessing of available seismic data and also undertake API of seismic data to find the petroleum traps from the images of the sub-surface rock layers, (iii) again conducting EIS in the specific areas identified for drilling prior to taking up the drilling of exploratory wells to reassess the possible impact on the environment due to impending drilling operation, (iv) drilling of exploratory wells to find new gas or oil reserves, (v) promptly intimate MC and GoI on the discovery of hydrocarbons prior to taking up the testing of the well so that, if required, GoI could send its representative for witnessing the testing of the well being carried out to determine whether the discovery is of potential commercial interest, (vi) preparation and execution of appraisal programme to carry out an adequate and effective appraisal to determine whether the discovery is a commercial discovery and also to determine the boundaries of the area to be delineated as the ‘Development Area’, (vii) declaration of commercial viability of the discovery and devising the development plan for taking up the development activity of the block. The approval of OC and MC is required for undertaking the above activities so that the cost incurred on the activities would become eligible for recovery as a contract cost. Our observations related to the exploration phase are discussed below:
Delay in carrying out environment impact studies
2.2.19 According to Article 14.5 of the PSC, the Company was required to carry out environment impact studies (EIS) through persons having special knowledge on environmental matters in order to determine the prevailing situation relating to the environment, human beings and local communities, the flora and fauna in the contract area and in the adjoining or neighboring areas and establish the likely effect of exploration activities on the same. Article 14.5.1 stipulates that the preliminary part of the EIS should be concluded prior to commencement of seismographic study and final part should be concluded prior to starting the drilling of wells in the exploration phase. The timely completion of EIS is necessary, so that other exploration activities could be taken up and completed within a period of five to seven years as prescribed in PSC.
During 2006-11, of the nine domestic blocks where the Company was operator, in eight blocks, the time taken for completing pre-drilling EIS since award of work, ranged between 14 and 106 months as given in column no. 9 of Annexure-12. As can be seen from the Annexure-12, in three blocks viz., Tarapur, Unawa and Ahmedabad, the time taken for completing EIS was more than 60 months though all these blocks were located onshore. The inordinate time taken in completing the EIS lacked justification.
The Management stated (September 2011) that the process of EIS preceding the drilling activity could be initiated only after finalisation of the location for drilling based on the seismic study. Further, the EIS would be conducted separately for each phase and not for the block as a whole and the EIS process also included public hearing. All this led to taking of considerable time in completion of EIS. In case of Tarapur, Unawa, and Ahmedabad blocks, the drilling work program was firmed at a later date and accordingly pre drilling EIS was taken up.
Time taken for completing pre-drilling EIS ranged between 14 and 106 months

Chapter II, Performance reviews relating to Government companies
87
The reply is not tenable as the reasons for delay put forth by the Company are of routine nature normally involved in the process. However, the reply brings out the fact that abnormal delay was caused on account of delay in firming up the location by the Company for drilling activity, which is indicative of ineffectiveness of the study works carried out by the Company.
Time and cost overrun in drilling of offshore wells
2.2.20 In offshore block, KG block was the only block wherein the Company as an operator carried out the drilling of exploration wells. As referred in paragraph no 2.2.14, the Company drilled 16 wells during July 2004 to April 2010 by deploying four rigs at different periods of time in KG block. Our analysis of actual time taken against the estimated time for drilling work revealed that as per the drilling plan, the well should be drilled at the rate of 27.76 meters per day. However, a total depth of 77,395.07 meters of 16 wells was drilled in 3,441 days i.e., at the average rate of 22.49 meters per day. As a result of short drilling of 5.27 meter depth per day, the Company had deployed rigs 653 days in excess of estimated days resulting in extra expenditure of ` 180.91 crore23 on drilling work. This indicated that the management of drilling operation was not properly monitored.
The Management stated (September 2011) that the KG field was a unique field and due to High Pressure High Temperature (HPHT) conditions in the deeper reservoir, the drillability of the well was very poor which led to decrease in the average drilling rate per day against the rate estimated in the drilling plan.
The reply is not acceptable as the facts of unique field conditions/ HPHT wells were already taken care of at the time of preparing the drilling plan by the Company.
Drilling of exploratory well in area belonging to other operator
2.2.21 The Company is operator in onshore block in CB-ON/ 2 (Tarapur) in which the Company has PI of 80 per cent and GGR has 20 per cent. In the nearby block i.e., North Kathana Field (NKF), the Company was a non-operator with PI of 70 per cent while other JV partners have PI of 30 per cent. Heramec is the operator for NKF block. The Company drilled (February 2005 to April 2009) 36 exploratory wells in the Tarapur block, of which one exploratory well TS-8 was drilled during June to August 2007 at a total cost of ` 10.54 crore and proved to be oil bearing. The Company, however, subsequently noticed (December 2007) that the well TS-8 was drilled in the neighboring NKF block instead of within the boundaries of Tarapur block. In view of this, the Company handed over (19 March 2008) the well along with cost to Heramec, the operator of NKF. For regularising the induction of TS-8 under NKF block, the Management Committee of NKF deliberated (13 February 2010) on the issue including the representatives from MoPNG, DGH. However, the representative of MoPNG in MC instructed (February 2010) Heramec not to book the expenditure in the JV’s account of NKF till the issue was resolved. 23 Calculated at the least rate of rig hiring charge US $ 61,800 per day paid by the Company converted at
the average rate of ` 44.83 per US $ prevailed during the period 2004 to 2009.
Against the estimated drilling rate of 27.76 meters per day, the average rate of drilling was 22.49 meter per day which led to extra expenditure of ` 180.91 crore

Audit Report No. 4 (Commercial) for the year ended 31 March 2011
88
We observed that the Company did not investigate and fix the responsibility for drilling the well in the adjacent block viz. NKF block where the Company was not an operator. Thus, due to the Company’s laxity, a well was drilled at a wrong place which not only resulted in loss of interest of ` 3.94 crore24 on the blocked up fund (August 2007- March 2011) but also exposed the Company to financial loss due to not resolving the issue of recovery of the expenditure of ` 10.54 crore incurred on drilling the well.
The Management stated (September 2011) that the well was drilled in a wrong place due to ambiguity in geodetic projection system25. However, appropriate follow up action had been initiated with DGH and Heramec and the issue would be put up in the next MC meeting.
Thus, the fact remains that due to Company’s laxity, the well was drilled without proper verification of the map made out from geodetic projection system.
Hiring of Jack up rig from Premium drilling
2.2.22 The Company invited (March 2007) tender for deployment of Jack-up rig26 to take up the drilling activities in KG block. The technical specification of the tender stipulated for using the drill pipe grade of S-135. The Company awarded (April 2007) the work to Premium Drilling Inc., USA (rig operator) being the only qualified bidder. Though in the technical bid, the rig operator offered S-135 drill pipe grade suitable for the work, the Company while entering into agreement, accepted the drill pipe of lower grade of XD 105 as subsequently offered by the rig operator in deviation from the technical specification.
However, when the drilling work commenced in May 2007 with the use of low grade XD 105 pipe, the Company encountered the problems of additional drilling, logging, casing running, etc. Resultantly, the Company decided (March 2008) to use the drill pipe S-135 as per the original specification in the place of XD 105 grade pipes. Accordingly, rig operator replaced (May 2008) the XD 105 grade pipes with S-135 grade pipes for which the Company had to bear extra expenditure of US $ 89,330 (` 38.14 lakh at prevailing rate of ` 42.70/US $) towards transportation cost. However, the extra cost other than the transportation cost incurred by the Company on above account could not be quantified in absence of the required details in this regard. As S-135 grade pipe was specified in the tender based on the site requirement, the Company should have insisted that the rig operator mobilised the same grade pipes while commencing the drilling activities. The Company’s failure to insist for the grade pipes specified lacked justification.
The Management stated (September 2011) that the rig was readily available from nearby RIL block. As it would be easy for mobilising the rig to the 24 Calculated on ` 10.54 crore at the average borrowing rate ranging between 6.64 to 14.10 per cent
prevailing during the period. 25 A map projection of geodetic reference system indicates shape, size, position and orientation of
(mathematical) reference of surface (e.g. sphere or spheroid). 26 A Jack-up rig is a type of mobile platform to stand still on the sea floor resting on a number of
supporting legs.
Drilling of well at a wrong place led to blocking up of the funds of ` 10.54 crore and also loss of interest of ` 3.94 crore
Chapter II, Performance reviews relating to Government companies
89
Company’s block, the XD 105 grade drill pipes which were on the board of the rig were accepted. Though the work was stuck up twice while drilling, but it had occurred due to hole condition of the well and not due to use of XD 105 grade drill pipes.
The reply is not tenable. The Company should have insisted that the rig operator should bring equipment and drill pipes at his cost as per the specifications while mobilising the rig to the Company’s block. The Company’s records indicated that XD 105 grade drill pipes had technical limitations for use in deep directional wells which were being drilled in the Company’s block.
Unfruitful expenditure on civil works
2.2.23 The Company as operator of Ankleshwar onshore block was to drill 14 exploratory wells during April 2006 to March 2009 as per MWP of exploration phase I. Accordingly, it had taken up the work of drilling five wells during May 2008 to August 2008 and had also simultaneously acquired necessary land to drill another six27 wells. Out of the five wells drilled, four wells were dry and the Company decided (August 2008) to take up the drilling of the proposed six wells only after reassessing the feasibility in continuing the work based on the study of drilled well data with 3D seismic data. However, the Company went ahead with civil work on the site for the proposed six wells and incurred expenditure of ` 1.65 crore during July to September 2008 even without the approval of other JV partners in Operating Committee (OC) meeting. Finally, in April 2011 the Company decided to drop the work in the site acquired for the six wells. As per the Company’s estimation, the execution of civil work (earthwork and masonry) would have hardly taken 25 days, hence, it should not have incurred expenditure of ` 1.65 crore hastily. Rather it should have taken up the work at the site for six wells only after re-assessing the feasibility results of the five drilled wells. Further, as the work was executed without the approval of the JV partners, they refused to admit (October 2010/January 2011) the Company’s claim for this expenditure.
The Management stated (September 2011) that as the phase I of the exploratory period was to expire and the extension for the phase had been applied, these locations were taken up for initial staking and civil work so as to complete the MWP within the time. Further, the Company had sought concurrence of the OC for this expenditure and approval was awaited.
Thus, the fact remains that the Company went ahead with site preparation work of the proposed six wells against its own decision of August 2008 and also without the approval of OC.
Wasteful expenditure on drilling
2.2.24 We observed a similar instance in Sanand–Miroli onshore block, where the Company was operator. The Company decided (August 2008) to drill exploratory well viz. SE-11 in the block. Another well viz. SE-6 was also to be drilled in the block based on the success result of SE-11. The SE-11 was 27 Ank-2, 6, 11, 22, 23 and 27.
Expenditure of ` 1.65 crore on civil work incurred against the Company’s own decision and also without OC approval remained unfruitful
Audit Report No. 4 (Commercial) for the year ended 31 March 2011
90
drilled (September-October 2008) and on completion of testing there was no hydrocarbon finding (February 2009). The Company, however, without waiting for the test results of SE-11, executed (January 2009) the civil work at the cost of ` 44.21 lakh in the proposed site for well SE-6. Since the result of SE-11 was a failure, the Company never drilled the proposed SE-6 well. Thus, disregarding of its own decision led to incurring of unfruitful expenditure of ` 44.21 lakh.
Non fixation of norms for testing of wells
2.2.25 The ‘Objects’ in the well are identified before starting the process of testing. The object in oil exploration activity means the zone of interest to find the possible presence of hydrocarbon. Then, the wells drilled are tested by conducting the drill stem test. Under this procedure, an instrument viz., Sonde (which remotely senses the electrical/ radioactive properties of rocks and their fluid) is sent into the well to obtain important sampling information on the formation of fluid so as to establish the probability of commercial production. Normally, one to six ‘Objects’ are identified in a well for testing. As a prudent practice, the Management should fix the norms with reference to the time required for testing the ‘Objects’ in the well. However, the Company had not fixed any such norms.
We observed that during 2006-11, the Company tested 212 ‘Objects’ in 79 onshore wells and 37 ‘Objects’ in 13 offshore wells in the blocks where it was the operator. Huge variations were, however, noticed in the time taken in conducting the object tests in the wells. The time taken for testing per object in the onshore wells varied from one to 43 days, whereas it ranged from 12 to 33 days in offshore wells. In the absence of fixation of any norms for time for testing the ‘Objects’, we are not in a position to comment on the reasonability of the time taken in testing the above ‘Objects’. As the equipments used for testing are hired on hourly basis, it is all the more important to fix the norms regarding time for testing so as to control the testing cost. An instance of fruitless expenditure incurred in testing a well is discussed in the succeeding paragraph 2.2.26 below.
The Management stated (September 2011) that the main objective of testing of well was identification of mobile fluid (oil, gas and water). If the mobile fluid was identified, further test for measuring the pressure would be taken up; otherwise, the test would be discontinued. In view of this, the variance was bound to be there in the duration of testing period and hence no norm was fixed.
The reply is not tenable. It is possible for the Company to fix the norm for testing the wells based on its experience and analysis of the data relating to testing of wells as has been fixed and followed by Oil and Natural Gas Corporation Limited, a central PSU engaged in the similar activities.
Fruitless expenditure in testing a well
2.2.26 The Company is operator in onshore block, CB-ONN-2002/3 (Sanand-Miroli) block. It drilled exploratory well viz., SE-2 with a depth of
No norms were fixed for testing of objects in the well. The time taken for testing per object was ranged from 1 to 43 days in onshore wells
Chapter II, Performance reviews relating to Government companies
91
2,470m in September 2007; based on the tests results, the Company identified (October 2007) three ‘Objects’ from bottom of the well viz., Object 1 (2,303-2,311m and 2,313-2,317.5m), Object 2 (1,890-1,900m) and Object 3 (1,683-1,695m and 1,630-1,651m). As per the industry practice in vogue, in the casing string28 cemented to the sides of the well, the holes called perforations are made by shot to reach to the producing formation. The process of perforation starts from the ‘Objects’ identified at the bottom of the well and moves to the ‘Objects’ identified at the middle and then top of the well. This approach is economical and technically feasible. The Company, instead of taking up the perforations of SE-2 well starting from Object 1 to 3, had taken up and completed only Object 2 and 3 (i.e. only on the middle and top of the well). After perforation of Object 2 and 3, it was found that both areas were of litho logically ‘Olpad formation’29 and Object 2 was of dry zone and Object 3 had insignificant hydrocarbon presence which neither had any self flow nor had shown any improvement even after performing the process of ‘hydraulic fracturing’30.
The workover rig31 (i.e. John 50 VII) after execution of perforations work at Object 2 and 3 during 26 October to 3 November 2007 moved from SE-2 well to SE-4 well. The Company, having no justification on record, had moved the rig again back to SE-2 well and performed (3-8 February 2008) the perforation works on the Object 1 of SE-2. After the perforations were done at the cost of ` 21.83 lakh (including the cost of mobilisation and demobilisation of the rig) on the Object 1 of SE-2, it was found that the zone was ‘Olpad formation’ and was water bearing.
The expenditure of ` 21.83 lakh incurred was avoidable, because the Company had already noted the poor results in Object 2 and 3 of SE-2. Under the circumstances, the Company’s decision to perform the perforation on Object 1 of SE-2 again by mobilising the rig and incurring the cost was neither technically sound nor in consonance with the best practices in the industry.
The Management stated (September 2011) that as the Object 1 was having least potential, the perforation was done at Object 2 and then at Object 3, thereafter the rig was mobilised to SE-4 to test the interesting zones identified. The rig was mobilised back to SE-2 to test the remaining left out Object 1.
The reply is not tenable. The Company skipped the Object 1 being least potential object of SE-2 and mobilised the rig to SE-4 well. The reason given for incurring avoidable expenditure on re-mobilising the rig to SE-2 for taking up the perforation work on its least potential Object 1 was therefore not convincing.
28 Joints of steel pipes screwed together to form a casing string. 29 A formation is a mapable rock layer with definite top and bottom. Geologists have divided all
sedimentary rocks into formation. A well was drilled in Olpad area in 1969 and the formation was named after the area i.e. Olpad formations.
30 An engineering method used to increase the permeability (i.e., the ease with which a fluid can flow through a rock) of a reservoir around the wellbore to increase production. Under this method liquid under high pressure is pumped down a well to fracture the reservoir rock adjacent to wellbore.
31 A portable rig is with a mast and hoisting system used for testing, maintaining, restoring or improving production from a well.

Audit Report No. 4 (Commercial) for the year ended 31 March 2011
92
Delay in putting up Declaration of Commerciality to Managing Committee
2.2.27 The Sanand-Miroli onshore block consisted of two parts i.e., Northern Sanand area and Southern Miroli area. During the exploration phase (July 2004 to July 2010), in Northern Sanand area, the Company drilled 11 wells32 (i.e., 9 exploratory wells and 2 appraisal33 wells). Of the wells drilled, oil discoveries were made in five wells i.e. SE-2, SE-4, SE-5, SE-8 and SE-10, of which a cluster consisting of SE-2, SE-4, SE-5 (oil wells) and SE-3 (gas well) were to be developed for production.
We observed that declaration of commerciality (DoC) for the cluster as per Article 10.5 of PSC was submitted to MC on 31 July 2010 for consideration by MC members. The Company being Operator of the block was designated as Secretary of MC under Article 6.4 of PSC and was required to ensure timely placement of the relevant issues in the MC meeting for their approval. However, the issue of DoC was placed belatedly in the MC meeting on 31 July 2011 (i.e., after a period of one year since the submission of DoC). We observed that the DoC submitted on 31 July 2010 was not properly prepared by the Company. DGH had sought clarification on various issues which led to delay in putting up the DoC in MC meeting. The delay in submission of DoC in MC meeting has a consequential effect on preparation and submission of field development plan34 (FDP) and taking up the development work.
Construction of fixed platform in KG block by another operator
2.2.28 The Company submitted (June 2009) a Field Development Plan (FDP) for the discoveries viz., Deen Dayal West (DDW) located in south west of the KG block (Shallow water35) for 17 sq. km. The FDP for DDW field was approved (November 2009) by DGH with envisaged commencement of production from December 2011 that was revised to June 2013.
Reliance Industries Limited (RIL), a private sector enterprise was developing (May 2004) KG-DWN-98/ 3 block (RIL block) (Deep water36) located adjacent to the KG block with water depth up to 2,700 meter. RIL sought (December 2003) the Company’s consent to acquire soil data/ survey/ investigation related to pipe line route/ platform/ Pipe Line End Manifold in the KG block. The Company in principle agreed for the request stating (January 2004) that it had no objection for RIL’s sub-sea pipeline route or Shallow Water Pipeline End Manifold (SWPLEM) in KG block. However, it requested for discussion to mitigate any mutual issues that may come up based on Company’s exploration/ development plans.
32 Exploratory well-SE-2, SE-4, SE-3, SE-5, SE-8, SE-9, SE-10, SE-11 and SE-14 and Appraisal well-
SE-8A1 and SE-8A2. 33 Appraisal well – A well drilled to measure the size/quality (commercial potential) of a hydrocarbon
discovery. Before development, a discovery is likely to need several such wells. 34 It contains the proposal for construction, establishment, and operation of all the facilities and services
for and incidental to the recovery, storage and transportation of the petroleum from the proposed field to the delivery point.
35 A block with water depth up to 400 meters. 36 A block with water depth exceeding 400 meters.

Chapter II, Performance reviews relating to Government companies
93
Though the Company had, in-principle, agreed only for laying of RIL’s sub-sea pipeline route or SWPLEM through KG block. RIL, unilaterally started installing (January 2007) Control and Riser Platform (CRP) complex, in addition to pipeline in KG block. By this time, the Company had discoveries in two wells (June 2005 and July 2006) in DDW field. The Company expressed (January 2007) concern to RIL stating that the in-principle approval was given only for laying pipeline in KG block, and the additional works including CRP had cut the Company’s development plan and it could not afford to have the discovered DDW field severed in parts. In response, RIL expressed (February 2007) its inability to make any change in its work plan on the plea that the above development was based on no objection certificate (NOC) received from the Company and also approval given by DGH. Whereas, no copy of the approval by DGH was available in the records of the Company.
We observed that if RIL wanted to have the platform in their deep water block, it could go only for a floating platform which would have involved very high capital cost in comparison to the cost of fixed CRP constructed in shallow water block (KG block) of the Company. Thus, RIL constructed CRP through encroachment into Company’s KG block in a well planned manner and was unduly benefitted at the cost of the Company, the extent of which was not quantifiable in the absence of required details.
We further, observed that as per Rule 7 of the Petroleum and Natural Gas Rules, 1959, every lessee has to construct and maintain structures necessary for production and does not have the right to transfer the title and interest of the lease without the written consent of GoI. However, no such consent was obtained by the Company before giving in-principle approval to RIL. Further, as per the mining lease conditions, the Company would be responsible for safety and security of all structures in its block and, therefore, it would also be responsible for RIL’s structures for its life period.
The Management stated (September 2011) that the issue of RIL putting up their surface facilities at KG block did come up when the block was only under exploration lease with the Company. Since the Company did not have any mining lease for the block at that time, it did not have any right on any matter concerning the block except exploration of sub-surface reservoirs in the block. The block continued to be the property of GoI and RIL was using above ground part of the block. The mining lease for the block was granted to the Company only in August 2010. By that time, the surface facilities of RIL had already been established. However, RIL’s putting up their structure in the block had neither affected the developmental activities nor the production plan of the Company. Further, any Contractor, including RIL, would require an approved FDP to start production of oil/ gas. This implied that structures, including the CRP, had the approval of the MC consisting of members from GOI and DGH. Hence, the Company being a contractor cannot override the decision, which had implicit Government approval taken in national interest.
The reply is not tenable. Even in the exploration license issued to the Company for the block in March 2003, it was stipulated that the license issued was subjected to the provisions of PNG Rules. As per the Rules, necessary
No consent was obtained from GoI by the Company before giving in -principle approval to RIL for laying pipeline/ CRP in area of the Company’s KG block

Audit Report No. 4 (Commercial) for the year ended 31 March 2011
94
approvals should have been specifically obtained from GoI by the Company, before giving in-principle approval to RIL. Thus, the in-principle no objection granted by the Company for putting up the RIL structure in January 2004 was in violation of PNG Rules. Further, as RIL had established fixed CRP in Company’s KG block, the Company cannot avoid obtaining RIL’s prior consent/ NOC before taking up any development activity in the KG block surrounding CRP. An instance of extra expenditure incurred by the Company due to delay in giving consent by RIL for carrying out the development work in KG block has also been discussed in succeeding paragraph 2.2.29.
Payment of idle charges due to restriction of RIL in KG block
2.2.29 In KG block, in order to acquire 3D seismic data with more accuracy and reliability for drilling the wells in the DDW field (proposed development phase), the Company decided (August 2008) to go for Q-marine survey37 for accurate and reliable seismic data. Accordingly, the Company issued (December 2008) the Letter of Award (LOA) to Western Geco International Limited, United Kingdom (WGIL) for acquiring 3D seismic data covering 474 sq. km on Q-marine technology basis. While the work was under execution, some portion of the area marked for API work was not free due to pre-occupation of four working rigs of the Company and also due to the Control and Riser Platform (CRP) put up by RIL as discussed in preceding paragraph no. 2.2.28. Hence, a specially equipped vessel was required to be deployed to acquire the seismic data beneath the rigs and CRP through the process of undershooting38. Accordingly, the Company issued (3 January 2009) LOA to WGIL for mobilising the special vessel and the work was also taken up from 27 January 2009. Though, RIL agreed (4 February 2009) to the Company’s request for issue of NOC to take up the undershooting work on 15 February 2009 in the area beneath their CRP, RIL prolonged and gave clearance only on 21 February 2009 to take up the work. As a result, the work could be completed on 24 February 2009 with a delay of 7.767 days39 resulting in avoidable payment of day rate for the vessel amounting to US $ 1.24 million40 (` 5.76 crore @ ` 46.39/US $). Thus, the Company’s failure to prevent RIL in putting up the CRP in the KG block, subsequently necessitated the Company to seek and wait for RIL’s NOC for taking up the undershooting work in the Company’s area resulting in avoidable payment of idle charges amounting to ` 5.76 crore.
The Management stated (September 2011) that the Operator who carries out exploration/ development activities within a block has to seek approval of the other operator to avoid any damage to other operator’s structure in the block. Accordingly, the Company sought the permission from RIL whose facilities in the form of CRP were already installed in its block.
37 Q-marine survey is propriety technology owned by Western Geco. In the Q technology, the electronics
and fibre optic networks provide very high channel count recording systems which ensure acquisition of accurate reliable seismic data.
38 It is the process of making a 3D seismic image of the subsurface of an area without the seismic equipment ever being on that land.
39 The delay attributable to RIL as worked out by the Company. 40 At the actual day rate of US $ 1,59,757.50 for 7.767 days converted at the actual exchange rate of
` 46.39 per US $ prevailing on the date of payment on 14 September 2010.
Existence of RIL’s CRP in the Company’s block and consequential necessity for obtaining the consent of RIL for executing the Company’s work in its own block led to avoidable payment of ` 5.76 crore

Chapter II, Performance reviews relating to Government companies
95
Thus, the fact remains that the Company’s failure to prevent RIL in putting up the CRP in the KG block led to the avoidable payment of idle charges as cited above.
Infructuous expenditure on wells drilled without DGH approval
2.2.30 The Company and Heramac hold PI of 70 and 30 per cent respectively in Unawa block. The Company is the operator for the block. In the Operating Committee (OC) meeting (19 May 2008) of the block, it was decided to drill one development well (UN-1A) and to start drilling work in another development well (UN-2A) based on the results of UN-1A. Accordingly, UN-1A was drilled (1-22 July 2008), and the test results of the well showed that the well was water bearing. The Company, however, with the concurrence of Heramac in OC meeting (31 July 2008) but without the approval of MC decided to drill appraisal well UN-2A. The well UN-2A was drilled (31 July 2008 - 8 August 2008) and the work was terminated after drilling up to the depth of 750 meters against the planned depth of 2,100 meters, without any reason. DGH, however, did not approve the drilling work of UN-2A as it was taken up without MC approval. As a result, the expenditure of ` 2.75 crore incurred on the work was not eligible for cost recovery under Article 15 of PSC. Drilling of UN-2A well without approval of MC lacked justification.
The Management stated (September 2011) that the drilling of UN-2A had been taken up based on the interpretation of mud logging and wire-line logging data results of UN-1A obtained initially and the final test result of UN-1A was received later. As the result was unsatisfactory, the drilling of UN-2A was terminated forthwith. The issue of approval had been referred to MC and DGH and was pending with them.
Thus, the fact remains that the Company went ahead with drilling of UN-2A without waiting for the test results of UN-1A ignoring its financial interests.
Non abandonment of wells
2.2.31 As per the special conditions included in the environmental clearance given by the Ministry of Environment and Forest, (MoEF) under EIA notification of 2006, in the event that no economic quantity of hydrocarbon is found, the Company should implement a full abandonment plan at drilling site in accordance with the Regulation 59 of Oil Mines Regulations, 1984 to bring the unviable well area to pre-existing local environment. We observed that the testing of 26 wells (exploratory and appraisal wells) were completed during November 2006 to October 2010 in four blocks as per the details given in the Annexure-13. As per the test results, the wells were neither dry nor had any presence of hydrocarbon for commercial exploitation. However, even after expiry of 166 to 1,610 days since completion of tests, the wells were not abandoned to bring it to pre-existing local environment (31 March 2011). The non compliance to the Regulation lacked justification. Further, the drilling of well PK-6 in Ahmedabad block and TS-5 in Tarapur block were completed in January 2004 and June 2007 respectively. However, neither the testing of the wells was carried out nor were the wells abandoned. Reasons for not testing the wells were not on record. Further, the non abandonment of the wells for a
A well drilled without MC approval at the cost of ` 2.75 crore was not eligible for cost recovery as DGH did not approve the drilling work
Even after expiry of 166 to 1,610 days since completion of tests, 26 wells were not abandoned to bring it to pre-existing local environment
Audit Report No. 4 (Commercial) for the year ended 31 March 2011
96
long time may cause environmental damage to local habitation, flora and fauna in the contract area.
The Management stated (September 2011) that the wells could be abandoned only with the approval of OC members. However, the OC members normally haul in all technical data of the dry wells so that no opportunity in terms of hydrocarbon potential was ignored or lost before abandoning the unviable wells. Further, as the exploratory drilling was continued in the blocks, the Company had also considered the possibility of using any such well as injector/ directional well in future while taking up the drilling operation in the nearby site.
The reply is not tenable as the delayed action in deciding the abandonment of failed wells for abnormally long periods may have consequential impact of violating the environmental laws and regulations.
Establishment of hydrocarbon prospectivity in the operator blocks of Company
2.2.32 As discussed in paragraph 2.2.12, the Company was operator in nine domestic blocks, of which in six blocks41, the Company drilled 109 wells (93 onshore and 16 offshore) as on 31 March 2011. The Company had discovery of hydrocarbons in 54 wells (i.e., 50 per cent) (42 onshore and 12 offshore), which was found to be at satisfactory level. However, no drilling activities were undertaken by the Company in remaining three blocks42 even after lapse of 21 to 58 months from the effective date of PSC for the blocks.
The Management stated (September 2011) that they would complete the drilling programme within the PSC timeframe.
Development
2.2.33 Development activities cover preparation of field development plan (FDP) after declaration of commercial discovery, conducting EIS (second part) with reference to development area, drilling of development wells, obtaining petroleum mining lease from State Government for onshore fields and from GoI for offshore fields, creation of facility for production including installation of platforms, laying of pipelines and other processing facilities. Our observations related to development phase are discussed below.
Non preparation of FDP for Tarapur block and incurring of irregular expenditure
2.2.34 Company as operator should not carry out exploration activities after expiry of exploration period without obtaining extension in exploration period from DGH. In Tarapur block, during the exploration phase (November 2000 to November 2008) the Company as operator drilled 35 wells and found the
41 One offshore viz., KG block (KG-OSN-2001/ 3) and five onshore viz., Unawa, Tarapur, Ahmedabad,
Ankleshwar and Sanand-Miroli blocks. 42One is offshore viz., Mumbai offshore; and two are onshore viz., KG onshore (KG-ONN-2004/ 2) and
Rajasthan.

Chapter II, Performance reviews relating to Government companies
97
presence of commercial oil/ gas in 12 wells. The declaration of commerciality (DOC) to MC and GoI was submitted (April 2008) and all the work committed under MWP in exploration phase was also completed (November 2008). However, the Company, instead of preparing and obtaining the approval of FDP, continued to drill (December 2008) one exploratory well at the cost of ` 9.87 crore and seven appraisal wells43 (relating to exploratory phase) at a total cost of ` 71.25 crore. Hence, MC did not approve (February 2009) the exploratory and appraisal wells drilled after the expiry of exploration period. Further, the JV partner, GGR also did not agree to share the cost of drilling the appraisal wells as the same was incurred without the MC approval. Hence, the Company will have to bear the entire cost of ` 71.25 crore (Company’s share ` 57 crore and GGR share of ` 14.25 crore) in drilling the appraisal wells. In addition, the Company also drilled (October-December 2007) three development wells at a cost of ` 23.17 crore without MC approval.
As a result, the total expenditure of ` 104.29 crore (` 9.87 crore plus ` 71.25 crore plus ` 23.17 crore) incurred for drilling all the wells without MC approval will not qualify for ‘cost petroleum’ (i.e., recovery of cost petroleum) under Article 14 of PSC.
The Management stated (September 2011) that the seven appraisal wells were related to the Tarapur well no. 6 where there was oil discovery and hence would become eligible for cost recovery. Regarding approval of drilling cost of one exploration well, the issue was under examination by DGH and MoPNG.
The reply was, however, silent on irregular drilling of three development wells without approval of FDP by DGH.
Thus, the fact remains that none of the above cited wells had the approval of MC and hence did not qualify for ‘cost petroleum’ so far (August 2011).
Delay in supply of input data for preparation of FEED work
2.2.35 In KG block, having discovered (2004) gas in KG-8 well, the Company decided (December 2005) to bring the gas onshore on fast track basis by devising a plan for creation of facilities, such as, well head platform, pipeline and other facilities. Accordingly, it issued (January 2006) work order to Mustang Engineering Pty. Ltd., Australia (firm A) for taking up Front End Engineering Design (FEED) at a cost of AUS $ 1.687 million i.e. ` 5.85 crore44 with scheduled completion by 2 June 2006. The FEED study involved preparation of design, estimates and tender documents for award of contracts for the creation of above mentioned facilities. For FEED study, metocean data and soil data related to the surrounding of KG 8 well were required. The Company, however, did not supply new metocean data as required by firm A. In August 2006 when the design was prepared by firm A, the Company did not accept the same on the ground that the design suggested 43A well drilled from the side of exploratory well (where discovery is noticed) to assess characteristics
such as flow rate of a proven hydrocarbon accumulation. 44Calculated at ` 34.68 per AUS $ at the prevailing price during placement of work order.
Expenditure of ` 104.29 crore incurred for drilling of wells without MC approval will not qualify for recovery as ‘cost petroleum’

Audit Report No. 4 (Commercial) for the year ended 31 March 2011
98
was heavy and abnormal. Firm A cited (May 2007) that the design was prepared based on certain hypothesis as the Company did not provide metocean data for the study.
Thus, due to Company’s failure in providing the required metocean data to Firm A, the expenditure of ` 5.85 crore incurred for FEED work proved unfruitful.
2.2.36 We observed that the Company re-awarded (6 February 2007) the FEED work to Worley Parsons, Thailand (firm B) at a cost of US $ 1.89 million with the stipulation to complete it within 18 weeks from the date of award i.e., by 12 June 2007. However, the Company belatedly provided the reservoir data in June 2008, which led to delay in completion of work by firm B till March 2009. However, for the delay caused in providing the data, the Company paid US $ 0.40 million i.e. ` 2.07 crore45 towards idle charges to firm B (March 2009) which was avoidable.
The Management stated (September 2011) that initially after issue of order to firm A, the Company supplied (January 2006) metocean data available with it. However, when the new metocean data from M/s. A H Glenn (Consultant) was received in August 2006, the Company did not pass it to firm A, since firm A was on the verge of concluding their design work. Regarding delay in providing reservoir data to Firm B, it was stated that the Company was planning to provide data in March 2007 on the receipt of test results of two wells (KG-17 and KG 15). However, due to significant differences noticed between test results of the two wells, the Company waited to have another test result from well KG-22 and hence could supply reservoir data in June 2008.
The reply is not acceptable as the Company should have ensured availability of new and firm metocean/ reservoir data from consultant before award of work to firm A and firm B.
Development activities in KG-block
2.2.37 In offshore KG block, the Company had eight discoveries in KG-8, KG-15, KG-16, KG-17, KG-19, KG-21, KG-22 and KG-31. The total area of KG block is 1,850 sq. km. consisting of three discovered fields on western, northern, and eastern side of the block. The Company as operator submitted (June 2009) the field development plan (FDP) for two discoveries of western field viz., KG-8 and KG-15 of Deen Dayal West (DDW) field at a total projected cost of US $ 3,069 million (` 13,945.53 crore at prevailing rate of ` 45.44/US $) to MC. The MC approved (November 2009) the FDP envisaged for having 15 wells (conversion of existing 4 exploratory wells and drilling of 11 new development wells), two offshore platforms, 20 km. long pipeline to onshore and setting up of onshore gas terminal. It was also planned to start the production by December 2011.
We observed that the Company had finalised the contract for construction of offshore platform and submarine pipeline in April 2011 and June 2011
45Calculated at ` 51.62 per US $ at the prevailing rate during March 2009.
Failure to supply the required data for FEED work led to incurring of infructuous expenditure of ` 5.85 crore and payment of idle charges ` 2.07crore

Chapter II, Performance reviews relating to Government companies
99
respectively, after delay of 12 months46 from the date of approval of FDP. This delay has corresponding impact on commencement of the production activities in the block.
The Management stated (September 2011) that as the price quoted in the single offer received (July 2010) for the work was unreasonably high, the Company had to rework the tendering philosophy afresh. This caused delay in award of the works.
The reply is not acceptable as the invitation of tender for entire work as a whole on lump sum basis had restricted the number of bidders/ offers to bare minimum of one. Company should have invited the tenders by splitting the works into different parts based on the activities/ skills involved as subsequently done by the Company.
Production
2.2.38 The production activities include all the operations conducted for the purpose of producing petroleum after the commencement of production.
Performance of gas and oil producing fields
2.2.39 As discussed in paragraph no. 2.2.12, the Company has total 14 producing blocks. During 2006-11, the total quantity of production of gas and oil from these blocks was 1,929.79 Million Cubic Meter (MM3) and 0.22 Million Metric Tonne (MMT) respectively. The year wise details of production, cost of production, revenue and profit/ loss are given in the table below:
2006-07 2007-08 2008-09 2009-10 2010-11 Total Particulars
Oil Gas Oil Gas Oil Gas Oil Gas Oil Gas Oil Gas Production (Qty) oil in MMT/ gas in MM3
0.03 652.51 0.04 481.08 0.04 359.53 0.06 262.59 0.05 174.08 0.22 1,929.79
Total Sales ` in crore 415.65 323.22 327.35 290.00 207.41 1563.63
Total production exp47 ` in crore
253.89 274.77 268.99 216.44 152.39 1,166.48
Profits (` in crore48) 161.76 48.45 58.36 73.56 55.02 397.15
Source: The Company’s Annual Reports
During 2006-11, the sales from production activity reduced from ` 415.65 crore to ` 207.41 crore (i.e. by 50.10 per cent) due to reduction in production of gas from 652.51 MM3 to 174.08 MM3 in five years period. This reduction was mainly due to depletion of gas in the Hazira block (from 11.8 BCF to 8.6 BCF), which was a producing block since 1994. During the same period, there was an increase in sale of oil from 0.03 MMT to 0.05 MMT due to addition of two blocks viz., Ahmedabad (February 2008) and Tarapur (September 2009). However, the Company would not be in a position to enhance the production of gas/ oil till June 2013 in view of the delay in execution of works of KG block as discussed in paragraph no. 2.2.37. 46As worked out after considering six months for tendering and award of work from November 2009. 47Production expenditure, duties and taxes, foreign exchange loss, depletion cost, others. 48Arrived without reckoning administrative and other expenses, employee cost, interest and finance
charges.
Improper award of work related to development of KG block led to postponement of production activities

Audit Report No. 4 (Commercial) for the year ended 31 March 2011
100
Marketing
2.2.40 The Company also undertakes trading activities by purchasing gas mainly from three suppliers viz., Panna Mukti Tapti JV, Petronet LNG Limited, Hazira LNG Private Limited, etc., and also sells gas mainly to the customers engaged in industrial, power generation and gas distribution activities. The purchase and sale of gas are made with regular suppliers and customers respectively through execution of agreements with them. Besides, the Company also purchases and sells the gas on spot (ad hoc) basis depending on the market scenario. The revenue and expenditure out of gas trading activity during 2006-11 are given below:
(` in crore) Particulars 2006-07 2007-08 2008-09 2009-10 2010-11 Total
Revenue from Trading 2,216.48 3,794.27 5,148.83 3,557.02 4,528.79 19,245.39Expenditure for Trading 2,055.79 3,128.22 4,406.09 3,112.94 4,207.73 16,910.77Surplus/ (deficit)49 160.69 666.05 742.74 444.08 321.06 2,334.62
Source: The Company’s Annual Reports
The major reduction in sales value from ` 5,148.83 crore (2008-09) to ` 3,557.02 crore (2009-10) (30.92 per cent) was mainly due to crash in gas price (ranged between US $ 13.49 to US $ 3.62 per MMBTU50) during 2008-10 in international market (July 2008 to September 2009). This also correspondingly resulted in decrease in purchase value of natural gas from ` 4,406.09 crore (2008-09) to ` 3,112.94 crore (2009-10) (i.e. by 29.35 per cent). Besides, additional inflow of huge quantity of D6 gas of RIL also contributed towards reduction in trading operations of the Company during 2009-10.
During the period 2006-11, however, the total revenue from trading of gas was ` 19,245.39 crore, which was 12.31 times more than the aggregate revenue of ` 1,563.63 crore from sale of own production of oil/ gas during this period. This indicated that Company’s focus during this period remained mainly on trading rather than on production activity.
Non inclusion of Take or Pay clause in gas sale contracts
2.2.41 As discussed in the above paragraph, in the trading of gas, the Company enters into contracts with both suppliers and customers for purchase and sale of gas respectively. The Company is buying and selling the gas both in the unit of SCM51 based on the volume of gas and in the unit of MMBTU52 based on the calorific value of gas. As per the provisions of contracts entered into with the suppliers, if the Company fails to lift the minimum off-take quantity of gas (i.e., 80 per cent of the daily contracted quantity), it has to make penal payment viz. Take or Pay53 (ToP) charges. Simultaneously, to safeguard its financial interest, the Company has to insert similar penal clause 49Arrived at without reckoning administrative and other expenses, employee cost, interest and finance
charges. 50One million British thermal units. 51Standard cubic meter. 52One million British thermal units. 53It is a penal charge recoverable from the customers who had not lifted the minimum off-take quantity
of gas as per the terms of gas sale agreement entered with the Company.
The revenue from trading was 12.31 times more than the revenue from sale of the Company’s own production of oil/ gas

Chapter II, Performance reviews relating to Government companies
101
in the contract entered into with the customers so as to recover the penal charges in the event of short lifting of the minimum off-take quantity of gas by the customers.
We observed that during 2007-11, the total number of customers purchasing the gas ranged from 38 to 47, to whom the Company sold 291.90 crore SCM and 39.91 crore MMBTU as per the contracts entered into with them. Of these, the quantity of gas sold to 25 to 36 customers constituted 59 to 94 per cent of the total quantity of gas sold during the period. The Company, however, did not insert ToP charges penalty clause in the contracts entered with 25 to 36 customers out of total number of customers ranging from 38 to 47 during 2007-11. This was prejudicial to the interest of the Company. We test checked the records made available for the period 2008-11 related to four54 customers with whom the Company entered into gas sale contracts without ToP charges clause. We observed that the Company was unable to levy and recover ToP charges of ` 502.19 crore55 from these customers who did not off-take the minimum quantity of gas as per terms of the contract. For the customers with whom the contracts were entered with ToP charges clause, the Company had recovered ` 6.41 crore ToP charges during 2007-11.
The Management stated (September 2011) that entering into contract without ToP charges clause was becoming an industry practice. Major customers viz., NTPC, IFFCO,etc. normally invite tenders for purchasing gas on non ToP charges basis and the Company’s competitors viz., IOC, BPCL and GAIL also submit their bids on non ToP charges basis to these customers. In such a competitive market, to meet the customer requirement, the Company had to take the commercial decision of selling the gas on non ToP charges basis. This non binding obligation nature of contracts helped the Company to earn profit by entering into short term contracts with willing customers from time to time based on the prevailing price and demand for gas in a dynamic market.
The reply is not tenable. Though the Company was paying ToP charges to its suppliers, it had failed to safeguard its own interest due to non inclusion of ToP charges clause in the contracts entered with its customers. Further, in the absence of such a penal clause, the Company cannot ensure that the customers adhere to the provisions of the contract, as these customers would not have any disincentive that would help to ensure the consistent offtake of gas quantity from the Company.
Passing of undue benefit to Adani Energy Limited
2.2.42 A mention was made in paragraph no. 3.4 of Audit Report 2005-06 (Commercial) - GoG, about the undue favour shown to Adani Energy (Gujarat) Limited (AEL), a private sector enterprise, by the Company for not recovering the minimum charges of ` 1.80 crore for not taking delivery of contracted quantity of gas from the date of commencement of supply as per
54Bhander Power Limited, Torrent Power Limited, Gujarat Industries Power Corporation Limited,
Gujarat State Electricity Corporation Limited. 55Worked out for the shortfall quantity of gas off taken compared to 80 per cent of the contracted
quantity and valued at the weighted average price of gas sold during the respective financial year in respect of four customers.
Non insertion of ToP clause in sale contracts led to non recovery of ` 502.19 crore from the customers who did not off-take the minimum quantity of gas

Audit Report No. 4 (Commercial) for the year ended 31 March 2011
102
the provision of gas supply agreement (GSA). One more instance of passing of undue favour to AEL as observed in audit is discussed below.
During the period 2006-09, 73,70,196 MMBTU quantity of gas was sold to AEL by the Company from the gas purchased on spot purchase basis from Hazira LNG Private Limited. The spot purchase price of the gas was ranging from ` 340.95 per MMBTU to ` 1,075.44 per MMBTU, whereas it was sold to AEL at the price lesser by ` 5.23 to ` 430.79 per MMBTU during the period from 2006-07 to 2008-09 without any recorded reason. This led to passing of undue benefit of ` 70.54 crore at the cost of Company’s revenue.
The Management stated (September 2011) that it was procuring spot gas from three suppliers viz., HLPL56, IOCL and BPCL. The gas procured from HLPL was not only sold to AEL but also to other customers. The price charged from AEL was higher than the weighted average sales price of the spot gas per MMBTU. Hence, no undue benefit was passed to AEL.
The reply is not tenable. The weighted average sales price of the spot gas was arrived at by dividing the total sales price charged from all the customers with total quantities of gas sold. Thus, the average price worked out by the Company does not give a correct picture as it included the sale price of gas charged from other customers (other than AEL) which was higher than the cost. Hence, while arriving at overall results of gas trading activities, higher prices so charged from other customers has nullified the impact of losses of sale of gas to AEL. As such, the gas sold to AEL was procured on spot basis and so the selling price of the gas to any customers including AEL should be more than the purchase price of such gas.
Finance
2.2.43 Efficient fund management serves as a tool for decision making, for optimum utilisation of available resources and borrowings at favourable terms at appropriate time. For the efficient management of fund, the Company should prepare financial budget based on the work programme planned, recover dues from JV partners through cash calls57 and joint interest billing58, raise sales invoices and recover dues along with interest/ Take or Pay charges, if any, applicable from the customers of gas, and make timely payment of statutory dues, dues to suppliers, so as to avoid any penal interest etc. The cash flow statement showing the management of fund during 2006-10 and the instances of the Company’s failure in recovering the dues from customers/ JV partners, payment of avoidable penal interest due to improper tax planning, as observed by us, are discussed in the following paragraphs.
56Hazira LNG Private Limited. 57It means any request for payment of cash made by the Operator, in accordance with an approved work
programme and approved budget to the JV partners in connection with JV operations. 58A statement of the cost and expenditure incurred during the prior month, indicating the amount payable
by the JV partner after considering the advance received from them for the venture.
Undue favour of ` 70.54 crore was passed on to AEL by selling gas at the price lower than the purchase price

Chapter II, Performance reviews relating to Government companies
103
Management of fund 2.2.44 The following table shows the details of cash inflow and outflow of the Company during 2006-11:
(` in crore) Particulars 2006-07 2007-08 2008-09 2009-10 2010-11
Cash from Operating Activities 195.78 538.71 1,175.44 (431.39) 372.34Cash from Investing Activities (729.05) (1,727.65) (2,693.08) (2,002.80) (1,264.82)Cash from Financing Activities 545.08 1,183.97 2,314.69 1,683.06 874.75Net increase or (Decrease) in Cash and cash equivalents
11.81 (4.97) 797.05 (751.13) (17.73)
Source: The Company’s Annual Reports
Analysis of the cash flow from investing and financing activities during 2006-11 indicated that the Company raised total amount of ` 7,149.08 crore through short/long term borrowings and utilised fund of ` 7,837.52 crore towards exploration and development activities in the blocks which were under exploration and development phases. The details are given below:
(` in crore) Particulars 2006-07 2007-08 2008-09 2009-10 2010-11 Total
Short term loan 569.79 611.91 631.97 1,095.71 (199.06) 2,710.32Long term loan 0 727.62 2,128.35 340.89 1,241.90 4,438.76Proceeds from loans 569.79 1,339.53 2,760.32 1,436.60 1,042.84 7,149.08Exploration and development expenditure being capitalised
733.68 1,634.27 2,553.75 1,657.69 1,258.13 7,837.52
Source: The Company’s Annual Reports
Of the total borrowings during 2006-11, there were short term loans (including cash credit with banks) which were borrowed at rates ranging between 6.75 and 11.75 per cent. The long term borrowing was availed at the interest rate of 11.25 per cent from a consortium of banks.
2.2.45 The exploration, development and production activities of the Company are of high risk, capital intensive nature and requires long gestation period. Therefore, the utilisation of long term loan on these activities would be more advantageous instead of short term loan which is not a dependable source, as the short term loan assistance could be discontinued by the banks at short notice. However, as can be seen from the above table, the Company depended on the short term loans which constituted 38 per cent of its total borrowings for the exploration and development activities. This is not a prudent financial practice. Hence, the Company should arrange for increasing the funds such as raising long term loans or raising equity fund through private placement with financial institutions/ through Initial Public Offer (IPO). We observed that though an IPO was planned (March 2010) by the Company, it had to defer it due to unfavourable capital market conditions. The Company, by expediting the exploration and development activities, can enhance the production of oil and gas, which may give a favourable scenario to launch the IPO.
The Management stated (September 2011) that the short term loan mainly consisted of line of credit (LoC) availed from consortium of banks. Though LoC was given for a period of 12 months, the same was renewed year after year and became perpetual in nature like a long term loan. Further, the interest
Utilisation of short term borrowings for the exploration/ development works indicated the imprudent financial practice followed by the Company
Audit Report No. 4 (Commercial) for the year ended 31 March 2011
104
being charged on short term loan was less by 3 to 4 per cent in comparison with long term loans. However, the Company had already started to match the long term application funds from long term resources and was also in the process of raising the equity on private placement basis in the year 2011.
The reply is not tenable. The Company utilised the short term loan mainly during 2006-10 for capital expenditure (exploration and development expenditure) which was not prudent and against the accepted business practices. Though the Company at present is able to avail short term finance at comparatively low financial cost, this may not prevail in the long run. Further, the short term finance/ LoC facility may not be a dependable source for meeting long term requirement as the extension of such facility is at the discretion of the consortium of banks.
Belated raising of joint interest billing
2.2.46 As per the Accounting Procedure 4 of Article 1 of Joint Operating Agreement, the Company, being an operator of KG block should render joint interest billing (JIB) statement to all JV partners, by 25th day of each month. The JIB shows the cost and expenditure incurred during the prior month and the amount payable by the JV partner after considering the advance received from them for the venture. We observed that an amount of ` 123.28 crore and ` 46.26 crore being the share of expenditure recoverable from JV partner JEL for the block were due for raising JIB on 25 April 2009 and 25 January 2010 respectively. However, against the due dates for JIB, the Company belatedly raised the JIB on 19 June 2009 and 18 February 2010 i.e. with a delay of 55 days and 24 days respectively on the above funds. This led to loss of interest of ` 2.0859 crore on the blocked up amount to the extent of the delay.
The Management stated (September 2011) that it could not raise JIB due on 20 April 2009 relating to the period of March 2009 as March month, being close of the financial year, the Company had to wait till May 2009 for the receipt of all invoices for the period up to 31 March 2009 so as to effect the TDS for that year. Similarly, it could not raise JIB due on 25 January 2010 relating to the period December 2009 as the Company closed its accounts up to 31 December 2009 for IPO purpose and hence, the JIB was raised subsequently, in the above cases.
The reply is not tenable. Raising of invoice of JIB has nothing to do with closing of accounts and thus, the interest loss due to belated raising of JIB could have been avoided.
Non recovery of interest from joint venture partners
2.2.47 As discussed in the above paragraph, the JIB issued by the operator to the JV partner was required to be paid within 30 days of issue as stipulated in the JOA. If the JV partners fail to make the payment within the stipulated time, the operator is entitled to recover the due amount along with interest calculated at the London Inter Bank Offer Rate (LIBOR) plus two per cent per
59Calculated at the Company’s average borrowing rate of 9.64 per cent prevailing during 2009-10.
Delayed raising of joint interest billing led to loss of interest of ` 2.08 crore
Chapter II, Performance reviews relating to Government companies
105
annum during the period of default from the JV partner. We observed that in respect of Sanand-Miroli block, the Company did not levy and recover interest on the dues ranging between ` 0.66 crore and ` 3.56 crore (during August 2007-2009), which were paid by JV partners (JEL and GGR) after delays ranging from 12 to 368 days. This led to loss of interest of ` 1.0660 crore, not recovered by the Company as per provisions of JOA.
The Management stated (September 2011) that the cash calls raised against GGR and JEL were not acknowledged by them for want of OC resolution. Subsequently on pursuing them, the cash calls were paid by them and hence the interest was not charged on the delayed payments.
The reply does not give the reason for the pendency of the OC resolution. The Company, being operator, had to ensure timely approval of OC resolution and its issuance to non operating members.
Short remittance of advance tax led to payment of avoidable interest
2.2.48 The Company planned (June 2008) to commission a Wind Mill Project (WMP) at an estimated cost of ` 300 crore before 31 March 2009 so as to avail the depreciation of ` 120 crore61 on the investment and thereby to get the tax benefit of ` 40.79 crore for the financial year (FY) 2008-09 under section (U/s) 32 of Income Tax Act, 1961. The Management, while giving its in principle approval for taking up the project in September 2008, was aware that conducting of feasibility study, invitation and finalisation of international bids, award of contract and commissioning of WMP would take more than six months period. However, the Company continued to pay lesser advance tax U/s 211 of the Income Tax Act, 1961, taking into account the tax benefit of ` 40.79 crore against projected commissioning of WMP and accordingly paid total advance tax amounting to ` 150 crore62 during financial year 2008-09.
We observed that as the WMP could not be commissioned during the FY 2008-09 and tax benefit on account of WMP was not available to the Company. Since the Company had already reckoned the benefit of tax on WMP, the advance tax of ` 150 crore U/s 211 paid was short by ` 74.86 crore as against payable tax of ` 224.86 crore. Thus, for the shortfall of advance tax payments, the Company had to pay penal interest U/s 234B and 234C amounting to ` 7.65 crore. Since the Company was aware in September 2008 itself that it would not be possible to commission the WMP by 31 March 2009, it could have avoided payment of penal interest to the extent of ` 4.17 crore on shortfall of advance tax (` 40.79 crore) had it not imprudently taken into account the benefit of projected commissioning of WMP.
The Management stated (September 2011) that if the Company did not consider the envisaged tax shield, then it would have funded for the payment of applicable advance tax through borrowings, which would also result in incurring of interest. 60The loss of interest due to delay of JEL was ` 90.80 lakh and GGR was ` 15.76 lakh. Calculated the
interest at the LIBOR prevailing plus two per cent i.e., between 4.12 and 7.19 per cent. 61 Depreciation is @ 80 per cent for the period of six months on ` 300 crore. 62 Four installments of ` 10 crore, ` 45 crore, ` 28.50 crore and ` 66.50 crore.
The Company did not recover interest of ` 1.06 crore on delayed payment of cash calls made by JV partners
Short remittance of advance income tax led to avoidable payment of penal interest of ` 4.17 crore

Audit Report No. 4 (Commercial) for the year ended 31 March 2011
106
The reply is not tenable since payment of advance tax is a statutory requirement, which the Company should comply with in any circumstances. Further, the contention of the Management is mere hindsight as the Company even after knowing that it would not be able to commission the project by 31 March 2009, failed to pay the due amount of advance tax and consequently paid the penal interest.
Internal Control and Monitoring Mechanism
2.2.49 The following deficiencies were noticed in the internal control and monitoring mechanism of the Company:
• No system was in place for submission of annual budget to BoD;
• No detailed milestones were prepared for taking up the exploration activities as per the commitment given in MWP of PSC and also for taking up development activities as per FDP for the block, where the Company was operator;
• Management Information System (MIS) was also not in place for periodical reporting on the physical and financial status of each block against the commitments made in MWP and FDP to top Management;
• No system for reporting the instances of delays in drilling work occurred due to controllable reasons on part of service provider/ the Company;
• No MIS for showing the status of indents placed by various departments for purchase of material/ for availing services vis-à-vis purchases made/ services hired, etc.;
• System was not in place to keep track of the receipt of approvals granted in OC/ MC meetings held; and
• No mechanism was in place to report periodically to the top management i.e. MD and BoD about the status of disputes between JV partners/ issues pending with DGH/ MoPNG related to exploration production and development activities of various blocks and the methodology devised for settling the issues.
Acknowledgement
We acknowledge the cooperation and assistance extended by different levels of the Management at various stages of conducting the performance audit.
Conclusion
• Bidding process adopted by the Company for acquisition of hydrocarbon block was found to be defective as in case of KG block, the bids of the Company ignored the actual cost involved,
Chapter II, Performance reviews relating to Government companies
107
which exposed the Company against high risks in exploration activities.
• Exploration and development activities undertaken by the Company suffered with several deficiencies such as, delays in acquisition of study data, excessive time taken in drilling work than envisaged in drilling plan, execution of work without approval of Operating Committee/Management Committee, delay in preparation of field development plan, execution of drilling operation beyond exploration period, etc. which caused huge financial losses to the Company.
• The Company suffered financial losses in trading activities on account of undue favours extended to the buyers by way of non recovery of Take or Pay charges, sale of gas/ oil at price below purchase costs, etc.
• Management of finances by the Company was not prudent and efficient as it financed the exploration/ development activities through short term borrowing, which is against the accepted business practices.
• The Company did not have proper internal control and monitoring system in place.
Recommendations
The Company should consider:
• Proper assessment of both financial and technical issues before bidding for the blocks.
• Devising a mechanism for improving the efficiency in the management of the activities related to exploration and development and also in ensuring compliance to related Acts, rules and regulations, instructions of Directorate General of Hydrocarbon/Government of India and provisions of Production Sharing Contract and Joint Operating Agreement.
• Inclusion of clause for recovery of ToP charges in all the contracts for sale of gas.
• Arranging for enhancement of long term loans or raising equity fund through private placement with financial institutions/ through Initial Public Offer (IPO).
• Improve the internal control and monitoring system including revamping of present MIS system in place

Audit Report No. 4 (Commercial) for the year ended 31 March 2011
108
109
Transaction Audit Observations
Important audit findings that emerged from the test check of transactions of the State Government companies and Statutory corporations are included in this Chapter.
Government Companies
Gujarat State Civil Supplies Corporation Limited
3.1 Imprudent decision for re-inviting tender
Imprudent decision to re-invite tender for purchase of Tur dal ignoring lower rates received under original tender led to avoidable expenditure of ` 1.28 crore.
The Company procures and supplies Tur dal for the Mid Day Meal (MDM) Scheme of Government of Gujarat (GoG). To meet the requirement of Tur dal for July and August 2008, the Company invited (12 May 2008) tender for procurement and distribution of 35,000 quintals (qtls.) of Tur dal for its six purchase centres1. As per tender terms, the bidders had to quote per quintal (qtl.) rates inclusive of all the cost and transportation for delivery of Tur dal up to the place of Company’s respective purchase centres.
The price bids were opened (2 June 2008) and negotiations were held (5 June 2008) with five bidders who were L1 bidders for supply to different centres. The negotiated rates for the centres by L1 bidders ranged from ` 3,525 to ` 3,721 per qtl., as against the market rates, of ` 3,400 to ` 3,900 per qtl. prevailing during the period from May 2008 till the date of negotiation. The Company, however, had taken the lowest rate of ` 3,525 per qtl. received for one of the centres i.e. Mehsana and compared it with the L1 rates of the remaining centres. As L1 rates for the remaining centres were higher by ` 116 to ` 196 per qtl., the Company placed (9 June 2008) purchase order (PO) on the L1 bidder whose rate was ` 3,525 per qtl. for supply of 5,875 qtls. of Tur dal only to Mehsana centre which was executed in June-July 2008. It had also decided (June 2008) to re-invite tender for the remaining requirement.
The Company re-invited (19 June 2008) tender for procurement of 29,125 qtls. of Tur dal for its remaining five purchase centres. The price bids were opened (19 June 2008) and negotiations were held (24 June 2008) with four bidders who were the L1 bidders for supply of Tur dal to the five centres. The rates offered for different centres by the L1 bidders after negotiation ranged from ` 4,104 to ` 4,175 per qtl. which were higher than the market rates of ` 3,400 1 Ahmedabad, Vadodara, Rajkot, Junagadh, Surat and Mehsana.
Chapter III
Audit Report No.4 (Commercial) for the year ended 31 March 2011
110
to ` 4,050 per qtl. prevailing between 6 June 2008 and the date of negotiation i.e. 24 June 2008. The Company placed (9/15 July 2008) POs with all four L1 bidders and procured (July-August 2008) 27,406.20 quintals of Tur dal.
Our analysis of the records related to purchases of Tur dal made in the past during August 2005 to February 2008, revealed that there had been differences between the L1 rates for different centres from ` 14 to ` 105 per qtl. apparently due to transportation cost for different centres. The Company, however, ensured that overall the POs were placed at the rates which were lesser than the then prevailing market rates.
However, while finalising the bids received against the original tender of May 2008, the Company failed to give due weightage to the fact that the overall negotiated rates for different centres were well within the prevailing market rates and the marginal differences in the rates among L1 bidders of various centres were on account of the transportation costs involved for various locations. On the contrary, under the re-invited tender, the Company placed POs with four bidders whose quoted rates were not only higher than their negotiated rates under the original tender, but were also higher than the prevailing market rates. Had the Company prudently placed POs at the negotiated rates under the original tender, it could have avoided the extra expenditure of ` 1.28 crore2 incurred in purchase of 27,406 qtls. of Tur dal at higher rates under the re-invited tender.
The Government/ Management stated (September 2011) that as the bids received for original tender were not competitive, it had re-invited the tender. Further, the Company did not have any historical data for analysing the rates in finalisation of tender invited in May 2008. Therefore, the higher rates received in the subsequent tender of June 2008 could not be taken adversely against the Company’s decision making process, particularly when the competition was less in June 2008. Moreover, the proposal for adopting e-tender procedure for future procurements was under consideration of the government and the revised purchase procedure would be followed by the Company once the Government granted its approval.
The reply is not tenable. The re-invitation of tender was not required since the rates received in the original tender were well within the market rates prevailing during the period. Even the re-invited tender did not infuse any competition as it had received only three bids for one centre (Junagadh) and one bid each for the remaining centres. Moreover, while finalising the original tender, the Company had historical data relevant for taking prudent decision.
2 Centre: Qty in qtls x Differential Rate per qtl. between original and re invited tenders=avoidable exp.|
Ahmedabad 4825 qtls. x ` 404; Vadodara 7281qtls. x ` 490; Rajkot 5300 qtls. x ` 511; Junagadh 4500 qtls. x ` 526; Surat 5500qtls. x ` 396 = ` 1,27,70,290.

Chapter III, Transaction Audit Observations
111
Sardar Sarovar Narmada Nigam Limited
3.2 Unfruitful investment
Failure to promptly stop spending on the canal works in the area affected due to the acquisition of land for PCPIR resulted in unfruitful investment of ` 2.86 crore.
The Phase I of Sardar Sarovar Project (SSP) canal system comprises Narmada Main Canal chainage from 0 to 144.50 KM and a delivery network consisting of branch canals, distributaries, minor, sub-minor channels and control structures. The Phase I of SSP covers culturable command area (CCA) of 4.46 lakh hectares (ha) and is divided into 52 blocks.
The Government of Gujarat (GoG) proposed (November 2007) setting up of a ‘Petroleum, Chemical and Petrochemicals Special Investment Region3’ (PCPIR) at Dahej. Accordingly, in March 2008, GoG issued initial notification for acquiring land covering an area of 45,299 ha, spreading over Vagra and Bharuch, under the Land Acquisition Act, 1894. The final notification was also issued in June 2009.
The Company was aware (May 2008) that some of the areas under its four blocks i.e. 6G4, 6G5, 6G6, and 6G7 (the blocks) of Phase I were falling within the areas earmarked for PCPIR. However, it had not taken any prompt action to indentify the exact areas which were getting affected in the four blocks so as to stop making any further investment in the canal network which was either under progress or was to be taken up in those areas. Only in March 2009, the Company initiated action and indentified that out of total CCA of 29,730 ha, 14,927 ha was being affected due to PCPIR. Further, as late in August 2009, it had decided to stop any canal construction work in the boundary of PCPIR.
We observed that as the Company belatedly decided (August 2009) to stop the canal work, the work awarded (September 2004) for construction of Kaladara distributory and its minors of block 6G4 were continued till its completion in January 2009. Consequently, the cost of ` 1.87 crore4 incurred for the canal work carried out during June 2008 to January 2009 in the affected areas was an imprudent and avoidable investment.
Further, in July 2008, the Company awarded a contract for supply and commissioning of 156 vertical gates on the control structures of distributaries and minors under the four blocks at a cost of ` 1.52 crore to a firm5. The stipulated period for completion of work was April 2009. Till April 2009, the firm had supplied gates and had partly erected embedded parts and gate leaf
3 It is a specifically delineated investments region planned for the establishment of manufacturing
facilities for domestic and export led production in petroleum, chemicals and petrochemicals, along with the associated services and infrastructure.
4 Total value of work carried out till completion in January 2009, was ` 11.43 crore (-) the value of work done up to June 2008 was ` 9.56 crore.
5 M/s Hardware Tools & Machinery Project Private Limited, Ahmedabad.

Audit Report No.4 (Commercial) for the year ended 31 March 2011
112
costing ` 1.16 crore. As the Company identified (March 2009) the areas in four blocks affected due to PCPIR, it had asked (July 2009) the firm to erect and commission only 39 out of 156 gates in the areas not affected by PCPIR. Hence, the firm had commissioned 39 gates till December 2009. The total value of work executed was ` 1.43 crore and payments were also made (August 2008 to May 2010) to the firm. Of the expenditure of ` 1.43 crore, ` 0.44 crore related to 39 gates and the rest ` 0.99 crore was incurred on the surplus un-erected 117 gates with 33 embedded parts which pertained to the areas covered under PCPIR. This surplus material remained unfruitful due to its idleness for over a period of two years (November 2011).
Government/Management stated (August/September 2011) that the notification for PCPIR was issued in June 2009. In Kaladara distributory, the Company had withdrawn the work of ` 1.04 crore from the contractor in July 2009. Further, PCPIR was planned to be developed in a phased manner starting from 2011 and hence till the full development of PCPIR, the farmers would continue to utilise the canal net work created in the region. Regarding the gate works, it was stated that the contract was awarded even prior to issue of notification of June 2009. The firm executed gate works costing ` 1.31 crore, of which the cost of 39 gates was ` 0.86 crore, and the surplus 117 gates would be used in the canal works in other places.
The reply is not correct. The initial notification for acquisition of land for PCPIR was issued in March 2008 and public notices were also issued in May 2008. Hence, the continuing of the canal work of Kaladara distributory and also the award of gate works were avoidable. Further, the records produced to us indicated that the cost of canal work of Kaladara distributory carried out during June 2008 to January 2009 was ` 1.87 crore, the cost of 39 gates was ` 0.44 crore and the value of surplus 117 gates lying idle was ` 0.99 crore.
Thus, the Company’s failure to promptly indentify the affected areas due to acquisition of land for PCPIR and consequential delay in taking prudent decisions related to works in the affected areas led to unfruitful investment of ` 2.86 crore. Responsibility should be fixed for the failure to promptly indentify the affected areas leading to the unfruitful investment of funds.
3.3 Avoidable payment of interest on enhanced compensation
Delay in depositing enhanced land compensation as per the Court award led to avoidable payment of interest of ` 79.04 lakh.
The Company acquires land under the provisions of Land Acquisition Act, 1894 (Act) for construction of canal network under Sardar Sarovar Project (SSP) in the State. As per the procedures followed, Government of Gujarat (GoG) issues the notification for acquisition of the land under section (U/s) 4 (1) of the Act, the Special Land Acquisition Officer (SLAO) declares the land award U/s 11 of the Act and the possession of the land is taken over U/s 16 of the Act. In case of any objection as to the amount of compensation determined
Chapter III, Transaction Audit Observations
113
in the land award, the land owner can, through written application, request SLAO to refer the matter to the Court for determination of amount of compensation U/s 18 of the Act. SLAO may accordingly refer the matter to the Court and also deposit the amount of compensation as declared in his award with the Court if the land owner is not accepting the amount.
The Court may either uphold the award of SLAO or give the award enhancing the amount of compensation6. On receipt of the Court award, the Company takes the opinion of District Government Pleader (DGP) and the SLAO and later seeks directions of its Administrative Department7 (Department) of GoG, as to whether it should go for appeal or deposit the compensation as per the Court award. If approval is received for payment of compensation, the Company should deposit the amount with the Court.
Our scrutiny of records of three divisions8 of the Company revealed that during December 2005 to September 2009, the Court had given award in respect of 33 land reference (LR) cases involving a total amount of enhanced compensation of ` 10.36 crore. Further, U/s 28 of the Act, the Company was to pay interest on the enhanced amount of compensation at 9 per cent per annum (p.a.) for a period of one year from the date of taking over the possession of land and thereafter at 15 per cent p.a. till the amount was deposited in the Court. Accordingly, the divisions paid the enhanced compensation amount along with interest of ` 13.96 crore9 payable U/s 28 of the Act till depositing the amount during January 2007 to March 2010.
Taking into account the procedures such as, getting copy of the Court award and obtaining approval of the Department, a period of three months from the date of award could reasonably be considered to be sufficient for depositing the amount in the Court. However, even after allowing the period of three months, delays of two to 24 months were noticed in depositing the amount by the Company in the Court. The delays were caused not for want of funds but due to laxity in adhering to the procedures and also due to the existence of poor monitoring mechanism for reporting the delays. After the Court had given the award, the Company took 61 to 293 days even in approaching the Department for obtaining the approval and thereafter the Department also took 40 to 581 days for deciding to make payments. The delays could have been avoided, since the Company’s HO had a separate Section to monitor the LR cases manned by the officials on deputation from the Revenue Department of GoG and also the Secretary of the Administrative Department was a Member in the Company’s Board of Directors. Thus, delay of 2 to 24 months, over and above three months reasonably adequate for decision making, led to avoidable payment of interest of ` 79.04 lakh.
6 This enhanced compensation consisted of additional amount of compensation for the land + 30 per
cent Solatium on that additional amount + 12 per cent increase on the additional amount for the period from the date of notification under Section 4 (1) to the date of award by SLAO under Section 11 of the Act.
7 Narmada, Water Resources, Water Supply and Kalpsar Department 8 Narmada Project Canal Division 4/1-Limdi, 1/1 Dhandhuka and 2/6 Botad 9 Interest was reckoned from the period April 1994 to January 1999 during which the original award
was made by SLAO till the period October 2006 to March 2010 considered for depositing the amount of compensation.

Audit Report No.4 (Commercial) for the year ended 31 March 2011
114
The Government stated (September 2011) that the opinion of various authorities viz., DGP, SLAO and the Legal Department of GoG were being obtained to decide whether to prefer an appeal against the Court award or not. Hence, neither the Company nor its Administrative Department was solely responsible for these procedural delays. Further, only in four cases there was an abnormal delay in processing the LR cases and it occurred for want of original documents at the division offices.
The reply is not tenable. Taking into account the various procedures involved in the process, a reasonable period of three months for depositing the enhanced compensation was already considered by us for working out the interest loss. The Company needs to devise an effective control mechanism in coordination with its Administrative department for proper monitoring of LR cases, so as to avoid any delay in depositing the enhanced amount of compensation.
3.4 Premature investment
Premature investment of ` 70.05 lakh made in construction of Pressurized Irrigation Network System not required for immediate use.
The Sardar Sarovar Project (SSP) canal system comprises Narmada Main Canal, branch canals, distributaries, minor and sub-minor channels. Government of Gujarat (GoG), to promote Micro Irrigation System (MIS)10, at the farms falling under the command of SSP, issued (August 2008) instructions to the Company to construct and commission the Pressurized Irrigation Network System (PINS) in the command area in a phased manner.
The PINS acts as an interface between canal and the MIS at farm level. The work of PINS, inter alia includes construction of storage structure, inlet structure for carrying water from off take point of canal (i.e. distributary/minor) to storage structure, supply and fittings of pumps, laying of pipes to deliver water to farmers’ fields for its ultimate use through the MIS net work created by the farmers in their fields. As per the guidelines of GoG, the Company should take up the construction of PINS at various locations after considering the factors such as topography, hydrology of the land and the readiness of the canal for supply of water to the proposed PINS.
Test check of records of three Division offices11 of the Company revealed that the Division offices awarded (December 2008) separate contracts for construction and commissioning of PINS at four locations at a tendered cost
10 It refers to system of irrigation that applies water through small devices. The devices deliver water
onto the soil surface very near the plant or below the soil surface directly into the plant root zone. Under this system, depending upon the agronomic or horticultural requirements, the water is sprinkled, sprayed or misted in the micro-sprinkler mode. This led to saving of water and electricity compared to ground water utilization.
11 Two divisions viz., Saurashtra Brach Canal Division (i) 2/5 Limbdi and (ii) 2/3 Dhandhuka; and one division viz., Kutchh Branch Canal Division (iii) 1/5 Chanasma under the control of Office of Chief Engineer (CE), Rajkot and the Office of CE, Mehsana respectively.
Chapter III, Transaction Audit Observations
115
aggregating ` 98.18 lakh with a stipulation to complete the work within a period of three months. Of the four locations, for the PINS at Khambhkav and Zanzarkha, the water had to be drawn from minor canals under the distribution net work of Saurashtra Branch Canal. Further, for one PINS at Govna and for the remaining one PINS at Dodiwada, the water was to be drawn from a minor and a distributary under the distribution net work of Kutchh Branch Canal respectively.
We observed that at the time of award (December 2008) of the work for PINS, neither the distributary/minors which were to supply the water to the PINS at the above locations were constructed and ready, nor was there any plan to take up their construction in the near future. Further, the construction of PINS was a small civil work which could have been easily completed within a normal period of three months once the canal was ready to serve the water. Despite this and disregarding the guidelines of the State Government regarding readiness of the canal for supply of water to the proposed PINS, Division Offices of the Company awarded the work for PINS. The works of PINS construction were completed (August 2010) against the stipulated period of completion by March 2009. The constructed PINS could not be tested and commissioned in the absence of canal to supply the water to PINS (March 2011). The full payments to the tune of ` 70.0512 lakh were also made till June 2010 against the total value of work done for the four PINS. Thus, the imprudent award of work for PINS even before the construction of related distributary and minor canals led to premature investment of ` 70.05 lakh and consequential idling of assets created for PINS.
Government/Management (August/September 2011) stated that the work of PINS cited in audit was taken up only on pilot basis, but in any case for constructing the minors/distributary connecting these PINS, the contracts were now awarded.
The reply is not tenable. The guidelines of the State Government were issued even before taking up the work of PINS on pilot basis. Hence, the selection of the location for constructing the PINS even on pilot basis should have been made based on the guidelines so as to avoid blocking of funds in idle assets. Responsibility should be fixed for the imprudent award of work for PINS causing idle investment.
12The total tender cost of ` 25.44 lakh for the PINS works at Govna and Dodiwada was later reduced to
` 14.06 lakh.

Audit Report No.4 (Commercial) for the year ended 31 March 2011
116
Gujarat State Electricity Corporation Limited
3.5 Non commissioning of Ash Collection System
Imprudent selection of a firm and non-commissioning of Ash Collection System led to avoidable expenditure of ` 9.95 crore.
A mention was made in paragraph 4.14.8 of Audit Report 2004-05 (Commercial), Government of Gujarat about non-finalisation of tender invited (September 2003) for the work of supply and commissioning of Dry Fly Ash Collection (DFAC) System including Silos13 at Unit 3 and 4 of Gandhinagar Thermal Power Station (GTPS) till March 2005. It was also mentioned that due to non-commissioning of the DFAC system, the Company had continued with the practice of dumping fly ash on top soil instead of providing facilities to the brick manufacturers for lifting of dry ash as per the directives (14 September 1999) of the Ministry of Environment and Forest, GoI. In the absence of proper DFAC system, the Company could not avoid incurring the expenditure on water and electricity in disposal of dry fly ash in wet mode and failed to achieve the envisaged savings of ` 1.80 crore per annum on this account (February 2004).
Further scrutiny of the case revealed that, of the three bids received (October 2003) for the work invited on firm price basis, Energo Engineering Projects Private Limited, New Delhi (firm E) who quoted ` 4.68 crore stood L1. The Company awarded (December 2005) the work to firm E at a total cost of ` 4.65 crore with stipulated completion period of seven months up to July 2006. While awarding the work, the Company was aware that firm E was small and less experienced as compared to other two bidders. Further, silos commissioned in past (1999/2002) by firm E at Unit 5 of Ukai TPS (UTPS) and Unit 1 and 2 of GTPS were not working satisfactorily due to use of inferior equipments and improper works executed by Firm E. Besides, the Raw Coal Stacker Reclaimer System commissioned (August 2004) by firm E at UTPS with a delay of 54 months failed twice (March 2005) and was not working to the full capacity due to design deficiency14. Despite poor track record of firm E as stated above, the work was awarded to the same firm on the basis of their quote being L1.
The deficient drawings/ layout for the system and silos furnished (December 2005) by firm E and also its poor response to clarifications sought by the Company led to delay in taking decision on various issues including location for putting up silo and the design of ash evacuation system. Even after shifting the ‘zero date’ for the work to 7 December 2006 (by nearly one year), firm E executed meagre work costing ` 27.95 lakh at slow pace till December 2007 and there was no progress in the work since then. The Company, however, belatedly issued termination notice and encashed (March 2009) the bank guarantee of ` 46.50 lakh of firm E. The Company finally terminated the
13It is a structure used for storing dry ash in bulk quantity. 14 In this regard, a mention was made vide paragraph 2.4.16 of Audit Report (Commercial) for
the year 2006-07.
Chapter III, Transaction Audit Observations
117
contract in January 2010. The Company, however, did not have any plan for installation of DFAC system.
Thus, the imprudent selection of firm E completely ignoring its poor performance track record and also inordinate delay in terminating the contract of firm E, coupled with non fixation of any other new agency for the work led to non-commissioning of the system (November 2011). Considering the stipulated completion of work i.e. June 2007 (based on the shifted ‘zero date’), the Company had incurred avoidable expenditure of ` 9.95 crore (cost of ` 200.36 per MT as worked out by the Company) in disposal of 4.97 lakh MT of dry fly ash (of Unit 3 and 4 of GTPS) in wet mode during the period from July 2007 to March 2011. Besides, the Company was unable to control the pollution of top soil and air due to non-commissioning of DFAC system.
The Government / Management stated (July/August 2011) that it could not ignore firm E being a L1 firm. However, this work order was issued after firm E attended to the defects in the silos at GTPS and UTPS at Company’s instance. As regards to the time consumed in termination of contract, it was stated that initial delay was caused in persuading firm E to resume the work and later in seeking the legal opinion on this issue. Further, new agency for the work was not fixed as there was a proposal to convert fuel base in GTPS from coal to gas.
The Management’s plea regarding selection of firm E and delay in termination of contract were not convincing as the Company should have taken cognisance of poor track record of firm E before award of work and should have terminated the work with firm E without wasting any time in persuading the firm considering the abnormally slow progress of work. As regards the Management’s contention on conversion of fuel base in GTPS, we observed that though the proposal for conversion of fuel base was under consideration of the Management since December 2009, no concrete action was noticed in this regard.
Thus, imprudent selection of firm ignoring its poor track record and failure in commissioning the Ash Collection System led to avoidable expenditure of ` 9.95 crore, besides failure in stopping the pollution of top soil and air in violation of GoI directives.
3.6 Avoidable expenditure
Failure to place the letters of intent on L2 bidders at their quoted rates within validity period of tender led to avoidable expenditure of ` 1.04 crore
The Company invited (January 2008) tender on Annual Rate Contract basis for supply of 267 MT of blended Organophosphate (OPH) to its four thermal power stations (TPS)15 for use in the cooling water treatment system. As per 15Wanakbori (WTPS) -100MT, Gandhinagar (GTPS)-110 MT, Dhuvaran (DTPS)-50 MT and Utran
(UTPS) -7 MT.

Audit Report No.4 (Commercial) for the year ended 31 March 2011
118
tender conditions, the validity of bid was to be in force for a period of 120 days from the date of opening of the technical bids. In case of exigency, the Company could go to L2 bidder at their quoted rate for the placement of order. The technical bids were opened on 28 January 2008. Of the three qualified bidders, Synergy Associates (SA) was the L1 bidder for all the TPS16, whereas, Puja Chemicals (PC) and Chempure Technologies Pvt. Ltd. (CTP) were L2 bidders for two TPS each17.
The Company, instead of placing Letter of Intent (LoI) for supply of 267 MT of OPH on SA who had offered to supply entire quantity required, placed (April 2008) LoI only for the supply of 160 MT. On the plea of avoiding dependency on single supplier (i.e., SA), the Company placed LoI for the remaining requirement of OPH (107 MT) on CTP (50 MT) and PC (57 MT) with the condition that both suppliers should match their supply rates with the rates of SA (L1). PC and CTP, however, did not agree (April 2008) to supply the material at the L1 rate. Hence, the quantity allotted to PC and CTP was re-allotted by placing (April 2008) an additional LoI on SA. SA did not accept (8 May 2008) both LoIs citing the reason of increase in price of basic raw material (i.e Yellow Phosphorus) for OPH.
As the price of material showed an increasing trend and the rates offered by CTP and PC were to remain valid till 27 May 2008, the Company, after the refusal of LoIs by SA, should have immediately placed LoIs on L2 bidders who were willing to supply at their quoted rates for the required quantity (267 MT) of OPH. The Company, however, failed to place the LoIs within the validity period of offer of L2 bidders at their quoted rates. Belatedly, on 3 June 2008, the Company approached one L2 bidder, PC, asking its confirmation for supply of material at their quoted rate. PC refused (9 June 2008) to supply even at their quoted rates on the ground of expiry of validity of their offer.
Due to exigency, the Company procured the required material of 267 MT through the tenders invited in July 2008 and October 2008. Under the above tenders, the orders were placed (September to December 2008) with PC and CTP at the rates which were higher by ` 29,600 to ` 42,850 per MT for the supply at different TPS compared to their L2 rates quoted for the tender invited in January 2008. This resulted in avoidable expenditure of ` 1.04 crore18 on the 267 MT of material purchased.
Thus, initially, the Company failed to place the LoI for the entire requirement of 267 MT with L1 bidder SA in April 2008 who was willing to supply the same. Even when SA did not accept the LoI on 8 May 2008, the Company should have placed LoIs with L2 bidders who were willing to supply the required quantity of OPH at their quoted rates which remained valid till
16 ` 24,900/MT for WTPS and GTPS; ` 27,400/MT for DTPS and ` 28,900 for UTPS. 17 PC was L2 bidder for DTPS and UTPS; CTP was L2 bidder for WTPS and GTPS. 18(I) Cost of purchase if L2 rate of tender (January 2008) was accepted: TPS wise: ` 28,900 x 100 MT +
` 27,150 x 110 MT+ ` 31,100 x 50 MT+ ` 29,200 x 7 MT = ` 76.36 lakh. (II) Cost of actual purchases made through subsequent tenders: ` 60,700x65 MT+ ` 70,000x202 MT= ` 180.85 lakh. Extra cost (II-I) = ` 104.49 lakh.

Chapter III, Transaction Audit Observations
119
27 May 2008. Hence, the purpose of keeping the tender provision enabling the Company to place order at L2 rates, in case of exigency, was also defeated.
The Government/Management stated (June/July 2011) that the price of OPH remained volatile due to shortage of its input raw material i.e Yellow Phosphorus in the market, hence the firms were unwilling to accept the orders even at their quoted rates.
The reply is not tenable. Only one L2 bidder PC was approached (3 June 2008) after the expiry of validity period and hence PC cited (9 June 2008) that the validity of their offer was over on 27 May 2008 and was unable to extend the validity of the offer due to increase in price of the material. The reason why the Company did not approach both L2 bidders PC and CTP before the expiry of validity period was not on record. The Company should fix the responsibility for not placing the orders within the validity period of the offer.
Alcock Ashdown (Gujarat) Limited
3.7 Loss due to non safeguarding of financial interest
Imprudent acceptance of a ship building contract exposed the Company to probable loss of ` 96.42 crore.
The Company accepted (December 2006) a contract for construction of six survey vessels for Indian Navy from Ministry of Defence (MoD), Government of India, at an aggregate firm price of ` 698.91 crore19. The price consisted of basic price of ` 109.89 crore per vessel amounting to ` 659.34 crore, cost of modification of ` 32.97 crore and cost of project management of ` 6.60 crore. As per contract terms, first vessel was to be delivered on 6 April 2009 while the remaining five vessels were to be delivered from 6 July 2009 to 6 July 2010.
The Company, however, could execute (March 2011) the works valuing ` 276.23 crore only against which payments to the extent of ` 257.15 crore were also received from MoD. Based on the Company’s repeated requests seeking extension in delivery schedule on the grounds of difficulties in mobilising working capital loans, the MoD rescheduled (December 2009) the delivery of vessels starting from September 2011 to March 2013.
We observed that while accepting (December 2006) the contract of MoD, the Company already had five ship building contracts (worth ` 465.44 crore) on hand. Further, as the proposal for disinvestment of the Company was under consideration (since July 2006) with the Government of Gujarat (GoG), technical staff of the Company had started quitting causing adverse impact on the pace of execution of the contracts on hand. As a result, the Company had started facing difficulties in mobilising working capital loans from Banks. 19Excludes the cost of spares estimated to ` 98.90 crore for which payment would be made by MoD on
actual cost not on fixed price basis.

Audit Report No.4 (Commercial) for the year ended 31 March 2011
120
The Company, however, while accepting (December 2006) the huge value contract of MoD did not take cognisance of the above facts, which were vital for protecting the financial interests and reputation of the Company.
We further observed that the Company imprudently accepted the price of ` 109.89 crore per vessel for MoD project even though its own estimated cost of construction (excluding the element of profit) per vessel was ` 115.87 crore. Further, the Company was, for the first time, bidding (July 2005) for the Indian Navy contract; however, it did not prepare proper cost estimate for the project by taking cognisance of the fact that core equipments for navy vessels were highly sophisticated and its availability was from limited sources due to stringent specifications. Besides, the time overrun in execution of the shipbuilding contract also led to escalation in the cost of the project. As per the Company’s own latest estimate (March 2011), the cost of construction (excluding the element of profit) per vessel would be ` 125.96 crore as against the contract price of ` 109.89 crore. Thus, the Company was already exposed to the probable loss of ` 96.42 crore (` 125.96 crore - ` 109.89 crore x 6 vessels), which did not include the revised costs for the other fixed price items in the contract (viz., cost of modification and project management.) not estimated by the Company as yet.
In response to an audit query, the Management admitted (October 2010) that inexperience in preparation of cost estimate for the special type of equipments/steel for the navy vessels was the reason for inaccuracy in the preparation of estimate for the contract. Regarding delay in execution, it was stated that uncertainty due to GoG’s disinvestment plan and non availability of adequate financial assistance from banks had caused the delay.
Thus, the acceptance of a huge contract at the rate below cost estimates and without considering the prevalent circumstances having direct impact on its capability of executing the work, the Company was exposed to the probable loss of ` 96.42 crore in execution of the contract.
The matter was reported to Government/Management (June 2011); their replies had not been received (November 2011).
GSPC Gas Company Limited
3.8 Non-synchronisation of activities in setting up of CNG stations
Non synchronisation of activities in setting up of CNG stations led to loss of ` 9.41 crore due to non availing of free operation and maintenance of compressor machine and loss of interest on the blocked up of funds.
The Company, for setting up of Compressed Natural Gas (CNG) stations at various locations, invited (July 2007) tender and awarded (10 December 2007) the work for supply, installation and commissioning of 10 Comprehensive
Chapter III, Transaction Audit Observations
121
Compressor Packages (CCPs)20 on three firms at a total cost of ` 18.71 crore. Further, for setting up of another 15 CNG stations, repeat orders for 15 CCPs21 were also placed (31 May 2008) at a total cost of ` 27.92 crore on the same firms at the same rates of the original orders. As per stipulation given in the work orders, works should be completed within 30 weeks from the date of issue of the orders. The Company was entitled to have free operation and maintenance (O&M) of CCPs for a period of 12 months starting from the date of commissioning or 18 months from the date of supply of CCPs whichever was earlier for each CNG station.
Against the scheduled date of commissioning of 10 CCPs i.e., 7 July 2008 as per the original orders, the CCPs were supplied during June to August 2008 and were commissioned during September 2008 to September 2010. In case of repeat orders, against the scheduled date of commissioning of 15 CCPs i.e., 27 December 2008, the CCPs were supplied during October to November 2008 but only 10 CCPs were commissioned during November 2009 to March 2011. Remaining 5 CCPs were not commissioned as on 31 March 2011.
We observed that CCPs were supplied by the firms within a period of five to seven months from the date of placement of orders. However, the supplied CCPs could not be commissioned due to the Company’s failure to synchronise the placement of work orders with the phase relating to adherence to various statutory procedures before setting up of CNG stations. Our analysis revealed that an average time of 260 to 310 days were taken in completing the procedures viz., obtaining necessary clearances from Revenue/Forest departments, Highways Authorities, Pollution Control Board, etc. The Company was aware that supply of CCPs against the orders placed was expected with a lead time of six months and the statutory clearances were to be obtained before commissioning of CCPs. However, it had submitted the applications for obtaining clearances for the CNG stations as late as in April 2008 to June 2010. Further, avoidable delays due to revision of drawings of works, shifting of cables, construction of approach road etc., also attributed to the overall delay in commissioning of CCPs and starting CNG stations.
Against the schedule date, 20 CCPs were commissioned with a delay of 75 to 815 days and the remaining 5 CCPs were not commissioned even after a delay of 824 days (March 2011). Due to belated commissioning, the Company could not avail free O&M for a period of 2 to 12 months in 24 out of 2522 CCPs. This led to loss of ` 2.91 crore23. Further in all 24 cases, CCPs costing ` 37.62 crore supplied by the firms remained idle for a period of 245 to 787 days since the receipt of CCPs till the date of its commissioning or 31 March
20 (3 CCPs -1200 sm3/hr and 7 CCPs - 650 sm3/hr) 21 (4 CCPs - 1200 sm3/hr and 11 CCPs - 650 sm3/hr) 22In one CCP i.e. at Gandhinagar, there was a delay of 75 days against the schedule date of
commissioning date, the free O&M period did not lapse. 23Reckoning the rate of ` 1.20 lakh per month per CCP offered by the firms for the O&M of CCP after
the warranty period given in the contract x no. of months lost in availing the free O&M in 24 CCPs as per the terms of the contract i.e., 12 months starting from the date of commissioning or 18 months from the date of supply whichever was earlier.

Audit Report No.4 (Commercial) for the year ended 31 March 2011
122
2011. Consequently, the Company suffered loss of interest of ` 6.50 crore24 on the locked up fund of ` 37.62 crore for the period (July 2008 to March 2011).
The Management/Government (June/July 2011) stated that the delays in commissioning of the CCPs were unavoidable as the Company had to depend on external agencies for obtaining the clearances before setting up the CNG stations and also in few cases, the locations of CNG stations were changed due to Petroleum and Natural Gas Regulatory Board (PNGRB) Regulations.
The reply is not tenable. Before placement of work orders, the Management was aware of the procedures involved in obtaining the statuary clearances and also about the suppliers’ obligations for providing free O&M for the CCPs supplied. However, it did not properly assess the estimated time required for completing each activity and had also not made adequate efforts to expedite the activities leading to non-synchronisation of activities and the consequential delays. The Management, however, did not furnish the necessary details relating to change in the locations of the CNG stations, which include date of issue of PNGRB Regulations, the cases where the locations changed, the extent of delay etc., in absence of which no comments could be offered.
The Company needs to avoid recurrence of similar incidents of idle investments on account of non-synchronisation/delays relating to project activities through better planning duly taking the cognisance of the time involved in obtaining the statuary clearances.
Gujarat State Petronet Limited
3.9 Undue benefit to a firm
Undue benefit of ` 12.02 crore was passed on to a firm by way of waiver of capacity charges contrary to the provisions of gas transmission agreement.
The Company transports gas through its own pipeline network to the customers and recovers transmission charges from them. Essar Steel Limited (ESL) entered into (March 2004) a Gas Transmission Agreement (GTA) with the Company for transporting maximum daily quantity of 7,201 MMBTU25 of gas from ESL’s suppliers (i.e. IOCL and BPCL26) at Dahej to its plant premises at Hazira. In this regard, reference is invited to Paragraph 3.13 and 3.14 of Audit Report (Commercial) for the year 2006-07 regarding short recovery of interconnectivity charges of ` 10.20 crore27 and non recovery of penalty and interest of ` 14.73 crore by the Company from ESL in violation of provisions of GTA.
24Calculated at company’s average borrowing rate of 10.63 per cent on the value of each CCP for the
number of days delayed. 25 Million metric british thermal units 26 Indian Oil Corporation Limited and Bharat Petroleum Corporation Limited 27 Money value of ` 20.10 crore commented in previous Report, ` 10.20 crore pertain to ESL.

Chapter III, Transaction Audit Observations
123
Under GTA, the Company further reserved (September 2006) Capacity Tranches (CT) viz., Essar Spot CT and Essar SEZ CT in its pipeline and started transportation of 58,350 MMBTU and 50,845 MMBTU gas respectively to ESL. In addition, at the request of ESL, the Company allotted (June/July 2009) another CT viz., Essar D6 CT with entry point at the Company’s pipeline at Atakparadi to transport 1,08,334 MMBTU28 D6 gas of Reliance Industries Limited (RIL), to ESL plant. The Spot CT and SEZ CT were valid till June 2010 and D6 CT got the validity up to March 2010. As per terms of GTA, ESL was to pay transmission charges consisting of capacity charges and commodity charges. The capacity charges were payable for the contracted (reserved) quantity of the gas under each CT till its validity period, even if there was no transportation of gas in any billing period. The commodity charges were, however, payable based on the actual gas transported during the billing period.
We observed that ESL wanted (September 2009) to lay its own pipeline to directly connect with pipeline of Reliance Gas Transportation Infrastructure Limited (RGTIL) at Damka so as to avoid using the existing pipeline network of the Company. Hence, to retain the business with ESL, the Company decided (May 2010) to lay the pipeline from RGTIL’s pipeline at Damka to the Company’s nearest pipeline network at Mora at an estimated cost of ` 2.35 crore29 for onward transportation of D6 gas to ESL premises. Further, the Company (May 2010) also extended the validity of D6 CT on a long term basis with effect from 1 April 2010 to 31 March 2014. The Company incurred expenditure of ` 1.82 crore for the work of laying the pipeline and the work was in progress (June 2011). After laying the pipeline from Damka, ESL would have to pay transmission rate of ` 2.98/ MMBTU which would be cheaper to the existing rate of ` 19.74/ MMBTU being paid to the Company for transportation of D6 gas from Company’s entry point at Atakparadi.
The decision of the Company to lay the new pipeline at the estimated cost of ` 2.35 crore could be considered to be prudent as it was in Company’s own interest in retaining business of ESL. The Company, however, further waived (May 2010) the capacity charges of ` 12.02 crore already recovered from ESL during April to June 2010 under Spot CT and SEZ CT. This waiver was done on the basis of ESL’s plea that it was not able to utilise the capacity reserved under Spot CT and SEZ CT during the said period (April to June 2010), after it started taking the supply of D6 gas through D6 CT. The waiver was not justified as it was made in violation of terms of GTA and also led to loss of revenue of ` 12.02 crore to the Company.
The Management stated (September 2011) that to retain ESL’s transportation volume of D6 and also to avoid development of competing pipeline which would have long term implication, a contractual arrangement was made with ESL wherein the Company agreed to raise the credit note for ` 12.02 crore for the unutilised capacity under Spot CT and SEZ CT against the capacity
28 D6 CT- 91,009 MMBTU and D6 RE CT 17,325 MMBTU. 29 Cost of laying pipeline ` 197.17 lakh, Consultancy cost ` 17.95 lakh and Third party Inspection cost
` 20.09 lakh.
Audit Report No.4 (Commercial) for the year ended 31 March 2011
124
charges previously recovered under these CTs during April to June 2010. Hence, this was not waiver of income.
The reply is not tenable. The Company reserved the capacity in its pipeline separately for each CT of ESL and hence charges were to be levied and recovered as per the provisions of GTA. Thus, the benefit of ` 12.02 crore passed on to ESL in the form of credit note was outside the scope of GTA.
The matter was reported to Government (June 2011); their reply had not been received (November 2011).
3.10 Avoidable payment of non-utilisation penalty and other charges
Delay in planning and utilising the leasehold plots within the prescribed time limit led to avoidable payment of non-utilisation penalty and other charges amounting to ` 1.21 crore.
The Company with an aim to construct Gas Grid Control Room, Training Centre and Residential quarters for its staff acquired (May 200730) two plots viz., plot E and S, on 99 years lease basis at total cost of ` 7.23 crore31 in the estate of Gujarat Industrial Development Corporation (GIDC), Gandhinagar. As per the terms of License Agreement (agreement) entered with GIDC, the Company should complete the construction of the buildings and make it fit for occupation within a period of two years from the date of allotment of plots by GIDC in February 2007. Otherwise, GIDC shall recover non utilisation (NU) penalty at the rate of 3 per cent on the prevailing allotment price for the period of non utilisation of plots. Further, the Company should also pay other charges viz., service charges, lease rent, etc. even if it did not utilise the plots. The Company did not even start the construction of buildings in both plots till March 2011. As the plots were not utilised within the stipulated time of February 2009, GIDC recovered (July 2010 to March 2011) NU penalty of ` 1.15 crore32 and other charges of ` 0.06 crore33 from the Company.
Our analysis of the reasons for non utilisation of plots within the stipulated time revealed that after the acquisition of the plots in May 2007, the Company prepared (September 2008) a proposal with design layout for construction of control room and training centre. Subsequently, the Company revised (September 2009) the proposal by increasing the size of design layout of buildings on the reason of impending expansion of its activity. However, on the plea of change of Managing Director (MD) and reconstitution of Board of Directors (BoD), it had put up a proposal and obtained the approval of BoD only in January 2011, for construction of control room and training centre in plot E and for construction of residential quarters in plot S at an estimated cost of ` 23.87 crore and ` 17.92 crore respectively. While the bids received (June 2011) for the work relating to plots were under finalisation (August 2011), the 30 Date of actual possession of plots after allotment. 31 E-18 (25,464 sq.mtrs.) costing ` 5.13 crore and S-1 (10,436sq. mtrs.) costing ` 2.10 crore. 32 ` 82.52 lakh for E-18 plot and ` 32.97 lakh for S-1 plot. 33 ` 5.74 lakh for E-18 plot and ` 0.75 lakh for S-1 plot.
Chapter III, Transaction Audit Observations
125
construction work in plot E started in May 2011 and is scheduled for completion by February 2012. GIDC granted extension of time from February 2009 as stipulated in the agreement to August 2011 and February 2012 for utilisation of plot S and E respectively. Considering the present status of the works, the Company may have to seek further extension of time from GIDC and also have to pay NU penalty and other charges accordingly. Thus, 45 months taken since acquisition of the plots only for the process of planning and approval of development plan etc for the plots without any justifiable reasons led to avoidable payment of NU penalty and other charges amounting to ` 1.21 crore.
The Management stated (August 2011) that, as the Company planned (January 2009) to expand its activities outside the State by creating pipelines across the country, it had revised the size of design layout of control room and training centre. Further, the subsequent change of MD and reconstitution of BoD also led to delay in finalisation and starting of work in the plots.
The reply is not tenable. As per the provisions, of agreement with GIDC, even after constructing the buildings within the stipulated period of two years, the Company had the option to retain the unutilised portion of the plots for taking up the additional construction work in future, if required, for expansion of its activities. Considering this aspect, the Company, should have designed the layout of buildings in such a manner so that based on the then prevailing need, it could have taken up and completed the construction within stipulated time of February 2009. Further, change of MD and reconstitution of BoD are part of routine business process and cannot be considered to be a valid reason for delay in utilising of plots. Thus, the Company’s laxity in developing the plots within the time limit stipulated in the agreement led to an avoidable payment of NU penalty and other charges amounting to ` 1.21 crore.
The matter was reported to Government (July 2011); their reply had not been received (November 2011).

Audit Report No.4 (Commercial) for the year ended 31 March 2011
126
Gujarat Energy Transmission Corporation Limited
3.11 Loss due to delay in finalisation of tender
Failure to finalise the tender within the validity period led to avoidable expenditure of ` 90 lakh in purchase of various steel items.
The Company invited (24 October 2009) tender on firm price basis for purchase of various types of steel items34 weighing 1749.96 MT for transmission line works. Fourteen bids were received and the technical bids were opened on 30 November 2009. The validity period of tender was for 120 days from the date of opening of technical bids viz., upto 30 March 2010. The price bids of seven technically qualified bidders were opened on 29 January 2010. The Company placed the Letters of Intent (LOIs) on six firms (based on the lowest rate quoted for various items) at a total cost of ` 5.48 crore on 08 April 2010. As the validity of the tender expired on 30 March 2010, the firms refused to accept the LOIs issued to them.
The Company procured (June and November 2010), the above steel items by placing the purchase orders (POs) under the subsequent tenders invited on 6 February and 19 July 2010. The prices of various type of steel items procured under the subsequent tenders were ranging from ` 33,082 to 37,841 per MT compared to the prices of ` 27,951 to ` 33,274 per MT offered under the tender of October 2009. Five out of six firms which did not accept LOIs under tender of October 2009 got POs under the subsequent tenders at prices which were higher ranging from ` 2,868 to ` 5,860 per MT.
We observed that the Company, since its formation in April 2005, had never fixed any stage-wise time frame for completing the entire process of finalisation of tender after taking into account the reasonableness of the time required by the concerned section so as to ensure placement of the orders within the validity period of the tender. In the instant case, against the validity period of 120 days, the Company took 128 days for placement of orders after opening of technical bids. For scrutiny of technical bids and approving the technically qualified bidders 59 days were taken (30 November 2009 to 28 January 2010) and for scrutiny of price bids upto obtaining the approval of Purchase Committee (PC) another 56 days were taken (29 January to 25 March 2010). Even after the approval of PC, 13 days (26 March to 7 April 2010) were taken for issuing LOIs. As this procurement was made for the regular items of MS steel with routine technical specifications and tender terms, the delay in finalising the tender was not justified and could have been avoided. The Company’s failure to finalise the tender within the validity period led to avoidable expenditure of ` 90 lakh35 on procurement of steel items at higher rates under the subsequent tenders. 34 M S Beams (i) 150x150mmx13 meter-1228 MT (ii) 116x100mmx11 meter-72.96 MT; M S Channel
(iii) 100x50x6mm -152 MT (iv) 125x65x6mm -80MT (v) 50x50x6 mm -156 MT; M S Flat - (vi) 75x10mm-29 MT; M S Plain Bar (vii) 20mm-32 MT= 1749.96 MT
35 Price difference between the tender of October 2009 and subsequent tenders and the quantity (i) 150x150mmx13 meter - ` 5859.85 x 1228 MT; (ii) 116x100mmx11 meter - ` 2867.80 x 72.96 MT;
(iii) 100x50x6mm - ` 3719.30 x 152 MT (iv) 125x65x6mm – ` 3750.20 x 80MT; (v) 50x50x6 mm – ` 5130.41 x 156 MT; (vi) 75x10mm- ` Nil x 29 MT; (vii) 20mm - Nil x 32 MT

Chapter III, Transaction Audit Observations
127
The Government/Management stated (May 2011) that adherence to the lengthy procedures involved in finalisation of tender and also careful scrutiny of bid documents with available resources led to non finalisation of tender within the validity period.
The reply is not tenable. As the Management itself had fixed the validity period of the tender after reckoning the relevant aspects, it should have made adequate efforts to adhere to the time schedule in finalising the offer of the bidders within the validity period of their offers. The Management, however, agreed to our suggestions on framing of the stage-wise time schedule for completing each activity involved in finalisation of tender and also for devising a mechanism to monitor the timely finalisation of tenders.
Dahej SEZ Limited
3.12 Loss of interest due to non adherence to Government instructions
Failure to evolve financial management system in line with the instructions of Finance Department led to loss of interest of ` 2.46 crore.
The Company was incorporated36 (September 2004) with the main objective to establish and develop multi products Special Economic Zone (SEZ) at Dahej in Gujarat. The Company allots plots in SEZ on lease for 30 years to the allottees and collects the allotment price from them either upfront or in three installments, generating huge surplus funds. As per the instructions (31 December 1999) of Finance Department of Government of Gujarat (GoG), the State Public Sector Undertakings (PSUs) should deposit their short term surplus funds37 for periods below 15 days with Gujarat State Financial Services (GSFS) under its Liquid Deposit Scheme (LDS), which could be withdrawn upon one day notice and was offering interest at the rate as specified from time to time38. Further, GSFS was also accepting deposits from PSUs for a period of more than 15 days separately under its inter-corporate deposits scheme.
The Company, since the commencement of business in March 2007, had kept huge surplus funds in the Current Accounts (CAs) with two banks viz., State Bank of India (SBI) and HDFC Bank, Gandhinagar. Our scrutiny of CAs with the banks revealed that during the period from April 2007 to March 2011, the funds ranging from ` 0.21 lakh to ` 294.21 crore were kept in CA with SBI
36 Both Gujarat Industrial Development Corporation (GIDC) and ONGC are holding equal share in the
equity capital of the Company. 37 As per the FD’s instructions, surplus funds would mean any operating surplus with PSUs in the form
of Cash in Current Account with Bank or otherwise and would be required by PSU in future date even after one day.
38 Prior to July 2007, GSFS was giving interest based on the interest received from inter-bank call money market which was fluctuating. However, from July 2007, GSFS was offering fixed rate of return under LDS

Audit Report No.4 (Commercial) for the year ended 31 March 2011
128
for a period of one to 60 days. Further, it had also kept surplus funds ranging from ` 75.78 lakh to ` 35.70 crore in CA with HDFC Bank for a period of one to 56 days during June 2009 to March 2011. Despite the instructions of GoG, the parking of such huge funds in the CAs earning absolutely no return indicated the imprudent management of funds by the Company. We observed that no mechanism was in place to ensure the efficient management of Company’s huge funds. Even after reckoning two days for withdrawal of funds from CAs and depositing the same in LDS, the Company suffered an avoidable loss of interest of ` 2.46 crore39 due to idling of funds in CAs with banks instead of depositing the same in LDS at the interest rate ranging from 3 to 12.20 per cent offered by GSFS during March 2007 to March 2011.
The Government/Management stated (May/September 2011) that the uncertainty in making payments to the developer (GIDC) executing the work of developing infrastructure in SEZ and also the difficulty in operating the account under LDS as GSFS did not provide the facility of cheque book, were the reasons for not deploying the funds under LDS. As such, the loss of interest worked out in Audit was notional.
The reply is not tenable as the funds deposited under LDS could be withdrawn from GSFS at one day notice, hence, there would not be any liquidity problem. Further, the timing for making payments to GIDC was known to the Company in advance as GIDC happened to be the promoter of the Company and also the developer of SEZ. Thus, due to non adherence to GoG instructions, the Company lost the opportunity of earning significant returns on its surplus funds.
The Company should devise proper mechanism for the efficient management of funds duly observing the instructions of GoG issued from time to time so as to safeguard the financial interests of the Company.
Gujarat Urja Vikas Nigam Limited
3.13 Irregular payment
Irregular payment of ` 1.76 crore was made to a firm at the instance of the State Government in violation of Incentive Scheme and Wind Power Policy.
As per the ‘Incentive Scheme for Wind Power Generation-1993’ of Government of Gujarat (GOG), industrial undertakings (IUs) setting up40 Wind Turbine Generator (WTG), if opted for transmitting the energy generated to its factory at a different location, would be permitted to do so
39The funds which were kept more than two days in current accounts of SBI ranged from ` 0.21 lakh to
` 165.14 crore and HDFC ranged from ` 1.86 crore to ` 35.70 crore, which led to loss of interest of ` 2.17 crore and ` 0.29 crore on the funds kept in SBI and HDFC respectively.
40 At the location as identified by Gujarat Energy Development Agency

Chapter III, Transaction Audit Observations
129
through the grid of erstwhile Gujarat Electricity Board (GEB)41 against the payment of wheeling charges42. If the energy of WTG wheeled to grid remained surplus after meeting the captive requirement of IU, the same would be allowed to bank for a period of six months and thereafter the unconsumed energy would lapse. But, if an IU opted to sell the energy to GEB, it would get a fixed rate of ` 1.75 per unit for the energy sold to GEB.
Choksi Tube Company Limited (CTC), an IU, had set up WTGs with a total capacity of 1.84 MW at Navadra, Jamnagar in January 1997. CTC had entered (December 2001) into an agreement with GEB for wheeling the energy generated from its WTGs through GEB grid for meeting the captive requirement of its Unit at Kalol, Mehsana with retrospective effect from February 2001. However, the agreement did not provide for sale of power to GEB. During February 2001 to September 2009, CTC wheeled 15.90 million units (MUs) from WTGs to GEB grid. Of this, only 3.23 MUs was consumed by its Unit during February 2001 to March 2007 and there was no captive consumption thereafter up to September 2009 due to shut down of its Unit.
In September 2009, GoG issued direction to the Company to pay CTC at ` 1.75 per unit for the surplus energy fed into the grid but not utilised for captive consumption. The direction was issued as CTC represented that its WTGs had generated more energy than required for the captive consumption resulting in accumulation of surplus energy over the succeeding years. The Company paid (February 2010) ` 1.76 crore43 to CTC for the 11.41 MUs44 of surplus energy fed to its grid during February 2001 to September 2009 and also executed power purchase agreement (PPA) with CTC for purchasing the unconsumed energy at ` 1.75 per unit effective from October 2009.
We observed that as the wheeling agreement with CTC did not provide for sale of energy, CTC could only transmit the energy of WTG through GEB grid to CTC factory for its captive consumption. Hence, as per the scheme, the surplus energy banked after meeting the captive requirement of CTC would have lapsed automatically on expiry of six months from the date of banking of each unit of energy. Further, as per New Wind Farm Policy-2007, entering into a power purchase agreement (PPA) with the Company is indispensable for sale of energy of WTG by IU. By entering into PPA, IU undertakes several contractual obligations as well, like, not to dump the energy in excess of the schedule allowed, not to claim the payment for the inadvertent flow of energy to grid (i.e. below 2 MW on hourly time block), etc. However, in the instant case, CTC did not undertake any such contractual obligation meant for safeguarding the interest of the Company. Thus, in the absence of PPA, the payment of ` 1.76 crore made to CTC with retrospective effect was irregular and against the financial interests of the Company. 41 The erstwhile GEB was unbundled in a phased manner by 31 March 2005. Since then the activities
related to purchase and sale of power and exercising strategic control over the generation, transmission and distribution companies had been performed by Gujarat Urja Vikas Nigam Limited.
42 Wheeling charges are operation and maintenance charges to GEB. 43 1,14,06,168 units x ` 1.75 per unit= ` 1,99,60,794 less ` 23,64,465 towards O&M charges, service tax
etc. 44 Of the 15.90MUs wheeled to grid, 14.64 MUs were available for CTC after reckoning wheeling
charges and reactive power charges. Of the 14.64 MUs, the captive consumption by CTC Unit was 3.23 MUs and the remaining 11.41 was surplus power fed to grid.

Audit Report No.4 (Commercial) for the year ended 31 March 2011
130
The Government stated (June 2011) that as CTC was not using single unit of energy generated through WTG for their captive consumption and continuing to bank the energy in the grid for many years, GoG considered the representation of CTC and instructed the Company to make the payments for the energy fed to the grid.
The reply is factually not correct as there was captive consumption of energy (3.23 MUs) by CTC during 2001 to 2007. Further, there was no provision in the scheme, either for extension of banking period of energy in grid beyond six months or for making payment for unutilised energy on account of non-consumption of wind energy by the recipient. Moreover, it was not only CTC, there were other 27 WTGs of the Company which had also lost 17.98 MUs of surplus energy to the grid due to banking it in grid for more than six months during 2003 to 2008 without getting any payment from the Company. Thus, the payment made to CTC was irregular and set a wrong precedence, which could prompt other WTGs also to raise similar claims against the Company.
Statutory Corporations
Gujarat State Financial Corporation
3.14 Short recovery of dues under OTS Scheme
Erroneous calculation of OTS amount led to short recovery of ` 1.42 crore from the loanee units.
The Corporation introduced (October 2007) One Time Settlement (OTS) Scheme with the approval (September 2007) of Government of Gujarat to settle the accounts of the loanee units which had availed term loans from it but had defaulted in repayment of their dues. As per terms of the Scheme, the account of the unit which had been declared as Non Performing Asset (NPA) as on 1 May 2007 was eligible to avail the Scheme. As stipulated in the scheme, the Corporation was to re-work out the outstanding dues of the units afresh by applying a concessional rate of 6 to 11 per cent of interest45 against the interest rate of 18 to 21 per cent originally charged on the loan disbursed in the accounts of the units and then deduct the amount of repayments made by the units to arrive at the amount of dues under OTS scheme.
As per the scheme, the amount to be adopted for settlement under OTS should be higher of the following two criteria, i.e. (i) the dues as re-worked out by the Corporation as per the method stated above (criteria I), or (ii) 50 or 65 per cent46 of the principal disbursed including the other incidental expenses 45 The concessional rate of 6, 9 and 11 per cent of interest were applicable for the units to whom the loan
amount disbursed was up to ` 5 lakh, above ` 5 lakh up to ` 15 lakh and ` 15 lakh respectively. This concessional rate of interest was to be applied on compounded quarterly basis from the date of disbursement to the last date of schedule of repayment of loan and, thereafter, simple interest at the concessional rate was to be applied.
46 50 per cent and 65 per cent was applicable to the units to whom the loan disbursed was up to ` 15 lakh and above ` 15 lakh respectively.
Chapter III, Transaction Audit Observations
131
capitalised in the accounts of the unit (criteria II). Further, it was stipulated that if the unit had more than one defaulting loan account, all the defaulting accounts were required to be settled simultaneously by the unit based on the OTS amount determined for each loan account separately.
We observed that two NPA units viz., Khyati Multimedia Entertainment Limited, Mehsana (KMEL) and Principal Pharmaceuticals and Chemicals Limited, Bharuch (PPCL) which had two defaulting accounts each, applied (October 2007/March 2008) for settlement of all the accounts simultaneously under OTS scheme. However, we noticed that while considering the cases for OTS, though the Corporation had separately re-worked out the dues for each account of two NPA units as per Scheme, the OTS amount for each unit was wrongly determined based on the aggregate value of reworked out dues and 65 per cent of the principal disbursed (including other incidental expenses capitalised in the accounts of each unit) against different loan accounts taken together as given in Annexure 14. As a result of erroneous calculation, the Corporation sanctioned (February 2008/May 2008) and recovered (March 2008/September 2008) OTS amount of ` 1.99 crore and ` 0.62 crore instead of correct amount of ` 3.12 crore and ` 0.91 crore from KMEL and PPCL respectively. This led to total short recovery of ` 1.42 crore from the NPA units.
The Management stated (June 2011) that Board of Directors (BOD) granted approval (January 2010), whereby if the OTS amount calculated for any account of the loanee unit was negative then such amount could be adjusted against the OTS amount payable under any other accounts of the same unit.
The reply of the management is not correct. The BoD granted approval for making such adjustment of the negative OTS amount in respect of the new liberal OTS scheme introduced in 2010 as a part of Swarnim Gujarat Celebrations and not for this particular OTS scheme 2007. Moreover, the OTS scheme 2007 was introduced with the approval of GoG, hence, BoD was not competent to allow any concessions or alter the scheme provisions without formal approval of GoG.
Thus, due to erroneous calculation of OTS amount, the Corporation suffered a loss of ` 1.42 crore in settlement of dues of KMEL and PPCL, which tantamounted to passing on of undue benefit to the NPA units in violation to the norms/criteria of OTS scheme 2007 approved by the GOG.
The Corporation should fix the responsibility for erroneous settlement of loan accounts of these NPA units under OTS scheme 2007.
The matter was reported to Government (May 2011); their reply had not been received (November 2011).
Audit Report No.4 (Commercial) for the year ended 31 March 2011
132
Gujarat State Road Transport Corporation
3.15 Avoidable expenditure
Avoidable expenditure of ` 41.60 lakh due to inordinate delay in replacement of scrapped steam boiler
The Tyre-Retreading47 Plant (plant) at the Central Workshop of the Corporation, Ahmedabad, had steam boiler (boiler) which was using furnace oil and burnt oil as fuel. The boiler was in use since 1957 and completed its useful life. As it had some defects, it was declared as scrap in May 2006. The Workshop Manager, however, belatedly, in December 2007, sent his proposal to the Head of the Office of the Corporation for purchase of a new Thermic Fluid Heater (heater)48 estimated to cost ` 10 lakh to replace the scrapped boiler. The Vice Chairman-cum Managing Director accorded approval for the proposal in June 2008 as the heater was more fuel efficient compared to the boiler. Moreover, there would be a saving in the manpower cost as the use of heater would not require the services of boiler attendant.
The Corporation invited (September 2008) e-tender for supply and commissioning of the heater, but no bid was received. Again, it invited (November 2008) tender but did not award the work on the plea that the only technically qualified bidder49, had quoted a rate of ` 14.74 lakh which was higher by ` 4.76 lakh compared to the rate of another supplier50 who did not participate in bidding. In June 2009, the Corporation re-invited the tender for the work with a revised estimated cost of ` 15 lakh. Of the four technically qualified bids received, L1 bidder, i.e. Fluid Tech Builders (FTB), Ahmedabad was selected (September 2009) for award of the work at a total cost of ` 13.47 lakh. The Corporation, however, took seven months for awarding (May 2010) the work to FTB and the heater was commissioned in November 2010.
We observed that though the Corporation was well aware of the fact that the old boiler had outlived its life and the new heater was an efficient and cost effective replacement of old boiler, it inordinately delayed the commissioning of new heater on account of avoidable reason. In view of this, the Corporation should not have taken a period of 52 months (June 2006 to May 2010) for procuring and commissioning of the heater for the Plant. Had the Corporation promptly acted after declaration of the boiler as scrap and taken timely procurement action, it could have procured and installed the heater within a period of ten months, i.e. upto March 2007.
Our analysis of related cost data indicated that the average cost of retreading of tyres in the Plant after installation of the new heater was only ` 163.81 per
47 The old tread in the worn out tyre is polished away and a new rubber tread is applied to the bare
casing using this plant. This retreading process extends the useful life of the tyre. 48 It is a coil type vertical thermal oil heater and has larger heating surface and efficient burner to get
high thermal efficiency. The heater HSD oil as fuel 49 Praj Sales, Ahmedabad. 50 Isotex Corporation.

Chapter III, Transaction Audit Observations
133
tyre51 as compared to the average cost of retreading of ` 267.48 per tyre52 in the Plant with the boiler. This difference of ` 103.67 per tyre was due to lesser fuel cost incurred in the Plant by using the heater in the place of boiler. Hence, the Corporation had incurred ` 41.60 lakh for the work of retreading of 40,127 tyres done through the Plant with use of the boiler during the period from April 2007 to November 2010.
The Management stated (August 2011) that the attendant of the scrapped boiler was to retire in May 2009 and till then it had to incur cost of ` 7.26 lakh towards his salary. Keeping this in view and also by considering the lead time of eight to nine months in the procurement and commissioning of new heater, it had initiated for procurement action in September 2008. Further, it took some time as it was in search of right heater from a competent manufacturer.
The reply is not tenable. As it was uneconomical to repair and maintain the old boiler, the Management declared it as scrap in May 2006. Hence, the replacement of old boiler with heater should not have been delayed on the plea of incurring the cost towards salary of the attendant which was negligible and there was an option to avail his services elsewhere till his retirement. The Corporation should fix the responsibility for the inordinate delay in procurement of a cost saving device.
The matter was reported to Government (July 2011); their reply had not been received (November 2011).
General
3.16 Follow-up action on Audit Reports
Outstanding action taken notes
3.16.1 Reports of the Comptroller and Auditor General of India represent the culmination of the process of scrutiny starting with initial inspection of accounts and records maintained by various public sector undertakings (PSUs). It is, therefore, necessary that they elicit appropriate and timely response from the Executive. As per rule 7 of the Rules of Procedure (Internal Working) of Committee on Public Undertakings (COPU), Gujarat Legislative Assembly, all the administrative departments of PSUs should submit, within three months of their presentation to the Legislature, explanatory notes indicating the corrective/ remedial action taken or proposed to be taken on paragraphs and performance audits included in the Audit Reports.
51 Calculated based on 5,244 tyres retreaded at the total fuel (HSD oil) cost of ` 8.59 lakh incurred during
December 2010 to May 2011. 52 Calculated based on 40,127 tyres retreaded at the total fuel (furnace oil and burnet oil) cost of
` 107.33 lakh incurred during April 2007 to November 2011.
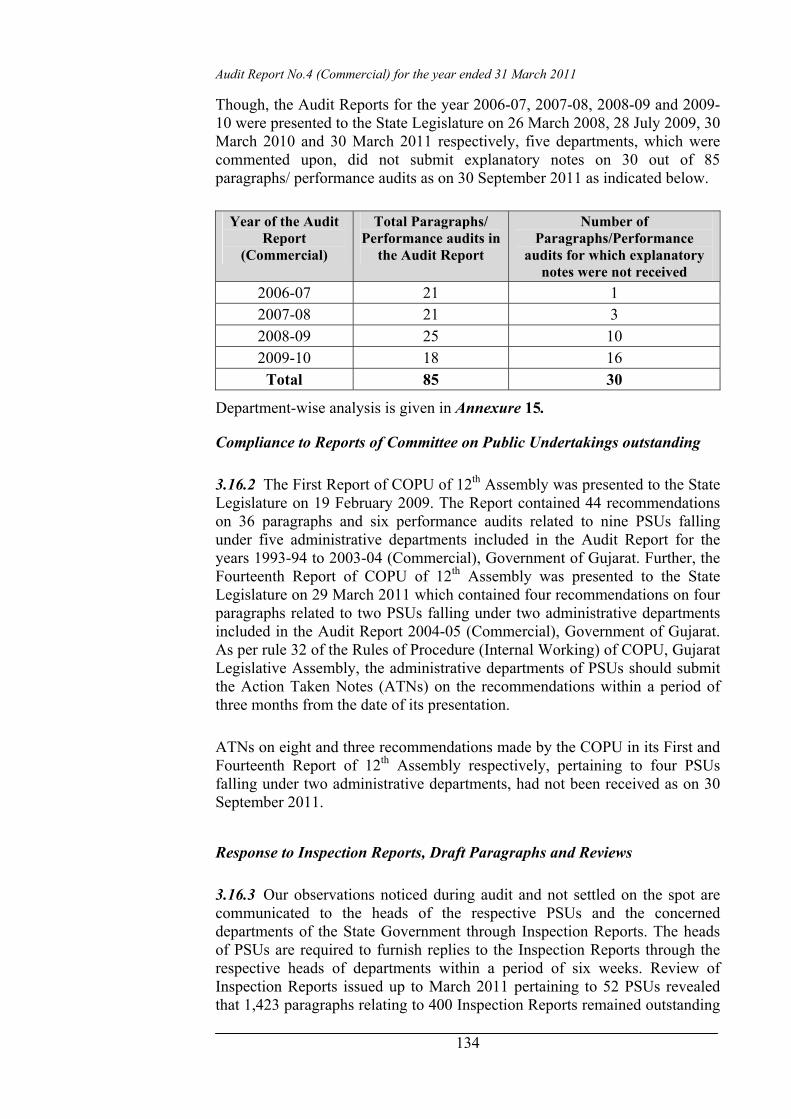
Audit Report No.4 (Commercial) for the year ended 31 March 2011
134
Though, the Audit Reports for the year 2006-07, 2007-08, 2008-09 and 2009-10 were presented to the State Legislature on 26 March 2008, 28 July 2009, 30 March 2010 and 30 March 2011 respectively, five departments, which were commented upon, did not submit explanatory notes on 30 out of 85 paragraphs/ performance audits as on 30 September 2011 as indicated below.
Year of the Audit Report
(Commercial)
Total Paragraphs/ Performance audits in
the Audit Report
Number of Paragraphs/Performance
audits for which explanatory notes were not received
2006-07 21 1 2007-08 21 3 2008-09 25 10 2009-10 18 16
Total 85 30
Department-wise analysis is given in Annexure 15.
Compliance to Reports of Committee on Public Undertakings outstanding
3.16.2 The First Report of COPU of 12th Assembly was presented to the State Legislature on 19 February 2009. The Report contained 44 recommendations on 36 paragraphs and six performance audits related to nine PSUs falling under five administrative departments included in the Audit Report for the years 1993-94 to 2003-04 (Commercial), Government of Gujarat. Further, the Fourteenth Report of COPU of 12th Assembly was presented to the State Legislature on 29 March 2011 which contained four recommendations on four paragraphs related to two PSUs falling under two administrative departments included in the Audit Report 2004-05 (Commercial), Government of Gujarat. As per rule 32 of the Rules of Procedure (Internal Working) of COPU, Gujarat Legislative Assembly, the administrative departments of PSUs should submit the Action Taken Notes (ATNs) on the recommendations within a period of three months from the date of its presentation.
ATNs on eight and three recommendations made by the COPU in its First and Fourteenth Report of 12th Assembly respectively, pertaining to four PSUs falling under two administrative departments, had not been received as on 30 September 2011.
Response to Inspection Reports, Draft Paragraphs and Reviews
3.16.3 Our observations noticed during audit and not settled on the spot are communicated to the heads of the respective PSUs and the concerned departments of the State Government through Inspection Reports. The heads of PSUs are required to furnish replies to the Inspection Reports through the respective heads of departments within a period of six weeks. Review of Inspection Reports issued up to March 2011 pertaining to 52 PSUs revealed that 1,423 paragraphs relating to 400 Inspection Reports remained outstanding
Chapter III, Transaction Audit Observations
135
as on 30 September 2011. Department-wise break-up of Inspection Reports and audit observations outstanding as on 30 September 2011 is given in Annexure 16.
Similarly, draft paragraphs and performance audits on the working of PSUs are forwarded to the Principal Secretary/Secretary of the Administrative Department concerned demi-officially seeking confirmation of facts and figures and their comments thereon within a period of six weeks. We noticed that five draft paragraphs and one performance audit forwarded to the various departments during May to August 2011 as detailed in Annexure 17 had not been replied to so far (November 2011).
It is recommended that the Government should ensure that (a) procedure exists for action against the officials who fail to send replies to inspection reports/draft paragraphs/ performance audits and ATNs to the recommendations of COPU as per the prescribed time schedule; (b) action to recover loss/ outstanding advances/ overpayment is taken within the prescribed time; and (c) the system of responding to audit observations is strengthened.
AHMEDABAD (Dr. P. MUKHERJEE) The Principal Accountant General (Commercial and Receipt Audit), Gujarat
Countersigned
NEW DELHI (VINOD RAI) The Comptroller and Auditor General of India

Audit Report No.4 (Commercial) for the year ended 31 March 2011
136
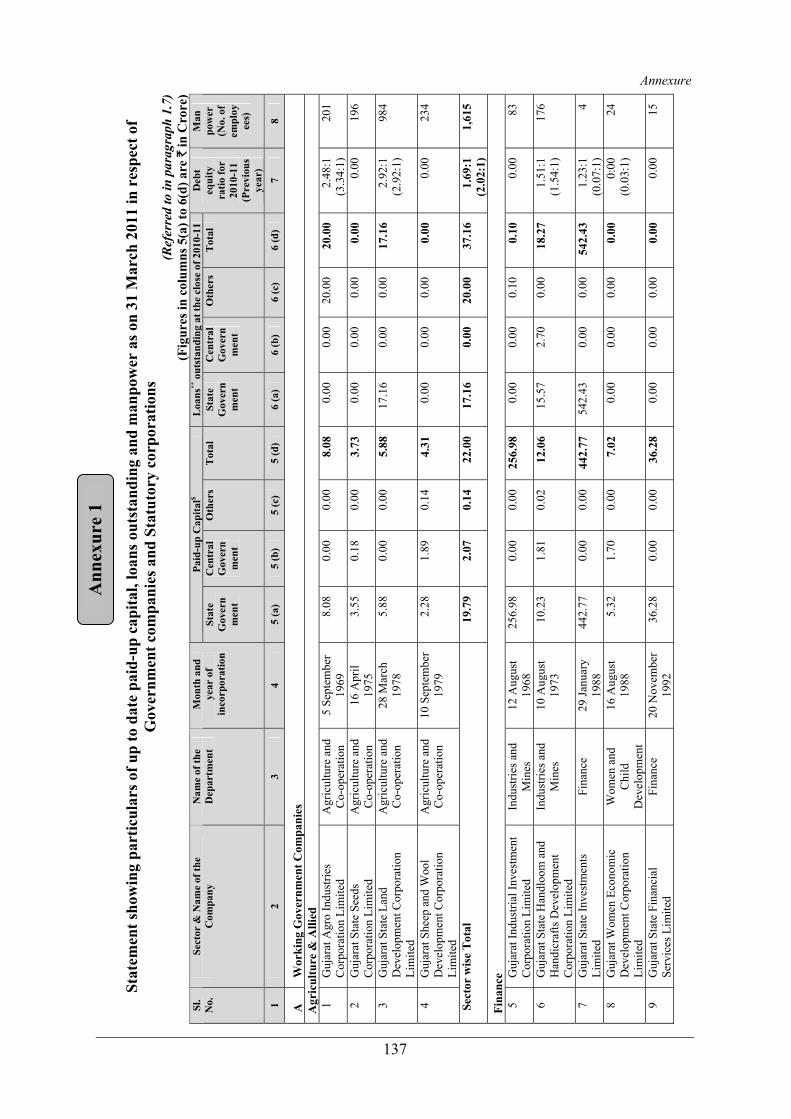
137
Stat
emen
t sho
win
g pa
rtic
ular
s of u
p to
dat
e pa
id-u
p ca
pita
l, lo
ans o
utst
andi
ng a
nd m
anpo
wer
as o
n 31
Mar
ch 2
011
in r
espe
ct o
f G
over
nmen
t com
pani
es a
nd S
tatu
tory
cor
pora
tions
(R
efer
red
to in
par
agra
ph 1
.7)
(Fig
ures
in c
olum
ns 5
(a) t
o 6(
d) a
re `
in C
rore
) Pa
id-u
p C
apita
l$ L
oans
** o
utst
andi
ng a
t the
clo
se o
f 201
0-11
Sl
. N
o.
Sect
or &
Nam
e of
the
Com
pany
N
ame
of th
e D
epar
tmen
t M
onth
and
ye
ar o
f in
corp
orat
ion
Stat
e G
over
nm
ent
Cen
tral
G
over
nm
ent
Oth
ers
Tot
al
Stat
e G
over
nm
ent
Cen
tral
G
over
nm
ent
Oth
ers
Tot
al
Deb
t eq
uity
ra
tio fo
r 20
10-1
1 (P
revi
ous
year
)
Man
po
wer
(N
o. o
f em
ploy
ees)
1 2
3 4
5 (a
) 5
(b)
5 (c
) 5
(d)
6 (a
) 6
(b)
6 (c
) 6
(d)
7 8
A
Wor
king
Gov
ernm
ent C
ompa
nies
A
gric
ultu
re &
Alli
ed
1 G
ujar
at A
gro
Indu
strie
s C
orpo
ratio
n Li
mite
d A
gric
ultu
re a
nd
Co-
oper
atio
n 5
Sept
embe
r 19
69
8.08
0.
00
0.00
8.
08
0.00
0.
00
20.0
0 20
.00
2.48
:1
(3
.34:
1)
201
2 G
ujar
at S
tate
See
ds
Cor
pora
tion
Lim
ited
Agr
icul
ture
and
C
o-op
erat
ion
16 A
pril
1975
3.
55
0.18
0.
00
3.73
0.
00
0.00
0.
00
0.00
0.
00
196
3 G
ujar
at S
tate
Lan
d D
evel
opm
ent C
orpo
ratio
n Li
mite
d
Agr
icul
ture
and
C
o-op
erat
ion
28 M
arch
19
78
5.88
0.
00
0.00
5.
88
17.1
6 0.
00
0.00
17
.16
2.92
:1
(2
.92:
1)
984
4 G
ujar
at S
heep
and
Woo
l D
evel
opm
ent C
orpo
ratio
n Li
mite
d
Agr
icul
ture
and
C
o-op
erat
ion
10 S
epte
mbe
r 19
79
2.28
1.
89
0.14
4.
31
0.00
0.
00
0.00
0.
00
0.00
23
4
Sec
tor
wis
e T
otal
19
.79
2.07
0.
14
22.0
0 17
.16
0.00
20
.00
37.1
6 1.
69:1
(2.0
2:1)
1,
615
Fina
nce
5 G
ujar
at In
dust
rial I
nves
tmen
t C
orpo
ratio
n Li
mite
d In
dust
ries a
nd
Min
es
12 A
ugus
t 19
68
256.
98
0.00
0.
00
256.
98
0.00
0.
00
0.10
0.
10
0.00
83
6 G
ujar
at S
tate
Han
dloo
m a
nd
Han
dicr
afts
Dev
elop
men
t C
orpo
ratio
n Li
mite
d
Indu
strie
s and
M
ines
10
Aug
ust
1973
10
.23
1.81
0.
02
12.0
6 15
.57
2.70
0.
00
18.2
7 1.
51:1
(1.5
4:1)
17
6
7 G
ujar
at S
tate
Inve
stm
ents
Li
mite
d Fi
nanc
e 29
Janu
ary
1988
44
2.77
0.
00
0.00
44
2.77
54
2.43
0.
00
0.00
54
2.43
1.
23:1
(0
.07:
1)
4
8 G
ujar
at W
omen
Eco
nom
ic
Dev
elop
men
t Cor
pora
tion
Li
mite
d
Wom
en a
nd
Chi
ld
Dev
elop
men
t
16 A
ugus
t 19
88
5.32
1.
70
0.00
7.
02
0.00
0.
00
0.00
0.
00
0:00
(0
.03:
1)
24
9 G
ujar
at S
tate
Fin
anci
al
Serv
ices
Lim
ited
Fina
nce
20 N
ovem
ber
1992
36
.28
0.00
0.
00
36.2
8 0.
00
0.00
0.
00
0.00
0.
00
15
Ann
exur
e 1
Annexure

138
(Fig
ures
in c
olum
ns 5
(a) t
o 6(
d) a
re `
in C
rore
) Sl
. N
o.
Sect
or &
Nam
e of
the
Com
pany
N
ame
of th
e D
epar
tmen
t M
onth
and
ye
ar o
f in
corp
orat
ion
Paid
-up
Cap
ital$
Loa
ns**
outs
tand
ing
at th
e cl
ose
of 2
010-
11D
ebt
equi
ty
ratio
for
2010
-11
(Pre
viou
s ye
ar)
Man
pow
er
(No.
of
empl
o ye
es)
Stat
e G
over
nmen
t
Cen
tral
G
over
n-m
ent
Oth
ers
Tot
alSt
ate
Gov
ern
men
t
Cen
tral
G
over
nm
ent
Oth
ers
Tot
al
1 2
3 4
5 (a
) 5
(b)
5 (c
) 5
(d)
6 (a
) 6
(b)
6 (c
) 6
(d)
7 8
10
GSF
S C
apita
l and
Se
curit
ies L
imite
dFi
nanc
e03
Mar
ch
1998
0.00
0.00
5.00
5.
000.
000.
000.
000.
000.
001
11
Guj
arat
Min
oriti
es
Fina
nce
and
Dev
elop
men
t C
orpo
ratio
n L
imite
d
Soci
al Ju
stic
e an
d Em
pow
erm
ent
24 S
epte
mbe
r 19
99
10.0
00.
000.
00
10.0
08.
530.
0040
.43
48.9
64.
9:1
(7
.30:
1)
17
12
Infr
astru
ctur
e Fi
nanc
e C
ompa
ny G
ujar
at li
mite
d Fi
nanc
e3
Febr
uary
20
00
0.00
0.00
2.50
2.
500.
000.
000.
000.
000.
000
13
Guj
arat
Gop
alak
D
evel
opm
ent C
orpo
ratio
n Li
mite
d
Soci
al Ju
stic
e an
d Em
pow
erm
ent
18 M
ay 2
001
4.10
0.00
0.00
4.
100.
000.
008.
588.
582.
09:1
(2
.27:
1)
14
14
Guj
arat
Saf
ai K
amda
r V
ikas
Nig
am L
imite
d So
cial
Just
ice
and
Empo
wer
men
t
24 O
ctob
er
2001
4.
000.
000.
00
4.00
7.67
0.00
37.9
745
.64
11.4
1:1
(1
1.85
:1)
65
15
Guj
arat
Thak
or a
nd K
oli
Vik
as N
igam
Lim
ited
Soci
al Ju
stic
e an
d Em
pow
erm
ent
19 S
epte
mbe
r 20
03
2.85
0.00
Rs.7
00
only
2.
851.
900.
009.
2611
.16
3.92
:1
(4.9
4:1)
4
16
Guj
arat
Liv
elih
ood
Prom
otio
n C
ompa
ny
Lim
ited
Panc
haya
t Rur
al
Hou
sing
and
R
ural
D
evel
opm
ent
21 A
p ril
2010
0.05
0.00
0.00
0.
050.
000.
000.
000.
000.
0011
Sec
tor
wis
e T
otal
772.
583.
517.
52
783.
6157
6.10
2.70
96.3
467
5.14
0.86
:1
(0.2
3:1)
41
4
Infr
astr
uctu
re17
G
ujar
at S
tate
Rur
al
Dev
elop
men
t Cor
pora
tion
Lim
ited
Panc
haya
t Rur
al
Hou
sing
and
R
ural
D
evel
opm
ent
7 Ju
ly19
77
0.58
0.00
0.00
0.
580.
000.
000.
000.
000.
0014
5
18
Guj
arat
Por
ts
Infr
astru
ctur
e an
d D
evel
opm
ent C
ompa
ny
Lim
ited
Ports
and
Tr
ansp
ort
27 A
ugus
t 19
82
0.00
0.00
18.0
0 18
.00
0.00
0.00
0.00
0.00
0.00
6
19
Guj
arat
Sta
te P
olic
e H
ousi
ng C
orpo
ratio
n Li
mite
d
Hom
e1
Nov
embe
r 19
88
50.0
00.
000.
00
50.0
00.
000.
000.
000.
000.
0024
8
Audit Report No.4 (Commercial) for the year ended 31 March 2011
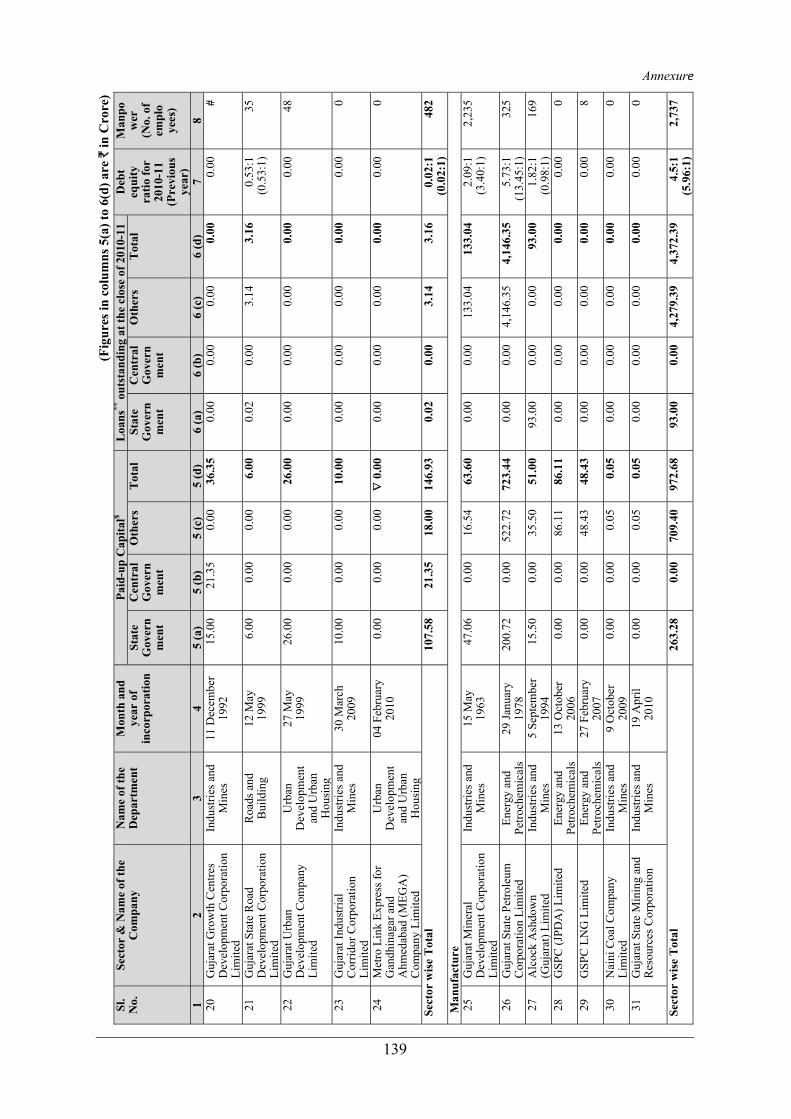
139
(Fig
ures
in c
olum
ns 5
(a) t
o 6(
d) a
re `
in C
rore
) Sl
. N
o.
Sect
or &
Nam
e of
the
Com
pany
N
ame
of th
e D
epar
tmen
t M
onth
and
ye
ar o
f in
corp
orat
ion
Paid
-up
Cap
ital$
Loa
ns**
outs
tand
ing
at th
e cl
ose
of 2
010-
11D
ebt
equi
ty
ratio
for
2010
-11
(Pre
viou
s ye
ar)
Man
pow
er
(No.
of
empl
o ye
es)
Stat
e G
over
nm
ent
Cen
tral
G
over
nm
ent
Oth
ers
Tot
alSt
ate
Gov
ern
men
t
Cen
tral
G
over
nm
ent
Oth
ers
Tot
al
1 2
3 4
5 (a
)5
(b)
5 (c
)5
(d)
6 (a
)6
(b)
6 (c
)6
(d)
78
20
Guj
arat
Gro
wth
Cen
tres
Dev
elop
men
t Cor
pora
tion
Li
mite
d
Indu
strie
s and
M
ines
11
Dec
embe
r 19
92
15.0
021
.35
0.00
36.3
50.
000.
000.
000.
000.
00#
21
Guj
arat
Sta
te R
oad
Dev
elop
men
t Cor
pora
tion
Lim
ited
Roa
ds a
nd
Bui
ldin
g 12
May
1999
6.
000.
000.
006.
000.
020.
003.
143.
160.
53:1
(0
.53:
1)
35
22
Guj
arat
Urb
an
Dev
elop
men
t Com
pany
Li
mite
d
Urb
an
Dev
elop
men
t an
d U
rban
H
ousi
n g
27 M
ay19
99
26.0
00.
000.
0026
.00
0.00
0.00
0.00
0.00
0.00
48
23
Guj
arat
Indu
stria
l C
orrid
or C
orpo
ratio
n Li
mite
d
Indu
strie
s and
M
ines
30
Mar
ch20
09
10.0
00.
000.
0010
.00
0.00
0.00
0.00
0.00
0.00
0
24
Met
ro L
ink
Expr
ess f
or
Gan
dhin
agar
and
A
hmed
abad
(MEG
A)
Com
pany
Lim
ited
Urb
an
Dev
elop
men
t an
d U
rban
H
ousi
n g
04 F
ebru
ary
20
10
0.00
0.00
0.00
∇ 0
.00
0.00
0.00
0.00
0.00
0.00
0
Sect
or w
ise
Tot
al10
7.58
21.3
518
.00
146.
930.
020.
003.
143.
160.
02:1
(0
.02:
1)48
2
Man
ufac
ture
25
G
ujar
at M
iner
al
Dev
elop
men
t Cor
pora
tion
Lim
ited
Indu
strie
s and
M
ines
15
May
1963
47
.06
0.00
16.5
463
.60
0.00
0.00
133.
0413
3.04
2.09
:1
(3.4
0:1)
2,
235
26
Guj
arat
Sta
te P
etro
leum
C
orpo
ratio
n Li
mite
d En
ergy
and
Pe
troch
emic
als
29 Ja
nuar
y 19
7820
0.72
0.00
522.
7272
3.44
0.00
0.00
4,14
6.35
4,14
6.35
5.73
:1
(13.
45:1
)32
5
27
Alc
ock
Ash
dow
n (G
ujar
at) L
imite
dIn
dust
ries a
nd
Min
es5
Sept
embe
r 19
9415
.50
0.00
35.5
051
.00
93.0
00.
000.
0093
.00
1.82
:1
(0.9
8:1)
169
28
GSP
C (J
PDA
) Lim
ited
Ener
gy a
nd
Petro
chem
ical
s13
Oct
ober
20
060.
000.
0086
.11
86.1
10.
000.
000.
000.
000.
000
29
GSP
C L
NG
Lim
ited
Ener
gy a
nd
Petro
chem
ical
s27
Feb
ruar
y 20
070.
000.
0048
.43
48.4
30.
000.
000.
000.
000.
008
30
Nai
ni C
oal C
ompa
ny
Lim
ited
Indu
strie
s and
M
ines
9 O
ctob
er20
090.
000.
000.
050.
050.
000.
000.
000.
000.
000
31
Guj
arat
Sta
te M
inin
g an
d R
esou
rces
Cor
pora
tion
In
dust
ries a
nd
Min
es
19 A
pril
2010
0.
000.
000.
050.
050.
000.
000.
000.
000.
000
Sect
or w
ise
Tot
al26
3.28
0.00
709.
4097
2.68
93.0
00.
004,
279.
394,
372.
394.
5:1
(5.9
6:1)
2,73
7
Annexure

140
(Fig
ures
in c
olum
ns 5
(a) t
o 6(
d) a
re `
in C
rore
) Sl
. N
o.
Sect
or &
Nam
e of
the
Com
pany
N
ame
of th
e D
epar
tmen
t M
onth
and
ye
ar o
f in
corp
orat
ion
Paid
-up
Cap
ital$
Loa
ns**
out
stan
ding
at t
he c
lose
of 2
010-
11
Deb
t eq
uity
ra
tio fo
r 20
10-1
1 (P
revi
ous
yea
r)
Man
pow
er
(No.
of
empl
oye
es)
Stat
e G
over
nm
ent
Cen
tral
G
over
nm
ent
Oth
ers
Tot
al
Stat
e G
over
nmen
t
Cen
tral
G
over
nm
ent
Oth
ers
Tot
al
1 2
3 4
5 (a
) 5
(b)
5 (c
) 5
(d)
6 (a
) 6
(b)
6 (c
) 6
(d)
7 8
Pow
er
32
G
ujar
at P
ower
C
orpo
ratio
n Li
mite
d En
ergy
and
Pe
troch
emic
als
28 Ju
ne 1
990
263.
28
0.00
19
.30
282.
58
0.00
0.
00
0.00
0.
00
0.00
38
33
Guj
arat
Sta
te E
lect
ricity
C
orpo
ratio
n Li
mite
d En
ergy
and
Pe
troch
emic
als
12 A
ugus
t 19
93
0.00
0.
00
1,68
1.02
1,
681.
02
0.00
0.
00
5,65
1.88
5,
651.
88
3.36
:1
(3.5
1:1)
7,
964
34
Guj
arat
Sta
te E
nerg
y G
ener
atio
n Li
mite
d En
ergy
and
Pe
troch
emic
als
13 D
ecem
ber
1998
0.
00
0.00
33
2.47
33
2.47
0.
00
0.00
63
3.26
63
3.26
1.
9:1
(1
.93:
1)
16
35
Guj
arat
Ene
rgy
Tran
smis
sion
C
orpo
ratio
n Li
mite
d
Ener
gy a
nd
Petro
chem
ical
s 19
May
19
99
12.5
0 0.
00
582.
22
594.
72
79.3
3 0.
00
3,61
6.61
3,
695.
94
6.21
:1
(5.4
7:1)
12
,196
36
Dak
shin
Guj
arat
Vij
Com
pany
Lim
ited
Ener
gy a
nd
Petro
chem
ical
s 15
Sep
tem
ber
2003
0.
00
0.00
26
7.73
26
7.73
0.
00
47.0
2 17
6.61
22
3.63
0.
84:1
(0
.85:
1)
4,57
8
37
Mad
hya
Guj
arat
Vij
Com
pany
Lim
ited
Ener
gy a
nd
Petro
chem
ical
s 15
Sep
tem
ber
2003
0.
00
0.00
24
2.64
24
2.64
0.
00
0.00
26
2.10
26
2.10
1.
08:1
(1
.04:
1)
5,96
8
38
Pasc
him
Guj
arat
Vij
Com
pany
Lim
ited
Ener
gy a
nd
Petro
chem
ical
s 15
Sep
tem
ber
2003
0.
00
0.00
56
2.90
56
2.90
29
4.62
15
9.97
19
8.92
65
3.51
1.
16:1
(1
.30:
1)
12,8
66
39
Utta
r Guj
arat
Vij
Com
pany
Lim
ited
Ener
gy a
nd
Petro
chem
ical
s 15
Sep
tem
ber
2003
0.
00
0.00
23
7.15
23
7.15
79
.24
29.8
7 21
1.89
32
1.00
1.
35:1
(1
.63:
1)
6,99
3
40
Guj
arat
Urja
Vik
as
Nig
am L
imite
d En
ergy
and
Pe
troch
emic
als
22 D
ecem
ber
2004
4,
043.
600.
00
0.00
4,
043.
60
315.
65
0.00
14
7.58
46
3.23
0.
11:1
(0
.15:
1)
297
41
GSP
C P
ipav
av P
ower
C
ompa
ny L
imite
d En
ergy
and
Pe
troch
emic
als
22 F
ebru
ary
2006
0.
00
0.00
16
8.65
16
8.65
0.
00
0.00
97
7.96
97
7.96
5.
8:1
(1
.53:
1)
24
42
Bha
vnag
ar E
nerg
y C
ompa
ny L
imite
d En
ergy
and
Pe
troch
emic
als
26 Ju
ly
2007
0.
00
0.00
17
2.75
17
2.75
0.
00
0.00
0.
00
0.00
0.
00
19
Sect
or w
ise
Tot
al
4,31
9.38
0.00
4,
266.
83
8,58
6.21
76
8.84
23
6.86
11
,876
.81
12,8
82.5
1 1.
5:1
(1
.46:
1)
50,9
59
Serv
ice
43
To
uris
m C
orpo
ratio
n of
G
ujar
at L
imite
d In
dust
ries a
nd
Min
es
10 Ju
ne
1975
20
.00
0.00
0.
00
20.0
0 0.
00
0.00
0.
00
0.00
0.
00
341
44
Guj
arat
Indu
stria
l and
Te
chni
cal C
onsu
ltanc
y Li
mite
d
Indu
strie
s and
M
ines
8
Dec
embe
r 19
78
0.00
0.
00
0.20
0.
20
0.00
0.
00
0.00
0.
00
0.00
34
Audit Report No.4 (Commercial) for the year ended 31 March 2011

141
(Fig
ures
in c
olum
ns 5
(a) t
o 6(
d) a
re `
in C
rore
) Sl
. N
o.
Sect
or &
Nam
e of
the
Com
pany
N
ame
of th
e D
epar
tmen
t M
onth
and
ye
ar o
f in
corp
orat
ion
Paid
-up
Cap
ital$
Loa
ns**
out
stan
ding
at t
he c
lose
of 2
010-
11
Deb
t eq
uity
ra
tio fo
r 20
10-1
1 (P
revi
ous
year
)
Man
pow
er
(No.
of
empl
oye
es)
Stat
e G
over
nm
ent
Cen
tral
G
over
nm
ent
Oth
ers
Tot
al
Stat
e G
over
nm
ent
Cen
tral
G
over
nm
ent
Oth
ers
Tot
al
1 2
3 4
5 (a
) 5
(b)
5 (c
) 5
(d)
6 (a
) 6
(b)
6 (c
) 6
(d)
7 8
45
Guj
arat
Sta
te C
ivil
Supp
lies C
orpo
ratio
n Li
mite
d
Food
, Civ
il Su
pplie
s and
C
onsu
mer
A
ffai
rs
26 S
epte
mbe
r 19
80
10.0
0 0.
00
0.00
10
.00
0.00
0.
00
0.00
0.
00
0.00
1,
679
46
Guj
arat
Sta
te P
etro
net
Lim
ited
Ener
gy a
nd
Petro
chem
ical
s 23
Dec
embe
r 19
98
0.00
0.
00
562.
58
562.
58
0.00
0.
00
1,47
8.19
1,
478.
19
2.63
:1
(2.2
3:1)
16
2
47
Guj
arat
Info
rmat
ics
Lim
ited
Scie
nce
and
Te
chno
logy
19
Feb
ruar
y 19
99
17.0
6 0.
00
1.45
18
.51
10.8
0 0.
00
0.00
10
.80
0.58
:1
(0.5
8:1)
47
48
GSP
C G
as C
ompa
ny
Lim
ited
Ener
gy a
nd
Petro
chem
ical
s 11
Mar
ch
1999
28
.42
0.00
15
6.81
18
5.23
0.
00
0.00
36
2.49
36
2.49
1.
96:1
(2
.09:
1)
272
49
Guj
arat
Info
pet
ro
Lim
ited
Scie
nce
and
Te
chno
logy
15
Janu
ary
2001
0.
00
0.00
0.
05
0.05
0.
00
0.00
0.
00
0.00
0.
00
118
50
Guj
arat
Fou
ndat
ion
for
Men
tal H
ealth
and
Alli
ed
Scie
nces
(b)
Hea
lth a
nd
Fam
ily W
elfa
re
29 A
pril
2003
0.
02
0.00
0.
00
0.02
0.
00
0.00
0.
00
0.00
0.
00
0
51
Dah
ej S
EZ L
imite
d In
dust
ries a
nd
Min
es
21 S
epte
mbe
r 20
04
0.00
0.
00
0.05
0.
05
0.00
0.
00
0.00
0.
00
0.00
21
52
Guj
arat
Wat
er R
esou
rces
D
evel
opm
ent C
orpo
ratio
n
Lim
ited
Nar
mad
a, W
ater
R
esou
rces
, W
ater
Sup
ply
and
Kal
psar
3 M
ay
1971
31
.49
0.00
0.
00
31.4
9 0.
00
0.00
0.
00
0.00
0.
00
3,28
0
53
Guj
arat
Sta
te F
ores
t D
evel
opm
ent C
orpo
ratio
n Li
mite
d
Fore
st a
nd
Envi
ronm
ent
20 A
ugus
t 19
76
3.93
2.
39
0.00
6.
32
0.00
0.
00
0.00
0.
00
0.00
25
8
Sect
or w
ise
Tot
al
110.
92
2.39
72
1.14
83
4.45
10
.80
0.00
1,
840.
68
1,85
1.48
2.
22:1
(1
.98:
1)
6,21
2
Mis
cella
neou
s 54
G
ujar
at R
ural
Indu
strie
s M
arke
ting
Cor
pora
tion
Li
mite
d
Indu
strie
s and
M
ines
16
May
19
79
9.17
0.
00
0.00
9.
17
0.00
0.
00
0.00
0.
00
0.00
62
55
Sard
ar S
arov
ar N
arm
ada
Nig
am L
imite
d N
arm
ada,
Wat
er
Res
ourc
es,
Wat
er S
uppl
y an
d K
alps
ar
24 M
arch
19
88
28,1
03.7
5 0.
00
0.00
28
,103
.75
0.00
0.
00
4,29
4.88
4,
294.
88
0.15
:1
(0.2
1:1)
4,
776
Annexure
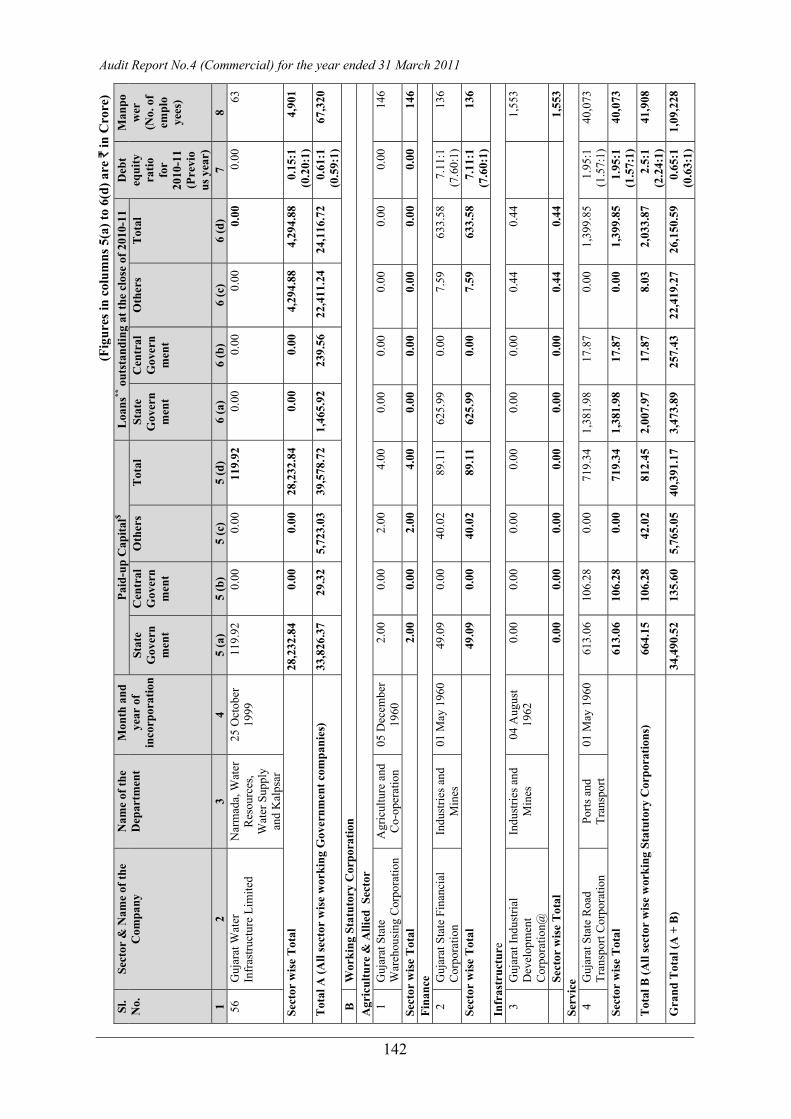
142
(Fig
ures
in c
olum
ns 5
(a) t
o 6(
d) a
re `
in C
rore
) Sl
. N
o.
Sect
or &
Nam
e of
the
Com
pany
N
ame
of th
e D
epar
tmen
t M
onth
and
ye
ar o
f in
corp
orat
ion
Paid
-up
Cap
ital$
Loa
ns**
out
stan
ding
at t
he c
lose
of 2
010-
11
Deb
t eq
uity
ra
tio
for
2010
-11
(Pre
vio
us y
ear)
Man
pow
er
(No.
of
empl
o ye
es)
Stat
e G
over
nm
ent
Cen
tral
G
over
nm
ent
Oth
ers
Tot
al
Stat
e G
over
nm
ent
Cen
tral
G
over
nm
ent
Oth
ers
Tot
al
1 2
3 4
5 (a
) 5
(b)
5 (c
) 5
(d)
6 (a
) 6
(b)
6 (c
) 6
(d)
7 8
56
Guj
arat
Wat
er
Infr
astru
ctur
e Li
mite
d N
arm
ada,
Wat
er
Res
ourc
es,
Wat
er S
uppl
y an
d K
alps
ar
25 O
ctob
er
1999
11
9.92
0.
00
0.00
11
9.92
0.
00
0.00
0.
00
0.00
0.
00
63
Sect
or w
ise
Tot
al
28,2
32.8
4 0.
00
0.00
28
,232
.84
0.00
0.
00
4,29
4.88
4,
294.
88
0.15
:1
(0.2
0:1)
4,
901
Tot
al A
(All
sect
or w
ise
wor
king
Gov
ernm
ent c
ompa
nies
) 33
,826
.37
29.3
2 5,
723.
03
39,5
78.7
2 1,
465.
92
239.
56
22,4
11.2
4 24
,116
.72
0.61
:1
(0.5
9:1)
67
,320
B
Wor
king
Sta
tuto
ry C
orpo
ratio
n A
gric
ultu
re &
Alli
ed S
ecto
r
1 G
ujar
at S
tate
W
areh
ousi
ng C
orpo
ratio
n A
gric
ultu
re a
nd
Co-
oper
atio
n 05
Dec
embe
r 19
60
2.00
0.
00
2.00
4.
00
0.00
0.
00
0.00
0.
00
0.00
14
6
Sect
or w
ise
Tot
al
2.00
0.
00
2.00
4.
00
0.00
0.
00
0.00
0.
00
0.00
14
6 Fi
nanc
e
2 G
ujar
at S
tate
Fin
anci
al
Cor
pora
tion
Indu
strie
s and
M
ines
01
May
196
0 49
.09
0.00
40
.02
89.1
1 62
5.99
0.
00
7.59
63
3.58
7.
11:1
(7
.60:
1)
136
Sect
or w
ise
Tot
al
49.0
9 0.
00
40.0
2 89
.11
625.
99
0.00
7.
59
633.
58
7.11
:1
(7.6
0:1)
13
6
Infr
astr
uctu
re
3 G
ujar
at In
dust
rial
Dev
elop
men
t C
orpo
ratio
n@
Indu
strie
s and
M
ines
04
Aug
ust
1962
0.
00
0.00
0.
00
0.00
0.
00
0.00
0.
44
0.44
1,55
3
Se
ctor
wis
e T
otal
0.
00
0.00
0.
00
0.00
0.
00
0.00
0.
44
0.44
1,55
3 Se
rvic
e
4 G
ujar
at S
tate
Roa
d Tr
ansp
ort C
orpo
ratio
n Po
rts a
nd
Tran
spor
t 01
May
196
0 61
3.06
10
6.28
0.
00
719.
34
1,38
1.98
17
.87
0.00
1,
399.
85
1.95
:1
(1.5
7:1)
40
,073
Sect
or w
ise
Tot
al
613.
06
106.
28
0.00
71
9.34
1,
381.
98
17.8
7 0.
00
1,39
9.85
1.
95:1
(1
.57:
1)
40,0
73
Tot
al B
(All
sect
or w
ise
wor
king
Sta
tuto
ry C
orpo
ratio
ns)
664.
15
106.
28
42.0
2 81
2.45
2,
007.
97
17.8
7 8.
03
2,03
3.87
2.
5:1
(2
.24:
1)
41,9
08
Gra
nd T
otal
(A +
B)
34,4
90.5
2 13
5.60
5,
765.
05
40,3
91.1
7 3,
473.
89
257.
43
22,4
19.2
7 26
,150
.59
0.65
:1
(0.6
3:1)
1,
09,2
28
Audit Report No.4 (Commercial) for the year ended 31 March 2011

143
(Fig
ures
in c
olum
ns 5
(a) t
o 6(
d) a
re `
in C
rore
) Sl
. N
o.
Sect
or &
Nam
e of
the
Com
pany
N
ame
of th
e D
epar
tmen
t M
onth
and
ye
ar o
f in
corp
orat
ion
Paid
-up
Cap
ital$
Loa
ns**
out
stan
ding
at t
he c
lose
of 2
010-
11
Deb
t eq
uity
ra
tio fo
r 20
10-1
1 (P
revi
ous
year
)
Man
pow
er
(No.
of
empl
o ye
es)
Stat
e G
over
nmen
t
Cen
tral
G
over
nm
ent
Oth
ers
Tot
al
Stat
e G
over
nm
ent
Cen
tral
G
over
nm
ent
Oth
ers
Tot
al
1 2
3 4
5 (a
) 5
(b)
5 ©
5
(d)
6 (a
) 6
(b)
6 ©
6
(d)
7 8
C
Non
wor
king
Gov
ernm
ent C
ompa
nies
Agr
icul
ture
& A
llied
1
Guj
arat
Fis
herie
s D
evel
opm
ent
Cor
pora
tion
Lim
ited
(b)
Agr
icul
ture
and
C
o-op
erat
ion
17 D
ecem
ber
1971
1.
94
0.00
0.
00
1.94
2.
29
0.00
0.
00
2.29
1.
18:1
(1
.18:
1)
0
2 G
ujar
at D
airy
D
evel
opm
ent
Cor
pora
tion
Lim
ited
(b)
Agr
icul
ture
and
C
o-op
erat
ion
29 M
arch
19
73
10.4
6 0.
00
0.00
10
.46
53.7
7 0.
00
20.0
0 73
.77
7.05
:1
(7.0
5:1)
6
Sect
or w
ise
Tot
al
12.4
0 0.
00
0.00
12
.40
56.0
6 0.
00
20.0
0 76
.06
6.13
:1
(6.1
3:1)
6
Fina
nce
3
Guj
arat
Sm
all I
ndus
tries
C
orpo
ratio
n Li
mite
d (u
nder
liqu
idat
ion)
(b)
Indu
strie
s and
M
ines
26
Mar
ch
1962
3.
79
0.00
0.
21
4.00
8.
65
0.00
14
.42
23.0
7 5.
77:1
(5
.77:
1)
0
4 G
ujar
at L
eath
er
Indu
strie
s Lim
ited
(und
er
liqui
datio
n) (b
)
Indu
strie
s and
M
ines
18
Apr
il 19
78
0.00
0.
00
1.50
1.
50
2.06
0.
00
0.00
2.
06
1.37
:1
(1.3
7:1)
0
Sect
or w
ise
Tot
al
3.79
0.
00
1.71
5.
50
10.7
1 0.
00
14.4
2 25
.13
4.57
:1
(4.5
7:1)
0
Infr
astr
uctu
re
5 G
ujar
at S
tate
C
onst
ruct
ion
Cor
pora
tion
Lim
ited
Roa
ds a
nd
Bui
ldin
gs
16 D
ecem
ber
1974
5.
00
0.00
0.
00
5.00
9.
26
0.00
0.
00
9.26
1.
85:1
(1
.85:
1)
0
6 G
ujar
at N
atio
nal
Hig
hway
s Lim
ited
(b) #
# R
oads
and
B
uild
ings
08
July
197
7 10
.00
6.00
0.
00
16.0
0 0.
00
0.00
0.
00
0.00
0.
00
0
Sect
or w
ise
Tot
al
15.0
0 6.
00
0.00
21
.00
9.26
0.
00
0.00
9.
26
0.44
:1
(0.4
4:1)
0
Man
ufac
ture
7
Guj
arat
Sta
te T
extil
e C
orpo
ratio
n Li
mite
d (u
nder
liqu
idat
ion)
(b)
Indu
strie
s and
M
ines
13
Nov
embe
r 19
68
46.4
6 0.
00
0.00
46
.46
587.
88
0.00
0.
67
588.
55
12.6
7:1
(1
2.67
:1)
0
8 G
ujar
at S
tate
Mac
hine
To
ols L
imite
d In
dust
ries a
nd
Min
es
15 F
ebru
ary
1974
0.
00
0.00
0.
54
0.54
0.
00
0.00
2.
39
2.39
4.
43:1
(4
.51:
1)
0
Annexure

144
(Fig
ures
in c
olum
ns 5
(a) t
o 6(
d) a
re `
in C
rore
) Sl
. N
o.
Sect
or &
Nam
e of
the
Com
pany
N
ame
of th
e D
epar
tmen
t M
onth
and
ye
ar o
f in
corp
orat
ion
Paid
-up
Cap
ital$
Loa
ns**
outs
tand
ing
at th
e cl
ose
of 2
010-
11D
ebt
equi
ty
ratio
for
2010
-11
(Pre
viou
s ye
ar)
Man
pow
er
(No.
of
empl
o ye
es)
Stat
e G
over
nm
ent
Cen
tral
G
over
nm
ent
Oth
ers
Tot
alSt
ate
Gov
ern
men
t
Cen
tral
G
over
nm
ent
Oth
ers
Tot
al
1 2
3 4
5 (a
)5
(b)
5 ©
5 (d
)6
(a)
6 (b
)6
©6
(d)
78
9 G
ujar
at C
omm
unic
atio
ns
and
Elec
troni
cs L
imite
d (u
nder
liqu
idat
ion)
(b)
Indu
strie
s an
d M
ines
30
May
197
512
.45
0.00
0.00
12.4
50.
900.
008.
699.
590.
77:1
(0
.77:
1)
0
10
Guj
arat
Tra
ns-R
ecei
vers
Li
mite
d
Indu
strie
s an
d M
ines
26
Mar
ch
1981
0.
000.
000.
290.
290.
000.
000.
550.
551.
9:1
(1
.90:
1)
0
11
Guj
arat
Fin
tex
Lim
ited
(und
er li
quid
atio
n,
subs
idia
r y o
f GST
C) (
b)
Indu
strie
s an
d M
ines
20
Sep
tem
ber
1992
0.
000.
00R
s.200
O
nly
Rs.2
00
Onl
y 0.
000.
000.
010.
010.
000
12
Guj
arat
Silt
ex L
imite
d (u
nder
liqu
idat
ion,
su
bsid
iar y
of G
STC
) (b)
Indu
strie
s an
d M
ines
20
Sep
tem
ber
1992
0.
000.
00R
s.200
O
nly
Rs.2
00
Onl
y 0.
000.
000.
010.
010.
000
13
Guj
arat
Tex
feb
Lim
ited
(und
er li
quid
atio
n,
subs
idia
r y o
f GST
C) (
b)
Indu
strie
s an
d M
ines
20
Sep
tem
ber
1992
0.
000.
00R
s.200
O
nly
Rs.2
00
Onl
y 0.
000.
000.
010.
010.
000
Sect
or w
ise
Tot
al58
.91
0.00
0.83
59.7
458
8.78
0.00
12.3
360
1.11
10.0
6:1
(1
0.06
:1)
0
Tot
al C
(All
sect
or w
ise
non
wor
king
Gov
ernm
ent c
ompa
nies
)90
.10
6.00
2.54
98.6
466
4.81
0.00
46.7
571
1.56
7.21
:1
(7.2
1:1)
6
Gra
nd T
otal
(A +
B +
C)
34,5
80.6
214
1.60
5,76
7.59
40,4
89.8
14,
138.
7025
7.43
22,4
66.0
226
,862
.15
0.66
:1
(0.6
5:1)
1,
09,2
34
Expe
ct in
resp
ect o
f 36
PSU
s whi
ch fi
nalis
ed th
eir a
ccou
nts f
or 2
010-
11 (S
l. N
o. A
-2, A
-5, A
-7, A
-9, A
-10,
A-1
3, A
-14,
A-1
6, A
-17,
A-1
8, A
-22,
A-2
3, A
-25,
A-2
6, A
-28,
A-2
9, A
-31,
A-3
3,
A-3
4, A
-35,
A-3
6, A
-37,
A-3
8, A
-40,
A-4
1, A
-42,
A-4
4, A
-46,
A-4
7, A
-48,
A-4
9, A
-53,
B-2
, C-2
, C-8
and
C-1
0) fi
gure
s are
pro
visio
nal a
nd a
s giv
en b
y th
e PS
Us.
Abo
ve in
clud
es 1
0 se
ctio
n 61
9-B
Com
pani
es a
t Sl.
No.
A-1
8, A
-27,
A-3
4, A
-42,
A-4
4, A
-46,
A-4
9, A
-51,
C-4
and
C-8
. (b
) In
form
atio
n as
furn
ishe
d by
Com
pany
in e
arlie
r yea
rs
#
Empl
oyee
s tra
nsfe
rred
to G
IDC
with
eff
ect f
rom
01
Janu
ary
2009
**
Loa
n ou
tsta
ndin
g at
the
clos
e of
201
0-11
repr
esen
ts lo
ng te
rm lo
ans o
nly.
$
Paid
-up
Cap
ital i
nclu
des S
hare
App
licat
ion
Mon
ey
## T
he n
ame
of th
e C
ompa
ny w
as st
ruck
off
from
the
regi
ster
of R
egis
trar o
f Com
pani
es o
n 14
Aug
ust 2
011
unde
r sec
tion
560
(5) o
f the
Com
pani
es A
ct 1
956
unde
rEas
y Ex
it Sc
hem
e 20
11
@ S
tate
Gov
ernm
ent m
ade
capi
tal c
ontri
butio
n in
the
form
of l
oans
, hen
ce, p
aid
up c
apita
l is ‘
nil’
(Sl.N
o.B
-3)
∇ S
eria
l No.
A-2
4 –
The
Shar
es w
ere
allo
tted
in M
ay 2
011
and
henc
e th
e sh
are
capi
tal a
s on
31 M
arch
201
1 w
as ‘N
il`.
Audit Report No.4 (Commercial) for the year ended 31 March 2011

145
Sum
mar
ised
fina
ncia
l res
ults
of G
over
nmen
t Com
pani
es a
nd S
tatu
tory
Cor
pora
tions
for
the
late
st y
ear
for
whi
ch a
ccou
nts w
ere
final
ised
.
(Ref
erre
d to
in p
arag
raph
1.1
5)
(Fig
ures
in c
olum
ns 5
(a) t
o 11
are
`in
Cro
re)
Net
Pro
fit (+
)/ L
oss (
-)
Sl.
No.
Se
ctor
& N
ame
of th
e C
ompa
ny
Peri
od o
f A
ccou
nts
Yea
r in
w
hich
fin
alis
edN
et P
rofit
/ L
oss
befo
re
Inte
rest
&
Dep
reci
ati
on
Inte
rest
D
epre
ciat
ion
Net
Pr
ofit/
L
oss
Tur
nove
r Im
pact
of
Acc
ount
s C
omm
ents
(A
)
Paid
up
Cap
ital#
Acc
umul
ate
d Pr
ofit
(+)/
L
oss(
-)
Cap
ital
empl
oyed
(B
)
Ret
urn
on
capi
tal
empl
oye
d (C
)
Perc
ent
age
retu
rn
on
capi
tal
empl
o ye
d
1 2
3 4
5 (a
) 5
(b)
5 (c
) 5
(d)
6 7
8 9
10
11
12
A
Wor
king
Gov
ernm
ent C
ompa
nies
Agr
icul
ture
& A
llied
1 G
ujar
at A
gro
Indu
strie
s Cor
pora
tion
Lim
ited
2009
-10
2010
-11
8.34
0.
27
0.15
7.
92
294.
67
--
8.08
7.
98
55.7
6 8.
19
14.6
9
2 G
ujar
at S
tate
See
ds C
orpo
ratio
n Li
mite
d 20
10-1
1 20
11-1
2 17
.84
0.00
0.
27
17.5
7 13
9.23
0.
78
3.73
67
.25
78.3
1 17
.57
22.4
4
3 G
ujar
at S
tate
Lan
d D
evel
opm
ent
Cor
pora
tion
Lim
ited
2009
-10
2011
-12
-7.4
0 2.
00
0.36
-9
.76
579.
11
--
5.88
-1
10.8
1 -8
3.01
-7
.76
--
4 G
ujar
at S
heep
and
Woo
l Dev
elop
men
t C
orpo
ratio
n Li
mite
d 20
09-1
0 20
10-1
1 0.
37
0.00
0.
08
0.29
1.
66
0.19
4.
31
-1.5
5 4.
82
0.29
6.
02
Sect
or w
ise
Tot
al
19.1
5 2.
27
0.86
16
.02
1,01
4.67
0.
97
22.0
0 -3
7.13
55
.88
18.2
9 32
.73
Fina
nce
5 G
ujar
at In
dust
rial I
nves
tmen
t Cor
pora
tion
Lim
ited
2010
-11
2011
-12
13.7
3 2.
00
0.31
11
.42
54.8
9 --
25
6.98
-1
73.1
1 33
2.77
13
.42
4.03
6 G
ujar
at S
tate
Han
dloo
m a
nd H
andi
craf
ts
Dev
elop
men
t Cor
pora
tion
Lim
ited
2008
-09
2010
-11
2.69
1.
25
0.09
1.
35
14.1
5 --
12
.06
-46.
11
44.2
2 2.
60
5.88
7 G
ujar
at S
tate
Inve
stm
ents
Lim
ited
2010
-11
2011
-12
47.6
1 0.
00
0.01
47
.60
47.9
8 --
44
2.77
26
6.82
1,
024.
95
47.6
0 4.
64
8 G
ujar
at W
omen
Eco
nom
ic D
evel
opm
ent
Cor
pora
tion
Lim
ited
2007
-08
2009
-10
$ $
$ 0.
00
0.00
--
7.
02
--
7.37
--
--
9 G
ujar
at S
tate
Fin
anci
al S
ervi
ces L
imite
d 20
10-1
1 20
11-1
2 83
1.51
71
4.25
0.
13
117.
13
836.
79
--
36.2
8 24
6.29
9,
061.
29
831.
38
9.18
10
GSF
S C
apita
l and
Sec
uriti
es L
imite
d 20
10-1
1 20
11-1
2 2.
03
0.00
0.
01
2.02
2.
22
--
5.00
7.
31
12.7
9 2.
02
15.7
9
Ann
exur
e 2
Annexure
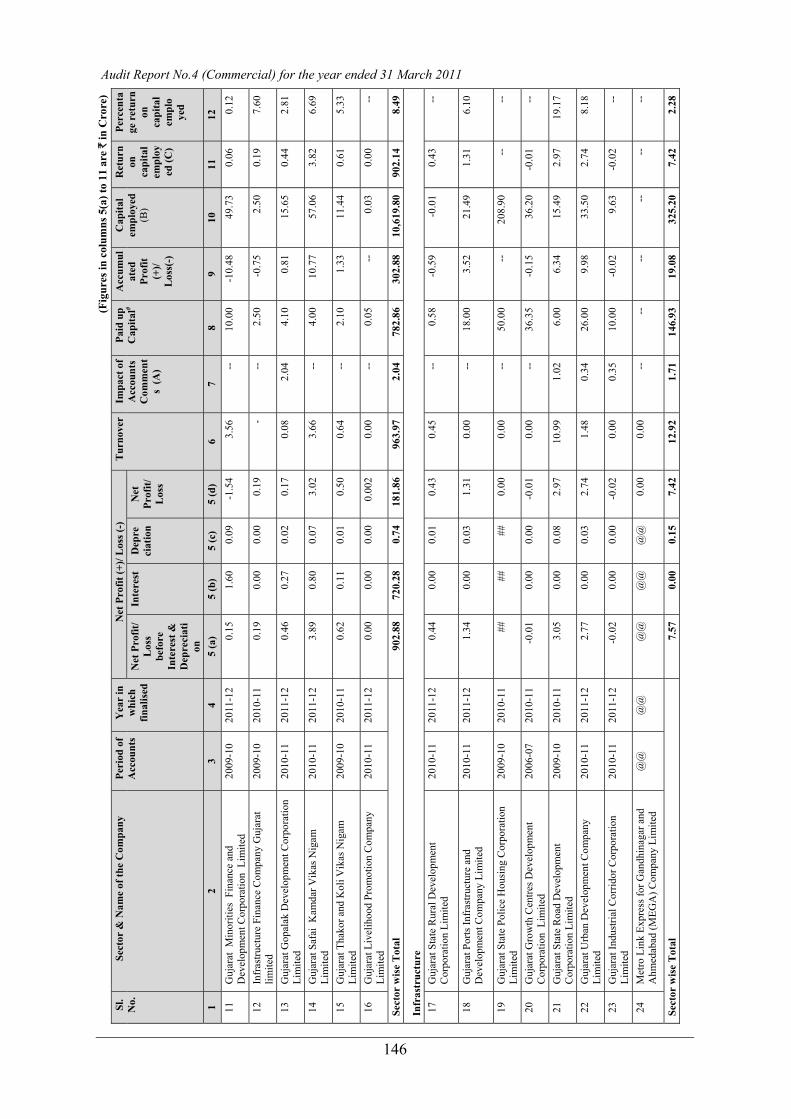
146
(Fig
ures
in c
olum
ns 5
(a) t
o 11
are
` in
Cro
re)
Sl.
No.
Se
ctor
& N
ame
of th
e C
ompa
ny
Peri
od o
f A
ccou
nts
Yea
r in
w
hich
fin
alis
ed
Net
Pro
fit (+
)/ L
oss (
-)
Tur
nove
rIm
pact
of
Acc
ount
s C
omm
ent
s (A
)
Paid
up
Cap
ital#
Acc
umul
ated
Pr
ofit
(+)/
L
oss(
-)
Cap
ital
empl
oyed
(B
)
Ret
urn
on
capi
tal
empl
oyed
(C)
Perc
enta
ge r
etur
n on
ca
pita
l em
plo
yed
Net
Pro
fit/
Los
s be
fore
In
tere
st &
D
epre
ciat
ion
Inte
rest
D
epre
ciat
ion
Net
Pr
ofit/
L
oss
1 2
3 4
5 (a
) 5
(b)
5 (c
) 5
(d)
6 7
8 9
10
11
12
11
Guj
arat
Min
oriti
es F
inan
ce a
nd
Dev
elop
men
t Cor
pora
tion
Lim
ited
2009
-10
2011
-12
0.15
1.
60
0.09
-1
.54
3.56
--
10
.00
-10.
48
49.7
3 0.
06
0.12
12
Infr
astru
ctur
e Fi
nanc
e C
ompa
ny G
ujar
at
limite
d 20
09-1
0 20
10-1
1 0.
19
0.00
0.
00
0.19
-
--
2.50
-0
.75
2.50
0.
19
7.60
13
Guj
arat
Gop
alak
Dev
elop
men
t Cor
pora
tion
Lim
ited
2010
-11
2011
-12
0.46
0.
27
0.02
0.
17
0.08
2.
04
4.10
0.
81
15.6
5 0.
44
2.81
14
Guj
arat
Saf
ai K
amda
r Vik
as N
igam
Li
mite
d 20
10-1
1 20
11-1
2 3.
89
0.80
0.
07
3.02
3.
66
--
4.00
10
.77
57.0
6 3.
82
6.69
15
Guj
arat
Tha
kor a
nd K
oli V
ikas
Nig
am
Lim
ited
2009
-10
2010
-11
0.62
0.
11
0.01
0.
50
0.64
--
2.
10
1.33
11
.44
0.61
5.
33
16
Guj
arat
Liv
elih
ood
Prom
otio
n C
ompa
ny
Lim
ited
2010
-11
2011
-12
0.00
0.
00
0.00
0.
002
0.00
--
0.
05
--
0.03
0.
00
--
Sect
or w
ise
Tot
al
902.
88
720.
28
0.74
18
1.86
96
3.97
2.
04
782.
86
302.
88
10,6
19.8
0 90
2.14
8.
49
Infr
astr
uctu
re
17
Guj
arat
Sta
te R
ural
Dev
elop
men
t C
orpo
ratio
n Li
mite
d 20
10-1
1 20
11-1
2 0.
44
0.00
0.
01
0.43
0.
45
--
0.58
-0
.59
-0.0
1 0.
43
--
18
Guj
arat
Por
ts In
fras
truct
ure
and
Dev
elop
men
t Com
pany
Lim
ited
2010
-11
2011
-12
1.34
0.
00
0.03
1.
31
0.00
--
18
.00
3.52
21
.49
1.31
6.
10
19
Guj
arat
Sta
te P
olic
e H
ousi
ng C
orpo
ratio
n Li
mite
d 20
09-1
0 20
10-1
1 ##
##
##
0.
00
0.00
--
50
.00
--
208.
90
--
--
20
Guj
arat
Gro
wth
Cen
tres D
evel
opm
ent
Cor
pora
tion
Lim
ited
2006
-07
2010
-11
-0.0
1 0.
00
0.00
-0
.01
0.00
--
36
.35
-0.1
5 36
.20
-0.0
1 --
21
Guj
arat
Sta
te R
oad
Dev
elop
men
t C
orpo
ratio
n Li
mite
d 20
09-1
0 20
10-1
1 3.
05
0.00
0.
08
2.97
10
.99
1.02
6.
00
6.34
15
.49
2.97
19
.17
22
Guj
arat
Urb
an D
evel
opm
ent C
ompa
ny
Lim
ited
2010
-11
2011
-12
2.77
0.
00
0.03
2.
74
1.48
0.
34
26.0
0 9.
98
33.5
0 2.
74
8.18
23
Guj
arat
Indu
stria
l Cor
ridor
Cor
pora
tion
Lim
ited
2010
-11
2011
-12
-0.0
2 0.
00
0.00
-0
.02
0.00
0.
35
10.0
0 -0
.02
9.63
-0
.02
--
24
Met
ro L
ink
Expr
ess f
or G
andh
inag
ar a
nd
Ahm
edab
ad (M
EGA
) Com
pany
Lim
ited
@@
@
@
@@
@
@
@@
0.
00
0.00
--
--
--
--
--
--
Sect
or w
ise
Tot
al
7.57
0.
00
0.15
7.
42
12.9
2 1.
71
146.
93
19.0
8 32
5.20
7.
42
2.28
Audit Report No.4 (Commercial) for the year ended 31 March 2011
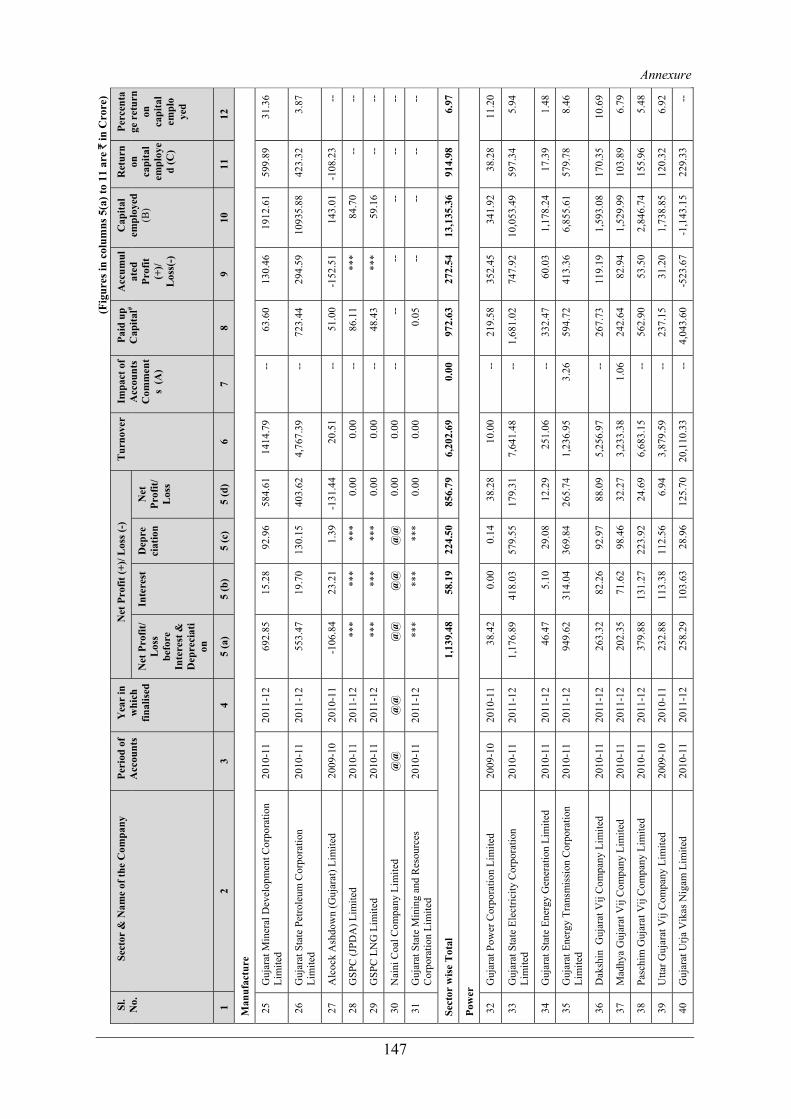
147
(Fig
ures
in c
olum
ns 5
(a) t
o 11
are
` in
Cro
re)
Sl.
No.
Se
ctor
& N
ame
of th
e C
ompa
ny
Peri
od o
f A
ccou
nts
Yea
r in
w
hich
fin
alis
ed
Net
Pro
fit (+
)/ L
oss (
-)
Tur
nove
rIm
pact
of
Acc
ount
s C
omm
ent
s (A
)
Paid
up
Cap
ital#
Acc
umul
ated
Pr
ofit
(+)/
Los
s(-)
Cap
ital
empl
oyed
(B
)
Ret
urn
on
capi
tal
empl
oye
d (C
)
Perc
enta
ge r
etur
n on
ca
pita
l em
plo
yed
Net
Pro
fit/
Los
s be
fore
In
tere
st &
D
epre
ciat
ion
Inte
rest
D
epre
ciat
ion
Net
Pr
ofit/
L
oss
1 2
3 4
5 (a
) 5
(b)
5 (c
) 5
(d)
6 7
8 9
10
11
12
Man
ufac
ture
25
Guj
arat
Min
eral
Dev
elop
men
t Cor
pora
tion
Lim
ited
2010
-11
2011
-12
692.
85
15.2
8 92
.96
584.
61
1414
.79
--
63.6
0 13
0.46
19
12.6
1 59
9.89
31
.36
26
Guj
arat
Sta
te P
etro
leum
Cor
pora
tion
Lim
ited
2010
-11
2011
-12
553.
47
19.7
0 13
0.15
40
3.62
4,
767.
39
--
723.
44
294.
59
1093
5.88
42
3.32
3.
87
27
Alc
ock
Ash
dow
n (G
ujar
at) L
imite
d 20
09-1
0 20
10-1
1 -1
06.8
4 23
.21
1.39
-1
31.4
4 20
.51
--
51.0
0 -1
52.5
1 14
3.01
-1
08.2
3 --
28
GSP
C (J
PDA
) Lim
ited
2010
-11
2011
-12
***
***
***
0.00
0.
00
--
86.1
1 **
* 84
.70
--
--
29
GSP
C L
NG
Lim
ited
2010
-11
2011
-12
***
***
***
0.00
0.
00
--
48.4
3 **
* 59
.16
--
--
30
Nai
ni C
oal C
ompa
ny L
imite
d @
@
@@
@
@
@@
@
@
0.00
0.
00
--
--
--
--
--
--
31
Guj
arat
Sta
te M
inin
g an
d R
esou
rces
C
orpo
ratio
n Li
mite
d 20
10-1
1 20
11-1
2 **
* **
* **
* 0.
00
0.00
0.05
--
--
--
--
Sect
or w
ise
Tot
al
1,13
9.48
58
.19
224.
50
856.
79
6,20
2.69
0.
00
972.
63
272.
54
13,1
35.3
6 91
4.98
6.
97
Pow
er
32
Guj
arat
Pow
er C
orpo
ratio
n Li
mite
d 20
09-1
0 20
10-1
1 38
.42
0.00
0.
14
38.2
8 10
.00
--
219.
58
352.
45
341.
92
38.2
8 11
.20
33
Guj
arat
Sta
te E
lect
ricity
Cor
pora
tion
Lim
ited
2010
-11
2011
-12
1,17
6.89
41
8.03
57
9.55
17
9.31
7,
641.
48
--
1,68
1.02
74
7.92
10
,053
.49
597.
34
5.94
34
Guj
arat
Sta
te E
nerg
y G
ener
atio
n Li
mite
d 20
10-1
1 20
11-1
2 46
.47
5.10
29
.08
12.2
9 25
1.06
--
33
2.47
60
.03
1,17
8.24
17
.39
1.48
35
Guj
arat
Ene
rgy
Tran
smis
sion
Cor
pora
tion
Lim
ited
2010
-11
2011
-12
949.
62
314.
04
369.
84
265.
74
1,23
6.95
3.
26
594.
72
413.
36
6,85
5.61
57
9.78
8.
46
36
Dak
shin
Guj
arat
Vij
Com
pany
Lim
ited
2010
-11
2011
-12
263.
32
82.2
6 92
.97
88.0
9 5,
256.
97
--
267.
73
119.
19
1,59
3.08
17
0.35
10
.69
37
Mad
hya
Guj
arat
Vij
Com
pany
Lim
ited
2010
-11
2011
-12
202.
35
71.6
2 98
.46
32.2
7 3,
233.
38
1.06
24
2.64
82
.94
1,52
9.99
10
3.89
6.
79
38
Pasc
him
Guj
arat
Vij
Com
pany
Lim
ited
2010
-11
2011
-12
379.
88
131.
27
223.
92
24.6
9 6,
683.
15
--
562.
90
53.5
0 2,
846.
74
155.
96
5.48
39
Utta
r Guj
arat
Vij
Com
pany
Lim
ited
2009
-10
2010
-11
232.
88
113.
38
112.
56
6.94
3,
879.
59
--
237.
15
31.2
0 1,
738.
85
120.
32
6.92
40
Guj
arat
Urja
Vik
as N
igam
Lim
ited
2010
-11
2011
-12
258.
29
103.
63
28.9
6 12
5.70
20
,110
.33
--
4,04
3.60
-5
23.6
7 -1
,143
.15
229.
33
--
Annexure
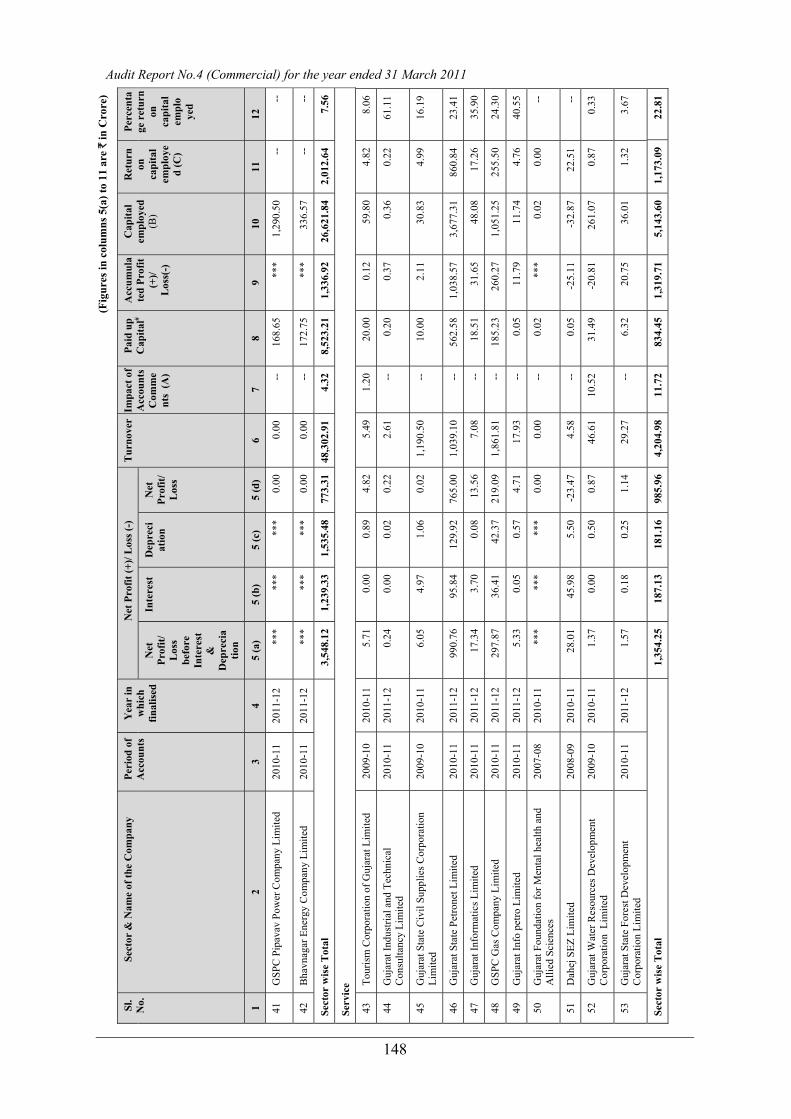
148
(Fig
ures
in c
olum
ns 5
(a) t
o 11
are
` in
Cro
re)
Sl.
No.
Se
ctor
& N
ame
of th
e C
ompa
ny
Peri
od o
f A
ccou
nts
Yea
r in
w
hich
fin
alis
ed
Net
Pro
fit (+
)/ L
oss (
-)
Tur
nove
rIm
pact
of
Acc
ount
s C
omm
ent
s (A
)
Paid
up
Cap
ital#
Acc
umul
ate
d Pr
ofit
(+)/
Los
s(-)
Cap
ital
empl
oyed
(B
)
Ret
urn
on
capi
tal
empl
oye
d (C
)
Perc
enta
ge r
etur
n on
ca
pita
l em
plo
yed
Net
Pr
ofit/
L
oss
befo
re
Inte
rest
&
D
epre
cia
tion
Inte
rest
D
epre
ciat
ion
Net
Pr
ofit/
L
oss
1 2
3 4
5 (a
) 5
(b)
5 (c
) 5
(d)
6 7
8 9
10
11
12
41
GSP
C P
ipav
av P
ower
Com
pany
Lim
ited
2010
-11
2011
-12
***
***
***
0.00
0.
00
--
168.
65
***
1,29
0.50
--
--
42
Bha
vnag
ar E
nerg
y C
ompa
ny L
imite
d 20
10-1
1 20
11-1
2 **
* **
* **
* 0.
00
0.00
--
17
2.75
**
* 33
6.57
--
--
Sect
or w
ise
Tot
al
3,54
8.12
1,
239.
33
1,53
5.48
77
3.31
48
,302
.91
4.32
8,
523.
21
1,33
6.92
26
,621
.84
2,01
2.64
7.
56
Serv
ice
43
Tour
ism
Cor
pora
tion
of G
ujar
at L
imite
d 20
09-1
0 20
10-1
1 5.
71
0.00
0.
89
4.82
5.
49
1.20
20
.00
0.12
59
.80
4.82
8.
06
44
Guj
arat
Indu
stria
l and
Tec
hnic
al
Con
sulta
ncy
Lim
ited
2010
-11
2011
-12
0.24
0.
00
0.02
0.
22
2.61
--
0.
20
0.37
0.
36
0.22
61
.11
45
Guj
arat
Sta
te C
ivil
Supp
lies C
orpo
ratio
n Li
mite
d 20
09-1
0 20
10-1
1 6.
05
4.97
1.
06
0.02
1,
190.
50
--
10.0
0 2.
11
30.8
3 4.
99
16.1
9
46
Guj
arat
Sta
te P
etro
net L
imite
d 20
10-1
1 20
11-1
2 99
0.76
95
.84
129.
92
765.
00
1,03
9.10
--
56
2.58
1,
038.
57
3,67
7.31
86
0.84
23
.41
47
Guj
arat
Info
rmat
ics L
imite
d 20
10-1
1 20
11-1
2 17
.34
3.70
0.
08
13.5
6 7.
08
--
18.5
1 31
.65
48.0
8 17
.26
35.9
0
48
GSP
C G
as C
ompa
ny L
imite
d 20
10-1
1 20
11-1
2 29
7.87
36
.41
42.3
7 21
9.09
1,
861.
81
--
185.
23
260.
27
1,05
1.25
25
5.50
24
.30
49
Guj
arat
Info
pet
ro L
imite
d 20
10-1
1 20
11-1
2 5.
33
0.05
0.
57
4.71
17
.93
--
0.05
11
.79
11.7
4 4.
76
40.5
5
50
Guj
arat
Fou
ndat
ion
for M
enta
l hea
lth a
nd
Alli
ed S
cien
ces
2007
-08
2010
-11
***
***
***
0.00
0.
00
--
0.02
**
* 0.
02
0.00
--
51
Dah
ej S
EZ L
imite
d 20
08-0
9 20
10-1
1 28
.01
45.9
8 5.
50
-23.
47
4.58
--
0.
05
-25.
11
-32.
87
22.5
1 --
52
Guj
arat
Wat
er R
esou
rces
Dev
elop
men
t C
orpo
ratio
n L
imite
d 20
09-1
0 20
10-1
1 1.
37
0.00
0.
50
0.87
46
.61
10.5
2 31
.49
-20.
81
261.
07
0.87
0.
33
53
Guj
arat
Sta
te F
ores
t Dev
elop
men
t C
orpo
ratio
n Li
mite
d 20
10-1
1 20
11-1
2 1.
57
0.18
0.
25
1.14
29
.27
--
6.32
20
.75
36.0
1 1.
32
3.67
Sect
or w
ise
Tot
al
1,35
4.25
18
7.13
18
1.16
98
5.96
4,
204.
98
11.7
2 83
4.45
1,
319.
71
5,14
3.60
1,
173.
09
22.8
1
Audit Report No.4 (Commercial) for the year ended 31 March 2011
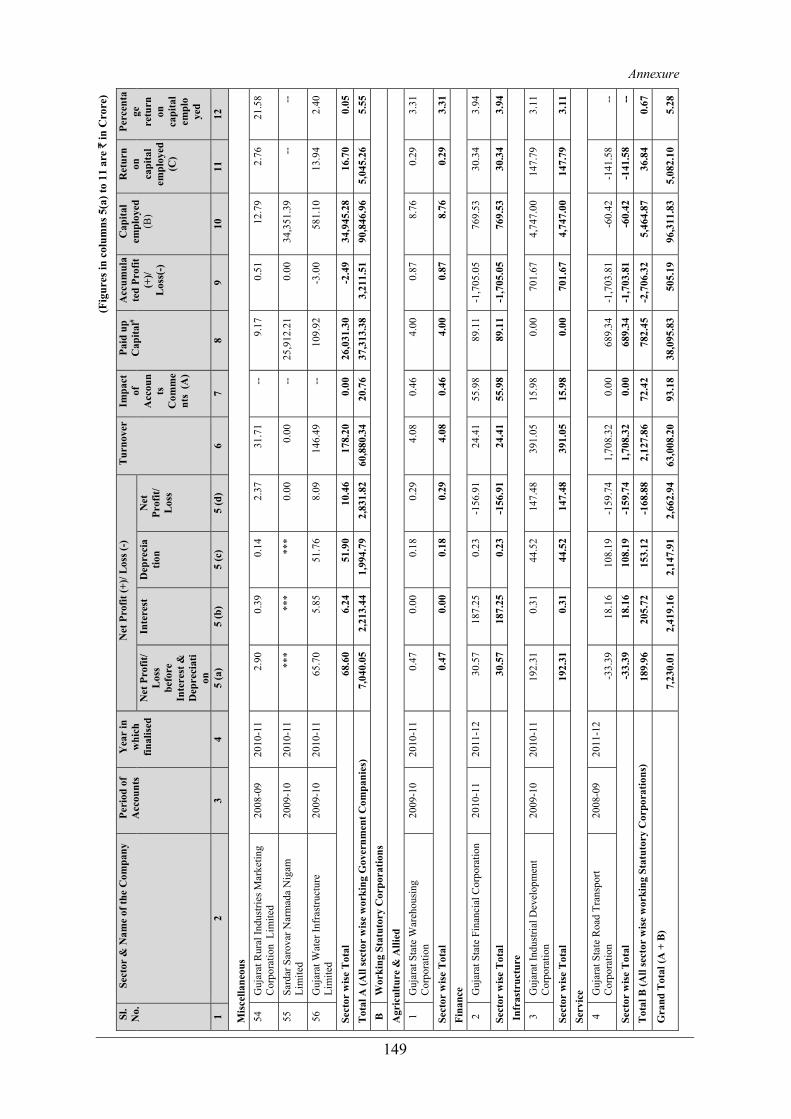
149
(Fig
ures
in c
olum
ns 5
(a) t
o 11
are
` in
Cro
re)
Sl.
No.
Se
ctor
& N
ame
of th
e C
ompa
ny
Peri
od o
f A
ccou
nts
Yea
r in
w
hich
fin
alis
ed
Net
Pro
fit (+
)/ L
oss (
-)
Tur
nove
rIm
pact
of
A
ccou
nts
C
omm
ent
s (A
)
Paid
up
Cap
ital#
Acc
umul
ate
d Pr
ofit
(+)/
Los
s(-)
Cap
ital
empl
oyed
(B
)
Ret
urn
on
capi
tal
empl
oyed
(C
)
Perc
enta
ge
retu
rn
on
capi
tal
empl
o ye
d
Net
Pro
fit/
Los
s be
fore
In
tere
st &
D
epre
ciat
ion
Inte
rest
D
epre
cia
tion
Net
Pr
ofit/
L
oss
1 2
3 4
5 (a
) 5
(b)
5 (c
) 5
(d)
6 7
8 9
10
11
12
Mis
cella
neou
s 54
G
ujar
at R
ural
Indu
strie
s Mar
ketin
g C
orpo
ratio
n L
imite
d 20
08-0
9 20
10-1
1 2.
90
0.39
0.
14
2.37
31
.71
--
9.17
0.
51
12.7
9 2.
76
21.5
8
55
Sard
ar S
arov
ar N
arm
ada
Nig
am
Lim
ited
2009
-10
2010
-11
***
***
***
0.00
0.
00
--
25,9
12.2
1 0.
00
34,3
51.3
9 --
--
56
Guj
arat
Wat
er In
fras
truct
ure
Lim
ited
2009
-10
2010
-11
65.7
0 5.
85
51.7
6 8.
09
146.
49
--
109.
92
-3.0
0 58
1.10
13
.94
2.40
Sect
or w
ise
Tot
al
68.6
0 6.
24
51.9
0 10
.46
178.
20
0.00
26
,031
.30
-2.4
9 34
,945
.28
16.7
0 0.
05
Tot
al A
(All
sect
or w
ise
wor
king
Gov
ernm
ent C
ompa
nies
) 7,
040.
05
2,21
3.44
1,
994.
79
2,83
1.82
60
,880
.34
20.7
6 37
,313
.38
3,21
1.51
90
,846
.96
5,04
5.26
5.
55
B
Wor
king
Sta
tuto
ry C
orpo
ratio
ns
Agr
icul
ture
& A
llied
1
Guj
arat
Sta
te W
areh
ousi
ng
Cor
pora
tion
2009
-10
2010
-11
0.47
0.
00
0.18
0.
29
4.08
0.
46
4.00
0.
87
8.76
0.
29
3.31
Sect
or w
ise
Tot
al
0.47
0.
00
0.18
0.
29
4.08
0.
46
4.00
0.
87
8.76
0.
29
3.31
Fi
nanc
e
2 G
ujar
at S
tate
Fin
anci
al C
orpo
ratio
n 20
10-1
1 20
11-1
2 30
.57
187.
25
0.23
-1
56.9
1 24
.41
55.9
8 89
.11
-1,7
05.0
5 76
9.53
30
.34
3.94
Sect
or w
ise
Tot
al
30.5
7 18
7.25
0.
23
-156
.91
24.4
1 55
.98
89.1
1 -1
,705
.05
769.
53
30.3
4 3.
94
Infr
astr
uctu
re
3 G
ujar
at In
dust
rial D
evel
opm
ent
Cor
pora
tion
2009
-10
2010
-11
192.
31
0.31
44
.52
147.
48
391.
05
15.9
8 0.
00
701.
67
4,74
7.00
14
7.79
3.
11
Sect
or w
ise
Tot
al
192.
31
0.31
44
.52
147.
48
391.
05
15.9
8 0.
00
701.
67
4,74
7.00
14
7.79
3.
11
Serv
ice
4
Guj
arat
Sta
te R
oad
Tran
spor
t C
orpo
ratio
n 20
08-0
9 20
11-1
2 -3
3.39
18
.16
108.
19
-159
.74
1,70
8.32
0.
00
689.
34
-1,7
03.8
1 -6
0.42
-1
41.5
8 --
Se
ctor
wis
e T
otal
-3
3.39
18
.16
108.
19
-159
.74
1,70
8.32
0.
00
689.
34
-1,7
03.8
1 -6
0.42
-1
41.5
8 --
T
otal
B (A
ll se
ctor
wis
e w
orki
ng S
tatu
tory
Cor
pora
tions
) 18
9.96
20
5.72
15
3.12
-1
68.8
8 2,
127.
86
72.4
2 78
2.45
-2
,706
.32
5,46
4.87
36
.84
0.67
G
rand
Tot
al (A
+ B
) 7,
230.
01
2,41
9.16
2,
147.
91
2,66
2.94
63
,008
.20
93.1
8 38
,095
.83
505.
19
96,3
11.8
3 5,
082.
10
5.28
Annexure

150
(Fig
ures
in c
olum
ns 5
(a) t
o 11
are
` in
Cro
re)
Sl.
No.
Se
ctor
& N
ame
of th
e C
ompa
ny
Peri
od o
f A
ccou
nts
Yea
r in
w
hich
fin
alis
ed
Net
Pro
fit (+
)/ L
oss (
-)
Tur
nove
rIm
pact
of
Acc
ount
s C
omm
ents
(A
)
Paid
up
Cap
ital#
Acc
umul
ate
d Pr
ofit
(+)/
L
oss(
-)
Cap
ital
empl
oyed
(B
)
Ret
urn
on
capi
tal
empl
oye
d (C
)
Perc
ent
age
retu
rn
on
capi
tal
empl
o ye
d
Net
Pr
ofit/
L
oss
befo
re
Inte
rest
&
D
epre
cia
tion
Inte
rest
D
epre
cia
tion
Net
Pr
ofit/
Los
s
1 2
3 4
5 (a
) 5
(b)
5 (c
) 5
(d)
6 7
8 9
10
11
12
C
Non
wor
king
Gov
ernm
ent C
ompa
nies
A
gric
ultu
re &
Alli
ed
1 G
ujar
at F
ishe
ries D
evel
opm
ent C
orpo
ratio
n Li
mite
d 19
98-9
9 20
02-0
3 -0
.87
0.15
0.
03
-1.0
5 28
.13
--
1.94
4.
01
0.87
-0
.90
--
2 G
ujar
at D
airy
Dev
elop
men
t C
orpo
ratio
n Li
mite
d 20
10-1
1 20
11-1
2 -0
.97
0.00
0.
00
-0.9
7 -
--
10.4
6 -1
21.1
4 -0
.83
-0.9
7 --
Sect
or w
ise
Tot
al
-1.8
4 0.
15
0.03
-2
.02
28.1
3 0.
00
12.4
0 -1
17.1
3 0.
04
-1.8
7 --
Fi
nanc
e
3 G
ujar
at S
mal
l Ind
ustri
es C
orpo
ratio
n Li
mite
d (u
nder
liqu
idat
ion)
20
06-0
7 20
07-0
8 -0
.31
3.31
0.
00
-3.6
2 0.
00
--
4.00
-7
4.93
3.
21
-0.3
1 --
4 G
ujar
at L
eath
er In
dust
ries L
imite
d (u
nder
liq
uida
tion)
20
01-0
2 20
02-0
3 0.
00
0.00
0.
00
0.00
0.
00
--
1.50
-6
.67
0.00
0.
00
--
Sect
or w
ise
Tot
al
-0.3
1 3.
31
0.00
-3
.62
0.00
0.
00
5.50
-8
1.60
3.
21
-0.3
1 --
In
fras
truc
ture
5
Guj
arat
Sta
te C
onst
ruct
ion
Cor
pora
tion
Lim
ited
2009
-10
2010
-11
-0.9
7 0.
98
0.00
-1
.95
36.1
5 --
5.
00
-38.
00
-5.7
2 -0
.97
--
6 G
ujar
at N
atio
nal H
ighw
ays L
imite
d 20
08-0
9 20
10-1
1 2.
22
0.00
0.
00
2.22
0.
00
--
16.0
0 8.
36
24.4
3 2.
22
9.09
Se
ctor
wis
e T
otal
1.
25
0.98
0.
00
0.27
36
.15
0.00
21
.00
-29.
64
18.7
1 1.
25
6.68
M
anuf
actu
re
7 G
ujar
at S
tate
Tex
tile
Cor
pora
tion
Lim
ited
(und
er li
quid
atio
n)
1994
-95
1995
-96
0.00
0.
00
0.00
0.
00
0.00
--
46
.46
0.00
0.
00
0.00
--
8 G
ujar
at S
tate
Mac
hine
Too
ls L
imite
d 20
10-1
1 20
11-1
2 - 0
.08
0.00
0.
00
- 0.0
8 0.
00
--
0.54
-2
.73
0.20
-0
.08
--
9 G
ujar
at C
omm
unic
atio
ns a
nd E
lect
roni
cs
Lim
ited
(und
er li
quid
atio
n)
2001
-02
2002
-03
-34.
13
0.00
0.
00
-34.
13
5.57
--
12
.45
-104
.74
0.00
-3
4.13
--
10
Guj
arat
Tra
ns-R
ecei
vers
Lim
ited
2010
-11
2011
-12
0.00
0.
00
0.00
0.
00
0.00
--
0.
29
-6.0
5 -4
.04
0.00
--
11
Guj
arat
Fin
tex
Lim
ited
(und
er li
quid
atio
n,
subs
idia
ry o
f GST
C)
1994
-95
1995
-96
0.00
0.
00
0.00
0.
00
0.00
--
-∇
0.
00
0.00
0.
00
--
12
Guj
arat
Silt
ex L
imite
d (u
nder
liqu
idat
ion,
su
bsid
iary
of G
STC
) 19
94-9
5 19
95-9
6 0.
00
0.00
0.
00
0.00
0.
00
--
-∇
0.00
0.
00
0.00
--
Audit Report No.4 (Commercial) for the year ended 31 March 2011

151
(Fig
ures
in c
olum
ns 5
(a) t
o 11
are
` in
Cro
re)
Sl.
No.
Se
ctor
& N
ame
of th
e C
ompa
ny
Peri
od o
f A
ccou
nts
Yea
r in
w
hich
fin
alis
ed
Net
Pro
fit (+
)/ L
oss (
-)
Tur
nove
r Im
pact
of
Acc
ount
s C
omm
ent
s (A
)
Paid
up
Cap
ital#
Acc
umu
late
d Pr
ofit
(+)/
Los
s(-)
Cap
ital
empl
oyed
(B
)
Ret
urn
on
capi
tal
empl
oyed
(C
)
Perc
ent
age
retu
rn
on
capi
tal
empl
oyed
Net
Pr
ofit/
L
oss
befo
re
Inte
rest
&
D
epre
cia
tion
Inte
rest
D
epre
cia
tion
Net
Pro
fit/
Los
s
1 2
3 4
5 (a
) 5
(b)
5 (c
) 5
(d)
6 7
8 9
10
11
12
13
Guj
arat
Tex
feb
Lim
ited
(und
er
liqui
datio
n, su
bsid
iary
of G
STC
) 19
94-9
5 19
95-9
6 0.
00
0.00
0.
00
0.00
0.
00
--
-∇
6.04
0.
00
0.00
--
Sect
or w
ise
Tot
al
-34.
21
0.00
0.
00
-34.
21
5.57
0.
00
59.7
4 -1
07.4
8 -3
.84
-34.
21
--
Tot
al C
(All
sect
or w
ise
non
wor
king
Gov
ernm
ent c
ompa
nies
) -3
5.11
4.
44
0.03
-3
9.58
69
.85
0.00
98
.64
-335
.85
18.1
2 -3
5.14
--
Gra
nd T
otal
(A +
B +
C )
7,19
4.90
2,
423.
60
2,14
7.94
2,
623.
36
63,0
78.0
5 93
.18
38,1
94.4
7 16
9.34
96
,329
.95
5,04
6.96
5.
24
(A)
Impa
ct o
f acc
ount
s com
men
ts in
clud
e th
e co
mm
ents
of S
tatu
tory
Aud
itors
and
CA
G in
dica
ting
decr
ease
in p
rofit
/ inc
reas
e in
loss
es
(B)
Cap
ital e
mpl
oyed
repr
esen
ts th
e ne
t fix
ed a
sset
s (in
clud
ing
capi
tal w
orks
-in-p
rogr
ess)
plu
s wor
king
cap
ital e
xcep
t in
case
of f
inan
cial
com
pani
es/ C
orpo
ratio
ns w
here
the
Cap
ital e
mpl
oyed
repr
esen
ts th
e m
ean
of th
e ag
greg
ate
of o
peni
ng a
nd c
losi
ng b
alan
ces o
f p
aid-
up c
apita
l, lo
ans i
n lie
u of
cap
ital,
seed
mon
ey, d
eben
ture
s, re
serv
es (o
ther
than
thos
e w
hich
hav
e be
en fu
nded
spec
ifica
lly a
nd b
acke
d by
inve
stm
ents
out
side
), bo
nds,
depo
sits
and
bor
row
ings
(inc
ludi
ng re
finan
ce).
(c)
Ret
urn
on C
apita
l Em
ploy
ed h
as b
een
wor
ked
out b
y ad
ding
pro
fit/lo
ss a
nd in
tere
st c
harg
ed to
pro
fit a
nd lo
ss a
ccou
nt.
# Pa
id-u
p C
apita
l inc
lude
s Sha
re A
pplic
atio
n M
oney
$ Ex
cess
of i
ncom
e tra
nsfe
rred
to N
on-p
lan
gran
t by
Com
pany
(Sl.
No.
A-8
)
## E
xces
s of i
ncom
e ov
er e
xpen
ditu
re w
ere
capi
taliz
ed b
y th
e C
ompa
ny (S
l. N
o.A
-19)
@@
The
Com
pany
(Sl.
No.
A-2
4 an
d A
-30)
is g
oing
to p
repa
re it
s firs
t acc
ount
s for
the
perio
d up
to 3
1 M
arch
201
1. T
he a
ccou
nts a
re u
nder
arr
ears
.
***
indi
cate
s PSU
und
er c
onst
ruct
ion
(Sl.
No.
A-2
8, A
-29,
A-3
1, A
-41,
A-4
2, A
-50
and
A-5
5)
* St
ate
Gov
ernm
ent m
ade
capi
tal c
ontri
butio
n in
the
form
of l
oan,
hen
ce, p
aid-
up c
apita
l is N
il (S
l. N
o. B
-3)
∇ P
aid
up c
apita
l (Sl
. No.
. C
-11,
C-1
2 an
d C
-13)
` 2
00/-
each
onl
y.
Annexure

152
St
atem
ent s
how
ing
gran
ts a
nd su
bsid
y re
ceiv
ed/r
ecei
vabl
e, g
uara
ntee
s rec
eive
d, w
aive
r of
due
s, lo
ans w
ritt
en o
ff a
nd lo
ans c
onve
rted
in
to e
quity
dur
ing
the
year
and
gua
rant
ee c
omm
itmen
t at t
he e
nd o
f Mar
ch 2
011
(Ref
erre
d to
in p
arag
raph
1.1
0)
(Fig
ures
in c
olum
ns 3
(a) t
o 6(
d) a
re `
in c
rore
) E
quity
/ loa
ns
rece
ived
out
of
budg
et d
urin
g th
e ye
ar
Gra
nts a
nd su
bsid
y re
ceiv
ed d
urin
g th
e ye
ar
Gua
rant
ees r
ecei
ved
duri
ng
the
year
and
com
mitm
ent a
t th
e en
d of
the
year
Wai
ver
of d
ues d
urin
g th
e ye
ar
Sl.
No
Sect
or a
nd N
ame
of th
e C
ompa
ny
Equ
ity
Loa
ns
Cen
tral
G
over
nmen
t St
ate
Gov
ernm
ent
Oth
ers
Tot
al
Rec
eive
d C
omm
itmen
t@
Loa
ns
repa
ymen
t w
ritt
en o
ff
Loa
ns
conv
erte
d in
to
equi
ty
Inte
rest
/pen
al
inte
rest
w
aive
d
Tot
al
(1)
(2)
3 (a
) 3
(b)
4 (a
) 4
(b)
4 (c
) 4
(d)
5 (a
) 5
(b)
6 (a
) 6
(b)
6 (c
) 6
(d)
A
Wor
king
Gov
ernm
ent C
ompa
nies
A
gric
ultu
re &
Alli
ed
1 G
ujar
at A
gro
Indu
strie
s C
orpo
ratio
n Li
mite
d 0.
00
0.00
8.
34
179.
93
0.67
18
8.94
0.
00
0.00
7.
00
0.00
2.
31
9.31
2 G
ujar
at S
tate
See
ds
Cor
pora
tion
Lim
ited
0.10
0.
00
0.38
0.
00
0.00
0.
38
0.00
0.
00
0.00
0.
00
0.00
0.
00
3 G
ujar
at S
tate
Lan
d D
evel
opm
ent C
orpo
ratio
n Li
mite
d
0.00
2 0.
00
0.00
46
9.51
6.
20
475.
71
0.00
0.
00
0.00
0.
00
0.00
0.
00
4 G
ujar
at S
heep
and
Woo
l D
evel
opm
ent C
orpo
ratio
n Li
mite
d
0.00
0.
00
1.03
10
.99
0.00
12
.02
0.00
0.
00
0.00
0.
00
0.00
0.
00
Sec
tor
wis
e T
otal
0.
10
0.00
9.
75
660.
43
6.87
67
7.05
0.
00
0.00
7.
00
0.00
2.
31
9.31
Fi
nanc
e 5
Guj
arat
Indu
stria
l Inv
estm
ent
Cor
pora
tion
Lim
ited
0.00
0.
00
0.00
10
.00
0.00
10
.00
0.00
0.
10
0.00
0.
00
0.00
0.
00
6 G
ujar
at S
tate
Han
dloo
m a
nd
Han
dicr
afts
Dev
elop
men
t C
orpo
ratio
n Li
mite
d
0.00
0.
00
0.00
8.
14
0.00
8.
14
0.00
0.
00
0.00
0.
00
0.00
0.
00
7 G
ujar
at S
tate
Inve
stm
ents
Li
mite
d 0.
00
512.
25
0.00
0.
00
0.00
0.
00
0.00
0.
00
0.00
0.
00
0.00
0.
00
8 G
ujar
at W
omen
Eco
nom
ic
Dev
elop
men
t Cor
pora
tion
Li
mite
d
0.00
0.
00
0.00
9.
41
0.00
9.
41
0.00
0.
00
0.00
0.
00
0.00
0.
00
9 G
ujar
at M
inor
ities
Fin
ance
an
d D
evel
opm
ent
Cor
pora
tion
Lim
ited
0.00
1.
20
0.10
0.
83
0.00
0.
93
0.00
31
.22
0.00
0.
00
0.00
0.
00
Ann
exur
e 3
Audit Report No.4 (Commercial) for the year ended 31 March 2011

153
(Fig
ures
in c
olum
ns 3
(a) t
o 6(
d) a
re `
in c
rore
) E
quity
/ loa
ns
rece
ived
out
of
budg
et d
urin
g th
e ye
ar
Gra
nts a
nd su
bsid
y re
ceiv
ed d
urin
g th
e ye
ar
Gua
rant
ees r
ecei
ved
duri
ng
the
year
and
com
mitm
ent a
t th
e en
d of
the
year
Wai
ver
of d
ues d
urin
g th
e ye
ar
Sl.
No
Sect
or a
nd N
ame
of th
e C
ompa
ny
Equ
ity
Loa
ns
Cen
tral
G
over
nmen
t St
ate
Gov
ernm
ent
Oth
ers
Tot
al
Rec
eive
d C
omm
itmen
t@
Loa
ns
repa
ymen
t w
ritt
en o
ff
Loa
ns
conv
erte
d in
to
equi
ty
Inte
rest
/pen
al
inte
rest
w
aive
d
Tot
al
(1)
(2)
3 (a
) 3
(b)
4 (a
) 4
(b)
4 (c
) 4
(d)
5 (a
) 5
(b)
6 (a
) 6
(b)
6 (c
) 6
(d)
10
Guj
arat
Gop
alak
D
evel
opm
ent C
orpo
ratio
n Li
mite
d
0.75
0.
00
0.00
1.
15
0.00
1.
15
0.00
8.
57
0.00
0.
00
0.00
0.
00
11
Guj
arat
Saf
ai K
amda
r Vik
as
Nig
am L
imite
d 0.
50
1.57
0.
00
21.6
0 0.
00
21.6
0 0.
00
25.0
0 0.
00
0.00
0.
00
0.00
12
Guj
arat
Tha
kor a
nd K
oli
Vik
as N
igam
Lim
ited
0.75
0.
50
0.00
0.
47
0.00
0.
47
0.00
9.
26
0.00
0.
00
0.00
0.
00
13
Guj
arat
Liv
elih
ood
Prom
otio
n C
ompa
ny L
imite
d 0.
05
0.00
1.
13
12.0
4 0.
00
13.1
7 0.
00
0.00
0.
00
0.00
0.
00
0.00
Sec
tor
wis
e T
otal
2.
05
515.
52
1.23
63
.64
0.00
64
.87
0.00
74
.15
0.00
0.
00
0.00
0.
00
Infr
astr
uctu
re
14
Guj
arat
Sta
te R
ural
D
evel
opm
ent C
orpo
ratio
n Li
mite
d
0.00
0.
00
0.00
0.
13
0.00
0.
13
0.00
0.
00
0.00
0.
00
0.00
0.
00
15
Guj
arat
Sta
te P
olic
e H
ousi
ng
Cor
pora
tion
Lim
ited
0.00
0.
00
20.5
5 14
4.97
0.
00
165.
52
0.00
0.
00
0.00
0.
00
0.00
0.
00
16
Guj
arat
Sta
te R
oad
Dev
elop
men
t Cor
pora
tion
Lim
ited
0.00
0.
00
0.00
77
.20
0.00
77
.20
0.00
0.
00
0.00
0.
00
0.00
0.
00
Sec
tor
wis
e T
otal
0.
00
0.00
20
.55
222.
30
0.00
24
2.85
0.
00
0.00
0.
00
0.00
0.
00
0.00
M
anuf
actu
re
17
Alc
ock
Ash
dow
n (G
ujar
at)
Lim
ited
0.00
43
.00
0.00
0.
00
0.00
0.
00
0.00
0.
00
0.00
0.
00
0.00
0.
00
Sec
tor
wis
e T
otal
0.
00
43.0
0 0.
00
0.00
0.
00
0.00
0.
00
0.00
0.
00
0.00
0.
00
0.00
Po
wer
18
G
ujar
at P
ower
Cor
pora
tion
Lim
ited
63.0
0 14
7.00
∇
0.00
0.
00
0.00
0.
00
0.00
0.
00
0.00
0.
00
0.00
0.
00
19
Guj
arat
Sta
te E
lect
ricity
C
orpo
ratio
n Li
mite
d 0.
00
0.00
0.
00
0.54
0.
00
0.54
0.
00
42.7
8 0.
00
0.00
0.
00
0.00
20
Guj
arat
Ene
rgy
Tran
smis
sion
C
orpo
ratio
n Li
mite
d 0.
00
0.00
0.
00
188.
07
0.00
18
8.07
0.
00
0.00
0.
00
0.00
0.
00
0.00
21
Dak
shin
Guj
arat
Vij
Com
pany
Lim
ited
0.00
0.
00
0.00
21
1.91
0.
00
211.
91
0.00
0.
00
0.00
0.
00
0.00
0.
00
Annexure

154
(Fig
ures
in c
olum
ns 3
(a) t
o 6(
d) a
re `
in c
rore
) Sl
. N
o Se
ctor
and
Nam
e of
the
Com
pany
E
quity
/ loa
ns
rece
ived
out
of
budg
et d
urin
g th
e ye
ar
Gra
nts a
nd su
bsid
y re
ceiv
ed d
urin
g th
e ye
ar
Gua
rant
ees r
ecei
ved
duri
ng
the
year
and
com
mitm
ent a
t th
e en
d of
the
year
Wai
ver
of d
ues d
urin
g th
e ye
ar
Equ
ity
Loa
ns
Cen
tral
G
over
nmen
t St
ate
Gov
ernm
ent
Oth
ers
Tot
al
Rec
eive
dC
omm
itmen
t@
Loa
ns
repa
ymen
t w
ritt
en o
ff
Loa
ns
conv
erte
d in
to
equi
ty
Inte
rest
/ pe
nal i
nter
est
wai
ved
Tot
al
(1)
(2)
3 (a
) 3
(b)
4 (a
) 4
(b)
4 (c
) 4
(d)
5 (a
) 5
(b)
6 (a
) 6
(b)
6 (c
) 6
(d)
22
Mad
hya
Guj
arat
Vij
Com
pany
Lim
ited
0.00
0.
00
0.00
22
8.24
0.
00
228.
24
0.00
0.
00
0.00
0.
00
0.00
0.
00
23
Pasc
him
Guj
arat
Vij
Com
pany
Lim
ited
0.00
0.
00
0.00
1,
016.
47
0.00
1,
016.
47
0.00
0.
00
0.00
0.
00
0.00
0.
00
24
Utta
r Guj
arat
Vij
Com
pany
Li
mite
d 0.
00
0.00
0.
00
1,47
7.10
0.
00
1,47
7.10
0.
00
0.00
0.
00
0.00
0.
00
0.00
25
Guj
arat
Urja
Vik
as N
igam
Li
mite
d 62
8.26
0.
00
0.00
4.
10
0.00
4.
10
0.00
1,
680.
04
0.00
0.
00
0.00
0.
00
Sec
tor
wis
e T
otal
69
1.26
14
7.00
0.
00
3,12
6.43
0.
00
3,12
6.43
0.
00
1,72
2.82
0.
00
0.00
0.
00
0.00
Se
rvic
e 26
To
uris
m C
orpo
ratio
n of
G
ujar
at L
imite
d 0.
00
0.00
0.
00
1.76
0.
00
1.76
0.
00
0.00
0.
00
0.00
0.
00
0.00
27
Guj
arat
Sta
te C
ivil
Supp
lies
Cor
pora
tion
Lim
ited
0.00
0.
00
0.00
21
.22
0.00
21
.22
0.00
0.
00
0.00
0.
00
0.00
0.
00
28
Guj
arat
Info
rmat
ics L
imite
d 0.
00
0.00
7.
65
31.3
8 0.
00
39.0
3 0.
00
0.00
0.
00
0.00
0.
00
0.00
29
G
ujar
at W
ater
Res
ourc
es
Dev
elop
men
t Cor
pora
tion
Li
mite
d
0.00
0.
00
0.00
46
.00
0.00
46
.00
0.00
0.
00
0.00
0.
00
0.00
0.
00
30
Guj
arat
Sta
te F
ores
t D
evel
opm
ent C
orpo
ratio
n Li
mite
d
0.00
0.
00
1.30
0.
00
0.00
1.
30
0.00
8.
98
0.00
0.
00
0.00
0.
00
Sec
tor
wis
e T
otal
0.
00
0.00
8.
95
100.
36
0.00
10
9.31
0.
00
8.98
0.
00
0.00
0.
00
0.00
M
isce
llane
ous
31
Guj
arat
Rur
al In
dust
ries
Mar
ketin
g C
orpo
ratio
n
Lim
ited
0.00
0.
00
0.00
0.
78
0.00
0.
78
0.00
0.
00
0.00
0.
00
0.00
0.
00
32
Sard
ar S
arov
ar N
arm
ada
Nig
am L
imite
d 2,
191.
54
0.00
0.
00
0.00
0.
00
0.00
0.
00
3,10
9.66
0.
00
0.00
0.
00
0.00
33
Guj
arat
Wat
er In
fras
truct
ure
Lim
ited
10.0
0 0.
00
0.00
55
8.75
0.
00
558.
75
0.00
0.
00
0.00
0.
00
0.00
0.
00
Sec
tor
wis
e T
otal
2,
201.
54
0.00
0.
00
559.
53
0.00
55
9.53
0.
00
3,10
9.66
0.
00
0.00
0.
00
0.00
T
otal
A (A
ll se
ctor
wis
e w
orki
ng
Gov
ernm
ent c
ompa
nies
) 2,
894.
95
705.
52
40.4
8 4,
732.
69
6.87
4,
780.
04
0.00
4,
915.
61
7.00
0.
00
2.31
9.
31
Audit Report No.4 (Commercial) for the year ended 31 March 2011
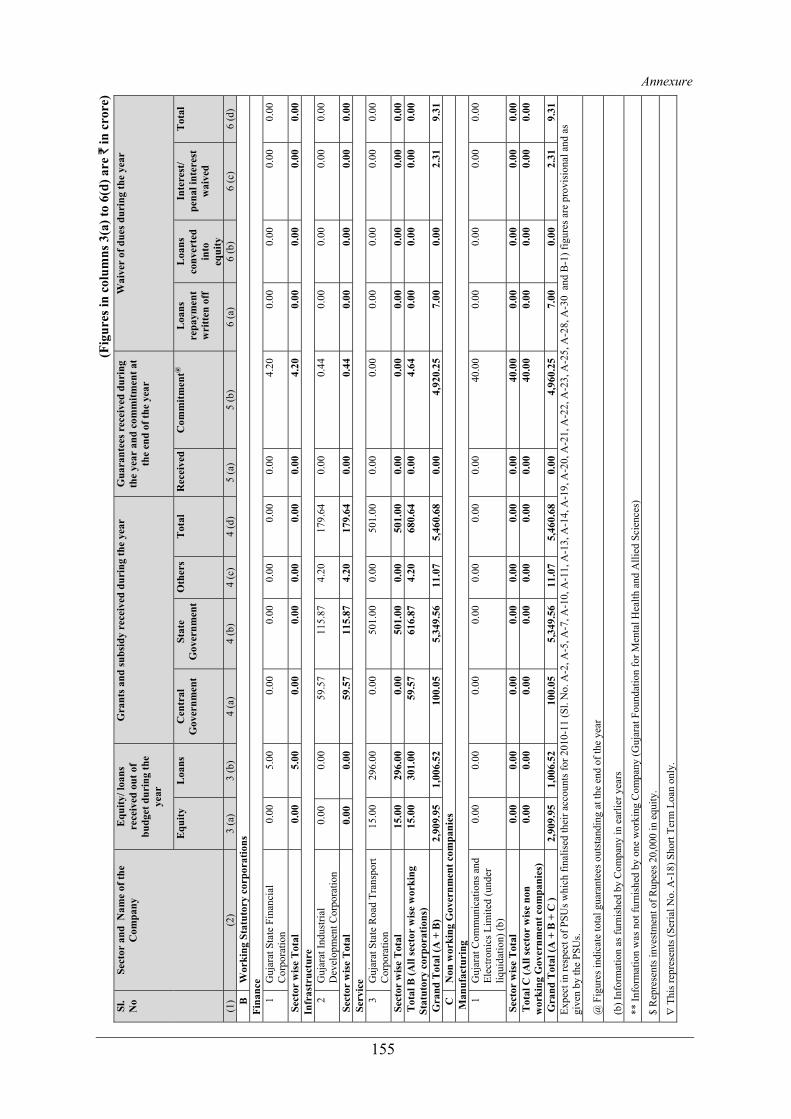
155
(Fig
ures
in c
olum
ns 3
(a) t
o 6(
d) a
re `
in c
rore
) Sl
. N
o Se
ctor
and
Nam
e of
the
Com
pany
E
quity
/ loa
ns
rece
ived
out
of
budg
et d
urin
g th
e ye
ar
Gra
nts a
nd su
bsid
y re
ceiv
ed d
urin
g th
e ye
ar
Gua
rant
ees r
ecei
ved
duri
ng
the
year
and
com
mitm
ent a
t th
e en
d of
the
year
Wai
ver
of d
ues d
urin
g th
e ye
ar
Equ
ity
Loa
ns
Cen
tral
G
over
nmen
t St
ate
Gov
ernm
ent
Oth
ers
Tot
al
Rec
eive
dC
omm
itmen
t@
Loa
ns
repa
ymen
t w
ritt
en o
ff
Loa
ns
conv
erte
d in
to
equi
ty
Inte
rest
/ pe
nal i
nter
est
wai
ved
Tot
al
(1)
(2)
3 (a
) 3
(b)
4 (a
) 4
(b)
4 (c
) 4
(d)
5 (a
) 5
(b)
6 (a
) 6
(b)
6 (c
) 6
(d)
B
Wor
king
Sta
tuto
ry c
orpo
ratio
ns
Fina
nce
1
Guj
arat
Sta
te F
inan
cial
C
orpo
ratio
n 0.
00
5.00
0.
00
0.00
0.
00
0.00
0.
00
4.20
0.
00
0.00
0.
00
0.00
Sec
tor
wis
e T
otal
0.
00
5.00
0.
00
0.00
0.
00
0.00
0.
00
4.20
0.
00
0.00
0.
00
0.00
In
fras
truc
ture
2
Guj
arat
Indu
stria
l D
evel
opm
ent C
orpo
ratio
n 0.
00
0.00
59
.57
115.
87
4.20
17
9.64
0.
00
0.44
0.
00
0.00
0.
00
0.00
Sec
tor
wis
e T
otal
0.
00
0.00
59
.57
115.
87
4.20
17
9.64
0.
00
0.44
0.
00
0.00
0.
00
0.00
S
ervi
ce
3 G
ujar
at S
tate
Roa
d Tr
ansp
ort
Cor
pora
tion
15.0
0 29
6.00
0.
00
501.
00
0.00
50
1.00
0.
00
0.00
0.
00
0.00
0.
00
0.00
Sec
tor
wis
e T
otal
15
.00
296.
00
0.00
50
1.00
0.
00
501.
00
0.00
0.
00
0.00
0.
00
0.00
0.
00
Tot
al B
(All
sect
or w
ise
wor
king
St
atut
ory
corp
orat
ions
) 15
.00
301.
00
59.5
7 61
6.87
4.
20
680.
64
0.00
4.
64
0.00
0.
00
0.00
0.
00
Gra
nd T
otal
(A +
B)
2,90
9.95
1,
006.
52
100.
05
5,34
9.56
11
.07
5,46
0.68
0.
00
4,92
0.25
7.
00
0.00
2.
31
9.31
C
N
on w
orki
ng G
over
nmen
t com
pani
es
Man
ufac
turi
ng
1 G
ujar
at C
omm
unic
atio
ns a
nd
Elec
troni
cs L
imite
d (u
nder
liq
uida
tion)
(b)
0.00
0.
00
0.00
0.
00
0.00
0.
00
0.00
40
.00
0.00
0.
00
0.00
0.
00
Sec
tor
wis
e T
otal
0.00
0.
00
0.00
0.
00
0.00
0.
00
0.00
40
.00
0.00
0.
00
0.00
0.
00
Tot
al C
(All
sect
or w
ise
non
wor
king
Gov
ernm
ent c
ompa
nies
) 0.
00
0.00
0.
00
0.00
0.
00
0.00
0.
00
40.0
0 0.
00
0.00
0.
00
0.00
Gra
nd T
otal
(A +
B +
C )
2,90
9.95
1,
006.
52
100.
05
5,34
9.56
11
.07
5,46
0.68
0.
00
4,96
0.25
7.
00
0.00
2.
31
9.31
Ex
pect
in re
spec
t of P
SUs w
hich
fina
lised
thei
r acc
ount
s for
201
0-11
(Sl.
No.
A-2
, A-5
, A-7
, A-1
0, A
-11,
A-1
3, A
-14,
A-1
9, A
-20,
A-2
1, A
-22,
A-2
3, A
-25,
A-2
8, A
-30
and
B-1
) fig
ures
are
pro
visi
onal
and
as
give
n by
the
PSU
s.
@ F
igur
es in
dica
te to
tal g
uara
ntee
s out
stan
ding
at t
he e
nd o
f the
yea
r
(b) I
nfor
mat
ion
as fu
rnis
hed
by C
ompa
ny in
ear
lier y
ears
** In
form
atio
n w
as n
ot fu
rnis
hed
by o
ne w
orki
ng C
ompa
ny (G
ujar
at F
ound
atio
n fo
r Men
tal H
ealth
and
Alli
ed S
cien
ces)
$ R
epre
sent
s inv
estm
ent o
f Rup
ees 2
0,00
0 in
equ
ity.
∇ T
his r
epre
sent
s (Se
rial N
o. A
-18)
Sho
rt Te
rm L
oan
only
.
Annexure

Audit Report No.4 (Commercial) for the year ended 31 March 2011
156
Statement showing investments made by State Government in PSUs whose accounts are in arrears
(Referred to in paragraph 1.25) (Figures in columns 6 to 8 are ` in Crore)
Investment made by State Government during the year of
which accounts are in arrear
Sl. No.
Name of the Public Sector Undertaking # Year upto
which accounts finalised
Paid up capital
Period of accounts pending
finalisationEquity Loans Grants
(1) (2) (3) (4) (5) (6) (7) (8) A Working Government Companies 1 Gujarat Agro Industries Corporation Limited 2009-10 8.08 2010-11 0.00 0.00 179.93
2 Gujarat State Land Development Corporation Limited
2009-10 5.88 2010-11 0.002 0.00 469.51
3 Gujarat Sheep and Wool Development Corporation Limited
2009-10 4.31 2010-11 0.00 0.00 10.99
2010-11 0.00 0.00 8.14 4 Gujarat State Handloom and Handicrafts Development Corporation Limited
2008-09 12.06
2009-10 0.00 1.40 7.22 2010-11 0.00 0.00 9.41 2009-10 0.00 0.00 9.58
5 Gujarat Women Economic Development Corporation Limited
2007-08 7.02
2008-09 0.00 0.00 9.63 6 Gujarat Minorities Finance and Development
Corporation Limited 2009-10 10.00 2010-11 0.00 1.20 0.83
7 Gujarat Thakor and Koli Vikas Nigam Limited
2009-10 2.10 2010-11 0.75 0.50 0.47
8 Gujarat State Police Housing Corporation Limited
2009-10 50.00 2010-11 0.00 0.00 144.97
9 Gujarat State Road Development Corporation Limited
2009-10 6.00 2009-10 0.00 0.00 77.20
10 Alcock Ashdown (Gujarat) Limited 2009-10 51.00 2010-11 0.00 43.00 0.00 11 Gujarat Power Corporation Limited 2009-10 219.58 2010-11 63.00 147.00∇ 0.00 12 Uttar Gujarat Vij Company Limited 2009-10 237.15 2010-11 0.00 0.00 1,477.10
13 Tourism Corporation of Gujarat Limited 2009-10 20.00 2010-11 0.00 0.00 1.76 14 Gujarat State Civil Supplies Corporation
Limited 2009-10 10.00 2010-11 0.00 0.00 21.22
15 Gujarat Water Resources Development Corporation Limited
2009-10 31.49 2010-11 0.00 0.00 46.00
2010-11 0.00 0.00 0.78 16 Gujarat Rural Industries Marketing Corporation Limited
2008-09 9.17 2009-10 0.00 0.00 0.86
17 Sardar Sarovar Narmada Nigam Limited 2009-10 25,912.21 2010-11 2,191.54 0.00 0.00 18 Gujarat Water Infrastructure Limited 2009-10 109.92 2010-11 10.00 0.00 558.75
Total A (Working Government Companies) 26,705.97 2,265.29 193.10 3,034.35 B Working Statutory corporations 1 Gujarat Industrial Development Corporation 2009-10 *0.00 2010-11 0.00 0.00 115.87
2010-11 15.00 296.00 501.00 2 Gujarat State Road Transport Corporation 2008-09 689.34
2009-10 15.00 235.70 501.62 Total B (Working Statutory corporations) 689.34 30.00 531.70 1,118.49 Grand Total (A + B) 27,395.31 2,295.29 724.80 4,125.84 ** Information was not furnished by one working Company (Gujarat Foundation for Mental Health and Allied Sciences), which had arrears of accounts from 2008-09 to 2010-11 * State Government made Capital contribution in the form of loan, hence paid up capital is ‘nil’. ∇ Represents short term loans only.
Annexure 4
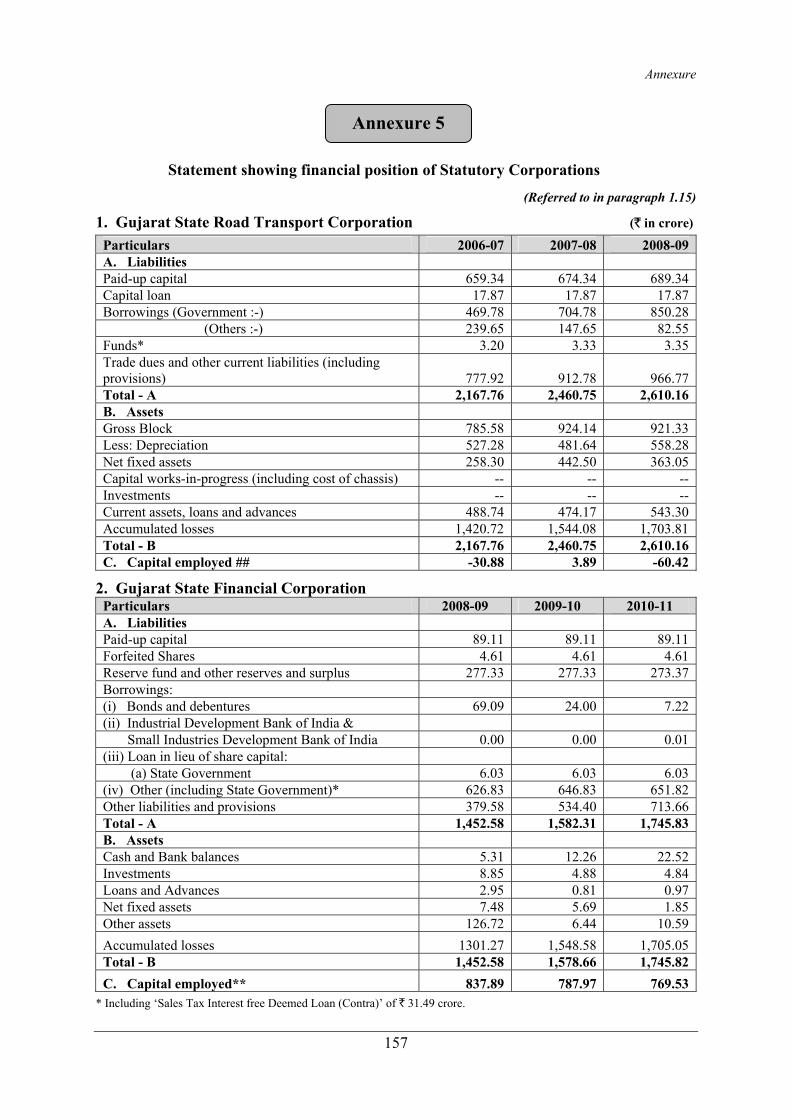
Annexure
157
Statement showing financial position of Statutory Corporations (Referred to in paragraph 1.15)
1. Gujarat State Road Transport Corporation (` in crore) Particulars 2006-07 2007-08 2008-09 A. Liabilities Paid-up capital 659.34 674.34 689.34 Capital loan 17.87 17.87 17.87 Borrowings (Government :-) 469.78 704.78 850.28 (Others :-) 239.65 147.65 82.55 Funds* 3.20 3.33 3.35 Trade dues and other current liabilities (including provisions) 777.92 912.78 966.77 Total - A 2,167.76 2,460.75 2,610.16 B. Assets Gross Block 785.58 924.14 921.33 Less: Depreciation 527.28 481.64 558.28 Net fixed assets 258.30 442.50 363.05 Capital works-in-progress (including cost of chassis) -- -- --Investments -- -- --Current assets, loans and advances 488.74 474.17 543.30 Accumulated losses 1,420.72 1,544.08 1,703.81 Total - B 2,167.76 2,460.75 2,610.16 C. Capital employed ## -30.88 3.89 -60.42
2. Gujarat State Financial Corporation Particulars 2008-09 2009-10 2010-11 A. Liabilities Paid-up capital 89.11 89.11 89.11 Forfeited Shares 4.61 4.61 4.61 Reserve fund and other reserves and surplus 277.33 277.33 273.37 Borrowings: (i) Bonds and debentures 69.09 24.00 7.22 (ii) Industrial Development Bank of India & Small Industries Development Bank of India 0.00 0.00 0.01 (iii) Loan in lieu of share capital: (a) State Government 6.03 6.03 6.03 (iv) Other (including State Government)* 626.83 646.83 651.82 Other liabilities and provisions 379.58 534.40 713.66 Total - A 1,452.58 1,582.31 1,745.83 B. Assets Cash and Bank balances 5.31 12.26 22.52 Investments 8.85 4.88 4.84 Loans and Advances 2.95 0.81 0.97 Net fixed assets 7.48 5.69 1.85 Other assets 126.72 6.44 10.59 Accumulated losses 1301.27 1,548.58 1,705.05 Total - B 1,452.58 1,578.66 1,745.82 C. Capital employed** 837.89 787.97 769.53
* Including ‘Sales Tax Interest free Deemed Loan (Contra)’ of ` 31.49 crore.
Annexure 5

Audit Report No.4 (Commercial) for the year ended 31 March 2011
158
3. Gujarat State Warehousing Corporation (` in crore)
Particulars 2007-08 2008-09 2009-10 A. Liabilities Paid-up-capital 4.00 4.00 4.00 Reserves and surplus 4.05 4.56 4.76 Trade dues and current liabilities (including provisions) 2.77 2.22 1.74 Total - A 10.82 10.78 10.50 B. Assets Gross Block 8.40 8.45 8.45 Less: Depreciation 3.92 4.09 4.25 Net fixed assets 4.48 4.36 4.20 Capital works-in-progress 0.03 0.00 0.00 Current assets, loans and advances 6.31 6.42 6.30 Total - B 10.82 10.78 10.50 C. Capital employed ## 8.05 8.56 8.76 4 Gujarat Industrial Development Corporation
Particulars 2007-08 2008-09 2009-10 A. Liabilities Loans 5.62 4.30 4.57 Subsidy from Government 127.31 251.46 426.99 Reserves and surplus 709.12 874.18 1,021.66 Receipts on capital account 2,104.11 2,538.76 3,510.87 Current liabilities and provisions (including deposits) 346.78 661.96 859.05 Total - A 3,292.94 4,330.66 5,823.14 B. Assets Gross block 27.43 29.47 34.14 Less: Depreciation 13.35 14.96 16.67 Net fixed assets 14.08 14.51 17.47 Works-in-progress 47.44 179.45 64.57 Capital expenditure on development of industrial estates etc.
1,131.57 1,752.73 2,402.24
Investments 123.60 107.75 217.09 Other assets 1,976.25 2,276.22 3121.77 Total - B 3,292.94 4,330.66 5,823.14 C. Capital employed## 2,822.56 3,560.95 4,747.00
* Excluding depreciation funds
## Capital employed represents the net fixed assets (including capital works-in-progress) plus working capital
** Capital employed represents the mean of the aggregate of opening and closing balances of paid-up capital, loans in lieu of capital, seed money, debentures, reserves (other than those which have been funded specifically and backed by investments outside), bonds, deposits and borrowings (including refinance).
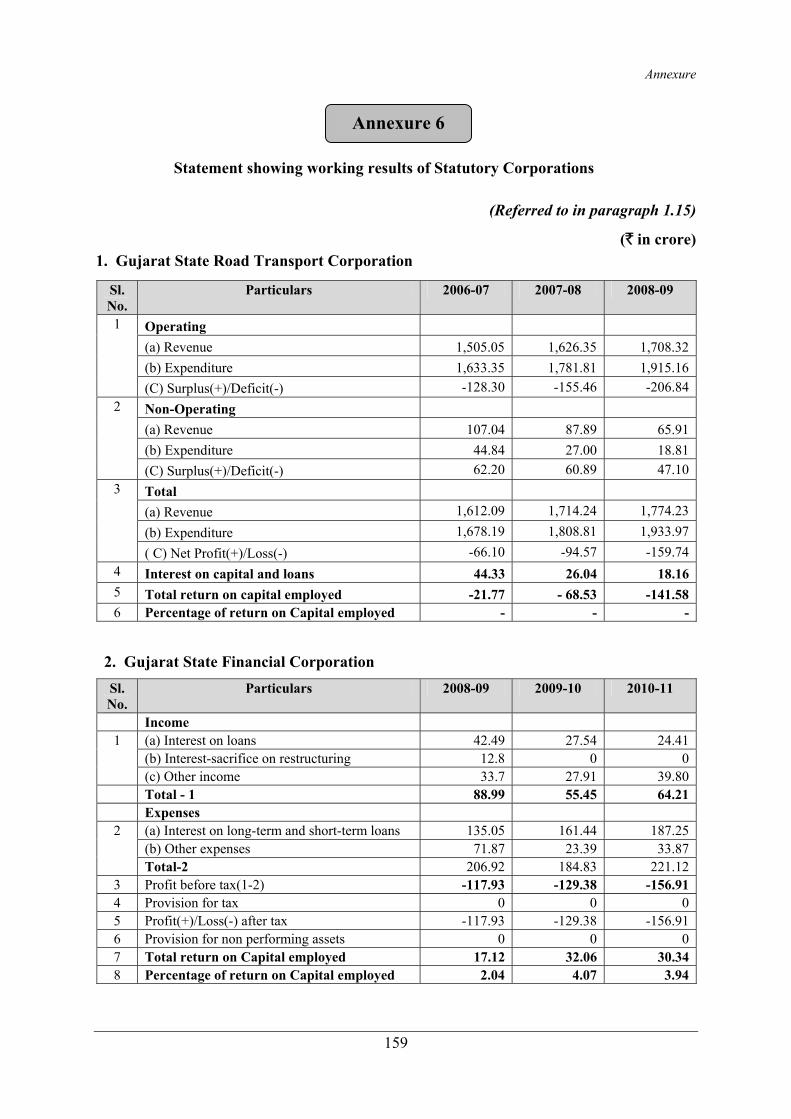
Annexure
159
Statement showing working results of Statutory Corporations
(Referred to in paragraph 1.15)
(` in crore) 1. Gujarat State Road Transport Corporation
Sl. No.
Particulars 2006-07 2007-08 2008-09
Operating (a) Revenue 1,505.05 1,626.35 1,708.32(b) Expenditure 1,633.35 1,781.81 1,915.16
1
(C) Surplus(+)/Deficit(-) -128.30 -155.46 -206.84Non-Operating (a) Revenue 107.04 87.89 65.91(b) Expenditure 44.84 27.00 18.81
2
(C) Surplus(+)/Deficit(-) 62.20 60.89 47.10Total (a) Revenue 1,612.09 1,714.24 1,774.23(b) Expenditure 1,678.19 1,808.81 1,933.97
3
( C) Net Profit(+)/Loss(-) -66.10 -94.57 -159.744 Interest on capital and loans 44.33 26.04 18.165 Total return on capital employed -21.77 - 68.53 -141.586 Percentage of return on Capital employed - - -
2. Gujarat State Financial Corporation Sl. No.
Particulars 2008-09 2009-10 2010-11
Income (a) Interest on loans 42.49 27.54 24.41(b) Interest-sacrifice on restructuring 12.8 0 0
1
(c) Other income 33.7 27.91 39.80 Total - 1 88.99 55.45 64.21 Expenses
(a) Interest on long-term and short-term loans 135.05 161.44 187.25(b) Other expenses 71.87 23.39 33.87
2
Total-2 206.92 184.83 221.123 Profit before tax(1-2) -117.93 -129.38 -156.914 Provision for tax 0 0 05 Profit(+)/Loss(-) after tax -117.93 -129.38 -156.916 Provision for non performing assets 0 0 07 Total return on Capital employed 17.12 32.06 30.348 Percentage of return on Capital employed 2.04 4.07 3.94
Annexure 6

Audit Report No.4 (Commercial) for the year ended 31 March 2011
160
(` in crore) 3. Gujarat State Warehousing Corporation
Sl. No.
Particulars 2007-08 2008-09 2009-10
Income (a) Warehousing charges 2.56 3.92 4.08(b) Other income 1.23 1.19 1.28
1
Total-1 3.79 5.11 5.36Expenses (a) Establishment charges 3.34 3.02 3.17(b) Other expenses 0.84 1.32 1.90
2
Total-2 4.18 4.34 5.073 Profit(+)/Loss(-) before tax -0.39 0.77 0.294 Provision for tax 0.00 0.15 0.095 Prior period adjustments 0.00 0.00 0.016 Other appropriations 0.00 0.09 -0.077 Amount available for dividend NIL 0.53 0.268 Dividend for the year - 0.13 0.069 Total return on capital employed -0.39 0.77 0.29
10 Percentage of return on capital employed - 9.00 3.31 4. Gujarat Industrial Development Corporation
Sl. No.
Particulars 2007-08 2008-09 2009-10
1 Revenue Receipts 290.77 393.15 537.432 Net expenditure after capitalisation 169.81 228.09 389.953 Excess of income over expenditure 120.96 165.06 147.48
4 Provision for replacement, renewals and for additional liability -- -- --
5 Net surplus 120.96 165.06 147.486 Total interest charged in Profit & Loss account 0.42 0.39 0.317 Total return on capital employed 121.38 165.45 147.798 Percentage of return on capital employed 4.30 4.65 3.11

Annexure
161
Statement showing particulars of distribution network planned vis-à-vis achievement there against for the DISCOMs as a whole and also DGVCL and
PGVCL during 2006-07 to 2010-11
1. State as a whole (Referred to in paragraph 2.1.14 & 2.1.40) Sl.No.
Description 2006-07 2007-08 2008-09 2009-10 2010-11
(A) Consumer and Connected load i No. of Consumers
(HT & LT) 88,89,775 94,40,046 1,01,03,997 1,06,66,300 1,13,21,743
ii Connected load at the year end (In MW)
21,606 22,858 24,164 25,184 27,239
(B) HT Lines (in CKM) i At the beginning of the year 1,80,972 2,04,690 2,11,926 2,22,712 2,31,786 ii Additions made during the
year 23,718 7,236 10,786 9,074 7,122
iii At the end of the year 2,04,690 2,11,926 2,22,712 2,31,786 2,38,908 (C) LT Lines (in CKM)
i At the beginning of the year 2,25,536 2,37,513 2,51,858 2,64,155 2,76,777 ii Additions made during the
year 11,977 14,345 12,297 12,622 5,472
iii At the end of the year 2,37,513 2,51,858 2,64,155 2,76,777 2,82,249 (D) HT-LT Ratio 0.86 0.84 0.84 0.84 0.85 (E) Transformers Capacity (in MVA)
i At the beginning of the year 19,833 21,645 22,948 23,817 25,033 ii Additions made during the
year 1,812 1,303 869 1,216 1,244
iii At the end of the year 21,645 22,948 23,817 25,033 26,277
2. Dakshin Gujarat Vij Company Limited
Sl. No.
Description 2006-07 2007-08 2008-09 2009-10 2010-11
(A) Consumer and connected load i No. of consumers
(HT & LT) 17,10,164 18,27,803 19,35,568 20,44,219 22,07,983
ii Connected load at the year end (in MW)
4,700.92 5,059.88 5248.12 4955.92 5335
(B) HT Lines (in CKM) i At the beginning of the year 17,837 24,536 26,230 28,022 29,755 ii Additions planned for the
year 6,699 1,694 1,792 1,733 1,500
iii Additions made during the year
6,699 1,694 1,792 1,733 549
iv At the end of the year 24,536 26,230 28,022 29,755 30,304 v Shortage in addition (ii-iii) 0 0 0 0 951
Annexure 7

Audit Report No.4 (Commercial) for the year ended 31 March 2011
162
S.No. Description 2006-07 2007-08 2008-09 2009-10 2010-11
(C) LT Lines (in CKM)
i At the beginning of the year 30,770 34,330 37,719 40,255 41,053
ii Additions planned for the year 3,560 3,560 3,389 2,536 798
iii Additions made during the year 3,560 3,389 2,536 798 739
iv At the end of the year 34,330 37,719 40,255 41,053 41,792
v Shortage in addition (ii-iii) 0 171 853 1,738 59
(D) HT-LT Ratio 0.71 0.70 0.70 0.72 0.73
(E) Transformers Capacity (in MVA)
i At the beginning of the year 2,803 3,207 3,496 3,667 3,885
ii Additions planned for the year 404 289 171 218 201
iii Additions made during the year 404 289 171 218 201
iv At the end of the year 3,207 3,496 3,667 3,885 4,086
v Shortage in addition (ii-iii) 0 0 0 0 0
3. Paschim Gujarat Vij Company Limited
S.No. Description 2006-07 2007-08 2008-09 2009-10 2010-11 (A) Consumer and connected load
i No. of consumers (HT <) 32,06,166 33,44,482 35,35,852 37,00,782 39,27,191 ii Connected load at the year end
(in MW) 8,228 8,372 8,967 9,060 10,141
(B) HT Lines (in CKM) i At the beginning of the year 72,630 84,409 85,915 91,077 94,978 ii Additions planned for the year No target fixed iii Additions made during the year 11,779 1,506 5,162 3,901 2,706 iv At the end of the year 84,409 85,915 91,077 94,978 97,684 v Shortage in addition (ii-iii) -- -- -- -- --
(C) LT Lines (in CKM) i At the beginning of the year 98,233 1,03,473 1,09,810 1,14,897 1,21,558 ii Additions planned for the year No target fixed iii Additions made during the year 5,240 6,337 5,087 6,661 (-)359 iv At the end of the year 1,03,473 1,09,810 1,14,897 1,21,558 1,21,199 v Shortage in addition (ii-iii) -- -- -- -- --
(D) HT-LT Ratio 0.82 0.78 0.79 0.78 0.81 (E) Transformers Capacity (in MVA)
i At the beginning of the year 7,468 8,332 8,773 9,087 9,645 ii Additions planned for the year No target fixed
iii Additions made during the year 864 441 314 558 702 iv At the end of the year 8,332 8,773 9,087 9,645 10,347 v Shortage in addition (ii-iii) -- -- -- -- --

Annexure
163
Statement showing loss of revenue due to slow replacement of conventional meters with static/quality meters in selected DISCOMs
(Referred to in paragraph 2.1.37)
1 Dakshin Gujarat Vij Company Limited
Year (A) Opening Balance of
Old Convention
al meters (B)
Replacement during the
year with Static/
Quality meters
(C )
Closing Balance of
Old Convention
al meters (D)= (B - C)
Average Rate of
Realisation (in `) (E)
Loss of units per meter (In
Mus) (F) = (D) X 19.06 X 12 months / 10,00,000
Loss of Revenue
(` in crore )(G) = (F) X
(E) / 10
2007-08 7,89,779 3,16,079 4,73,700 4.23 108.34 45.83
2008-09 4,73,700 1,20,962 3,52,738 5.05 80.68 40.74
2009-10 3,52,738 82,103 2,70,635 4.95 61.90 30.64
2010-11 2,70,635 47,991 2,22,644 5.34 50.92 27.19
Total 301.84 144.40
Source: Information furnished by DGVCL
2 Paschim Gujarat Vij Company Limited
Year (A) Opening Balance of
Old Convention
al meters (B)
Replacement during the
year with Static/
Quality meters
(C )
Closing Balance of
Old Convention
al meters (D)= (B - C)
Average Rate of
Realisation (in `) (E)
Loss of units per meter (In
Mus) (F) = (D) X 19.06 X 12 months / 10,00,000
Loss of Revenue
(` in crore )(G) = (F) X
(E) / 10
2007-08 14,23,297 2,13,822 12,09,475 3.59 276.63 99.31
2008-09 12,09,475 2,66,969 9,42,506 4.30 215.57 92.70
2009-10 9,42,506 2,37,137 7,05,369 4.13 161.33 66.63
2010-11 7,05,369 1,40,901 5,64,468 4.55 129.11 58.75
Total 782.64 317.39
Source: Information furnished by PGVCL
Annexure 8
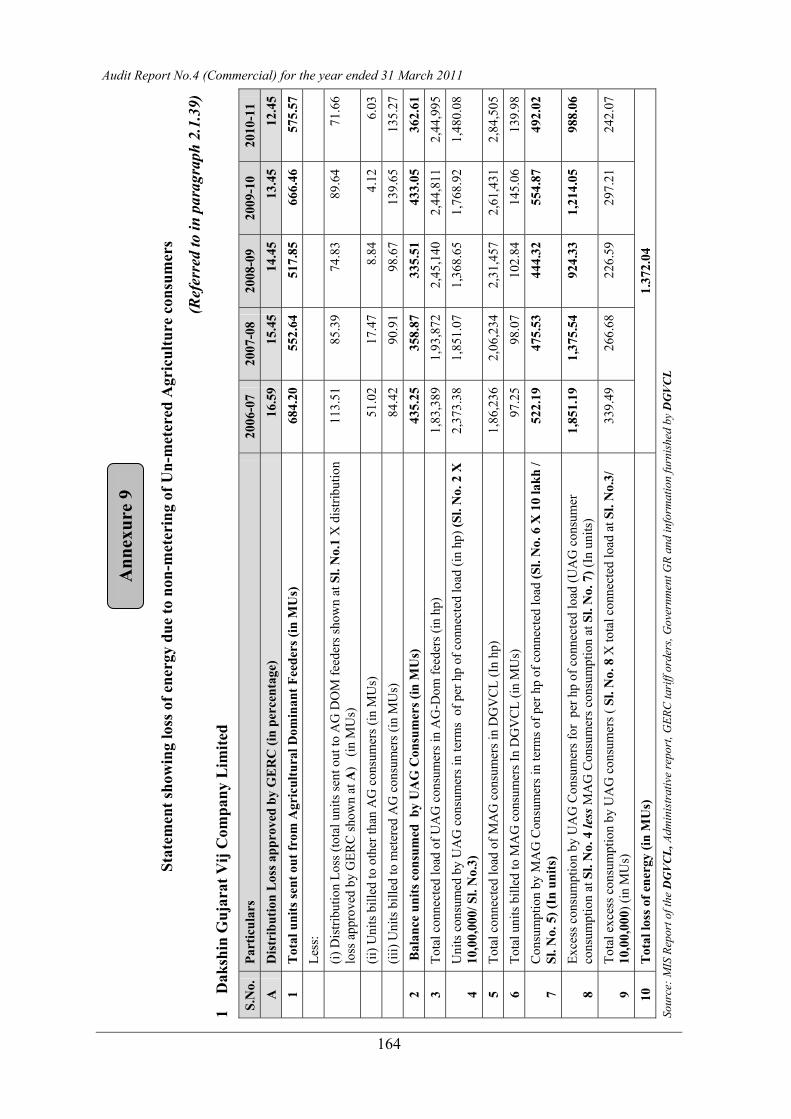
164
Stat
emen
t sho
win
g lo
ss o
f ene
rgy
due
to n
on-m
eter
ing
of U
n-m
eter
ed A
gric
ultu
re c
onsu
mer
s
(Ref
erre
d to
in p
arag
raph
2.1
.39)
1
Dak
shin
Guj
arat
Vij
Com
pany
Lim
ited
S.N
o.
Part
icul
ars
2006
-07
2007
-08
2008
-09
2009
-10
2010
-11
A
Dis
trib
utio
n L
oss a
ppro
ved
by G
ER
C (i
n pe
rcen
tage
) 16
.59
15.4
5 14
.45
13.4
5 12
.45
1 T
otal
uni
ts se
nt o
ut fr
om A
gric
ultu
ral D
omin
ant F
eede
rs (i
n M
Us)
68
4.20
55
2.64
51
7.85
66
6.46
57
5.57
Less
:
(i)
Dis
tribu
tion
Loss
(tot
al u
nits
sent
out
to A
G D
OM
feed
ers s
how
n at
Sl.
No.
1 X
dis
tribu
tion
loss
app
rove
d by
GER
C sh
own
at A
) (i
n M
Us)
11
3.51
85
.39
74.8
3 89
.64
71.6
6
(ii
) Uni
ts b
illed
to o
ther
than
AG
con
sum
ers (
in M
Us)
51
.02
17.4
7 8.
84
4.12
6.
03
(ii
i) U
nits
bill
ed to
met
ered
AG
con
sum
ers (
in M
Us)
84
.42
90.9
1 98
.67
139.
65
135.
27
2 B
alan
ce u
nits
con
sum
ed b
y U
AG
Con
sum
ers (
in M
Us)
43
5.25
35
8.87
33
5.51
43
3.05
36
2.61
3
Tota
l con
nect
ed lo
ad o
f UA
G c
onsu
mer
s in
AG
-Dom
feed
ers (
in h
p)
1,83
,389
1,
93,8
72
2,45
,140
2,
44,8
11
2,44
,995
4 U
nits
con
sum
ed b
y U
AG
con
sum
ers i
n te
rms
of p
er h
p of
con
nect
ed lo
ad (i
n hp
) (Sl
. No.
2 X
10
,00,
000/
Sl.
No.
3)
2,37
3.38
1,
851.
07
1,36
8.65
1,
768.
92
1,48
0.08
5 To
tal c
onne
cted
load
of M
AG
con
sum
ers i
n D
GV
CL
(In
hp)
1,86
,236
2,
06,2
34
2,31
,457
2,
61,4
31
2,84
,505
6
Tota
l uni
ts b
illed
to M
AG
con
sum
ers I
n D
GV
CL
(in M
Us)
97
.25
98.0
7 10
2.84
14
5.06
13
9.98
7 C
onsu
mpt
ion
by M
AG
Con
sum
ers i
n te
rms o
f per
hp
of c
onne
cted
load
(Sl.
No.
6 X
10
lakh
/ Sl
. No.
5) (
In u
nits
) 52
2.19
47
5.53
44
4.32
55
4.87
49
2.02
8 Ex
cess
con
sum
ptio
n by
UA
G C
onsu
mer
s for
per
hp
of c
onne
cted
load
(UA
G c
onsu
mer
co
nsum
ptio
n at
Sl.
No.
4 le
ss M
AG
Con
sum
ers c
onsu
mpt
ion
at S
l. N
o. 7
) (In
uni
ts)
1,85
1.19
1,
375.
54
924.
33
1,21
4.05
98
8.06
9 To
tal e
xces
s con
sum
ptio
n by
UA
G c
onsu
mer
s ( S
l. N
o. 8
X to
tal c
onne
cted
load
at S
l. N
o.3/
10
,00,
000)
(in
MU
s)
339.
49
266.
68
226.
59
297.
21
242.
07
10
Tot
al lo
ss o
f ene
rgy
(in M
Us)
1.
372.
04
Sour
ce: M
IS R
epor
t of t
he D
GV
CL,
Adm
inis
trat
ive
repo
rt, G
ERC
tari
ff or
ders
, Gov
ernm
ent G
R an
d in
form
atio
n fu
rnis
hed
by D
GV
CL
Ann
exur
e 9
Audit Report No.4 (Commercial) for the year ended 31 March 2011
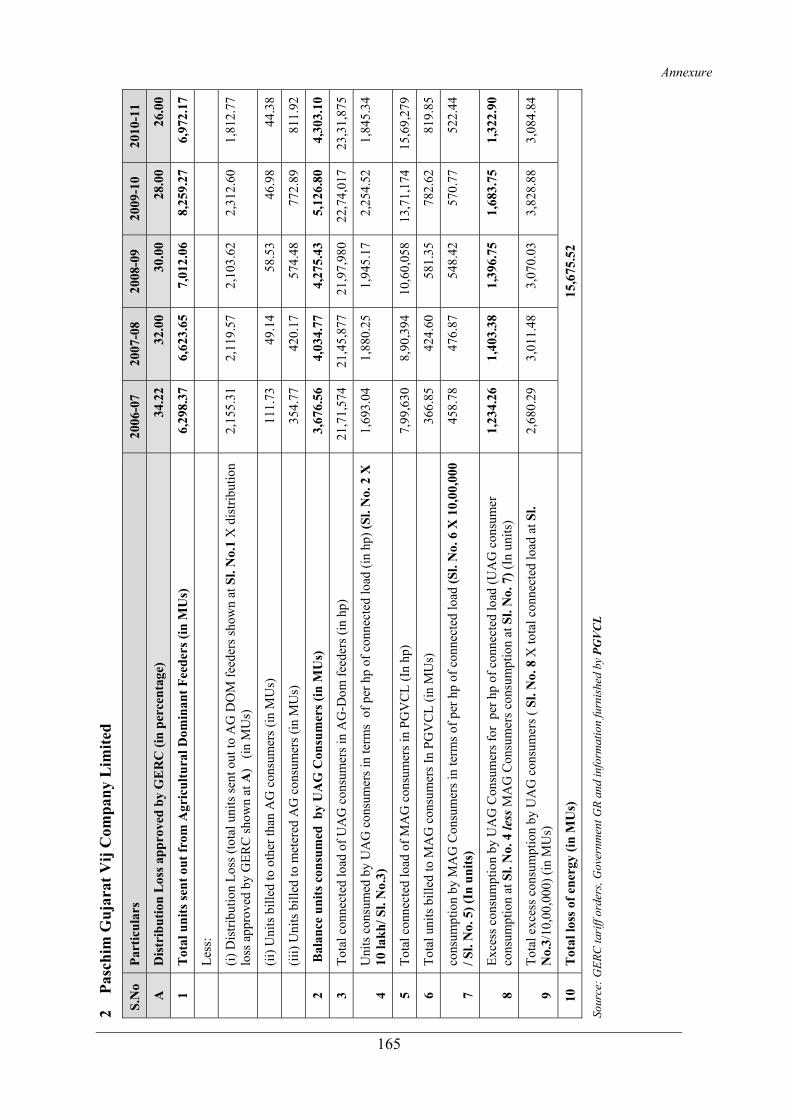
165
2
Pasc
him
Guj
arat
Vij
Com
pany
Lim
ited
S.N
o Pa
rtic
ular
s 20
06-0
7 20
07-0
8 20
08-0
9 20
09-1
0 20
10-1
1
A
Dis
trib
utio
n L
oss a
ppro
ved
by G
ER
C (i
n pe
rcen
tage
) 34
.22
32.0
0 30
.00
28.0
0 26
.00
1 T
otal
uni
ts se
nt o
ut fr
om A
gric
ultu
ral D
omin
ant F
eede
rs (i
n M
Us)
6,
298.
37
6,62
3.65
7,
012.
06
8,25
9.27
6,
972.
17
Le
ss:
(i)
Dis
tribu
tion
Loss
(tot
al u
nits
sent
out
to A
G D
OM
feed
ers s
how
n at
Sl.
No.
1 X
dis
tribu
tion
loss
app
rove
d by
GER
C sh
own
at A
) (i
n M
Us)
2,
155.
31
2,11
9.57
2,
103.
62
2,31
2.60
1,
812.
77
(ii
) Uni
ts b
illed
to o
ther
than
AG
con
sum
ers (
in M
Us)
11
1.73
49
.14
58.5
3 46
.98
44.3
8
(ii
i) U
nits
bill
ed to
met
ered
AG
con
sum
ers (
in M
Us)
35
4.77
42
0.17
57
4.48
77
2.89
81
1.92
2 B
alan
ce u
nits
con
sum
ed b
y U
AG
Con
sum
ers (
in M
Us)
3,
676.
56
4,03
4.77
4,
275.
43
5,12
6.80
4,
303.
10
3 To
tal c
onne
cted
load
of U
AG
con
sum
ers i
n A
G-D
om fe
eder
s (in
hp)
21
,71,
574
21,4
5,87
7 21
,97,
980
22,7
4,01
7 23
,31,
875
4 U
nits
con
sum
ed b
y U
AG
con
sum
ers i
n te
rms
of p
er h
p of
con
nect
ed lo
ad (i
n hp
) (Sl
. No.
2 X
10
lakh
/ Sl.
No.
3)
1,69
3.04
1,
880.
25
1,94
5.17
2,
254.
52
1,84
5.34
5 To
tal c
onne
cted
load
of M
AG
con
sum
ers i
n PG
VC
L (I
n hp
) 7,
99,6
30
8,90
,394
10
,60,
058
13,7
1,17
4 15
,69,
279
6 To
tal u
nits
bill
ed to
MA
G c
onsu
mer
s In
PGV
CL
(in M
Us)
36
6.85
42
4.60
58
1.35
78
2.62
81
9.85
7 co
nsum
ptio
n by
MA
G C
onsu
mer
s in
term
s of p
er h
p of
con
nect
ed lo
ad (S
l. N
o. 6
X 1
0,00
,000
/ S
l. N
o. 5
) (In
uni
ts)
458.
78
476.
87
548.
42
570.
77
522.
44
8 Ex
cess
con
sum
ptio
n by
UA
G C
onsu
mer
s for
per
hp
of c
onne
cted
load
(UA
G c
onsu
mer
co
nsum
ptio
n at
Sl.
No.
4 le
ss M
AG
Con
sum
ers c
onsu
mpt
ion
at S
l. N
o. 7
) (In
uni
ts)
1,23
4.26
1,
403.
38
1,39
6.75
1,
683.
75
1,32
2.90
9 To
tal e
xces
s con
sum
ptio
n by
UA
G c
onsu
mer
s ( S
l. N
o. 8
X to
tal c
onne
cted
load
at S
l. N
o.3/
10,0
0,00
0) (i
n M
Us)
2,
680.
29
3,01
1.48
3,
070.
03
3,82
8.88
3,
084.
84
10
Tot
al lo
ss o
f ene
rgy
(in M
Us)
15
,675
.52
Sour
ce: G
ERC
tari
ff or
ders
, Gov
ernm
ent G
R an
d in
form
atio
n fu
rnis
hed
by P
GV
CL
Annexure

Audit Report No. 4 (Commercial) for the year ended 31 March 2011
166
Statement showing targets and actual performance of checking, theft cases detected, assessment made and amount realised for the five years ending 31 March 2011
(Referred to in paragraph 2.1.42)
Dakshin Gujarat Vij Company Limited
No. of checking Theft cases Assessed amount (` in lakh)
Amount Realised (` in lakh)
Year
Targets Actual Actual Targets Actual Actual
2006-07 4,50,484 2,50,490 12,895 -- 2,160.09 1,076.23
2007-08 4,50,484 2,36,776 9,305 2,900 2,252.59 627.08
2008-09 4,50,484 2,15,596 10,194 3,000 2,750.77 1,316.18
2009-10 6,79,120 1,86,950 9,592 3,000 2,533.31 1,304.71
2010-11 2,03,340 10,449 3,000 2,627.87 746.00
Source: Information furnished by DGVCL
Paschim Gujarat Vij Company Limited
No. of checking Theft cases Assessed amount (` in lakh)
Amount Realised (` in lakh)
Year
Targets Actual Actual Targets Actual Actual
2006-07 7,55,532 52,463 10,750 5,599.72 2,388.17
2007-08 7,64,098 47,027 8,375 4,113.33 2,126.87
2008-09 9,05,859 53,460 6,325 4,719.47 2,310.41
2009-10
Not available
11,15,792 64,832 6,325 4,265.86 2,117.70
2010-11 8,06,637 49,134 7,800 4,245.00 2,530.00
Source: Information furnished by PGVCL
Annexure 10

Annexure
167
Statement showing cross subsidies in major sectors of consumers in DGVCL and
PGVCL as approved in tariff orders by GERC for 2006-11
(Referred to in paragraph 2.1.68) (ACOS and Tariff in paise)
Categories 2006-07 2007-08 2008-09 2009-10 2010-11
Avg. Tariff
per unit
Cross subsidy
(plus and
minus) in
percent-age
Avg. Tariff
per unit
Cross subsidy
(plus and
minus) in
percent-age
Avg. Tariff
per unit
Cross subsidy
(plus and
minus) in
percent-age
Avg. Tariff
per unit
Cross subsidy
(plus and
minus) in
percent-age
Avg. Tariff
per unit
Cross subsidy
(plus and
minus) in
percent-age
Dakshin Gujarat Vij Company Limited
ACOS of DGVCL
422 417 430 435 456
Residential 309 26.78 314 24.70 312 27.44 312 28.28 327 28.29
Commercial 488 -15.64 478 -14.63 479 -11.40 487 -11.95 488 -7.02
Industrial LT
408 3.32 419 -0.48 413 3.95 440 -1.15 453 0.66
Public Lighting
338 19.91 341 18.23 342 20.47 340 21.84 347 23.90
Agricultural 99 76.54 126 69.78 105 75.58 192 55.86 102 77.63
Public water works
350 17.06 290 30.46 274 36.28 295 32.18 291 36.18
Industrial HT
457 -8.29 485 -16.31 485 -12.79 497 -14.25 491 -7.68
Railway Traction
482 -14.22 517 -23.98 517 -20.23 518 -19.08 517 -13.38
Paschim Gujarat Vij Company Limited
ACOS of PGVCL
352 366 375 409 397
Residential 307 12.78 308 15.85 306 18.40 311 23.96 313 21.16
Commercial 473 -34.38 486 -32.79 484 -29.07 490 -19.80 487 -22.67
Industrial LT
414 -17.61 437 -19.40 439 -17.07 462 -12.96 468 -17.88
Public lighting
332 5.68 340 7.10 342 8.80 344 15.89 343 13.60
Agricultural 101 71.31 111 69.67 103 72.53 108 73.59 107 73.05
Public water works
281 20.17 289 21.04 276 26.40 276 32.52 275 30.73
Industrial HT
459 -30.40 454 -24.04 465 -24.00 503 -22.98 500 -25.94
Source: Tariff orders issued by GERC
Annexure 11

Stat
emen
t sho
win
g th
e tim
e ta
ken
for
pre
drill
ing
Env
iron
men
t Im
pact
Stu
dies
(Ref
erre
d to
in p
arag
raph
2.2
.19)
D
ate
of C
ompl
etio
n of
M
onth
s tak
en fo
r C
ompl
etio
n of
Sl
. N
o.
NE
LP
roun
d an
d ph
ase
year
s B
lock
Nam
e D
ate
of
awar
d Pr
e se
ism
ic
EIS
Pre
drill
ing
EIS
s
Dat
e of
E
nvir
onm
ent
clea
ranc
e Pr
e-se
ism
ic
EIS
from
da
te o
f aw
ard
Pre-
drill
ing
EIS
from
da
te o
f aw
ard
Mon
ths t
aken
fr
om d
ate
of
awar
d to
ob
tain
ing
Env
iron
men
t cl
eara
nce
End
dat
e of
da
ta
acqu
isiti
on
or
proc
essi
ng
on b
oard
1 2
3 4
5 6
7 8
9 10
11
1
Pre
NEL
P 1.
5+3+
2.5
Yea
rs
CB
-ON
/2
(Tar
apur
) A
pril
2000
Mar
. 200
7 Fe
b. 2
009
7 A
ug. 2
007
16 Ju
ne 2
009
83
10
6 88
11
0 A
pr. 2
006
Mar
.200
6 M
ay 2
007
2 Pr
e N
ELP
Una
wa
Una
wa
bloc
k Fe
brua
ry.
2001
N
ot
App
licab
le
Feb.
200
8 O
ct. 2
008
Not
A
pplic
able
84
92
20
07
3 N
ELP
II,
2.5+
1.5+
1 Y
ears
C
B-O
NN
-200
0/1
(AM
D)
July
200
1 Se
pt. 2
002
Sept
. 200
2 M
ar. 2
007
---
3 A
ug. 2
007
14
14
68
---
73
Jan.
200
3 Fe
b 20
06
4 N
ELP
IV
2.5+
2+1.
5 Y
ears
C
B-O
NN
-200
2/3
(San
and
Miro
li)
Febr
uary
20
04
Dec
. 200
4 Ja
n. 2
006
Dec
. 200
7 --
- 7
Feb.
200
8 10
23
46
--
- 48
N
ov. 2
005
Feb.
200
6 5
NEL
P V
, 3+3
+1
Yea
rs
CB
-ON
N-2
003/
2 (A
nkle
shw
ar)
Sept
embe
r 20
05
M
ar. 2
007
2 Se
pt. 2
008
18
36
D
ec. 2
006
6 N
ELP
VI,
4+3
Yea
rs
KG
-ON
N-2
004/
2 (K
G O
nsho
re)
Mar
ch 2
007
Nov
. 200
8 M
ay 2
009
11 F
eb. 2
010
20
26
35
Mar
. 200
9
7 N
ELP
VI,
4+3
Yea
rs
MB
-OSN
-200
4/1
(Mum
bai O
ffsh
ore)
Ju
ne 2
007
Nov
. 200
8 O
ct. 2
010
EC is
aw
aite
d 17
40
EC
is a
wai
ted
Jan.
201
0
8 N
ELP
VII
, 4+3
Y
ears
R
J-O
NN
-200
5/3
(Raj
asth
an)
Dec
embe
r 20
08
Oct
. 201
0 Y
et to
be
done
22
Yet
to b
e do
ne
Fe
b. 2
011
Ann
exur
e 12
168
Audit Report No.4 (Commercial) for the year ended 31 March 2011

Annexure
169
Status of testing of wells in Blocks
Ankleshwar (Referred to in paragraph 2.2.31)
Sl. No. Well Name Testing of well Days Upto 31 March 2011
1 Ank-7 22 June 2008 1,012
2 Ank-10 27 November 2008 854
3 Ank-34 12 September 2009 565
4 Ank-37 12 May 2010 323
5 Ank-38 17 October 2009 530
6 Ank-21A1 10 November 2009 506
7 Ank-33 14 April 2010 351
8 Ank-39 16 October 2010 166
Tarapur 9 TS-4 15 December 2007 1,202
10 TS-5 No testing carried out No testing carried out
11 TS-1 18 September 2009 559
12 TS-7 20 June 2008 1014
13 TK-1 10 April 2009 720
14 P-2 7 March 2009 754
15 P-3 30 January 2008 1,156
16 P-4 12 February 2009 777
Ahmedabad 17 PK-6 No testing carried out No testing carried out
18 SE-1A 2 November 2006 1,610
19 GSAH-1 8 December 2009 478
20 GSAH-3 13 December 2009 473
21 GSAH-4 14 January 2010 441
22 GSAH-2 14 August 2010 229
Sanand-Miroli 23 M-3 28 October 2008 884
24 M-7 31 January 2009 789
25 M-5 6 January 2009 814
26 M-8 29 May 2009 671
Annexure 13

Audit Report No.4 (Commercial) for the year ended 31 March 2011
170
Statement showing erroneous calculation of amount under One Time Settlement scheme by Gujarat State Financial Corporation
(Referred to at paragraph no. 3.15)
I. Khyati Multimedia Entertainment Limited, Mehsana
Account No. Original loan amount
(` in lakh)
Period of sanction of loan
Amount computed as
per OTS Criteria I (` in lakh)
Amount as per Criteria II (` in lakh)
OTS amount as per norms
(i.e. Col. no. 4 or 5 whichever
is higher (` in lakh)
1 2 3 4 5 6
C/K1/049/00 &71 150.78 June 1997 (-) 15.05 98.00 98.00
C/K1/049/01 88.24 November 1998 213.72 57.36 213.72
Total 198.67 155.36 311.72
Note :- OTS amount determined by the Corporation ` 198.67 lakh (Total of Col. no.4) (-) OTS amount as per norms should be ` 311.72 lakh (Total of Col. no.6) = Short recovery of dues ` 113.05 lakh.
II. Principal Pharmaceuticals and Chemicals Limited, Bharuch
Account no. Original loan amount
(` in lakh)
Period of sanction of loan
Amount computed as
per OTS Criteria I (` in lakh)
Amount as per Criteria II (` in lakh)
OTS amount as per norms
(i.e. Col. no. 4 or 5 whichever
is higher (` in lakh)
1 2 3 4 5 6
E3/P/056/00 35.86 April 1997 (-) 5.46 23.31 23.31
E3/P/056/01 42.58 February 1999 67.29 27.68 67.29
Total 61.83 50.99 90.60
Note :- OTS amount determined by the Corporation ` 61.83 lakh (Total of Col. no.4) (-) OTS amount as per norms should be ` 90.60 lakh (Total of Col. no.6) = Short recovery of dues ` 28.77 lakh. Total short recovery of dues ` 113.05 lakh + ` 28.77 lakh = ` 141.82 lakh.
Annexure 14
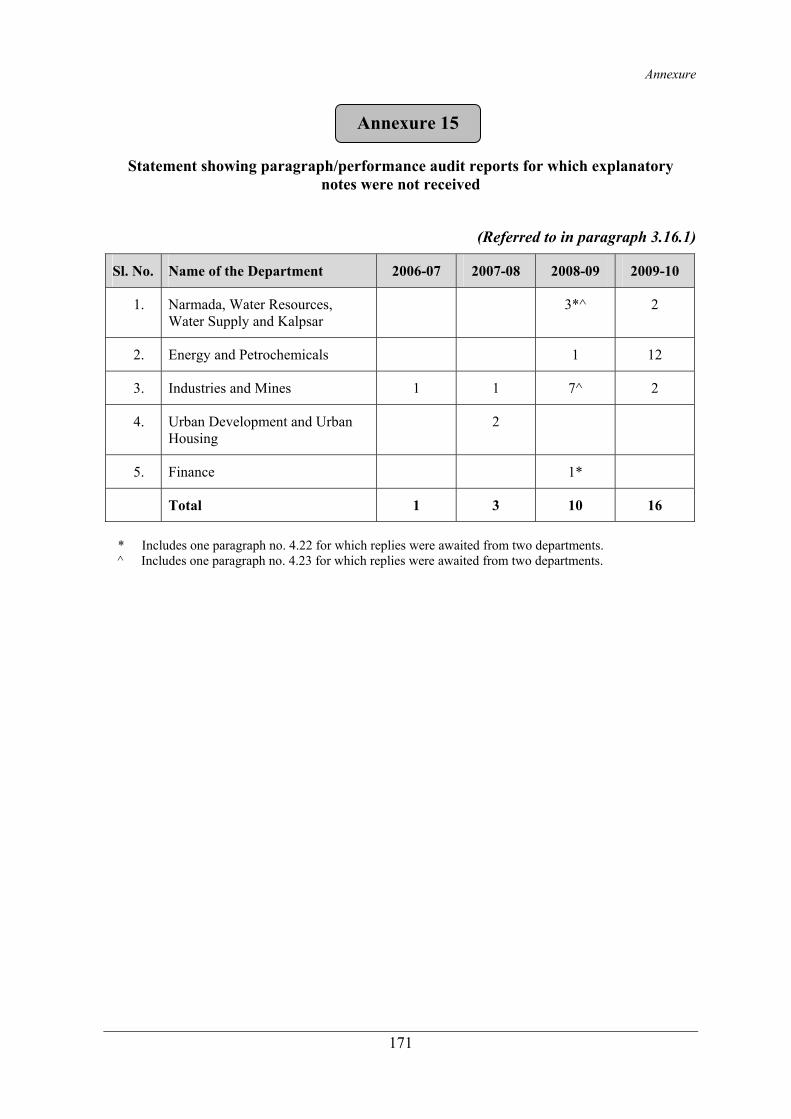
Annexure
171
Statement showing paragraph/performance audit reports for which explanatory notes were not received
(Referred to in paragraph 3.16.1)
Sl. No. Name of the Department 2006-07 2007-08 2008-09 2009-10
1. Narmada, Water Resources, Water Supply and Kalpsar
3*^ 2
2. Energy and Petrochemicals 1 12
3. Industries and Mines 1 1 7^ 2
4. Urban Development and Urban Housing
2
5. Finance 1*
Total 1 3 10 16
* Includes one paragraph no. 4.22 for which replies were awaited from two departments. ^ Includes one paragraph no. 4.23 for which replies were awaited from two departments.
Annexure 15
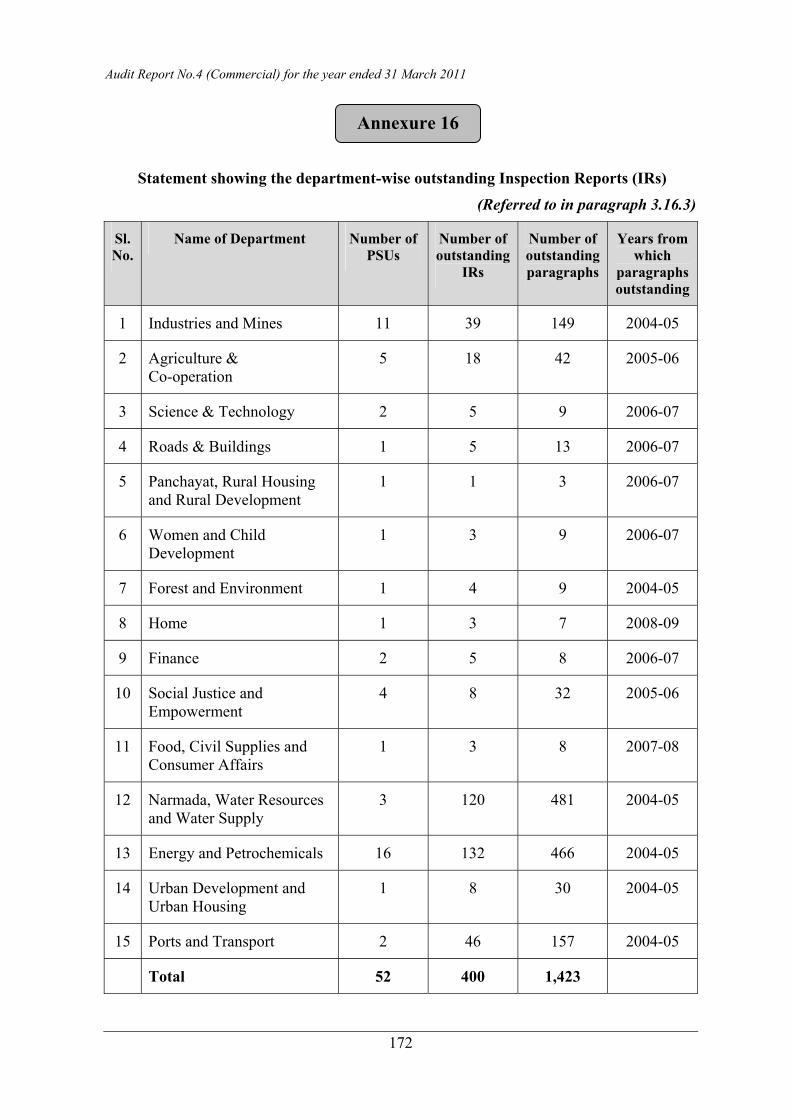
Audit Report No.4 (Commercial) for the year ended 31 March 2011
172
Statement showing the department-wise outstanding Inspection Reports (IRs)
(Referred to in paragraph 3.16.3)
Sl. No.
Name of Department Number of PSUs
Number of outstanding
IRs
Number of outstanding paragraphs
Years from which
paragraphs outstanding
1 Industries and Mines 11 39 149 2004-05
2 Agriculture & Co-operation
5 18 42 2005-06
3 Science & Technology 2 5 9 2006-07
4 Roads & Buildings 1 5 13 2006-07
5 Panchayat, Rural Housing and Rural Development
1 1 3 2006-07
6 Women and Child Development
1 3 9 2006-07
7 Forest and Environment 1 4 9 2004-05
8 Home 1 3 7 2008-09
9 Finance 2 5 8 2006-07
10 Social Justice and Empowerment
4 8 32 2005-06
11 Food, Civil Supplies and Consumer Affairs
1 3 8 2007-08
12 Narmada, Water Resources and Water Supply
3 120 481 2004-05
13 Energy and Petrochemicals 16 132 466 2004-05
14 Urban Development and Urban Housing
1 8 30 2004-05
15 Ports and Transport 2 46 157 2004-05
Total 52 400 1,423
Annexure 16

Annexure
173
Statement showing the department-wise draft paragraphs/performance audit reports reply to which are awaited as on 30 November 2011
(Referred to in paragraph 3.16.3)
Sl. No.
Name of the Department
Number of draft
paragraphs
Number of draft
performance audit reports
Period of issue
1. Energy and Petrochemicals
2 1 June/July/August 2011
2. Industries and Mines 2 -- May/June 2011
3. Ports and Transport 1 -- July 2011
Annexure 17

Printed at Government Photo Litho Press, Ahmedabad