Government of Kenya - World Food ProgrammeKilifi, Lamu, Taita Taveta and Kieni part of Nyeri county,...
50
1 Government of Kenya THE 2014 SHORT RAINS SEASON ASSESSMENT REPORT Kenya Food Security Steering Group (KFSSG) Collaborative report of the Kenya Food Security Steering Group: Ministries of Devolution and Planning, Agriculture, Livestock and Fisheries, Environment, Water and Natural Resources, Health, and Education, Science and Technology, National Drought Management Authority, WFP/VAM, FEWS NET, FAO, UNICEF, World Vision, ACF; with financial support from the Government of Kenya, FAO, UNICEF, USAID and WFP. FEBRUARY 2015
Transcript of Government of Kenya - World Food ProgrammeKilifi, Lamu, Taita Taveta and Kieni part of Nyeri county,...

1
Government of Kenya
THE 2014 SHORT RAINS SEASON ASSESSMENT REPORT
Kenya Food Security Steering Group (KFSSG)
Collaborative report of the Kenya Food Security Steering Group: Ministries of Devolution and
Planning, Agriculture, Livestock and Fisheries, Environment, Water and Natural Resources,
Health, and Education, Science and Technology, National Drought Management Authority,
WFP/VAM, FEWS NET, FAO, UNICEF, World Vision, ACF; with financial support from the
Government of Kenya, FAO, UNICEF, USAID and WFP.
FEBRUARY 2015

2
Table of Contents
Executive summary ......................................................................................................................... 3
1.0 Introduction ............................................................................................................................. 12
1.1 Assessment Coverage and Objectives ................................................................................. 12
1.2 Assessment Approach ......................................................................................................... 13
2.0 Food and Nutrition Security Analysis by Livelihood Cluster ................................................ 15
2.1 The Pastoral Northwest Livelihood Cluster ........................................................................ 15
2.2 The Pastoral Northeast Livelihood Cluster ......................................................................... 20
2.3 The Agro Pastoral Livelihood Cluster ................................................................................ 26
2.4 The Southeastern Marginal Agriculture Livelihood Cluster ............................................... 32
2.5 The Coastal Marginal Agricultural Livelihood Cluster ...................................................... 38
3.0 Food Security Prognosis ......................................................................................................... 44
3.1 Prognosis Assumptions ....................................................................................................... 44
3.2 Food and Nutrition Security through August 2015 ............................................................. 44
4.0 Proposed Sectoral Interventions ............................................................................................. 46
4.1 Agriculture Sector: Priority Interventions March 2015 – August 2015 .............................. 46
4.2 Livestock Sector: Priority interventions March 2015 – August 2015 ................................. 46
4.3 Water Sector: Priority interventions March 2015 – August 2015 ....................................... 47
4.4 Health and Nutrition Sector: Priority interventions, March 2015 – August 2015 .............. 47
4.5 Education: Priority interventions, March 2015 – August 2015 .......................................... 48
4.6 Food Assistance Sector: Priority interventions, March 2015 – August 2015 ..................... 49
Annex 1: Food Security Phase Classification Seasonal Trends, 2011 - 2014 .............................. 50

3
Executive summary
Summary of key findings
Below average performance of the 2014 short rains resulted hindered improvements in
food security in the pastoral, agro pastoral and marginal agricultural areas
The 2014 short rains assessment has established that an estimated 1.6 million people are acutely
food insecure and will require immediate food assistance over the next six months (March –
August 2015). This is a seven percent increase from the August 2014 food insecure population
(Figure 1.1). While the short rains were generally below average across most of the arid and
semi-arid (ASAL) counties, cumulative amounts varied. As a result, food security improved n
some areas while also worsening in others. The counties of Turkana, Samburu, Mandera, West
Pokot and Baringo recorded substantial improvements in food security conditions, with the food
insecure population reducing. These areas were characterized by extension of the 2014 long rains
that continued through September, beyond their normal cessation in June. Marsabit, Wajir, Isiolo
and Garissa on the other hand experienced increased food insecure cases. The below average
2014 short rains resulted in below normal recovery of rangeland resources in the pastoral areas
and agro pastoral areas, thereby affecting livestock productivity, household income and
consequently households food consumption. Most water points in the pastoral areas are depleted
and livestock return trekking distances have increased 20 – 50 percent compared to the normal,
and are expected to increase further as the short lean season progresses. The above average land
surface temperatures that have prevailed from January have exacerbated the rate of depletion of
rangeland resources. Seasonal livestock migration occurred earlier than normal, while in some
instances, livestock remained in the dry season grazing areas, further depriving households the
much needed livestock products. Though livestock prices seasonally declined between December
and January 2015. Terms of trade were still favorable across most of the pastoral markets. In the
southeastern marginal agricultural areas, most of the maize crop did not reach maturity, wilting
at the tussling stage, due to moisture stress. Short rains crop harvest is expected to be up to 70
percent below the long term averages. Most households are therefore expected to have higher
than normal dependence on the markets for food access.
-
500,000
1,000,000
1,500,000
2,000,000
2,500,000
3,000,000
3,500,000
4,000,000
Mar
05
- A
ug
05
Sep
05
- F
eb
06
Mar
06
- A
ug
06
Sep
06
- F
eb
07
Mar
07
- S
ep
07
Oct
07
- F
eb
08
Mar
08
- S
ep
08
Oct
08
- M
ar 0
9
Mar
09
- A
ug
09
Sep
09
- F
eb
10
Mar
10
- A
ug
10
Sep
10
- F
eb
11
Mar
11
- A
ug
11
Sep
11
- F
eb
12
Mar
12
- A
ug
12
Sep
t 1
2 -
Fe
b2
01
3
Mar
13
- A
ug
13
Sep
13
- F
eb
14
Mar
14
- A
ug
14
Sep
14
- F
eb
15
Mar
15
- A
ug
15
Nu
mb
er o
f p
eop
le
Figure 1.1: Trend of the food insecure population

4
The current areas of concern include parts of Wajir, Marsabit, Isiolo and Garissa, where localised
households have moved into Crisis phase of the Integrated Food Security Phase Classification
(IPC Phase 3). Being s short lean season, food security conditions are expected to improve in less
than two months’ time, upon resumption of the 2015 long rains in mid-March.
Scope of the 2014 Short rains assessment
In Kenya most of the crop growing areas and livestock rearing areas are predominantly rainfall
dependent. There are two major seasons across the country, namely the Short Rains (October –
December) and the Long Rains (March – May). Some areas are majorly dependent on the long
rains for both crop and livestock production while other depend on the short rains. Kenya can be
divided into two broad zones namely the Arid and Semi-Arid Lands (ASAL) which covers about
80 percent of the countries’ landmass while the remaining 20 percent comprises the Medium- to
High- Rainfall cropping and livestock zones.
The 2015 Short rains assessment was conducted from 26th January 2015 to 6th February 2015 in
23 Arid and Semi-arid (ASAL) counties that are vulnerable to drought hazard. The counties
covered during this assessment include; Turkana, Samburu, Marsabit, West Pokot, Mandera,
Wajir, Isiolo, Tana River, Garissa, Kitui, Makueni, Narok, Kajiado, Baringo, Laikipia, Kwale,
Kilifi, Lamu, Taita Taveta and Kieni part of Nyeri county, Meru North part in Meru County,
Mbeere region in Embu, and Tharaka part of Tharaka Nithi county.
The objective of the assessment was to evaluate the performance of the 2014 short rains season
(October – December rains) and its impacts on various key sectors including water quality and
access, crop and livestock production, health and nutrition, markets and trade and education .
The assessment further sought to evaluate the manner and extent to which shocks such as
conflicts, floods, crop diseases and high food prices, together with ongoing food and non-food
interventions, were affecting food availability and household food access and gave a prognosis
for food security situation in the next six months and recommendations for the current short term
response required. Other contributing factors that were affecting food security including
conflicts, markets operations, livestock and crop diseases were analysed and a food security
prognosis done to provide recommendations for possible response options. The findings are
summarized in the sections below.
Categories of the food insecure population
Summary of food security phase classification
From the 2015 short rains assessment, an estimated 1.6 million are acutely food insecure. The
main factors that exacerbated food insecurity include the below normal short rains performance,
cumulative effects of the previous poor rains seasons, elevated food prices, crop pests and
diseases, livestock diseases, and conflict incidences especially in the pastoral areas. The food
insecure populations are mainly in the northwest and northeast pastoral clusters, and the
southeast marginal agricultural areas. To mitigate against the food insecure conditions, both the
national and county governments together with development partners are implementing an array
of activities which include, activation of drought contingency funds for all the affected ASAL
counties, Hunger Safety Net Programme which manages cash transfer programmes in Turkana,
Mandera, Marsabit and Wajir with about 100,000 beneficiary households. Government of Kenya

5
(GoK) partnering with World Food Programme (WFP) is also implementing food for assets/cash
for assets programme in 13 ASAL counties with about 750,000 beneficiaries. Others include
general relief food distribution, provision of school meals under various programs such as
Expanded School Meal Program, and Supplementary Feeding Programmes.
Population in Crisis (IPC Phase 3)
The areas under Crisis
(IPC Phase 3) currently
are Wajir (parts of Eldas,
Griftu, Sabule, west of
Tarbaj), Garissa (parts of
Dadaab, Ladgera,
Balambala), Isiolo (parts
of Merti and Sericho),
Marsabit (parts of
Maikona, Laisamis and
Moyale). Households in
Crisis are those who are
marginally able to meet
minimum food needs
only with accelerated
depletion of livelihood
assets that will lead to
food consumption gaps. For these areas, the 2014 short rains were cumulatively 50 percent and
below, compared to the normal (Figure 1.2). The situation was further compounded by the
cumulative effects of the poor performance of the previous two seasons. The state of rangeland
conditions (pasture, browse and water) in these areas is mainly poor with some areas having
depleted resources. As a result, livestock trekking distances to water sources have increased from
the normal 5 – 10
kilometres to 20 – 40
kilometres. Consequently,
livestock health and body
conditions have been
affected, with most
livestock having poor to
emaciated body conditions.
Unusual migrations of
livestock was reported in
these areas, with close to 90
percent of livestock having
migrated out of these areas.
Figure 1.3 illustrates the on-
going livestock migration
routes, depicting a general
haphazardness in migration
patterns. Due to the

6
migration levels witnessed, household access to milk and livestock products has declined
markedly with milk availability declining by up to 80 percent compared to the normal, less than
a litre compared to 3 – 4 litres. Milk prices have increased by 70 – 120 percent between
November and January 2015, resulting in reduced consumption of milk at the households level.
Though the terms of trade are still favourable in these areas, the very poor households who are in
Crisis are not benefiting much due to low livestock holdings. The food consumption gaps being
experienced have resulted in increased acute malnutrition cases for children under five years.
The nutrition situation in the crisis areas, according to the nutrition surveys conducted in January
2015, showed critical levels. Nutrition surveys conducted in Wajir indicate a ‘very critical’
nutrition situation with GAM rates of 22 percent and SAM of 7.1 percent, implying 1 out of 4
children are malnourished, and 1 in 10 children severely malnourished. In Wajir East and South
the situation is ‘critical’ with GAM and SAM rates of 17.6 and 3.7 percent respectively. In
Northern Garissa a deterioration has been noted, with surveys results indicating GAM and SAM
of 15.2 and 2.7 percent respectively indicating a critical nutrition situation. In Isiolo, the nutrition
situation is Serious, GAM rates remain stable compared to the same period last year, however
high number of cases were noted in Merti and Sericho areas, bordering Wajir West and Garissa
north.
Population in Stressed (IPC Phase 2)
Households in the stressed (IPC Phase 2) are mainly in the southeastern (Kitui, Mbeere, Meru
North, Tharaka Nithi and parts of Makueni) and coastal marginal agricultural areas (Taita Taveta
and parts of Kilifi, Kwale), the agro pastoral areas (Laikipia, Baringo, West Pokot, Nyeri), and
parts of the northwest (Turkana, Marsabit, Samburu) and northeast (Isiolo, Garissa, Mandera,
Wajir, Tana River) pastoral areas. Households in stress are able to afford minimally adequate
food consumption but are unable to afford essential non food expenditures without engaging in
irreversible coping strategies. Majority of the pastoral household groups in the Stressed Phase
received about 80 – 140 percent of the normal rains, that resulted into 60 – 90 percent recharge
of water sources. Distances to water declined significantly and average less than 10 kilometres,
with the exception of parts of Turkana and Marsabit where trekking distances reach 15
kilometres. Currently, though watering distances have started increasing, they are still within
normal ranges, except for localized areas. Relatively less distances covered to water points
coupled with fair quantity and quality of pasture and browse were still able to support some
livestock productivity, with households still able to access 1 – 3 litres of milk per day, compared
to a normal of 4 – 6 litres per day. Foot and Mouth Disease outbreak has been reported in most
parts including Isiolo, Meru North, there was also outbreak of CCPP in Tseikuru and Nuu in
Kitui county but disease incidents remain normal in other areas. While nutrition levels have
remained fairly stable in areas classified in the Stressed Phase, localized areas in Turkana,
Marsabit, Isiolo, Samburu, Mandera, Garissa still had high malnutrition rates, and would require
close monitoring.
For the southeast (Kitui, Mbeere, Meru North, Tharaka Nithi and parts of Makueni) and parts of
the coastal marginal agricultural areas, the below normal performance of the short rains, which
were largely below 80 percent of the normal, resulted in substantial crop failures, estimated at up
to 70 percent below the long term averages. This is attributed to the fact that rainfall receded
during the critical stage of crop development, especially tussling for maize and, on resumption of
the rains, the crops were past recovery stage of growth. Pasture conditions are fair in all the

7
stressed areas, but expected to last for about one to two months as opposed to two to three
months normally. This is an indication that conditions are likely to deteriorate in the event that
the onset of the 2015 long rains delays. Milk production has reduced by about 50 percent and
prices have also increased by about 50 percent in these areas. Livestock prices remained within
the normal ranges while maize prices have remained fairly stable due to ample supplies in the
markets. Though nutrition status will continue deteriorating as food security conditions worsen,
it’s not expected to reach alarming stages, as continued supplementary nutrition programs will
prevent the worst outcomes from occurring.
Impacts of the 2014 Short Rains Season
The October to December 2014 short rains had a false
start in most of the southeast marginal agricultural
areas, and a late onset in pastoral areas, occurring
between third week of October to first week of
November, compared to the normal onset of second
week of October. In much of the northeast pastoral,
northwest pastoral areas of Samburu, Marsabit, and
parts of Turkana, and southeast marginal agricultural
areas, the rains were 25 – 80 percent of the normal
amounts (Figure 1.4). The northwest pastoral areas of
West Pokot, Baringo, Turkana and most parts of the
coastal marginal agricultural areas received 90 – 140
percent of the cumulative normal rains. Southern
pastoral areas of Narok and Kajiado received 80 –
110 percent of normal rains, with localized parts
having more than 110 percent, while others having
less than 75 percent of normal rains. Both spatial and
temporal distribution was poor and uneven, impacting
negatively on crop and livestock production.
Cessation across most counties occurred earlier than normal, between last dekad of November
and first dekad of December, as opposed to third dekad of December to first dekad of January.
National Maize Supply Situation and Prospects
According to the State Department of Agriculture, the national maize stocks stood at 1.56 million
metric tons (Table 1.1) by end of January. The stocks remained high following the concluded
harvesting of the long rains crop in the North Rift (Trans Nzoia, Uasin Gishu), Western
highlands (Kisii and Nyamira), and parts of central Rift (Nakuru, Laikipia). Additionally,
increased importation by the private sector players also boosted stock levels nationally. The Food
Security and Nutrition Working Group’s (FSNWG’s) East Africa Cross-Border Trade Bulletin
for January 2015 noted that 2014 maize imports from Tanzania and Uganda were 21 and 16
percent higher than 2013, respectively. Considering imports from across the border by the
private sector players and the expected 2014 short rains harvest between January and March, the
total available national stocks will stand at about 2 million metric tons by end of June. Taking
into account the monthly per capita consumption of 0.3 million metric tons, the available stocks
would last through June 2015, with a surplus of 0.03 million metric tons thereafter. Continued
importation of maize and early long rains harvested crop from the South Rift, would ensure

8
adequate availability of maize after June, hence no cause for alarm, at this point. Through June,
ample maize stocks will ensure prices remain fairly stable or increase gradually, largely
following the seasonal trends. According to the food security situation report (January 2015),
published by the State Department of Agriculture, stocks of other crops except wheat, are
adequate and would last through July 2015. Beans stocks by end of January stood at 1,446,810
bags, Wheat at 1,931,420 bags and Rice 540,580 bags. In areas where short rain crop was not
severely affected by poor rains, harvesting is expected to begin in February. The short rains
maize crop is expected to be up to 70 percent below the five-year averages, being 0.18 million
metric tons (MMT) against an average of 0.5 MMT.
Table 1.1: Maize balance sheet (1st January to 30
th June 2015)
Maize Balance Sheet through October 2014 90 Kg bags MT
Stocks as at 31st January 2015 in 90kg bags 17,359,400 1,562,346
a) Total East Africa Imports* (Private sector cross border trade) expected
between January to June 2015
2,500,000 225,000
b) Imports outside EAC between January to June 2015 600,000 54,000
c) Estimated Short Rains harvest between January to March 2015 2,000,000 180,000
Total available stocks between January to June 2015 22,459,400 2,021,346
Post –harvest storage losses estimated at 10% 2,245,940 202,135
Amount used for manufacture of feeds and other industrial products (2%
of stocks)
449,188 40,427
Amount used as seed (1%) 224,594 20,213
Expected total exports to East Africa Community region 0 0
Expected exports outside the EAC region 0 0
Projected national availability as at 30th June 2015( 90kg Bags) 19,539,678 1,758,571
CONSUMPTION @3.84 million bags/Month for 43 million people for 5
months
19,200,000 1,728,000
Balance as at 30th June 2015 (Surplus/Deficit) 339,678 30,571
Surplus 339,678 30,571
Source: Ministry of Agriculture, Livestock and Fisheries
Food price trends
Figure 1.5 illustrates the
wholesale maize prices for
the urban representative
markets in Kenya, namely
Nairobi, Mombasa, Nakuru
and Kisumu. Evidently,
wholesale maize prices
have been on a declining
trend from mid-2014
through December.
Between July and October,
prices declined 13 – 27
percent in all the four
markets, but remained
above the long term
9
averages in Eldoret and Kisumu throughout the same period. The decline in prices was mainly
due to stable supplies in the markets. The government through the Ministry of Agriculture signed
a Memorandum of Understanding (MoU) with the Tanzanian Government that allowed Kenyan
private sector traders to import up to 180,000 metric tons (MT) of maize at a negotiated price and
under import duty waivers through September. The imports, coupled with the early harvest from
the southern Rift Valley including in Bomet, Transmara, Nyamira, and Kericho Counties along
with some production in the southeastern marginal areas and the Lake Victoria basin ensured
normal supply on markets at the national level through September. Continued imports and
harvest from the North Rift, that usually trickle in from November onwards, ensured price
decline through December, while also remaining 10 – 20 percent below the averages in Nairobi,
Eldoret and Mombasa. Between December and January 2015, prices have maintained a stable
trend.
Retail maize prices in the southeast marginal agricultural markets continued to remain stable
between December and January 2015, at Ksh. 35 – 40, and in some instances going below Ksh.
35.. Maize prices have remained stable in Kitui, Makueni, Tharaka Nithi, Meru North and Nyeri,
and declined by 10 percent in Embu. These prices are up to 12 percent below the long term
averages in Kitui, Makueni and Tharaka Nithi, while being six to 27 percent above the averages
in Meru North, Embu and Nyeri. As mentioned earlier, stability in prices is due to ample
supplies in the markets, owing mainly to imports from across the borders, and some short rains
crop harvest from these areas. Cereal prices were up to 25 percent above the averages in most of
the pastoral markets, between December and January, except in Marsabit and Mandera counties
where they were comparable to averages. Normal market operations have ensured continued
flow of commodities from various source markets into the pastoral markets, supporting stable
prices, and favorable terms of trade. Terms of trade were still favorable in the pastoral and agro
pastoral areas. with variations noted from county to county.
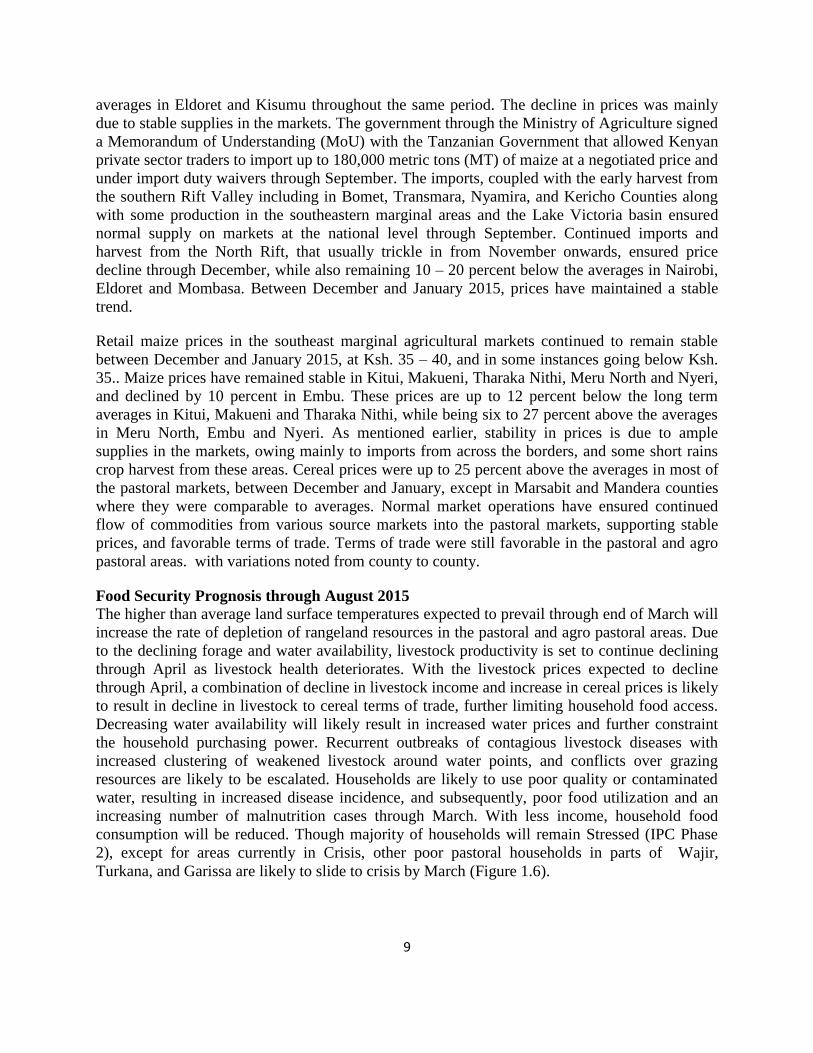
Food Security Prognosis through August 2015
The higher than average land surface temperatures expected to prevail through end of March will
increase the rate of depletion of rangeland resources in the pastoral and agro pastoral areas. Due
to the declining forage and water availability, livestock productivity is set to continue declining
through April as livestock health deteriorates. With the livestock prices expected to decline
through April, a combination of decline in livestock income and increase in cereal prices is likely
to result in decline in livestock to cereal terms of trade, further limiting household food access.
Decreasing water availability will likely result in increased water prices and further constraint
the household purchasing power. Recurrent outbreaks of contagious livestock diseases with
increased clustering of weakened livestock around water points, and conflicts over grazing
resources are likely to be escalated. Households are likely to use poor quality or contaminated
water, resulting in increased disease incidence, and subsequently, poor food utilization and an
increasing number of malnutrition cases through March. With less income, household food
consumption will be reduced. Though majority of households will remain Stressed (IPC Phase
2), except for areas currently in Crisis, other poor pastoral households in parts of Wajir,
Turkana, and Garissa are likely to slide to crisis by March (Figure 1.6).

10
The 2015 long rains have
been forecasted to be
near-normal in cumulative
amount, with a late onset.
This is likely to bring
moderate relief to
households from April
onwards. Importantly
though, households’
recovery may be
hampered by successive
previous season failures,
which could require more
than one good season for
substantial recovery.
Through August,
households are expected
to have improved food security conditions, and be in stressed (IPC Phase 2), including those who
were previously in crisis (IPC Phase 3). However, if the 2015 long rains are below normal and
poorly distributed in space and time, food security conditions are likely to deepen both in the
pastoral and marginal agricultural areas, with possibilities of more households especially those in
the stressed (IPC Phase 2), getting in to the crisis (IPC Phase 3), through August 2015. The
importance of monitoring closely the performance of the coming long rains cannot be
overemphasized, as it will be key in determining how food security outcomes evolves over the
next six months.

11
Options for response
The prevailing conditions and situation of food security provides several points for both short
and long-term intervention. The immediate interventions should focus on nutrition support and
livestock offtake programmes specifically in the pastoral areas. Long term interventions that
enhance the productivity target promotion of drought resistant crops besides provision of inputs
in the arid and semi-arid areas, pasture reseeding, and water harvesting. In addition, immediate
food and cash assistance programs to sustain food access and demand while enhancing resilience
in those localized areas where there is heightened food insecurity should be up scaled. In areas
experiencing conflicts, peace building and conflict management initiatives should be promoted.
Table 1.2 below summarizes the priority interventions by sector. More detailed analysis of the
sector specific interventions are presented in section 4 of this report.
Table 1.2: Summary of priority interventions by sector for March 2015 – August 2015 SECTOR PROPOSED INTERVENTIONS COST
Ksh.(M)
COST IN U.S.
DOLLAR (M)
AGRICULTURE Up Post- Harvest management, management of the Maize
Lethal Necrosis Disease (MNLD), Provision of drought tolerant
crops and traditional high value crops and subsizied farm inputs,
Promotion of on farm water harvesting, Purchase of
598M 6.57M
LIVESTOCK Vaccinations, Pasture reseeding and rangeland rehabilitation,
Livestock Disease Surveillance, Livestock Supplementary
feeding, Commercial Emergency Off take, Livestock water
supply
322M 3.54M
WATER Fuel subsidy for community boreholes, Water Trucking, Water
treatment, Provision of water Tanks and storage facilities, Water
Infrastructure development for emergency supply, repair of
strategic boreholes in grazing areas,
204M 2.24M
HEALTH AND
NUTRITION
Active case finding outreaches, Water and hygiene
interventions, HiNi interventions including IMAM, Vitamin A
supplementations, deworming, IYCN Intervention including
mother to mother support group, Strengthen Documentation and
Strengthen disease surveillance
325.3M 3.57M
EDUCATION Up scaling Home Grown School Meals Program and
supplementary feeding for ECD, Provision of infrastructure for
water storage, Water Trucking, Deworming and Vitamin A
supplementation
373M 4.1 M
FOOD
ASSISTANCE
Building resilience to future shocks through FFA and CFA.
Food commodities and cash for 1.6 million food insecure people
in need of assistance for the next six months (March- August
2015). An estimated 69,500 MT of food or cash equivalent
(CFA) will be required.
7,270M 80M
Total 9,100M 100M

12
1.0 Introduction
1.1 Assessment Coverage and Objectives
The 2014 October to December short rains season assessment was conducted between the period
of 26th
January to 6th
February 2015. The assessment was coordinated and conducted by the
Kenya Food Security Steering Group (KFSSG)1 and the County Steering Groups (CSG) in the 23
persistently drought‐prone pastoral, agro pastoral and marginal agricultural counties. The 23
counties assessed cover close to 80 percent of the country’s geographic area with diverse
livelihood zones (Figure 1.7). Specifically, the following counties, grouped into five livelihood
clusters, were covered during the assessment:
a) Pastoral Northwest Cluster (Turkana,
Marsabit and Samburu Counties);
b) Pastoral Northeast Cluster (Mandera,
Garissa, Isiolo, Wajir, and Tana River
counties);
c) Agro pastoral Cluster (Baringo, West
Pokot, Laikipia, Narok, Kajiado and
Nyeri (Kieni) counties);
d) Southeastern Marginal Agricultural
Cluster (Tharaka-Nithi, Embu (Mbeere),
Meru North, Makueni, and Kitui counties);
and
e) Coastal Marginal Agricultural Cluster
(Taita Taveta, Kilifi, Lamu, and Kwale
counties).
The overall objective of the assessment was to
develop an objective, evidence-based and
transparent food and nutrition security situation
analysis, taking into account the cumulative effect of previous seasons and inform the
government and relevant stakeholders on the status of food security across the Arid and Semi-
Arid areas. Moreover, the assessment aimed at identifying areas with high severity of food
insecurity and to provide recommendations for appropriate response options, whether short or
long term, required.
Specific objectives were to:
Ascertain at the livelihood level, the quality and quantity of the 2014 October to
December short rains, and assess their impact on all key sectors including crop
agriculture, livestock, water, and health and nutrition as well as education .
Establish the impacts of other compounding factors such as conflict, crop pest and
disease, relative high food prices and floods on household food security.
1 KFSSG is comprised of Government of Kenya (GoK) ministries, the UN, NGOs and key development partners.

13
Assess potential food needs, including options for appropriate transfer modalities
including food for assets, cash and vouchers, hunger safety nets and general food
distribution.
Establish required non-food interventions, with particular emphasis on programs that
promote preparedness and build household resilience.
1.2 Assessment Approach
The overall assessment processes and
methodologies were coordinated and
developed by the KFSSG. First, secondary
data for all assessed counties was
collected, analyzed and collated into
briefing packs. The data included
livelihood zone baseline data, drought
monitoring information, monthly nutrition
surveillance data, price data and satellite
imagery. Thereafter, the KFSSG
organized a one-week training workshop
for the assessment teams. During the
workshop, the teams refined sectoral
indicators and interview guides, and were
taken through the entire assessment
process, including, agro-climatic
information analysis, sampling methods
and field data collection techniques,
integrated food security phase
classification, estimation of population in
need of emergency food assistance, and
report writing. In addition, food security
outcome monitoring indicators were also
collected from 2,700 households situated
in 90 sentinel sites. Outcome indicators
that were collected included the coping
strategy index, food consumption scores and household expenditure data. Figure 1.8 shows the
sentinel sites from which the outcome indicators were collected. Once in the counties, each
assessment team conducted a minimum of two community, two key informant and two market
interviews in each sample site. The teams also visited health and education institutions to gather
relevant information. Visual inspection techniques were also used during transects drives to
obtain qualitative information. The field data was collated, reviewed, analyzed and triangulated
to verify its validity. The NDMA drought monitoring bulletins, the February 2015 nutrition
SMART survey reports and the KFSSG monthly Food Security Updates provided important
additional information.
The KFSSG adopted a multi-sectoral and multi-agency approach covering the Agriculture,
Livestock, Markets, Health and Nutrition, Water and Sanitation, Education and the Food

14
assistance Sectors. While the analytical framework is generally the sustainable livelihood
framework with the livelihood zones being the focal areas, the required outcome is a detailed
understanding of the changes in food security and identification of populations affected and in
need of multi-sectoral assistance, particularly in the immediate and medium terms. Results from
sampled areas were used, along with outcomes of discussions with the larger County Steering
Groups (CSGs) and secondary data analysis to draw inferences for non-visited areas situated in
similar livelihood zones. The findings and recommendations were provided at both the county
and sub-county levels for planning purposes. The Food Security Integrated Phase Classification
(IPC Version 2.0) was employed in classifying severity levels of food insecurity in different
livelihood zones.

15
2.0 Food and Nutrition Security Analysis by Livelihood Cluster
2.1 The Pastoral Northwest Livelihood Cluster
2.1.1 Cluster Background
The cluster comprises of Marsabit,
Turkana and Samburu Counties
and covers an area of 173,877
square kilometers with an
estimated population of 1.37
million persons (KNBS Census
2009). The cluster has three main
livelihood zones namely: Pastoral
livelihood zone, accounting for 69
percent of the population, Agro
pastoral 24 percent and
Fisheries/Formal
employment/Business/Petty trade
at seven percent (Figure 2.1). The
Pastoral livelihood zone accounts
for 80 percent of the total area in the cluster. The main sources of income are; livestock
production at 80 percent, crop production at 15 percent and others including fishing, casual labor
and charcoal burning at five percent.
2.1.2 Factors Affecting Food Security
The main factors affecting food security include: poor temporal and uneven distribution of the
short rains, human and livestock diseases, high food prices, human wildlife conflict, livestock
migration and insecurity related to resource based conflicts and cattle rustling.
2.1.3 Cluster Food Security Situation
2.1.3.1 Current Food Security Situation
The current food insecurity phase classification for the cluster is Stressed (IPC Phase 2). Terms
of Trade (ToT) for the cluster were slightly above the long term average and more favorable in
Samburu, increasing by 34 percent. Food stocks held in Marsabit county were lowest at 9.8
percent of long term average (LTA) while in Turkana and Samburu counties stocks were 45 and
30 percent of LTA respectively. Meal frequency was normal at one to two meals per day in the
pastoral areas and two to three in the agro pastoral areas. Household water consumption per
person per day was normal at a range of 6 to 10 liters in the pastoral areas and 10 to 15 liters in
the agro pastoral areas. Milk production ranged from 0 – 0.75 liters compared to 2 – 3 liters
normally. Milk available in the markets retailed at Kshs 80 – 100 per liter while in Turkana, the
farm gate price of milk was normal at Kshs 45 per liter. The percentage of children at risk of

16
malnutrition based on mid upper arm circumference (MUAC <135mm) was stable and within the
seasonal ranges across the cluster. The coping strategy score for the cluster ranged between 22 to
25 in December 2014 compared to 14 to 23 in December, 2013.
2.1.3.2 Food Security Phase Classification
The current food security
phase classification for the
cluster after the 2014 short
rains assessment was
Stressed (IPC phase 2) and
was a slight improvement
compared to six months ago
however, some pockets in
Marsabit county are
classified as Crisis (IPC
Phase 3) as shown in Figure
2.2. Household water
consumption improved in
Turkana and Samburu to 10
– 15 liters from 5 – 8 liters per person per day in August 2014. However in the pastoral
livelihood zones in Marsabit, water consumption has declined to five liters from 7 – 10 liters per
person per day after the long rains. The terms of trade were still favorable and within seasonal
norms except for Samburu county where they have improved, with one goat exchanging for 51
kilograms of maize compared to the long term average of 35 kilograms of maize. The nutritional
status as indicated by percentage of children at risk (MUAC < 135mm) was stable across the
cluster, and within the five year averages.
2.1.4 Rainfall Performance
The onset of the short rains was timely in the first and second week of October in most parts of
pastoral northwest cluster. Despite the timely onset, the rainfall was poorly distributed in time
and unevenly in space with most areas receiving between 25 to 50 percent of normal except for
Turkana where most parts received between 125 and 140 percent of the normal. In Samburu and
Marsabit counties, most parts received between 25 and 50 percent of the normal. Within the
cluster, Marsabit had more parts receiving below 25 percent of the normal compared to other
counties. Cessation was one dekad earlier than normal across the cluster except Samburu, where
the cessation was in the second dekad of December.
2.1.5 Current Shocks and Hazards
The shocks and hazards affecting food security in the cluster include, cattle rustling and resource
based conflicts, in and out-migration of livestock, livestock diseases; outbreak of Foot and
Mouth Disease (FMD), crop destruction by wildlife, crop pests and an upsurge of human
diseases in Marsabit county and insecurity in Turkana.
17
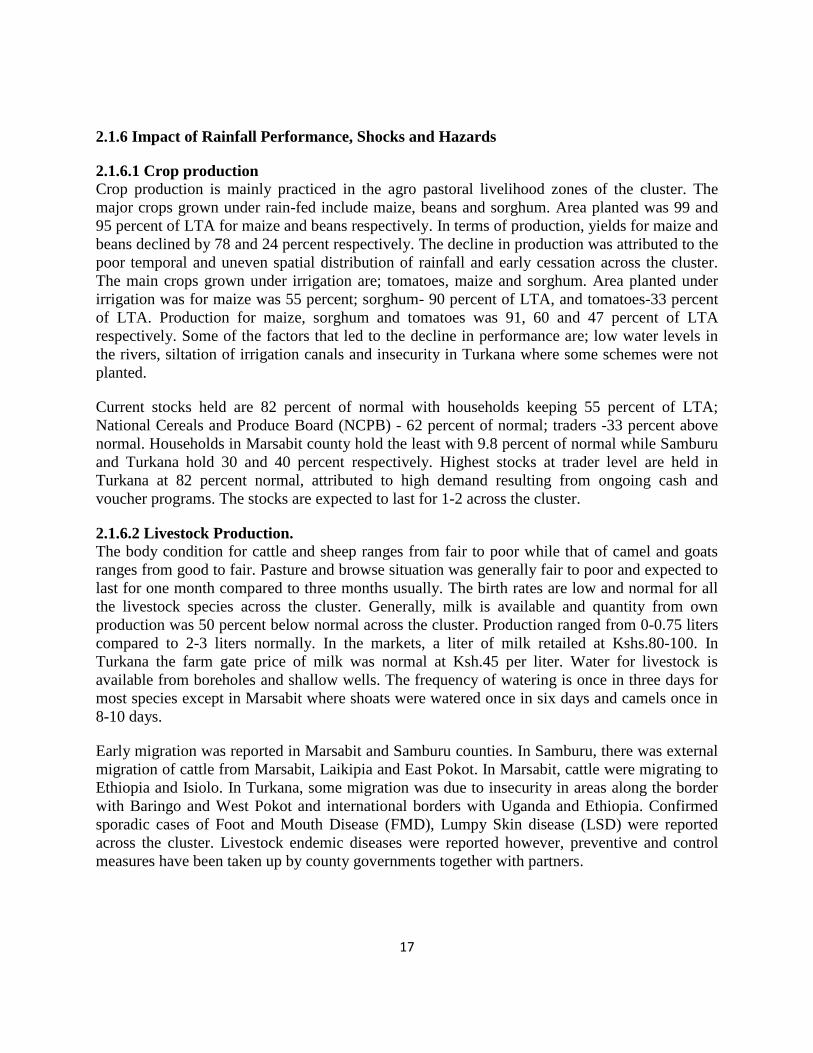
2.1.6 Impact of Rainfall Performance, Shocks and Hazards
2.1.6.1 Crop production
Crop production is mainly practiced in the agro pastoral livelihood zones of the cluster. The
major crops grown under rain-fed include maize, beans and sorghum. Area planted was 99 and
95 percent of LTA for maize and beans respectively. In terms of production, yields for maize and
beans declined by 78 and 24 percent respectively. The decline in production was attributed to the
poor temporal and uneven spatial distribution of rainfall and early cessation across the cluster.
The main crops grown under irrigation are; tomatoes, maize and sorghum. Area planted under
irrigation was for maize was 55 percent; sorghum- 90 percent of LTA, and tomatoes-33 percent
of LTA. Production for maize, sorghum and tomatoes was 91, 60 and 47 percent of LTA
respectively. Some of the factors that led to the decline in performance are; low water levels in
the rivers, siltation of irrigation canals and insecurity in Turkana where some schemes were not
planted.
Current stocks held are 82 percent of normal with households keeping 55 percent of LTA;
National Cereals and Produce Board (NCPB) - 62 percent of normal; traders -33 percent above
normal. Households in Marsabit county hold the least with 9.8 percent of normal while Samburu
and Turkana hold 30 and 40 percent respectively. Highest stocks at trader level are held in
Turkana at 82 percent normal, attributed to high demand resulting from ongoing cash and
voucher programs. The stocks are expected to last for 1-2 across the cluster.
2.1.6.2 Livestock Production.
The body condition for cattle and sheep ranges from fair to poor while that of camel and goats
ranges from good to fair. Pasture and browse situation was generally fair to poor and expected to
last for one month compared to three months usually. The birth rates are low and normal for all
the livestock species across the cluster. Generally, milk is available and quantity from own
production was 50 percent below normal across the cluster. Production ranged from 0-0.75 liters
compared to 2-3 liters normally. In the markets, a liter of milk retailed at Kshs.80-100. In
Turkana the farm gate price of milk was normal at Ksh.45 per liter. Water for livestock is
available from boreholes and shallow wells. The frequency of watering is once in three days for
most species except in Marsabit where shoats were watered once in six days and camels once in
8-10 days.
Early migration was reported in Marsabit and Samburu counties. In Samburu, there was external
migration of cattle from Marsabit, Laikipia and East Pokot. In Marsabit, cattle were migrating to
Ethiopia and Isiolo. In Turkana, some migration was due to insecurity in areas along the border
with Baringo and West Pokot and international borders with Uganda and Ethiopia. Confirmed
sporadic cases of Foot and Mouth Disease (FMD), Lumpy Skin disease (LSD) were reported
across the cluster. Livestock endemic diseases were reported however, preventive and control
measures have been taken up by county governments together with partners.

18
2.1.6.3 Water and Sanitation
The main sources of domestic water are boreholes, springs, pans/dams, shallow wells and Lake
Turkana, river Turkwel and river Kerio in Turkana county and River Ewaso Nyiro in Samburu
county. Open sources were recharged up to 100 percent in Turkana and below 50 percent in
Marsabit and Samburu. Over 80 percent of pans in Marsabit and Samburu have dried up while
most pans in Turkana have water expected to last for two to three months. Distances to water
sources are within the seasonal range of between five to 10 kilometers. In Karare area in
Marsabit county, households are walking up to 13km. Waiting time at water sources was
between 10 to 30 minutes across the cluster except in the pastoral areas of Samburu where
households are waiting between four to eight hours to collect water. Cost of water ranges
between two to five shillings per jerrican, except in Samburu where cost of water at the
boreholes is up at Kshs.20. Vendors in Turkana and Samburu are selling a 20 liter jerrican of
water between Kshs. 10-20 while water vendors are selling at Kshs. 40 in Marsabit township.
Household water consumption was within the normal range between 6-12 liters per person per
day with consumption having improved from 10 to 20-30 liters in the agro pastoral areas of
Turkana and between 10-15 liters in the pastoral and fisheries zones. In the pastoral areas of
Samburu, water consumption is about three liters per person per day. Water treatment at
household level is below 20 percent and this is done either by boiling, use of water treatment
chemicals and sand filters. Despite the availability of treatment chemicals at household level, in
Marsabit and Turkana, low utilization is due to culture. Treatment chemicals are scarce in
Samburu and when available, most households cannot afford due to high prices. Latrine
coverage across the cluster was low ranging between 10 to 30 percent. Water related diseases
reported include diarrhea and malaria. Sources of water contamination reported across the cluster
was mainly open defecation and unprotected open water sources.
2.1.6.4 Market Performance
Markets across the cluster operated normally with food commodity supplies being normal. Poor
infrastructure in remote market, leads to high transportation costs. Market supplies were mostly
from outside the cluster, however, in Turkana, some supplies are from irrigation schemes in the
county. Average maize prices in the cluster were about 18 percent above LTA and ranged from
Kshs. 48.9 in Marsabit county
to Kshs. 82 per kilogram in
Turkana county as January
2015. Goat prices in the
cluster were about 25 percent
above the LTA and ranged
between Kshs. 2,040 – Ksh.
2,917.
Terms of Trade (ToT) in
January 2015 were generally
good across the cluster. In
Samburu, terms of trade
improved significantly where
the sale of one goat could be

19
exchanged for 51 kilograms of maize compared to the long term average of 35 kilograms of
maize. Terms of trade were most favorable in Marsabit where the sale of one goat would
purchase 60 kilograms of maize compared to the LTA of 56 kilograms (Figure 2.3).
2.1.6.5 Health and Nutrition
2.1.6.5.1 Morbidity and mortality patterns
The most common diseases for both the under-fives and the general population are; Upper
Respiratory Tract Infections (URTI), malaria, diarrhea and skin diseases. Morbidity incidences
were on the increase across the cluster except in Samburu where they remained within the
seasonal ranges. In Turkana county, there were eight reported cases of measles, while dysentery
cases doubled to 2,064 between July - December 2014 from 1,024 reported in the same period in
2013, mainly attributed to poor sanitation and hygiene. The crude mortality rates (CMR) and
under-five mortality rates (U5MR) in the period under review were within the seasonal norms in
the three counties.
2.1.6.5.2 Immunization and Vitamin A supplementation
The percentage of fully immunized children increased by 10-20 percent at 51.9, 61 and 78.4
percent in Samburu, Turkana, and Marsabit counties respectively, this is below the national
target of 80 percent. Vitamin A supplementation among children aged (6-11 months) ranged
between 59 to 68.2 percent while that of children aged (12 to 59 months) ranged from 15 to 54.7,
generally below the national target. The low coverage for immunization and vitamin A
supplementation is attributed to long walking distances to health facilities.
2.1.6.5.3 Nutrition Status and Dietary Diversity
The proportion of children
at risk of malnutrition
(MUAC 135mm) in
January 2015 was below
the long term averages
except for Turkana which
was slightly above the
LTA (Figure 2.4). MUAC
trends July 2014 to
January 2015 remained
relatively stable and
within seasonal trends.
The increase in Turkana
may be attributed to the reduced milk availability at household level. The stable nutrition
situation across the cluster from August 2014 was due to response interventions put in place
following high global acute malnutrition rates reported in June 2014. Dietary diversity remains
poor across the cluster, with households consuming less than two food groups. Households with
poor, borderline and acceptable food consumption scores (FCS) were 38, 27 and 35 percent
respectively compared to 46, 51 and three percent in December 2013. Meal frequency was
normal across the cluster.

20
2.1.6.6 Education
Enrolment and attendance for both boys and girls generally increased across the cluster.
Transition from primary to secondary schools in the cluster was 63 percent except for Turkana at
40 percent. Low transition was attributed to poor performance in schools, lack of school fees for
secondary education and in some cases early marriages for the girls. Dropout rates were higher
for girls compared to boys except for Marsabit, where dropouts for boys were higher than that of
girls. In Marsabit county, boys dropped out to support their households in search for water and
pasture for livestock. Reasons contributing to drop outs for girls across the cluster were mainly
domestic chores, early marriages and pregnancies. The Regular School Meals Programme
(RSMP) in Turkana and Marsabit and Homegrown School Meals Programme (HGSMP) in
Samburu county has contributed to improved enrolment, attendance, learners’ concentration and
retention in schools.
2.1.7 Coping Mechanisms
The mean coping strategy score across the cluster was 25 in December 2014, compared to 23 in
December 2013. Most common consumption related coping strategies were reduction in the
number and size of meals taken per day and reduction in the quantity of food consumed by
adults/mothers for young children to eat. Charcoal burning which previously has been employed
as a coping strategy is slowly evolving into a livelihood diversification strategy in the cluster. In
addition, collection and sale of firewood, tapping and sale of Aloe vera and weaving of baskets,
beads and mats was reported in Turkana as a livelihood strategy.
2.2 The Pastoral Northeast Livelihood Cluster
2.2.1 Cluster background
The cluster covers five counties that include; Tana
River, Isiolo, Mandera, Wajir and Garissa with an
area of 190,634 square kilometres and a population
of 1,844,780 persons as per 2009 census (KNBS).
The major livelihoods in the cluster as represented in
Figure 2.5 are; Pastoral livelihood zone accounting
for 57 percent of the population, Agro Pastoral 21
percent, Marginal Mixed Farming nine percent,
Irrigated seven percent and Informal/Formal
employment/Business/Petty Trade six percent. The
major sources of cash income in the cluster are;
livestock production contributing 60 percent and
crop production 30 percent for the households.
2.2.2 Current Factors Affecting Food Security
The main factors affecting food security were poor
performance of the short rains season, crops and
livestock pests and diseases, inadequate and poor
pastures, diminishing water supply for livestock and

21
domestic use, livestock migration, insecurity due to resource based conflicts, inter-clan clashes
and terrorist threats in Mandera, Wajir and Garissa. Others are high food prices, low livestock
prices, poor road infrastructure and human wildlife conflict in Tana River and Garissa.
2..2.3 Cluster Food Security Situation
2.2.3.1 Current Food Security Situation
The current food insecurity phase classification for the cluster is Stressed (Phase 2). However,
few pockets in Wajir (Griftu, Eldas), Isiolo (Merti, Garbatulla, and Oldonyiro) and Mandera
(Kutulo) are in Crisis (Phase 3). The lowest and highest terms of trade in the cluster was 39
kilograms and 58 kilograms from a sale of goat in Wajir and Garissa respectively. Food
consumption score changed from 77 percent poor, 22 percent borderline in December 2013 to
three percent poor, seven percent borderline and 90 percent acceptable in December 2014.
Households in the cluster were on average consuming between one and two meals per day with
an average composition of three food groups. Water consumption in the cluster ranged 10 to 20 a
litre which was within the normal ranges. The mean coping strategy index in the cluster was 27
percent in December 2014 compared to eight percent in December 2013. The GAM rates in
Mandera, Garissa and Isiolo were 22.3, 15.2 and 13.2 percent, which are above emergency
thresholds2 in Mandera and Garissa.
2.2.3.2 Food Security Phase Classification
The food security phase
classification in February 2014 after
the short rains was Stressed (IPC
Phase 2), across all the livelihoods in
the cluster. In August 2014 after the
long rains season much of the cluster
is still classified as Stressed (IPC
Phase 2). However, localized areas
of Wajir (Griftu, Eldas, West of
Tarbaj, Hadado and Sebule), Isiolo
(Merti, Garbatulla, Oldonyiro) and
Garissa (Balambala (Dujis), Benane,
Danyere, Modogashe (Maalinin and
Ilan), Shantabak (Baraki, Gurufa and
Goreale) are in Crisis (Phase 3) as illustrated in Figure 2.6. The food consumption score is 90
percent acceptable, seven percent borderline and three percent poor from 37 percent acceptable,
39 percent borderline and 24 percent borderline in May 2014 after the long rains. The mean
coping strategy index for the cluster changed from 19 percent in May 2014 to 27 percent in
December 2014. The terms of trade declined by 22, 21 and 16 percent in Mandera, Garissa and
Isiolo counties respectively. The proportion of children with MUAC below 135 mm increased by
five percent in Garissa, was 18.1 percent in Wajir and 22.4 percent in Mandera. Water
consumption per person per day ranged between 8 – 10 litres which is less than 10 – 15 litres in
2 WHO Classification – GAM above 15% is classified as Emergency/Critical nutrition situation

22
August 2014 but was stable in Garissa at 20 litres per person per day. Household food stocks
considerably increased compared to a similar period last year and the 2014 short rains season.
Distances to water compare favorably to the normal despite the rain season. Distances for the
pastoral livelihood zone ranged between 10 and 15 kilometres in Wajir, Garissa and Isiolo except
for Mandera where distances reached up to 20 kilometres.
2.2.4 Rainfall Performance The onset of the short rains was late in first week of November 2014, in Garissa, Isiolo and Tana
River and timely in Wajir and Mandera in second week of October 2014. Most parts of Tana
River, Wajir and Mandera received between 50 and 75 percent of the normal, while Isiolo and
Garissa, most parts received 25-50 percent of normal. Some parts in Mandera, Tana River,
Isiolo, Wajir and Garissa received below 25 percent of the normal. The spatial distribution was
uneven and temporal distribution poor across the cluster. Cessation was early in first to third
week of December 2014, except in Mandera third week of November 2014.
2.2.5 Current Shocks and Hazards Shocks and hazards include; clan conflicts and Al-Shabaab threats along Somalia border, low
amounts of rainfall resulting to water scarcity for both livestock and domestic, prolonged
drought, poor livestock marketing infrastructure resulting to low prices. Resource based conflicts
due to livestock migration to already fading pasture and water points. Others include; tension
after the ethnic clashes in Tana Delta in Tana River, endemic livestock diseases in Garissa and
Tana River. Human wildlife conflicts due to closure of national parks and reserves in Tana River
and Isiolo.
2.2.6 Impacts of Rainfall Performance, Shocks and Hazards
2.2.6.1 Crop Production The cluster depends both on the long and short rains season. Crop production contributes to
about 30-40 percent of food and cash income. The main food crops planted during the short rains
season are maize, cow peas and sorghum. Other crops include beans and green grams. Rain fed
area under maize was 70 percent of the LTA, while cow peas and sorghum were 56 and 72
percent respectively of the LTA. Acreage under green grams and beans increased by 75 and 18
percent respectively of the LTA. Poor temporal rainfall distribution and early cessation lowered
the production of all the crops. Maize, cowpeas and sorghum production in the rain fed area was
projected to decline by 42, 28 and 77 percent respectively compared to the LTA. Isiolo County
had the worst crop production with maize, beans and cow peas recording 100, 80, and 85 percent
respectively below the LTA. Despite increased acreage under green grams and beans the
projected yields will decline by 11 and 80 percent respectively. Area under irrigation increased
by 47, 44 and two percent of LTA for bananas, mangoes and tomatoes respectively. Bananas and
mangoes production increased by 58 and 67 percent while tomatoes declined by 54 percent of
the LTA. The reduction in areas was due to lack of floods water along the flood plains in Tana
River. Production further declined due to infestation of pests and diseases. Maize stocks held in
the cluster was 96 percent of the LTA. Households, traders and millers hold 34, 76 and 62
percent of the LTA respectively while National Cereal Produce Board (NCPB) hold 97 percent
above LTA. The low stocks at household level are attributed to below average performance of
the short rains season.

23
2.2.6.2 Livestock Production Pasture and browse condition is fair to poor across the livelihood zones except for Mixed
Marginal Farming livelihood zone in Tana River where the condition is good to fair. The
condition is expected to last for less than a month to two months compared to two to three
months. Livestock body condition is good to fair across all livelihood zones except in the
pastoral livelihood zone in Wajir where the condition of cattle is fair to poor. The body condition
is expected to deteriorate further in the next one to two months. Milk availability has reduced
and ranged at 0.5 to two litres compared three to five litres. Household milk consumption ranged
between 0.5 to one litre compared to normal of two to three litres of milk. The cost of milk was
Ksh.50-60 per litre with exception of Mandera and Wajir where one litre costs between Ksh.100-
150 compared to the normal of Ksh.50-80. Return trekking distance in Mandera, Garissa and
Isiolo ranged from 15-25 kilometres compared to normal of 4-10 kilometres. In Wajir livestock
covered 20-40 kilometres compared to normal of 15 kilometres with exception of Eldas Sub
County where cattle and camels trekked 48 kilometres. In Tana River, livestock covered one to
eight kilometres in marginal and mixed farming livelihood zones and 5-15 kilometres in the
pastoral livelihood zone. Water frequency varies ranging at three to five days for cattle and
shoats. Tropical Livestock Units (TLUs) have generally decreased over the years across the
cluster. In Wajir, Garissa, Isiolo and Tana River, TLUs in pastoral livelihood zone ranged at 3-5
compared to normal of 7-9. Livestock birth rate across all the species has declined due to the fair
to poor livestock body condition.
Out migration has been reported in Mandera towards Somalia and Ethiopia, while in migration
was observed from pastoral livelihood zone of Mandera South and Mandera West. Conflicts
between border communities along Kenya and Ethiopia has affected in migration to access
pastures along river Daua, Malkamari, Guba and Choroqo. In Wajir, Garissa and Isiolo some
livestock have moved out of the counties to Tana River, Laikipia and Kitui counties. Outbreak of
Foot and Mouth Disease, Anthrax, Black Quarter and Lumpy Skin Diseases has been reported in
Wajir, Isiolo, Garissa and Tana River. Endemic diseases reported were Contagious Caprine
Pleuralpneumonia and Pestes des Petit Ruminants, Contagious Bovine Pleuropneumonia, Sheep
and Goat Pox, Trypanosomiasis and tick infestation. Haemorrhagic Septicaemia in Camel had
led to several deaths in Wajir and Garissa.
2.2.6.3 Water and Sanitation The major water sources are rivers, shallow wells, boreholes, dams/pans, irrigation canals, piped
water systems and springs. Open water sources were poorly recharged as a result of the poor
performance of the rains. However, distances to water sources have remained within the normal
range of less than five kilometres with the exception of Garissa county where the distances have
increased to 7.5 kilometres from the normal maximum of five kilometres. In all the pastoral and
agro pastoral livelihood zones, waiting time at the water source has considerably increased from
less than half an hour to 2-4 hours with the exception of Isiolo and Tana River where it is within
the normal of 15 minutes to one hour. However, in Gafarsa, Muchuro and Kombola in Isiolo
county, households are taking more than five hours compared to the normal two hours due to
influx of livestock from other areas and whose watering takes precedence to collection of water
for domestic use. Water for household consumption was 15 to 20 litres per person per day in
Garissa and Tana River. In Isiolo and Mandera, water consumption was 5-10 litres per person
per day compared to normal of 10-15 litres per person per day. The cost of water has remained

24
within the normal range of Ksh.2-5 per 20 litres jerican across the cluster with the exception of
the pastoral and agro pastoral livelihood zones of Mandera and Wajir Counties where the cost is
Ksh.10-20 per 20 litres jerican compared to the normal Ksh.5. However, private water vendors in
the pastoral livelihood zones of Tana North-Bura, Madogo, Bangale in Tana River and Ashadin,
Mbalambala and Geillab in Garissa County are selling water at Ksh.20-30 per 20 litres per
jerican. Latrine coverage in the cluster ranges from 30-51 percent in Wajir and Isiolo. Mandera,
Garissa and Tana River Counties have a latrine coverage of 28, 35and 47 percent respectively.
2.2.6.4 Markets and Trade Market operations in the cluster
were at optimal levels; except the
occasional insecurity related
disruptions reported in parts of
Garissa, Wajir and Mandera
Counties. Remote markets situated
far away from the main (urban)
markets are affected by poor
infrastructure resulting to high
transport costs. Livestock supplies
were from within the cluster and
were reported to be high; whereas
majority of the food supplies were
mainly from external markets. In
January 2015, maize prices were
two percent below LTA in Wajir and Isiolo counties. In Mandera, Tana River and Garissa, prices
were 19, 38 and 60 percent above the LTA respectively. Prices ranged between Ksh.35 (Tana
River) to Ksh.66 per kilogram (Mandera). Goat prices were two percent below LTA in Tana
River and 8, 33, 46 and 48 percent above the LTA in Mandera, Wajir, Garissa and Isiolo
respectively. The prices ranged between Ksh.2, 052 (Isiolo) to Ksh.3, 371 (Tana River). Terms
of Trade (ToT) for Wajir and Tana River were above the LTA, while in Mandera, Garissa and
Isiolo ToT were below the LTA as illustrated in Figure 2.7. Mandera county had the least
favorable ToT; where the sale of a medium sized goat would purchase 40 kilograms of maize;
which is 11 percent lower than the LTA. Tana River county had the most favorable ToT; sale of
a goat would purchase 96 kilograms of maize compared to the LTA of 64 kilograms.
2.2.6.5 Health and Nutrition
Major diseases among under-five and general population in July to December 2014 were
diarrhoea, skin diseases, respiratory diseases and eye infections. Others were; ear infections,
intestinal worms, malaria and rheumatism. An increase in diarrhoea and malaria illnesses was
reported in Isiolo, Mandera and Garissa in July to December, 2014 compared to 2013 same
period. The crude death (CDR) and under-five death rates (U5DR) remained below alert levels
across the cluster. The percentage of fully immunized child (FIC) for Wajir, Mandera, Tana
River and Garissa Counties in the month of July to December, 2014 decreased to 47.3, 27, 25.1
and 64 percent respectively compared to 54.5, 53, 28 and 70 percent in 2013 same period which
are below national targets of 80 percent except in Isiolo County. Vitamin A supplementation
coverage for children aged (6-11 months) ranged between 49-78.2 percent. Vitamin A

25
supplementation for children aged (12-59 months) ranged between 40.9-58.4 percent which are
below national targets of 80 percent. The decline was attributed to stock outs in Vitamin A
supplementation (100, 000 I.U dosage) in Garissa and Isiolo Counties.
The percentage of under-five
at risk of malnutrition by
mid upper arm
circumference (MUAC <135
millimetres) was below long
term averages (LTA) except
in Garissa County where the
January 2015 MUAC
average was above LTA.
The percentage of under-five
malnourished by
MUAC<135MM ranged
between 10.9-21.7 percent.
The current rates increased
in all counties compared to
2014 same period rates except for Tana River County. Integrated nutrition surveys conducted in
Isiolo and Tana River County in February, 2015 indicated global acute malnutrition (GAM) rates
based on weight for height z-scores at 13.2 percent and 9.9 percent respectively. The GAM rates
for Garissa (Dadaab, Lagdera, Balambala) and Wajir (Wajir South /East) was at 15.2 percent and
17.0 percent respectively (Figure 2.8). However for Wajir West the GAM and SAM rates were at
Very Critical levels of 22.6 percent and 7.1 percent respectively. Meal frequency across the
cluster reduced from a normal of two meals a day to current one meal a day.
2.2.6.6 Education
School enrolment for both boys and girls increased generally across the cluster in 2014.
However, enrolment for boys was higher than that of girls due to preference of educating boys as
opposed to girls and early marriages for girls. Female Genital Mutilation and conflict in Mandera
was the main reason for low enrolment in girls. Boy’s enrolment ranged at 53-60 percent while
girls was 39-47 percent across the cluster. Since January 2015, attendance and enrolment in
Mandera and Wajir Counties has been adversely affected by the teachers’ strike protesting
against insecurity as well as agitating for better terms of engagement. In 2014, transition rates
from Early Childhood Development (ECD) centers to primary schools ranged at 90-97 percent
due to employment of ECD teachers by the County Governments and School Meals Programme
(SMP). Wajir County recorded the highest transition rate at 97 percent. Transition rate from
primary to secondary schools was low across the cluster except for Garissa County with
transition rates of 90 percent in 2014 up from 80.1 percent in 2013 which was above the national
average of 74 percent, attributed to a cash transfer programme by the Save the Children and
Children Department, who supported orphans and vulnerable children transiting to secondary
schools with bursaries. The general low transition rates across the cluster is attributed to high
poverty levels, early and long trekking distances to schools.
Dropout rates across were low in 2014, with the lowest in Mandera County at two percent and

26
Garissa County recording the highest at 33 percent. Reasons for dropouts are mainly migration,
conflicts, early marriages, Female Genital Mutilation (FGM) and herding activities practiced by
the boys. Regular School Meals Programme (RSMP) was implemented in all public primary
schools across the cluster and all ECD centers attached to them, except for Isiolo which
transitioned from RSMP to the Home Grown School Meals Programme (HGSMP) in 2014.
Under the new approach, schools receive cash and procure food commodities from the local
markets with support from the School Management Committees. Provision of meals contributed
to school enrolment, retention and completion rates to schools across the cluster. The meals
contributed to improved access, class participation and retention of pupils in schools and
improving the nutritional status which enhances pupil’s performance. Main reasons for pupils
missing their meals is lack of firewood, water, delayed delivery of food to schools and inability
by some schools to employ and retain cooks.
2.2.7 Coping Mechanisms The mean coping strategy score across the cluster in the month of December 2014 was 27, as
compared to eight in December 2013 except in Garissa where score was 16 in December 2014,
compared to 11 recorded in December 2013. Households were employing consumption related
coping strategies more often compared to the same period in the previous year. The common
insurance coping strategies employed by households across the cluster included reduction in
number and meal rations, skipping of meals and reliance on less preferred and less expensive
food, borrowing food and non-food items on credit, reliance on relatives and friends. Other
livelihood strategies being employed in the cluster
were burning of charcoal and engagement to casual
labour.
2.3 The Agro Pastoral Livelihood Cluster
2.3.1 Cluster Background
The cluster comprises of Narok, Laikipia, Kajiado,
Baringo, West Pokot and Nyeri (Kieni) counties and
covers an area of 71,757 square kilometers. It has a
population of 2,945,217 persons (2009 census) and
six main livelihood zones (Figure 2.9). The zones
include mixed farming livelihood zone accounting
for 31 percent of the population, pastoral livelihood
zone (27%), marginal mixed farming (20%), and
agro pastoral livelihood zone (11%). Formal
employment/Tourism/trade/Business and Irrigated
Crop livelihood zone account for 10.7 and 0.7
percent of the population respectively. The main
sources of income in the cluster are livestock
production and cash crop production, which
accounts for 75 percent and 55 percent of cash
income respectively.

27
2.3.2 Current Factors Affecting Food Security
The main factors affecting food security are endemic livestock diseases, poor post-harvest
management practices, crop pests and diseases such as Maize Lethal Necrosis Disease (MLND)
in Narok, Baringo and Laikipia, insecurity along the borders due cattle rustling and conflict for
water and pasture. Others are, high food prices, frost bite in Nyeri and Laikipia, human wildlife
conflicts, poor hygiene and child care practices, water borne diseases.
2.3.3 Cluster Food Security Situation
2.3.3.1 Current Food Security Situation
The current food security phase classification for the cluster is None/minimal (IPC Phase 1)
except for pastoral and agro pastoral livelihood zones of West Pokot and Baringo, marginal
mixed farming zone of Kieni and pastoral and marginal mixed farming livelihood zones of
Laikipia which are in Stressed (IPC Phase 2). In the pastoral and agro pastoral areas of Baringo
and the marginal mixed farming livelihood zones in Kieni, households are currently consuming
between one to two meals compared to a normal of between two to three meals in a day. Meal
frequency was stable and normal in Kajiado and Narok Counties at three meals per day across all
livelihood zones as well as in the mixed farming livelihood zones in the rest of the counties
within the cluster. Food consumption generally improved across the cluster as 70 - 90 percent of
households in the cluster had acceptable food consumption score. The percentage of children at
risk of malnutrition as measured by Mid Upper Arm Circumference (MUAC <135mm) is stable
and below the long term average (LTA) across the cluster except in some parts of Baringo (East
Pokot) currently at 33 percent, largely due to insecurity. There was no reported disease outbreak.
Under-five mortality rate (U5MR) across the cluster is less than 0.5 per 10,000 persons per day
and crude mortality rate (CMR) is less than 0.3 per 10,000 per person day which is below the
alert threshold of one death per 10,000 persons per day. The Coping Strategy Index (CSI) in
Baringo, West Pokot, Laikipia and Kieni currently stands at 21. However, CSI stand at 7 and 28
in Kajiado and Narok counties respectively. Water consumption is above 15 litres per person per
day across the cluster, lowest consumption was in the pastoral areas at 8 - 12 litres per person per
day.
2.3.3.2 Food Security Phase
Classification
The cluster has remained in
None/minimal food
insecurity phase as it was
after the long rains
assessment in August 2014.
Parts of West Pokot and
Baringo County, which were
classified in Crisis (IPC
Phase 3) last season, have
moved to Stressed phase
(Figure 2.10). The rest of
pastoral and agro pastoral
livelihood zones of West

28
Pokot and Baringo, marginal mixed farming zone of Kieni and pastoral and marginal mixed
farming livelihood zones of Laikipia have remained in Stressed Phase (IPC Phase 2).
2.3.4 Rainfall Performance
The onset of the short rains in this cluster was generally timely in the 2nd
week of October except
Kajiado where rains started in the 1st week of November. However, Baringo received off season
rains in August 2014. Spatial distribution was uneven while temporal distribution was poor
within the cluster. Larger parts of West Pokot and Baringo received between 110 - 140 percent
of the normal rainfall while most parts of Nyeri received between 50 - 70 percent of the normal
rainfall. Narok, Kajiado and Laikipia received above 90 percent of the normal rains in most
parts. Cessation was timely in Narok, Nyeri and Baringo between the 4th
week of December and
1st week of January 2015. However, cessation was earlier by two weeks in Kajiado, Laikipia,
West Pokot instead of the 4th week of December.
2.3.5 Current Shocks and Hazards
The current shocks and hazards contributing to food insecurity in the Agro-Pastoral cluster
include, outbreak of livestock diseases especially Foot and Mouth Disease (FMD) in Baringo,
West Pokot and Kajiado. Maize Lethal Necrotic Disease (MLND) was reported in Baringo and
Laikipia. Other hazards reported in this cluster were insecurity due to cattle rustling in Baringo
and West Pokot, human-wildlife conflicts in Laikipia and frost bites in Nyeri and Laikipia.
2.3.6 Impacts of Rainfall Performance, Shocks and Hazards
2.3.6.1 Crop Production
Most counties in the cluster are long rains dependent. Crop production in the area contributes to
30 percent of food and 40 percent income to the households. The major crops grown in the area
are maize, beans and Irish potatoes.
2.3.6.1.1 Rain Fed Crop Production
The area put under maize was 52 percent of LTA. Maize production was 1.15 million bags and is
a reduction to 58 percent of the LTA of 1.95 million bags (90kg), followed by a subsequent
decline in production by 41 percent of the LTA. The decline was attributed to fear of Maize
Lethal Necrosis (MLND) as most farmers opted to have a closed season for maize in favor of
other crops. Inadequate moisture at critical stages of germination and tasselling, poor choice of
seed and late distribution of subsidized seed were among other reasons cited. The area put under
beans and Irish potatoes marginally reduced but production significantly decreased to 42 and 98
percent below the LTA for beans and potatoes respectively.
Crops under irrigation are tomatoes, onions, kales and maize. There was no significant change in
the area put under irrigation for the crops except for maize which reduced by 43 percent.
However, production of tomatoes reduced by 65 percent compared to the LTA. The decline was
attributed to tuta absoluta pest. Maize production also reduced by 58.6 percent because of the
reduced hecterage that purposed to break the MLND cycle. There was an increase in production
of onions by 58.6 percent.

29
2.3.6.1.2 Maize stocks held in the cluster
There was a reduction of stocks at all levels, with the households holding 751,466 bags of maize
which is 50.5 percent below the long term average of 1,517,703 bags, traders held 187,735 bags
compared to 404,152 bags (46.4% of LTA), while millers had 52,837 bags compared to LTA of
161,705 bags (32.6 %). Stocks held are expected to last for one month.
2.3.6.2 Livestock Production
Pasture condition in the Pastoral and Agro-Pastoral livelihood zones is fair to poor and expected
to last for one month compared to 2 - 4 months normally. Browse is good to fair across all
livelihood zones in the cluster and is expected to last 2 - 3 months, which is normal. Livestock
body condition in pastoral livelihood zones is poor for cattle and sheep and good for goats and
camels. In the agro pastoral and mixed farming livelihood zones, livestock body condition was
good for all species. Birth rates for all species are normal in all livelihood zones in the cluster.
Milk production per household per day is 0.5 - 2 litres, three litres and 3 – 4 litres in the
pastoral, agro-pastoral and mixed farming livelihood zones respectively, which is normal.
Households are consuming 90 percent of milk produced. Milk prices increased from Ksh.20 to
Ksh.30 in the mixed farming livelihood zone and from Ksh.50 to Ksh.60 per litre for the agro
pastoral and pastoral livelihood zones. Tropical Livestock Unit (TLU) per household ranges
from 8 - 30 which is normal. Pastoral and agro pastoral livelihood zones are holding TLUs of 25
and 20 respectively. Common water sources include rivers, water pans, shallow wells and
boreholes, most of which have dried due to low recharge rates. Available water is expected to
last until the next one month.
Return trekking distances are 1 - 5 kilometers in the mixed and agro pastoral livelihood zone and
8 – 10 kilometers in the pastoral livelihood zones, which is normal at this season. Watering
frequency is daily in the Mixed and Agro-Pastoral livelihood zones. Cattle and goats were
watered after 2 – 4 days while camels were watered after 8 - 10 days. There were in and out
migrations from the pastoral livelihood zones which is normal. In West Pokot, migration was
along the Kenya/Uganda border and also towards Turkana. Movement of livestock in Kajiado
was towards Mara, Mau, lota and Nairobi.
Outbreak of notifiable diseases Food and Mouth Disease (FMD), lumpy skin (LSD), black
quarter, Contagious Bovine Pleuro Pneumonia (CBPP) and Anthrax in cattle and Peste des Petits
Ruminants (PPR), sheep and goat pox, Contagious Caprine Pleuro Pneumonia (CCPP) in sheep
and goats was reported in West Pokot, Narok, Kieni and Baringo. Vaccination against Foot
Mouth Disease was administered in November and December in (Narok County) and is on-going
in (West Pokot County).
2.3.6.3 Water and Sanitation
The major sources of water in the cluster are rivers, piped water systems, springs, boreholes,
shallow wells, lakes, swamps, streams, roof catchment and dams/pans. Recharge of the open
water sources was 60 - 90 percent in Baringo, West Pokot and Narok Counties and 30-50 percent
in Kieni, Laikipia and Kajiado counties. Distances to water sources were within the normal range
except in the pastoral zones. In the mixed farming, agro pastoral and marginal mixed farming
livelihood zones, they were less than three kilometres while in the pastoral zones, the distances

30
were 3-6 kilometres compared to the normal 4 - 8 kilometres. Waiting time at the source was
within the normal range of a maximum of 20 minutes except in the marginal mixed livelihood
zones of Kieni where it was about one hour compared to the normal 40 minutes due to
imbalanced water distribution hence deficits experienced in this zone.
The cost of a 20 litre water jerrican is within the normal range of Ksh. 2 - 5 in Baringo and
Narok counties as well as in the mixed farming livelihood zones of Laikipia and Kieni counties.
In the marginal mixed farming livelihood zones of Kieni, the price is normal at Ksh. 10.
However, the price has increased from Ksh. 2 normally to Ksh. 3 - 5 in the marginal mixed
farming zones of Laikipia County. Water consumption per person per day has remained within
the normal range of 12 - 20 litres per person per day with the exception of the pastoral zones of
Baringo, West Pokot and marginal mixed farming zones of Kieni where consumption is currently
at 7.5 - 12 compared to the normal 12 - 15 litres. In the mixed farming zones of Kieni, Laikipia,
West Pokot and Baringo, consumption is 20-30 litres. Latrine coverage is varies between 46
percent (Kajiado) and 98 percent (Kieni).
2.3.6.4 Markets and Trade
Market operations in the cluster were normal except for a few markets in Baringo and West
Pokot, which were closed due to quarantines imposed against Foot and Mouth outbreaks. The
prices of maize across the cluster
were above the long term average
except West Pokot and Narok where
their maize prices were Ksh. 26 and
Ksh 32 per kilogram respectively.
Goat prices across the cluster were
above the long term average and
ranged from Ksh. 2,400 in Baringo to
Ksh. 3,500 in Nyeri.
The terms of trade are above the long
term averages across all the
livelihood zones in the cluster with
exception of Baringo county where
the terms of trade are slightly below
the long term average. Households in Baringo are purchasing 56 kilogrammes of maize from the
sale of a goat compared to the long term average of 65 kilogrammes of maize as shown in Figure
2.11. Narok County has the most favorable terms of trade where the sale of a goat would
purchase 126 kilogrammes of maize compared to the long term average of 59 kilogrammes.
2.3.6.5 Health and Nutrition
3.5.1 Morbidity and mortality patterns
The most prevalent diseases among under-fives and the general population were disease of the
skin, upper respiratory infections, diarrhoea, malaria, eye infection and pneumonia. Baringo and
Laikipia counties reported eye infection while Kieni reported intestinal worms. There was an
increase in morbidity cases compared to last year in all counties with the exception of Laikipia

31
and Narok where there was a decline of diseases in children under five years old. Typhoid,
diarrhea, dysentery and suspected cases of measles increased in West Pokot County by 18, 48, 46
and 46 percent respectively in 2014 compared to 2013. There was no reported case of disease
outbreak across the cluster.
The crude and under five death rate across the cluster ranged between 0.03 /10,000 persons per
day to 0.24/10,000 persons per day and <0.034 /10,000 persons per day to 0.48/10000 persons
per day respectively. The rates were below alert thresholds of 1death per 10,000 persons per day
and 2 /10,000 persons per day respectively.
3.5.2 Immunization and Vitamin A supplementation
Fully Immunization Child (FIC) coverage is below the national target of 80 percent except Kieni
in Nyeri County. The coverage was between 65 – 75 percent across the cluster and 104 percent
in Kieni respectively. Similarly, vitamin A supplementation was below the national target of 80
percent across the cluster except Kieni and Laikipia with coverage of 81 and 89 percent
respectively. Narok and Baringo counties had coverage of 53 and 16 percent respectively. The
low coverage in Baringo was attributed sporadic insecurity in Baringo North and East Pokot sub
counties between August to December 2014.
3.5.3 Nutrition Status and Dietary Diversity
The percentage of
children at risk of
malnutrition by Mid
upper Arm
Circumference
(MUAC) <135mm
across the cluster are
below the LTA except
Baringo and West
Pokot counties that
are about average.
The MUAC trends are
generally stable in this
cluster as shown in
Figure 2.12. Household food consumption was normal in all livelihood zones at 3 - 4 meals a day
for mixed farming and 2 - 3 meals a day for pastoral and agro pastoral livelihood zones. The
meal frequency for under-fives remained between 3 - 4 meals per day and poor dietary diversity
with foods comprising mainly carbohydrates. Household food consumption scores compared to
December 2013 showed a general food security improvement across the cluster.
2.3.6.6 Education
There was a general increase in enrolment across the cluster. The enrolment of boys was slightly
higher than that of girls across the cluster with Narok, Laikipia and Kieni counties recording a
near gender parity in their enrolment data. The dropouts were generally low across the cluster
with the lowest at one percent being recorded in Narok and the highest at five percent in Kajiado.
The dropouts were mainly attributed to early pregnancies, early marriages, drive for casual jobs

32
due poverty at households among other factors across the cluster. The transition rate from ECDC
to primary schools were much higher compared to primary to secondary for all the counties due
to limited secondary schools within the cluster. All the counties has had transition rates from
primary to secondary above the national average of 70 percent except for Laikipia which had 65
percent. There was Home Grown School Meals Programme implemented within the cluster
though not in all public primary schools. The programme was in selected schools in the cluster
characterized with food insecurity and low educational participation. The HGSM programme is
said to have contributed to increased enrolments, attendance, completion rates and performance
among other factors.
2.3.7 Coping Mechanisms
The Coping strategy Index (CSI) for the agro pastoral cluster indicate that households were
engaging in consumption coping strategies less frequently in December 2014 compared to the
same period the previous years with an exception of Kajiado and Narok counties where they
were using the strategies more frequently. CSI for West Pokot, Baringo, Laikipia and Nyeri
(Kieni) counties was 21 in December 2014 compared to 25 in Dec 2013.
2.4 The Southeastern Marginal Agriculture Livelihood Cluster
2.4.1 Cluster Background
The cluster comprises of five counties namely,
Makueni, Kitui, Tharaka-Nithi, Meru (North) and
Embu (Mbeere). It covers an area of 47,348 square
kilometers with an estimated population of 3,032,460
persons (KNBS 2009). The cluster has two major
livelihood zones; Marginal Mixed Farming livelihood
zone representing 65 percent of the population, and
Mixed Farming livelihood zone representing 26
percent of the population (Figure 2.13). The main
sources of income for the cluster include; Crop
production which accounts for 40 percent of the total
household income, Livestock production accounting
for 35 percent and Employment at 25 percent.
2.4.2 Current Factors Affecting Food Security
Main factors affecting food security are poor
performance of the rains, poor quality pasture, low
livestock prices, resource based conflicts, use of
uncertified seeds, high food prices, diminishing water
sources and livestock diseases.

33
2.4.3 Cluster Food Security Situation
2.4.3.1 Current Food Security Situation
The current food insecurity phase classification is Non/minimal (IPC Phase 1) with an exception
to Kitui County and Marginal mixed livelihood zone of Mbeere, Meru North and Makueni
Counties which are Stressed (IPC Phase 2). Performance of the short rains was below normal
resulting in reduced maize production of 70 to 80 percent, compared to the long term average.
Market prices for cereals (maize) are currently on the rise. Maize prices range between Ksh. 28
to Ksh. 35 which is higher than the Long Term Average (LTA) of Ksh. 25 to 30. Meal frequency
has reduced to 1-2 meals per day in the Marginal Mixed Farming livelihood zone compared to
three meals normally. In Mixed Farming zones, consumption was within normal at 2-3 meals per
day. Pasture and browse were fair to good. Water consumption was at 10 to 20 liters per person
per day (lpppd) except in some pockets of marginal mixed farming zones of Kitui County which
recorded 10 liters pppd. The proportion of children at risk of malnutrition as measured by mid
upper arm circumference (MUAC < 135 mm) is stable at 5 to 10 which was below normal of 8
to 15 with an exception of Meru north recording 16 percent.
2.4.3.2 Food Security Phase Classification
The food insecurity phase
classification after the 2014
long rains assessment for
each livelihood zone was
minimal phase for the Rain
Fed Cropping areas in
Mbeere, Makueni and
Tharaka. However, the
Marginal Mixed Farming
Livelihood Zones remained at
“stressed” (Phase 2) except
for Makueni. The Short rains,
2014 food insecurity phase
classification for the cluster is
in Stressed (Phase 2) with
exception of Rain Fed and
Mixed Farming zones of Meru North, Marginal Mixed Farming zones of Tharaka , Mixed
Farming zones of Mbeere and Makueni all of which are at Non/Minimal (IPC Phase 1) as shown
in (Figure 2.14). The stability of the food security phase will be highly dependent on the
performance of the next rain season. Water consumption ranges was 10 to 20 liters per person
per day (pppd) except in some pockets of the marginal mixed farming zones of Kitui County
which registered below 10 liters pppd as compared 10 to 25 liters pppd in August 2014. Milk
availability improved at an average of 1-3 liters across all livelihood zones as compared to 0.25 -
1.5 liters in August, 2014. Distances to water sources increased by 20 to 30 Percent. The
percentage of children at risk of malnutrition rates remained the same as reported in August,
2014 except for Meru North Sub county which had 16 percent compared to 21percent in 2014.
The under-five mortality rate has remained below 1/10,000/ day.

34
2.4.4 Rainfall Performance
The onset of the short rains varied in different counties; in Makueni and Meru it was timely in
the first dekad of October while in Kitui and Embu it was late. In Tharaka Nithi there was a false
start in the second dekad of October that was followed by a dry period to the last dekad of the
month. The rains resumed in the first dekad of November followed by another dry period. Spatial
distribution was uneven while temporal distribution was poor. Embu County received between
50 and 75 percent of the normal. Larger parts of Makueni and Tharaka Nithi received between
50 and 70 percent of the normal while larger part of Meru received below 25 percent of the
normal. The cessation of the rains was earlier than normal across the cluster.
2.4.5 Current shocks and hazards
Current shocks and hazards include resource-based conflict in Meru, Tharaka Nithi and Embu,
illegal abstraction of rivers by upstream users in Tharaka Nithi and poor performance of short
rains. Livestock diseases included New Castle Disease, CCPP, Foot and Mouth Disease (FMD),
Lumpy Skin Disease (LSD).
2.4.6 Impacts of Rainfall Performance, Shocks and Hazards
2.4.6.1 Crop Production
The short rains are the main season for crop production accounting for about 70 percent of
annual production. The main crops grown are maize, green grams and cowpeas. The area under
maize reduced by about three percent of the LTA due to poor rainfall performance. The area
under sorghum and green grams increased by 10 and three percent of LTA following campaigns
on adoption of early maturing crops, drought tolerant crops and promotion of Gadam sorghum as
a cash crop (Table 2.1). Projected yields of 64 percent for maize, 50 percent for beans and
cowpeas respectively to the LTA was reported.
Table 2.1: Rain fed crop production Rain fed
Crop
Area planted
during 2014
Short rains
season(Ha)
Long Term
area (Ha)
2014 Short rains
season production (90
kg bags)
projected/Actual
Long Term Average
production during the
Short rains season
(90kg bags)
Maize 171,648 179,841 824,084 2,322,568
Sorghum 96,269 87,549 287,823 48,4474
Green Grams 81,743 79,043 246,678 56,3526
The total area under irrigation increased by 58 percent from 2,120 Ha to 3,359 Ha attributed to
establishment of irrigation schemes in some counties and adoption of green-house technology
especially for tomato production. The three main crops grown under irrigation are tomatoes,
kales and bananas covering an area of 454 hectares for tomatoes and kales, and 1,365 hectares
for bananas. Other crops grown under irrigation are paw paws and maize covering an area of 422
hectares and 570 hectares respectively.
Following the poor rainfall performance maize stocks held are 44 percent below the LTA. (Table
2.2) The stocks currently held by households are 14 percent of LTA while traders’ stocks are
about 20 percent higher than the LTA. The National Cereals and Produce Board (NCPB) are

35
currently holding about 76 percent of LTA. The stocks held by millers increased by 96 percent of
LTA. Available stocks are expected to last for 2-3 months compared to 4-7 months normally.
Table 2.2: Maize stocks held Maize stocks held
by
Quantities held currently
(90-kg bags)
Long Term Average quantities held (90-kg
bags)at similar time of the year
Households 35,014 242,764
Traders 131,594 109,300
Millers 29,220 14,900
NCPB 36,519 47,400
Total 232,347 414,364
2.4.6.2 Livestock Production
The body condition for cattle, goats and sheep ranges from good to fair. Pasture and browse
situation was fair in Mbeere, Makueni, Meru and Kitui and good in Tharaka. Available fodder
was supported by crop residues from the farms and is expected to last for 1-2 months in Mbeere
and Makueni, 2-4 months in Rain Fed livelihood zone in Meru and until the onset of the long
rains in Tharaka. The birth rates remain normal for all the livestock species. Milk is available but
the production is approximately 50 percent below normal. In Meru and Tharaka, production per
household ranged from 1-3 litres compared to 3-6 litres normally while in Mbeere, Kitui &
Makueni it ranged from 0.5- 1 liters compared to two liters normally. The price per liter in
Makueni and Mbeere was Ksh 40-50 up from Ksh.45-60, in Tharaka the farm gate price was
stable at Ksh.40 per litre while in Meru the price reduced from Ksh.60 to Ksh.45 in Rain Fed
livelihood zone.
Water for livestock is available in the normal sources and the frequency of watering is daily or
once in two days and the distances to water points are gradually increasing. In Tharaka,
abstraction of water upstream in the neighbouring county of Meru has led to low flow
downstream leading to inadequate supply. There was normal internal migration of livestock in
Mbeere to the hills of Kiangombe, Kanjiru and Kiambere and in Meru to Elat. Livestock
migration has been reported from Tana River County in to Kitui County through Ngomeni and
Tseikuru wards in Mwingi North, Endau ward in Kitui East, Mutha ward in Kitui South and Nuu
ward in Mwingi Central which are the normal migratory routes. Camels were reported to be
migrating from Isiolo to Meru. Confirmed sporadic cases of Foot and Mouth disease (FMD),
Lumpy Skin disease (LSD) were reported across the cluster. However, it’s only in sections of
Mbeere, Makueni and Meru North where a quarantine has been imposed. In Makueni 30 cattle
and 67 goats were reported to have died from Pestis de Pestis and Rift Valley Fever Disease.
2.4.6.3 Water and Sanitation
Major sources of water for domestic use are rivers, boreholes, pans/dams, rock catchment,
shallow wells, springs and piped water systems. Distances to water sources are normal at 1-5 km
except in the Marginal Mixed Farming livelihood zones of Meru North which are at 10-12 km
compared to 6-8 km normally. However households in Ukasi-Nguni ward (Kitui) was
experiencing severe water stress with households trekking 15km to 20km to Ukasi borehole.
Waiting time at the source is within the normal range of 30-60 minutes except in Mukuyuni and
Kalata areas of Makueni where it was five and four hours respectively due to breakdown of the

36
main water supply. The current water consumption is 10-25 liters pppd compared to the normal
25-30 litres, with the exception of the Marginal Mixed farming zone of Kitui at eight litres. The
cost of water is within the normal ranges across the livelihood of Ksh.3-5 per 20 liter jerican
except marginal mixed farming of Tharaka, Mbeere and marginal mixed farming of Meru North
where the cost ranged from Ksh.20-30. Households have not embraced fully the use of water
treatment methods and it stands at 10 percent. Latrine coverage ranges from 70-85 percent.
However, in Kitui, Tseikuru ward latrine coverage is at 30 percent.
2.4.6.4 Markets and Trade
The main markets operations in
the cluster continued without
disruptions. However Kibwezi
market (in Makueni) was under
quarantine due to Foot and Mouth
disease. The new ministerial
directive to package produce in
50 kilograms bags also led to
disruption of Laare and Mutuati
markets in Meru North. Maize
prices decreased between August
2014 and January 2015. The price
of maize was highest between
August to October for Meru
North and December for Mbeere compared to the cluster averages and prices in other Counties
(Figure 2.15). Kitui recorded the lowest maize prices for October 2014, November 2014 and
January 2015. The maize prices remained above the cluster averages except for Makueni,
Tharaka and Kitui in the months between August 2014 and January 2015
2.4.6.5 Health and Nutrition
2.4.6.5.1 Morbidity and mortality patterns
The morbidity prevalence among children under five years are Upper Respiratory Tract
Infections (URTIs), diarrhea, malaria, pneumonia and skin diseases. Prevalence of intestinal
worms was also reported in Meru North and Kitui. The major diseases among general population
include; URTI, clinical malaria, diarrhea, skin diseases, and Urinary Tract Infection (UTI).
Diarrhea cases increased in 2014 compared 2013 in Meru North and Makueni and this was
attributed to low adherence to water safety and poor hygienic practices.
2.4.6.5.2 Immunization and Vitamin A supplementation
Fully Immunized Child (FIC) coverage was below the national target of 80percent and varied
from 45.8 to 78 percent, with exceptional of Embu 88.7 percent. Routine Vitamin A
supplementation coverage for children six to 59 months was below the national target of 80
percent. The decline in coverage was attributed to documentation gaps across the counties and
cultural beliefs by communities in parts of Kitui whose faith don’t allow them to go to the health
facilities.

37
2.4.6.5.3 Nutrition Status and Dietary Diversity
The percentage of
children under five at
risk of malnutrition
based on MUAC less
than 135mm
remained stable. In
January 2015 MUAC
rates were above LTA
in Tharaka (Figure
2.16). Admissions to
the Integrated
Management of Acute
Malnutrition (IMAM)
programme in Kitui
increased. Current
meal frequency is between one to three meals per day as compared to the normal of three to four
meals per day. This can be attributed to poor yield and limited sources of income. The meals had
low dietary diversity of 2-3 food groups consisting of cereals, pulses and vegetables. The diet
consumed for the 6-23 months consists of mainly starches, for example maize meal porridge,
mashed potatoes, pumpkins and bananas.
2.4.6.6 Education
Increased enrolment was recorded in all counties in both primary and early childhood
development centers (ECDCs) except Kitui, which recorded a decline in enrolment of four
percent. Dropout rates were minimal across the counties and the cases recorded are attributed to
child labour (search for casual jobs) to cushion family incomes, early marriages, unwanted
pregnancies, and other more cherished cultural roles within different communities. The transition
rates were higher from ECDC to primary in the range of 80 to 99 percent with Kitui recording
the highest within the cluster. Transition from primary to secondary was in the range of 60 to 88
percent with Makueni recording the highest in the cluster. The Government supported Home
Grown School Meals Programme is being implemented across the cluster except Meru North. It
is reported that the school meals programme has contributed to increased enrolment, attendance,
retention, completion rates and improved performance.
2.4.7 Coping Mechanisms
The coping strategy index was 23 in December 2014 compared to 20 (Sep 2014) and 17 (Dec
2013) which implied they were employing consumption-based coping strategies more frequently.
Some strategies included reduction of meals in quantity and quality, increased engagement in
casual labour, charcoal burning, borrowing, sale of firewood and consumption of less preferred
but cheaper foods.

38
2.5 The Coastal Marginal Agricultural Livelihood Cluster
2.5.1 Cluster Background
The cluster is located in the south most
tip of Kenya. It covers an estimated
area of about 47,861 square
kilometers, with a population of
2,182,554 persons, and consists of
Kwale, Kilifi, Lamu and Taita Taveta
Counties. Major livelihood zones in
the cluster include; Mixed Farming (60
percent of population),
Trade/Business/Formal
employment/Casual labour (21
percent), Marginal Mixed Farming (11
percent) and others 8 percent) Figure
2.17. Major source of income for the
livelihoods are livestock production
representing 40 percent of total
household income, crop production and waged labour accounting for 30 percent respectively. .
2.5.2 Factors Affecting Food Security
The main factors affecting food security are poor performance of the short rains especially in
Taita Taveta, high food prices, insecurity that affected markets especially in Lamu, poor post-
harvest management practices, human wildlife conflict, collapse of the tourism industry reducing
remittances for rural households.
2.5.3 Cluster Food Security Situation
2.5.3.1 Current Food Security Situation
The current food insecurity phase classification for the cluster is Non/Minimal (IPC Phase 1)
with an exception of ranching livelihoods in Kilifi, Parts of Kwale boardering Taita Taveta and
Taita Taveta Counties which are Stressed (IPC Phase 2).The performance of the short rains was
normal however, both temporal and spatial distribution was poor resulting in maize production
deficit of 35 to 45 percent, compared to the long term average. Maize prices in the cluster are on
an increasing trend owing to minimal household stocks and increasing dependency on the
markets with prices ranging from Ksh.30 to Ksh.35 in comparison to a range of Ksh.25 to 30.
Households in the cluster were on average consuming one to two meals per day in comparison to
the normal three. Rangeland conditions, water, pasture and browse, were fair to good and were
favourably comparable to normal across the cluster. Water consumption is at 15 to 20 litres per
person per day with an exception of Lamu and Kilifi counties which records 10 to 15 litres per
person per day. The current terms of trade have improved with households purchasing 80 to 110
kilograms of maize from sale of a goat as of January, 2015 in comparison to a normal range of
60 to 80.The proportion of children at risk of malnutrition as measured by mid upper arm
circumference (MUAC < 135 mm) is stable and slightly below the normal LTA. Currently the

39
normal insurance coping mechanisms are being employed and there are no unusual disease
outbreaks and mortalities across the cluster
2.5.3.2 Food Security Phase Classification
The food security
situation has slightly
improved compared to
the long rains of 2014,
the cluster was in
minimal Phase
excluding Taita Taveta
and some pockets of
Kwale and Kilifi which
were in Stressed phase
(IPC Phase 2), currently
the cluster remains in
the non/Minimal (IPC
Phase 1) with an
exception of parts of Kwale boardering Taita Taveta, Parts of Kilifi and Taita Taveta Counties
which are Stressed (IPC Phase 2) as shown in (Figure 2.18). Water consumption remained
favourably comparable at 15 to 20 litres per person per day with an exception of Lamu and Kilifi
counties which records 10 to 15 litres per person per day in comparison to August which was 17
to 30 litres per person per day. Livestock productivity has remained stable as evidenced by milk
availability by an average of one to three litres across all livelihood zones as compared to
average of one to two litres in August, 2014. Milk prices have marginally increased by about 30
percent as compared to August, 2014. In January of 2015, one medium sized goat was exchanged
for 80 to 110kilograms of maize compared to 70 to 90 kilograms in August, 2014. Distances to
water sources across the cluster maintained a stable trend of one to four kilometres .The
proportion of children ‘at risk’ (MUAC<135mm) of malnutrition in January 2015 has remained
within seasonal norms. The under-five mortality rate has remained below 1/10,000/ day.
2.5.4 Rainfall Performance
The onset of the short rains was timely in the second week of October across the cluster except
for Kilifi where the short rains were characterized by a false start in the first dekad of October
followed by a dry spell until the first dekad of November and peaked in the first dekad of
December. Larger parts of Taita Taveta and Lamu received between 50 and 90 percent of the
normal. Kwale and part of Kilifi County received above 100 percent of the normal while and
others parts of Kilifi receiving below 75 percent, the county had some parts receiving between
200 and 350 percent of the normal. Spatial distribution was uneven while temporal distribution
was poor within the clusterr. The cluster experienced early cessation except for Lamu where
cessation was normal in the last week of December. The rest had early cessation in the first week
of December.
2.5.5 Other Shocks and hazards
The Coastal Marginal Agricultural cluster has faced insecurity issues that have resulted in a
decline in tourism leading to loss of jobs and remittances to households. Others include

40
insufficient recharge of water sources for both livestock and humans due to poor short rains
performance across the cluster, human-wildlife conflict, deteriorating condition of pasture across
the cluster, human and livestock disease outbreaks, increased cases of diarrhea and malaria; and
low food stocks at household level in Taita Taveta.
2.5.6 Impact of Rainfall performance, Shocks and Hazards
2.5.6.1 Crop production The long rains are the main season for crop production in the cluster. Crop production
contributes 10 – 20 percent of cash income in the cluster. Main crops grown are maize, cow peas
and green grams. Overall area under crops increased by 11 percent of the LTA with increase in
area for maize being 26 percent, cowpeas 96 percent and green grams at 77 percent. Production
declined by 35, 14 and 19 percent for maize, cowpeas and green grams respectively.Other food
crops grown are beans and cassava covering an area of 731 and 2532 hectares respectively.
Production realized from beans and cassava was 8,310 bags and 45,589 metric tons respectively.
The main crops grown under irrigation include tomato, kales and amaranthus. The area under
irrigation increased by 14, 60 and 10 percent of the LTA for tomato, kales and amaranthus
respectively. Production was 60 percent of LTA for tomatoes and 149 percent of LTA for kales
and 201 percent for amarunthus. The overall maize stocks in the cluster have increased by eight
percent of LTA, attributed to good performance of the Long rains. Households and NCPB are
holding 25 and 10 percent more than their LTA stocks, while traders and millers have 80 and 88
percent of their LTA stocks
2.5.6.2 Livestock Production
Pasture condition was fair to poor across the livelihood zones in the cluster with the exceptions
of Kwale where pasture condition was good. This is expected to last for one to two months
instead of two to three months. Browse condition is fair across the cluster and expected to last for
next two months. Crop residues (maize stovers) were being utilized in Taita Taveta as alternative
livestock feeds. Body condition of cattle, sheep and goat is good to fair across the cluster and is
expected to last for two to three months. Milk availability ranges from one liter to three liters per
day with eight liters being produced by dairy herd in Taita Taveta. Household milk consumption
ranges from half a liter to two liters per day. In Taita Taveta, Kilifi and Lamu Counties, milk was
sold at Ksh.35-50 per liter compared to normal of Ksh.30 while in Kwale, milk prices was
Ksh.60 per liter compared to normal of Ksh.50 per liter. Milk prices in Lamu, Fishing/Mangrove
livelihood zone and Kwale especially in Msambweni, Lungalunga and Matuga sub counties was
highest ranging at Ksh.60-80 per liter compared to normal of Ksh.50 per liter. Water access for
livestock in the cluster remained normal.
Low livestock migrations observed in Lamu from Tana River and Garissa Counties due to
perceived insecurity and curfew while in Taita Taveta, in migration of livestock was reported
especially in the Mixed Farming (Crop/Livestock) livelihood zones from Kajaido and Tana River
Counties through Mackinon along Taita ranches bordering Kwale. Foot and Mouth Disease
outbreak was reported in Galana Ranch in Kilifi County. Other diseases such as Contagious
Caprine Pleuropneumonia, Newcastle Disease, Fowl Coryza, Fowl Pox, Coccidios
Trypanosomiasis, Sheep and Goat pox, Contagious Bovine Pleuropneumonia, Anaplasmosis and

41
worm infestations have been reported across the cluster. Preventive measures, vaccination and
diseases surveillance have been on going.
2.5.6.3 Water and Sanitation
The main sources of domestic water were boreholes, springs, pans/dams, shallow wells, piped
water, roof and rock catchments across the cluster. Djabias are reliable water sources in Lamu.
Open water sources were recharged to 50-70 percent of their capacity. About 50 percent of pans
in Lamu, Kilifi and Taita Taveta have dried up and the remaining pans are expected to last for
one month. However, over 70 percent of pans in Kwale have water expected to last for between
two to three months. Distances to domestic water sources in the Mixed and Marginal Mixed
zones of Lamu and Mixed farming (food crop, horticulture and Dairy, irrigated) zones of Taita
Taveta range from 0.5km – 1km while in other parts of the cluster, distance range from 1-2km.
However, Mwenza Mwenye, Vitsangalaweni, Mteza and Kifusini areas in Kwale County,
households are trekking for 4 – 6 km to fetch water. Kiunga in Lamu is relying on water trucking
as the nearest water source is 15 km away. Waiting time at water sources was between 10 to 30
minutes across the cluster. Bura, Kasigau, Marungu and Ngolia areas in Kwale, households have
to wait for up to one hour while Mwakitau in Taita Taveta, it takes up to six hours to collect
water.
Cost of water ranges between one to five shillings per jerry can across the cluster. However, in
the fishing and mangrove livelihood zone of Lamu and Gongoni, Marereni, Mryachakwe and
Mrima wa Ndege in Kilifi, water cost Ksh. 10 - 20 per 20 liters jerry can. Domestic water
consumption ranges from 10 to 20 liters per person per day across the cluster. Water treatment at
household level is below 30 percent mainly either by boiling or use of water treatment chemicals
though many households cannot afford to buy treatment chemicals. Water treatment chemicals
are available at household level in Kilifi although they are largely not acceptable because of the
smell and taste. Latrine coverage across the cluster ranges between 50 to 76 percent. It was
noticed that some of the villages such as Mteza and Kifusini in Mwereni have no a single toilet.
Though no water borne disease outbreak has been reported, few cases of Malaria, Bilharzia and
Diarrhea have been reported in most part of the cluster. Main source of water contamination is
open defecation and sharing of same sources of water with livestock and wildlife.
2.5.6.4 Markets and Trade
The main markets in the cluster were;
Mpeketoni, Witu, Hindi and Mokowe
while in the fishing and mangrove
livelihood, are Faza and Kiunga.
Wundanyi, Mwatate, Voi, Chumvini
and Taveta. Bamba, Guru Guru,
Mariakani, Kanagoni and Kayafungo
while those for food include Kilifi,
Mtwapa, Kaloleni, Mariakani,
Malindi and Gongoni Samburu,
Malomani, Vigurungani,
Mwakijembe, Kinango, Taru and
Mwangulu. No Market disruptions

42
were noted. Demand is high for the main dietary items for the households.
The price of maize in the cluster ranged from Ksh.31 per kilogram in Lamu County to Ksh.46
per kilogram in Taita Taveta. Prices were on a downward trend in August and September, 2014
and picked again in December and January 2015 (Figure 2.19). Except for Lamu County, maize
prices within the rest of cluster remained above LTA. Goat prices across all the counties in the
cluster in December 2013 ranged between Ksh.2,036 in Kilifi and Ksh.3,500 in Taita Taveta
County. The trend for goat price from January to December was marginal increase across the
cluster with prices fluctuating between Ksh.2,069 in August 2014 in to a maximum of Ksh.3,500
in January
2.5.6.5 Health and Nutrition
Morbidity patterns for both the under-fives and the general population were similar across the
cluster with upper respiratory tract infections (URTI), diarrhea, skin infections, clinical malaria
and pneumonia reported as the most prevalent diseases. Malaria and diarrheal diseases increased
in Kwale, Kilifi and Lamu attributed to more mosquito breeding sites, low usage of bed nets and
low latrine coverage. 2014 had more diarrhea cases compared to 2013 due to water shortages and
inadequate water treatment tablets. A measles outbreak was reported in Kiwandani in Kilifi and
four cases were confirmed. There was a confirmed case of Rift valley fever in Ramada in
Malindi. Mortality information for Kilifi and TaitaTaveta County showed the under-five Crude
Mortality rates was 0.048 and 0.13/10,000 persons /day respectively and were below the alert
thresholds.
Fully immunized
child coverage was
38, 77, 81 and 82.9
percent in Lamu,
Kilifi, Kwale and
TaitaTaveta
respectively.
Coverage
improved
compared to 2013
but still below the
national target of
80 percent. Routine
Vitamin A supplementation coverage for children aged six to 59 months was below the national
target though higher than 2013. Improved coverage is attributed to Malezi Bora activities and
integrated outreach services. The percentage of children under-fives at risk of malnutrition
(MUAC˂135mm) across cluster was low and stable (Figure 2.20).
Food consumption across the cluster reduced to between one to two meals per day in the Food
Cropping; Marginal Mixed and Livestock livelihood zones and two to three meals per day in the
Mixed and Cash Crop livelihood zones. The meals in the Livelihood zones comprise of three to
four food groups mainly cereals, pulses and vegetables except in the Livestock farming zone
where they take no vegetables and reduced quantities of protein. Admission of underweight

43
children and those admitted under supplementary feeding program (SFP) has shown a stable
trend than admissions of 2013.
2.5.6.6 Education
There was a slight increase of 0.1 to 1.9 percent in enrolment between term two and three 2014
in the cluster except for Taita Taveta. Even though there were more boys than girls across the
cluster, Kwale and Lamu had almost near gender parity with a ratio of 51: 49 of boys to girls
respectively. There was an improvement in attendance in term three with Taita Taveta recording
the highest percent. In general the dropout rates were minimal in all the Counties within the
cluster, the isolated cases were attributed to early marriage, unwanted pregnancies, rush for
casual jobs to cushion family income among other factors. Transition rates from ECDC to
primary were generally high in the range of 90 to 100 percent while from primary to secondary
was in the range of 30 to 85 percent. Lamu sub-county had the lowest transition rate of 30
percent (Primary to secondary) which is below the national average of 74 percent attributed to
limited secondary schools within the County. The Home Grown School Meals Programme is
implemented in all the Counties across the cluster. School Meals Programme is also provided by
Njaa Marufuku Kenya (NMK) a project of Ministry of Agriculture to selected four schools per
sub-county across the cluster.
2.5.7 Coping Mechanisms
The mean coping strategy score across the cluster in the month of December 2014 was 18, as
compared to 13 and 15 in September 2014 and December 2013 respectively. Households were
employing consumption related coping strategies more often compared to the same period in the
previous year. The common insurance coping strategies employed by households across the
cluster included reduction in number and meal rations, skipping of meals and consumption of
less preferred foods.

44
3.0 Food Security Prognosis
3.1 Prognosis Assumptions
The food security outcomes in the next six months (March to August 2015) will be defined by
several assumptions that mainly include agro climatic, food price assumptions, livelihood
assumptions, and humanitarian assumptions. These include but are not limited to the following
assumptions.
The March to May long rains are likely to have a late onset, be near average in cumulative
amounts and have erratic distribution both in space and time.
Hotter than normal conditions, are likely during the January – March period along the
Eastern Horn of Africa. Heat waves and dust storms likely to be more, especially in the
northern parts of the country.
Rangeland resources are expected to deteriorate faster than normal during the January to
March dry season, due to the below normal short rains the previous season.
Continued importation of maize from Uganda and Tanzania is expected through June. Maize
prices are expected to marginally increase from January through June though ample supplies
will ensure price increases are not unseasonable or particularly large.
Fuel prices are expected to continue decreasing through April, driven by the expected
continued fall in international crude oil prices. Declining fuel prices are expected to drive
transportation and energy costs down, eventually further reducing the consumer inflation
rate. Prices of a broad range of products are likely to fall, increasing household purchasing
power.
Casual labor opportunities and wages in marginal agricultural areas is expected to marginally
increase in early March as households begin land preparation and planting for the 2015 long
rains.
Humanitarian assistance by the national government, county governments, and other
agencies is expected to increase and widen in scope between January and June as agencies
respond to increasing needs.
3.2 Food and Nutrition Security through August 2015
The higher than average land surface temperatures expected to prevail through end of March will
increase the rate of depletion of rangeland resources in the pastoral and agro pastoral areas. Due
to the declining forage and water availability, livestock productivity is set to continue declining
through April as livestock health deteriorates. With the livestock prices expected to decline
through April, a combination of decline in livestock income and increase in cereal prices is likely
to result in decline in livestock to cereal terms of trade, further limiting household food access.
Decreasing water availability will likely result in increased water prices and further constraint
the household purchasing power. Recurrent outbreaks of contagious livestock diseases with
increased clustering of weakened livestock around water points, and conflicts over grazing
resources are likely to be escalated. Households are likely to use poor quality or contaminated
water, resulting in increased disease incidence, and subsequently, poor food utilization and an
increasing number of malnutrition cases through March. With less income, household food

45
consumption will be reduced. Though majority of households will remain Stressed (IPC Phase
2), except for areas currently in Crisis, more poor pastoral households in parts of Wajir,
Turkana, and Garissa are likely to slide to crisis by March. Nonetheless, in the marginal
agricultural areas, households are expected to remain in stressed (IPC Phase 2) through March
(until onset of the long rains).
The 2015 long rains have been forecasted to be near-normal in cumulative amount, with a late
onset. This is likely to bring moderate relief to households from April onwards. The long rains
will lead to regeneration of pasture, browse, and recharge water points to support kidding,
lambing, and calving. Livestock will likely return to the wet season grazing areas. Livestock
body conditions, milk availability, and livestock prices will most likely track the availability of
pasture and browse, decrease through March and increasing from April through June. Household
food access will track livestock prices, decreasing through April and increasing from May
through June. Importantly though, households’ recovery may be hampered by successive
previous season failures, which could require more than one good season for substantial
recovery. Through August, households are expected to have improved food security conditions,
and be in stressed (IPC Phase 2), including those who were previously in crisis (IPC Phase 3).
However, if the 2015 long rains are significantly below normal and poorly distributed in space
and time, food security conditions are likely to deepen both in the pastoral and marginal
agricultural areas, with possibilities of more households especially those in the stressed (IPC
Phase 2), getting in to the crisis (IPC Phase 3), through August 2015. The importance of
monitoring closely the performance of the coming long rains cannot be overemphasized, as it
will be key in determining how food security outcomes evolves over the next six months.

46
4.0 Proposed Sectoral Interventions
4.1 Agriculture Sector: Priority Interventions March 2015 – August 2015
Frequent erratic and poor performance of the rains in the ASAL areas is largely responsible for
low agricultural production. The efforts of different organizations and agencies have been to
secure the areas for a more sustained productivity within the fragile ecosystem and low rainfall
amounts. A more sustainable way to improve productivity in the areas of the ASAL counties is
to put resources into irrigation activities. The need has been identified within the County
Integrated Development Plans (CIDPs) but will take time to be realized. In the meantime,
provision of seeds and some inputs and a clear pest management strategy will be necessary. The
few interventions identified for the coming season include the following: Intervention Counties Cost in Ksh (M)
Upscale provision of subsidized inputs Laikipia 144
Post- Harvest management, management of the
Maize Lethal Necrosis Disease (MNLD),
Baringo, Narok, West Pokot,
Tana River, Isiolo, Wajir
10
Promotion of Traditional High Value Crops and
drought tolerant crop seeds
Kilifi, Lamu, Kwale, Taita
Taveta, Kajiado, Narok, West
Pokot, Makueni, Embu, Garissa,
Isiolo, Tana River, Wajir
281
Promote on-farm water harvesting Kilifi, Taita-Taveta,Tharaka 72
Up scaling of water harvesting for crop
production(water pans)
Makueni, Kitui 70
Post harvesting management Tharaka 21
Total 598
4.2 Livestock Sector: Priority interventions March 2015 – August 2015
Within the pastoral areas, livestock production is the main occupation that support livelihoods.
The current short rains did not particularly perform well. There was normal onset, but poor
temporal and spatial distribution. The resultant effect was very poor availability of pastures and
browse in most areas immediately after cessation. Livestock migrations have been witnessed in
most counties but only within normal dry season grazing areas. There are chronic issues in the
ASAL areas that have led to poor rangeland management and are always aggravated by poor
seasonal rainfall performances. As a result of the dry conditions prevailing, water availability is
deteriorating with strategic boreholes also experiencing low yield and thus making it difficult to
support livestock activities. It is expected that the long rains will be near average and hopefully
reduce the pressure on the little pastures available. The assessment recommends a number of
measures to be undertaken to mitigate on possibilities of extreme condition. These include the
following: Intervention Counties Cost in
Ksh (M)
Livestock vaccination and disease surveillance Narok, Baringo, Kajiado , West
Pokot,Nyeri, Kilifi, Kwale ,Taita-
Taveta, Lamu, Turkana,Samburu,
Garissa, Wajir
142
Reseeding of grazing areas Baringo, West Pokot, Kwale, Taita-
Taveta, Lamu
15

47
Livestock supplementary feeding Turkana,Marsabit, Wajir 60
Destocking of Livestock Turkana, Marsabit, Girassa, Tana
River, Wajir
95
Maintenance of boreholes for livestock Wajir 4
Livestock vaccination against FMD, LSD, RVF, PPR Meru County, Mbeere,Makueni 6
Total 322
4.3 Water Sector: Priority interventions March 2015 – August 2015
The open water sources were not sufficiently recharged to sustainable capacity in areas that
received below normal short rains. As a result, trekking distances and unit cost of water have
increased in several parts of the pastoral, agro pastoral and marginal mixed farming livelihoods.
Pressure has begun building up on permanent water sources, such as boreholes and shallow
wells. Furthermore, quality of available water in the unprotected sources including pans and
dams is generally poor suggesting appreciable contamination. As a result, water consumption per
person per day has reduced and for some households are below recommended thresholds.
Consequently, in some of the most affected areas, water trucking has started as an immediate
measure. However, this is very costly and not sustainable and targeting is nonexistent. There is
need to invest in medium to long term sustainable development of water structures that would
ensure continuous availability of water to vulnerable households. In preparation for the
upcoming long rains season there is also need to develop and rehabilitate existing water
structures and desiltation of pans and dams. The recommended interventions in water sector
include the following: Intervention Counties Cost in Ksh
(M)
Fuel subsidy for community boreholes, Kajiado, Baringo, Laikipia, Kilifi, Wajir 16
Community water trucking and Water treatment
Chemicals
Baringo, Kilifi, Isiolo, Tana River, Wajir,
Igembe north,Makueni
90
Water trucking for schools Turkana,Marsabit,Samburu 15
Provision of water tanks Baringo, Narok, West Pokot, Nyeri,
Makueni/Mbeere/Tharaka N &S
/Kitui/Igembe North
45
Replacement of pumping equipment, rehabilitation of
pipelines
Kilifi, Kwale , Lamu 15
Provision of water treatment at household level Turkana,Marsabit,Samburu 3
Piped water supply system extension Kitui/Meru North/Embu/Tharaka 15
Repair of broken down boreholes in strategic grazing
areas
Igembe North, Tharaka North, 5
Total 204
4.4 Health and Nutrition Sector: Priority interventions, March 2015 – August 2015
The health and nutrition situation in the ASAL areas remains of concern especially in the
northwest and northeast cluster and requires continuous support. Nutrition specific interventions
- High impact interventions (HINI) include integrated of management of acute malnutrition,
immunization and vitamin supplementation and promoting of appropriate care and feeding

48
practices in addition to proper hygiene and sanitation practices, these interventions urgently need
to continue and will help reduce the high acute malnutrition rates. The negative impacts of the
poor performance of the season on food security outcomes has also affected the health and
nutrition situation of the population, therefore nutrition sensitive interventions will also help to
mitigate further deterioration in areas vulnerable to food insecurity. Details of the interventions
can be found in the table below:
Intervention Counties Cost in
Ksh (M)
Intensify Active case finding
and outreaches
Baringo, Isiolo,
Laikipia,Meru,Samburu,Tana
river,Turkana,Wajir
80.4
Water Hygiene and Sanitation Interventions Baringo,Meru,Turkana 4.1
Intensify HiNi Intervention including intensify IMAM,
Vitamin A supplementation and deworming
Baringo,Kilifi,Kitui,Lamu,Marsabit,
Meru,Turkana,Garissa,Isiolo,Laikipia,
Mandera.
212.8
IYCN Intervention including mother to mother support
group
Makueni,Kitui 27.5
Strengthen Documentation Makueni 0.5
Strengthen disease surveillance Meru 0.066
Total 325.3
4.5 Education: Priority interventions, March 2015 – August 2015
The poor performance of the short rains has led to low access of food in the households. There is
a notable increase of pupils attending school and enrollment for the Early Childhood
Development Centers (ECD) increased especially in Pastoral North West cluster. There is need
to up scale the home grown school meals Programmes since there are schools that were not
benefiting but are in need coupled with the increase with the pupils population.
There is also an increased need of water supply across the clusters and water trucking
interventions are ongoing for schools. There is an urgent need to provide water storage facilities
for the affected schools to enable them have reservoir for the supplied water. The following
interventions are therefore proposed for education sector: Intervention Counties Cost in Ksh
(M)
Up scaling Home Grown School Meals Program Kilifi ,Kwale, Taita-Taveta,
Lamu,Tharaka
157
Provision of water storage tanks Kilifi, Turkana,Samburu,Marsabit,
Tharaka, Mbeere
48
Supplementary feeding ECD and HGSMP Turkana,Samburu,Marsabit 80
Provision of water to schools Isiolo, Wajir 20
School fees and food for fees Wajir, Garissa 8
Expanded school meals program Mbeere, Makueni, Kitui, Meru North,
Tharaka North and south
60
Total 373

49
4.6 Food Assistance Sector: Priority interventions, March 2015 – August 2015
There is need to augment resilience building interventions through appropriate food assistance
transfer modalities along other multi sectoral non-food interventions so as to improve the
nutritional status of vulnerable households and prevent further engagement of undesirable or
distress coping strategies. The following table shows the locations and populations that are in
immediate need of food assistance, until August 2015: County Total County
Population
Population affected
after the 2014 long
rains
March 2015 – August 2015
% of population
that is in need of
food assistance
Number of people
requiring food
assistance
Turkana 539,264 157,000 25 136,500
Wajir 619,220 150,200 29 179,900
Mandera 337,800 153,800 47 157,600
Garissa 504,391 133,400 32 158,900
Marsabit 291,166 86,000 34 100,100
Samburu 223,947 72,300 37 83,500
Laikipia 399,227 16,000 9 36,400
West Pokot 512,690 56,000 9 46,800
Tana River 240,075 42,500 12 29,800
Isiolo 143,294 64,500 55 78,800
Kajiado 687,312 0 2 10,600
Baringo 555,561 72,600 11 59,600
Narok 576,388 0 2 10,800
Subtotal Pastoral 5,630,335 1,004,300 19 1,089,300
Makueni 884,527 28,100 2 21,900
Kwale 649,931 82,600 10 64,900
Kilifi 1,109,735 75,500 3 35,900
Kitui 1,012,709 169,600 18 179,300
Taita Taveta 284,657 62,300 24 67,100
Mbeere 219,220 14,600 15 32,900
Tharaka 130,098 16,300 20 26,000
Meru North 775,982 39,400 7 56,200
Kieni 324,659 17,600 20 35,200
Lamu 101,539 0 3 2,800
Marginal Agricultural 5,493,057 506,000 10 522,200
Total 11,123,392 1,510, 300 14 1,611,500

50
Annex 1: Food Security Phase Classification Seasonal Trends, 2011 - 2014