Changing Pattern of Public Expenditure on Health in India: Issues ...

Government Health Expenditure in India: A Benchmark Study
Undertaken for the MacArthur Foundation, India
by
Economic Research Foundation
New Delhi
August 2006
2
I. Introduction
It is well known that health expenditure in India is dominated by private spending.
To a large extent this is a reflection of the inadequate public spending that has been a
constant if unfortunate feature of Indian development in the past half century. This is
particularly unfortunate because of the large positive externalities associated with health
spending, which make health spending a clear merit good. The greater reliance on private
delivery of health infrastructure and health services therefore means that overall these
will be socially underprovided by private agents, and also deny adequate access to the
poor. This in turn has adverse outcomes not only for the affected population but for
society as a whole. It adversely affects current social welfare and labour productivity, and
of course harms future growth and development prospects.
This is why the perceptions that government spending on health has been further
undermined during the period of economic liberalisation since the early 1990s create
concern, and need to be investigated. This study seeks to examine the actual pattern of
government spending on health and related areas (particularly, family welfare and child
development) by both central and state governments. In this section, the theoretical
arguments for public intervention and need for public expenditures in health are
discussed, and the international experience in this regard is considered. In the following
section, the broad patterns of aggregate health spending in India are analysed, along with
the shares of public and private expenditure and the significance of health spending in
household budgets. The third section contains an analysis of central government budgets
on health, family welfare and child development over the period 1993-94 to 2003-04. The
fourth section takes up the health budgets of state governments, with special attention to
patterns in 15 major states. The fifth section considers some of the implications for health
outcomes – not only life expectancy, infant mortality and similar indicators, but also
evidence on morbidity. Some of the recently released results of NFHS-3 for 5 states are
considered in relation to the evidence on government health expenditure in these states.
The final section draws some preliminary conclusions and suggests areas of future
3
research and specific question that merit more detailed investigation in the basis of these
conclusions.
The theoretical case for public expenditure on health
There is a consensus among social scientists that health care is different from
other goods and services, because of greater likelihood of “market failure”. The two main
characteristics of health care which lead to market failure and thus necessitate state
intervention are the presence of externalities and information asymmetries.
An externality results when an action of an agent has an effect not only upon the
agent but also upon others. If a good or service not only benefits those who purchase
these but others as well, then there is said to be a positive externality in its consumption.
Conversely, a particular action of a producer may generate a negative externality, such as
pollution. In the case of positive externalities, the operation of market forces alone would
lead to sub-optimal consumption and production of the relevant good or service. This
necessitates state intervention in order to ensure that sufficient resources are directed to
the production of such goods or services, which in turn would result in an increase in the
society’s welfare.
It has been argued that such externalities are less evident for general health care
services such as physician and hospital care, and greater in the area broadly known as
“public health”. The latter relate to interventions targeted at overall conditions of
nutrition and sanitation that determine health, as well as communicable diseases which
are passed either directly among humans or indirectly through the physical environment.
An action taken by one person (e.g. ensuring clean, safe water, immunizing oneself
against, or seeking treatment for, a communicable disease) generates direct health
benefits for other individuals, through reduced rates of disease. Clearly, purely market-
oriented or individually based activities would ignore the wider positive external effects,
and therefore yield less than socially optimal levels of such activity. However, even
general health care services that apparently affect only individuals have positive
externalities, not only because of the social costs of morbidity, but because inequalities in
4
health care create other social concerns. These positive externalities make government
intervention essential. Such intervention can take the form of price subsidies to encourage
or spread the consumption of health care services, or direct public provision of such
services.
Asymmetric information reflects any situation in which one party to any contract
or exchange has access to some information that is not known to the other party. Such
information asymmetries, primarily between the service provider and patient, pervade the
health sector and cause market failure in both health care and health care insurance
markets. For example, in any society, patients know best how improvements in the health
affects their own well-being, while providers have better information regarding both the
causes of ill-health and the effectiveness of alternative health care services in restoring
health or preventing the further deterioration of health. There are also problems of
“incentive incompatibility”, in which the interests of the patient and the health care
provider need not coincide. These point to the need for government intervention in the
form of regulation. Such regulation can take the form of licensing of health care
providers, limits on advertising, insistence on some professional norms that prohibit low
quality, etc. Such regulation has to ensure balance between the need to increase welfare
by improving or ensuring quality, and the welfare reducing effects of inadvertently
granting monopoly powers to providers.
Therefore from both the efficiency and equity grounds there, is no alternative to
the public provision of health care. Even for the success of an insurance system based on
private provision, increased public health spending and reforming of public health
facilities are necessary. This is what makes the theoretical case for health expenditure by
the government.
The international experience
Health expenditure is highly unequal across the globe. As is to be expected, the
developed countries spend the most on health per person. OECD countries accounted for
less than 20 per cent of the world's population in the year 2000 but were responsible for

5
almost 90 per cent of the world's health spending. Therefore 80 per cent of world’s
population spent only 10 per cent of the total expenditure on health. This includes people
in the Asia-Pacific as well as African and Latin American countries. Africa accounts for
about 25 per cent of the global burden of disease but only about 2 per cent of global
health spending. (World Health Report, 2003).
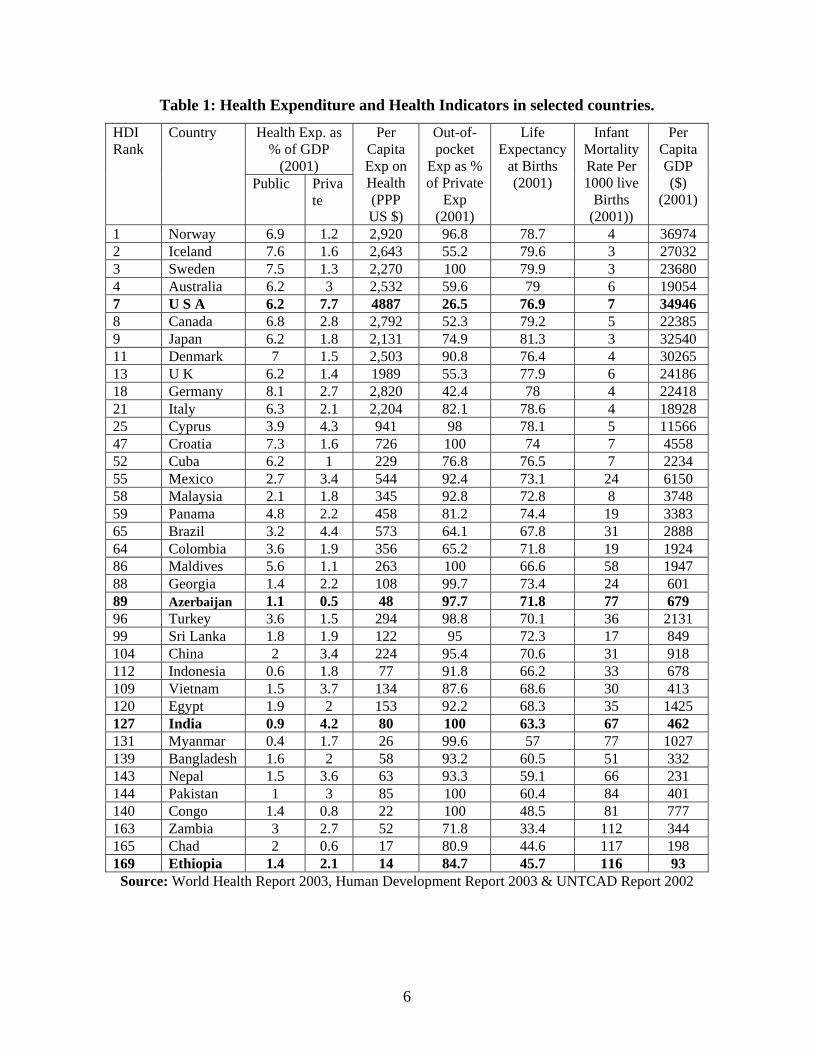
Similarly, health expenditure, both in terms of percentage of GDP spent on health
and per capita health expenditure, is much higher in the developed countries, as evident
from Table 1. The share of GDP spent on health ranges from a low of 1.6 per cent in
Azerbaijan to 13.9 per cent in the USA. Similarly there is a very wide variation of per
capita health expenditure across countries, which is typically extremely low in
developing countries compared with most of the developed countries. The range in 2001
was from $14 in Ethiopia to $4877 in the USA.
What is also notable from Table 1 is the much higher ratio of public health
spending to private spending in the developed countries. By contrast, in middle
developed and low developed countries, either private expenditure dominates or there is
very little difference between the shares of private and public expenditure, although in
general both tend to be low. It is notable that India has the lowest ratio of public to
private health expenditure among all the countries described in this table, including the
poorest countries. Further, all the private expenditure in India (as in some other countries)
is constituted by out-of-pocket expenses. This is inherently regressive and puts a
disproportionate burden for health care on poor households.
6
Table 1: Health Expenditure and Health Indicators in selected countries.
Health Exp. as % of GDP
(2001)
HDI Rank
Country
Public Private
Per Capita Exp on Health (PPP US $)
Out-of-pocket
Exp as % of Private
Exp (2001)
Life Expectancy
at Births (2001)
Infant Mortality Rate Per 1000 live
Births (2001))
Per Capita GDP ($)
(2001)
1 Norway 6.9 1.2 2,920 96.8 78.7 4 36974 2 Iceland 7.6 1.6 2,643 55.2 79.6 3 27032 3 Sweden 7.5 1.3 2,270 100 79.9 3 23680 4 Australia 6.2 3 2,532 59.6 79 6 19054 7 U S A 6.2 7.7 4887 26.5 76.9 7 34946 8 Canada 6.8 2.8 2,792 52.3 79.2 5 22385 9 Japan 6.2 1.8 2,131 74.9 81.3 3 32540 11 Denmark 7 1.5 2,503 90.8 76.4 4 30265 13 U K 6.2 1.4 1989 55.3 77.9 6 24186 18 Germany 8.1 2.7 2,820 42.4 78 4 22418 21 Italy 6.3 2.1 2,204 82.1 78.6 4 18928 25 Cyprus 3.9 4.3 941 98 78.1 5 11566 47 Croatia 7.3 1.6 726 100 74 7 4558 52 Cuba 6.2 1 229 76.8 76.5 7 2234 55 Mexico 2.7 3.4 544 92.4 73.1 24 6150 58 Malaysia 2.1 1.8 345 92.8 72.8 8 3748 59 Panama 4.8 2.2 458 81.2 74.4 19 3383 65 Brazil 3.2 4.4 573 64.1 67.8 31 2888 64 Colombia 3.6 1.9 356 65.2 71.8 19 1924 86 Maldives 5.6 1.1 263 100 66.6 58 1947 88 Georgia 1.4 2.2 108 99.7 73.4 24 601 89 Azerbaijan 1.1 0.5 48 97.7 71.8 77 679 96 Turkey 3.6 1.5 294 98.8 70.1 36 2131 99 Sri Lanka 1.8 1.9 122 95 72.3 17 849 104 China 2 3.4 224 95.4 70.6 31 918 112 Indonesia 0.6 1.8 77 91.8 66.2 33 678 109 Vietnam 1.5 3.7 134 87.6 68.6 30 413 120 Egypt 1.9 2 153 92.2 68.3 35 1425 127 India 0.9 4.2 80 100 63.3 67 462 131 Myanmar 0.4 1.7 26 99.6 57 77 1027 139 Bangladesh 1.6 2 58 93.2 60.5 51 332 143 Nepal 1.5 3.6 63 93.3 59.1 66 231 144 Pakistan 1 3 85 100 60.4 84 401 140 Congo 1.4 0.8 22 100 48.5 81 777 163 Zambia 3 2.7 52 71.8 33.4 112 344 165 Chad 2 0.6 17 80.9 44.6 117 198 169 Ethiopia 1.4 2.1 14 84.7 45.7 116 93
Source: World Health Report 2003, Human Development Report 2003 & UNTCAD Report 2002

7
II. Patterns of health expenditure in India
The first systematic analysis of the distribution of health spending in India by
source of funds was published in the National Health Accounts of India, 2001-02. The
results are shown in Chart 1, and confirm the widespread perception that private
households account for the bulk of health expenditure. According to this estimate,
households accounted for more than two-thirds of health spending in the country, and
around three times the amount of all government expenditure taken together, by central,
state and local governments. Employers (firms) account for only 5 per cent, but what is
especially notable is the negligible role played by both external sources and others
including NGOs. Despite the reported increase in foreign aid for dealing with HIV-AIDS
and similar issues, all external sources taken together accounted for only 2 per cent of
total health spending1, while NGOs accounted for only 0.3 per cent.
More recent estimates suggest that the role of households has increased even more
substantially in the most recent period. According to the Report of the National
Commission on Macroeconomics and Health, 2005, households undertook nearly three-
fourths of all the health spending in the country. Public spending was only 22 per cent,
and all other sources accounted for less than 5 per cent. As Table 2 shows, both the per
capita spending and the share of households in this varied widely across states. Per capita
spending in the state with the highest rate (Goa) is nearly 7 times that of per capita
spending in the state with the lowest per capita spending (Meghalaya). Interestingly, the
share of household spending is lowest in Meghalaya, but was among the highest in Bihar
which has relatively low per capita spending. There are many states where households
undertake more than 80 per cent of all health spending, indicating an exceptionally high
burden upon them.
1 However, some foreign aid – that going directly to governmental sources – is included in the health expenditure of central and state governments.

8
Chart 1: Sources of health spending in India
Sources of health spending in India, 2001-02
7.2
14.4
2.2
68.8
25.1 0.3
Central governmentState governmentsLocal governmentsHouseholdsExternal fundingFirmsOthers incl NGOs
Source: National Health Accounts for India, 2001-02
It should be noted that this distribution is extremely skewed by international
standards. as already evident from Table 1. In developed countries, the share of public
spending in total health expenditure varies from around half (in the United States) to
more than four-fifths (in some countries of the European Union). Even in the developing
world, the ratio is 2:1 for public to private health expenditure. The exceptionally high
burden placed upon households in the Indian context reflects the inadequate quantity and
quality of public health service delivery.

9
While there is no very clear pattern, in general, it appears that the burden on
households is higher where public spending is also low. This is explored in more detail in
the final section on health outcomes.
Table 2: Health care spending in India, 2004-05
Per cent spent by
State
Per capita expenditure
(Rs.) Household Public Other
Andhra Pradesh 1118 73.4 19.4 7.2 Arunachal Pradesh 4365 86.5 13.5 0 Assam 1347 80.8 17.8 1.4 Bihar 1497 90.2 8.3 1.5 Delhi 1177 56.4 40.5 3.1 Goa 4564 79.2 17.5 3.3 Gujarat 1187 77.5 15.8 6.7 Haryana 1786 85 10.6 4.4 Himachal Pradesh 3927 86 12.4 1.6 Jammu & Kashmir 2082 77.3 20.7 2 Karnataka 997 70.4 23.2 6.4 Kerala 2952 86.3 10.8 2.9 Madhya Pradesh 1200 83.4 13.6 3 Maharashtra 1576 73.3 22.1 4.6 Manipur 2068 81.2 17.2 1.6 Meghalaya 664 36.5 58.4 5.2 Mizoram 1027 39.4 60.6 0 Nagaland 5338 91.7 7.6 0.7 Orissa 995 79.1 18 2.9 Punjab 1813 76.1 18 5.9 Rajasthan 808 70 24.5 5.5 Sikkim 2240 56.9 43.1 0 Tamil Nadu 933 60.7 26.6 12.7 Tripura 1101 69 27.4 3.6 Uttar Pradesh 1152 84.3 13 2.7 West Bengal 1188 78.4 17.3 4.3 Union Territories 598 85.1 8.8 6.1
All India 1377 73.5 22 4.5
Source: Report of National Commission on Macroeconomics and Health,
Government of India, 2005

10
This distribution between public and private spending reflects a trend of gradually
increasing household expenditure on health care. Chart 2 reveals that spending on health
has been gradually increasing as a proportion of total household consumption. The
increase has been especially notable in rural areas, where health now accounts for nearly
7 per cent of total household consumption expenditure. This in turn probably reflects
three separate trends: the greater valuation placed on health such that even poor
households are willing to spend and incur debt to ensure minimal health care; the
worsening quality and spread of, and therefore the reduced access to, reliable public
health services; and the increase in user charges and other effective charges upon
consumers even in the public health system, as government-run hospitals and clinics that
are starved of public funds resort to making citizens pay more for medicines, diagnostic
procedures and surgical aids.
Chart 2: Health spending as per cent of household consumption expenditure,
1993-94 to 2004-05
Health spending as per cent of household consumption expenditure
5.43
4.6
6.09
5.06
6.61
5.19
3
3.5
4
4.5
5
5.5
6
6.5
7
Rural Urban
1993-941999-20002004-05
Source: NSSO Surveys of consumption expenditure, 50th, 55th and 61st Rounds.
11
The burden on citizens is particularly high because, even as households bear the
brunt of aggregate health spending in the country, systems of affordable health insurance
are non-existent or poorly developed. And, as noted earlier, employers (both public and
private) account for relatively little in terms of spending on health, and in any case with
more than 90 per cent of Indian workers having “informal” or unorganised status, there
are few possibilities of ensuring that employers bear at least part of the costs of medical
treatment. Therefore instances of accident or severe illness requiring hospitalisation have
drastic effects upon the households of the affected persons, even among poor households.
This is equally true of urban and rural households but the effects may be particularly
sharp among the rural population because of the relative paucity of any publicly provided
treatment. For example, recent studies of agrarian distress have also found that health
expenditures have been significant in causing or increasing the indebtedness of farmers,
which has in turn been a proximate cause of farmers’ suicides.2
2 See for example, the Report of the Commission on Farmers’ Welfare, Government of Andhra Pradesh, December 2004.

12
III. Central government health expenditure since 1993
One of the more obvious indicators of the inadequacy of public health spending in
India is the very small amount of such spending relative to GDP. In developed countries,
especially those with ageing populations, government health spending accounts for
around 5 per cent of GDP or more. Even in Asian developing countries excluding India,
the average is around 3 per cent of GDP. This makes it quite remarkable that India, which
is currently seen internationally as an economic powerhouse and one of the success
stories of global economic growth in the past decade, has government health expenditure
amounting to less than 1 per cent of GDP. Further, this ratio is not only low
internationally, but is even low compared to past experience. As Chart 3 shows, even in
the mid-1980s, health expenditure of central and state government taken together was
more than 1 per cent of GDP, but now it is only around 0.9 per cent. Further, it has fallen
as low as around 0.8 per cent in 2001-02. It is also significant that a greater proportion is
taken up by revenue expenditure (essentially, the payment of salaries) rather than capital
expenditure for creating much-needed basic physical infrastructure.
Health is a concurrent subject under the Indian Constitution, but state
governments are dominantly responsible for most health provision, both curative and
public health aspects. However, in addition to direct central government spending on
specific budget items, there is a range of centrally mandated expenditures which are also
effectively spent by state governments, as well as some joint spending. While there are
some specific central intervention, especially various “Missions” as well as high-end
curative facilities, the bulk of the health provision that affects most of the citizenry is the
result of spending by state governments. The National Rural Health Mission, which is a
very recent central programme, involves only central expenditure.

13
Chart 3: Health expenditure of central and state governments as per cent of GDP
Health expenditure by central and state governments as per cent of GDP
0.6
0.65
0.7
0.75
0.8
0.85
0.9
0.95
1
1.05
1.1
1975-76 1980-81 1985-86 1990-91 1995-96 2000-01 2001-02 2002-03 2003-04
Revenue Capital
The ratio of central government spending to total state government spending is
currently around 1:2. In the past decade, as evident from Chart 4, central government
expenditure on health and related areas has been relatively flat at around 0.35 per cent of
GDP, with a small downturn in the mid-1990s and a small increase in the very recent
period. Within this, expenditures on health alone have been completely flat at only 0.1
per cent of GDP. There has been some slight increase in expenditures on family welfare,
which include some expenditure for reproductive health. However, spending on women
and child development has remained relatively constant as share of GDP. This is
surprising, because the last category is dominated by the ICDS. The government has been
instructed by the Supreme Court to universalise the ICDS to cover all habitations and
provide one anganwadi for every 1000 population, which would require a very large
increase in expenditure. As shall be seen later, such additional expenditure has still not
been forthcoming from the central government.

14
Chart 4: Central government health expenditure as per cent of GDP
Central government expenditure as per cent of GDP
0
0.05
0.1
0.15
0.2
0.25
0.3
0.35
0.4
0.45
1993-94 1994-951995-961996-971997-981998-991999-002000-012001-022002-032003-04
Health Family welfare Women and child dev
While health expenditure of the central government has been low and relatively
stable as share of GDP, it has shown some slight improvement in real per capita terms.
Chart 5 suggests that real per capita spending by the central government was broadly
constant in the mid-1990s but grew slightly from 1997 to 2001. It was again stagnant
until 2003 (in fact showing absolute decline in aggregate terms in 2002-03), but since
then has shown an increase in the last two years. It is likely that it will increase further in
the current budgetary year because of anticipated expenditures on the National Rural
Health Mission. Even so, the increase is rather minor and involves central government
health expenditures that are not only well below the standards of comparable developing
countries, but very far from the amounts required to provide minimally acceptable levels
of health care to the entire population.

15
Chart 5: Central government spending on Health, real per capita and growth rate
Central government budgetary allocations on Health (in constant 1993-94 prices)
Per capita and annual rate of growth
6.00
8.00
10.00
12.00
14.00
16.00
18.00
20.00
1993-94
1994-95
1995-96
1996-97
1997-98
1998-99
1999-00
2000-01
2001-02
2002-03
2003-04
2004-05
2005-06
Year
in R
s
-10
-5
0
5
10
15
20
in p
er c
en
Total allocation on Health growth rate
However, within this, the share of expenditure allotted to public health appears to
be declining. Chart 6 shows that there has been stagnation in public health expenditure
since 1999-2000 except for one year (2004-05), and that there has been quite a sharp drop
in spending on public health in per capita terms over the past five years.
It is worth noting that this has occurred despite a substantial increase in budgetary
allocations to the National Aids Control Organisation, which by 2005-06 accounted for
37 per cent of all public health expenditure of the central government. It has meant
reduced budgetary resources provided (especially in per capita terms) for dealing with
several other major communicable diseases as well as non-communicable diseases such
as trachoma and blindness control.

16
Chart 6: Central government spending on Public Health, real per capita and growth rate
Central government budgetary allocation on Public Health (at constant 1993-94 prices)
Per capita and annual growth rate
2.00
2.50
3.00
3.50
4.00
4.50
5.00
5.50
6.00
1993-94
1994-95
1995-96
1996-97
1997-98
1998-99
1999-00
2000-01
2001-02
2002-03
2003-04
2004-05
2005-06
Year
in R
s
-40
-30
-20
-10
0
10
20
30
40
in p
er c
en
Total Public Health growth rate
An important area of public health expenditure which is dominantly the
responsibility of the central government is medical training and research. Here too, the
per capita spending has increased only slowly over the 1990s although recent years have
shown some increase. However, it could be argued that this is an area where much
greater public spending is required, and it must necessarily be undertaken by the central
government. There are two important reasons for this, especially in the field of medical
research. First, international experience has shown that much medical research
undertaken in the world, increasingly by large multinational companies and labs based in
developed countries, does not engage very much with those drugs and medical
interventions that are of specific relevance to tropical countries or particular contexts
such as India. For example, out of more than 2000 drugs patented in the developed world
in the past decade, only 4 relate to tropical diseases. So it is imperative for countries such
as India to direct larger amounts of public money towards relevant medical research to be
used nationally and in developing countries with similar conditions. Second, recent
legislation which has made Indian patent law TRIPS-compatible has also entailed a

17
significant reduction in the adaptive capabilities of many India firms which had based
their production on reverse engineering processes. Therefore it is crucial to enhance the
technological innovation capability of Indian producers, which once again requires public
expenditure. In this current context, therefore, the levels of public spending indicated in
Chart 7 appear to be grossly inadequate.
Chart 7: Central government spending on medical training and research
Central government spending on medical training and research: Real per capita and growth rate
0.00
1.00
2.00
3.00
4.00
5.00
6.00
7.00
1993-94
1994-95
1995-96
1996-97
1997-98
1998-99
1999-00
2000-01
2001-02
2002-03
2003-04
2004-05
2005-06
Year
in R
s
-10
-5
0
5
10
15
20
25
30
in p
er c
en
per capita spending growth rate in constant prices
In contrast to public health, expenditure on family welfare by the central
government appears to have increased in the aggregate as well as per capita, as shown in
Chart 8. Within aggregate family welfare, the most important segment is family welfare
services, which has accounted for around an increasing part of the total, from 38 per cent
in 1993-94 to 73 per cent in 2006-06. Except for 2000-01, when both the aggregate and
per capita spending on family welfare services fell, this broad category has shown a
generally increasing trend, even in per capita terms.

18
Chart 8: Central government spending on Family Welfare
Central government budgetary allocation for Family Welfare,real per capita and rate of growth
0.00
5.00
10.00
15.00
20.00
25.00
30.00
35.00
1993-94
1994-95
1995-96
1996-97
1997-98
1998-99
1999-00
2000-01
2001-02
2002-03
2003-04
2004-05
2005-06
Year
in R
s
-10
-5
0
5
10
15
20
25
30
35
in p
er c
en
per capita allocation growth rate in real terms
Chart 9: Central government spending on Family Welfare Services
Central government spending on Family Welfare Servicesreal per capita and growth rate
0.00
5.00
10.00
15.00
20.00
25.00
1993-94
1994-95
1995-96
1996-97
1997-98
1998-99
1999-00
2000-01
2001-02
2002-03
2003-04
2004-05
2005-06
Year
in R
s
-15
-10
-5
0
5
10
15
20
25
30
35
40
in p
er c
en
Real per capita spending growth rate
19
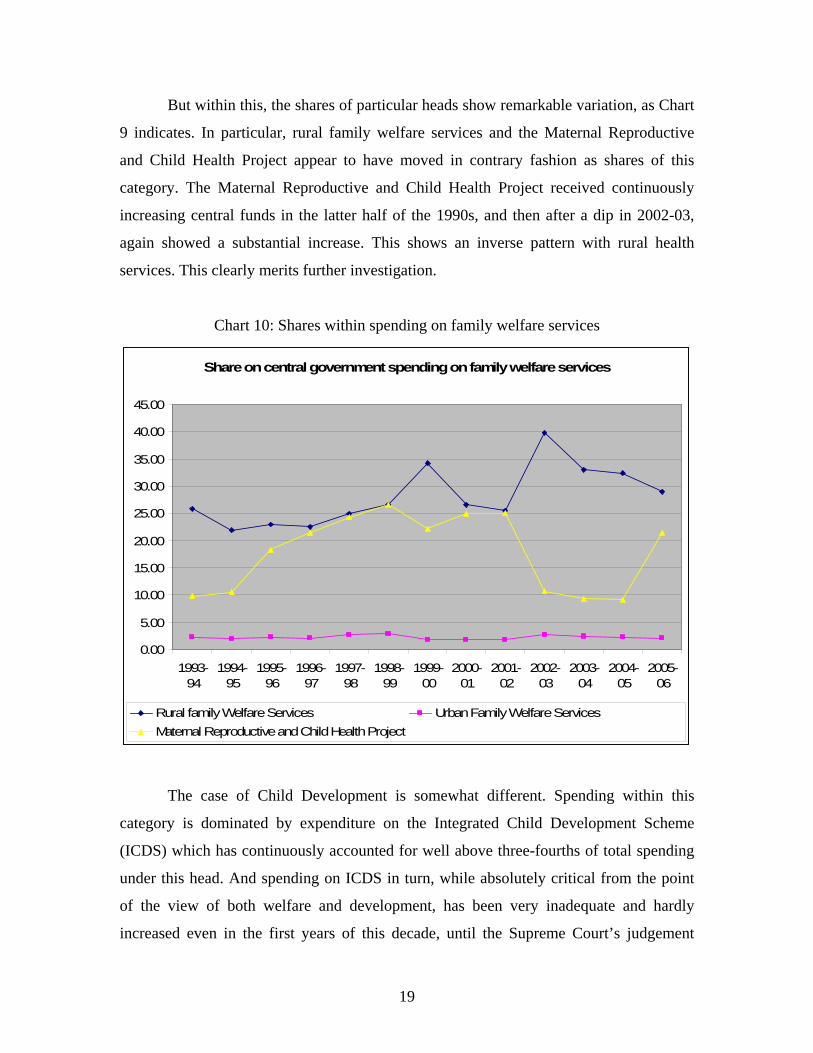
But within this, the shares of particular heads show remarkable variation, as Chart
9 indicates. In particular, rural family welfare services and the Maternal Reproductive
and Child Health Project appear to have moved in contrary fashion as shares of this
category. The Maternal Reproductive and Child Health Project received continuously
increasing central funds in the latter half of the 1990s, and then after a dip in 2002-03,
again showed a substantial increase. This shows an inverse pattern with rural health
services. This clearly merits further investigation.
Chart 10: Shares within spending on family welfare services
Share on central government spending on family welfare services
0.00
5.00
10.00
15.00
20.00
25.00
30.00
35.00
40.00
45.00
1993-94
1994-95
1995-96
1996-97
1997-98
1998-99
1999-00
2000-01
2001-02
2002-03
2003-04
2004-05
2005-06
Rural family Welfare Services Urban Family Welfare ServicesMaternal Reproductive and Child Health Project
The case of Child Development is somewhat different. Spending within this
category is dominated by expenditure on the Integrated Child Development Scheme
(ICDS) which has continuously accounted for well above three-fourths of total spending
under this head. And spending on ICDS in turn, while absolutely critical from the point
of the view of both welfare and development, has been very inadequate and hardly
increased even in the first years of this decade, until the Supreme Court’s judgement

20
about universalising ICD and the Court’s strictures on the central government for its
tardy response have forced some increase in spending in the very recent past.
Chart 11: Central government spending on ICDS
Budgetary allocation on ICDS (per capita and rate of growth)
0.00
2.00
4.00
6.00
8.00
10.00
12.00
14.00
16.00
18.00
1993-94
1994-95
1995-96
1996-97
1997-98
1998-99
1999-00
2000-01
2001-02
2002-03
2003-04
2004-05
2005-06
Year
in R
s
-20
-10
0
10
20
30
40
50
60
70
in p
er c
en
Total allocation on ICDS rate of growth

21
IV. Health expenditure of 14 state governments since 1993
According to the Indian Constitution, the health sector falls under the concurrent
list and thus, the provision of public health care in India is a responsibility shared by both
the Central and State governments. For state government health expenditure, the
financing responsibility is primarily that of the state government with some overlapping
responsibilities in a series of centrally sponsored schemes. As noted earlier, state
governments account for about two- thirds and the centre about one-third of the total
public spending on health. However, there are of course large variations in this ratio
across states.
The total health budgetary allocation of any state government in India mainly
consists of expenditures on the medical, public health and on family welfare. In the
allocation of the medical health, the major heads that are covered are the allocations on
urban health services, rural health services and medical education and training. The other
major heads are the expenditures on the public health and family welfare. Here we
analyse the behaviour of the per capita health allocations under these major heads since
1993-94 to 2002-03 for 14 major states in India. (Bihar has been excluded because of
data inadequacies.)
Table 3 provides data on the annual rate of growth of the total health budget
(medical and public health including family welfare) of these 14 states, measured in
constant 1993-94 prices. It shows that increases in state government health expenditure
have generally been below the rate of growth of aggregate real GDP. Only in four states
did health expenditure grow at an annual rate of more than 7 per cent – Andhra Pradesh,
Karnataka, Punjab and West Bengal. In three states, real health expenditure actually
declined in aggregate terms - Assam, Madhya Pradesh and Uttar Pradesh. Furthermore,
there is evidence of deceleration over this period. In the latter half of this decade, i.e.
1998-99 to 2002-03, the rate of growth of such spending declined compared to the earlier
period 1993-94 to 1997-98, in 9 states in India (except the states of Andhra Pradesh,
Assam, Kerala, Maharashtra and Orissa). In this sub-period there were absolute declines

22
as well, in Gujarat, Haryana, Madhya Pradesh, Rajasthan, Tamil Nadu and Uttar
Pradesh.
Table 3: Annual rates of growth of total expenditure on Health by state governments
1993-94 to 2002-03 1993-94 to 1997-98 1998-99 to 2002-03 Andhra Pradesh 7.24 4.58 6.54 Assam -0.15 0.05 3.50 Gujarat 6.03 8.33 -5.93 Haryana 4.34 3.65 -1.24 Karnataka 7.31 5.01 3.60 Kerala 3.93 1.56 3.99 Maharashtra 5.59 3.81 6.58 Madhya Pradesh -2.59 3.47 -16.36 Orissa 4.65 1.29 2.22 Punjab 7.47 5.64 0.63 Rajasthan 4.08 8.65 -1.70 Tamil Nadu 3.74 4.50 -1.47 Uttar Pradesh -1.54 2.35 -0.46 West Bengal 7.26 2.97 1.46
It is worth undertaking a disaggregated analysis of trends in aggregate spending
on medical and public health, and family welfare, separately. Table 4 provides these data
– from which it is apparent that in all the 14 states, the medical and public health
component followed the same trend as the aggregate health expenditure. However,
expenditure on the department of family welfare shows greater variation. Only in
Madhya Pradesh did both forms of expenditure decrease over the decade as a whole.
Over the entire period, medical and public health expenditure increased while family
welfare spending decreased in four states – Haryana, Orissa, Punjab and Uttar Pradesh. In
Assam on the other hand, family welfare expenditure increased while that on medical and
public health fell.

23
Table 4: Annual rates of growth of expenditure by category
1993-94 to
2002-03 1993-94 to
1997-98 1998-99 to
2002-03 Andhra Pradesh Medical and Public Health 7.50 4.95 6.97 Family welfare 6.26 3.14 4.88 Assam Medical and Public Health -0.56 1.22 3.22 Family welfare 2.07 -6.18 4.81 Gujarat Medical and Public Health 6.54 9.05 -6.02 Family welfare 3.18 4.60 -5.52 Haryana Medical and Public Health 5.81 6.63 -1.09 Family welfare -2.05 -7.41 -2.03 Karnataka Medical and Public Health 7.16 4.67 2.49 Family welfare 7.96 6.66 9.38 Kerala Medical and Public Health 4.46 2.42 4.71 Family welfare 0.81 -2.99 -0.62 Maharashtra Medical and Public Health 6.18 4.36 6.05 Family welfare 0.45 0.05 11.59 Madhya Pradesh Medical and Public Health -1.82 4.11 -16.32 Family welfare -6.85 0.36 -16.60 Orissa Medical and Public Health 5.88 1.72 4.15 Family welfare -0.69 -0.29 -6.69 Punjab Medical and Public Health 8.84 6.84 1.16 Family welfare -4.11 -2.41 -6.32 Rajasthan Medical and Public Health 4.60 8.71 -1.59 Family welfare 1.87 8.50 -2.48 Tamil Nadu Medical and Public Health 3.73 5.66 -2.49 Family welfare 3.80 -1.28 3.53 Uttar Pradesh Medical and Public Health 0.05 4.24 -1.47 Family welfare -5.53 -0.45 12.30 West Bengal Medical and Public Health 7.64 3.81 1.83 Family welfare 4.84 -2.24

24
In general, the budgetary head of family welfare showed much greater
variation across the sub-periods than the other category. In the states of Karnataka, Tamil
Nadu, Uttar Pradesh and West Bengal, the rate of growth of budgetary allocations on
Family Welfare increased in the second sub-period, despite declines in the rate of growth
of the total budgetary allocations. In Orissa, the opposite trend is clearly visible, with
accelerated spending on medical and public health, but accelerated declines in spending
on family welfare.
Of course, what is more significant than the aggregate spending is the per capita
public spending on health and family welfare. This show very large variation across
states, as is evident from Table A1 in the Appendix. Table 5 shows the absolute levels
and change in per capita spending between 1993-94 and 2001-02 for the 14 states
considered here (data were not available for 2002-03 for some states).
Table 5: Per capita spending by state governments on health and family welfare together (in constant 1993-94 prices)
1993-94
(in Rs.)
As per cent of highest
2001-02
(in Rs.)
As per cent of highest
Andhra Pradesh 75.93 68.3 106.17 70.5 Assam 80.25 72.2 73.64 48.9 Gujarat 83.17 74.9 97.06 64.5 Haryana 81.3 73.2 86.88 57.7 Karnataka 86.43 77.8 135.06 89.7 Kerala 100.73 90.7 128.4 85.3 Maharashtra 87.76 79.0 115.38 76.7 Madhya Pradesh 64.14 57.7 35.97 23.9 Orissa 58.92 53.0 72.24 48.0 Punjab 111.09 100 150.51 100 Rajasthan 85.46 76.9 110.08 73.1 Tamil Nadu 98.64 88.8 122.35 81.3 Uttar Pradesh 67.71 61.0 48.29 32.1 West Bengal 74.31 66.9 102.31 68.0

25
The first important point that emerges from this is that there is very wide variation
across states, and further, these gaps have actually widened over time. In 1993-94, per
capita spending by the state government of Orissa on all health and family welfare was
only Rs. 58.92, which was the lowest - just above half the level in the highest-spending
state, Punjab. By 2001-02, the differences had grown even sharper. By then, per capita
expenditure in Madhya Pradesh, which was the lowest in that year, was less than a
quarter of that in Punjab! And in 2001-02 there were there three other states whose per
capita spending was less than half of the level in Punjab: Assam, Orissa and Uttar
Pradesh.
The second important point is that in three major states, real per capita spending
on health actually declined over this period – Assam, Madhya Pradesh and Uttar Pradesh.
In Madhya Pradesh, the decline was particularly sharp, to almost half the level of the
earlier period in constant price terms. This has obvious implications for the state of public
health services in general, and is particularly worrying because these declines occurred in
backward states where public health facilities were already grossly inadequate in quantity
and poor in quality, and therefore required much more expenditure rather than less.
In two other states – Gujarat and Haryana – per capita expenditure on these heads
did not increase very much, largely because of the stagnation or decline of the family
welfare component. In fact, the expenditure on medical and public health comprises the
major share (about three-fourths) of total expenditures for all the states, and generally
tends to follow the evident trends in aggregate expenditure.
Table 6 provides data on absolute levels of and changes in real per capita
expenditure on family welfare, once again in 1993-94 prices. It is evident from this table
that the budgetary allocations towards the department of family welfare have been very
low in most of the states. Once again, it is clear that there are wide and growing
differences across states in per capita real expenditure in this category. Further, the
highest spending state changed over this period, from Haryana to Karnataka (where per
capita spending under this head more than doubled in constant price terms). However, on

26
average Rajasthan showed the highest spending in this category over the period as a
whole.
Table 6: Per capita spending by state governments on family welfare
1993-94
(Rs.)
per cent of highest
2001-02
(Rs.)
per cent of highest
Andhra Pradesh 15.9 78.7 21.16 77.1 Assam 14.41 71.3 13.11 47.8 Gujarat 14.14 70.0 11.8 43.0 Haryana 20.21 100 13.29 48.4 Karnataka 13.63 67.4 27.44 100 Kerala 16.81 83.2 17.44 63.6 Maharashtra 12.8 63.3 12.78 46.6 Madhya Pradesh 11.53 57.1 4.35 15.9 Orissa 13 64.3 10.09 36.8 Punjab 17.94 88.8 9.81 35.8 Rajasthan 17.26 85.4 23.93 87.2 Tamil Nadu 18.11 89.6 21.85 79.6 Uttar Pradesh 18.37 90.9 12.62 46.0 West Bengal 11.18 55.3 12.35 45.0
What is even more remarkable is the number of states that show a decline in real
per capita spending under this head. In seven states – Assam, Gujarat, Haryana, Madhya
Pradesh, Orissa, Punjab and Uttar Pradesh – there were declines in per capita spending on
family welfare in constant price terms. Once again, this decline has been sharpest in
Madhya Pradesh where the absolute level was already very low. But the declines are
significant even in Punjab and Haryana, which are among the wealthier states. Andhra
Pradesh and Karnataka had growing allocations in real terms, and relatively high per
capita expenditure.
In most of the states there is a wide rural-urban disparity in the per capita
budgetary allocations of the state. Details are providing in Table A3 in the Appendix. The
only exceptions to this are the states of Punjab and Rajasthan, where the real per-capita
allocations in the rural and the urban health sectors have been almost at par. From Charts
12 and 13, it is clear that in these two states the per capita allocations in the rural areas in
the early 1990s even exceeded those in the urban areas, though marginally. However,

27
subsequently urban has outpaced rural per capita expenditure even in these states, in line
with the trend in other states and All-India.
Chart 12: Health expenditure in Punjab, Rural and Urban
Real per-capita Rural and Urban Allocations in Punjab
0.00
10.00
20.00
30.00
40.00
50.00
60.00
70.00
80.00
90.00
1993-94 1994-95 1995-96 1996-97 1997-98 1998-99 1999-2000 2000-01 2001-02 2002-03
Year
in ru
pees
Urban Health Services Rural health services
Chart 13: Per capita health expenditure in Rajasthan, Urban and Rural
Real percapita rural and Urban health expenditure in Rajasthan
0.00
5.00
10.00
15.00
20.00
25.00
30.00
35.00
40.00
45.00
1993-94 1994-95 1995-96 1996-97 1997-98 1998-99 1999-2000 2000-01 2001-02 2002-03
Years
in ru
pees
Urban Health Services Rural health services

28
With reference to the rural-urban disparity, an interesting trend is exhibited by the
state of Assam. While urban per capita allocations showed a declining trend, rural per
capita allocation in the rural sector suggest a slightly rising trend, as shown in Chart 14.
Real per capita allocation for urban areas came down from Rs. 34.05 in 1993 to 11.49 in
2002-03. However, the same allocation for rural areas has gone up from Rs. 14.11 in
1993-94 to 18.57 in 2002-03, and is now significantly higher than the urban allocation.
Chart 15: Per capita health expenditure in Assam, Urban and Rural
Real percapita Rural- urban allocations in the health sector in Assam
0.00
5.00
10.00
15.00
20.00
25.00
30.00
35.00
40.00
1993-94 1994-95 1995-96 1996-97 1997-98 1998-99 1999-2000 2000-01 2001-02 2002-03
Y ear
Urban Health Services Rural health services
Per capita real allocations towards Public Health show even more variation across
states than medical expenditures and spending on public health. Maharashtra spent
around Rs. 34 per head on public health in 1993-94 and such spending increased by more
than one and half times in real terms by 2001-02. In 1993-94, the lowest spending state,
Karnataka, spent only 17 per cent of that amount, and in 2001-02, the lowest spending
state spent only 8 per cent of what was spent in Maharashtra. Indeed, no other state
comes anywhere near Maharashtra in terms of per capita spending on public health.
(Some of this may be due to differences in classification in Maharashtra relative to other

29
states, since Maharashtra also shows very low rural medical expenditure and larger
“general” expenditure.)
Table 7: Per capita spending by state governments on public health
1993-94
(Rs.)
per cent of highest
2001-02
(Rs.)
per cent of highest
Andhra Pradesh 14.19 41.9 14.42 27.9 Assam 11 32.5 9.35 18.1 Gujarat 14.88 44.0 12.28 23.7 Haryana 11.76 34.8 11.52 22.3 Karnataka 5.71 16.9 5.64 10.9 Kerala 7.85 23.2 8.83 17.1 Maharashtra 33.84 100 51.72 100 Madhya Pradesh 10.84 32.0 3.92 7.6 Orissa 8.83 26.1 9.03 17.5 Punjab 11.01 32.5 9.19 17.8 Rajasthan 8.71 25.7 7.31 14.1 Tamil Nadu 13.36 39.5 15.28 29.5 Uttar Pradesh 10.88 32.2 4.31 8.3 West Bengal 9.05 26.7 9.72 18.8
What is more alarming is the reduced per capita spending on public health in
almost all the states – indeed, only Maharashtra, Kerala, Tamil Nadu and West Bengal
show any increases, and the latter three. The most dramatic declines in per capita
spending have been in Madhya Pradesh and Uttar Pradesh – two states with clear need
for more spending rather than less.

30
V. Evidence on health outcomes
It is fairly obvious that these low and in several cases declining levels of spending
on health and related items would have an impact on conditions of health among the
citizenry, especially given that most of the population is poor and cannot afford to spend
too much on health even if they are forced to spend more and more for private care. One
major fallout of inadequate public spending that was highlighted in the first section is the
high proportion of total health spending in India that is incurred by households, which is
in sharp contrast to the picture in most other countries. Also, this pattern has worsened
over time. The growing proportion of household consumption expenditure that is devoted
to health, also noted in the first section, is at least partly if not substantially the result of
inadequate or reduced public provision.
Obviously, there is no direct and clear linkage that can be made between
government health expenditure and health outcomes of the people. However, certain
broad tendencies can certainly be identified. In particular, the unacceptably slow
improvement in a range of basic health indicators such as life expectancy at birth, infant
mortality and maternal mortality, can be partially traced to inadequate public expenditure
and intervention. Chart 16 shows that infant mortality rates were highly volatile over the
1990s, did not show a consistent declining trend, and even increased (for India as a
whole) for one period in the late 1990s. In several states there is evidence of IMRs
stagnating or even increasing in certain periods in the late 1990s, as per details provided
in Table A5.

31
Chart 16: IMR and annual rate of change in IMR for India
India: IMR and annual rate of change
50
55
60
65
70
75
80
85
1990 1991 1992 1993 1994 1995 1996 1997 1998 1999 2000 2001 2002-7
-6
-5
-4
-3
-2
-1
0
1
2
IMR change in IMR
Table on LEB, IMR and MMR trends
Furthermore, the expenditure on public health does have a direct impact on
certain health indicators such as the spread of communicable diseases. And, as Table 8
shows, while there may not be a direct and regular relationship, it is certainly the case
that there is a broad overall correlation between per capita health spending of the state
government and certain basic health indicators. In Table 8, states are placed in
descending order according to the state government’s per capita expenditure on health
and family welfare taken together. Some broad features are evident: the richer states tend
to have higher per capita spending, and generally tend to have lower IMRs, greater
incidence of full antenatal care and safe deliveries, and better nutrition indicators.
However, it is not the case that the richer states all have higher per capita health
expenditure – rather, some of them, such as Gujarat and Haryana, have among the lowest
per capita expenditure on health. Conversely, Rajasthan, with relatively low per capita
income, has relatively higher per capita government spending on health.

32
Table 8: State government health spending per capita and some health indicators
Per capita state govt health exp in 2001-
02 (in Rs.)
Life expec tancy
at birth (2001-
06) Males
Life expec tancy
at birth (2001-
06) Females
IMR (2002) <5 MR
Children <3 yrs
severely mal
nourished
Full immune isation
coverage (% of
children 12-36
months)
Full Antenatal
care (3 visits) (%)
Safe delivery
(%)
Punjab 150.51 69.8 72 51 72 8.8 74 13.6 61.3 Karnataka 135.06 62.4 66.4 55 69.8 16.5 81 29.5 62 Kerala 128.4 71.7 75 10 18.8 4.7 91 64.3 96.5 Tamil Nadu 122.35 67 69.8 44 63.3 10.6 92 20 80 Maharashtra 115.38 66.8 69.8 45 58.1 17.6 85 23.8 60.8 Rajasthan 110.08 62.2 62.8 78 114.9 20.8 20 3.6 37.7 Andhra Pradesh 106.17 64.1 65.4 62 85.5 10.3 72 35.2 67.9 West Bengal 102.31 66.1 69.3 49 67.6 16.3 78 11.7 42.3 Gujarat 97.06 63.1 64.1 60 85.1 16.2 68 22.1 59.1 Haryana 86.88 64.6 69.3 62 76.8 10.1 56 28.5 44.1 Assam 73.64 59 60.9 70 89.5 13.3 57 - 20.5 Orissa 72.24 60.1 59.7 87 104.4 20.7 56 11.3 36.9 Uttar Pradesh 48.29 63.5 64.1 80 122.5 21.9 27 3.9 25.8 Madhya Pradesh 35.97 59.2 58 85 137.6 24.3 77 5.6 32.1
Source: Public Finance documents, SRS and Report on Macroeconomic s and Health
While there is no exact correlation between per capita health spending and some
basic indicators such as life expectancy, IMR and Under 5 MR, there is a broad
relationship along expected lines. However, it should be noted that (barring Kerala) most
indicators even in the high-spending states are relatively poor by international standards.
Another interesting relationship is that between government health spending over
time and health outcomes. The recently released preliminary results of the NFHS-3 allow
for a consideration of some health indicators over time in four of the states considered
here: Gujarat, Maharashtra, Orissa and Punjab. Chart 17 provides trends in per capita
expenditure on health and family welfare by these state governments, in constant 1993-94
prices, and the subsequent charts provide some information on health outcomes in these
states based on successive NFHS reports.

33
Chart 17: Real per capita expenditure on health and family welfare in selected states
Real per capita expenditure on health and family welfare
40
60
80
100
120
140
160
180
1993-94 1994-95 1995-96 1996-97 1997-98 1998-99 1999-2000
2000-01 2001-02 2002-03
Gujarat Maharashtra Orissa Punjab
As is evident from Chart 17, real per capita spending on health and family welfare
showed a volatile pattern in these states, stagnating or even declining slightly at the start
of this period, increasing over the late 1990s and then once again stagnating or declining.
There have been relatively sharp falls in Maharashtra and Gujarat from the turn of the
decade, uneven pattern in Maharashtra and stagnation in Orissa. While the real per capita
expenditure on health and family welfare remained the highest in Punjab throughout the
period, the relative ranking of Gujarat and Maharashtra fluctuated, and Orissa continued
to have the lowest though the gap narrowed with the middle two states.
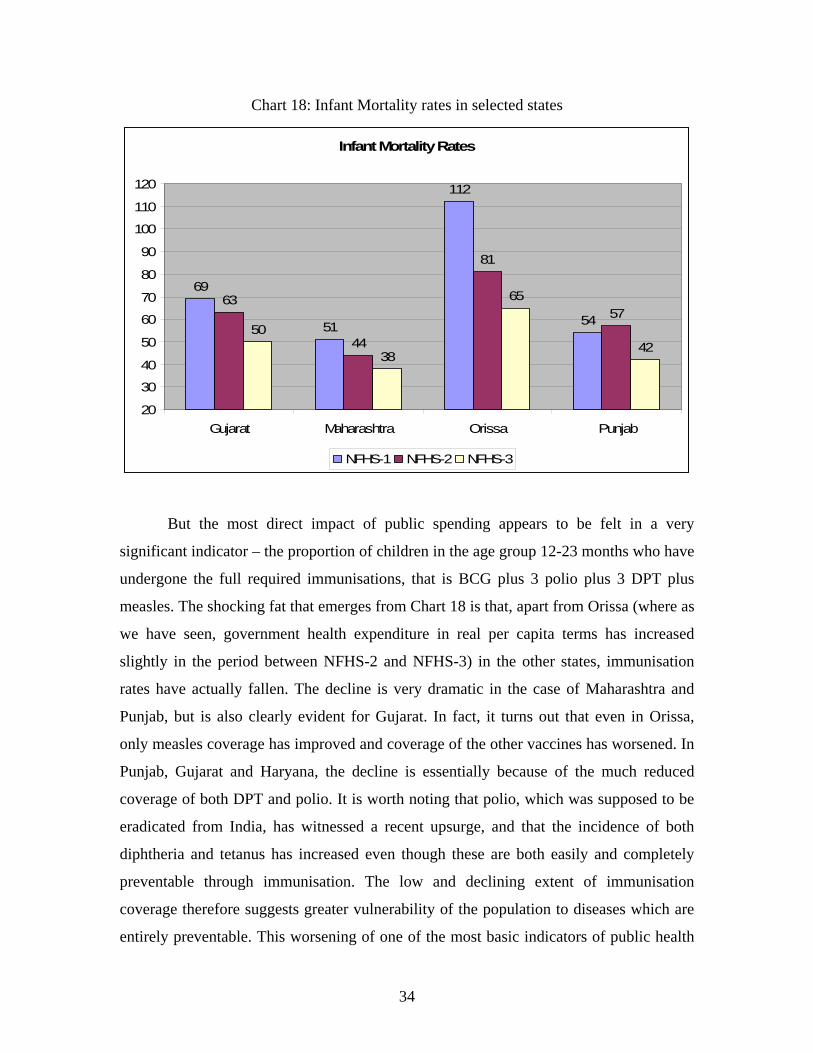
However, as Chart 18 shows, this is only partly reflected in infant mortality rates
in these states. While that in Orissa was the highest, it also showed the sharpest decline,
whereas the IMR of Punjab has been comparable with that of Maharashtra with much
lower per capita spending and has also shown a greater variation over time.
34
Chart 18: Infant Mortality rates in selected states
Infant Mortality Rates
69
51
112
5463
44
81
5750
38
65
42
20
30
40
50
60
70
80
90
100
110
120
Gujarat Maharashtra Orissa Punjab
NFHS-1 NFHS-2 NFHS-3
But the most direct impact of public spending appears to be felt in a very
significant indicator – the proportion of children in the age group 12-23 months who have
undergone the full required immunisations, that is BCG plus 3 polio plus 3 DPT plus
measles. The shocking fat that emerges from Chart 18 is that, apart from Orissa (where as
we have seen, government health expenditure in real per capita terms has increased
slightly in the period between NFHS-2 and NFHS-3) in the other states, immunisation
rates have actually fallen. The decline is very dramatic in the case of Maharashtra and
Punjab, but is also clearly evident for Gujarat. In fact, it turns out that even in Orissa,
only measles coverage has improved and coverage of the other vaccines has worsened. In
Punjab, Gujarat and Haryana, the decline is essentially because of the much reduced
coverage of both DPT and polio. It is worth noting that polio, which was supposed to be
eradicated from India, has witnessed a recent upsurge, and that the incidence of both
diphtheria and tetanus has increased even though these are both easily and completely
preventable through immunisation. The low and declining extent of immunisation
coverage therefore suggests greater vulnerability of the population to diseases which are
entirely preventable. This worsening of one of the most basic indicators of public health

35
appears to be the direct result of reduced government expenditure which in turn has
reduced the spread of and access to vaccination among the general populations, and
particularly in the rural areas.
Chart 18: Trends in full immunisation of children
Trends in full immunisation of children
50
64
36
62
53
78
44
72
45
59
52
60
20
30
40
50
60
70
80
90
Gujarat Maharashtra Orissa Punjab
NFHS-1 NFHS-2 NFHS-3
This suggests that while infant mortality rates my not directly reflect the trends in
government health expenditure so clearly (although there are broad relationships that can
be discerned), immunisation coverage appears to be directly (and even almost
immediately) affected by public spending in this area. The reduced expenditure can
therefore have alarming and completely unnecessary adverse effects upon the health of
the population, which will eventually reflect not in mortality per se but in increased
morbidity and reduced capabilities.

36
VI. Conclusions and directions for further research
This is a preliminary study which has sought to consider the broad patterns of
government spending on health and related areas in India in the recent past, and link them
to observed health outcomes. The analysis has been conducted both at the central
government level and for 14 major states.
A number of important conclusions have already emerged from this preliminary
analysis. First, absolute levels of total government spending on health, family welfare and
child development are absurdly low by international standards, not only in per capita
terms but also as share of GDP. Government spending on health amounts to less than 1
per cent of GDP. This has meant that a disproportionately large and growing share of the
burden of health care has been borne by households in India, such that they account for
an increasing share of total expenditure (nearly three-quarters in the most recent year for
which data are available). Unlike many other countries, this is completely in the form of
out-of-pocket expenses, which are inherently regressive. Also, the share of household
consumption expenditure devoted to health care has also been increasing over time,
especially in rural areas where it now accounts for nearly 7 per cent of the household
budget on average.
The central government accounts for roughly one-third of total government
expenditure on health, on average 0.35 per cent of GDP over the past decade. In terms of
GDP share, expenditure on health has been flat, although there has been a slight increase
in spending under the budget head family welfare. Surprisingly, given the constitutional
requirement and Supreme Court order on the central government to expand and
universalise the ICDS within a very short time period, spending on child development has
also been flat in proportion to GDP. Central government expenditure shows sharp
fluctuations over the 1990s, with a slight increase since 2003, although within this, the
share of public health has declined substantially and budget allocations in this category
also declined in per capita terms. The share of spending devoted to medical training and
research has also been far too low.

37
The analysis of state budgets (14 major states) indicates wide variations across
states, which are not always explained by differences in income (defined as SDP per
capita). There are also differences in the time trend, and worrying indications of declining
state government spending in crucial areas. Overall health spending declined over the
decade 1993-94 to 2002-03 in 3 states, and declined between 1998-99 and 2002-03 in 6
states. Within the overall spending, family welfare showed the greatest fluctuation over
time in most states. There were sharp and generally growing rural-urban disparities in
spending in most states. Further, over this decade, the gaps between states in terms of per
capita spending increased.
In terms of outcomes, while clear and direct correlations between government
spending on health and health outcomes are not to be expected, there was nevertheless
indication that there is a broad relationship. In particular, the stagnation or low rate of
decline of certain crucial indicators such as the IMR could be related to this. Across
states, the per capita spending was seen to be strongly correlated with various indicators
including not only life expectancy at birth, infant mortality and child mortality, but also
with the extent of antenatal care provided, the proportion of safe deliveries and the spread
of immunisation. The state-level analysis of outcomes also considered the very recent
evidence from NFHS-3 for the four states of Gujarat, Maharashtra, Orissa and Punjab.
The declines in per capita spending on health in constant 1993-94 price terms in three of
these states was linked to the actual declines in the extent of full immunisation among
children in the age group 12 to 23 months. This pointed starkly to the negative public
health implications of reduced real health spending by state governments.
These preliminary conclusions must obviously be refined by much more rigorous
empirical analysis of the relevant indicators. Therefore this study also points to a number
of areas of future research that are extremely relevant given that broad trends that have
been identified as well as the pattern of variation across states. The most important future
task involves exploring the disaggregated pattern of health spending both at central
government and state government levels, according to more detailed classifications. This
38
is important because, even within overall expenditures that are growing, the shift across
categories can have important effects on both quality and quantity of public health
services, and can in turn affect not only the access of citizens and the need to rely on
private care, but also health outcomes. Further, the analysis over time and across states of
health spending in relation to aggregate and per capita income (GDP and SDP) can be
usefully extended to consider a number of other comparisons, through rank correlations,
etc. The disaggregated impact of health expenditure on particular groups, not only
women and girl children, and across rural and urban, but specifically for socially
disadvantaged communities and regions, is also a major area for further research. Clearly,
this is an area with huge possibilities in terms of addressing very important questions,
which would monitor the need for, the amount and nature of, the distribution and the
impact of government health expenditure among the population at large and among
specific groups.

39
Appendix Tables
Per Capita Total Expenditure on Medical and Public Health and Family Welfare- Major State wise
(Rupees) (in real terms- measured at constant prices) 1993-94 1994-95 1995-961996-971997-981998-991999-2000 2000-01 2001-022002-03Andhra Pradesh 75.93 71.68 69.66 82.19 82.88 93.09 97.69 108.27 106.17 NAAssam 80.25 76.76 77.58 74.28 74.99 59.44 69.12 75.25 73.64 62.71Gujarat 83.17 86.13 89.55 93.47 107.54 133.04 140.09 128.87 97.06 106.30Haryana 81.30 78.30 74.41 78.14 85.90 103.32 92.16 86.19 86.88 88.22Karnataka 86.43 89.75 87.64 84.61 104.86 111.42 127.40 129.19 135.06 119.11Kerala 100.73 106.49 105.49 102.57 106.02 111.37 130.68 115.30 128.40 130.62Maharashtra 87.76 82.04 86.56 88.54 91.92 91.30 98.93 111.81 115.38 104.93Madhya Pradesh 64.14 66.37 65.51 73.65 75.63 97.71 100.45 59.30 35.97 70.01Orissa 58.92 64.31 58.80 60.59 60.03 72.18 73.06 75.86 72.24 75.13Punjab 111.09 99.92 100.34 112.73 125.54 152.03 152.98 166.55 150.51 144.28Rajasthan 85.46 94.09 100.80 102.16 109.61 116.19 109.78 105.64 110.08 94.01Tamil Nadu 98.64 103.84 105.62 105.99 115.09 128.89 131.42 123.00 122.35 117.36Uttar Pradesh 67.71 59.35 58.87 61.21 68.51 52.57 52.59 54.24 48.29 NAWest Bengal 74.31 68.68 71.81 78.43 74.19 97.30 106.20 115.85 102.31 98.20

40
Per Capita Family Welfare Expenditure- Major State wise (Rupees) (in real terms- measured at constant prices) 1993-94 1994-95 1995-96 1996-97 1997-98 1998-99 1999-2000 2000-01 2001-02 2002-03Andhra Pradesh 15.90 15.59 14.83 17.97 16.15 19.75 19.37 22.14 21.16 NAAssam 14.41 10.11 12.95 10.15 9.59 10.17 11.50 14.80 13.11 11.05Gujarat 14.14 14.41 14.50 13.59 16.46 18.64 18.12 18.62 11.80 15.70Haryana 20.21 17.56 14.61 13.84 13.67 16.43 13.60 9.93 13.29 13.24Karnataka 13.63 15.58 16.15 13.06 18.95 15.66 21.00 21.45 27.44 19.79Kerala 16.81 17.77 15.50 15.10 14.97 15.65 19.52 15.47 17.44 15.34Maharashtra 12.80 9.59 13.07 11.44 10.61 7.32 8.11 12.61 12.78 9.10Madhya Pradesh 11.53 11.09 11.29 12.34 11.66 12.22 13.33 8.01 4.35 9.04Orissa 13.00 13.25 13.59 12.87 12.06 14.82 12.84 12.55 10.09 10.97Punjab 17.94 11.14 14.73 16.37 11.95 12.20 11.00 11.67 9.81 8.51Rajasthan 17.26 21.36 20.38 21.22 22.98 21.81 19.86 17.97 23.93 15.46Tamil Nadu 18.11 19.01 18.84 13.83 18.83 21.16 19.66 19.56 21.85 22.59Uttar Pradesh 18.37 18.08 14.15 17.14 16.88 9.55 9.30 10.76 12.62 NAWest Bengal 11.18 9.22 10.37 9.52 9.05 12.72 13.09 14.29 12.35 11.37

41
Per Capita Public Health Total Expenditure- Major State wise (Rupees) (in real terms- measured at constant prices)
1993-
94 1994-
95 1995-
96 1996-
97 1997-
98 1998-
99 1999-2000
2000-01
2001-02
2002-03
Andhra Pradesh 14.19 14.35 12.90 14.82 13.74 13.20 14.05 14.55 14.42 NA
Assam 11.00 10.58 10.46 8.39 13.57 8.57 10.85 11.08 9.35 9.16
Gujarat 14.88 16.17 16.56 17.15 19.51 19.30 21.43 16.76 12.28 14.72Haryana 11.76 11.59 9.88 11.23 18.46 16.75 14.34 13.04 11.52 11.04Karnataka 5.71 6.11 5.65 5.53 5.98 5.55 6.59 5.86 5.64 5.56
Kerala 7.85 8.15 8.75 8.55 8.58 9.74 11.58 10.26 8.83 9.79
Maharashtra 33.84 34.46 35.11 36.76 38.11 37.85 36.24 44.86 51.72 45.09Madhya Pradesh 10.84 10.20 8.78 10.30 10.36 16.43 13.60 8.44 3.92 10.00Orissa 8.83 9.24 8.66 8.71 8.83 10.56 10.75 10.34 9.03 11.89
Punjab 11.01 10.06 9.22 10.43 13.09 12.51 11.54 10.56 9.19 9.73
Rajasthan 8.71 8.79 9.91 11.30 10.65 9.67 10.99 7.49 7.31 6.69Tamil Nadu 13.36 13.84 14.29 14.33 15.86 19.26 18.26 17.88 15.28 12.51Uttar Pradesh 10.88 8.90 9.84 10.18 11.71 8.27 5.20 5.04 4.31 NAWest Bengal 9.05 8.45 8.58 9.59 8.44 11.66 10.92 10.61 9.72 8.97

42
Infant Mortality Rates in India
States/UTs 1990 1991 1992 1993 1994 1995 1996 1997 1998 1999 2000 2001 2002Andhra Pradesh 70 73 71 64 65 67 65 63 66 66 65 66 62Assam 76 81 76 81 78 77 74 76 76 76 75 74 70Bihar 75 69 73 70 67 73 71 71 67 63 62 62 61Chhatisgarh NA NA NA NA NA NA NA NA 94 78 79 77 73Gujarat 72 69 67 58 64 62 61 62 64 63 62 60 60Haryana 69 68 75 66 70 69 68 68 70 68 67 66 62Jharkhand NA NA NA NA NA NA NA NA 62 71 70 62 51Karnataka 70 77 73 67 67 62 53 53 58 58 57 58 55Kerala 17 16 17 13 16 15 14 12 16 14 14 11 10Madhya Pradesh 111 117 104 106 98 99 97 94 98 90 87 86 85Maharashtra 58 60 59 50 55 55 48 47 49 48 48 45 45Orissa 122 124 115 110 103 103 95 96 98 97 95 91 87Punjab 61 53 56 55 53 54 51 51 54 53 52 52 51Rajasthan 84 79 90 82 84 86 85 85 83 81 79 80 78Tamil Nadu 59 57 58 56 59 54 53 53 53 52 51 49 44Uttar Pradesh 99 97 98 94 88 86 85 85 85 84 83 83 80West Bengal 63 71 65 58 62 58 55 55 53 52 51 51 49Arunachal Pradesh NA NA NA NA NA NA NA NA 44 43 44 39 37Delhi NA NA NA NA NA NA NA NA 36 31 32 29 30Goa NA NA NA NA NA NA NA NA 23 21 23 19 17Himachal Pradesh 69 75 67 63 67 63 62 63 64 62 60 54 52Jammu & Kashmir 70 NA NA NA NA NA NA NA 45 52 50 48 45Manipur NA NA NA NA NA NA NA NA 25 25 23 20 14Meghalaya NA NA NA NA NA NA NA NA 52 56 58 56 61Mizoram NA NA NA NA NA NA NA NA 23 19 21 19 14Nagaland NA NA NA NA NA NA NA NA NA NA N.A. N.A. N.A.Sikkim NA NA NA NA NA NA NA NA 52 49 49 42 34Tripura NA NA NA NA NA NA NA NA 49 42 41 39 34Uttaranchal NA NA NA NA NA NA NA NA 58 52 50 48 41Andaman & Nicobar Islands NA NA NA NA NA NA NA NA 30 25 23 18 15Chandigarh NA NA NA NA NA NA NA NA 32 28 28 24 21Dadra & Nagar Haveli NA NA NA NA NA NA NA NA 61 56 58 58 56Daman & Diu NA NA NA NA NA NA NA NA 51 35 48 40 42Lakshadweep NA NA NA NA NA NA NA NA 26 32 27 33 25Pondicherry NA NA NA NA NA NA NA NA 21 22 23 22 22India 80 80 79 74 74 74 72 71 72 70 68 66 63