
Government Finance Statistics - OECD.org - OECD · Content of Presentation Stock take – current...
17
Government Finance Statistics Current status and the way forward Sagé de Clerck Statistics Department IMF
Transcript of Government Finance Statistics - OECD.org - OECD · Content of Presentation Stock take – current...
Government Finance Statistics Current status and the way forward
Sagé de Clerck
Statistics Department
IMF
Content of Presentation
Stock take – current status of GFS
Update of GFSM 2001 Aligned with 2008 SNA
Harmonization with accounting standards
The way forward
Government Finance Division, IMF Statistics Department 2
March 2010
IMF Executive Board Decision – present fiscal data in the framework of GFSM 2001 in IMF staff reports
Common format for presenting fiscal data Enhance cross-country comparability
Transparent linkage between stocks and flows
Compatible with National Accounts data
Implementation date – starting in May 2011 Except for program countries
Government Finance Division, IMF Statistics Department 3
Data dissemination in GFS Formats
GFS Yearbook Supplemented in 2002
Converted in 2003
Now just over 100 countries report annual data in this format
International Financial Statistics (IFS) Converted for August 2007 issue
Now just over 80 countries have monthly or quarterly data
World Economic Outlook Converted for April 2010 issue
Other IMF publications to follow – best effort basis
Government Finance Division, IMF Statistics Department 4
Impact of the Financial Crisis
“The crisis re-affirmed an old lesson: Good data, good analysis, and effective policy responses are the lifeblood
of surveillance both at the national and international levels”
Quote from FSB and IMF report on data gaps to the G-20 Finance Ministers and Central Bank Governors
Government Finance Division, IMF Statistics Department 5
Impact of the Financial Crisis (continued)
G-20 Ministers and Central Bank Governors adopted the following recommendations directly related to GFS:
#17 - promote timely and comparable GFS data based on GFSM 2001 framework
#18 - launch public sector debt database
#20 - enhance the Principle Global Indicators website and close data gaps
Board Paper and G-20 Recommendations provide a significant impetus to further enhance fiscal data, using GFSM 2001 framework
Government Finance Division, IMF Statistics Department 6
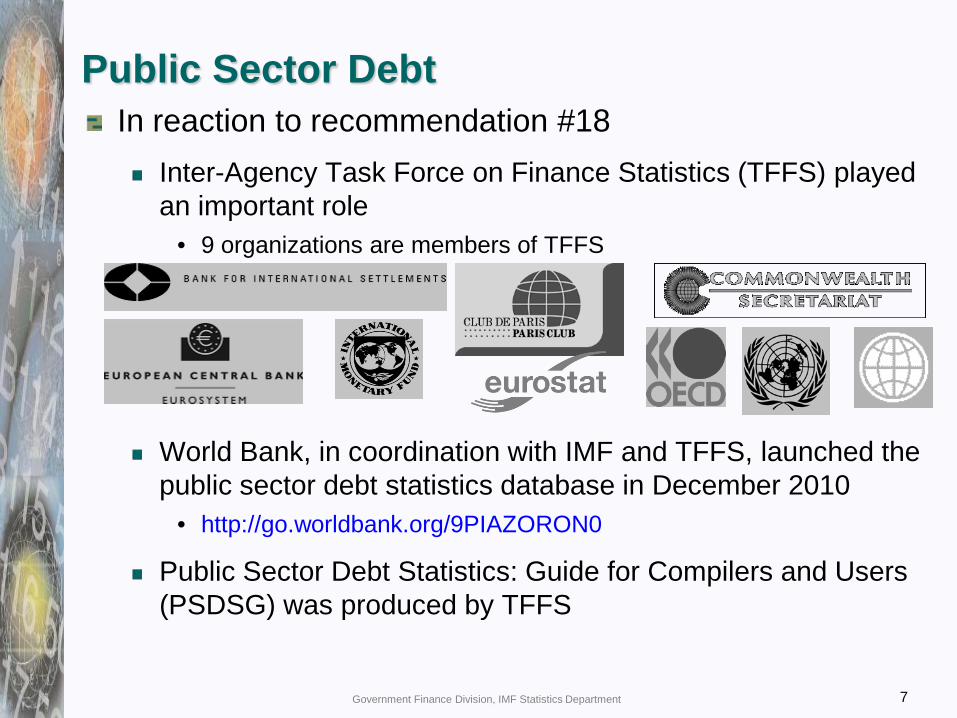
Public Sector Debt In reaction to recommendation #18
Inter-Agency Task Force on Finance Statistics (TFFS) played an important role
• 9 organizations are members of TFFS
World Bank, in coordination with IMF and TFFS, launched the public sector debt statistics database in December 2010
• http://go.worldbank.org/9PIAZORON0
Public Sector Debt Statistics: Guide for Compilers and Users (PSDSG) was produced by TFFS
Government Finance Division, IMF Statistics Department 7
Position as on February 25, 2010 PSDSG is consistent with 2008 SNA
Draft Guide printed for use at Public Sector Debt Statistics Workshop for G-20 and other large emerging economies
“Pre-publication draft” of Guide scheduled to be published by end March 2011
Editorial review April – June
Final publication late 2011, early 2012
Participated in UNCTAD’s “Train the Trainers” Workshop, Feb 21 – 24, 2011
Draft available on TFFS Website: (end March) http://www.tffs.org/psdstoc.htm
Government Finance Division, IMF Statistics Department 8
Changes in Statistical methodology
Final version of 2008 SNA released in September 2009 by the UN
Balance of Payments and International Investment Position Manual (BPM6) adopted by BOPCOM in November 2008
Update of other manuals initiated: GFSM 2001
Monetary and Financial Statistics Manual
Government Finance Division, IMF Statistics Department 9
GFSM 2001 Update
Objective of update Align GFS with 2008 SNA
Improve and clarify, using country experiences
Purpose Update not a revision
Will not re-open debates settled in the update of the SNA
Strategy To follow an international consultative process
• Electronic GFS Discussion Forum • GFS Advisory Committee
Government Finance Division, IMF Statistics Department 10

GFS Discussion Forum
Forum was created in November 2010 http://forums.imf.org/gfsm/forum.php
Outline update issues: Methodological changes resulting from the 2008 SNA
Corrections/omissions in GFSM 2001
Presentational issues and clarifications
Discussion papers were posted for comments Methodological topics included social security, consolidation, public sector, cyclical adjusted balances, contingencies, etc.
Government Finance Division, IMF Statistics Department 11
GFS Advisory Committee
Meeting held in February 2011 Endorsed the mandate to conceptually align with 2008 SNA as far as possible
• Where full alignment is not possible – justify the difference and indicate how to reconcile
Extend guidance to include the public sector
Expand guidance on debt statistics and contingencies referenced to the Public Sector Debt Statistics Guide
Provide more nuanced guidance on consolidation (also regional perspective)
Clarify treatment of social protection
Clarify linkages between statistics and accounting, including an example SCOA, and provide guidance on reconciliation
Government Finance Division, IMF Statistics Department 12
GFS Advisory Committee (continued)
Clarify statistical treatment of natural resources and environment-related issues
Discussed GFS Compilation issues GFS Compilation Guide for Developing Countries
• Circulated for comments to volunteer members
Develop a common GFS template to facilitate international data exchange and reporting – should coordinate efforts to reduce reporting burden
• Initiative is part of the work program of the Inter-Agency Group on Economic and Financial Statistics (BIS, ECB, Eurostat, IMF, OECD, UN, WB)
Continue work on government maps
Government Finance Division, IMF Statistics Department 13

Maps of Governments
• Institutional Maps: The case of Australia
(Central Government)
Local Government: Approximately 900 cities, district councils, municipalities, shires, and towns.
State Government: 8 state governments
(Budgetary Central Government): Agencies, departments, governor general’s office, judiciary, and parliament.
Social Security Funds: Not applicable
Extra-budgetary units/accounts: Government agencies, 6 government commissions, 3 government corporations, health insurance commission, and 2 national universities.
(General Government)
Source: Government Finance Statistics Yearbook 2009
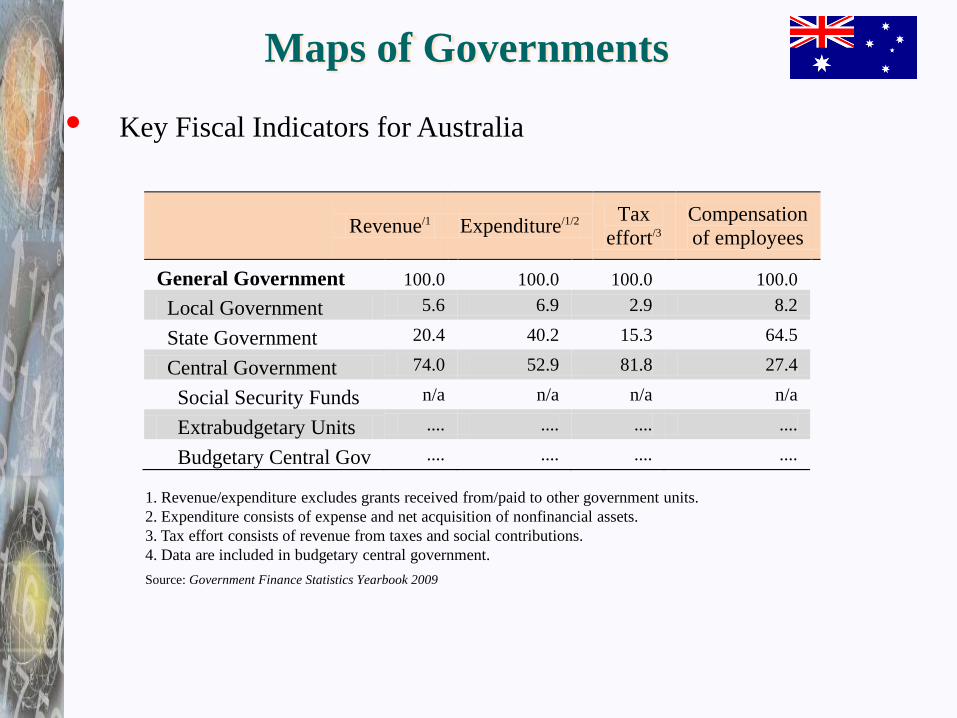
Maps of Governments
• Key Fiscal Indicators for Australia
Revenue/1 Expenditure/1/2 Tax effort/3
Compensation of employees
General Government 100.0 100.0 100.0 100.0 Local Government 5.6 6.9 2.9 8.2
State Government 20.4 40.2 15.3 64.5
Central Government 74.0 52.9 81.8 27.4
Social Security Funds n/a n/a n/a n/a
Extrabudgetary Units .... .... .... ....
Budgetary Central Gov .... .... .... ....
1. Revenue/expenditure excludes grants received from/paid to other government units. 2. Expenditure consists of expense and net acquisition of nonfinancial assets. 3. Tax effort consists of revenue from taxes and social contributions. 4. Data are included in budgetary central government.
Source: Government Finance Statistics Yearbook 2009
GFSM 2001 Update Timeline
Commenced work on draft chapters
Post draft – End 2011/Early 2012
Have a final version available – Mid 2012
Ambitious program Limited mandate
PSDSG is front runner
Research agenda
Government Finance Division, IMF Statistics Department 16

The way forward …
Continue technical assistance to support member countries
Continue to provide several training opportunities – courses, workshops and seminars
Headquarter based
Regional
Invite consultation/participation through the electronic GFS Discussion Forum
Appreciate all opportunities to collaborate with other international organizations and member countries
Government Finance Division, IMF Statistics Department 17