Government Banking and BRICs in the Recent Financial Crisis
57
Observations on BRIC Government Banks and Financial Statecraft: Competitive Advantages since Liberalization and Policy Alternatives for Crisis and Social Inclusion Kurt von Mettenheim Paper to be presented to the workshop on Financial Statecraft and Ascendant Powers: Latin America and Asia after the 2008-10 Global Financial Crisis 5 April 2012, University of Southern California DRAFT FOR DISCUSSION. PLEASE DO NOTE CITE. COMMENTS WELCOME.
-
Upload
hatem-hassan -
Category
Documents
-
view
216 -
download
0
Transcript of Government Banking and BRICs in the Recent Financial Crisis

8132019 Government Banking and BRICs in the Recent Financial Crisis
httpslidepdfcomreaderfullgovernment-banking-and-brics-in-the-recent-financial-crisis 157
Observations on BRIC Government Banks and Financial Statecraft
Competitive Advantages since Liberalization
andPolicy Alternatives for Crisis and Social Inclusion
Kurt von MettenheimPaper to be presented to the workshop on
Financial Statecraft and Ascendant PowersLatin America and Asia after the 2008-10 Global Financial Crisis
5 April 2012 University of Southern California
DRAFT FOR DISCUSSION PLEASE DO NOTE CITE COMMENTS WELCOME
8132019 Government Banking and BRICs in the Recent Financial Crisis
httpslidepdfcomreaderfullgovernment-banking-and-brics-in-the-recent-financial-crisis 257
983106983122983113983107 983111983151983158983141983154983150983149983141983150983156 983106983137983150983147983155 983137983150983140 983110983145983150983137983150983139983145983137983148 983123983156983137983156983141983139983154983137983142983156
2
Introduction1
Until 2008 developing countries systematically fared worse during financial crises Afterdeclaration of moratorium on foreign debt payments by Mexico in August 1982 the globalsouth and east experienced financial crises in a seemingly endless sequence Panic in US
financial markets during 2007 quickly spread around the globe and crisis is far from overHowever it is clear that BRIC countries were better prepared to counter shocks and resumegrowth This paper explores our findings about Brazilian federal banks (that they havemodernized and realized competitive advantages since liberalization and provided criticalpolicy alternatives) to Russia India and China amidst crisis2 Although further research willbe required (and other factors mattered) evidence suggests that BRIC government bankshave indeed realized competitive advantages over private and foreign banks during the 2000sand helped provide counter cyclical credit to counter crisis We also argue that public banksmay accelerate social inclusion through new card payment and mobile banking technologies
These findings differ from the realist tradition of financial statecraft in internationalpolitical economy recent market-based banking theory and expectations that privatizations
and liberalization would reveal the greater efficiency of private banks and produce transitionsto market centered financial systems Instead evidence from Brazil and other BRICs (andrecent research on alternative banking in Europe)3 raises new questions about domestic financial statecraft social inclusion and political development We are currently workingwith a network of research and policy making institutions to promote the adoption of CorePrinciples for Alternative Banking and Social Inclusion at large public banks in advanceddeveloping and emerging countries (while supporting alternative banking groups of occupymovements in the US)4 Any shortcomings of this draft paper and our still incipient researchand policy agenda surely pale in comparison to the devastating consequences of misguidedneo-classical ideas in banking theory and neo-liberal excesses of deregulation
We define financial statecraft as the formulation of procedural rules and policies byagents empowered to act in the name of the state which mandate and regulate basicrelationships in state civil society and markets5 Financial statecraft requires balancingpolitical legitimacy and market confidence to regulate the allocation of household savings tofirms increase the mobility of capital and shape growth6 Financial statecraft is a specifictype of statecraft involving monetary financial and banking phenomena Like most conceptsin the social sciences financial statecraft cuts to essentially contested theories and concepts7 about government intervention free markets bureaucracy and policy capacities
1 Earlier versions of this paper were presented at the meeting of Association of BRICS Business Schools27 November 2010 Xavier Institute of Management and Entrepreneurship Bangalore and published as
ldquoGovernment Banking and BRICs in the Recent Financial Crisisrdquo Journal of Management and Entrepreneurship March 2011 I thank Maria Kravchenko RS Deshpande Huang Lei MihalisChasomeris CP Ravindranathan and Maria Antonieta del Tedesco Lins and anonymous reviewers forcomments and suggestions2 Mettenheim Kurt Federal Banking in Brazil Policies and Competitive Advantages London Pickeringand Chatto 20103 On alternative banking in Europe Ayadi et al (2009) Investigating diversity in the banking sector in
Europe the performance and role of savings banks (Brussels Center for European Policy Studies) andAyadi et al (2010) Investigating diversity in the banking sector in Europe key developments
performance and role of cooperative banks (Brussels Center for European Policy Studies)4 See appendix lsquoCore Principles for Alternative Banking and Social Inclusionrsquo5 Conaghan Catherine and James Malloy Unsettling Statecraft Democracy and Neoliberalism in the
Central Andes Pittsburgh University of Pittsburgh Press 19946
Sola Lourdes amp Whitehead Laurence eds Statecrafting Monetary Authority Democracy andFinancial Order in Brazil Oxford University of Oxford Centre for Brazilian Studies 20067 On essentially contested character of concepts in the social sciences see Gallie Collier Gerring
8132019 Government Banking and BRICs in the Recent Financial Crisis
httpslidepdfcomreaderfullgovernment-banking-and-brics-in-the-recent-financial-crisis 357
983106983122983113983107 983111983151983158983141983154983150983149983141983150983156 983106983137983150983147983155 983137983150983140 983110983145983150983137983150983139983145983137983148 983123983156983137983156983141983139983154983137983142983156
3
The comparative political economy of finance is especially contested Financialdeepening approaches and bank-centered finance strategies (and liberal and coordinatedpolitical economy approaches) often see the same phenomena from profoundly differentperspectives8 Liberal market-economies are driven by equity markets thrive on publicinformation and spurn coordination Coordinated market-economies are driven by bank
credit thrive on limited sharing of firm strategy with financiers and spurn markets fortheir excessive volatility that produce sub-optimal equilibrium9 From a market-centeredperspective neo-institutionalism is largely neo-protectionism From the perspective ofcoordinated capitalism and developmental states excessive liberalization andprivatization would simply throw babies -- cherished institutions of social policy anddomestic control ndash out with the bathwater In terms of finance theory marketapproaches insist that policies should free agents to lsquoget prices rightrsquo while coordinatedmarket and bank-centered approaches argue that enough credit be directed to accelerateinnovation and lsquoget planning rightrsquo10
These deep differences shape views of financial statecraft and governmentbanking in BRICs The question of social inclusion may provide more grounds for
agreement Given the huge decline in the number of bankless Brazilians (those withoutbank account) from 80 - 50 percent 2000-2010 the relation between financial statecraftand democratization appears more positive sum than supposed by most scholars ofpolitical economy Most research on domestic finance (and especially monetary theoryand policy) assumes zero sum relations between social inclusion and proper financefiscal and monetary policy However in contexts of high inequality and financialexclusion positive sum relations may obtain This counters conceptions of fiscalconstraints to change and reverses causal relations of independent central bankingInstead of seeking to ensure central bank independence from politics and social forces(Alesina and Summers 1993) or free markets and private banks through privatizationsand deregulation (Williamson 1990) the construction of financial and monetaryauthority in Brazil (Whitehead 2002 Sola and Whitehead 2006) has involved therealization of competitive advantage by large public banks (Mettenheim 2010)Moreover basic income policies (albeit conditional see Soares et al 2010) and othersocial services have proved more successful than private banking for reaching thebankless
Reforms during the 1990s and modernization of public (and central) banksduring the 2000s thus require rethinking constraints to change Since the end of theelectoral road to socialism exemplified by military coup in Chile against PresidentAllende on 11 September 1973 social scientists and policy communities have largelyconcurred that markets severely constrain social inclusion For Gold Lo and Wright
(1975) structural theories of the state replaced earlier instrumental and functionaltraditions in Marxism by better describing how markets constrain social policy and vetopolitical change Since then social scientists emphasize how markets cleared byindividual investors impose fiscal austerity and set constraints to change Much ofcritical and mainstream social science agree that social policies tend to pressure fiscalaccounts and lead either to tax increases or adjustment policies that reduced profits and
8 On bank-centered and market centered financial systems see Zysman John Governents Markets and
Growth Financial Systems and the Politics of Industrial Change Ithaca NY Cornell University Press19839 The terms of this dichotomy are from Hall Peter amp David Soskice eds Varieties of Capitalism The
Institutional Foundations of Comparative Advantage Oxford Oxford University Press 200110
This distinction between prices and planning is from Dymski Gary A lsquoBanking on TransformationFinancing Development Overcoming Povertyrsquo Paper presented to UFRJ Economics Institute September2003
8132019 Government Banking and BRICs in the Recent Financial Crisis
httpslidepdfcomreaderfullgovernment-banking-and-brics-in-the-recent-financial-crisis 457
983106983122983113983107 983111983151983158983141983154983150983149983141983150983156 983106983137983150983147983155 983137983150983140 983110983145983150983137983150983139983145983137983148 983123983156983137983156983141983139983154983137983142983156
4
tax revenue This in the worst cases caused political-economic crisis and led to thebreakdown of democracy in developing countries (OacuteDonnell 1973) Similar forces inadvanced economies led to stagflation in the 1970s and electoral turns to neo-conservative governments and neo-liberal policies in the 1980s designed to downsizeWelfare States (Pierson 1996)
These structural explanations are now incomplete Old views of fiscaldominance fail to capture the implications of advances in monetary economics duringthe 1990s and bank modernization during the 2000s Government bank modernizationnew regulatory frameworks and better supervision of banks and markets (contrary toderegulation in the US and a few tax havens and financial centers) provide a new settingfor what we call financial roads to social economies In other words structural theoriesof the state and conceptions of vicious cycles that emphasize fiscal constraints predate studies of the credit channel interest rate channel and the modernization of publicbanks
Old views of fiscal dominance remain so prevalent that austerity has oftenremained in place far beyond necessary in developing countries Many developing
countries have accumulated significant foreign reserves and sustained trade surplusesduring years of economic growth Moreover in Brazil transparent policy frameworkssuch as inflation targeting and flexible foreign exchange regimes have been in place forover a decade (Fraga et al 2004) The situation of many ergo developing countries isthus different Bank modernization the accumulation of immense foreign reserves andthe consolidation of reforms have approximated markets and public policy Newchannels for change are at hand Our research focuses on the modernization of socialbanking especially the ability of new technologies such as electronic card paymentchannels and mobile banking to bring income grants and access to banking and publicservices in vast numbers Since opening the Brazilian banking industry in 1995 a backto the future modernization of government banks and basic income policies are biglargely untold storiesl organizations the competitiveness of private banks or the greaterefficiency of market-centered microfinance firms or funds
This also implies that advocates of central bank independence beg the questionof financial statecraft in developing and emerging economies The construction ofmonetary authority in Brazil during the 1990s and 2000s differs from standard theoriesof central bank independence in three ways First rather than the imposition oforthodoxy the construction of monetary authority in Brazil involved heterodox policiesof inertial inflation that were used to reduce high and persistent inflation Second thesuccessful reduction of inflation while redistributing wealth to the poor provided thepolitical impetus and legitimation for monetary statecraft after military rule both in
terms of economic policies and party politics Third central bank authority and capacityemerged in Brazil in precisely the reverse causal order expected by economists Contrary to claims about the need to establish central bank independence to ensure pricestability the reverse occurred The Central Bank of Brazil expanded prerogatives andbuilt capacity after price stability was secured by heterodox policies in 1994
Domestic Financial Statecraft
Our approach to financial statecraft remits to a long tradition in comparative politicaleconomy that focuses on how politics and government policies shape markets Thisapproach is epitomized by Polanyrsquos The Great Transformation Shonfieldrsquos Modern
Capitalism Zysmanrsquos Governments Markets and Growth Gourevitchrsquos Politics in Hard Times Conaghan amp Malloyacutes Unsettling Statecraft and Sola amp Whiteheadacutes
8132019 Government Banking and BRICs in the Recent Financial Crisis
httpslidepdfcomreaderfullgovernment-banking-and-brics-in-the-recent-financial-crisis 557
983106983122983113983107 983111983151983158983141983154983150983149983141983150983156 983106983137983150983147983155 983137983150983140 983110983145983150983137983150983139983145983137983148 983123983156983137983156983141983139983154983137983142983156
5
Statecrafting Monetary Authority Democracy and Financial Order in Brazil PeterKingstoneacutes analysis of coalitions Christine Kearneyacutes analysis of neo-liberal policiesand studies of recentralization and federalism by Leslie Armijo Kent Eaton and DavidSamuels all explore the political determinants of economic policies in Brazil11
Polanyirsquos The Great Transformation and Shonefieldrsquos Modern Capitalism
remain canonic studies of financial statecraft Polanyi argued that laissez faire liberalism during the 19th century generated movements of social self-defense in theform of organized labor efforts to address the social question and central banking toprotect private banks from downturns and currency devaluation under the gold standardOther interventions such as tarrifs imperialist expansion subsidies to agriculture andindustry and top-down social policies also prevailed over liberalism and free marketsespecially after the 1873 depression Statecrafting often in authoritarian forms thusreappeared in the latter 19th century after decades of liberalism Thereafter two worldwars and recovery from economic depression meant that political imperatives continuedto dominate domestic policymaking After 1945 Shonefield argues that ContinentalEuropeans reshaped government ownership in response to the political and economic
imperatives of recovery rather than ideology or nationalist design This emphasis onnecessity and improvisation places the statecrafting tradition closer to Lindblomrsquosmuddling-through conception of policymaking than Marxist-Leninist or nationalisttheories that saw large state banks as means to ideological ends
Recent scholarship has returned to core ideas of statecrafting For Kirschnerbecause the impact of alternative financial arrangements and policies on welfare is oftenequal or unpredictable politics rather than independent economic judgements bothshape and explain policy choices and the configuration of markets12 Statecrafting thusdescribes the political construction of coalitions to support economic policies and theadoptionadaptation of policies to the particularities of domestic markets institutionsand politics13 Hoffman traces how political ideas periodically recast the US financialsystem during critical junctures of change since independence14 Laurence Toya andAmyx also argue that politics explain the origin character and implementation of lsquobigbangrsquo financial reforms in Great Britain and Japan in the 1980s15 Peacuterez describes howdomestic groups determined banking and finance reforms in Spain16 This is consistentwith Maxfieldrsquos description of how the formation of a bankeracutes coalition shapedfinancial reforms and policies in Mexico17 However during the last decades domesticeconomic statecrafting has become virtually synonomous with imposing liberal reformsWe report fundamentally different developments from the BRICS The realization ofcompetitive advantages by government banks since liberalization and the importance of
11
Our approach also can be described from Claus Offe as a sociological approach to political economy ndashone that focuses on how social organizations interests and political coalitions sustain economic policiesOffe Claus lsquoPolitical Economy Sociological Perspectivesrsquo in Goodin Robert E amp Klingemann Hans-Dieter (eds) A New Handbook of Political Science Oxford Oxford University Press 1998 pp 675-69012 Kirschner Jonathan (ed) Monetary Orders Ambiguous Economics Ubiquitous Politics Ithaca NYCornell University Press 200313 Conaghan Catherine M amp James M Malloy Unsettling Statecraft Democracy and Neoliberalism in
the Central Andes Pittsburgh PA University of Pittsburgh Press 199414 Hoffmann Susan Politics and Banking Ideas Public Policy and the Creation of Financial
Institutions Ithaca NY Cornell University Press 200115 Laurence Henry Money Rules The New Politics of Finance in Britain and Japan Ithaca NY CornellUniversity Press 200116 Peacuterez Sofiacutea Banking on Privilege The Politics of Spanish Financial Reform Ithaca NY Cornell
University Press 200317 Maxfield Sylvia Governing Capital International Finance and Mexican Politics Ithaca NY CornellUniversity Press 1990
8132019 Government Banking and BRICs in the Recent Financial Crisis
httpslidepdfcomreaderfullgovernment-banking-and-brics-in-the-recent-financial-crisis 657
983106983122983113983107 983111983151983158983141983154983150983149983141983150983156 983106983137983150983147983155 983137983150983140 983110983145983150983137983150983139983145983137983148 983123983156983137983156983141983139983154983137983142983156
6
these large institutions for domestic policy making particularly for counter-cyclicalcredit and social inclusion This comes at a critical time of reassessment in the US andadvanced economies
Errors of Deregulation and Crisis in the US
A clearer explanation of the financial panic in US sub-prime mortgage markets alsohelps explain why BRIC countries suffered less and recovered more quickly From theperspectives of BRICs the excesses of deregulation and market based banking are theanomalies ndash not the reality of smoothing the growth curve and encouraging socialinclusion Competing hypotheses rushed to explain the origin and evolution of the USfinancial panic and crisis (Gorton 2008) The US Government Commission (2010) splitwith dissenters presenting separate explanations However for purposes of comparisonto BRICs review of antecedents crisis mechanisms and policy responses suggest botherrors of deregulation and particular complementarities in market-centered financecapitalism Asset bubbles are not new to financial markets However the deregulation
of capital markets and the dual bubble of long-term housing prices and quick valuationof mortgage backed securities and other derivatives produced unprecedented crisis in2007 Policy statements national accounts Federal Reserve balance sheets and markettrends and working papers indicate the following causes and consequences
First the steep valuation of the Case-Schiller Home Price Index from 1988-2009suggests a long-term asset bubble has changed US political economy and producedstructural imbalances From 1895-1995 home prices largely accompanied inflation(Baker 2007) However from 1995 to June 2006 home prices outpaced inflation by anestimated 70 percent This produced a US$ 25 trillion home price bubble and a fullUS$ 80 trillion in housing related wealth effects Construction alone during this periodincreased from an estimated 4-6 percent of US GDP
Second policies designed to counter financial crisis in 2000 such as low interestrates fueled another round of home price increases while construction and consumptionwere encouraged by further deregulation of financial markets Revocation of the Glass-Steagal law (1999) the Commodities and Futures Act of 2000 and the ConsolidatedEntity Supervision Act of the Securities and Exchange Commission (2004) freed USbanks to sell and securitize mortgages and other assets virtually without supervisionInstead of convergence toward International Financial Reporting Standards and Bankfor International Settlements (BIS) Basel II Accord capital reserve requirements USbanks were permitted to leverage freely and sell largely without consumer protectionregulations The US turn to deregulation remains an outlier Elsewhere domestic
regulators banks and financial institutions have adopted policies and reforms toconverge toward BIS domestic bank regulations and more effective capital marketsupervision
Third the valuation of mortgage backed securities and derivatives created afundamentally new situation once problems appeared in 2007 Data from the SecuritiesIndustry and Financial Markets Association suggest how the value of asset backedsecurities exploded after deregulation Values of outstanding debt and new debt issuedfrom 1996-2008 reveal an abrupt capitalization of mortgage related and asset backedsecurities typical of asset bubbles Longstanding bond markets such as municipal bondstreasury bonds corporate debt federal agency securities money markets and assetbacked bonds all remained on relatively stable growth trajectories until crisis hit in
2007 In comparison the market value of mortgage related bonds almost doubled fromUS$35 trillion in 2000 to reach US$89 trillion before crisis in 2007
8132019 Government Banking and BRICs in the Recent Financial Crisis
httpslidepdfcomreaderfullgovernment-banking-and-brics-in-the-recent-financial-crisis 757
983106983122983113983107 983111983151983158983141983154983150983149983141983150983156 983106983137983150983147983155 983137983150983140 983110983145983150983137983150983139983145983137983148 983123983156983137983156983141983139983154983137983142983156
7
Fourth central drivers of the financial market bubble in the US were secondarymarkets for mortgage backed securities and derivatives For example throughout thefinancial panic and crisis municipal bond markets remained largely stable despitefalling tax receipts and the impact of crisis on sub-national government budgets Thevalue of US Treasury bonds also increased during crisis reflecting a flight to quality
much criticized by surplus countries such as China This remains a comparativeadvantage of market-centered finance capitalism Despite originating crisis a flight toquality cheapens counter cyclical policies Corporate bonds also increased during crisisas US Federal Reserve banks and treasury injected funds to keep US firms afloatFurther analysis is needed However data from bond markets suggest that marketcentered finance capitalism retains particular sets of complementarities and policyalternatives
Fifth both government policies during crisis and proposals for new regulatoryframeworks are designed to tap these complementarities After September 2008 USgovernment reserves increased from US$ 900 billion to over two trillion dollars largelythrough new credit facilities created by the Federal Reserve Board and regional banks of
the Federal Reserve System US government reserves first increased through massiveextension of credit then through central bank swaps then through acquisition of federalgovernment securities by the US central bank These policies suggest particularconfigurations and complementarities in market-centered finance capitalism
The first program introduced in February 2008 was the Federal Reserve PrimaryDealer Credit Facility an overnight loan facility to ensure funds for primary dealers oftreasury securities to sustain demand in financial markets US government primarycredit borrowing increased from under US$200 billion through September 2008 to overUS$1100 billion by December 2008 but decreased thereafter to under US$400 billionby April 2009 US Federal Reserve Banks also purchased massive amounts of assetbacked securities to sustain markets In November 2008 the Federal Deposit InsuranceCorporation created a Temporary Liquidity Guarantee Program one that provided overUS$3340 billion by April 2009 (Given that FDIC funds are taken from charges onsavings accounts this transfer of funds from savings accounts to emergency financialpolicy credits has attracted criticism from community banking association members)US monetary authority purchases of GSE mortgage backed securities also reachedUS$125 trillion in GSE ldquoagencyrdquo mortgage backed securities US$2000 billion indirect agency obligations and permitted purchase of up to US$3000 billion in treasurysecurities during 2009 The Federal Reserve Board also created a Term Asset-BackedSecurities Loan Facility
In September 2008 the Federal Reserve Board created an Asset-Backed
Commercial Paper Money Market Mutual Fund Liquidity Facility to stave off financialpanic Lending through the Federal Reserve Bank of Boston reached US$1500 billionby September 2008 However loans under this program declined to near zero in Apriland remained below US$200 billion in May 2009 The Federal Reserve Board alsocreated a Commercial Paper Funding Facility through the Federal Reserve Bank of NewYork to avert financial panic spreading into commercial paper markets Loans to banksunder this facility reached US$3500 billion in January 2009 but declined to underUS$1400 billion by June 2009 The Federal Reserve Board also created a TermAuction Facility in December 2009 to ensure liquidity in uninsured interbank lendingmarkets Lending through this facility remained at approximately US$1400 billion intoOctober 2008 but increased to almost US$US5000 billion in March 2009 before
declining to an estimated US$ 3200 billion outstanding in June 2009
8132019 Government Banking and BRICs in the Recent Financial Crisis
httpslidepdfcomreaderfullgovernment-banking-and-brics-in-the-recent-financial-crisis 857
8132019 Government Banking and BRICs in the Recent Financial Crisis
httpslidepdfcomreaderfullgovernment-banking-and-brics-in-the-recent-financial-crisis 957
983106983122983113983107 983111983151983158983141983154983150983149983141983150983156 983106983137983150983147983155 983137983150983140 983110983145983150983137983150983139983145983137983148 983123983156983137983156983141983139983154983137983142983156
9
but should not conceal the counter intuitive modernization of government banksalongside (and often ahead) of private and foreign banks
A third explanation draws from the institutional complementarity hypothesis toargue that different policies in BRICS captured particular complementarities in bankingand finance to avert more severe impacts on economic activity This is a promising
approach but one that exceeds our ability to retrace the domestic policies amidst crisisacross four major countriesA fourth explanation is taken from the World Capitalist System approach and
focuses on the profound structural changes implied by recent growth and betteradjustment in BRIC countries This perspective also provides significant opportunitiesfor reflection and interpretation that must remain beyond the scope of this paper Theemergence of BRIC nations as driving force in the global economy is a fundamentallynew situation for theories of center-periphery north-south dependent development andtheories that focus on the specific trajectories of nations in what used to be called latelate development
A final explanation of why BRIC countries have fared comparatively better in
the face of global financial crisis is scale The very large size of these economiesprovided policy options unavailable to smaller countries From this perspective closedeconomies are less subject to the impacts of sudden stops in foreign finance during andafter the financial crisis and less exposed to export declines during global downturnsMoreover large closed BRIC economies retain options of turning away from exportstoward domestic investment and consumption a characteristic especially importantgiven atrocious income distribution and social exclusion This dimension also remainsbeyond the scope of this paper on public banking and domestic financial statecraft
Unless we are mistaken these explanations are complementary to our core claimsthat government banks made a difference in terms of avoiding the creation of asset bubblesrealizing competitive advantages over private and foreign banks since liberalization andproviding counter cyclical policy alternatives to ameliorate downturn Case studies of theBRICs follow
Brazil
We begin with Brazil Our research on Brazil suggests that since price stability the return todemocracy and liberalization of the banking system in 1995 federal banks have realizedcompetitive advantage over private and foreign banks while providing policy alternatives topolitical and social forces This article extends this argument to suggest that these institutionshave modernized amidst liberalization and globalization across BRIC countries ldquojust in timerdquo
to retain client confidence and provide counter-cyclical credit to avert domestic downturns inthe face of global crisis
8132019 Government Banking and BRICs in the Recent Financial Crisis
httpslidepdfcomreaderfullgovernment-banking-and-brics-in-the-recent-financial-crisis 1057
983106983122983113983107 983111983151983158983141983154983150983149983141983150983156 983106983137983150983147983155 983137983150983140 983110983145983150983137983150983139983145983137983148 983123983156983137983156983141983139983154983137983142983156
10
The market shares of government banks private banks and foreign banks in domesticBrazilian credit from 1988-2009 are reported in Figure 1 First the trajectories of credit fromgovernment private and foreign banks suggests that state presence in banking declined during the 1990s through privatization of state government banks However sincecapitalization and reform in 2001 government banks increased market share substantiallyconsistent with our argument that they have modernized to compete alongside private andforeign banks Further comparison of government private and foreign bank policies suggestthat government banks 1) provide more loans per capita 2) provide more counter-cyclicalcredit to help firms and households through economic downturns and 3) hold treasury bonds
for the term rather than trading or unloading a difference that helps reduce market pressuresto shorten the term and increase the cost of government debt
Bank Returns in Brazil and Select Latin American and Reference Countries 2003-20072003 2004 2005 2006 2007
------------------------------------------------------------------------------------------Brazil Government 235 215 265 337
Private 160 262 259 273Foreign 101 61 166 106Bank System 158 176 212 206 224
Argentina -227 -42 70 143 97Chile 167 167 179 186 162
Mexico 161 172 244 262 202Australia 242 228 253 270 281Canada 147 167 149 209 125Spain 132 141 169 199South Africa 116 162 152 183 184---------------------------------------------------------------------------------------------Excludes credits under guarantee Source Bankscope cited in Central Bank of Brazil Financial Stability
Report November 2008 p 56 and Central Bank of Brazil Financial Stability Reports 2004-7
The above table also suggests that government banks have also systematicallyoutperformed private and foreign banks operating in Brazil since capitalization of theseinstitutions to meet Basel II Capital Risk guidelines of the Bank for International Settlements
in 2001 This is an anomaly for theories of private bank efficiency and expectations of liberalreforms in the 1990s Moreover counter-cylical lending exposes government banks to late
983088
983093
983089983088
983089983093
983090983088
983090983093
983091983088
983089 983097 983096 983096
983089 983097 983096 983097
983089 983097 983097 983088
983089 983097 983097 983089
983089 983097 983097 983090
983089 983097 983097 983091
983089 983097 983097 983092
983089 983097 983097 983093
983089 983097 983097 983094
983089 983097 983097 983095
983089 983097 983097 983096
983089 983097 983097 983097
983090 983088 983088 983088
983090 983088 983088 983089
983090 983088 983088 983090
983090 983088 983088 983091
983090 983088 983088 983092
983090 983088 983088 983093
983090 983088 983088 983094
983090 983088 983088 983095
983090 983088 983088 983096
983090 983088 983088 983097
983077
983129983141983137983154
Figure 1 Government Private and Foreign Bank Lending as percent
of Brazilian GDP 1988-2009
983120983154983145983158983137983156983141
983111983151983158983141983154983150983149983141983150983156
983110983151983154983141983145983143983150
8132019 Government Banking and BRICs in the Recent Financial Crisis
httpslidepdfcomreaderfullgovernment-banking-and-brics-in-the-recent-financial-crisis 1157
983106983122983113983107 983111983151983158983141983154983150983149983141983150983156 983106983137983150983147983155 983137983150983140 983110983145983150983137983150983139983145983137983148 983123983156983137983156983141983139983154983137983142983156
11
and non-payment of loans This reduces profits Strategies to ldquoholdrdquo government securitiesalso reduce profits Nonetheless government banks have reported stronger returns thanforeign and domestic banks on average since capitalization in 2001
The above data may conceal bad banking practices such as crony credit bad loans andcosts that in the end must be passed on to others through fiscal accounts or the money supply
Data from the Central Bank of Brazil help control for these possibilities and provide furthercomparison of bank performance This section compares government private and foreignbanks in terms of the Basel Index bad credit late loans and stress tests that estimate theimpact of hypothetical shocks to bank portfolios from foreign exchange devaluation andorcredit problems
First the Basel Index for government domestic and foreign banks from 2002-2006suggests that government banks remain capitalized well above levels set in Central Bank ofBrazil guidelines (110 set in 1999) The Bank for International Settlements suggests an 80level of capital in reserve against possible losses in lending and finance The average BaselIndex for government banks increased from 167 percent in 2002 to 197 percent in 2006 Incomparison the average Basel Index for private domestic banks increased from 151 pecent
to 170 percent during this period while foreign banks on average reported Basel Indexes of152 in 2002 remaining at 154 in 2006 This suggests that government banks in Brazil retainsufficient capital in reserve against risks arising from bad credit or losses in financialmarkets
Bank System Basel Index in Brazil Select Latin American and Reference Countries
2002 2003 2004 2005 2006---------------------------------------------------------------------------------------------Brazil Government 167 148 165 174 197
Private 151 171 183 177 170Foreign 152 167 187 164 154
Chile 141 136 130 125 120Mexico 144 141 145 163 159Australia 100 104 104 104 103Canada 134 133 129 125 121Spain 126 123 122 119South Africa 124 140 127 123 122
---------------------------------------------------------------------------------------------Source Central Bank of Brazil Financial Stability Report 2002-2006Note Basel Index = recommended minimum eleven percent relation between required net worth and risk-
weighted total assets
A closer look at changing Basel indexes reveal the consequences of counter-cyclicallending from federal government banks Because private domestic and foreign banks adoptedmore cautious strategies and provided less credit during the downturn of 2002 theseinstitutions maintained levels of capital reserves above levels found in government banksThe average Basel index for the domestic financial system thus remained roughly the same atyear-end 2002 (06 percent increase to 162 over June 2002) However this average concealsan increase of 21 percent in the Basel Index for private banks (largely meaning they chose tohold low risk rated government paper) and a decline of 23 percent of the Basel Index forgovernment banks (meaning they incurred risks to lend during downturn and adjustment)Before assuming the worst readers should note two matters First the Central Bank of Brazilrequires banks to maintain a Basel Index of 110 This is three points greater than the 80
8132019 Government Banking and BRICs in the Recent Financial Crisis
httpslidepdfcomreaderfullgovernment-banking-and-brics-in-the-recent-financial-crisis 1257
983106983122983113983107 983111983151983158983141983154983150983149983141983150983156 983106983137983150983147983155 983137983150983140 983110983145983150983137983150983139983145983137983148 983123983156983137983156983141983139983154983137983142983156
12
suggested in the 1988 Basel Accord and subsequent revisions for capital guidelines In otherwords Brazilian banks set aside almost half again more in additional capital reserves thanlevels recommended by the Bank for International Settlements Second the different BaselIndex ratings of government and private banks also reflects the greater weight of credit andtherefore credit risk in these institutions And data on bad and late loans since 2001 suggest
that the slight and temporarily higher levels of average Basel Indexes reported by governmentbanks do not reflect broader deterioration of portfoliosFurthermore Banks in Brazil and especially government banks tend to be more
conservative setting aside not only frac12 of deposits as compulsory reserves at the Central Bankof Brazil but also retaining additional reserves against bad loans and losses Firstcomparative data suggests that Brazilian banks tend to set considerably larger sums aside inreserve against bad loans and other losses Of the four large Latin American countries andfour further economies reported by the IMF and Central Bank of Brazil Brazil retainedsubstantially larger reserves against bad loans than any country except Spain during 2007This confirms the particular characteristics of banking in Brazil that of a higher cost andlower operating efficiency combined with larger reserves and provisions against losses
Bank Reserves as Percent of Overdue amp Late Loans in Brazil Select Latin American andReference Countries
2003 2004 2005 2006 2007 2008---------------------------------------------------------------------------------------------Brazil 3200 3719 2874 2800 2862 2709Argentina 792 1029 1251 1303 1303Chile 1309 1655 1776 1985 2107Mexico 1671 2018 2321 2074 1947Australia 1318 1829 2030 2052 1889Canada 435 477 493 553 449Spain 2454 2196 2518 2733South Africa 542 613 643---------------------------------------------------------------------------------------------Source IMF Global Financial Stability Report 2008 cited in Central Bank of Brazil Financial Stability
Report November 2008 p 56
The level of bad and late loans in bank portfolios is another measure of bank solidityThe convergence of bad credit levels in government private and foreign banks from 1988-2008 introduced this study Further comparison suggests that although government banksretain higher levels of bad and late loans in specific sectors (especially home loans) the value
of late loans as a percent of total loans in government banks fell below levels in private andforeign banks during 2008 (See table on following page) The value of bad credit (loans over12 months past due) in government banks decreased from R$372 billion in 2001 to R$149billion in June 2006 This places the value of bad credit in government banks below the valuefound in private and foreign banks Bad credit in private banks increased from R$173 billionin 2001 to peak at R$255 billion during 2003 declining to R$180 billion in 2006 Foreignbanks also reported increased values of bad credit from R$123 billion in 2001 peaking atR$141 billion in 2003 and declining to R$130 billion in 2006 While late loans remained 85percent of total loans in government banks in 2001 (above 75 percent in private and 65percent in foreign banks) by 2008 the relation reverses In 2008 late loans declined to 32percent of total loans at government banks while remaining at 37 percent in private banksand 45 percent in foreign banks
8132019 Government Banking and BRICs in the Recent Financial Crisis
httpslidepdfcomreaderfullgovernment-banking-and-brics-in-the-recent-financial-crisis 1357
983106983122983113983107 983111983151983158983141983154983150983149983141983150983156 983106983137983150983147983155 983137983150983140 983110983145983150983137983150983139983145983137983148 983123983156983137983156983141983139983154983137983142983156
13
Moreover government banks in Brazil continue to set aside greater provisions againstbad and late loans than private or foreign banks In 2004 government banks retained 86percent of the value of total loans in provision against losses from non-paying loans whileprivate banks retained 60 percent and foreign banks 51 percent In 2008 the level ofprovisions at government banks had declined on average to 68 percent but still remained
well above the levels of 52 and 51 percent recorded at private and foreign banks
Late Loans and Provisions in Government Private and Foreign Banks 2001-2008
Government Banks Private Banks Foreign Banks--------------------------- ----------------------------- -----------------------------R$bi R$bi R$bigt12m Late Provision gt12m Late Provision gt12m Late Provision
----------------------------------------------------------------------------------------------------------------2001 372 85 173 75 123 652002 394 55 202 73 141 60
2003 326 70 255 74 159 662004 133 35 86 160 31 60 102 32 512005 134 39 81 163 35 59 107 35 482006 149 42 68 180 44 66 130 45 532007 35 75 37 55 43 502008 32 68 37 52 45 512009 30 56 612010 20 47 40 66 41 532011 20 43 46 71 50 58----------------------------------------------------------------------------------------------------------------Note Bad credit = loans past due over 12 months Late = percent of total loans gt120 days overdue
Provision = percent of total loan value set aside as reserves against losses Empty cells reflect lack of databecause of changing reporting standards at Central BankSource Central Bank of Brazil Financial Stability Report November 2008 p 56 and 2002-2006
Again in comparative perspective the levels of late loans in Brazilian bankingremains significantly higher than other countries Table 213 reports the value of late loans asa percent of bank portfolios in Brazil select Latin American and further countries forreference This suggests that differences found in Brazilian government banks have to dowith differences in the banking system such as judicial preference for debtors over creditorsrather than the inferior performance of government banks
Late Loans as percent of Total Loans in Brazil Select Latin American and ReferenceCountries
2003 2004 2005 2006 2007----------------------------------------------------------------------------------------------------------------Brazil 39 30 35 37 32Chile 16 12 09 08 08Mexico 28 22 18 21 25Australia 03 02 02 02 02Canada 12 07 05 04 04Spain 17 17 16 14 11South Africa 24 18 15 11 12
---------------------------------------------------------------------------------------------------------------- Does not include credits covered by guaranteeSource Bankscope cited in Central Bank of Brazil Financial Stability Report November 2008 p 56
8132019 Government Banking and BRICs in the Recent Financial Crisis
httpslidepdfcomreaderfullgovernment-banking-and-brics-in-the-recent-financial-crisis 1457
983106983122983113983107 983111983151983158983141983154983150983149983141983150983156 983106983137983150983147983155 983137983150983140 983110983145983150983137983150983139983145983137983148 983123983156983137983156983141983139983154983137983142983156
14
Further comparative data confirms that the Brazilian banking system tends to run onmore expensive credit higher returns and profits and higher levels of late and bad loansBanks operating in Brazil also retain higher levels of administrative and personnel costsHowever Brazilian banks also tend to set aside more generous reserves and provisions
against losses These structural characteristics can be seen in the comparative data in the tablebelow The data on government private and foreign banks in Brazil and comparisons suggestthat the Brazilian banking system incurs higher operating costs maintains higher reservesprovisions and capital against losses and risk but nonetheless produces strong returns
Indicators of Bank Efficiency Performance and Provisions in Brazil Select Latin Americanand Reference Countries
Cost Op Exps NPL Provisions EquityIncome Assets Loans NPL Assets
----------------------------------------------------------------------------------------------------------------
Brazil 62 65 41 153 9Argentina 84 41 66 116 12Chile 53 28 10 166 7Colombia 52 59 32 144 11Mexico 58 47 20 232 12US 54 33 07 163 8Spain 56 16 07 313 12----------------------------------------------------------------------------------------------------------------Source World Bank ldquoBrazil The Industry Structure of Banking Servicesrdquo Brasiacutelia June 2007 pp
Comparison of administrative costs in Brazilian banking with levels in other large
Latin American and emerging and reference economies suggest that Brazilian banks retainhigher costs From 2001 through 2005 the value of administrative costs as a percent of bankassets in Brazil declined from 69 percent to 58 percent but remained significantly abovelevels reported from Chile (30 to 27 percent) Mexico (47 to 46 percent) and well abovereference countries such as Australia Canada and Spain (16 36 and 11 percentrespectively) Although time series lacks comparison after 2005 administrative costs inBrazilian banks decline significantly from 58 in 2005 to 42 in 2008
Bank Administrative Costs in Brazil Select Latin American and Reference Countries (Assets)
2001 2002 2003 2004 2005 2006 2007 2008-------------------------------------------------------------------------------------------------Brazil 69 61 60 61 58 55 51 42Chile 30 30 27 27 27Mexico 47 48 46 43 46Australia 17 17 16 16 16Canada 27 27 27 27 26Spain 17 17 16 14 11-------------------------------------------------------------------------------------------------- Adjusted average of total assetsSource Bankscope cited in Central Bank of Brazil Financial Stability Report November 2008 p 56
A final comparison of government private and foreign bank solidity is based onCentral Bank of Brazil estimates of the impact of hypothetical shocks to the Brazilian
8132019 Government Banking and BRICs in the Recent Financial Crisis
httpslidepdfcomreaderfullgovernment-banking-and-brics-in-the-recent-financial-crisis 1557
983106983122983113983107 983111983151983158983141983154983150983149983141983150983156 983106983137983150983147983155 983137983150983140 983110983145983150983137983150983139983145983137983148 983123983156983137983156983141983139983154983137983142983156
15
economy on domestic banks These estimates are based on the revisions of the widely usedValue-at-Risk estimates proposed by Boudoukh Richardson and Whitelaw that adapts theoriginal VaR method developed and commercialised by JP Morgan19
Stress Tests for Impact of Credit Interest Rate and Foreign Exchange Shock on Basel Index
Comparison of Government Domestic and Foreign Banks 2001-2006
2002 2003 2004 2005 2006-------------------------------------------------------------------------------------------------------------
Government 112 104 114 113 109Domestic 112 132 126 121 103Private 103 131 135 108 84-------------------------------------------------------------------------------------------------------------Source Central Bank of Brazil Financial Stability Reports 2002-2006Note Basel Index = Capital risk guideline measure defined by Bank for International Settlements BaselCommittee that recommends 8 percent relation between PR and total assets weighted by risk level Since 2002Central Bank of Brazil minimum requirements of Basel Index remains 11 percent For methods of calculationsee Central Bank of Brazil Financial Stability Report Brasilia 2006 p 76
Central Bank of Brazil tests estimate that in the face of foreign currency valuationand interest rate shock government banks would nonetheless remain at or slightly below thecapital requirements against credit risk recommended by the central bank Again it should benoted that Basel Index levels recommended in the BIS Capital Requirements guidelines forthe Basel Index of banks are 80 while the Central Bank of Brazil has set minimum BaselIndex levels of 110 Given that federal government bank portfolios include more credit thanprivate banks and especially foreign banks the estimate of a shift to 109 in the averageBasle index for federal government banks in the face of a credit shock provides furtherevidence that these financial institutions are solid and their capital reserves sufficient Insum comparison of results for government private and foreign banks in the estimatesreported by the Central Bank of Brazil of the likely impact of a shock to the Brazilianeconomy in terms of interest rates and foreign exchange rates also suggests that governmentbanks appear solid The average Basel Index reported for government banks in this stress testwas 135 above the 110 Central Bank of Brazil guideline and well above the 80 levelsuggested by the BIS
Understanding the capacity of Brazilian banks to cope with shocks and risk is not justa theoretical exercise Since the currency crisis in Mexico during 1994-1995 the newlystabilized currency was tested by shocks from home and abroad Policies first dramaticallyincreased interest rates under a fixed exchange rate regime then freed the real to devalue
under a flexible foreign exchange rate regime in January 1999 The Asian currency crisesduring second semester 1997 led the Central Bank of Brazil to increase benchmark Selicinterest rates to 434 percent in November In August 1998 the declaration of moratorium onforeign debt payments by Russia the central bank to once again increase Selic interest ratesfrom 20 to 40 percent under the fixed exchange rate regime by November of that year Theseshocks from abroad coincided with preparations for national elections during 1998 leadingthe IMF and other official creditors to provide strong support for the Brazilan governmentNonetheless by January 1999 (after the election) market pressure led to the abandonment ofthe fixed foreign exchange rate regime that had served as nominal anchor for economic
19 Calculation first published in Resenha BMampF Vol 122 1998 (described in Central Bank of Brazil
Financial Stability Report 2002 amp 2003 then as Boudoukh Jacob Matthew Richardson RichardStanton amp Robert Whitelaw ldquoMaxVaR Long Horizon Value at Risk in a Mark-to-Market Environmentrdquo Journal of Investment Management 2004Vol 2 No 3 pp 14-19
8132019 Government Banking and BRICs in the Recent Financial Crisis
httpslidepdfcomreaderfullgovernment-banking-and-brics-in-the-recent-financial-crisis 1657
983106983122983113983107 983111983151983158983141983154983150983149983141983150983156 983106983137983150983147983155 983137983150983140 983110983145983150983137983150983139983145983137983148 983123983156983137983156983141983139983154983137983142983156
16
policy since 1994 The real quickly devalued from 121 to 20 against the US dollar by theend of January and led to considerable changes in policy (a flexible foreign exhange rateregime inflation targeting and the implementation of further fiscal reforms) Once the realrevalued from R$22 against the dollar in March to R$166 in April 1999 the governmentmoved to consolidate this new triad of economic policies Since 1999 flexible foreign
exchange markets inflation targeting and fiscal reform have remained in place This suggeststhat Brazilian banks have weathered volatile parameters and large risks during a markedpolitical business cycle One involving the transition from reformist President Cardoso to PTPresident Lula Since recovery of the economy during 2004 the coalition government underPT President Lula has sought to expand the contribution of government banks to accelerategrowth and social inclusion These policies have not undermined economic fundamentals oreroded the institutional foundations of comparative advantage retained by Brazilian federalgovernment banks
In sum the advances of Brazilian banking toward Basel Accord regulations during the1990s and 2000s the adoption of more transparent and timely reporting standards and themodernization of government banks under pressures from liberalization placed federal banks
in a new situation in the face of crisis once it hit the country in 2008 A closer look at the bigthree federal government banks is in order to better understand these changes
The Banco do Brasil
Upon taking office in 2003 President Lula retained the central economic policies of theCardoso administration such as inflation targeting tight fiscal and monetary policy andthe operational independence of the Banco do Brasil However the recovery of investorconfidence during 2003 and the return of stronger growth levels during 2004 led to aperiod of what the Central Bank of Brazil describes as organic growth at the Banco doBrasil From 2004-2008 the Banco do Brasil contributed to the deepning of domesticcredit markets and emerged as leading investment bank at the Bovespa stock marketFurthermore once the Bovespa collapsed credit became short and a sharp downturnensued during 2008 the Banco do Brasil provided emergency loans infusions of capitalthrough stock purchases and the acquisition of small and mid-sized firms and banksunable to weather the sharp decline and lack of credit Although the merger of Itauacute andUnibanco in 2008 displaced the Banco do Brasil as the largest financial institution inLatin America the bank retains powerful institutional foundations of comparativeadvantage and networks that cross Brazilian society politics and markets
The Banco do Brasil also remains at the center of Brazilian politics and policydisputes Indeed leaders of the PT party faction articulaccedilatildeo (articulation) includes
career employees of the Banco do Brasil and presidents of the Brazilian bank workersunion such as Luiz Gushiken and Ricardo Berzioni Both were nominated to ministerialposts by President Silva in January 2003 By August 2003 21 of 33 top positions at theBanco do Brasil had been filled by new representatives of the PT most Banco do Brasilemployees and members of the Brazilian bank workers union Critics decriedpoliticization However the resistance of bank representatives described above topresidential appeals to increase credit during 2003 was followed by more neutralappointments during 2004 When Banco do Brasil President Cassio Casseb Limaresigned in November 2004 (under charges of irregularities in consulting contracts atthe bank) President Lula nominated Rossano Maranhatildeo Pinto a career employee andBanco do Brasil vice president to head the bank Further appointments of PMDB
political leaders to cement support for the PT coalition government were also criticizedas politicization of the bank However Banco do Brasil officials responded that these
8132019 Government Banking and BRICs in the Recent Financial Crisis
httpslidepdfcomreaderfullgovernment-banking-and-brics-in-the-recent-financial-crisis 1757
983106983122983113983107 983111983151983158983141983154983150983149983141983150983156 983106983137983150983147983155 983137983150983140 983110983145983150983137983150983139983145983137983148 983123983156983137983156983141983139983154983137983142983156
17
experienced political leaders of the PMDB brought competitive advantages to the bankbased on their networks that cross the public and private sector These networks andrelations during the second PT coalition government of President Lula also appearsdifferent than the first given the departure from core offices of the presency bylongtime advisors to Lula that came from the Banco do Brasil and bank workers union
By late 2006 only one of seven vice presidents of the Banco do Brasil was a member ofPresident Lulaacutes Workersacute Party (PT)Again Banco do Brasil policies and growth since recovery of the economy in
2004 involved first a period of expansion during four years of growth followed by aturn to counter cyclical lending and finance once financial crisis abroad produced first asevere contraction in credit supply then a sharp economic downturn in fourth quarter2008 Institutional foundations of comparative advantage are behind Banco do Brasilpolicies during both periods First the capitalization of Brazilian firms on the Bovespastock market is closely related to the groups that cross politics government banks thepowerful bank worker labor union the Banco do Brasil employee private pension fundand bank consortia often led by the Banco do Brasil investment banking division (often
joined by the BNDESpar and Caixa investment banking division) Recent developmentsare complex and will require further research However rather than convergence towardprivate banking and a market-centered financial system examination of Banco do Brasilpolicies and market shares during the 2000s suggests that federal government banks notonly remain at the center of politics policy and development strategies but that theseinstitutions have modernized to compete against private and foreign banks
The large scale and scope of the Banco do Brasil has permitted use of the bankfor counter-cyclical lending and leadership in capital markets without deteriorating bankbalance sheets Since 2003 the Banco do Brasil has remained well within domesticbank regulations and Basel Accord guidelines During 2002 and 2003 reforms at theBanco do Brasil sought to reduce costs and increase efficiency ratings Indeed therelation between the Banco do Brasil and President Lula reversed past patterns In the1950s conflicts were between national developmentalist groups at the Banco do Brasiland more orthodox Ministers of Finance In 2003 and once again during the 2008financial crisis differences between President Lula and the Banco do Brasil were thereverse Banco do Brasil management refused to dramatically increase loans in 2003and resisted requests to reduce the price of credit in 2008 In 2003 the caution imposedby political risk perceptions led President Lula to respect the operational autonomy ofthe Banco do Brasil In April 2009 Banco do Brasil President Antonio Francisco deLima Neto was fired after refusing to reduce interest rates on loans This reversal ofpolicy positions from the 1950s suggests in a broader sense a transition from the
macroeconomics of populism to the microeconomics of government banking in the 21
st
century Government banks do not provide easy or all solutions Instead credit andfinance policies are subject to market discipline credit risk analysis and the realities ofbusiness cycles
Review of the Banco do Brasilrsquos balance sheet from 2002-2008 suggests that the bankdeveloped organically from 2002-2007 with gradual increases reflecting the competitiveadvantages at the top of Brazilian banking and finance Policies changed during 2007 and2008 as the credit shortage caused by international financial crisis led to the Banco do Brasilassuming once again lending of last resort functions by extending interbank investments andloans to small and medium sized banks to avert further declines in domestic liquidity TheBanco do Brasil also acquired a 51 percent stake in the Votarantim bank to avert a run on
deposits and possible failure while acquiring Satildeo Paulo state government savings bankNossa Caixa for R$76 billion in 2008 These acquisitions reflect concern about the
8132019 Government Banking and BRICs in the Recent Financial Crisis
httpslidepdfcomreaderfullgovernment-banking-and-brics-in-the-recent-financial-crisis 1857
983106983122983113983107 983111983151983158983141983154983150983149983141983150983156 983106983137983150983147983155 983137983150983140 983110983145983150983137983150983139983145983137983148 983123983156983137983156983141983139983154983137983142983156
18
replacement of the Banco do Brasil as the largest financial conglomerate in Brazil after themerger of Itauacute and Unibanco
Banco do Brasil Balance Sheet Summary 2002-2008 R$ billion
2002 2003 2004 2005 2006 2007 2008 2009 2010 2011Assets --------------------------------------------------------------------------------------------------------Interbank Investments 101 50 27 80 175 434 951Interbank Deposits 76 283 137 209 116 77 242Securities 709 696 734 664 731 752 732Central Bank Deposits 81 186 221 244 281 334 212Loans to Private Sector 89 652 757 885 1178 1463 1810Loans to Public Sector 56 43 41 37 43 24 230Receivables 297 273 312 351 404 548 808Other AssetsTotal Assets 2046 2301 2390 2529 2963 3672 5073Liabilities ---------------------------------------------------------------------------------------------------Deposits 972 1100 1155 1376 1588 1882 2711
M MKT Borrowing 483 400 445 305 492 722 914Treasury amp BNDES 59 74 106 133 143 175 224Shareholder Equity 92 121 141 168 207 242 299Other LiabilitiesTotal Liabilities 2046 2301 2390 2529 2963 3672 5073---------------------------------------------------------------------------------------------------------------- Compulsory deposits for commercial banks according to Central Bank regulationsSource Banco do Brasil Annual Reports Historical Series 2002-2008
From 2002 through 2006 the balance sheet of the Banco do Brasil suggests a periodof growth based on loans to the private sector with deposits and shareholder equityincreasing largely apace After 2006 the balance sheet changes fundamentally with capitalinjections from money market borrowing increasing from R$492 billion in 2006 to R$914billion in 2008 while Banco do Brasil liabilities with Treasury and BNDES increased fromR$143 billion in 2006 to R$224 billion in 2008 The asset side of the balance sheet alsosuggests fundamental change Private sector lending increased from R$1178 billion in 2006to R$1810 billion in 2008 reflecting acquisition of portfolios from Nossa Caixa Interbankinvestments increased from R$175 billion in 2006 to R$951 billion in 2008 while interbankdeposits also increased from R$116 billion in 2006 to R$242 billion in 2008 The counter-cyclical lending strategies of the Banco do Brasil during 2008 also included an increase oflending to the public sector from R$24 billion in 2007 to R$230 billion Banco do Brasilreponses to government credit policy can also be seen in the release of 40 percent of
compulsory deposits retained at the central bank Banco do Brasil deposits at the central bankdeclined from R$334 billion in 2007 to R$212 billion in 2008 ndash freeing this value for loansand investments
Networks and relations during the second government of President Lula appeardifferent than the first given the departure from core offices of the presency by longtimeadvisors to Lula that came from the Banco do Brasil and bank workers union By late 2006only one of seven vice presidents of the Banco do Brasil was a member of President LulaacutesWorkersacute Party (PT) The corporate profile of the Banco do Brasil suggests once again thehybrid character of this government bank one listed on the Bovespa Novo Mercado but withover 65 percent of shares owned by the Brazilian federal government Treasury
8132019 Government Banking and BRICs in the Recent Financial Crisis
httpslidepdfcomreaderfullgovernment-banking-and-brics-in-the-recent-financial-crisis 1957
8132019 Government Banking and BRICs in the Recent Financial Crisis
httpslidepdfcomreaderfullgovernment-banking-and-brics-in-the-recent-financial-crisis 2057
983106983122983113983107 983111983151983158983141983154983150983149983141983150983156 983106983137983150983147983155 983137983150983140 983110983145983150983137983150983139983145983137983148 983123983156983137983156983141983139983154983137983142983156
20
customers in 2008 reached 479 million with the bank retaining 39700 AMTs and 766million bank cards (239 million credit cards and 527 million debit cards) Like the CaixaEconocircmica Federal the Banco do Brasil also processes government payments withretirement and social security payments numbering 745 million transactions during 2008Although this implies administrative costs (and receipts) this also brings customers and
prospective customers into Banco do Brasil branch officesDuring 2008 the Banco do Brasil continued to expand operations form jointventures acquire private and government banks and modernize operations A secondaryoffering of stock in January 2008 granting of shares by VISA to the Banco do Brasil andupgrading of the bank to investment grade BB- by Standard amp Poors in April 2008 suggestthat market orientation of the bank continues during the Lula administration despite counter-cyclical credit policies A Lower Income Segment Department was also created to assumeBanco Popular do Brasil operations along with correspondent banking relations and regionalsustainable development programs The Banco do Brasil also received permission to usesavings accounts for home loans enabling the bank to compete on level ground with CaixaEconocircmica Federal During 2008 the Banco do Brasil also acquired the state government
banks Banco do Piaui Banco de Santa Catarina (33rd largest bank in Brazil with US$30billion assets at year end 2007) and Satildeo Paulo government savings bank Nossa Caixa (12thlargest Bank in Brazil with US$267 billion in assets at year end 2007) In sum the diversecorporate divisions and financial operations of the Banco do Brasil provided policy optionsduring 2008 to counter the credit shortage and help firms and domestic banks to adjust
Banco do Brasil and Private Bank Returns and Capital Adequacy 2002-2009
Basel Index Return on Assets Return on Liquid Assets----------------------------- ----------------------------- -----------------------------BB Itauacute Bradesco BB Itauacute Bradesco BB Itauacute Bradesco
--------------------------------------------------------------------------------------------------------------2002 122 184 179 12 26 20 302 288 2832003 137 198 199 11 28 16 231 297 2282004 152 206 188 13 30 23 240 292 3092005 171 170 173 12 37 26 187 353 2842006 173 171 188 28 31 25 267 288 2632007 156 179 156 14 32 22 222 321 2442008 152 161 169 25 19 16 304 221 2112009 150 165 166 12 13 14 238 182 195-------------------------------------------------------------------------------------------------------------- Annualized first quarter 2009 resultsSource Banco do Brasil Itauacute and Bradesco Annual Reports 2002-2009
Comparison of Banco do Brasil returns and capital adequacy with the two majorprivate Brazilian banks Itauacute and Bradesco suggests that the performance and solidity of theBanco do Brasil remains equal or superior to private banks During 2002 and 2003 thecapital adequacy of the Banco do Brasil and return on assets remained below levels reportedby the two largest Brazilian private banks suggesting the impact of counter-cyclical lendingHowever after 2004 the Basel index of the Banco do Brasil reached 171 far above BISstandards of 80 and Central Bank of Brazil requirements of 110 Furthermore from 2006through first quarter 2009 returns on assets returns on liquid assets and the Basel index ofthe Banco do Brasil exceed levels reported by Itauacute and Bradesco In sum despite providingcounter cyclical credit and despite having been replaced by the Itau-Unibanco merger as the
8132019 Government Banking and BRICs in the Recent Financial Crisis
httpslidepdfcomreaderfullgovernment-banking-and-brics-in-the-recent-financial-crisis 2157
983106983122983113983107 983111983151983158983141983154983150983149983141983150983156 983106983137983150983147983155 983137983150983140 983110983145983150983137983150983139983145983137983148 983123983156983137983156983141983139983154983137983142983156
21
largest Brazilian bank the performance and capital adequacy of the Banco do Brasil remainsat or above levels reported by the two largest private banks
In sum since liberalization of banking and finance and privatization of stategovernment banks during the 1990s the Banco do Brasil has been transformed from directstate owned bank into one of two very large financial conglomerates that dominate domestic
banking in Brazil Instead of retaining easy access to funds at Treasury to cover losses theBanco do Brasil has adopted international corporate governance standards to become listedon the Bovespa Novo Mercado and retains an important role in virtually every aspect ofBrazilian banking and finance Although sale of shares in the 1990s were designed to transfercorporate governance and control of the national bank to the private sector the federalgovernment retains 65 percent of stocks after two sale of stocks capitalized the bank duringthe 2000s The massive size and wide scope of Banco do Brasil networks across bankingfinancial markets political and social forces and business have led the bank to realize recordprofits during the period of growth from 2004-2008 and provide counter-cyclical credit toavert a further decline in industrial activity and the economy as the US and global financialcrisis hit Brazil first with a 50 percent decline in the Bovespa stock market and credit
shortage followed by a steep but short decline in industrial production in late 2008 Thetransparency of Banco do Brasil quarterly reports and advances in Central Bank of Brazilsupervision of domestic banking clarify the new tensions that have emerged during the PTgovernment of President Lula These tensions reflect the modernization and competitiveadvantages of the Banco do Brasil
Caixa Econocircmica Federal (Federal Savings Bank Caixa)
The third largest domestic bank the wholly government owned Federal Savings Bank Caixawas also called on by President Lula during the recent financial crisis to increase the pace ofgrowth provide counter cyclical credit during downturns and to reduce consumer andcorporate interest rates and bank spreads Review of balance sheets and policies since 2001suggest that the Caixa retains its core business in urban development home loans real estatetransfer of funds for government programs and services and lottery administration Howeverinvestment banking management of third party funds and the creation of of new products andservices have both increased profits and increased popular access to banking and socialservices The bank has recorded record profits since R$108 billion (2002) R$16 billion(2003) and R$14 billion (2004) The Caixa became the fourth largest Brazilian investmentbank by 2003 while gaining dealer status from the Central Bank of Brazil in primary andsecondary markets for government securities At year-end 2003 the bank retained anestimated R$767 billion of government paper (over ten percent of government paper) in its
portfolio assets earning over R$135 billion that year Since recovery of the Brazilianeconomy in 2004 the Caixa has reported strong profits and continued to improve thestructure of its balance sheet and converge toward international bank reporting standards
In terms of assets deposit base and the number of employees and branches the datasuggest that the Caixa has emerged from a process of rationalization and downsizing duringthe late 1990s and expanded ldquoorganicallyrdquo since capitalization in 2001 Assets declined fromover US$999 billion in 1997 to US$363 billion in 2002 after reorganization andcapitalization Deposits also declined from US$541 billion in 1997 to US$216 billion in2002 The number of employees and branches declined from 104253 and 2316 to 98971 and1803 respectively but returned to 104934 and 2428 by 2006 After reorganization andcapitalization in June 2001 Basel indexes and the ratio of fixed assets over equity indicate
substantial reform and transition toward international banking standards The Basel Index thatmeasures the adequacy of capital reserves against possible losses and risks increased from
8132019 Government Banking and BRICs in the Recent Financial Crisis
httpslidepdfcomreaderfullgovernment-banking-and-brics-in-the-recent-financial-crisis 2257
983106983122983113983107 983111983151983158983141983154983150983149983141983150983156 983106983137983150983147983155 983137983150983140 983110983145983150983137983150983139983145983137983148 983123983156983137983156983141983139983154983137983142983156
22
135 (49 in March 2001 before capitalization) to reach 278 and remain twice above theCentral Bank minimum of 110 at 252 in 2006 The ratio of fixed assets as a proportion ofequity also declines substantially from 638 at year end 2001 to 197 in 2007
Summary of Caixa Structure and Performance 1995-2007
Assets Profits Deposits Employees Branches Basel FAEquity1995 826 672 503 99866 23161996 907 2351 515 99343 21051997 999 875 541 96300 18031998 948 1693 499 94859 18191999 684 1571 344 94194 19192000 644 1362 322 104253 19212001 436 -1265 298 98971 2013 135 6382002 363 1462 216 106548 2147 146 5372003 521 2617 281 100498 2046 192 413
2004 556 2999 345 100164 2135 202 3612005 806 4852 456 106729 2321 278 2012006 981 4874 567 104934 2428 252 1972007 1409 4485 800 106770 2052 288 1282008 1266 5735 708 103895 2069 206 119
Note Assets amp Deposits = US$billion Profits = US$million Basel = BIS Basel Accord index of capital reserveadequacy FAEquity = Fixed Assets Equity a summary indicator of bank modernizationSource Central Bank of Brazil Top 50 Banks in Brazil available at wwwbcbgovbr
Caixa Annual Reports and transition toward Central Bank and international bankaccounting standards introduce breaks in the time series of financial performance after 2001
However international bank reporting standards have been used by the Caixa since 2005 andthe data provide further view of the policies and performance of the bank Table X reportsreturns on stockholder equity assets Basel solvency index immobilization index provisionsas a percent of credit operations bank efficiency index and coverage of personnel costs Thedata are consistent with the broader comparisons reported in chapter two that suggest highprofits and returns alongside higher levels of provisions and reserves against capital riskReturns on stockholder equity have remained above 20 percent per year reaching 306percent in 2008 Returns on liquid assets remained between 09 percent and 13 percentbelow the average levels recorded by private and foreign banks The Basel Index of the Caixaremained well above the 11 percent level required by the Central Bank declining from 279in 2005 to 206 in 2008
Caixa Performance Indicators 2005-2008
Indicator 2005 2006 2007 2008 2009 2010 2011--------------------------------------------------------------------------------------------------------------------------Return on Shareholder Equity 261 260 226 306Return on Liquid Assets 11 11 09 13Basel Solvency Index 279 253 289 206Immobilization Index 201 197 129 120Provisions as Credit Operations 101 98 91 86Efficiency Index 645 642 755 718Coverage of Personnel Costs 925 896 943 868
---------------------------------------------------------------------------------------------------------------------------Source Caixa Econocircmica Federal Relatoacuterios de Administraccedilatildeo 2005-2011
8132019 Government Banking and BRICs in the Recent Financial Crisis
httpslidepdfcomreaderfullgovernment-banking-and-brics-in-the-recent-financial-crisis 2357
983106983122983113983107 983111983151983158983141983154983150983149983141983150983156 983106983137983150983147983155 983137983150983140 983110983145983150983137983150983139983145983137983148 983123983156983137983156983141983139983154983137983142983156
23
The immobilization index of the Caixa also declined from 201 percent in 2005 to120 percent in 2008 suggesting transition toward standard levels of international bankingHowever the value of provisions as a percent of credit operations remains much higher thaninternational bank practices albeit declining from 101 percent in 2005 to 86 percent in2008 Finally both the substantial increase in efficiency index from 645 to 718 percent
suggests that the Caixa has distanced further from international private bank levels that tendto approach 500 percent This has resulted in the declining level of coverage of personnelcosts and indicates the comparatively larger organizational structure and less use ofoutsourced labor at the Caixa
Caixa Deposits and Sources of Funds 2005-2008 R$million
2005 2006 2007 2008 2009 2010 2011----------------------------------------------------------------------------------------------------------------Bank Deposits 692 863 1155 1320Savings Deposits 5328 6006 7560 9255Mid-Term Savings Deposits 3873 4219 4136 4862
Certificates (1270) (1412) (1244) (1831)Escrow (2602) (2806) (2891) (3031)
Funds and Programs 794 1034 1307 1100Other 009 015 019 013Caixa Total 10690 2139 14179 6552Bank System Total 68268 78148 92672 27482Caixa Deposits as Total (156) (155) (1531) (129)----------------------------------------------------------------------------------------------------------------Source Caixa Econocircmica Federal Relatoacuterios de Administraccedilatildeo 2005-2008
The liability side of Caixa balance sheets from 2005-8 suggests that the bank hasdistanced itself from reliance on official savings programs and funding toward consumerbank and savings deposits Bank deposits increased from R$69 billion in 2005 to overR$132 billion in 2008 Savings deposits increased from R$532 billion in 2005 to overR$925 billion in 2008 Furthermore the increase of mid-term savings deposits originatedfrom sale of savings certificates instead of escrow held by the Caixa the latter subject to
judicial review and removed from balance sheets in 2008 The value of funds deposited at theCaixa from government funds and programs increased from R$79 billion in 2005 to R$110billion in 2008 although it remains less than ten percent of total deposits In terms of totalvalue of deposits and savings the Caixa increased total value of deposits from 107 billion toover 165 billion from 2005-8
Caixa Loans 2005-8 R$ million2005 2006 2007 2008 2009 2020 2011
----------------------------------------------------------------------------------------------------------------Commercial 14652 16329 19134 28854
Consumer 8925 9474 11063 13747Business 5727 6854 8071 15107
Home 20208 26113 32475 45075Sewage and Infrastructure 1646 2556 3585 5445Other 690 691 694 689Risk Provision -3773 -4469 -5090 -6900Total Caixa Loans 37195 45689 55888 80062----------------------------------------------------------------------------------------------------------------Source Caixa Econocircmica Federal Relatoacuterios de Administraccedilatildeo 2005-8
8132019 Government Banking and BRICs in the Recent Financial Crisis
httpslidepdfcomreaderfullgovernment-banking-and-brics-in-the-recent-financial-crisis 2457
983106983122983113983107 983111983151983158983141983154983150983149983141983150983156 983106983137983150983147983155 983137983150983140 983110983145983150983137983150983139983145983137983148 983123983156983137983156983141983139983154983137983142983156
24
In terms of lending the data suggests that the primary focus of the Caixa on homeloans continued during the late 2000s although substantial increases in commercial lendingfor consumer credit and businesses suggest the diversification of the Caixa across creditmarkets Since 2005 Caixa lending to consumers and business increased from R$89 billionto R$137 billion and from R$57 billion to R$151 billion respectively in 2008
And unlike the high levels of bad and late credit reported during the adjustment to theend of high inflation in 1994-6 and financial crises (1994-5 1997 1998 1999 2001 2003)the level level of late loans at the Caixa fell substantially during the years of economicgrowth and credit expansion from 2006-2008 The percent of late over total loans at the Caixafell from 68 percent in 2006 to 40 percent in 2008 for commercial loans generally and from62 percent to 59 percent for consumer loans and 75 percent to 22 percent for loans tobusiness The value of late home loans as a percent of total home loans also fell from 31 to17 percent in 2008
Caixa AA-H Credit Classification 2001-8
Days Prov-Late ision 2001 2002 2003 2004 2005 2006 2007 2008 2009 2010 2011
---------------------------------------------------------------------------------------------------------------------------------------AA lt15 0 59 56 66 63 54 50 63 94A lt15 05 243 264 313 288 393 435 401 333---------------------------------------------------------------------------------------------------------------------------------------B 15-30 1 127 126 137 139 143 158 206 271C 31-60 3 203 166 145 169 167 192 194 192D 61-90 10 178 261 207 217 133 60 45 33---------------------------------------------------------------------------------------------------------------------------------------E 91-120 30 18 19 20 20 22 13 09 07F 121-50 50 49 15 15 14 10 07 07 07G 151-80 70 15 08 09 10 08 10 10 09
H gt180 100 104 87 85 77 68 72 61 51R$billion 2094 2353 2614 3016 3855 4736 5739 818---------------------------------------------------------------------------------------------------------------------------------------Source Caixa Annual Reports 2002-2008
The credit risk matrix of Caixa loans from 2001 to 2008 confirms this trend ofimprovement (See above table) The data also provide evidence of greater transparency andthe improvement of bank reporting and accounting standards as well as Central Banksupervision of banks Instead of two categories of credit (good = all loans up to 90 daysoverdue bad = loans over 90 days overdue) the Central Bank of Brazil has adoptedinternational standards of credit classification (from AA to H) and imposed regulations that
banks increase or decrease provisions according to the distribution of loans in thesecategories The scale of provisions required by the Central Bank vary from zero percentagainst loans classified as AA to provision of 100 percent of loan values for credits classifiedas H that is to say over 180 days late
The percent of loans over 180 days late has decreased from 104 percent of total in2001 to 51 percent in 2008 Furthermore all categories of late payment except for loansbetween 15-30 days late decreased significantly from 2001 through 2008 In comparisonloans classified as AA (paid and guaranteed) and A (paid on time) increased from 59 percentto 94 percent and 243 percent to 333 percent of total loans The only category of late loansthat increased over the period is that of loans 15-30 days overdue from 127 percent to 271percent of total
The central argument of this study is that Brazilian federal government banks retaininstitutional foundations of competitive advantage over private and foreign banks Further
8132019 Government Banking and BRICs in the Recent Financial Crisis
httpslidepdfcomreaderfullgovernment-banking-and-brics-in-the-recent-financial-crisis 2557
983106983122983113983107 983111983151983158983141983154983150983149983141983150983156 983106983137983150983147983155 983137983150983140 983110983145983150983137983150983139983145983137983148 983123983156983137983156983141983139983154983137983142983156
25
data that suggests this advantage can be seen in the increasing volume and market share ofthe Caixa in debit and credit cards The number of Caixa debit cards increased from 224million in 2002 to over 482 million in 2008 with Caixa market share of debit cards increasedfrom 196 percent ot total card market in 2002 to peak at 230 percent in 2005 and remainingat 219 percent of the total number of debit cards in Brazil in 2005
Two examples illustrate the institutional foundations of comparative advantage of theCaixa in the card payment industry First like other banks in Brazil the Caixa shares anagreement with Visa for payment processing However unlike other banks in Brazil theCaixa was contracted by the federal government to distribute ATM citizenship cards torecepients of federal government family grants and other transfer programs Apparentlywithout seeking approval the Caixa stamped its brandname on the federal government ATMcitizenship card and has continued to do so despite charges of unfair competition fromprivate domestic banks Furthermore a Caixa request to transform its 110 million ATMcitizenship cards into bank cards currently pending at the Central Bank would dramaticallyincrease the number of bank card holders in Brazil (1824 million at year end 2007)
Caixa Debit and Credit Card Market Shares 2002-2008
Million Debit Cards Million Credit Cards MillionCaixa Total Mkt Caixa Total Mkt Interbank Checks
----------------------------------------------------------------------------------------------------------------2002 224 1142 (196) 16 407 (39) 229502003 280 1254 (223) 18 440 (40) 213602004 320 1491 (213) 20 535 (37) 196702005 377 1639 (230) 25 675 (37) 183902006 384 1744 (220) 31 952 (32) 162202007 400 1824 (219) 39 1177 (33) 144902008 482 42----------------------------------------------------------------------------------------------------------------Source Central Bank of Brazil Diagnoacutestico do Sistema de Pagamentos de Varejo do Brasil Adendo Estatiacutesticondash 2007 p 9 and Caixa annual reports 2003-2008
Having reviewed the Banco do Brasil and Caixa a brief look at the counter-cyclicalpolicies and performance of the third Brazilian federal government bank ndash the BNDES ndash is inorder
Banco Nacional de Desenvolvimento Econocircmico e Social (National Bank for Economic
and Social Development BNDES)
The BNDES is a paradigmatic development bank The trajectory of the BNDES involves asequence of policies and financial practices that have shaped Brazilian development Duringthe 1950s the BNDE supplied direct credits for transportation electric energy infrastructureand steel production During the 1960s the bank diversified under financial reforms Duringthe 1970s the BNDE acted to complete state-led import substitution industrialization bychanneling foreign finance and forced savings into capital goods project lending and regionaldevelopment programs During the 1980s the bank shifted away from public investmentunder pressure of fiscal crisis and foreign debt During the 1990s the BNDES became agentfor the privatization of state owned enterprises The BNDES remained virtually the onlysource of long-term finance during a decade of financial crises in emerging markets (1994-2003) Since 2000 the bank has shifted toward ldquosecond generationrdquo reforms designed tofinance the private sector and free market forces deepen domestic capital and equity markets
8132019 Government Banking and BRICs in the Recent Financial Crisis
httpslidepdfcomreaderfullgovernment-banking-and-brics-in-the-recent-financial-crisis 2657
983106983122983113983107 983111983151983158983141983154983150983149983141983150983156 983106983137983150983147983155 983137983150983140 983110983145983150983137983150983139983145983137983148 983123983156983137983156983141983139983154983137983142983156
26
and lend to small medium and micro-enterprises Since 2004 capital inflows and a boomingdomestic stock market have reinforced the capacity of the BNDES to underwrite long-terminvestments and transform large Brazilian firms into multinational corporations Since 2007BNDES President Coutinho has pursued a full service approach attempting to help star-upsmall and medium firms provide funds to expand successful firms and participate in venture
capital funds to help enterprises transit toward corporate governance standards and initial orsecondary offerings of stock on the Bovespa exchange In 2008 as financial crisis led to ashortage of credit collapse of share prices and sharp decline in industrial production byfourth quarter 2008 the BNDES also provided lending of last resort to major Braziliancorporations while retaining long term goals for massive investments in deep sea petroleumproduction
BNDES Market Share of Interbank and Non-Bank Loans 1995-2008 US$ Billion
Interbank Loans Non-Bank Loans------------------------------------------ ------------------------------------------
BNDES Mkt Total BNDES Mkt Total-----------------------------------------------------------------------------------------------------------1995 156 (324) 481 80 (38) 20711996 181 (354) 511 109 (49) 21981997 197 (278) 707 145 (68) 21031998 216 (355) 608 230 (113) 20201999 204 (410) 497 150 (35) 14282000 243 (439) 553 152 (96) 15772001 259 (504) 515 145 (104) 13912002 233 (443) 525 137 (130) 10512003 261 (419) 622 200 (141) 14152004 306 (408) 749 218 (122) 17862005 343 (373) 918 277 (113) 24312006 388 (350) 1106 329 (102) 32312007 524 (335) 1563 432 (88) 48852008 530 (493) 1073 456 (96) 4743200920102011-----------------------------------------------------------------------------------------------------------Source Central Bank of Brazil Top 50 Banks 1995-2008
Revew of BNDES lending since 1995 suggests the realization of competitiveadvantages typical of a large centralized development bank Contrary to the extensive branchoffice networks retained by the Banco do Brasil and Caixa the BNDES retains under 1900employees (compared to 105000 at Caixa) in the Rio de Janeiro and four regional officesSince 1995 the BNDES increased its market share of non-bank loans from R$80 billion (38percent) to R$200 billion (141 percent) during the economic downturn risk aversion andcredit shortage in 2003 After 2003 the BNDES market share of loans to non-financialentities decreased to 88 percent of total loans albeit increasing during 2008 to 96 percentThis suggests that the BNDES has increased its market share of lending to non-financialsector since liberalization of the industry and privatization of state government banks
8132019 Government Banking and BRICs in the Recent Financial Crisis
httpslidepdfcomreaderfullgovernment-banking-and-brics-in-the-recent-financial-crisis 2757
983106983122983113983107 983111983151983158983141983154983150983149983141983150983156 983106983137983150983147983155 983137983150983140 983110983145983150983137983150983139983145983137983148 983123983156983137983156983141983139983154983137983142983156
27
BNDES inter-bank lending also increases substantially Since the Real Plan endedinertial inflation in 1994 the BNDES has expanded its market share of interbank lendingfrom 156 billion (324 percent) in 1995 to 530 billion (493 percent) in 2008 during creditshortage and stock market collapse During previous years of financial crisis and economicreversals the BNDES also increased interbank lending significantly For example during the
1999 and 2001 crises BNDES interbank lending increased to 410 percent and 504 percentof total This marked presence in interbank loan market reflects the role of the BNDES inproviding indirect lending to targeted sectors through private foreign and other governmentbanks in Brazil
BNDES Loan Approvals by Program 1995-2007 R$ Billion
Direct Lending 1999 2000 2001 2002 2003 2004 2005 2006 2007 2008 2009--------------------------------------------------------------------------------------------------------------------------------------Finem 51 55 68 133 79 114 132 145 220 285Capital Markets 16 19 09 08 09 06 20 34 35 104Export-Import 23 34 39 77 63 56 67 40 13 32
Sub-Total 91 109 118 219 153 177 220 221 269 424Percent Total (505) (474) (468) (585) (456) (447) (469) (430) (415) (464)
Indirect Lending--------------------------------------------------------------------------------------------------------------------------------------Finem 31 40 37 16 12 16 18 27 51 60Finame 16 25 33 40 53 66 93 107 170 221Finame Agro 07 13 18 30 28 45 21 14 20 27Finame Leasing 00 000 02 02 03 02 04 06 14 16Export-Import 14 23 20 40 56 54 73 97 67 95BNDESautom 18 17 22 24 27 34 36 35 50 55Sub-Total 89 120 134 154 182 220 249 292 379 484Percent Total (495) (526) (532) (415) (544) (553) (531) (570) (585)(536)
BNDES Total 180 230 252 374 335 398 469 513 648 908----------------------------------------------------------------------------------------------------------------Source BNDES statistics by modality available on wwwbndesgovbr
Review of BNDES finance by program suggests the evolution of credit policies from1995 through 2008 and increasing reliance on indirect lending through other financialintermediaries The three major programs of direct finance Financiamento aEmpreendimentos (Business Finance Finem) Mercado de Capitais (Capital Markets) andExport-Import finance remained between 505 percent and 415 percent of total BNDESlending with the exception of 2002 Indirect lending through six broad programs remained
between 495 percent and 585 pecent of total BNDES lending with the exception of 2002Indirect lending programs include Finem business lending Financiamento de Maquinas(Machine Finance Fineme) with agricultural and leasing modalities Export-Import financingand BNDES automatic lending provisions
These trends suggest the realization of competitive advantages over private andforeign banks in Brazil BNDES long term interest rates remained substantially lower thanSelic benchmark overnight inter-bank interest rates throughout this period while the lowercost of small staff and operations of the BNDES made lending at these rates viable Anothercompetitive advantage of the BNDES over private and foreign banks is the developmentbankacutes mandate as manager of funds from the forced savings fund Fundo de Amparo ao
Trabalhador (Worker Asssistance Fund FAT) Constitutionally mandated investments inproductive activities (not government bonds) increased from R$31 billion in 2000 to R$101
8132019 Government Banking and BRICs in the Recent Financial Crisis
httpslidepdfcomreaderfullgovernment-banking-and-brics-in-the-recent-financial-crisis 2857
983106983122983113983107 983111983151983158983141983154983150983149983141983150983156 983106983137983150983147983155 983137983150983140 983110983145983150983137983150983139983145983137983148 983123983156983137983156983141983139983154983137983142983156
28
billion in 2008 comprising 170 percent of BNDES liabilities This means that 170 percentof BNDES finance and lending is based on long-term deposits that provide no liquidity riskThis provides a competitive advantage over private and foreign banks
A closer look at BNDES lending by sector suggests that the bank still focuses
primarily on industry and infrastructure Despite the adoption of second generation reformsthat seek to free market forces and accelerate innovation and productivity through small andmedium enterprises BNDES lending still focuses on large scale industrial and long-terminfrastructure finance In this respect the BNDES embodies a persistent need in developingeconomy for state-led development banking along the lines emphasized by Lewis Myrdaland development economists 50 years ago This traditional sense of commanding heights thusstill captures the role of the BNDES in Brazilian political economy Despite more than twodecades of privatizations financial liberalization bank reforms and a variety of fiscalfinancial and economic reforms that have substantially modernized the domestic Brazilianeconomy and freed market forces the BNDES remains the single most important source forlong-term finance and credit The capitalization of the Bovespa stock market from 2004-
2008 for the first time in Brazilian history reduced the virtual monopoly of BNDES overlong term finance
BNDES Operations approved and invested by Sector 1998-2007 R$billion
1998 1999 2000 2001 2002 2003 2004 2005 2006 2007Industry ----------------------------------------------------------------------------------------------------------------------------approved 96 79 126 152 171 163 145 290 395 402invested 76 84 104 132 174 161 158 234 272 306
Infrastructure ----------------------------------------------------------------------------------------------------------------------approved 116 69 110 65 161 149 137 186 240 369invested 83 66 86 75 130 100 152 171 170 209
Other--------------------------------------------------------------------------------------------------------------------------------approved 18 47 40 54 79 93 117 69 108 126investedTotal --------------------------------------------------------------------------------------------------------------------------------approved 230 195 276 271 411 404 379 545 743 897invested 190 181 230 252 374 335 398 470 513 617
----------------------------------------------------------------------------------------------------------------Source BNDES Annual Reports 2003-2008 and testimony of BNDES President to Congress March 2009
Long-term investments have produced substantial profits at the BNDES The bank hasrecorded profits each year since 1999 increasing from over R$600 million in 1999 overR$32 billion during 2005 reaching over R$73 billion in 2007 The long-term character of
BNDES finance stands in stark contrast to policies at private banks Contrary to strategy ofprivate and foreign banks to trade and hold government paper described in chapter three theBNDES suspended purchase and trading in government paper because of constitutionalmandates to contribute to development and employment Furthermore the turn to capitalmarkets at the BNDES has provided substantial returns since 2004
However this does not mean that BNDES lending protected unproductive industriesInstead of wasting resources to unnecessarily bail out firms or provide crony credit highreturns and strong profits at the BNDES suggest that lending was sound Standard indicatorsof bank performance asset quality and capital reserves against credit and capital risk provideempirical control for this All these measures suggest that the BNDES weathered the periodof adjustment and sustained counter-cyclical investment policies without placing resources atrisk beyond Central Bank of Brazil regulations and BIS guidelines And returns have
8132019 Government Banking and BRICs in the Recent Financial Crisis
httpslidepdfcomreaderfullgovernment-banking-and-brics-in-the-recent-financial-crisis 2957
983106983122983113983107 983111983151983158983141983154983150983149983141983150983156 983106983137983150983147983155 983137983150983140 983110983145983150983137983150983139983145983137983148 983123983156983137983156983141983139983154983137983142983156
29
increased since recovery in 2004 BNDES participation in the booming Bovespa stock marketsince 2003 has provided record returns
The BNDESpar subsidiary that invests in capital markets has also recorded strongreturns during the period of economic growth and into the 2008 financial crisis BNDESparreturns on liquid assets increased from 75 percent in 2004 to 277 percent in 2007 declining
to 245 percent in 2008 Average returns on assets and stock holdings also remained highbuilding the assets held by the BNDESpar subsidiary from 141 billion in 2005 to 359 billionin 2008
This increased participation of the BNDES in capital markets involves new relationsand networks across government private sector labor unions the private pension funds ofgovernment bank and government enterprise employees and financial markets By 2007BNDES participation in stockholding and mutual funds reached across 261 forms and 25mutual funds totaling over R$910 billion reals The BNDES thereby retains broad portfoliothat represents institutional foundations of comparative advantage Furthermore unlike thepolicy of private and foreign banks to trade and hold high interest rate paying short termgovernment paper during the sudden stop of foreign finance and downturn in the Brazilian
business cycle (2002-3) the BNDES expanded credit operations and reduced financialoperations in secondary markets for indexed government paper This countered the perverseimpact of the liquidity preference among private and other government banks that increasedmarket pressures and led to shorter terms and higher cost of Brazilian government debt
BNDES aversion of government paper is required by constitutional mandate tomanage forced savings funds in ways that generate employment and income As noted alarge part of BNDES resources (liabilities) are from domestic official savings programs Thevalue of FAT resources increased from R$492 billion in 2003 to R$662 billion in 2005while the PIS-Pasep fund remained at approximately R$200 billion Foreign capital has alsobeen channeled to the BNDES through multilateral agencies and foreign bond issues Foreignloans to the BNDES have declined Multilateral agencies provided R$70 billion in 2003increased funding to R$129 billion during 2004 and continued to provide R$107 billion tothe BNDES during 2005
Comparison of BNDES structure and performance with development banks abroadsuggests both the large scale and scope of BNDES operations and controls formismanagement and political abuse of the bank In 2007 BNDES total assets are almostdouble the value reported by the Inter-American Development Bank (IADB) over frac12 thevalue of total assets held by the World Bank and almost ten times the value of assets held bythe French government development bank CAF Furthermore profits and loans from theBNDES far exceeded all three institutions The US$330 billion in loans reported by theBNDES far exceed the US$67 billion from the IADB the US$110 reported by the World
Bank and US$58 billion reported by the CAF BNDES profis returns on assets and return onliquid patrimony also far exceeded those reported by these three development banks thatserve as comparative control over performance and policies at the BNDES Finally lateloans at the BNDES remained at 011 percent of total loans well below levels reported by theWorld Bank comparable to the 010 percent reported by the IADB while considerably abovethe 001 percent reported by CAF
8132019 Government Banking and BRICs in the Recent Financial Crisis
httpslidepdfcomreaderfullgovernment-banking-and-brics-in-the-recent-financial-crisis 3057
983106983122983113983107 983111983151983158983141983154983150983149983141983150983156 983106983137983150983147983155 983137983150983140 983110983145983150983137983150983139983145983137983148 983123983156983137983156983141983139983154983137983142983156
30
Comparison of BNDES and Regional Development Banks 2007 US$ billion
BNDES IADB World Bank CAF----------------------------------------------------------------------------------------------------------------Total Assets 1144 699 2080 125
Liquid Patrimony 140 203 399 41Liquid Profits 38 01 -01 04Desembolsos 339 67 110 58Credit Portfolio 928 479 978 95Capitalization percent 123 291 192 328Return on Assets percent 38 47 na 36Return on PL percent 332 07 na 105Late Loans percent 011 010 086 001----------------------------------------------------------------------------------------------------------------Source BNDES Annual Report 2007
The large scale of BNDES lending and finance make it possible for governmentpolicy to provide counter cyclical credit to avert or ameliorate economic downturns andsubstitute private and foreign credit shortages In March 2009 testimony to Congress ongovernment policies during financial crisis BNDES President Coutinho argued that bankpolicy was to reduce the cost and increase the supply of credit Resources for counter cyclicallending during 2008-2009 came from Treasury loans to BNDES released by provisionaldecrees 439 and 414 summing R$175 billion transfer of R$60 billion in CVS funds sale ofFGTS Investment Fund and bank certificates summing R$170 billion Furthermore the thirdphase of conditional credit facility shared by Inter-American Development Bank and theBNDES provided the last tranch of a total US$60 billion for BNDES operations
Two further means were used by the BNDES to infuse capital during the collapse of
the stock market and shortage of credit during 2007-8 The counter cyclical policies of theBNDES can also be seen in the over two fold increase of BNDES holdings in private equityand investment funds Table 512 reports the value of private equity and investment fundholdings of the BNDES in 2007 and 2008 BNDES funds in private equity and mutual fundsincreased from R$4038 million in 2007 to over R$10 billion in 2008 The capitalization ofmutual funds and private equity firms by the BNDES also played an important countercyclical role during this period
BNDESpar Shareholding 2007-8 R$million
Percent Value ValueShares 2008 2007
----------------------------------------------------------------------------------------------------------------Ameacuterica Latina Logiacutestica 106 6386 -Aracruz 55 1292 1292Banco do Brasil 25 10854 12752Bom Gosto (2) 345 2458 -Brasil Telecom Part 30 1666 1958Braskem 52 2275 2432Brenco 209 1400 -CEG 345 1406 -CESP 57 2347 1397Coteminas 103 1150 1340
CPFL Energia 62 6081 5506Cia Sideruacutergica Nacional 36 1513 2686CVRD 40 15082 7098
8132019 Government Banking and BRICs in the Recent Financial Crisis
httpslidepdfcomreaderfullgovernment-banking-and-brics-in-the-recent-financial-crisis 3157
983106983122983113983107 983111983151983158983141983154983150983149983141983150983156 983106983137983150983147983155 983137983150983140 983110983145983150983137983150983139983145983137983148 983123983156983137983156983141983139983154983137983142983156
31
ELETROBRAacuteS (1) 118 22400 22400EMBRAER 50 1096 1096Gerdau 35 1533 490Independecircncia 139 2500 -JBS 130 14722 11370Klabin 202 5621 -
Light 336 8225 -Marfrig 146 8176 1020MPX Mineraccedilatildeo 26 1791 1791Ouro Fino 200 1057 840Paranapanema 175 1252 08Petrobraacutes 76 10226 10226Rede Energia SA 253 2633 -Tele Norte Leste Participaccedilotildees 16 1645 1645Valepar 97 26254 15585Subtotal 163055 102941Other firms 12223 12606Total 175278 115548----------------------------------------------------------------------------------------------------------------
Source BNDESpar Financial Statements 2008 pp
The BNDES also holds blocks of shares in many major Brazilian corporationsthrough its participation subsidiary BNDESpar Comparing value of investments in 2007 and2008 suggests that large purchases capitalized firms precisely as financial crisis and downturnin Bovespa stock market made it difficult for firms to find working capital Table X reportsthe percent of total company shares held by the BNDES and their respective market values(adjusted for risk of future losses) at year end 2007 and 2008 During this year of extremelyshort and expensive credit in Brazil caused by the international financial and banking crisisthe BNDES increased shareholding by over R$60 billion reals in 28 private Brazilianenterprises Further shareholding classified as X in Five firms (Bertin 269 Brasiliana 538
Copel 239 Rio Poliacutemeros 250 Telemar 313) Once again the BNDES provided access tocapital for firms caught in the sudden credit crunch and stock market collapse unable to meetobligations or raise funds through equity issues or commercial bank credit This countercyclical role of government banks has been critical in Brazil since the 19 th century
BNDESpar Private Equity and Fund Participation 2007-2008 R$million
Fund Manager 2008 2007-------------------------------------------------------------------------------------------------------------------------Brasil 21 Dynamo 46 60PROT Mellon Financial Services 4628 -
Logiacutestica Brasil Bradesco 135 -Fire BrasilPrivate 269 250FIPGG Governanccedila amp Gestatildeo Inv 289 311Opportunity Equity Partners Mellon Financial Services 1046 578Brasil Energia Bradesco 1184 655InfraBrasil ABN-Amro 677 251Rio Bravo Cinema Rio Bravo 116 110Brascan Petro amp Gaacutes Bank Brascan 136 113AG Angra Infra-Estrutura Bradesco 380 301Satildeo Paulo Metro Fund Bradesco 791 831Other Funds 653 572Total 10356 4038---------------------------------------------------------------------------------------------------------------------------
Source BNDESpar Financial Statements 2008
8132019 Government Banking and BRICs in the Recent Financial Crisis
httpslidepdfcomreaderfullgovernment-banking-and-brics-in-the-recent-financial-crisis 3257
983106983122983113983107 983111983151983158983141983154983150983149983141983150983156 983106983137983150983147983155 983137983150983140 983110983145983150983137983150983139983145983137983148 983123983156983137983156983141983139983154983137983142983156
32
Finally Brazilian federal government triennial plans include investment targets by theBNDES If current plans are compared to 2004-7 investments several structural changes inBNDES lending appear First BNDES plans for Oil and Petroleum production reveal aprofound change for Brazilian political economy In 1990 roughly 45 percent of oilconsumed in Brazil was imported In 2007 before oil price increased reversed the balance
Brazil reported domestic production levels sufficient to meet domestic consumptionFurthermore discoveries of substantial deep sea oil reserves have led the BNDES to planmassive investments involving Petrobras and other global petroleum firms For the 2009-2012 period investments in petroleum and gas (R$2697 billion) Petrochemicals (237) andEthanol (197) sum to over R$3130 billion
BNDES Triennial Investment Plans 2004-2012
2004-7 2007-10 2008-11 2009-12----------------------------------------------------------------------------------------------------------------Petroleum amp Gas 1472 1836 2028 2697
Mining 472 527 813 480Petrochemicals 64 174 264 237Steel 198 371 312 245Automotive 150 176 264 235Electronics 143 156 140 240Ethanol 166 205 205 197Paper amp Celulose 104 200 274 90Health 51 46 51 80Industry Total 2816 3802 4437 4501----------------------------------------------------------------------------------------------------------------Source BNDES Annual Reports 2002-2006
It is of note that President Dilma Roussef was instrumental in reducing the targets for2009-12 in petroleum and gas given indications that Petrobras and existing framework foroffshore oil prospecting and production proved unable to increase investments accordingly
The BNDES also retains a presence in government projects by providing managementassistance During 2008 BNDES staff provided management support for implementation of192 projects involving R$710 billion of total R$142 billion PT government growthacceleration projects BNDES staff also participated in the design management andimplementation of President Lularsquos Poliacutetica de Desenvolvimento Produtivo (Policy forProduction Development) involving R$2100 billion targeting production chains designed tomaximize employment and regional development benefits Finally the BNDES was alsocharged to create and co-manage a Fundo Amazonia with the Ministry of Environment toprovide incentives to reduce deforestation of the Amazon region BNDES Plans for 2009include completion of concession for construction of high speed train line and service for Riode Janeiro-Satildeo Paulo corridor two blocks of highway concession sales involving three majorhighways in each block of sales sale of management concessions for regional airports andthe reorganization of INFRAERO federal government airport management company
These policies reflect the goal of BNDES policy to launch firms on the stock marketrather than maintain direct credit and finance Exceptions during 2008 involve Auto andEthanol industies both for strategic and broader policy reasons Given the sharp downturn inauto sales during fourth quarter 2008 the BNDES provided significant lending to avert
further downsizing or failure of auto companies in Brazil Given the current globalredistribution of automobile production BNDES policies are designed to help the Brazilian
8132019 Government Banking and BRICs in the Recent Financial Crisis
httpslidepdfcomreaderfullgovernment-banking-and-brics-in-the-recent-financial-crisis 3357
983106983122983113983107 983111983151983158983141983154983150983149983141983150983156 983106983137983150983147983155 983137983150983140 983110983145983150983137983150983139983145983137983148 983123983156983137983156983141983139983154983137983142983156
33
operations of major auto firms through the period of adjustment and increase theattractiveness of domestic operations in global production strategies of multinational autocompanies Ethanol production also received massive funds to sustain an industry seen ascritical for alternative and sustainable fuel source capable of replacing petroleum Ethanolreached over 50 percent of automotive fuel sales in 2007
Under the Lula government (2003-10 the BNDES also resumed lending to state andmunicipal governments Since the renegotiation of municipal and state government debts inthe late 1990s states and municipalities have been largely prohibited from taking on debtThis was emplematic of the recentralization required to control fiscal excesses during militaryrule and the prolonged period of transition to democracy Policies during the 1990s weredesigned to avert overspending seen as critical to maintain price stability under the Real Plan(1994) In 2000 the Lei de Responsibilidade Fiscal (Fiscal Responsibility Law) largelyprohibited credit and finance to state and municipal governments Since 2000 municipalitiesand states have been required to submit detailed budget statements that in turn have been thebasis for a gradual return to sub-national government finance In August 2006 central bankand Treasury regulations freed municipalities to take on credit up to 12 times liquid receipts
Since then the BNDES has led in terms of credits and finance to subnational governmentsthrough a Programa Especial de Financiamento aos Estados e Distrito Federal
The BNDES also has developed the first system in Brazil for risk analysis ofmunicipal governments and has led in the market for municipal credit freed by August 2006procedures for approval at Treasury the Central Bank and Conselho Monetaacuterio Nacional(National Monetary Council) Prosecution of mayors and firms charged with managingmunicipal credits with the BNDES revealed fraudulent practices These funds for sub-national public finance also became critical mechanisms to counter severe budget shortfallscaused by financial crisis during 2008 Given that municipal and state government tax basesare shallow and that federal government transfers provide the bulk of sub-nationalgovernment resources the Lula administration allocated R$ 40 billion to the Fundo deParticipaccedilatildeo dos Estados (State Participation Fund) through a Programa Emergencial deFinanciamento (Emergency Finance Fund) administered by the BNDES
In sum the BNDES expanded credit and finance operations substantially during fouryears of sustained growth from 2004-2007 And having helped underwrite the stock marketboom and capitalized Brazilian firms directly and indirectly through credit finance mutualfunds and private equity funds the BNDES retained sufficient scale scope and capital baseto provide counter cyclical credit and finance to help firms adjust to financial crisis and creditshortage during 2008 In retrospect the growth of the BNDES since liberalization andprivatizations of state government banks in the 1990s suggest the comparative advantages of
development banking BNDES credit and finance fell to 52 percent of fixed capitalformation in 1995 Since then the turn to neo-developmentalism and a period of sustainedeconomic growth during the Lula administration increased the BNDES share of total fixedcapital formation during 2006 and 2007 to 126 and 141 percent Critics charge thatmonopoly over FGTS and PIS-PASEP official savings funds as liabilities provide theBNDES with unfair competitive advantage over private banks In 2008 forced savings fundssummed to only 17 percent of BNDES liabilities (resources) The BNDES does not relyexclusively on forced savings for competitive advantage Instead market-oriented policies
joint-ventures with private mutual funds investment funds private equity firms large blocksof shareholding in Brazilian firms and massive amounts of credit and investment to theprivate sector at below market but still profitable long term interest rates of 625 percent
suggest that the large scale and scope of BNDES operations provide institutional foundationsof competitive advantage over private and foreign banks
8132019 Government Banking and BRICs in the Recent Financial Crisis
httpslidepdfcomreaderfullgovernment-banking-and-brics-in-the-recent-financial-crisis 3457
983106983122983113983107 983111983151983158983141983154983150983149983141983150983156 983106983137983150983147983155 983137983150983140 983110983145983150983137983150983139983145983137983148 983123983156983137983156983141983139983154983137983142983156
34
Capitalization of the BNDES by Treasury of over R$2300 billion 2009-11hascaptured attention of many observers of Brazilian development Critics and advocates agreethat the BNDES has realized significant competitive advantages over private and foreignbanks and continues to serve as significant alternative to capital markets for large scaledevelopment projects However like the downturn in planned investments by Petrobras for
oil and gas exploration and production BNDES decreased planned investments fromR$1684 billion in 2010 to R$1397 billion in 2011 We believe this indicates the limits ofmanagement and passing of period of crisis both favoring finance from capital marketsbanks and public-private partnerships
India
Analysis of Brazilian federal banks suggests that these institutions provided policy alternativewhile realizing competitive advantage over private and foreign banks The modernization ofthese institutions helps explain why these large institutions were able to stay the effects ofcredit crunch and financial market downturn in Brazil This section explores data from the
Reserve Bank of India to compare market shares of types of banks from 1972-2008 and bankperformance from 2006-10 Further analysis will be required However the data appears tosupport our core argument that government banks have modernized and realized competitiveadvantages over private and foreign banks
First the number of branch offices which serves as a measure of institutionalcoverage across India of special concern for financial inclusion and the theory thatliberalization and privatizations would lead private banks to expand branch offices andincrease the supply of services From this perspective the trajectory of branch officessuggests that nationalized banks the State Bank of India and regional rural bankssustain much larger networks of branch offices that predominate while otherscheduled commercial (private and foreign) banks retain less than 8000 branch offices
Data from the Reserve Bank of India on the number of current accounts retainedby type of bank provide further evidence that the State Bank of India and its associates
8132019 Government Banking and BRICs in the Recent Financial Crisis
httpslidepdfcomreaderfullgovernment-banking-and-brics-in-the-recent-financial-crisis 3557
983106983122983113983107 983111983151983158983141983154983150983149983141983150983156 983106983137983150983147983155 983137983150983140 983110983145983150983137983150983139983145983137983148 983123983156983137983156983141983139983154983137983142983156
35
national banks and regional rural banks provide the bulk of banking accounts to theIndian population while private and foreign banks cherry pick upscale urban marketsreproducing capital drain and inequalities
Number of Current Accounts by Type of Bank 1972-1995
Since 1999 the pattern of predominance by alternative banking institutions and the minorrole of other scheduled commercial banks and foreign banks continues
The following figures report the value held in current accounts by type of banks first fromthe 1972-1995 period then from the 1999-2008 period For both time periods the trendconfirms that private and foreign banks remain at a competitive disadvantage in terms of thebroader market while the State Bank of India and its associates nationalized banks andregional rural banks tend to predominate
8132019 Government Banking and BRICs in the Recent Financial Crisis
httpslidepdfcomreaderfullgovernment-banking-and-brics-in-the-recent-financial-crisis 3657
983106983122983113983107 983111983151983158983141983154983150983149983141983150983156 983106983137983150983147983155 983137983150983140 983110983145983150983137983150983139983145983137983148 983123983156983137983156983141983139983154983137983142983156
36
Current Account Value by Type of Bank 1972-1995 R
Number of Deposit Accounts by type of bank 1999-2008
A similar pattern appears for the trajectory of savings accounts both the number of
accounts and the value held in savings accounts both for the 1972-1995 period We wereunable to organize data from the more recent period
8132019 Government Banking and BRICs in the Recent Financial Crisis
httpslidepdfcomreaderfullgovernment-banking-and-brics-in-the-recent-financial-crisis 3757
983106983122983113983107 983111983151983158983141983154983150983149983141983150983156 983106983137983150983147983155 983137983150983140 983110983145983150983137983150983139983145983137983148 983123983156983137983156983141983139983154983137983142983156
37
Number of Savings Accounts by Type of Bank 1972-1995
Value in Savings Accounts by Type of Bank 1972-1995
Number of Term Savings Accounts by Type of Bank 1972-1995
8132019 Government Banking and BRICs in the Recent Financial Crisis
httpslidepdfcomreaderfullgovernment-banking-and-brics-in-the-recent-financial-crisis 3857
983106983122983113983107 983111983151983158983141983154983150983149983141983150983156 983106983137983150983147983155 983137983150983140 983110983145983150983137983150983139983145983137983148 983123983156983137983156983141983139983154983137983142983156
38
Value in Term Savings Accounts by Type of Bank 1972-1995
The number and value of credits extended by banks from 1999-2008 appears mostpromising in terms of comparative analysis of bank performance and behavior Thesignificant spread at the end of the time series between the State Bank of India and itsassociates and foreign banks suggests the impact of foreign financial crisis and differentdomestic policies by these types of banks in India similar to that noted in the Brazilianexperience
Number of credits by type of bank 1999-2008
Value of credit by type of bank 1996-2008
8132019 Government Banking and BRICs in the Recent Financial Crisis
httpslidepdfcomreaderfullgovernment-banking-and-brics-in-the-recent-financial-crisis 3957
983106983122983113983107 983111983151983158983141983154983150983149983141983150983156 983106983137983150983147983155 983137983150983140 983110983145983150983137983150983139983145983137983148 983123983156983137983156983141983139983154983137983142983156
39
Further data from the Reserve Bank of India from 2008-10 permit closercomparison of government private and foreign banks in the recent financial crisis Interms of deposits investments total assets and net profits the dominant and expandingrole of government banking in India is apparent Further control variables (not reported)
include gross and net NPA types of income expenses and expenditures provisions andcontingencies and credit- and investment-deposit ratios provide control for bad bankingand confirm the counter cyclical policies during 2008-10 in India
THE FOLLOWING TABLES REQUIRE INTERPRETATION
Number of Banks 2006-7 2007-8 2008-9 2009-10 2010-11
State Bank of India amp Associates 8 8 7 7 6Nationalized Banks 20 20 20 20 20Old Private Sector Banks 17 15 15 15 14
New Private Sector Banks 8 8 7 7 7Foreign Banks 29 28 31 32 33Source RBI A Profile of Banks 2010-11
Number of Branch Offices 2006-7 2007-8 2008-9 2009-10 2010-11
State Bank of India amp Associates 14673 15848 16894 18178 18772Nationalized Banks 37435 39255 40956 43452 45640Old Private Sector Banks 4723 4690 4908 5220 5011New Private Sector Banks 2599 3635 4333 5232 6957
Foreign Banks 272 277 295 308 316Source RBI A Profile of Banks 2010-11
Number of Employees 2006-7 2007-8 2008-9 2009-10 2010-11
State Bank of India amp Associates 255699 249008 268598 266605 282453Nationalized Banks 473179 466400 462926 473041 475082Old Private Sector Banks 47994 48700 51341 55052 55075New Private Sector Banks 91060 110123 124998 127468 163604Foreign Banks 28426 31301 29582 28012 27968
Source RBI - India BanksAssociation
Business per employee (in lakh) 2006-7 2007-8 2008-9 2009-10 2010-11
State Bank of India amp Associates 43635 54922 65022 73743 79306Nationalized Banks 49001 61828 78316 93586 114477Old Private Sector Banks 48159 56932 63843 69749 8149New Private Sector Banks 80782 83196 78715 84041 82607Foreign Banks 97477 11255 128274 141139 155974Note Business = Deposits + Advances
8132019 Government Banking and BRICs in the Recent Financial Crisis
httpslidepdfcomreaderfullgovernment-banking-and-brics-in-the-recent-financial-crisis 4057
983106983122983113983107 983111983151983158983141983154983150983149983141983150983156 983106983137983150983147983155 983137983150983140 983110983145983150983137983150983139983145983137983148 983123983156983137983156983141983139983154983137983142983156
40
Profit per employee (in lakh) 2006-7 2007-8 2008-9 2009-10 2010-11
State Bank of India amp Associates 257 362 443 466 42Nationalized Banks 287 377 486 567 695Old Private Sector Banks 234 406 469 42 563New Private Sector Banks 587 685 677 847 893Foreign Banks 1613 2112 2539 1692 2759
Capital amp Reserves amp Surplus(Ycrore) 2006-7 2007-8 2008-9 2009-10 2010-11
State Bank of India amp Associates 42941 61706 72422 83726 84394Nationalized Banks 92689 113079 135920 157276 205857Old Private Sector Banks 10736 15315 17477 20171 23821New Private Sector Banks 39736 76056 82192 99813 114768Foreign Banks 33075 49332 59937 69176 80972
Deposits Ycrore 2006-7 2007-8 2008-9 2009-10 2010-11
State Bank of India amp Associates 633476 773875 1007041 1108086 1245862Nationalized Banks 1360724 1679993 2105706 2583934 3127122Old Private Sector Banks 138249 165589 199274 229897 264157New Private Sector Banks 413738 509444 537104 592904 738602Foreign Banks 150750 191161 214076 232099 240689
Investments Ycrore 2006-7 2007-8 2008-9 2009-10 2010-11
State Bank of India amp Associates 211875 263823 357624 387473 385697Nationalized Banks 452981 536018 655042 828125 942837Old Private Sector Banks 43647 54080 72393 83499 92617New Private Sector Banks 171008 224498 234139 270618 329403Foreign Banks 71471 98910 130354 159291 165499
Advances Ycrore 2006-7 2007-8 2008-9 2009-10 2010-11
State Bank of India amp Associates 482270 593722 739450 857937 994154Nationalized Banks 957877 1203678 1519762 1843082 2311478
Old Private Sector Banks 92887 111670 128504 154085 184647New Private Sector Banks 321865 406733 446824 478356 612886Foreign Banks 126339 161133 165385 163260 195539
Interest Income Ycrore 2006-7 2007-8 2008-9 2009-10 2010-11
State Bank of India amp Associates 53465 70428 89196 97954 109828Nationalized Banks 110720 142647 183892 208029 256490Old Private Sector Banks 11474 14614 18790 20497 23299New Private Sector Banks 38092 56377 66282 62309 73528
Foreign Banks 17924 24417 30322 26390 28520
8132019 Government Banking and BRICs in the Recent Financial Crisis
httpslidepdfcomreaderfullgovernment-banking-and-brics-in-the-recent-financial-crisis 4157
983106983122983113983107 983111983151983158983141983154983150983149983141983150983156 983106983137983150983147983155 983137983150983140 983110983145983150983137983150983139983145983137983148 983123983156983137983156983141983139983154983137983142983156
41
Other Income Ycrore 2006-7 2007-8 2008-9 2009-10 2010-11
State Bank of India amp Associates 9420 11818 16073 18394 19240Nationalized Banks 14264 20979 26394 30500 28625Old Private Sector Banks 1568 2184 2782 3152 3029
New Private Sector Banks 10745 14822 15078 17271 17697Foreign Banks 7044 10588 14894 9951 10972
Interest Expended Ycrore 2006-7 2007-8 2008-9 2009-10 2010-11
State Bank of India amp Associates 32607 47809 61770 66229 67018Nationalized Banks 69353 101093 131676 145712 164135Old Private Sector Banks 7055 9960 12834 14076 14768New Private Sector Banks 25802 38535 44123 37130 42347Foreign Banks 7603 10604 12819 8938 10622
Operating Expenses Ycrore 2006-7 2007-8 2008-9 2009-10 2010-11
State Bank of India amp Associates 15987 16993 20088 25283 29146Nationalized Banks 27268 29670 35416 40792 53819Old Private Sector Banks 2967 3235 3939 4715 5600New Private Sector Banks 12353 17032 17840 18136 22006Foreign Banks 7745 10353 12298 11102 12557
Cost of Funds 2006-7 2007-8 2008-9 2009-10 2010-11
State Bank of India amp Associates 475 59 594 532 48Nationalized Banks 48 582 609 537 493Old Private Sector Banks 498 62 667 613 55New Private Sector Banks 524 611 604 442 427Foreign Banks 403 433 446 283 311Cost of Funds = Ratio () of interest paid on deposits and borrowings to averageof opening and closing balances of deposits and borrowings
Return on advances adjusted toCoF 2006-7 2007-8 2008-9 2009-10 2010-11
State Bank of India amp Associates 372 365 395 36 405Nationalized Banks 399 369 409 382 427Old Private Sector Banks 406 426 515 482 492New Private Sector Banks 447 505 526 514 516Foreign Banks 574 66 815 716 564
2006-7 2007-8 2008-9 2009-10 2010-11
8132019 Government Banking and BRICs in the Recent Financial Crisis
httpslidepdfcomreaderfullgovernment-banking-and-brics-in-the-recent-financial-crisis 4257
983106983122983113983107 983111983151983158983141983154983150983149983141983150983156 983106983137983150983147983155 983137983150983140 983110983145983150983137983150983139983145983137983148 983123983156983137983156983141983139983154983137983142983156
42
Wages as of Total Expenses
State Bank of India amp Associates 2155 1589 1506 171 1921Nationalized Banks 1794 1405 1331 1365 1641Old Private Sector Banks 1689 1367 1326 1457 1675
New Private Sector Banks 936 956 1017 121 1383Foreign Banks 2008 1995 1944 2348 2331
Returns on Assets 2006-7 2007-8 2008-9 2009-10 2010-11
State Bank of India amp Associates 086 097 102 091 079Nationalized Banks 094 101 103 100 103Old Private Sector Banks 078 114 115 095 112New Private Sector Banks 109 113 112 138 151Foreign Banks 228 209 199 126 174
Capital Adequacy Ratio 2006-7 2007-8 2008-9 2009-10 2010-11
State Bank of India amp Associates 1232 1321 1396 1346 1225Nationalized Banks 1237 1213 1324 1318 1347Old Private Sector Banks 1208 1408 1476 1485 1456New Private Sector Banks 1199 1439 1533 1803 1687Foreign Banks 1239 1305 1432 1726 1672Note To 2007-8 = Basel I From 2008-09 = Basel-II
Net NPA Ratio 2006-7 2007-8 2008-9 2009-10 2010-11
State Bank of India amp Associates 132 143 147 150 149Nationalized Banks 094 077 068 091 092Old Private Sector Banks 096 066 09 082 053New Private Sector Banks 097 109 129 103 056Foreign Banks 073 077 181 182 067Net NPA Ratio = Net non-performing assets as net advances
In sum descriptive data from the Reserve Bank of India confirm the anomaly
and argument drawn from the Brazilian experience An important dimension of BRICcountry recovery from the global financial crisis and downturn is the counter cyclicallending policies and realization of competitive advantages of government banks Thisposes a series of new questions for business schools and scholars of public policyInstead of liberalization and privatization leading to transitions in BRIC countriestoward capital market centered financial systems and liberal market economies publicbanks have realized competitive advantages over private and foreign banks whileproviding policy alternatives to BRIC governments in the face of financial crisis andglobal economic slowdown We return to these implications in the conclusion
One development of note at the Reserve Bank of India is a policy focus onfinancial inclusion The 2008 report of the Committee on Financial Inclusion has beenfollowed by sections of the Reserve Bank of India Annual Report reserved fordiscussion of financial inclusion And instead of focusing on liberalization and
8132019 Government Banking and BRICs in the Recent Financial Crisis
httpslidepdfcomreaderfullgovernment-banking-and-brics-in-the-recent-financial-crisis 4357
983106983122983113983107 983111983151983158983141983154983150983149983141983150983156 983106983137983150983147983155 983137983150983140 983110983145983150983137983150983139983145983137983148 983123983156983137983156983141983139983154983137983142983156
43
privatization to ensure the spread of banking products and services alternative policieshave been explored One is of special note The Committee on Financial Inclusionrecommended issue of identity cards as bank cards This would profoundly change thelandscape of banking in India and has attracted attention from analysts at the CentralBank of Brazil charged with financial inclusion as well as the President of Indonesia
and apparently Uganda officials Given the revolution in information and card paymenttechnologies this policy proposal and pilot studies deserve close attention asalternatives to dramatically increase the pace of social inclusion of the bankless
8132019 Government Banking and BRICs in the Recent Financial Crisis
httpslidepdfcomreaderfullgovernment-banking-and-brics-in-the-recent-financial-crisis 4457
983106983122983113983107 983111983151983158983141983154983150983149983141983150983156 983106983137983150983147983155 983137983150983140 983110983145983150983137983150983139983145983137983148 983123983156983137983156983141983139983154983137983142983156
44
China
This section turns to a brief review of the Chinese banking sector to further explore therole of government banks in terms of their modernization competitive advantages
policy roles and capacity for counter cyclical credit that help explain why BRICcountries were able to avert the severe consequences of the global financial crisis
First figure A11 reports the basic structure of the banking system in China
Although we have been unable to compare the evolution of types of banks acrosstime in similar ways to the above data on India taken from the Reserve Bank of Indiaour research assistants have gathered the following comparative macroeconomicfinancial and balance sheet data on banking in China The data appear to be consistentwith the core argument presented in this paper ndash that government banks havemodernized since liberalization and provided policy makers with alternative means tocounter the effects of financial crisis abroad
8132019 Government Banking and BRICs in the Recent Financial Crisis
httpslidepdfcomreaderfullgovernment-banking-and-brics-in-the-recent-financial-crisis 4557
983106983122983113983107 983111983151983158983141983154983150983149983141983150983156 983106983137983150983147983155 983137983150983140 983110983145983150983137983150983139983145983137983148 983123983156983137983156983141983139983154983137983142983156
45
We lack more current information and were unable to collect data directly fromofficial sources in China to compare the trajectory of state owned private and foreignbanks As a substitute Figure 1 reports data from 2000-4 that permits initial observationof trends for this earlier period
Those present may not need reminding of the formidable record of economicgrowth in China during this 200-4 period that continues until today However data fromthe National Bureau of Statistics suggests that the Chinese banking system expanded atan even greater pace than the remarkable levels of GDP growth recorded for the 2000-4period Furthermore credit expansion was ldquoorganicrdquo in the sense that deposits
outpaced credit growth from 2000-4
Expansion of Loans in China 1999-2004
Loan Growth Total LoansYear on Year
Growth Total Depositssup1Year on Year
GrowthYear CNY billion CNY () CNY billion CNY()1999 9373 83 10878 1372000 9937 60 1238 1382001 11231 130 14362 1602002 13129 169 17092 1902003 159 211 20806 217
2004 18857 186 25319 217
sup1Based on preliminary estimates by the National Bureau of Statistics of the Peoplersquos Republic of ChinaSource National Bureau of Statistics of the PRC
Although we lack data comparable to that from the Reserve Bank of India ableto compare the trajectory of state private and foreign banks in China the sectoralbreakdown of loans and other banking and national account data confirms the profoundcapitalization of the Chinese banking system and GDP growth during from 1995-2004
8132019 Government Banking and BRICs in the Recent Financial Crisis
httpslidepdfcomreaderfullgovernment-banking-and-brics-in-the-recent-financial-crisis 4657
983106983122983113983107 983111983151983158983141983154983150983149983141983150983156 983106983137983150983147983155 983137983150983140 983110983145983150983137983150983139983145983137983148 983123983156983137983156983141983139983154983137983142983156
46
China Banking Sector Market Dimensions (1995 - 2004)
YearTotal
LoansCorp
LoansConsuLoans
HomeLoans
TotalDeposits Excess
GovBonds
CorpBonds GDP
GDPGrowth
()1995 52310 mdash mdash mdash 5376 145 330 65 5848 2511996 63100 mdash mdash mdash 6847 538 436 60 6788 1611997 73585 7341 17 130 8212 853 551 52 7446 971998 85002 8447 53 430 9529 102 9 777 68 7835 521999 95587 9394 164 1360 10831 1273 1054 78 8207 482000 108763 10453 424 3320 13486 261 1302 86 894 892001 118990 112 699 5600 15472 3573 1562 101 9593 732002 139800 12913 1067 8258 18339 4359 mdash mdash 10479 922003 169770 15401 1576 13302 22036 5059 mdash mdash 11669 1142004 194220 16848 1988 15800 25319 5897 mdash mdash 13657 170Figures = CNYB
This data reported in terms of percent GDP provides further clarity on the rapid
capitalization of loans It is of note that the bulk of loans during this period were to thecorporate sector with consumer and home loans lagging significantly
China Banking Sector Percent GDP
YEARTotal
LoansCorporate
LoansConsumer
LoansHomeLoans Deposits
ExcessDeposits
GovBonds
CorpBonds
1995 895 00 00 00 919 25 56 111996 929 00 00 00 1009 79 64 091997 988 986 02 02 1103 115 74 071998 1085 1078 07 05 1216 131 99 091999 1165 1145 20 17 1320 155 128 092000 1217 1169 47 37 1508 292 146 102001 1240 1167 73 58 1613 372 163 112002 1334 1232 102 79 1750 4162003 1455 1320 135 114 1888 4342004 1422 1234 146 116 1854 432
Sources China Banking Regulatory Commission Peoplersquos Bank of China and GoldmanSachs research estimates
Compilation of financial data from a select number of banks in China suggeststhat the pattern of bank change encountered in Brazil and India also describes theexperience of China The liberalization of the Chinese economy and the modernization
of state banks appear to describe the process of bank change instead of a process oftransition toward private banking and capital market centered financial systemAlthough we have been unable to draw data from Chinese monetary authorities thebalance sheet data suggests the clear predominance of large state banks in the politicaleconomy of banking and finance in China How these institutions were used to counterthe effects of financial crisis abroad and redirect domestic investment production andconsumption must remain a subject for further research
8132019 Government Banking and BRICs in the Recent Financial Crisis
httpslidepdfcomreaderfullgovernment-banking-and-brics-in-the-recent-financial-crisis 4757
983106983122983113983107 983111983151983158983141983154983150983149983141983150983156 983106983137983150983147983155 983137983150983140 983110983145983150983137983150983139983145983137983148 983123983156983137983156983141983139983154983137983142983156
47
Select Financial Data from Chinese Banks 2004()
CNY (billion)Total
AssetsGrossLoans
CustomerDeposits Equity
NPLRatio
()
Pre-prov
ProfitsNet
Profits
State Banks
ICBC 5671 3705 5105 163 190 653 23CCB 3905 2226 3489 195 39 605 484ABC (NA) mdashBOC 427 2146 3342 205 51 578 209Quasi-State
BoCom 1145 639 1023 54 30 131 16CMB 587 376 513 22 29 82 32CITIC Industrial 515 306 429 20 60 52 03SPDB 456 311 397 14 24 62 20China Everbright mdashGuangdong Development 345 216 301 mdash mdash mdash 32
Industrial Bank 341 203 283 10 25 37 11Quase-Private
Bank of Shanghai 216 106 179 83 51 32 26Hua Xia 304 181 270 92 40 29 10Shenzhen Development 198 126 166 43 114 28 03Bank of Beijing 209 85 174 71 mdash 26 07
Sector total 19422 25319 129Three state-banks 2692 3979 188Second tier banks 2549 3733 148
ABC = Agriculture Bank of China BOC = Bank of China
BOCOM = Bank of Communications CCB = China Construction BankCMB = China Merchantrsquos Bank CNY = yuanICBC = Industrial and Commercial Bank of ChinaNPL = nonperforming loanROA = return on assets ROE = return on equityprov = provisioningPRC = Peoplersquos Republic of ChinaSPDB = Shanghai Pudong Development BankNote Loan and deposit market share for BOC and ICBC are for their domestic operations onlySources Company data Goldman Sachs research estimates
Returns on Assets Equity and Domestic Market Shares of Major China Banks 2004()
CNY (billion) ROA () ROE ()Deposit Mkt
Share ()Loan MktShare ()
Mortgage MktShare()
State Banks
ICBC 004 14 199 187 253CCB 130 254 138 115 217ABC (NA)BOC 051 102 101 89 152Quasi-State
BoCom 015 45 37 29 34CMB 060 161 20 19 29
CITIC Industrial 007 17 17 16 18SPDB 048 153 16 16 26
8132019 Government Banking and BRICs in the Recent Financial Crisis
httpslidepdfcomreaderfullgovernment-banking-and-brics-in-the-recent-financial-crisis 4857
983106983122983113983107 983111983151983158983141983154983150983149983141983150983156 983106983137983150983147983155 983137983150983140 983110983145983150983137983150983139983145983137983148 983123983156983137983156983141983139983154983137983142983156
48
China EverbrightGuangdong Development mdash mdash 12 11 mdashIndustrial Bank 037 126 11 10 10Quase-Private
Bank of Shanghai 129 360 07 05 14Hua Xia 038 116 11 09 07Shenzhen Development 017 75 07 06 08Bank of Beijing 037 108 07 04 07
Sector totalThree state-banks 438 391 622Second tier banks 144 127 154
ABC = Agriculture Bank of China BOC = Bank of China BOCOM = Bank of Communications CCB =China Construction Bank CMB = China Merchantrsquos Bank CNY = yuanICBC = Industrial and Commercial Bank of China mkt = market NPL = nonperforming loan ROA =return on asset ROE = return on equity prov = provisioning PRC =Peoplersquos Republic of China SPDB = Shanghai Pudong Development BankNote Loan and deposit market share for BOC and ICBC are for their domestic operations onlySources Company data Goldman Sachs research estimates
Further data from 2006-10 from the Peoples Bank of China suggests that the big5 state banks continue to outperform the next 12 largest joint stock commercial banksThe big five have launched sales of shares to capitalize while listing on capital marketsand adopting reporting of financial data along lines of international standards Thisappears to be similar to Banco do Brasil policies that retain majority of shares in federalgovernment control while capitalizing the bank through issues of stock
Comparing the Performance of Big 5 State Banks and Next 12 Joint Stock CommercialBanks in China
2006 2007 2008 2009 2010
Profit Margin Big 5 State Banks 3116 3143 2586 3026 3269
Next 12 JS Commercial Banks 2050 2791 1796 2159 2365
Returns Big 5 State Banks 507 606 860 691 675(risk adj) Next 12 JS Commercial Banks 459 570 1016 714 723
Op Risk Big 5 State Banks 5548 5539 5215 5319 5322Next 12 JS Commercial Banks 5886 5721 5725 5831 5947
Leverage Big 5 State Banks 1626 1482 1724 173 1734Next 12 JS Commercial Banks 2826 2251 2064 2048 1936
ROE Big 5 State Banks 1424 1557 1999 1925 2037Next 12 JS Commercial Banks 1564 2049 2156 1840 1967
Big 4 and 11 JSCBsSource Peoples Bank of China China Financial Stability Reports 2007-11
Performance indicators reported by the Peoples Bank of China for the big 5 statebanks and 12 next largest joint stock commercial banks also suggest that the largestgovernment banks in China retain significant competitive advantages ndash and may providepolicy alternatives Given the current shift of economic policy in China away fromindustry and export led growth to more sustainable domestic oriented growth and socialinclusion the role of state banks clearly comes to the fore
8132019 Government Banking and BRICs in the Recent Financial Crisis
httpslidepdfcomreaderfullgovernment-banking-and-brics-in-the-recent-financial-crisis 4957
983106983122983113983107 983111983151983158983141983154983150983149983141983150983156 983106983137983150983147983155 983137983150983140 983110983145983150983137983150983139983145983137983148 983123983156983137983156983141983139983154983137983142983156
49
Net Operating Income of Big 5 State Banks and Next 12 CommercialBanks 100 million RMB YuanBig 5 State Banks 2006 2007 2008 2009 2010
Balance Net interest income 349703 500456 556790 532206 720152Net fee amp commission inc 48524 103817 138464 175469 232491
Investment income 216089 283725 338865 324037 340440
Other business income (1807) (17054) 47548 33791 2186
Net operating income 612509 870944 1081667 1065503 1314943
Percent Net interest income 5709 5746 5148 4995 5477
Net fee amp commission inc 792 1192 1280 1646 1768
Investment income 3528 3258 3133 3041 2589
Other business income (030) (196) 440 318 166
Net operating income 10000 10000 10000 100 100
Next 12 Joint Stock CommercialBanks 2006 2007 2008 2009 2010
Net interest income 87253 132945 198965 191276 281588
Net fee amp commission inc 7850 16247 27319 30115 42023
Investment income 20959 32172 44864 50767 50500
Other business income 2306 4498 16359 10384 7400
Net operating income 118468 185861 287507 282542 381511
Percent Net interest income 7365 7153 6920 6769 7381
Net fee amp commission inc 671 874 950 1066 1101
Investment income 1769 1731 1560 1797 1324
Other business income 195 242 569 368 194Net operating income 10000 10000 10000 10000 10000
Source Peoples Bank of China China Financial Stability Reports 2007-11
Big 4 and 11 JSCBsBig 5 = ICBC ABC BOC CCB BOCOMNext 12 Joint Stock Commercial Banks = China CITIC Bank Everbright Bank Huaxia BankGuangdong Development Bank Shenzhen Development Bank China Merchants Bank Shanghai PudongDevelopment Bank Industrial Bank China Minsheng Banking Corporation Evergrowing Bank ChinaZheshang Bank Bohai Bank
In conclusion bank change in China also appears to confirm our findings from
Brazil ndash that state banks have realized competitive advantages and increased marketshares since liberalization while providing counter cyclical credit to ameliorateadjustment to crisis The modernization of the China Postal Savings Bank is ofparticular interest given its social mission downmarket focus and 40000 branchOffices throughout the country Expansion of card payment services through the postalbank system confirms the importance of the Brazilian federal savings bank (CaixaEconocircmica Federal Caixa) as agent for federal government social policy and agentresponsible for management of citizenship cards (12 million) and payment of familygrants This back to the future modernization of savings banks has proved essential forovercoming notorious levels of social exclusion and inequality in Brazil Althoughenglish language materials are unavailable on the China Postal Savings Bank thisinstitution clearly presents profound opportunities for comparable policies in China
8132019 Government Banking and BRICs in the Recent Financial Crisis
httpslidepdfcomreaderfullgovernment-banking-and-brics-in-the-recent-financial-crisis 5057
983106983122983113983107 983111983151983158983141983154983150983149983141983150983156 983106983137983150983147983155 983137983150983140 983110983145983150983137983150983139983145983137983148 983123983156983137983156983141983139983154983137983142983156
50
Reported offer of microfinance services for poverty reduction as part of nationaleconomic stimulous plan may point to developments in this direction
Given that state planning capacity has long been at the center of attention intheories of financial statecraft the role of Chinese state banks in redirecting policiesaccording to the 12th 5 Year plan for 2011-15 seems critical From 2000-5 the 10th 5
Year plan emphasized infrastructure and the attraction of investment and labor skillsThe 11th 5 Year plan (2006-10) raised concerns about sustainability rather than growthlevels while also seeking to spread improvements to balance development better servepeople and improve the quality of life continue to support Center and West provincesand revitalize Northeast provinces In comparison the 12th 5 Year plan calls for morebalanced lsquoinclusiversquo growth and structural adjustemts more than 4 trillion RMB($US600 billion) for targeted industries and interior regions a focus on new energynew materials and information and high technologies biology and new medicineenergy converstaion and environmental protection aerospace marine and advancedmanufacturing This implies fundamental shifts away from industry to services that hasbeen reported in macroeconomic data for 2010 If past studies emphasized directed
credit and industrial change the role of Chinese state banks in realizing transformationscertainly warrants study
Although the domestic flow of funds process of liberalization (or the lackthereof) and insertion of banking into Chinese political economy is beyond the scope ofthis paper our findings from Brazil appear to provide valuable hypotheses about ChinaThat is to say the big state banks and other government banks in China remaincommanding heights not in the Marxist sense of providing means to reach socialismbut immense institutions with profound presence throughout politics and markets in thecountry In this sense our findings from Brazil appear to approximate patterns ofchange in China more than Washington Consensus expectations about liberalization andprivatizations to free private and foreign banks Financial statecraft draws attention tothe capitalization of Chinese state banks through stock Sales and listings on capitalmarkets However like the Banco do Brasil (that reformers in the 1990s sought to shiftcontrol to the private sector only to increase federal government shareholding) theChinese experience surely involves unexpected consequences and patterns of changedifferent than a linear transition to the Berle amp Means paradigm of corporategovernance
Russia The New State Duopoly
ldquoThe rush of 2003-8 increased the market share of foreign banks to 285 from
52 However the state-owned banks received enormous help from the federal budget in the days of the crisis thereby strengthening their dominant
position on the Russian financial market says Sergey Aleksashenko the formerDeputy chairman of Russias Central Bank quotes Russia Profile Today one
must not harbor any illusion of a fair competition with them all the main cash
flows in Russia are controlled by state-owned banks httpwwwbarentsnovacomnode1031
Description of banking policy in Russia during the global financial crisis can beobtained from Bank of Russia annual reports and related publications The figure on the
following page summarizes the financial flows to and from the Bank of RussiaAlthough central bank policy is beyond the scope of this study the role of state banks in
8132019 Government Banking and BRICs in the Recent Financial Crisis
httpslidepdfcomreaderfullgovernment-banking-and-brics-in-the-recent-financial-crisis 5157
983106983122983113983107 983111983151983158983141983154983150983149983141983150983156 983106983137983150983147983155 983137983150983140 983110983145983150983137983150983139983145983137983148 983123983156983137983156983141983139983154983137983142983156
51
channeling counter-cyclical credits released by the Bank of Russia appear to confirm thecore argument that emerges from our studies of the Brazilian banking system Furtherdata on the following pages also suggest that state banks in Russia performed wellduring 2008-10 confirming on the basis of sparse data taken from Bank of Russiareports and documents that public banks have modernized provided counter-cyclical
credit to reverse credit crunch and economic downturn while realizing competitiveadvantages over private and foreign banks
8132019 Government Banking and BRICs in the Recent Financial Crisis
httpslidepdfcomreaderfullgovernment-banking-and-brics-in-the-recent-financial-crisis 5257
983106983122983113983107 983111983151983158983141983154983150983149983141983150983156 983106983137983150983147983155 983137983150983140 983110983145983150983137983150983139983145983137983148 983123983156983137983156983141983139983154983137983142983156
52
The following aggregate figures reported by the Bank of Russia suggest severaltrends of significance First Chart 32 suggests that household deposits shifted fromRuble deposits to foreign currency pegged (or indexed) during 2008 Second Chart 33illustrates the substantial increase of non-bank overdue debt during second semester
2008
Consequently the financial results and profitability of banks declinedsignificantly during 2008 The greater confidence in deposits with government banksfound abroad suggests that this may have been critical in Russia
Performance data deom 2008-10 provides a clearer picture one that is consistentwith our findings in Brazil State banks appear to have outperformed all other types of
banks except medium and small regional banks The following table reports the averagereturns on assets and returns on equity reported by the Bank of Russia 2008-10
Returns on Assets and Equity by Type of Bank in Russia 2008-9
Return on assets Return on equity 2008 2009 2010 2008 2009 2010
-------------------------------------------------------------------------------------------------------------------State Banks 22 08 24 157 46 148Foreign Banks 18 11 21 146 83 145Large private banks 13 03 11 106 28 84Medium-Small Banks Moscow 15 12 14 68 52 67
Medium-Small Regional Banks 21 12 15 131 65 98--------------------------------------------------------------------------------------------------------------------Source Bank of Russia Bank Supervision Reports 2009 and 2010
8132019 Government Banking and BRICs in the Recent Financial Crisis
httpslidepdfcomreaderfullgovernment-banking-and-brics-in-the-recent-financial-crisis 5357
983106983122983113983107 983111983151983158983141983154983150983149983141983150983156 983106983137983150983147983155 983137983150983140 983110983145983150983137983150983139983145983137983148 983123983156983137983156983141983139983154983137983142983156
53
Further data from the Bank of Russia on the capital adequacy of Banks during2009-10 suggest that foreign banks and large private banks remain less capitalizedagainst risks according to Basel II guidelines albeit at levels almost double thatrecommended by the Bank for International Settlements (80 risk weighted) Although
further analysis is needed this data is consistent from that reported in Brazil thatgovernment banks tend to more cautious and more prudent in terms of placing asidehigher levels of reserves and patrimony against possible losses
Capital Adequacy of Banks by Type of Bank in Russia 2009-10
2009 2010 2011---------------------------------------------------------------------------------------------------------State Banks 184 227 186Foreign Banks 155 196 195Large Private Banks 140 181 155
Medium-Small Banks Moscow 316 312 268Medium-Small Regional Banks 219 241 207Non-Bank Credit Institutions 372 1038 678---------------------------------------------------------------------------------------------------------Source Bank of Russia Bank Supervision Report (Moscow) 2009 p 43
Finally Bank of Russia bank supervision reports also suggest that state banksexpanded their market shares of assets and capital during the years following the globalfinancial crisis While large private banks and foreign banks lost market share of bankassets and bank capital in Russia state banks increased their significant market sharefrom 405 ndash 426 percent and 471-476 percent of assets and capital respectivelyUnfortunately data from previous years and for specific banking groups was notobtained However this data does appear to indicate that our findings of competitiveadvantages and policy alternatives
Number and Market Share by Type of Bank
N Banks Assets Capital---------------------------- ---------------------------- ----------------------------
Type of Bank 2009 2010 2011 2009 2010 2011 2009 2010 2011-------------------------------------------------------------------------------------------------------------------------------State 17 22 27 405 439 458 471 489 473
Foreign 101 106 108 187 183 180 172 169 191Large Private 136 139 131 346 333 305 276 287 269Med-Small Moscow 361 335 317 27 26 26 43 34 35Medi-Small Regional 443 412 372 28 28 27 36 31 29Other Credit Institutions 50 51 57 07 04 04 01 02 03Total 1108 1058 100 100 100 100 100 100-------------------------------------------------------------------------------------------------------------------------------Source Bank of Russia Bank Supervision Report 2009 amp 2010
In sum politics and financial statecraft have led to the realization of significantcompetitive advantage by Russian state banks Sperbank and Vneshtorgbank increasedtheir share of bank assets from 32 percent in 2005 to over 50 percent by 2011 through
mergers and acquisitions and aggressive displacement of foreign banks Whatever thepolitics data from the Bank of Russia suggests that monetary authorities released a
8132019 Government Banking and BRICs in the Recent Financial Crisis
httpslidepdfcomreaderfullgovernment-banking-and-brics-in-the-recent-financial-crisis 5457
983106983122983113983107 983111983151983158983141983154983150983149983141983150983156 983106983137983150983147983155 983137983150983140 983110983145983150983137983150983139983145983137983148 983123983156983137983156983141983139983154983137983142983156
54
series of counter cyclical credit injections during 2008-9 to domestic bankinginstitutions Moreover data suggests that state banks continue to perform at or ahead oflevels reported by regional private and foreign banks The large market share andimproved performance of state banks reported in recent data suggests although the datais sparse that government banks in Russia have also modernized realized competitive
advantages and provided policy alternatives against the impact of financial crisisabroadWe were unable to find evidence of policy making toward social inclusion at the
Bank of Russia or Russian state banks despite the historical trajectory of the Sberbankas a savings bank under communism The context also appears to differ considerably Asurvey of the Zircon Research Group reportedly found that only 15 percent of Russiansretain bank accounts because of mistrust in banks and government This combination ofrealist politics and the realization of competitive advantages by Russian state bankssuggests that theories of economic statecraft in the realist tradition may indeed explainthe domestic developments under study
Conclusion
This paper reports evidence about government bank modernization and financialstatecraft in BRIC countries designed to counter the effects of crisis and shape domesticgrowth Government banks in BRIC countries have contributed to the widely notedadjustment of these economies to global financial crisis and economic downturnContrary to the Washington Consensus that prevailed during much of the 1980s and1990s (that privatization and liberalization especially of banking would free marketforces and deepen domestic financial systems) a quite different process of bank changeappears to have ensued after financial liberalization in the BRICs
Instead of replacement of state banks with private banks government banksremain central agents of domestic credit and growth and have modernized ldquojust intimerdquo The capitalization and realization of competitive advantages by large governmentbanks during the 2000s meant that once the US financial panic spread across capitalmarkets broke highly leveraged private and produced runs on private bank depositspolicy makers in BRIC countries nonetheless retained counter cyclical policyalternatives through their more solid large state banks
These findings counter traditional foci on the private sector individualentrepreneurship and ideals of free markets linked to the political and social advancesrecorded around the world in the last decades We report an anomaly for theories offinancial repression and the Washington Consensus about the virtues of privatization
and liberalization Although largely blamed for reproducing underdevelopment in thepast BRIC government banks averted excesses of private banking that drove creditbubbles such as home mortgages and derivatives in the US And since liberalization ofbanking (we have not adequately discussed how much liberalization occurred in eachcountry) government banks have modernized to compete with private and foreignbanks Government banks have realized competitive advantages and provided policyalternatives These two arguments help explain why BRIC countries have farecomparatively well in the face of financial crisis in core countries
Financial statecraft is therefore at the center of BRIC counter cyclical capacitiesand state planning Brazil Russia India and China fared significantly better thanadvanced and many developing countries in terms of adjusting to credit crunches and
export shocks This is because government banks proved critical interbank credit toretain confidence in domestic banking systems These institutions also presented other
8132019 Government Banking and BRICs in the Recent Financial Crisis
httpslidepdfcomreaderfullgovernment-banking-and-brics-in-the-recent-financial-crisis 5557
983106983122983113983107 983111983151983158983141983154983150983149983141983150983156 983106983137983150983147983155 983137983150983140 983110983145983150983137983150983139983145983137983148 983123983156983137983156983141983139983154983137983142983156
55
policy alternatives for political and social forces Politics shaped adjustment andrecovery through state banks differently in BRIC countries Given the realities of statecentered political realism in Russia the redirection of state banks toward goals ofChinese Five Year Plans and the modernization of the State Bank of India amidst anamorphous federalism the experience of Brazil with democratization and public bank
modernization may stand out (Armijo 2009)Further analysis of savings banks and cooperative banks also will be requiredAs members of the World Savings Bank Institute (a global association of savingsbanks) the Caixa in Brazil SNI and NABARD in India and China Postal Savings Bankappear to have provided access to very large numbers of previously unbanked citizensThis returns to traditional ideas of social banking and the history of savings banks thatwere founded throughout Europe since the late 18 th century The upmarket strategy andexpansion into investment banking and international banking of the Russian Sberbankconstrasts with downmarket strategies of savings banks in Brazil India and China
The financial press has recently reported doubts about bad loans in Chinese statebanks and cast doubt on the financial results posted and reported in this paper
However current estimates of 2-5 percent bad loans in Chinese state banks pale incomparison to the US$1240 billion in bad loans shifted to asset managementcompanies in the mid 2000s before capitalization of these institutions through sale ofshares Critics of state banking in Brazil also point to past levels of bad loans (reaching30-40 percent) because of their capture during military government delayed transitionBut the cost of capitalization and transfer of bad loans from Brazilian state banks alsoremained below US$400 billion and is still contingent on liquidation of assetmanagement companies created in 2001 In any case these numbers are very smallcompared to GAO estimates of US$120 trillion in emergency infusions by USmonetary authorities to banks and financial institutions from 2007-11
These are anomalies for recent market-based banking theory and neo-liberalpolicy designs However they do not run counter to orthodoxy in economics andbanking theory Over the last decades economic reforms (fiscal financial monetaryand banking) have improved transparency and brought public policy and marketexpectations closer However expectations about deregulation and free marketequilibria in banking and finance have succumbed in the face of panic and the stillsobering consequences of crisis The materials presented herein are descriptive and willrequire more careful analysis However given the urgency of searching for alternativedevelopment models and different approaches to financial statecraft in BRIC countriesand beyond we have taken the liberty to present research in initial stages and toprovoke thought along the lines suggested by our kind conveners
8132019 Government Banking and BRICs in the Recent Financial Crisis
httpslidepdfcomreaderfullgovernment-banking-and-brics-in-the-recent-financial-crisis 5657
983106983122983113983107 983111983151983158983141983154983150983149983141983150983156 983106983137983150983147983155 983137983150983140 983110983145983150983137983150983139983145983137983148 983123983156983137983156983141983139983154983137983142983156
56
Appendix on Alternative Banking and Social Inclusion
This appendix describes how ideas about government banking led to further work onalternative banking and social inclusion with help from the Rockefeller FoundationBellagio Center In July 2011 we were able to convene a conference designed to gather
scholars alternative banking executives and representatives from savings andcooperative bank associations to rethink strategies for social inclusion in the globalsouth and attempt to launch a new policy agenda Given the search for alternativestrategies to counter crisis and the advances of stabilization transparency and bankingsupervision in developing and emerging economies we call for alternative bankingcommunities in the global north and south to work together and help shape a new policyagenda for social inclusion Because savings banks credit cooperatives and otheralternative banking and finance institutions have realized competitive advantages andemerged from crisis we can now think beyond We believe that new policies may helpdeveloping and emerging nations redirect large domestic institutions such as postal andsavings banks toward meeting the UN millennium goals to eliminate poverty by 2015
Plans include writing a green paper on Core Principles for Alternative Bankingand Social Inclusion convening events to promote these principles through institutionalsupporters and networks and seeking adoption of these principles at policy venues suchas the World Savings Bank Institute the International Association of CooperativeBanks the Bank for International Settlements the International Financial ReportingStandards foundation the ISO International Standards Organization the Charter forResponsible Business regional development banks and the World Bank We also planto submit an edited volume of scholarly contributions on alternative banking and socialinclusion by year-end 2012 Interested parties are welcome to participate
Institutional supporters and networks include
Institutional SupportersColumbia University School of International and Public Affairs New YorkInstitute for Money Technology and Financial Inclusion University of CaliforniaIrvineKingacutes College Department of Management LondonSatildeo Paulo Business School Getulio Vargas FoundationSecond University of Naples
Networks
Association of Emerging Market Business Schools Satildeo Paulo BrazilCommunity of European Management Schools BrusselsCritical Political Economy NetworkEuropean Association of Co-operative Banks BrusselsGlobal Public Policy Network LondonInternational Cooperative Banking Association BrusselsSocial Science Finance Network AmsterdamSociety for Advancement of Social Economics PhiladelphiaWorld Savings Bank Institute Brussels
8132019 Government Banking and BRICs in the Recent Financial Crisis
httpslidepdfcomreaderfullgovernment-banking-and-brics-in-the-recent-financial-crisis 5757
983106983122983113983107 983111983151983158983141983154983150983149983141983150983156 983106983137983150983147983155 983137983150983140 983110983145983150983137983150983139983145983137983148 983123983156983137983156983141983139983154983137983142983156
Core Principles for Alternative Banking and Social Inclusion
Commitment to End Capital StarvationPromote access to and use of banking and financial services by all through newtechnologies and distribution channels to capitalize assets among the poor
Commitment to Universalize Income Savings Credit and FinanceProvide basic income via ATM cards and mobile banking to reach the poor and opennew channels of access to income savings credit finance insurance and opportunities
Prudent Banking and Regulatory ComplianceAlternative banking seeks to work within regulations guidelines and best practicesrecommended by domestic monetary authorities and international regulatory institutionssuch as the Bank for International Settlement Basel II Capital Risk Guidelines
Corporate Social Responsibility Leadership
Integrate corporate social responsibility into down-market business strategies andinstitutions of representation and democratization
Transparency and AccountabilityPublish annual reports and balance sheets in accord with international best practices offinancial social and sustainability reporting
Leadership in Provision of New Banking Services and Products to the PoorUse competitive advantages in banking and institutional networks to channel moreeffectively capital income and finance to the poor
Generate Sustainable Income and Household Asset AccumulationUse branch offices and new banking technologies to accelerate progress toward UNmillennium goals to eliminate poverty
Universalize Financial EducationPromote financial education to encourage responsible banking and finance and avertpredatory lending and unethical practices
Adopt Cutting Edge Technology and Management Practices to Provide
Competitive Alternative to Private Commercial and Investment Banks
Incorporate electronic card and mobile banking services to better serve the poorContribute to Realization of Bellagio Principles for SustainabilityPromote alternative banking and business practices that contribute to environmentallysustainable income consumption and production as stated in Bellagio Principles forSustainability
Respect and Build on National and Regional DifferencesI d f i l d l l i b ki i i i d i i l

8132019 Government Banking and BRICs in the Recent Financial Crisis
httpslidepdfcomreaderfullgovernment-banking-and-brics-in-the-recent-financial-crisis 257
983106983122983113983107 983111983151983158983141983154983150983149983141983150983156 983106983137983150983147983155 983137983150983140 983110983145983150983137983150983139983145983137983148 983123983156983137983156983141983139983154983137983142983156
2
Introduction1
Until 2008 developing countries systematically fared worse during financial crises Afterdeclaration of moratorium on foreign debt payments by Mexico in August 1982 the globalsouth and east experienced financial crises in a seemingly endless sequence Panic in US
financial markets during 2007 quickly spread around the globe and crisis is far from overHowever it is clear that BRIC countries were better prepared to counter shocks and resumegrowth This paper explores our findings about Brazilian federal banks (that they havemodernized and realized competitive advantages since liberalization and provided criticalpolicy alternatives) to Russia India and China amidst crisis2 Although further research willbe required (and other factors mattered) evidence suggests that BRIC government bankshave indeed realized competitive advantages over private and foreign banks during the 2000sand helped provide counter cyclical credit to counter crisis We also argue that public banksmay accelerate social inclusion through new card payment and mobile banking technologies
These findings differ from the realist tradition of financial statecraft in internationalpolitical economy recent market-based banking theory and expectations that privatizations
and liberalization would reveal the greater efficiency of private banks and produce transitionsto market centered financial systems Instead evidence from Brazil and other BRICs (andrecent research on alternative banking in Europe)3 raises new questions about domestic financial statecraft social inclusion and political development We are currently workingwith a network of research and policy making institutions to promote the adoption of CorePrinciples for Alternative Banking and Social Inclusion at large public banks in advanceddeveloping and emerging countries (while supporting alternative banking groups of occupymovements in the US)4 Any shortcomings of this draft paper and our still incipient researchand policy agenda surely pale in comparison to the devastating consequences of misguidedneo-classical ideas in banking theory and neo-liberal excesses of deregulation
We define financial statecraft as the formulation of procedural rules and policies byagents empowered to act in the name of the state which mandate and regulate basicrelationships in state civil society and markets5 Financial statecraft requires balancingpolitical legitimacy and market confidence to regulate the allocation of household savings tofirms increase the mobility of capital and shape growth6 Financial statecraft is a specifictype of statecraft involving monetary financial and banking phenomena Like most conceptsin the social sciences financial statecraft cuts to essentially contested theories and concepts7 about government intervention free markets bureaucracy and policy capacities
1 Earlier versions of this paper were presented at the meeting of Association of BRICS Business Schools27 November 2010 Xavier Institute of Management and Entrepreneurship Bangalore and published as
ldquoGovernment Banking and BRICs in the Recent Financial Crisisrdquo Journal of Management and Entrepreneurship March 2011 I thank Maria Kravchenko RS Deshpande Huang Lei MihalisChasomeris CP Ravindranathan and Maria Antonieta del Tedesco Lins and anonymous reviewers forcomments and suggestions2 Mettenheim Kurt Federal Banking in Brazil Policies and Competitive Advantages London Pickeringand Chatto 20103 On alternative banking in Europe Ayadi et al (2009) Investigating diversity in the banking sector in
Europe the performance and role of savings banks (Brussels Center for European Policy Studies) andAyadi et al (2010) Investigating diversity in the banking sector in Europe key developments
performance and role of cooperative banks (Brussels Center for European Policy Studies)4 See appendix lsquoCore Principles for Alternative Banking and Social Inclusionrsquo5 Conaghan Catherine and James Malloy Unsettling Statecraft Democracy and Neoliberalism in the
Central Andes Pittsburgh University of Pittsburgh Press 19946
Sola Lourdes amp Whitehead Laurence eds Statecrafting Monetary Authority Democracy andFinancial Order in Brazil Oxford University of Oxford Centre for Brazilian Studies 20067 On essentially contested character of concepts in the social sciences see Gallie Collier Gerring
8132019 Government Banking and BRICs in the Recent Financial Crisis
httpslidepdfcomreaderfullgovernment-banking-and-brics-in-the-recent-financial-crisis 357
983106983122983113983107 983111983151983158983141983154983150983149983141983150983156 983106983137983150983147983155 983137983150983140 983110983145983150983137983150983139983145983137983148 983123983156983137983156983141983139983154983137983142983156
3
The comparative political economy of finance is especially contested Financialdeepening approaches and bank-centered finance strategies (and liberal and coordinatedpolitical economy approaches) often see the same phenomena from profoundly differentperspectives8 Liberal market-economies are driven by equity markets thrive on publicinformation and spurn coordination Coordinated market-economies are driven by bank
credit thrive on limited sharing of firm strategy with financiers and spurn markets fortheir excessive volatility that produce sub-optimal equilibrium9 From a market-centeredperspective neo-institutionalism is largely neo-protectionism From the perspective ofcoordinated capitalism and developmental states excessive liberalization andprivatization would simply throw babies -- cherished institutions of social policy anddomestic control ndash out with the bathwater In terms of finance theory marketapproaches insist that policies should free agents to lsquoget prices rightrsquo while coordinatedmarket and bank-centered approaches argue that enough credit be directed to accelerateinnovation and lsquoget planning rightrsquo10
These deep differences shape views of financial statecraft and governmentbanking in BRICs The question of social inclusion may provide more grounds for
agreement Given the huge decline in the number of bankless Brazilians (those withoutbank account) from 80 - 50 percent 2000-2010 the relation between financial statecraftand democratization appears more positive sum than supposed by most scholars ofpolitical economy Most research on domestic finance (and especially monetary theoryand policy) assumes zero sum relations between social inclusion and proper financefiscal and monetary policy However in contexts of high inequality and financialexclusion positive sum relations may obtain This counters conceptions of fiscalconstraints to change and reverses causal relations of independent central bankingInstead of seeking to ensure central bank independence from politics and social forces(Alesina and Summers 1993) or free markets and private banks through privatizationsand deregulation (Williamson 1990) the construction of financial and monetaryauthority in Brazil (Whitehead 2002 Sola and Whitehead 2006) has involved therealization of competitive advantage by large public banks (Mettenheim 2010)Moreover basic income policies (albeit conditional see Soares et al 2010) and othersocial services have proved more successful than private banking for reaching thebankless
Reforms during the 1990s and modernization of public (and central) banksduring the 2000s thus require rethinking constraints to change Since the end of theelectoral road to socialism exemplified by military coup in Chile against PresidentAllende on 11 September 1973 social scientists and policy communities have largelyconcurred that markets severely constrain social inclusion For Gold Lo and Wright
(1975) structural theories of the state replaced earlier instrumental and functionaltraditions in Marxism by better describing how markets constrain social policy and vetopolitical change Since then social scientists emphasize how markets cleared byindividual investors impose fiscal austerity and set constraints to change Much ofcritical and mainstream social science agree that social policies tend to pressure fiscalaccounts and lead either to tax increases or adjustment policies that reduced profits and
8 On bank-centered and market centered financial systems see Zysman John Governents Markets and
Growth Financial Systems and the Politics of Industrial Change Ithaca NY Cornell University Press19839 The terms of this dichotomy are from Hall Peter amp David Soskice eds Varieties of Capitalism The
Institutional Foundations of Comparative Advantage Oxford Oxford University Press 200110
This distinction between prices and planning is from Dymski Gary A lsquoBanking on TransformationFinancing Development Overcoming Povertyrsquo Paper presented to UFRJ Economics Institute September2003
8132019 Government Banking and BRICs in the Recent Financial Crisis
httpslidepdfcomreaderfullgovernment-banking-and-brics-in-the-recent-financial-crisis 457
983106983122983113983107 983111983151983158983141983154983150983149983141983150983156 983106983137983150983147983155 983137983150983140 983110983145983150983137983150983139983145983137983148 983123983156983137983156983141983139983154983137983142983156
4
tax revenue This in the worst cases caused political-economic crisis and led to thebreakdown of democracy in developing countries (OacuteDonnell 1973) Similar forces inadvanced economies led to stagflation in the 1970s and electoral turns to neo-conservative governments and neo-liberal policies in the 1980s designed to downsizeWelfare States (Pierson 1996)
These structural explanations are now incomplete Old views of fiscaldominance fail to capture the implications of advances in monetary economics duringthe 1990s and bank modernization during the 2000s Government bank modernizationnew regulatory frameworks and better supervision of banks and markets (contrary toderegulation in the US and a few tax havens and financial centers) provide a new settingfor what we call financial roads to social economies In other words structural theoriesof the state and conceptions of vicious cycles that emphasize fiscal constraints predate studies of the credit channel interest rate channel and the modernization of publicbanks
Old views of fiscal dominance remain so prevalent that austerity has oftenremained in place far beyond necessary in developing countries Many developing
countries have accumulated significant foreign reserves and sustained trade surplusesduring years of economic growth Moreover in Brazil transparent policy frameworkssuch as inflation targeting and flexible foreign exchange regimes have been in place forover a decade (Fraga et al 2004) The situation of many ergo developing countries isthus different Bank modernization the accumulation of immense foreign reserves andthe consolidation of reforms have approximated markets and public policy Newchannels for change are at hand Our research focuses on the modernization of socialbanking especially the ability of new technologies such as electronic card paymentchannels and mobile banking to bring income grants and access to banking and publicservices in vast numbers Since opening the Brazilian banking industry in 1995 a backto the future modernization of government banks and basic income policies are biglargely untold storiesl organizations the competitiveness of private banks or the greaterefficiency of market-centered microfinance firms or funds
This also implies that advocates of central bank independence beg the questionof financial statecraft in developing and emerging economies The construction ofmonetary authority in Brazil during the 1990s and 2000s differs from standard theoriesof central bank independence in three ways First rather than the imposition oforthodoxy the construction of monetary authority in Brazil involved heterodox policiesof inertial inflation that were used to reduce high and persistent inflation Second thesuccessful reduction of inflation while redistributing wealth to the poor provided thepolitical impetus and legitimation for monetary statecraft after military rule both in
terms of economic policies and party politics Third central bank authority and capacityemerged in Brazil in precisely the reverse causal order expected by economists Contrary to claims about the need to establish central bank independence to ensure pricestability the reverse occurred The Central Bank of Brazil expanded prerogatives andbuilt capacity after price stability was secured by heterodox policies in 1994
Domestic Financial Statecraft
Our approach to financial statecraft remits to a long tradition in comparative politicaleconomy that focuses on how politics and government policies shape markets Thisapproach is epitomized by Polanyrsquos The Great Transformation Shonfieldrsquos Modern
Capitalism Zysmanrsquos Governments Markets and Growth Gourevitchrsquos Politics in Hard Times Conaghan amp Malloyacutes Unsettling Statecraft and Sola amp Whiteheadacutes
8132019 Government Banking and BRICs in the Recent Financial Crisis
httpslidepdfcomreaderfullgovernment-banking-and-brics-in-the-recent-financial-crisis 557
983106983122983113983107 983111983151983158983141983154983150983149983141983150983156 983106983137983150983147983155 983137983150983140 983110983145983150983137983150983139983145983137983148 983123983156983137983156983141983139983154983137983142983156
5
Statecrafting Monetary Authority Democracy and Financial Order in Brazil PeterKingstoneacutes analysis of coalitions Christine Kearneyacutes analysis of neo-liberal policiesand studies of recentralization and federalism by Leslie Armijo Kent Eaton and DavidSamuels all explore the political determinants of economic policies in Brazil11
Polanyirsquos The Great Transformation and Shonefieldrsquos Modern Capitalism
remain canonic studies of financial statecraft Polanyi argued that laissez faire liberalism during the 19th century generated movements of social self-defense in theform of organized labor efforts to address the social question and central banking toprotect private banks from downturns and currency devaluation under the gold standardOther interventions such as tarrifs imperialist expansion subsidies to agriculture andindustry and top-down social policies also prevailed over liberalism and free marketsespecially after the 1873 depression Statecrafting often in authoritarian forms thusreappeared in the latter 19th century after decades of liberalism Thereafter two worldwars and recovery from economic depression meant that political imperatives continuedto dominate domestic policymaking After 1945 Shonefield argues that ContinentalEuropeans reshaped government ownership in response to the political and economic
imperatives of recovery rather than ideology or nationalist design This emphasis onnecessity and improvisation places the statecrafting tradition closer to Lindblomrsquosmuddling-through conception of policymaking than Marxist-Leninist or nationalisttheories that saw large state banks as means to ideological ends
Recent scholarship has returned to core ideas of statecrafting For Kirschnerbecause the impact of alternative financial arrangements and policies on welfare is oftenequal or unpredictable politics rather than independent economic judgements bothshape and explain policy choices and the configuration of markets12 Statecrafting thusdescribes the political construction of coalitions to support economic policies and theadoptionadaptation of policies to the particularities of domestic markets institutionsand politics13 Hoffman traces how political ideas periodically recast the US financialsystem during critical junctures of change since independence14 Laurence Toya andAmyx also argue that politics explain the origin character and implementation of lsquobigbangrsquo financial reforms in Great Britain and Japan in the 1980s15 Peacuterez describes howdomestic groups determined banking and finance reforms in Spain16 This is consistentwith Maxfieldrsquos description of how the formation of a bankeracutes coalition shapedfinancial reforms and policies in Mexico17 However during the last decades domesticeconomic statecrafting has become virtually synonomous with imposing liberal reformsWe report fundamentally different developments from the BRICS The realization ofcompetitive advantages by government banks since liberalization and the importance of
11
Our approach also can be described from Claus Offe as a sociological approach to political economy ndashone that focuses on how social organizations interests and political coalitions sustain economic policiesOffe Claus lsquoPolitical Economy Sociological Perspectivesrsquo in Goodin Robert E amp Klingemann Hans-Dieter (eds) A New Handbook of Political Science Oxford Oxford University Press 1998 pp 675-69012 Kirschner Jonathan (ed) Monetary Orders Ambiguous Economics Ubiquitous Politics Ithaca NYCornell University Press 200313 Conaghan Catherine M amp James M Malloy Unsettling Statecraft Democracy and Neoliberalism in
the Central Andes Pittsburgh PA University of Pittsburgh Press 199414 Hoffmann Susan Politics and Banking Ideas Public Policy and the Creation of Financial
Institutions Ithaca NY Cornell University Press 200115 Laurence Henry Money Rules The New Politics of Finance in Britain and Japan Ithaca NY CornellUniversity Press 200116 Peacuterez Sofiacutea Banking on Privilege The Politics of Spanish Financial Reform Ithaca NY Cornell
University Press 200317 Maxfield Sylvia Governing Capital International Finance and Mexican Politics Ithaca NY CornellUniversity Press 1990
8132019 Government Banking and BRICs in the Recent Financial Crisis
httpslidepdfcomreaderfullgovernment-banking-and-brics-in-the-recent-financial-crisis 657
983106983122983113983107 983111983151983158983141983154983150983149983141983150983156 983106983137983150983147983155 983137983150983140 983110983145983150983137983150983139983145983137983148 983123983156983137983156983141983139983154983137983142983156
6
these large institutions for domestic policy making particularly for counter-cyclicalcredit and social inclusion This comes at a critical time of reassessment in the US andadvanced economies
Errors of Deregulation and Crisis in the US
A clearer explanation of the financial panic in US sub-prime mortgage markets alsohelps explain why BRIC countries suffered less and recovered more quickly From theperspectives of BRICs the excesses of deregulation and market based banking are theanomalies ndash not the reality of smoothing the growth curve and encouraging socialinclusion Competing hypotheses rushed to explain the origin and evolution of the USfinancial panic and crisis (Gorton 2008) The US Government Commission (2010) splitwith dissenters presenting separate explanations However for purposes of comparisonto BRICs review of antecedents crisis mechanisms and policy responses suggest botherrors of deregulation and particular complementarities in market-centered financecapitalism Asset bubbles are not new to financial markets However the deregulation
of capital markets and the dual bubble of long-term housing prices and quick valuationof mortgage backed securities and other derivatives produced unprecedented crisis in2007 Policy statements national accounts Federal Reserve balance sheets and markettrends and working papers indicate the following causes and consequences
First the steep valuation of the Case-Schiller Home Price Index from 1988-2009suggests a long-term asset bubble has changed US political economy and producedstructural imbalances From 1895-1995 home prices largely accompanied inflation(Baker 2007) However from 1995 to June 2006 home prices outpaced inflation by anestimated 70 percent This produced a US$ 25 trillion home price bubble and a fullUS$ 80 trillion in housing related wealth effects Construction alone during this periodincreased from an estimated 4-6 percent of US GDP
Second policies designed to counter financial crisis in 2000 such as low interestrates fueled another round of home price increases while construction and consumptionwere encouraged by further deregulation of financial markets Revocation of the Glass-Steagal law (1999) the Commodities and Futures Act of 2000 and the ConsolidatedEntity Supervision Act of the Securities and Exchange Commission (2004) freed USbanks to sell and securitize mortgages and other assets virtually without supervisionInstead of convergence toward International Financial Reporting Standards and Bankfor International Settlements (BIS) Basel II Accord capital reserve requirements USbanks were permitted to leverage freely and sell largely without consumer protectionregulations The US turn to deregulation remains an outlier Elsewhere domestic
regulators banks and financial institutions have adopted policies and reforms toconverge toward BIS domestic bank regulations and more effective capital marketsupervision
Third the valuation of mortgage backed securities and derivatives created afundamentally new situation once problems appeared in 2007 Data from the SecuritiesIndustry and Financial Markets Association suggest how the value of asset backedsecurities exploded after deregulation Values of outstanding debt and new debt issuedfrom 1996-2008 reveal an abrupt capitalization of mortgage related and asset backedsecurities typical of asset bubbles Longstanding bond markets such as municipal bondstreasury bonds corporate debt federal agency securities money markets and assetbacked bonds all remained on relatively stable growth trajectories until crisis hit in
2007 In comparison the market value of mortgage related bonds almost doubled fromUS$35 trillion in 2000 to reach US$89 trillion before crisis in 2007
8132019 Government Banking and BRICs in the Recent Financial Crisis
httpslidepdfcomreaderfullgovernment-banking-and-brics-in-the-recent-financial-crisis 757
983106983122983113983107 983111983151983158983141983154983150983149983141983150983156 983106983137983150983147983155 983137983150983140 983110983145983150983137983150983139983145983137983148 983123983156983137983156983141983139983154983137983142983156
7
Fourth central drivers of the financial market bubble in the US were secondarymarkets for mortgage backed securities and derivatives For example throughout thefinancial panic and crisis municipal bond markets remained largely stable despitefalling tax receipts and the impact of crisis on sub-national government budgets Thevalue of US Treasury bonds also increased during crisis reflecting a flight to quality
much criticized by surplus countries such as China This remains a comparativeadvantage of market-centered finance capitalism Despite originating crisis a flight toquality cheapens counter cyclical policies Corporate bonds also increased during crisisas US Federal Reserve banks and treasury injected funds to keep US firms afloatFurther analysis is needed However data from bond markets suggest that marketcentered finance capitalism retains particular sets of complementarities and policyalternatives
Fifth both government policies during crisis and proposals for new regulatoryframeworks are designed to tap these complementarities After September 2008 USgovernment reserves increased from US$ 900 billion to over two trillion dollars largelythrough new credit facilities created by the Federal Reserve Board and regional banks of
the Federal Reserve System US government reserves first increased through massiveextension of credit then through central bank swaps then through acquisition of federalgovernment securities by the US central bank These policies suggest particularconfigurations and complementarities in market-centered finance capitalism
The first program introduced in February 2008 was the Federal Reserve PrimaryDealer Credit Facility an overnight loan facility to ensure funds for primary dealers oftreasury securities to sustain demand in financial markets US government primarycredit borrowing increased from under US$200 billion through September 2008 to overUS$1100 billion by December 2008 but decreased thereafter to under US$400 billionby April 2009 US Federal Reserve Banks also purchased massive amounts of assetbacked securities to sustain markets In November 2008 the Federal Deposit InsuranceCorporation created a Temporary Liquidity Guarantee Program one that provided overUS$3340 billion by April 2009 (Given that FDIC funds are taken from charges onsavings accounts this transfer of funds from savings accounts to emergency financialpolicy credits has attracted criticism from community banking association members)US monetary authority purchases of GSE mortgage backed securities also reachedUS$125 trillion in GSE ldquoagencyrdquo mortgage backed securities US$2000 billion indirect agency obligations and permitted purchase of up to US$3000 billion in treasurysecurities during 2009 The Federal Reserve Board also created a Term Asset-BackedSecurities Loan Facility
In September 2008 the Federal Reserve Board created an Asset-Backed
Commercial Paper Money Market Mutual Fund Liquidity Facility to stave off financialpanic Lending through the Federal Reserve Bank of Boston reached US$1500 billionby September 2008 However loans under this program declined to near zero in Apriland remained below US$200 billion in May 2009 The Federal Reserve Board alsocreated a Commercial Paper Funding Facility through the Federal Reserve Bank of NewYork to avert financial panic spreading into commercial paper markets Loans to banksunder this facility reached US$3500 billion in January 2009 but declined to underUS$1400 billion by June 2009 The Federal Reserve Board also created a TermAuction Facility in December 2009 to ensure liquidity in uninsured interbank lendingmarkets Lending through this facility remained at approximately US$1400 billion intoOctober 2008 but increased to almost US$US5000 billion in March 2009 before
declining to an estimated US$ 3200 billion outstanding in June 2009
8132019 Government Banking and BRICs in the Recent Financial Crisis
httpslidepdfcomreaderfullgovernment-banking-and-brics-in-the-recent-financial-crisis 857
8132019 Government Banking and BRICs in the Recent Financial Crisis
httpslidepdfcomreaderfullgovernment-banking-and-brics-in-the-recent-financial-crisis 957
983106983122983113983107 983111983151983158983141983154983150983149983141983150983156 983106983137983150983147983155 983137983150983140 983110983145983150983137983150983139983145983137983148 983123983156983137983156983141983139983154983137983142983156
9
but should not conceal the counter intuitive modernization of government banksalongside (and often ahead) of private and foreign banks
A third explanation draws from the institutional complementarity hypothesis toargue that different policies in BRICS captured particular complementarities in bankingand finance to avert more severe impacts on economic activity This is a promising
approach but one that exceeds our ability to retrace the domestic policies amidst crisisacross four major countriesA fourth explanation is taken from the World Capitalist System approach and
focuses on the profound structural changes implied by recent growth and betteradjustment in BRIC countries This perspective also provides significant opportunitiesfor reflection and interpretation that must remain beyond the scope of this paper Theemergence of BRIC nations as driving force in the global economy is a fundamentallynew situation for theories of center-periphery north-south dependent development andtheories that focus on the specific trajectories of nations in what used to be called latelate development
A final explanation of why BRIC countries have fared comparatively better in
the face of global financial crisis is scale The very large size of these economiesprovided policy options unavailable to smaller countries From this perspective closedeconomies are less subject to the impacts of sudden stops in foreign finance during andafter the financial crisis and less exposed to export declines during global downturnsMoreover large closed BRIC economies retain options of turning away from exportstoward domestic investment and consumption a characteristic especially importantgiven atrocious income distribution and social exclusion This dimension also remainsbeyond the scope of this paper on public banking and domestic financial statecraft
Unless we are mistaken these explanations are complementary to our core claimsthat government banks made a difference in terms of avoiding the creation of asset bubblesrealizing competitive advantages over private and foreign banks since liberalization andproviding counter cyclical policy alternatives to ameliorate downturn Case studies of theBRICs follow
Brazil
We begin with Brazil Our research on Brazil suggests that since price stability the return todemocracy and liberalization of the banking system in 1995 federal banks have realizedcompetitive advantage over private and foreign banks while providing policy alternatives topolitical and social forces This article extends this argument to suggest that these institutionshave modernized amidst liberalization and globalization across BRIC countries ldquojust in timerdquo
to retain client confidence and provide counter-cyclical credit to avert domestic downturns inthe face of global crisis
8132019 Government Banking and BRICs in the Recent Financial Crisis
httpslidepdfcomreaderfullgovernment-banking-and-brics-in-the-recent-financial-crisis 1057
983106983122983113983107 983111983151983158983141983154983150983149983141983150983156 983106983137983150983147983155 983137983150983140 983110983145983150983137983150983139983145983137983148 983123983156983137983156983141983139983154983137983142983156
10
The market shares of government banks private banks and foreign banks in domesticBrazilian credit from 1988-2009 are reported in Figure 1 First the trajectories of credit fromgovernment private and foreign banks suggests that state presence in banking declined during the 1990s through privatization of state government banks However sincecapitalization and reform in 2001 government banks increased market share substantiallyconsistent with our argument that they have modernized to compete alongside private andforeign banks Further comparison of government private and foreign bank policies suggestthat government banks 1) provide more loans per capita 2) provide more counter-cyclicalcredit to help firms and households through economic downturns and 3) hold treasury bonds
for the term rather than trading or unloading a difference that helps reduce market pressuresto shorten the term and increase the cost of government debt
Bank Returns in Brazil and Select Latin American and Reference Countries 2003-20072003 2004 2005 2006 2007
------------------------------------------------------------------------------------------Brazil Government 235 215 265 337
Private 160 262 259 273Foreign 101 61 166 106Bank System 158 176 212 206 224
Argentina -227 -42 70 143 97Chile 167 167 179 186 162
Mexico 161 172 244 262 202Australia 242 228 253 270 281Canada 147 167 149 209 125Spain 132 141 169 199South Africa 116 162 152 183 184---------------------------------------------------------------------------------------------Excludes credits under guarantee Source Bankscope cited in Central Bank of Brazil Financial Stability
Report November 2008 p 56 and Central Bank of Brazil Financial Stability Reports 2004-7
The above table also suggests that government banks have also systematicallyoutperformed private and foreign banks operating in Brazil since capitalization of theseinstitutions to meet Basel II Capital Risk guidelines of the Bank for International Settlements
in 2001 This is an anomaly for theories of private bank efficiency and expectations of liberalreforms in the 1990s Moreover counter-cylical lending exposes government banks to late
983088
983093
983089983088
983089983093
983090983088
983090983093
983091983088
983089 983097 983096 983096
983089 983097 983096 983097
983089 983097 983097 983088
983089 983097 983097 983089
983089 983097 983097 983090
983089 983097 983097 983091
983089 983097 983097 983092
983089 983097 983097 983093
983089 983097 983097 983094
983089 983097 983097 983095
983089 983097 983097 983096
983089 983097 983097 983097
983090 983088 983088 983088
983090 983088 983088 983089
983090 983088 983088 983090
983090 983088 983088 983091
983090 983088 983088 983092
983090 983088 983088 983093
983090 983088 983088 983094
983090 983088 983088 983095
983090 983088 983088 983096
983090 983088 983088 983097
983077
983129983141983137983154
Figure 1 Government Private and Foreign Bank Lending as percent
of Brazilian GDP 1988-2009
983120983154983145983158983137983156983141
983111983151983158983141983154983150983149983141983150983156
983110983151983154983141983145983143983150
8132019 Government Banking and BRICs in the Recent Financial Crisis
httpslidepdfcomreaderfullgovernment-banking-and-brics-in-the-recent-financial-crisis 1157
983106983122983113983107 983111983151983158983141983154983150983149983141983150983156 983106983137983150983147983155 983137983150983140 983110983145983150983137983150983139983145983137983148 983123983156983137983156983141983139983154983137983142983156
11
and non-payment of loans This reduces profits Strategies to ldquoholdrdquo government securitiesalso reduce profits Nonetheless government banks have reported stronger returns thanforeign and domestic banks on average since capitalization in 2001
The above data may conceal bad banking practices such as crony credit bad loans andcosts that in the end must be passed on to others through fiscal accounts or the money supply
Data from the Central Bank of Brazil help control for these possibilities and provide furthercomparison of bank performance This section compares government private and foreignbanks in terms of the Basel Index bad credit late loans and stress tests that estimate theimpact of hypothetical shocks to bank portfolios from foreign exchange devaluation andorcredit problems
First the Basel Index for government domestic and foreign banks from 2002-2006suggests that government banks remain capitalized well above levels set in Central Bank ofBrazil guidelines (110 set in 1999) The Bank for International Settlements suggests an 80level of capital in reserve against possible losses in lending and finance The average BaselIndex for government banks increased from 167 percent in 2002 to 197 percent in 2006 Incomparison the average Basel Index for private domestic banks increased from 151 pecent
to 170 percent during this period while foreign banks on average reported Basel Indexes of152 in 2002 remaining at 154 in 2006 This suggests that government banks in Brazil retainsufficient capital in reserve against risks arising from bad credit or losses in financialmarkets
Bank System Basel Index in Brazil Select Latin American and Reference Countries
2002 2003 2004 2005 2006---------------------------------------------------------------------------------------------Brazil Government 167 148 165 174 197
Private 151 171 183 177 170Foreign 152 167 187 164 154
Chile 141 136 130 125 120Mexico 144 141 145 163 159Australia 100 104 104 104 103Canada 134 133 129 125 121Spain 126 123 122 119South Africa 124 140 127 123 122
---------------------------------------------------------------------------------------------Source Central Bank of Brazil Financial Stability Report 2002-2006Note Basel Index = recommended minimum eleven percent relation between required net worth and risk-
weighted total assets
A closer look at changing Basel indexes reveal the consequences of counter-cyclicallending from federal government banks Because private domestic and foreign banks adoptedmore cautious strategies and provided less credit during the downturn of 2002 theseinstitutions maintained levels of capital reserves above levels found in government banksThe average Basel index for the domestic financial system thus remained roughly the same atyear-end 2002 (06 percent increase to 162 over June 2002) However this average concealsan increase of 21 percent in the Basel Index for private banks (largely meaning they chose tohold low risk rated government paper) and a decline of 23 percent of the Basel Index forgovernment banks (meaning they incurred risks to lend during downturn and adjustment)Before assuming the worst readers should note two matters First the Central Bank of Brazilrequires banks to maintain a Basel Index of 110 This is three points greater than the 80
8132019 Government Banking and BRICs in the Recent Financial Crisis
httpslidepdfcomreaderfullgovernment-banking-and-brics-in-the-recent-financial-crisis 1257
983106983122983113983107 983111983151983158983141983154983150983149983141983150983156 983106983137983150983147983155 983137983150983140 983110983145983150983137983150983139983145983137983148 983123983156983137983156983141983139983154983137983142983156
12
suggested in the 1988 Basel Accord and subsequent revisions for capital guidelines In otherwords Brazilian banks set aside almost half again more in additional capital reserves thanlevels recommended by the Bank for International Settlements Second the different BaselIndex ratings of government and private banks also reflects the greater weight of credit andtherefore credit risk in these institutions And data on bad and late loans since 2001 suggest
that the slight and temporarily higher levels of average Basel Indexes reported by governmentbanks do not reflect broader deterioration of portfoliosFurthermore Banks in Brazil and especially government banks tend to be more
conservative setting aside not only frac12 of deposits as compulsory reserves at the Central Bankof Brazil but also retaining additional reserves against bad loans and losses Firstcomparative data suggests that Brazilian banks tend to set considerably larger sums aside inreserve against bad loans and other losses Of the four large Latin American countries andfour further economies reported by the IMF and Central Bank of Brazil Brazil retainedsubstantially larger reserves against bad loans than any country except Spain during 2007This confirms the particular characteristics of banking in Brazil that of a higher cost andlower operating efficiency combined with larger reserves and provisions against losses
Bank Reserves as Percent of Overdue amp Late Loans in Brazil Select Latin American andReference Countries
2003 2004 2005 2006 2007 2008---------------------------------------------------------------------------------------------Brazil 3200 3719 2874 2800 2862 2709Argentina 792 1029 1251 1303 1303Chile 1309 1655 1776 1985 2107Mexico 1671 2018 2321 2074 1947Australia 1318 1829 2030 2052 1889Canada 435 477 493 553 449Spain 2454 2196 2518 2733South Africa 542 613 643---------------------------------------------------------------------------------------------Source IMF Global Financial Stability Report 2008 cited in Central Bank of Brazil Financial Stability
Report November 2008 p 56
The level of bad and late loans in bank portfolios is another measure of bank solidityThe convergence of bad credit levels in government private and foreign banks from 1988-2008 introduced this study Further comparison suggests that although government banksretain higher levels of bad and late loans in specific sectors (especially home loans) the value
of late loans as a percent of total loans in government banks fell below levels in private andforeign banks during 2008 (See table on following page) The value of bad credit (loans over12 months past due) in government banks decreased from R$372 billion in 2001 to R$149billion in June 2006 This places the value of bad credit in government banks below the valuefound in private and foreign banks Bad credit in private banks increased from R$173 billionin 2001 to peak at R$255 billion during 2003 declining to R$180 billion in 2006 Foreignbanks also reported increased values of bad credit from R$123 billion in 2001 peaking atR$141 billion in 2003 and declining to R$130 billion in 2006 While late loans remained 85percent of total loans in government banks in 2001 (above 75 percent in private and 65percent in foreign banks) by 2008 the relation reverses In 2008 late loans declined to 32percent of total loans at government banks while remaining at 37 percent in private banksand 45 percent in foreign banks
8132019 Government Banking and BRICs in the Recent Financial Crisis
httpslidepdfcomreaderfullgovernment-banking-and-brics-in-the-recent-financial-crisis 1357
983106983122983113983107 983111983151983158983141983154983150983149983141983150983156 983106983137983150983147983155 983137983150983140 983110983145983150983137983150983139983145983137983148 983123983156983137983156983141983139983154983137983142983156
13
Moreover government banks in Brazil continue to set aside greater provisions againstbad and late loans than private or foreign banks In 2004 government banks retained 86percent of the value of total loans in provision against losses from non-paying loans whileprivate banks retained 60 percent and foreign banks 51 percent In 2008 the level ofprovisions at government banks had declined on average to 68 percent but still remained
well above the levels of 52 and 51 percent recorded at private and foreign banks
Late Loans and Provisions in Government Private and Foreign Banks 2001-2008
Government Banks Private Banks Foreign Banks--------------------------- ----------------------------- -----------------------------R$bi R$bi R$bigt12m Late Provision gt12m Late Provision gt12m Late Provision
----------------------------------------------------------------------------------------------------------------2001 372 85 173 75 123 652002 394 55 202 73 141 60
2003 326 70 255 74 159 662004 133 35 86 160 31 60 102 32 512005 134 39 81 163 35 59 107 35 482006 149 42 68 180 44 66 130 45 532007 35 75 37 55 43 502008 32 68 37 52 45 512009 30 56 612010 20 47 40 66 41 532011 20 43 46 71 50 58----------------------------------------------------------------------------------------------------------------Note Bad credit = loans past due over 12 months Late = percent of total loans gt120 days overdue
Provision = percent of total loan value set aside as reserves against losses Empty cells reflect lack of databecause of changing reporting standards at Central BankSource Central Bank of Brazil Financial Stability Report November 2008 p 56 and 2002-2006
Again in comparative perspective the levels of late loans in Brazilian bankingremains significantly higher than other countries Table 213 reports the value of late loans asa percent of bank portfolios in Brazil select Latin American and further countries forreference This suggests that differences found in Brazilian government banks have to dowith differences in the banking system such as judicial preference for debtors over creditorsrather than the inferior performance of government banks
Late Loans as percent of Total Loans in Brazil Select Latin American and ReferenceCountries
2003 2004 2005 2006 2007----------------------------------------------------------------------------------------------------------------Brazil 39 30 35 37 32Chile 16 12 09 08 08Mexico 28 22 18 21 25Australia 03 02 02 02 02Canada 12 07 05 04 04Spain 17 17 16 14 11South Africa 24 18 15 11 12
---------------------------------------------------------------------------------------------------------------- Does not include credits covered by guaranteeSource Bankscope cited in Central Bank of Brazil Financial Stability Report November 2008 p 56
8132019 Government Banking and BRICs in the Recent Financial Crisis
httpslidepdfcomreaderfullgovernment-banking-and-brics-in-the-recent-financial-crisis 1457
983106983122983113983107 983111983151983158983141983154983150983149983141983150983156 983106983137983150983147983155 983137983150983140 983110983145983150983137983150983139983145983137983148 983123983156983137983156983141983139983154983137983142983156
14
Further comparative data confirms that the Brazilian banking system tends to run onmore expensive credit higher returns and profits and higher levels of late and bad loansBanks operating in Brazil also retain higher levels of administrative and personnel costsHowever Brazilian banks also tend to set aside more generous reserves and provisions
against losses These structural characteristics can be seen in the comparative data in the tablebelow The data on government private and foreign banks in Brazil and comparisons suggestthat the Brazilian banking system incurs higher operating costs maintains higher reservesprovisions and capital against losses and risk but nonetheless produces strong returns
Indicators of Bank Efficiency Performance and Provisions in Brazil Select Latin Americanand Reference Countries
Cost Op Exps NPL Provisions EquityIncome Assets Loans NPL Assets
----------------------------------------------------------------------------------------------------------------
Brazil 62 65 41 153 9Argentina 84 41 66 116 12Chile 53 28 10 166 7Colombia 52 59 32 144 11Mexico 58 47 20 232 12US 54 33 07 163 8Spain 56 16 07 313 12----------------------------------------------------------------------------------------------------------------Source World Bank ldquoBrazil The Industry Structure of Banking Servicesrdquo Brasiacutelia June 2007 pp
Comparison of administrative costs in Brazilian banking with levels in other large
Latin American and emerging and reference economies suggest that Brazilian banks retainhigher costs From 2001 through 2005 the value of administrative costs as a percent of bankassets in Brazil declined from 69 percent to 58 percent but remained significantly abovelevels reported from Chile (30 to 27 percent) Mexico (47 to 46 percent) and well abovereference countries such as Australia Canada and Spain (16 36 and 11 percentrespectively) Although time series lacks comparison after 2005 administrative costs inBrazilian banks decline significantly from 58 in 2005 to 42 in 2008
Bank Administrative Costs in Brazil Select Latin American and Reference Countries (Assets)
2001 2002 2003 2004 2005 2006 2007 2008-------------------------------------------------------------------------------------------------Brazil 69 61 60 61 58 55 51 42Chile 30 30 27 27 27Mexico 47 48 46 43 46Australia 17 17 16 16 16Canada 27 27 27 27 26Spain 17 17 16 14 11-------------------------------------------------------------------------------------------------- Adjusted average of total assetsSource Bankscope cited in Central Bank of Brazil Financial Stability Report November 2008 p 56
A final comparison of government private and foreign bank solidity is based onCentral Bank of Brazil estimates of the impact of hypothetical shocks to the Brazilian
8132019 Government Banking and BRICs in the Recent Financial Crisis
httpslidepdfcomreaderfullgovernment-banking-and-brics-in-the-recent-financial-crisis 1557
983106983122983113983107 983111983151983158983141983154983150983149983141983150983156 983106983137983150983147983155 983137983150983140 983110983145983150983137983150983139983145983137983148 983123983156983137983156983141983139983154983137983142983156
15
economy on domestic banks These estimates are based on the revisions of the widely usedValue-at-Risk estimates proposed by Boudoukh Richardson and Whitelaw that adapts theoriginal VaR method developed and commercialised by JP Morgan19
Stress Tests for Impact of Credit Interest Rate and Foreign Exchange Shock on Basel Index
Comparison of Government Domestic and Foreign Banks 2001-2006
2002 2003 2004 2005 2006-------------------------------------------------------------------------------------------------------------
Government 112 104 114 113 109Domestic 112 132 126 121 103Private 103 131 135 108 84-------------------------------------------------------------------------------------------------------------Source Central Bank of Brazil Financial Stability Reports 2002-2006Note Basel Index = Capital risk guideline measure defined by Bank for International Settlements BaselCommittee that recommends 8 percent relation between PR and total assets weighted by risk level Since 2002Central Bank of Brazil minimum requirements of Basel Index remains 11 percent For methods of calculationsee Central Bank of Brazil Financial Stability Report Brasilia 2006 p 76
Central Bank of Brazil tests estimate that in the face of foreign currency valuationand interest rate shock government banks would nonetheless remain at or slightly below thecapital requirements against credit risk recommended by the central bank Again it should benoted that Basel Index levels recommended in the BIS Capital Requirements guidelines forthe Basel Index of banks are 80 while the Central Bank of Brazil has set minimum BaselIndex levels of 110 Given that federal government bank portfolios include more credit thanprivate banks and especially foreign banks the estimate of a shift to 109 in the averageBasle index for federal government banks in the face of a credit shock provides furtherevidence that these financial institutions are solid and their capital reserves sufficient Insum comparison of results for government private and foreign banks in the estimatesreported by the Central Bank of Brazil of the likely impact of a shock to the Brazilianeconomy in terms of interest rates and foreign exchange rates also suggests that governmentbanks appear solid The average Basel Index reported for government banks in this stress testwas 135 above the 110 Central Bank of Brazil guideline and well above the 80 levelsuggested by the BIS
Understanding the capacity of Brazilian banks to cope with shocks and risk is not justa theoretical exercise Since the currency crisis in Mexico during 1994-1995 the newlystabilized currency was tested by shocks from home and abroad Policies first dramaticallyincreased interest rates under a fixed exchange rate regime then freed the real to devalue
under a flexible foreign exchange rate regime in January 1999 The Asian currency crisesduring second semester 1997 led the Central Bank of Brazil to increase benchmark Selicinterest rates to 434 percent in November In August 1998 the declaration of moratorium onforeign debt payments by Russia the central bank to once again increase Selic interest ratesfrom 20 to 40 percent under the fixed exchange rate regime by November of that year Theseshocks from abroad coincided with preparations for national elections during 1998 leadingthe IMF and other official creditors to provide strong support for the Brazilan governmentNonetheless by January 1999 (after the election) market pressure led to the abandonment ofthe fixed foreign exchange rate regime that had served as nominal anchor for economic
19 Calculation first published in Resenha BMampF Vol 122 1998 (described in Central Bank of Brazil
Financial Stability Report 2002 amp 2003 then as Boudoukh Jacob Matthew Richardson RichardStanton amp Robert Whitelaw ldquoMaxVaR Long Horizon Value at Risk in a Mark-to-Market Environmentrdquo Journal of Investment Management 2004Vol 2 No 3 pp 14-19
8132019 Government Banking and BRICs in the Recent Financial Crisis
httpslidepdfcomreaderfullgovernment-banking-and-brics-in-the-recent-financial-crisis 1657
983106983122983113983107 983111983151983158983141983154983150983149983141983150983156 983106983137983150983147983155 983137983150983140 983110983145983150983137983150983139983145983137983148 983123983156983137983156983141983139983154983137983142983156
16
policy since 1994 The real quickly devalued from 121 to 20 against the US dollar by theend of January and led to considerable changes in policy (a flexible foreign exhange rateregime inflation targeting and the implementation of further fiscal reforms) Once the realrevalued from R$22 against the dollar in March to R$166 in April 1999 the governmentmoved to consolidate this new triad of economic policies Since 1999 flexible foreign
exchange markets inflation targeting and fiscal reform have remained in place This suggeststhat Brazilian banks have weathered volatile parameters and large risks during a markedpolitical business cycle One involving the transition from reformist President Cardoso to PTPresident Lula Since recovery of the economy during 2004 the coalition government underPT President Lula has sought to expand the contribution of government banks to accelerategrowth and social inclusion These policies have not undermined economic fundamentals oreroded the institutional foundations of comparative advantage retained by Brazilian federalgovernment banks
In sum the advances of Brazilian banking toward Basel Accord regulations during the1990s and 2000s the adoption of more transparent and timely reporting standards and themodernization of government banks under pressures from liberalization placed federal banks
in a new situation in the face of crisis once it hit the country in 2008 A closer look at the bigthree federal government banks is in order to better understand these changes
The Banco do Brasil
Upon taking office in 2003 President Lula retained the central economic policies of theCardoso administration such as inflation targeting tight fiscal and monetary policy andthe operational independence of the Banco do Brasil However the recovery of investorconfidence during 2003 and the return of stronger growth levels during 2004 led to aperiod of what the Central Bank of Brazil describes as organic growth at the Banco doBrasil From 2004-2008 the Banco do Brasil contributed to the deepning of domesticcredit markets and emerged as leading investment bank at the Bovespa stock marketFurthermore once the Bovespa collapsed credit became short and a sharp downturnensued during 2008 the Banco do Brasil provided emergency loans infusions of capitalthrough stock purchases and the acquisition of small and mid-sized firms and banksunable to weather the sharp decline and lack of credit Although the merger of Itauacute andUnibanco in 2008 displaced the Banco do Brasil as the largest financial institution inLatin America the bank retains powerful institutional foundations of comparativeadvantage and networks that cross Brazilian society politics and markets
The Banco do Brasil also remains at the center of Brazilian politics and policydisputes Indeed leaders of the PT party faction articulaccedilatildeo (articulation) includes
career employees of the Banco do Brasil and presidents of the Brazilian bank workersunion such as Luiz Gushiken and Ricardo Berzioni Both were nominated to ministerialposts by President Silva in January 2003 By August 2003 21 of 33 top positions at theBanco do Brasil had been filled by new representatives of the PT most Banco do Brasilemployees and members of the Brazilian bank workers union Critics decriedpoliticization However the resistance of bank representatives described above topresidential appeals to increase credit during 2003 was followed by more neutralappointments during 2004 When Banco do Brasil President Cassio Casseb Limaresigned in November 2004 (under charges of irregularities in consulting contracts atthe bank) President Lula nominated Rossano Maranhatildeo Pinto a career employee andBanco do Brasil vice president to head the bank Further appointments of PMDB
political leaders to cement support for the PT coalition government were also criticizedas politicization of the bank However Banco do Brasil officials responded that these
8132019 Government Banking and BRICs in the Recent Financial Crisis
httpslidepdfcomreaderfullgovernment-banking-and-brics-in-the-recent-financial-crisis 1757
983106983122983113983107 983111983151983158983141983154983150983149983141983150983156 983106983137983150983147983155 983137983150983140 983110983145983150983137983150983139983145983137983148 983123983156983137983156983141983139983154983137983142983156
17
experienced political leaders of the PMDB brought competitive advantages to the bankbased on their networks that cross the public and private sector These networks andrelations during the second PT coalition government of President Lula also appearsdifferent than the first given the departure from core offices of the presency bylongtime advisors to Lula that came from the Banco do Brasil and bank workers union
By late 2006 only one of seven vice presidents of the Banco do Brasil was a member ofPresident Lulaacutes Workersacute Party (PT)Again Banco do Brasil policies and growth since recovery of the economy in
2004 involved first a period of expansion during four years of growth followed by aturn to counter cyclical lending and finance once financial crisis abroad produced first asevere contraction in credit supply then a sharp economic downturn in fourth quarter2008 Institutional foundations of comparative advantage are behind Banco do Brasilpolicies during both periods First the capitalization of Brazilian firms on the Bovespastock market is closely related to the groups that cross politics government banks thepowerful bank worker labor union the Banco do Brasil employee private pension fundand bank consortia often led by the Banco do Brasil investment banking division (often
joined by the BNDESpar and Caixa investment banking division) Recent developmentsare complex and will require further research However rather than convergence towardprivate banking and a market-centered financial system examination of Banco do Brasilpolicies and market shares during the 2000s suggests that federal government banks notonly remain at the center of politics policy and development strategies but that theseinstitutions have modernized to compete against private and foreign banks
The large scale and scope of the Banco do Brasil has permitted use of the bankfor counter-cyclical lending and leadership in capital markets without deteriorating bankbalance sheets Since 2003 the Banco do Brasil has remained well within domesticbank regulations and Basel Accord guidelines During 2002 and 2003 reforms at theBanco do Brasil sought to reduce costs and increase efficiency ratings Indeed therelation between the Banco do Brasil and President Lula reversed past patterns In the1950s conflicts were between national developmentalist groups at the Banco do Brasiland more orthodox Ministers of Finance In 2003 and once again during the 2008financial crisis differences between President Lula and the Banco do Brasil were thereverse Banco do Brasil management refused to dramatically increase loans in 2003and resisted requests to reduce the price of credit in 2008 In 2003 the caution imposedby political risk perceptions led President Lula to respect the operational autonomy ofthe Banco do Brasil In April 2009 Banco do Brasil President Antonio Francisco deLima Neto was fired after refusing to reduce interest rates on loans This reversal ofpolicy positions from the 1950s suggests in a broader sense a transition from the
macroeconomics of populism to the microeconomics of government banking in the 21
st
century Government banks do not provide easy or all solutions Instead credit andfinance policies are subject to market discipline credit risk analysis and the realities ofbusiness cycles
Review of the Banco do Brasilrsquos balance sheet from 2002-2008 suggests that the bankdeveloped organically from 2002-2007 with gradual increases reflecting the competitiveadvantages at the top of Brazilian banking and finance Policies changed during 2007 and2008 as the credit shortage caused by international financial crisis led to the Banco do Brasilassuming once again lending of last resort functions by extending interbank investments andloans to small and medium sized banks to avert further declines in domestic liquidity TheBanco do Brasil also acquired a 51 percent stake in the Votarantim bank to avert a run on
deposits and possible failure while acquiring Satildeo Paulo state government savings bankNossa Caixa for R$76 billion in 2008 These acquisitions reflect concern about the
8132019 Government Banking and BRICs in the Recent Financial Crisis
httpslidepdfcomreaderfullgovernment-banking-and-brics-in-the-recent-financial-crisis 1857
983106983122983113983107 983111983151983158983141983154983150983149983141983150983156 983106983137983150983147983155 983137983150983140 983110983145983150983137983150983139983145983137983148 983123983156983137983156983141983139983154983137983142983156
18
replacement of the Banco do Brasil as the largest financial conglomerate in Brazil after themerger of Itauacute and Unibanco
Banco do Brasil Balance Sheet Summary 2002-2008 R$ billion
2002 2003 2004 2005 2006 2007 2008 2009 2010 2011Assets --------------------------------------------------------------------------------------------------------Interbank Investments 101 50 27 80 175 434 951Interbank Deposits 76 283 137 209 116 77 242Securities 709 696 734 664 731 752 732Central Bank Deposits 81 186 221 244 281 334 212Loans to Private Sector 89 652 757 885 1178 1463 1810Loans to Public Sector 56 43 41 37 43 24 230Receivables 297 273 312 351 404 548 808Other AssetsTotal Assets 2046 2301 2390 2529 2963 3672 5073Liabilities ---------------------------------------------------------------------------------------------------Deposits 972 1100 1155 1376 1588 1882 2711
M MKT Borrowing 483 400 445 305 492 722 914Treasury amp BNDES 59 74 106 133 143 175 224Shareholder Equity 92 121 141 168 207 242 299Other LiabilitiesTotal Liabilities 2046 2301 2390 2529 2963 3672 5073---------------------------------------------------------------------------------------------------------------- Compulsory deposits for commercial banks according to Central Bank regulationsSource Banco do Brasil Annual Reports Historical Series 2002-2008
From 2002 through 2006 the balance sheet of the Banco do Brasil suggests a periodof growth based on loans to the private sector with deposits and shareholder equityincreasing largely apace After 2006 the balance sheet changes fundamentally with capitalinjections from money market borrowing increasing from R$492 billion in 2006 to R$914billion in 2008 while Banco do Brasil liabilities with Treasury and BNDES increased fromR$143 billion in 2006 to R$224 billion in 2008 The asset side of the balance sheet alsosuggests fundamental change Private sector lending increased from R$1178 billion in 2006to R$1810 billion in 2008 reflecting acquisition of portfolios from Nossa Caixa Interbankinvestments increased from R$175 billion in 2006 to R$951 billion in 2008 while interbankdeposits also increased from R$116 billion in 2006 to R$242 billion in 2008 The counter-cyclical lending strategies of the Banco do Brasil during 2008 also included an increase oflending to the public sector from R$24 billion in 2007 to R$230 billion Banco do Brasilreponses to government credit policy can also be seen in the release of 40 percent of
compulsory deposits retained at the central bank Banco do Brasil deposits at the central bankdeclined from R$334 billion in 2007 to R$212 billion in 2008 ndash freeing this value for loansand investments
Networks and relations during the second government of President Lula appeardifferent than the first given the departure from core offices of the presency by longtimeadvisors to Lula that came from the Banco do Brasil and bank workers union By late 2006only one of seven vice presidents of the Banco do Brasil was a member of President LulaacutesWorkersacute Party (PT) The corporate profile of the Banco do Brasil suggests once again thehybrid character of this government bank one listed on the Bovespa Novo Mercado but withover 65 percent of shares owned by the Brazilian federal government Treasury
8132019 Government Banking and BRICs in the Recent Financial Crisis
httpslidepdfcomreaderfullgovernment-banking-and-brics-in-the-recent-financial-crisis 1957
8132019 Government Banking and BRICs in the Recent Financial Crisis
httpslidepdfcomreaderfullgovernment-banking-and-brics-in-the-recent-financial-crisis 2057
983106983122983113983107 983111983151983158983141983154983150983149983141983150983156 983106983137983150983147983155 983137983150983140 983110983145983150983137983150983139983145983137983148 983123983156983137983156983141983139983154983137983142983156
20
customers in 2008 reached 479 million with the bank retaining 39700 AMTs and 766million bank cards (239 million credit cards and 527 million debit cards) Like the CaixaEconocircmica Federal the Banco do Brasil also processes government payments withretirement and social security payments numbering 745 million transactions during 2008Although this implies administrative costs (and receipts) this also brings customers and
prospective customers into Banco do Brasil branch officesDuring 2008 the Banco do Brasil continued to expand operations form jointventures acquire private and government banks and modernize operations A secondaryoffering of stock in January 2008 granting of shares by VISA to the Banco do Brasil andupgrading of the bank to investment grade BB- by Standard amp Poors in April 2008 suggestthat market orientation of the bank continues during the Lula administration despite counter-cyclical credit policies A Lower Income Segment Department was also created to assumeBanco Popular do Brasil operations along with correspondent banking relations and regionalsustainable development programs The Banco do Brasil also received permission to usesavings accounts for home loans enabling the bank to compete on level ground with CaixaEconocircmica Federal During 2008 the Banco do Brasil also acquired the state government
banks Banco do Piaui Banco de Santa Catarina (33rd largest bank in Brazil with US$30billion assets at year end 2007) and Satildeo Paulo government savings bank Nossa Caixa (12thlargest Bank in Brazil with US$267 billion in assets at year end 2007) In sum the diversecorporate divisions and financial operations of the Banco do Brasil provided policy optionsduring 2008 to counter the credit shortage and help firms and domestic banks to adjust
Banco do Brasil and Private Bank Returns and Capital Adequacy 2002-2009
Basel Index Return on Assets Return on Liquid Assets----------------------------- ----------------------------- -----------------------------BB Itauacute Bradesco BB Itauacute Bradesco BB Itauacute Bradesco
--------------------------------------------------------------------------------------------------------------2002 122 184 179 12 26 20 302 288 2832003 137 198 199 11 28 16 231 297 2282004 152 206 188 13 30 23 240 292 3092005 171 170 173 12 37 26 187 353 2842006 173 171 188 28 31 25 267 288 2632007 156 179 156 14 32 22 222 321 2442008 152 161 169 25 19 16 304 221 2112009 150 165 166 12 13 14 238 182 195-------------------------------------------------------------------------------------------------------------- Annualized first quarter 2009 resultsSource Banco do Brasil Itauacute and Bradesco Annual Reports 2002-2009
Comparison of Banco do Brasil returns and capital adequacy with the two majorprivate Brazilian banks Itauacute and Bradesco suggests that the performance and solidity of theBanco do Brasil remains equal or superior to private banks During 2002 and 2003 thecapital adequacy of the Banco do Brasil and return on assets remained below levels reportedby the two largest Brazilian private banks suggesting the impact of counter-cyclical lendingHowever after 2004 the Basel index of the Banco do Brasil reached 171 far above BISstandards of 80 and Central Bank of Brazil requirements of 110 Furthermore from 2006through first quarter 2009 returns on assets returns on liquid assets and the Basel index ofthe Banco do Brasil exceed levels reported by Itauacute and Bradesco In sum despite providingcounter cyclical credit and despite having been replaced by the Itau-Unibanco merger as the
8132019 Government Banking and BRICs in the Recent Financial Crisis
httpslidepdfcomreaderfullgovernment-banking-and-brics-in-the-recent-financial-crisis 2157
983106983122983113983107 983111983151983158983141983154983150983149983141983150983156 983106983137983150983147983155 983137983150983140 983110983145983150983137983150983139983145983137983148 983123983156983137983156983141983139983154983137983142983156
21
largest Brazilian bank the performance and capital adequacy of the Banco do Brasil remainsat or above levels reported by the two largest private banks
In sum since liberalization of banking and finance and privatization of stategovernment banks during the 1990s the Banco do Brasil has been transformed from directstate owned bank into one of two very large financial conglomerates that dominate domestic
banking in Brazil Instead of retaining easy access to funds at Treasury to cover losses theBanco do Brasil has adopted international corporate governance standards to become listedon the Bovespa Novo Mercado and retains an important role in virtually every aspect ofBrazilian banking and finance Although sale of shares in the 1990s were designed to transfercorporate governance and control of the national bank to the private sector the federalgovernment retains 65 percent of stocks after two sale of stocks capitalized the bank duringthe 2000s The massive size and wide scope of Banco do Brasil networks across bankingfinancial markets political and social forces and business have led the bank to realize recordprofits during the period of growth from 2004-2008 and provide counter-cyclical credit toavert a further decline in industrial activity and the economy as the US and global financialcrisis hit Brazil first with a 50 percent decline in the Bovespa stock market and credit
shortage followed by a steep but short decline in industrial production in late 2008 Thetransparency of Banco do Brasil quarterly reports and advances in Central Bank of Brazilsupervision of domestic banking clarify the new tensions that have emerged during the PTgovernment of President Lula These tensions reflect the modernization and competitiveadvantages of the Banco do Brasil
Caixa Econocircmica Federal (Federal Savings Bank Caixa)
The third largest domestic bank the wholly government owned Federal Savings Bank Caixawas also called on by President Lula during the recent financial crisis to increase the pace ofgrowth provide counter cyclical credit during downturns and to reduce consumer andcorporate interest rates and bank spreads Review of balance sheets and policies since 2001suggest that the Caixa retains its core business in urban development home loans real estatetransfer of funds for government programs and services and lottery administration Howeverinvestment banking management of third party funds and the creation of of new products andservices have both increased profits and increased popular access to banking and socialservices The bank has recorded record profits since R$108 billion (2002) R$16 billion(2003) and R$14 billion (2004) The Caixa became the fourth largest Brazilian investmentbank by 2003 while gaining dealer status from the Central Bank of Brazil in primary andsecondary markets for government securities At year-end 2003 the bank retained anestimated R$767 billion of government paper (over ten percent of government paper) in its
portfolio assets earning over R$135 billion that year Since recovery of the Brazilianeconomy in 2004 the Caixa has reported strong profits and continued to improve thestructure of its balance sheet and converge toward international bank reporting standards
In terms of assets deposit base and the number of employees and branches the datasuggest that the Caixa has emerged from a process of rationalization and downsizing duringthe late 1990s and expanded ldquoorganicallyrdquo since capitalization in 2001 Assets declined fromover US$999 billion in 1997 to US$363 billion in 2002 after reorganization andcapitalization Deposits also declined from US$541 billion in 1997 to US$216 billion in2002 The number of employees and branches declined from 104253 and 2316 to 98971 and1803 respectively but returned to 104934 and 2428 by 2006 After reorganization andcapitalization in June 2001 Basel indexes and the ratio of fixed assets over equity indicate
substantial reform and transition toward international banking standards The Basel Index thatmeasures the adequacy of capital reserves against possible losses and risks increased from
8132019 Government Banking and BRICs in the Recent Financial Crisis
httpslidepdfcomreaderfullgovernment-banking-and-brics-in-the-recent-financial-crisis 2257
983106983122983113983107 983111983151983158983141983154983150983149983141983150983156 983106983137983150983147983155 983137983150983140 983110983145983150983137983150983139983145983137983148 983123983156983137983156983141983139983154983137983142983156
22
135 (49 in March 2001 before capitalization) to reach 278 and remain twice above theCentral Bank minimum of 110 at 252 in 2006 The ratio of fixed assets as a proportion ofequity also declines substantially from 638 at year end 2001 to 197 in 2007
Summary of Caixa Structure and Performance 1995-2007
Assets Profits Deposits Employees Branches Basel FAEquity1995 826 672 503 99866 23161996 907 2351 515 99343 21051997 999 875 541 96300 18031998 948 1693 499 94859 18191999 684 1571 344 94194 19192000 644 1362 322 104253 19212001 436 -1265 298 98971 2013 135 6382002 363 1462 216 106548 2147 146 5372003 521 2617 281 100498 2046 192 413
2004 556 2999 345 100164 2135 202 3612005 806 4852 456 106729 2321 278 2012006 981 4874 567 104934 2428 252 1972007 1409 4485 800 106770 2052 288 1282008 1266 5735 708 103895 2069 206 119
Note Assets amp Deposits = US$billion Profits = US$million Basel = BIS Basel Accord index of capital reserveadequacy FAEquity = Fixed Assets Equity a summary indicator of bank modernizationSource Central Bank of Brazil Top 50 Banks in Brazil available at wwwbcbgovbr
Caixa Annual Reports and transition toward Central Bank and international bankaccounting standards introduce breaks in the time series of financial performance after 2001
However international bank reporting standards have been used by the Caixa since 2005 andthe data provide further view of the policies and performance of the bank Table X reportsreturns on stockholder equity assets Basel solvency index immobilization index provisionsas a percent of credit operations bank efficiency index and coverage of personnel costs Thedata are consistent with the broader comparisons reported in chapter two that suggest highprofits and returns alongside higher levels of provisions and reserves against capital riskReturns on stockholder equity have remained above 20 percent per year reaching 306percent in 2008 Returns on liquid assets remained between 09 percent and 13 percentbelow the average levels recorded by private and foreign banks The Basel Index of the Caixaremained well above the 11 percent level required by the Central Bank declining from 279in 2005 to 206 in 2008
Caixa Performance Indicators 2005-2008
Indicator 2005 2006 2007 2008 2009 2010 2011--------------------------------------------------------------------------------------------------------------------------Return on Shareholder Equity 261 260 226 306Return on Liquid Assets 11 11 09 13Basel Solvency Index 279 253 289 206Immobilization Index 201 197 129 120Provisions as Credit Operations 101 98 91 86Efficiency Index 645 642 755 718Coverage of Personnel Costs 925 896 943 868
---------------------------------------------------------------------------------------------------------------------------Source Caixa Econocircmica Federal Relatoacuterios de Administraccedilatildeo 2005-2011
8132019 Government Banking and BRICs in the Recent Financial Crisis
httpslidepdfcomreaderfullgovernment-banking-and-brics-in-the-recent-financial-crisis 2357
983106983122983113983107 983111983151983158983141983154983150983149983141983150983156 983106983137983150983147983155 983137983150983140 983110983145983150983137983150983139983145983137983148 983123983156983137983156983141983139983154983137983142983156
23
The immobilization index of the Caixa also declined from 201 percent in 2005 to120 percent in 2008 suggesting transition toward standard levels of international bankingHowever the value of provisions as a percent of credit operations remains much higher thaninternational bank practices albeit declining from 101 percent in 2005 to 86 percent in2008 Finally both the substantial increase in efficiency index from 645 to 718 percent
suggests that the Caixa has distanced further from international private bank levels that tendto approach 500 percent This has resulted in the declining level of coverage of personnelcosts and indicates the comparatively larger organizational structure and less use ofoutsourced labor at the Caixa
Caixa Deposits and Sources of Funds 2005-2008 R$million
2005 2006 2007 2008 2009 2010 2011----------------------------------------------------------------------------------------------------------------Bank Deposits 692 863 1155 1320Savings Deposits 5328 6006 7560 9255Mid-Term Savings Deposits 3873 4219 4136 4862
Certificates (1270) (1412) (1244) (1831)Escrow (2602) (2806) (2891) (3031)
Funds and Programs 794 1034 1307 1100Other 009 015 019 013Caixa Total 10690 2139 14179 6552Bank System Total 68268 78148 92672 27482Caixa Deposits as Total (156) (155) (1531) (129)----------------------------------------------------------------------------------------------------------------Source Caixa Econocircmica Federal Relatoacuterios de Administraccedilatildeo 2005-2008
The liability side of Caixa balance sheets from 2005-8 suggests that the bank hasdistanced itself from reliance on official savings programs and funding toward consumerbank and savings deposits Bank deposits increased from R$69 billion in 2005 to overR$132 billion in 2008 Savings deposits increased from R$532 billion in 2005 to overR$925 billion in 2008 Furthermore the increase of mid-term savings deposits originatedfrom sale of savings certificates instead of escrow held by the Caixa the latter subject to
judicial review and removed from balance sheets in 2008 The value of funds deposited at theCaixa from government funds and programs increased from R$79 billion in 2005 to R$110billion in 2008 although it remains less than ten percent of total deposits In terms of totalvalue of deposits and savings the Caixa increased total value of deposits from 107 billion toover 165 billion from 2005-8
Caixa Loans 2005-8 R$ million2005 2006 2007 2008 2009 2020 2011
----------------------------------------------------------------------------------------------------------------Commercial 14652 16329 19134 28854
Consumer 8925 9474 11063 13747Business 5727 6854 8071 15107
Home 20208 26113 32475 45075Sewage and Infrastructure 1646 2556 3585 5445Other 690 691 694 689Risk Provision -3773 -4469 -5090 -6900Total Caixa Loans 37195 45689 55888 80062----------------------------------------------------------------------------------------------------------------Source Caixa Econocircmica Federal Relatoacuterios de Administraccedilatildeo 2005-8
8132019 Government Banking and BRICs in the Recent Financial Crisis
httpslidepdfcomreaderfullgovernment-banking-and-brics-in-the-recent-financial-crisis 2457
983106983122983113983107 983111983151983158983141983154983150983149983141983150983156 983106983137983150983147983155 983137983150983140 983110983145983150983137983150983139983145983137983148 983123983156983137983156983141983139983154983137983142983156
24
In terms of lending the data suggests that the primary focus of the Caixa on homeloans continued during the late 2000s although substantial increases in commercial lendingfor consumer credit and businesses suggest the diversification of the Caixa across creditmarkets Since 2005 Caixa lending to consumers and business increased from R$89 billionto R$137 billion and from R$57 billion to R$151 billion respectively in 2008
And unlike the high levels of bad and late credit reported during the adjustment to theend of high inflation in 1994-6 and financial crises (1994-5 1997 1998 1999 2001 2003)the level level of late loans at the Caixa fell substantially during the years of economicgrowth and credit expansion from 2006-2008 The percent of late over total loans at the Caixafell from 68 percent in 2006 to 40 percent in 2008 for commercial loans generally and from62 percent to 59 percent for consumer loans and 75 percent to 22 percent for loans tobusiness The value of late home loans as a percent of total home loans also fell from 31 to17 percent in 2008
Caixa AA-H Credit Classification 2001-8
Days Prov-Late ision 2001 2002 2003 2004 2005 2006 2007 2008 2009 2010 2011
---------------------------------------------------------------------------------------------------------------------------------------AA lt15 0 59 56 66 63 54 50 63 94A lt15 05 243 264 313 288 393 435 401 333---------------------------------------------------------------------------------------------------------------------------------------B 15-30 1 127 126 137 139 143 158 206 271C 31-60 3 203 166 145 169 167 192 194 192D 61-90 10 178 261 207 217 133 60 45 33---------------------------------------------------------------------------------------------------------------------------------------E 91-120 30 18 19 20 20 22 13 09 07F 121-50 50 49 15 15 14 10 07 07 07G 151-80 70 15 08 09 10 08 10 10 09
H gt180 100 104 87 85 77 68 72 61 51R$billion 2094 2353 2614 3016 3855 4736 5739 818---------------------------------------------------------------------------------------------------------------------------------------Source Caixa Annual Reports 2002-2008
The credit risk matrix of Caixa loans from 2001 to 2008 confirms this trend ofimprovement (See above table) The data also provide evidence of greater transparency andthe improvement of bank reporting and accounting standards as well as Central Banksupervision of banks Instead of two categories of credit (good = all loans up to 90 daysoverdue bad = loans over 90 days overdue) the Central Bank of Brazil has adoptedinternational standards of credit classification (from AA to H) and imposed regulations that
banks increase or decrease provisions according to the distribution of loans in thesecategories The scale of provisions required by the Central Bank vary from zero percentagainst loans classified as AA to provision of 100 percent of loan values for credits classifiedas H that is to say over 180 days late
The percent of loans over 180 days late has decreased from 104 percent of total in2001 to 51 percent in 2008 Furthermore all categories of late payment except for loansbetween 15-30 days late decreased significantly from 2001 through 2008 In comparisonloans classified as AA (paid and guaranteed) and A (paid on time) increased from 59 percentto 94 percent and 243 percent to 333 percent of total loans The only category of late loansthat increased over the period is that of loans 15-30 days overdue from 127 percent to 271percent of total
The central argument of this study is that Brazilian federal government banks retaininstitutional foundations of competitive advantage over private and foreign banks Further
8132019 Government Banking and BRICs in the Recent Financial Crisis
httpslidepdfcomreaderfullgovernment-banking-and-brics-in-the-recent-financial-crisis 2557
983106983122983113983107 983111983151983158983141983154983150983149983141983150983156 983106983137983150983147983155 983137983150983140 983110983145983150983137983150983139983145983137983148 983123983156983137983156983141983139983154983137983142983156
25
data that suggests this advantage can be seen in the increasing volume and market share ofthe Caixa in debit and credit cards The number of Caixa debit cards increased from 224million in 2002 to over 482 million in 2008 with Caixa market share of debit cards increasedfrom 196 percent ot total card market in 2002 to peak at 230 percent in 2005 and remainingat 219 percent of the total number of debit cards in Brazil in 2005
Two examples illustrate the institutional foundations of comparative advantage of theCaixa in the card payment industry First like other banks in Brazil the Caixa shares anagreement with Visa for payment processing However unlike other banks in Brazil theCaixa was contracted by the federal government to distribute ATM citizenship cards torecepients of federal government family grants and other transfer programs Apparentlywithout seeking approval the Caixa stamped its brandname on the federal government ATMcitizenship card and has continued to do so despite charges of unfair competition fromprivate domestic banks Furthermore a Caixa request to transform its 110 million ATMcitizenship cards into bank cards currently pending at the Central Bank would dramaticallyincrease the number of bank card holders in Brazil (1824 million at year end 2007)
Caixa Debit and Credit Card Market Shares 2002-2008
Million Debit Cards Million Credit Cards MillionCaixa Total Mkt Caixa Total Mkt Interbank Checks
----------------------------------------------------------------------------------------------------------------2002 224 1142 (196) 16 407 (39) 229502003 280 1254 (223) 18 440 (40) 213602004 320 1491 (213) 20 535 (37) 196702005 377 1639 (230) 25 675 (37) 183902006 384 1744 (220) 31 952 (32) 162202007 400 1824 (219) 39 1177 (33) 144902008 482 42----------------------------------------------------------------------------------------------------------------Source Central Bank of Brazil Diagnoacutestico do Sistema de Pagamentos de Varejo do Brasil Adendo Estatiacutesticondash 2007 p 9 and Caixa annual reports 2003-2008
Having reviewed the Banco do Brasil and Caixa a brief look at the counter-cyclicalpolicies and performance of the third Brazilian federal government bank ndash the BNDES ndash is inorder
Banco Nacional de Desenvolvimento Econocircmico e Social (National Bank for Economic
and Social Development BNDES)
The BNDES is a paradigmatic development bank The trajectory of the BNDES involves asequence of policies and financial practices that have shaped Brazilian development Duringthe 1950s the BNDE supplied direct credits for transportation electric energy infrastructureand steel production During the 1960s the bank diversified under financial reforms Duringthe 1970s the BNDE acted to complete state-led import substitution industrialization bychanneling foreign finance and forced savings into capital goods project lending and regionaldevelopment programs During the 1980s the bank shifted away from public investmentunder pressure of fiscal crisis and foreign debt During the 1990s the BNDES became agentfor the privatization of state owned enterprises The BNDES remained virtually the onlysource of long-term finance during a decade of financial crises in emerging markets (1994-2003) Since 2000 the bank has shifted toward ldquosecond generationrdquo reforms designed tofinance the private sector and free market forces deepen domestic capital and equity markets
8132019 Government Banking and BRICs in the Recent Financial Crisis
httpslidepdfcomreaderfullgovernment-banking-and-brics-in-the-recent-financial-crisis 2657
983106983122983113983107 983111983151983158983141983154983150983149983141983150983156 983106983137983150983147983155 983137983150983140 983110983145983150983137983150983139983145983137983148 983123983156983137983156983141983139983154983137983142983156
26
and lend to small medium and micro-enterprises Since 2004 capital inflows and a boomingdomestic stock market have reinforced the capacity of the BNDES to underwrite long-terminvestments and transform large Brazilian firms into multinational corporations Since 2007BNDES President Coutinho has pursued a full service approach attempting to help star-upsmall and medium firms provide funds to expand successful firms and participate in venture
capital funds to help enterprises transit toward corporate governance standards and initial orsecondary offerings of stock on the Bovespa exchange In 2008 as financial crisis led to ashortage of credit collapse of share prices and sharp decline in industrial production byfourth quarter 2008 the BNDES also provided lending of last resort to major Braziliancorporations while retaining long term goals for massive investments in deep sea petroleumproduction
BNDES Market Share of Interbank and Non-Bank Loans 1995-2008 US$ Billion
Interbank Loans Non-Bank Loans------------------------------------------ ------------------------------------------
BNDES Mkt Total BNDES Mkt Total-----------------------------------------------------------------------------------------------------------1995 156 (324) 481 80 (38) 20711996 181 (354) 511 109 (49) 21981997 197 (278) 707 145 (68) 21031998 216 (355) 608 230 (113) 20201999 204 (410) 497 150 (35) 14282000 243 (439) 553 152 (96) 15772001 259 (504) 515 145 (104) 13912002 233 (443) 525 137 (130) 10512003 261 (419) 622 200 (141) 14152004 306 (408) 749 218 (122) 17862005 343 (373) 918 277 (113) 24312006 388 (350) 1106 329 (102) 32312007 524 (335) 1563 432 (88) 48852008 530 (493) 1073 456 (96) 4743200920102011-----------------------------------------------------------------------------------------------------------Source Central Bank of Brazil Top 50 Banks 1995-2008
Revew of BNDES lending since 1995 suggests the realization of competitiveadvantages typical of a large centralized development bank Contrary to the extensive branchoffice networks retained by the Banco do Brasil and Caixa the BNDES retains under 1900employees (compared to 105000 at Caixa) in the Rio de Janeiro and four regional officesSince 1995 the BNDES increased its market share of non-bank loans from R$80 billion (38percent) to R$200 billion (141 percent) during the economic downturn risk aversion andcredit shortage in 2003 After 2003 the BNDES market share of loans to non-financialentities decreased to 88 percent of total loans albeit increasing during 2008 to 96 percentThis suggests that the BNDES has increased its market share of lending to non-financialsector since liberalization of the industry and privatization of state government banks
8132019 Government Banking and BRICs in the Recent Financial Crisis
httpslidepdfcomreaderfullgovernment-banking-and-brics-in-the-recent-financial-crisis 2757
983106983122983113983107 983111983151983158983141983154983150983149983141983150983156 983106983137983150983147983155 983137983150983140 983110983145983150983137983150983139983145983137983148 983123983156983137983156983141983139983154983137983142983156
27
BNDES inter-bank lending also increases substantially Since the Real Plan endedinertial inflation in 1994 the BNDES has expanded its market share of interbank lendingfrom 156 billion (324 percent) in 1995 to 530 billion (493 percent) in 2008 during creditshortage and stock market collapse During previous years of financial crisis and economicreversals the BNDES also increased interbank lending significantly For example during the
1999 and 2001 crises BNDES interbank lending increased to 410 percent and 504 percentof total This marked presence in interbank loan market reflects the role of the BNDES inproviding indirect lending to targeted sectors through private foreign and other governmentbanks in Brazil
BNDES Loan Approvals by Program 1995-2007 R$ Billion
Direct Lending 1999 2000 2001 2002 2003 2004 2005 2006 2007 2008 2009--------------------------------------------------------------------------------------------------------------------------------------Finem 51 55 68 133 79 114 132 145 220 285Capital Markets 16 19 09 08 09 06 20 34 35 104Export-Import 23 34 39 77 63 56 67 40 13 32
Sub-Total 91 109 118 219 153 177 220 221 269 424Percent Total (505) (474) (468) (585) (456) (447) (469) (430) (415) (464)
Indirect Lending--------------------------------------------------------------------------------------------------------------------------------------Finem 31 40 37 16 12 16 18 27 51 60Finame 16 25 33 40 53 66 93 107 170 221Finame Agro 07 13 18 30 28 45 21 14 20 27Finame Leasing 00 000 02 02 03 02 04 06 14 16Export-Import 14 23 20 40 56 54 73 97 67 95BNDESautom 18 17 22 24 27 34 36 35 50 55Sub-Total 89 120 134 154 182 220 249 292 379 484Percent Total (495) (526) (532) (415) (544) (553) (531) (570) (585)(536)
BNDES Total 180 230 252 374 335 398 469 513 648 908----------------------------------------------------------------------------------------------------------------Source BNDES statistics by modality available on wwwbndesgovbr
Review of BNDES finance by program suggests the evolution of credit policies from1995 through 2008 and increasing reliance on indirect lending through other financialintermediaries The three major programs of direct finance Financiamento aEmpreendimentos (Business Finance Finem) Mercado de Capitais (Capital Markets) andExport-Import finance remained between 505 percent and 415 percent of total BNDESlending with the exception of 2002 Indirect lending through six broad programs remained
between 495 percent and 585 pecent of total BNDES lending with the exception of 2002Indirect lending programs include Finem business lending Financiamento de Maquinas(Machine Finance Fineme) with agricultural and leasing modalities Export-Import financingand BNDES automatic lending provisions
These trends suggest the realization of competitive advantages over private andforeign banks in Brazil BNDES long term interest rates remained substantially lower thanSelic benchmark overnight inter-bank interest rates throughout this period while the lowercost of small staff and operations of the BNDES made lending at these rates viable Anothercompetitive advantage of the BNDES over private and foreign banks is the developmentbankacutes mandate as manager of funds from the forced savings fund Fundo de Amparo ao
Trabalhador (Worker Asssistance Fund FAT) Constitutionally mandated investments inproductive activities (not government bonds) increased from R$31 billion in 2000 to R$101
8132019 Government Banking and BRICs in the Recent Financial Crisis
httpslidepdfcomreaderfullgovernment-banking-and-brics-in-the-recent-financial-crisis 2857
983106983122983113983107 983111983151983158983141983154983150983149983141983150983156 983106983137983150983147983155 983137983150983140 983110983145983150983137983150983139983145983137983148 983123983156983137983156983141983139983154983137983142983156
28
billion in 2008 comprising 170 percent of BNDES liabilities This means that 170 percentof BNDES finance and lending is based on long-term deposits that provide no liquidity riskThis provides a competitive advantage over private and foreign banks
A closer look at BNDES lending by sector suggests that the bank still focuses
primarily on industry and infrastructure Despite the adoption of second generation reformsthat seek to free market forces and accelerate innovation and productivity through small andmedium enterprises BNDES lending still focuses on large scale industrial and long-terminfrastructure finance In this respect the BNDES embodies a persistent need in developingeconomy for state-led development banking along the lines emphasized by Lewis Myrdaland development economists 50 years ago This traditional sense of commanding heights thusstill captures the role of the BNDES in Brazilian political economy Despite more than twodecades of privatizations financial liberalization bank reforms and a variety of fiscalfinancial and economic reforms that have substantially modernized the domestic Brazilianeconomy and freed market forces the BNDES remains the single most important source forlong-term finance and credit The capitalization of the Bovespa stock market from 2004-
2008 for the first time in Brazilian history reduced the virtual monopoly of BNDES overlong term finance
BNDES Operations approved and invested by Sector 1998-2007 R$billion
1998 1999 2000 2001 2002 2003 2004 2005 2006 2007Industry ----------------------------------------------------------------------------------------------------------------------------approved 96 79 126 152 171 163 145 290 395 402invested 76 84 104 132 174 161 158 234 272 306
Infrastructure ----------------------------------------------------------------------------------------------------------------------approved 116 69 110 65 161 149 137 186 240 369invested 83 66 86 75 130 100 152 171 170 209
Other--------------------------------------------------------------------------------------------------------------------------------approved 18 47 40 54 79 93 117 69 108 126investedTotal --------------------------------------------------------------------------------------------------------------------------------approved 230 195 276 271 411 404 379 545 743 897invested 190 181 230 252 374 335 398 470 513 617
----------------------------------------------------------------------------------------------------------------Source BNDES Annual Reports 2003-2008 and testimony of BNDES President to Congress March 2009
Long-term investments have produced substantial profits at the BNDES The bank hasrecorded profits each year since 1999 increasing from over R$600 million in 1999 overR$32 billion during 2005 reaching over R$73 billion in 2007 The long-term character of
BNDES finance stands in stark contrast to policies at private banks Contrary to strategy ofprivate and foreign banks to trade and hold government paper described in chapter three theBNDES suspended purchase and trading in government paper because of constitutionalmandates to contribute to development and employment Furthermore the turn to capitalmarkets at the BNDES has provided substantial returns since 2004
However this does not mean that BNDES lending protected unproductive industriesInstead of wasting resources to unnecessarily bail out firms or provide crony credit highreturns and strong profits at the BNDES suggest that lending was sound Standard indicatorsof bank performance asset quality and capital reserves against credit and capital risk provideempirical control for this All these measures suggest that the BNDES weathered the periodof adjustment and sustained counter-cyclical investment policies without placing resources atrisk beyond Central Bank of Brazil regulations and BIS guidelines And returns have
8132019 Government Banking and BRICs in the Recent Financial Crisis
httpslidepdfcomreaderfullgovernment-banking-and-brics-in-the-recent-financial-crisis 2957
983106983122983113983107 983111983151983158983141983154983150983149983141983150983156 983106983137983150983147983155 983137983150983140 983110983145983150983137983150983139983145983137983148 983123983156983137983156983141983139983154983137983142983156
29
increased since recovery in 2004 BNDES participation in the booming Bovespa stock marketsince 2003 has provided record returns
The BNDESpar subsidiary that invests in capital markets has also recorded strongreturns during the period of economic growth and into the 2008 financial crisis BNDESparreturns on liquid assets increased from 75 percent in 2004 to 277 percent in 2007 declining
to 245 percent in 2008 Average returns on assets and stock holdings also remained highbuilding the assets held by the BNDESpar subsidiary from 141 billion in 2005 to 359 billionin 2008
This increased participation of the BNDES in capital markets involves new relationsand networks across government private sector labor unions the private pension funds ofgovernment bank and government enterprise employees and financial markets By 2007BNDES participation in stockholding and mutual funds reached across 261 forms and 25mutual funds totaling over R$910 billion reals The BNDES thereby retains broad portfoliothat represents institutional foundations of comparative advantage Furthermore unlike thepolicy of private and foreign banks to trade and hold high interest rate paying short termgovernment paper during the sudden stop of foreign finance and downturn in the Brazilian
business cycle (2002-3) the BNDES expanded credit operations and reduced financialoperations in secondary markets for indexed government paper This countered the perverseimpact of the liquidity preference among private and other government banks that increasedmarket pressures and led to shorter terms and higher cost of Brazilian government debt
BNDES aversion of government paper is required by constitutional mandate tomanage forced savings funds in ways that generate employment and income As noted alarge part of BNDES resources (liabilities) are from domestic official savings programs Thevalue of FAT resources increased from R$492 billion in 2003 to R$662 billion in 2005while the PIS-Pasep fund remained at approximately R$200 billion Foreign capital has alsobeen channeled to the BNDES through multilateral agencies and foreign bond issues Foreignloans to the BNDES have declined Multilateral agencies provided R$70 billion in 2003increased funding to R$129 billion during 2004 and continued to provide R$107 billion tothe BNDES during 2005
Comparison of BNDES structure and performance with development banks abroadsuggests both the large scale and scope of BNDES operations and controls formismanagement and political abuse of the bank In 2007 BNDES total assets are almostdouble the value reported by the Inter-American Development Bank (IADB) over frac12 thevalue of total assets held by the World Bank and almost ten times the value of assets held bythe French government development bank CAF Furthermore profits and loans from theBNDES far exceeded all three institutions The US$330 billion in loans reported by theBNDES far exceed the US$67 billion from the IADB the US$110 reported by the World
Bank and US$58 billion reported by the CAF BNDES profis returns on assets and return onliquid patrimony also far exceeded those reported by these three development banks thatserve as comparative control over performance and policies at the BNDES Finally lateloans at the BNDES remained at 011 percent of total loans well below levels reported by theWorld Bank comparable to the 010 percent reported by the IADB while considerably abovethe 001 percent reported by CAF
8132019 Government Banking and BRICs in the Recent Financial Crisis
httpslidepdfcomreaderfullgovernment-banking-and-brics-in-the-recent-financial-crisis 3057
983106983122983113983107 983111983151983158983141983154983150983149983141983150983156 983106983137983150983147983155 983137983150983140 983110983145983150983137983150983139983145983137983148 983123983156983137983156983141983139983154983137983142983156
30
Comparison of BNDES and Regional Development Banks 2007 US$ billion
BNDES IADB World Bank CAF----------------------------------------------------------------------------------------------------------------Total Assets 1144 699 2080 125
Liquid Patrimony 140 203 399 41Liquid Profits 38 01 -01 04Desembolsos 339 67 110 58Credit Portfolio 928 479 978 95Capitalization percent 123 291 192 328Return on Assets percent 38 47 na 36Return on PL percent 332 07 na 105Late Loans percent 011 010 086 001----------------------------------------------------------------------------------------------------------------Source BNDES Annual Report 2007
The large scale of BNDES lending and finance make it possible for governmentpolicy to provide counter cyclical credit to avert or ameliorate economic downturns andsubstitute private and foreign credit shortages In March 2009 testimony to Congress ongovernment policies during financial crisis BNDES President Coutinho argued that bankpolicy was to reduce the cost and increase the supply of credit Resources for counter cyclicallending during 2008-2009 came from Treasury loans to BNDES released by provisionaldecrees 439 and 414 summing R$175 billion transfer of R$60 billion in CVS funds sale ofFGTS Investment Fund and bank certificates summing R$170 billion Furthermore the thirdphase of conditional credit facility shared by Inter-American Development Bank and theBNDES provided the last tranch of a total US$60 billion for BNDES operations
Two further means were used by the BNDES to infuse capital during the collapse of
the stock market and shortage of credit during 2007-8 The counter cyclical policies of theBNDES can also be seen in the over two fold increase of BNDES holdings in private equityand investment funds Table 512 reports the value of private equity and investment fundholdings of the BNDES in 2007 and 2008 BNDES funds in private equity and mutual fundsincreased from R$4038 million in 2007 to over R$10 billion in 2008 The capitalization ofmutual funds and private equity firms by the BNDES also played an important countercyclical role during this period
BNDESpar Shareholding 2007-8 R$million
Percent Value ValueShares 2008 2007
----------------------------------------------------------------------------------------------------------------Ameacuterica Latina Logiacutestica 106 6386 -Aracruz 55 1292 1292Banco do Brasil 25 10854 12752Bom Gosto (2) 345 2458 -Brasil Telecom Part 30 1666 1958Braskem 52 2275 2432Brenco 209 1400 -CEG 345 1406 -CESP 57 2347 1397Coteminas 103 1150 1340
CPFL Energia 62 6081 5506Cia Sideruacutergica Nacional 36 1513 2686CVRD 40 15082 7098
8132019 Government Banking and BRICs in the Recent Financial Crisis
httpslidepdfcomreaderfullgovernment-banking-and-brics-in-the-recent-financial-crisis 3157
983106983122983113983107 983111983151983158983141983154983150983149983141983150983156 983106983137983150983147983155 983137983150983140 983110983145983150983137983150983139983145983137983148 983123983156983137983156983141983139983154983137983142983156
31
ELETROBRAacuteS (1) 118 22400 22400EMBRAER 50 1096 1096Gerdau 35 1533 490Independecircncia 139 2500 -JBS 130 14722 11370Klabin 202 5621 -
Light 336 8225 -Marfrig 146 8176 1020MPX Mineraccedilatildeo 26 1791 1791Ouro Fino 200 1057 840Paranapanema 175 1252 08Petrobraacutes 76 10226 10226Rede Energia SA 253 2633 -Tele Norte Leste Participaccedilotildees 16 1645 1645Valepar 97 26254 15585Subtotal 163055 102941Other firms 12223 12606Total 175278 115548----------------------------------------------------------------------------------------------------------------
Source BNDESpar Financial Statements 2008 pp
The BNDES also holds blocks of shares in many major Brazilian corporationsthrough its participation subsidiary BNDESpar Comparing value of investments in 2007 and2008 suggests that large purchases capitalized firms precisely as financial crisis and downturnin Bovespa stock market made it difficult for firms to find working capital Table X reportsthe percent of total company shares held by the BNDES and their respective market values(adjusted for risk of future losses) at year end 2007 and 2008 During this year of extremelyshort and expensive credit in Brazil caused by the international financial and banking crisisthe BNDES increased shareholding by over R$60 billion reals in 28 private Brazilianenterprises Further shareholding classified as X in Five firms (Bertin 269 Brasiliana 538
Copel 239 Rio Poliacutemeros 250 Telemar 313) Once again the BNDES provided access tocapital for firms caught in the sudden credit crunch and stock market collapse unable to meetobligations or raise funds through equity issues or commercial bank credit This countercyclical role of government banks has been critical in Brazil since the 19 th century
BNDESpar Private Equity and Fund Participation 2007-2008 R$million
Fund Manager 2008 2007-------------------------------------------------------------------------------------------------------------------------Brasil 21 Dynamo 46 60PROT Mellon Financial Services 4628 -
Logiacutestica Brasil Bradesco 135 -Fire BrasilPrivate 269 250FIPGG Governanccedila amp Gestatildeo Inv 289 311Opportunity Equity Partners Mellon Financial Services 1046 578Brasil Energia Bradesco 1184 655InfraBrasil ABN-Amro 677 251Rio Bravo Cinema Rio Bravo 116 110Brascan Petro amp Gaacutes Bank Brascan 136 113AG Angra Infra-Estrutura Bradesco 380 301Satildeo Paulo Metro Fund Bradesco 791 831Other Funds 653 572Total 10356 4038---------------------------------------------------------------------------------------------------------------------------
Source BNDESpar Financial Statements 2008
8132019 Government Banking and BRICs in the Recent Financial Crisis
httpslidepdfcomreaderfullgovernment-banking-and-brics-in-the-recent-financial-crisis 3257
983106983122983113983107 983111983151983158983141983154983150983149983141983150983156 983106983137983150983147983155 983137983150983140 983110983145983150983137983150983139983145983137983148 983123983156983137983156983141983139983154983137983142983156
32
Finally Brazilian federal government triennial plans include investment targets by theBNDES If current plans are compared to 2004-7 investments several structural changes inBNDES lending appear First BNDES plans for Oil and Petroleum production reveal aprofound change for Brazilian political economy In 1990 roughly 45 percent of oilconsumed in Brazil was imported In 2007 before oil price increased reversed the balance
Brazil reported domestic production levels sufficient to meet domestic consumptionFurthermore discoveries of substantial deep sea oil reserves have led the BNDES to planmassive investments involving Petrobras and other global petroleum firms For the 2009-2012 period investments in petroleum and gas (R$2697 billion) Petrochemicals (237) andEthanol (197) sum to over R$3130 billion
BNDES Triennial Investment Plans 2004-2012
2004-7 2007-10 2008-11 2009-12----------------------------------------------------------------------------------------------------------------Petroleum amp Gas 1472 1836 2028 2697
Mining 472 527 813 480Petrochemicals 64 174 264 237Steel 198 371 312 245Automotive 150 176 264 235Electronics 143 156 140 240Ethanol 166 205 205 197Paper amp Celulose 104 200 274 90Health 51 46 51 80Industry Total 2816 3802 4437 4501----------------------------------------------------------------------------------------------------------------Source BNDES Annual Reports 2002-2006
It is of note that President Dilma Roussef was instrumental in reducing the targets for2009-12 in petroleum and gas given indications that Petrobras and existing framework foroffshore oil prospecting and production proved unable to increase investments accordingly
The BNDES also retains a presence in government projects by providing managementassistance During 2008 BNDES staff provided management support for implementation of192 projects involving R$710 billion of total R$142 billion PT government growthacceleration projects BNDES staff also participated in the design management andimplementation of President Lularsquos Poliacutetica de Desenvolvimento Produtivo (Policy forProduction Development) involving R$2100 billion targeting production chains designed tomaximize employment and regional development benefits Finally the BNDES was alsocharged to create and co-manage a Fundo Amazonia with the Ministry of Environment toprovide incentives to reduce deforestation of the Amazon region BNDES Plans for 2009include completion of concession for construction of high speed train line and service for Riode Janeiro-Satildeo Paulo corridor two blocks of highway concession sales involving three majorhighways in each block of sales sale of management concessions for regional airports andthe reorganization of INFRAERO federal government airport management company
These policies reflect the goal of BNDES policy to launch firms on the stock marketrather than maintain direct credit and finance Exceptions during 2008 involve Auto andEthanol industies both for strategic and broader policy reasons Given the sharp downturn inauto sales during fourth quarter 2008 the BNDES provided significant lending to avert
further downsizing or failure of auto companies in Brazil Given the current globalredistribution of automobile production BNDES policies are designed to help the Brazilian
8132019 Government Banking and BRICs in the Recent Financial Crisis
httpslidepdfcomreaderfullgovernment-banking-and-brics-in-the-recent-financial-crisis 3357
983106983122983113983107 983111983151983158983141983154983150983149983141983150983156 983106983137983150983147983155 983137983150983140 983110983145983150983137983150983139983145983137983148 983123983156983137983156983141983139983154983137983142983156
33
operations of major auto firms through the period of adjustment and increase theattractiveness of domestic operations in global production strategies of multinational autocompanies Ethanol production also received massive funds to sustain an industry seen ascritical for alternative and sustainable fuel source capable of replacing petroleum Ethanolreached over 50 percent of automotive fuel sales in 2007
Under the Lula government (2003-10 the BNDES also resumed lending to state andmunicipal governments Since the renegotiation of municipal and state government debts inthe late 1990s states and municipalities have been largely prohibited from taking on debtThis was emplematic of the recentralization required to control fiscal excesses during militaryrule and the prolonged period of transition to democracy Policies during the 1990s weredesigned to avert overspending seen as critical to maintain price stability under the Real Plan(1994) In 2000 the Lei de Responsibilidade Fiscal (Fiscal Responsibility Law) largelyprohibited credit and finance to state and municipal governments Since 2000 municipalitiesand states have been required to submit detailed budget statements that in turn have been thebasis for a gradual return to sub-national government finance In August 2006 central bankand Treasury regulations freed municipalities to take on credit up to 12 times liquid receipts
Since then the BNDES has led in terms of credits and finance to subnational governmentsthrough a Programa Especial de Financiamento aos Estados e Distrito Federal
The BNDES also has developed the first system in Brazil for risk analysis ofmunicipal governments and has led in the market for municipal credit freed by August 2006procedures for approval at Treasury the Central Bank and Conselho Monetaacuterio Nacional(National Monetary Council) Prosecution of mayors and firms charged with managingmunicipal credits with the BNDES revealed fraudulent practices These funds for sub-national public finance also became critical mechanisms to counter severe budget shortfallscaused by financial crisis during 2008 Given that municipal and state government tax basesare shallow and that federal government transfers provide the bulk of sub-nationalgovernment resources the Lula administration allocated R$ 40 billion to the Fundo deParticipaccedilatildeo dos Estados (State Participation Fund) through a Programa Emergencial deFinanciamento (Emergency Finance Fund) administered by the BNDES
In sum the BNDES expanded credit and finance operations substantially during fouryears of sustained growth from 2004-2007 And having helped underwrite the stock marketboom and capitalized Brazilian firms directly and indirectly through credit finance mutualfunds and private equity funds the BNDES retained sufficient scale scope and capital baseto provide counter cyclical credit and finance to help firms adjust to financial crisis and creditshortage during 2008 In retrospect the growth of the BNDES since liberalization andprivatizations of state government banks in the 1990s suggest the comparative advantages of
development banking BNDES credit and finance fell to 52 percent of fixed capitalformation in 1995 Since then the turn to neo-developmentalism and a period of sustainedeconomic growth during the Lula administration increased the BNDES share of total fixedcapital formation during 2006 and 2007 to 126 and 141 percent Critics charge thatmonopoly over FGTS and PIS-PASEP official savings funds as liabilities provide theBNDES with unfair competitive advantage over private banks In 2008 forced savings fundssummed to only 17 percent of BNDES liabilities (resources) The BNDES does not relyexclusively on forced savings for competitive advantage Instead market-oriented policies
joint-ventures with private mutual funds investment funds private equity firms large blocksof shareholding in Brazilian firms and massive amounts of credit and investment to theprivate sector at below market but still profitable long term interest rates of 625 percent
suggest that the large scale and scope of BNDES operations provide institutional foundationsof competitive advantage over private and foreign banks
8132019 Government Banking and BRICs in the Recent Financial Crisis
httpslidepdfcomreaderfullgovernment-banking-and-brics-in-the-recent-financial-crisis 3457
983106983122983113983107 983111983151983158983141983154983150983149983141983150983156 983106983137983150983147983155 983137983150983140 983110983145983150983137983150983139983145983137983148 983123983156983137983156983141983139983154983137983142983156
34
Capitalization of the BNDES by Treasury of over R$2300 billion 2009-11hascaptured attention of many observers of Brazilian development Critics and advocates agreethat the BNDES has realized significant competitive advantages over private and foreignbanks and continues to serve as significant alternative to capital markets for large scaledevelopment projects However like the downturn in planned investments by Petrobras for
oil and gas exploration and production BNDES decreased planned investments fromR$1684 billion in 2010 to R$1397 billion in 2011 We believe this indicates the limits ofmanagement and passing of period of crisis both favoring finance from capital marketsbanks and public-private partnerships
India
Analysis of Brazilian federal banks suggests that these institutions provided policy alternativewhile realizing competitive advantage over private and foreign banks The modernization ofthese institutions helps explain why these large institutions were able to stay the effects ofcredit crunch and financial market downturn in Brazil This section explores data from the
Reserve Bank of India to compare market shares of types of banks from 1972-2008 and bankperformance from 2006-10 Further analysis will be required However the data appears tosupport our core argument that government banks have modernized and realized competitiveadvantages over private and foreign banks
First the number of branch offices which serves as a measure of institutionalcoverage across India of special concern for financial inclusion and the theory thatliberalization and privatizations would lead private banks to expand branch offices andincrease the supply of services From this perspective the trajectory of branch officessuggests that nationalized banks the State Bank of India and regional rural bankssustain much larger networks of branch offices that predominate while otherscheduled commercial (private and foreign) banks retain less than 8000 branch offices
Data from the Reserve Bank of India on the number of current accounts retainedby type of bank provide further evidence that the State Bank of India and its associates
8132019 Government Banking and BRICs in the Recent Financial Crisis
httpslidepdfcomreaderfullgovernment-banking-and-brics-in-the-recent-financial-crisis 3557
983106983122983113983107 983111983151983158983141983154983150983149983141983150983156 983106983137983150983147983155 983137983150983140 983110983145983150983137983150983139983145983137983148 983123983156983137983156983141983139983154983137983142983156
35
national banks and regional rural banks provide the bulk of banking accounts to theIndian population while private and foreign banks cherry pick upscale urban marketsreproducing capital drain and inequalities
Number of Current Accounts by Type of Bank 1972-1995
Since 1999 the pattern of predominance by alternative banking institutions and the minorrole of other scheduled commercial banks and foreign banks continues
The following figures report the value held in current accounts by type of banks first fromthe 1972-1995 period then from the 1999-2008 period For both time periods the trendconfirms that private and foreign banks remain at a competitive disadvantage in terms of thebroader market while the State Bank of India and its associates nationalized banks andregional rural banks tend to predominate
8132019 Government Banking and BRICs in the Recent Financial Crisis
httpslidepdfcomreaderfullgovernment-banking-and-brics-in-the-recent-financial-crisis 3657
983106983122983113983107 983111983151983158983141983154983150983149983141983150983156 983106983137983150983147983155 983137983150983140 983110983145983150983137983150983139983145983137983148 983123983156983137983156983141983139983154983137983142983156
36
Current Account Value by Type of Bank 1972-1995 R
Number of Deposit Accounts by type of bank 1999-2008
A similar pattern appears for the trajectory of savings accounts both the number of
accounts and the value held in savings accounts both for the 1972-1995 period We wereunable to organize data from the more recent period
8132019 Government Banking and BRICs in the Recent Financial Crisis
httpslidepdfcomreaderfullgovernment-banking-and-brics-in-the-recent-financial-crisis 3757
983106983122983113983107 983111983151983158983141983154983150983149983141983150983156 983106983137983150983147983155 983137983150983140 983110983145983150983137983150983139983145983137983148 983123983156983137983156983141983139983154983137983142983156
37
Number of Savings Accounts by Type of Bank 1972-1995
Value in Savings Accounts by Type of Bank 1972-1995
Number of Term Savings Accounts by Type of Bank 1972-1995
8132019 Government Banking and BRICs in the Recent Financial Crisis
httpslidepdfcomreaderfullgovernment-banking-and-brics-in-the-recent-financial-crisis 3857
983106983122983113983107 983111983151983158983141983154983150983149983141983150983156 983106983137983150983147983155 983137983150983140 983110983145983150983137983150983139983145983137983148 983123983156983137983156983141983139983154983137983142983156
38
Value in Term Savings Accounts by Type of Bank 1972-1995
The number and value of credits extended by banks from 1999-2008 appears mostpromising in terms of comparative analysis of bank performance and behavior Thesignificant spread at the end of the time series between the State Bank of India and itsassociates and foreign banks suggests the impact of foreign financial crisis and differentdomestic policies by these types of banks in India similar to that noted in the Brazilianexperience
Number of credits by type of bank 1999-2008
Value of credit by type of bank 1996-2008
8132019 Government Banking and BRICs in the Recent Financial Crisis
httpslidepdfcomreaderfullgovernment-banking-and-brics-in-the-recent-financial-crisis 3957
983106983122983113983107 983111983151983158983141983154983150983149983141983150983156 983106983137983150983147983155 983137983150983140 983110983145983150983137983150983139983145983137983148 983123983156983137983156983141983139983154983137983142983156
39
Further data from the Reserve Bank of India from 2008-10 permit closercomparison of government private and foreign banks in the recent financial crisis Interms of deposits investments total assets and net profits the dominant and expandingrole of government banking in India is apparent Further control variables (not reported)
include gross and net NPA types of income expenses and expenditures provisions andcontingencies and credit- and investment-deposit ratios provide control for bad bankingand confirm the counter cyclical policies during 2008-10 in India
THE FOLLOWING TABLES REQUIRE INTERPRETATION
Number of Banks 2006-7 2007-8 2008-9 2009-10 2010-11
State Bank of India amp Associates 8 8 7 7 6Nationalized Banks 20 20 20 20 20Old Private Sector Banks 17 15 15 15 14
New Private Sector Banks 8 8 7 7 7Foreign Banks 29 28 31 32 33Source RBI A Profile of Banks 2010-11
Number of Branch Offices 2006-7 2007-8 2008-9 2009-10 2010-11
State Bank of India amp Associates 14673 15848 16894 18178 18772Nationalized Banks 37435 39255 40956 43452 45640Old Private Sector Banks 4723 4690 4908 5220 5011New Private Sector Banks 2599 3635 4333 5232 6957
Foreign Banks 272 277 295 308 316Source RBI A Profile of Banks 2010-11
Number of Employees 2006-7 2007-8 2008-9 2009-10 2010-11
State Bank of India amp Associates 255699 249008 268598 266605 282453Nationalized Banks 473179 466400 462926 473041 475082Old Private Sector Banks 47994 48700 51341 55052 55075New Private Sector Banks 91060 110123 124998 127468 163604Foreign Banks 28426 31301 29582 28012 27968
Source RBI - India BanksAssociation
Business per employee (in lakh) 2006-7 2007-8 2008-9 2009-10 2010-11
State Bank of India amp Associates 43635 54922 65022 73743 79306Nationalized Banks 49001 61828 78316 93586 114477Old Private Sector Banks 48159 56932 63843 69749 8149New Private Sector Banks 80782 83196 78715 84041 82607Foreign Banks 97477 11255 128274 141139 155974Note Business = Deposits + Advances
8132019 Government Banking and BRICs in the Recent Financial Crisis
httpslidepdfcomreaderfullgovernment-banking-and-brics-in-the-recent-financial-crisis 4057
983106983122983113983107 983111983151983158983141983154983150983149983141983150983156 983106983137983150983147983155 983137983150983140 983110983145983150983137983150983139983145983137983148 983123983156983137983156983141983139983154983137983142983156
40
Profit per employee (in lakh) 2006-7 2007-8 2008-9 2009-10 2010-11
State Bank of India amp Associates 257 362 443 466 42Nationalized Banks 287 377 486 567 695Old Private Sector Banks 234 406 469 42 563New Private Sector Banks 587 685 677 847 893Foreign Banks 1613 2112 2539 1692 2759
Capital amp Reserves amp Surplus(Ycrore) 2006-7 2007-8 2008-9 2009-10 2010-11
State Bank of India amp Associates 42941 61706 72422 83726 84394Nationalized Banks 92689 113079 135920 157276 205857Old Private Sector Banks 10736 15315 17477 20171 23821New Private Sector Banks 39736 76056 82192 99813 114768Foreign Banks 33075 49332 59937 69176 80972
Deposits Ycrore 2006-7 2007-8 2008-9 2009-10 2010-11
State Bank of India amp Associates 633476 773875 1007041 1108086 1245862Nationalized Banks 1360724 1679993 2105706 2583934 3127122Old Private Sector Banks 138249 165589 199274 229897 264157New Private Sector Banks 413738 509444 537104 592904 738602Foreign Banks 150750 191161 214076 232099 240689
Investments Ycrore 2006-7 2007-8 2008-9 2009-10 2010-11
State Bank of India amp Associates 211875 263823 357624 387473 385697Nationalized Banks 452981 536018 655042 828125 942837Old Private Sector Banks 43647 54080 72393 83499 92617New Private Sector Banks 171008 224498 234139 270618 329403Foreign Banks 71471 98910 130354 159291 165499
Advances Ycrore 2006-7 2007-8 2008-9 2009-10 2010-11
State Bank of India amp Associates 482270 593722 739450 857937 994154Nationalized Banks 957877 1203678 1519762 1843082 2311478
Old Private Sector Banks 92887 111670 128504 154085 184647New Private Sector Banks 321865 406733 446824 478356 612886Foreign Banks 126339 161133 165385 163260 195539
Interest Income Ycrore 2006-7 2007-8 2008-9 2009-10 2010-11
State Bank of India amp Associates 53465 70428 89196 97954 109828Nationalized Banks 110720 142647 183892 208029 256490Old Private Sector Banks 11474 14614 18790 20497 23299New Private Sector Banks 38092 56377 66282 62309 73528
Foreign Banks 17924 24417 30322 26390 28520
8132019 Government Banking and BRICs in the Recent Financial Crisis
httpslidepdfcomreaderfullgovernment-banking-and-brics-in-the-recent-financial-crisis 4157
983106983122983113983107 983111983151983158983141983154983150983149983141983150983156 983106983137983150983147983155 983137983150983140 983110983145983150983137983150983139983145983137983148 983123983156983137983156983141983139983154983137983142983156
41
Other Income Ycrore 2006-7 2007-8 2008-9 2009-10 2010-11
State Bank of India amp Associates 9420 11818 16073 18394 19240Nationalized Banks 14264 20979 26394 30500 28625Old Private Sector Banks 1568 2184 2782 3152 3029
New Private Sector Banks 10745 14822 15078 17271 17697Foreign Banks 7044 10588 14894 9951 10972
Interest Expended Ycrore 2006-7 2007-8 2008-9 2009-10 2010-11
State Bank of India amp Associates 32607 47809 61770 66229 67018Nationalized Banks 69353 101093 131676 145712 164135Old Private Sector Banks 7055 9960 12834 14076 14768New Private Sector Banks 25802 38535 44123 37130 42347Foreign Banks 7603 10604 12819 8938 10622
Operating Expenses Ycrore 2006-7 2007-8 2008-9 2009-10 2010-11
State Bank of India amp Associates 15987 16993 20088 25283 29146Nationalized Banks 27268 29670 35416 40792 53819Old Private Sector Banks 2967 3235 3939 4715 5600New Private Sector Banks 12353 17032 17840 18136 22006Foreign Banks 7745 10353 12298 11102 12557
Cost of Funds 2006-7 2007-8 2008-9 2009-10 2010-11
State Bank of India amp Associates 475 59 594 532 48Nationalized Banks 48 582 609 537 493Old Private Sector Banks 498 62 667 613 55New Private Sector Banks 524 611 604 442 427Foreign Banks 403 433 446 283 311Cost of Funds = Ratio () of interest paid on deposits and borrowings to averageof opening and closing balances of deposits and borrowings
Return on advances adjusted toCoF 2006-7 2007-8 2008-9 2009-10 2010-11
State Bank of India amp Associates 372 365 395 36 405Nationalized Banks 399 369 409 382 427Old Private Sector Banks 406 426 515 482 492New Private Sector Banks 447 505 526 514 516Foreign Banks 574 66 815 716 564
2006-7 2007-8 2008-9 2009-10 2010-11
8132019 Government Banking and BRICs in the Recent Financial Crisis
httpslidepdfcomreaderfullgovernment-banking-and-brics-in-the-recent-financial-crisis 4257
983106983122983113983107 983111983151983158983141983154983150983149983141983150983156 983106983137983150983147983155 983137983150983140 983110983145983150983137983150983139983145983137983148 983123983156983137983156983141983139983154983137983142983156
42
Wages as of Total Expenses
State Bank of India amp Associates 2155 1589 1506 171 1921Nationalized Banks 1794 1405 1331 1365 1641Old Private Sector Banks 1689 1367 1326 1457 1675
New Private Sector Banks 936 956 1017 121 1383Foreign Banks 2008 1995 1944 2348 2331
Returns on Assets 2006-7 2007-8 2008-9 2009-10 2010-11
State Bank of India amp Associates 086 097 102 091 079Nationalized Banks 094 101 103 100 103Old Private Sector Banks 078 114 115 095 112New Private Sector Banks 109 113 112 138 151Foreign Banks 228 209 199 126 174
Capital Adequacy Ratio 2006-7 2007-8 2008-9 2009-10 2010-11
State Bank of India amp Associates 1232 1321 1396 1346 1225Nationalized Banks 1237 1213 1324 1318 1347Old Private Sector Banks 1208 1408 1476 1485 1456New Private Sector Banks 1199 1439 1533 1803 1687Foreign Banks 1239 1305 1432 1726 1672Note To 2007-8 = Basel I From 2008-09 = Basel-II
Net NPA Ratio 2006-7 2007-8 2008-9 2009-10 2010-11
State Bank of India amp Associates 132 143 147 150 149Nationalized Banks 094 077 068 091 092Old Private Sector Banks 096 066 09 082 053New Private Sector Banks 097 109 129 103 056Foreign Banks 073 077 181 182 067Net NPA Ratio = Net non-performing assets as net advances
In sum descriptive data from the Reserve Bank of India confirm the anomaly
and argument drawn from the Brazilian experience An important dimension of BRICcountry recovery from the global financial crisis and downturn is the counter cyclicallending policies and realization of competitive advantages of government banks Thisposes a series of new questions for business schools and scholars of public policyInstead of liberalization and privatization leading to transitions in BRIC countriestoward capital market centered financial systems and liberal market economies publicbanks have realized competitive advantages over private and foreign banks whileproviding policy alternatives to BRIC governments in the face of financial crisis andglobal economic slowdown We return to these implications in the conclusion
One development of note at the Reserve Bank of India is a policy focus onfinancial inclusion The 2008 report of the Committee on Financial Inclusion has beenfollowed by sections of the Reserve Bank of India Annual Report reserved fordiscussion of financial inclusion And instead of focusing on liberalization and
8132019 Government Banking and BRICs in the Recent Financial Crisis
httpslidepdfcomreaderfullgovernment-banking-and-brics-in-the-recent-financial-crisis 4357
983106983122983113983107 983111983151983158983141983154983150983149983141983150983156 983106983137983150983147983155 983137983150983140 983110983145983150983137983150983139983145983137983148 983123983156983137983156983141983139983154983137983142983156
43
privatization to ensure the spread of banking products and services alternative policieshave been explored One is of special note The Committee on Financial Inclusionrecommended issue of identity cards as bank cards This would profoundly change thelandscape of banking in India and has attracted attention from analysts at the CentralBank of Brazil charged with financial inclusion as well as the President of Indonesia
and apparently Uganda officials Given the revolution in information and card paymenttechnologies this policy proposal and pilot studies deserve close attention asalternatives to dramatically increase the pace of social inclusion of the bankless
8132019 Government Banking and BRICs in the Recent Financial Crisis
httpslidepdfcomreaderfullgovernment-banking-and-brics-in-the-recent-financial-crisis 4457
983106983122983113983107 983111983151983158983141983154983150983149983141983150983156 983106983137983150983147983155 983137983150983140 983110983145983150983137983150983139983145983137983148 983123983156983137983156983141983139983154983137983142983156
44
China
This section turns to a brief review of the Chinese banking sector to further explore therole of government banks in terms of their modernization competitive advantages
policy roles and capacity for counter cyclical credit that help explain why BRICcountries were able to avert the severe consequences of the global financial crisis
First figure A11 reports the basic structure of the banking system in China
Although we have been unable to compare the evolution of types of banks acrosstime in similar ways to the above data on India taken from the Reserve Bank of Indiaour research assistants have gathered the following comparative macroeconomicfinancial and balance sheet data on banking in China The data appear to be consistentwith the core argument presented in this paper ndash that government banks havemodernized since liberalization and provided policy makers with alternative means tocounter the effects of financial crisis abroad
8132019 Government Banking and BRICs in the Recent Financial Crisis
httpslidepdfcomreaderfullgovernment-banking-and-brics-in-the-recent-financial-crisis 4557
983106983122983113983107 983111983151983158983141983154983150983149983141983150983156 983106983137983150983147983155 983137983150983140 983110983145983150983137983150983139983145983137983148 983123983156983137983156983141983139983154983137983142983156
45
We lack more current information and were unable to collect data directly fromofficial sources in China to compare the trajectory of state owned private and foreignbanks As a substitute Figure 1 reports data from 2000-4 that permits initial observationof trends for this earlier period
Those present may not need reminding of the formidable record of economicgrowth in China during this 200-4 period that continues until today However data fromthe National Bureau of Statistics suggests that the Chinese banking system expanded atan even greater pace than the remarkable levels of GDP growth recorded for the 2000-4period Furthermore credit expansion was ldquoorganicrdquo in the sense that deposits
outpaced credit growth from 2000-4
Expansion of Loans in China 1999-2004
Loan Growth Total LoansYear on Year
Growth Total Depositssup1Year on Year
GrowthYear CNY billion CNY () CNY billion CNY()1999 9373 83 10878 1372000 9937 60 1238 1382001 11231 130 14362 1602002 13129 169 17092 1902003 159 211 20806 217
2004 18857 186 25319 217
sup1Based on preliminary estimates by the National Bureau of Statistics of the Peoplersquos Republic of ChinaSource National Bureau of Statistics of the PRC
Although we lack data comparable to that from the Reserve Bank of India ableto compare the trajectory of state private and foreign banks in China the sectoralbreakdown of loans and other banking and national account data confirms the profoundcapitalization of the Chinese banking system and GDP growth during from 1995-2004
8132019 Government Banking and BRICs in the Recent Financial Crisis
httpslidepdfcomreaderfullgovernment-banking-and-brics-in-the-recent-financial-crisis 4657
983106983122983113983107 983111983151983158983141983154983150983149983141983150983156 983106983137983150983147983155 983137983150983140 983110983145983150983137983150983139983145983137983148 983123983156983137983156983141983139983154983137983142983156
46
China Banking Sector Market Dimensions (1995 - 2004)
YearTotal
LoansCorp
LoansConsuLoans
HomeLoans
TotalDeposits Excess
GovBonds
CorpBonds GDP
GDPGrowth
()1995 52310 mdash mdash mdash 5376 145 330 65 5848 2511996 63100 mdash mdash mdash 6847 538 436 60 6788 1611997 73585 7341 17 130 8212 853 551 52 7446 971998 85002 8447 53 430 9529 102 9 777 68 7835 521999 95587 9394 164 1360 10831 1273 1054 78 8207 482000 108763 10453 424 3320 13486 261 1302 86 894 892001 118990 112 699 5600 15472 3573 1562 101 9593 732002 139800 12913 1067 8258 18339 4359 mdash mdash 10479 922003 169770 15401 1576 13302 22036 5059 mdash mdash 11669 1142004 194220 16848 1988 15800 25319 5897 mdash mdash 13657 170Figures = CNYB
This data reported in terms of percent GDP provides further clarity on the rapid
capitalization of loans It is of note that the bulk of loans during this period were to thecorporate sector with consumer and home loans lagging significantly
China Banking Sector Percent GDP
YEARTotal
LoansCorporate
LoansConsumer
LoansHomeLoans Deposits
ExcessDeposits
GovBonds
CorpBonds
1995 895 00 00 00 919 25 56 111996 929 00 00 00 1009 79 64 091997 988 986 02 02 1103 115 74 071998 1085 1078 07 05 1216 131 99 091999 1165 1145 20 17 1320 155 128 092000 1217 1169 47 37 1508 292 146 102001 1240 1167 73 58 1613 372 163 112002 1334 1232 102 79 1750 4162003 1455 1320 135 114 1888 4342004 1422 1234 146 116 1854 432
Sources China Banking Regulatory Commission Peoplersquos Bank of China and GoldmanSachs research estimates
Compilation of financial data from a select number of banks in China suggeststhat the pattern of bank change encountered in Brazil and India also describes theexperience of China The liberalization of the Chinese economy and the modernization
of state banks appear to describe the process of bank change instead of a process oftransition toward private banking and capital market centered financial systemAlthough we have been unable to draw data from Chinese monetary authorities thebalance sheet data suggests the clear predominance of large state banks in the politicaleconomy of banking and finance in China How these institutions were used to counterthe effects of financial crisis abroad and redirect domestic investment production andconsumption must remain a subject for further research
8132019 Government Banking and BRICs in the Recent Financial Crisis
httpslidepdfcomreaderfullgovernment-banking-and-brics-in-the-recent-financial-crisis 4757
983106983122983113983107 983111983151983158983141983154983150983149983141983150983156 983106983137983150983147983155 983137983150983140 983110983145983150983137983150983139983145983137983148 983123983156983137983156983141983139983154983137983142983156
47
Select Financial Data from Chinese Banks 2004()
CNY (billion)Total
AssetsGrossLoans
CustomerDeposits Equity
NPLRatio
()
Pre-prov
ProfitsNet
Profits
State Banks
ICBC 5671 3705 5105 163 190 653 23CCB 3905 2226 3489 195 39 605 484ABC (NA) mdashBOC 427 2146 3342 205 51 578 209Quasi-State
BoCom 1145 639 1023 54 30 131 16CMB 587 376 513 22 29 82 32CITIC Industrial 515 306 429 20 60 52 03SPDB 456 311 397 14 24 62 20China Everbright mdashGuangdong Development 345 216 301 mdash mdash mdash 32
Industrial Bank 341 203 283 10 25 37 11Quase-Private
Bank of Shanghai 216 106 179 83 51 32 26Hua Xia 304 181 270 92 40 29 10Shenzhen Development 198 126 166 43 114 28 03Bank of Beijing 209 85 174 71 mdash 26 07
Sector total 19422 25319 129Three state-banks 2692 3979 188Second tier banks 2549 3733 148
ABC = Agriculture Bank of China BOC = Bank of China
BOCOM = Bank of Communications CCB = China Construction BankCMB = China Merchantrsquos Bank CNY = yuanICBC = Industrial and Commercial Bank of ChinaNPL = nonperforming loanROA = return on assets ROE = return on equityprov = provisioningPRC = Peoplersquos Republic of ChinaSPDB = Shanghai Pudong Development BankNote Loan and deposit market share for BOC and ICBC are for their domestic operations onlySources Company data Goldman Sachs research estimates
Returns on Assets Equity and Domestic Market Shares of Major China Banks 2004()
CNY (billion) ROA () ROE ()Deposit Mkt
Share ()Loan MktShare ()
Mortgage MktShare()
State Banks
ICBC 004 14 199 187 253CCB 130 254 138 115 217ABC (NA)BOC 051 102 101 89 152Quasi-State
BoCom 015 45 37 29 34CMB 060 161 20 19 29
CITIC Industrial 007 17 17 16 18SPDB 048 153 16 16 26
8132019 Government Banking and BRICs in the Recent Financial Crisis
httpslidepdfcomreaderfullgovernment-banking-and-brics-in-the-recent-financial-crisis 4857
983106983122983113983107 983111983151983158983141983154983150983149983141983150983156 983106983137983150983147983155 983137983150983140 983110983145983150983137983150983139983145983137983148 983123983156983137983156983141983139983154983137983142983156
48
China EverbrightGuangdong Development mdash mdash 12 11 mdashIndustrial Bank 037 126 11 10 10Quase-Private
Bank of Shanghai 129 360 07 05 14Hua Xia 038 116 11 09 07Shenzhen Development 017 75 07 06 08Bank of Beijing 037 108 07 04 07
Sector totalThree state-banks 438 391 622Second tier banks 144 127 154
ABC = Agriculture Bank of China BOC = Bank of China BOCOM = Bank of Communications CCB =China Construction Bank CMB = China Merchantrsquos Bank CNY = yuanICBC = Industrial and Commercial Bank of China mkt = market NPL = nonperforming loan ROA =return on asset ROE = return on equity prov = provisioning PRC =Peoplersquos Republic of China SPDB = Shanghai Pudong Development BankNote Loan and deposit market share for BOC and ICBC are for their domestic operations onlySources Company data Goldman Sachs research estimates
Further data from 2006-10 from the Peoples Bank of China suggests that the big5 state banks continue to outperform the next 12 largest joint stock commercial banksThe big five have launched sales of shares to capitalize while listing on capital marketsand adopting reporting of financial data along lines of international standards Thisappears to be similar to Banco do Brasil policies that retain majority of shares in federalgovernment control while capitalizing the bank through issues of stock
Comparing the Performance of Big 5 State Banks and Next 12 Joint Stock CommercialBanks in China
2006 2007 2008 2009 2010
Profit Margin Big 5 State Banks 3116 3143 2586 3026 3269
Next 12 JS Commercial Banks 2050 2791 1796 2159 2365
Returns Big 5 State Banks 507 606 860 691 675(risk adj) Next 12 JS Commercial Banks 459 570 1016 714 723
Op Risk Big 5 State Banks 5548 5539 5215 5319 5322Next 12 JS Commercial Banks 5886 5721 5725 5831 5947
Leverage Big 5 State Banks 1626 1482 1724 173 1734Next 12 JS Commercial Banks 2826 2251 2064 2048 1936
ROE Big 5 State Banks 1424 1557 1999 1925 2037Next 12 JS Commercial Banks 1564 2049 2156 1840 1967
Big 4 and 11 JSCBsSource Peoples Bank of China China Financial Stability Reports 2007-11
Performance indicators reported by the Peoples Bank of China for the big 5 statebanks and 12 next largest joint stock commercial banks also suggest that the largestgovernment banks in China retain significant competitive advantages ndash and may providepolicy alternatives Given the current shift of economic policy in China away fromindustry and export led growth to more sustainable domestic oriented growth and socialinclusion the role of state banks clearly comes to the fore
8132019 Government Banking and BRICs in the Recent Financial Crisis
httpslidepdfcomreaderfullgovernment-banking-and-brics-in-the-recent-financial-crisis 4957
983106983122983113983107 983111983151983158983141983154983150983149983141983150983156 983106983137983150983147983155 983137983150983140 983110983145983150983137983150983139983145983137983148 983123983156983137983156983141983139983154983137983142983156
49
Net Operating Income of Big 5 State Banks and Next 12 CommercialBanks 100 million RMB YuanBig 5 State Banks 2006 2007 2008 2009 2010
Balance Net interest income 349703 500456 556790 532206 720152Net fee amp commission inc 48524 103817 138464 175469 232491
Investment income 216089 283725 338865 324037 340440
Other business income (1807) (17054) 47548 33791 2186
Net operating income 612509 870944 1081667 1065503 1314943
Percent Net interest income 5709 5746 5148 4995 5477
Net fee amp commission inc 792 1192 1280 1646 1768
Investment income 3528 3258 3133 3041 2589
Other business income (030) (196) 440 318 166
Net operating income 10000 10000 10000 100 100
Next 12 Joint Stock CommercialBanks 2006 2007 2008 2009 2010
Net interest income 87253 132945 198965 191276 281588
Net fee amp commission inc 7850 16247 27319 30115 42023
Investment income 20959 32172 44864 50767 50500
Other business income 2306 4498 16359 10384 7400
Net operating income 118468 185861 287507 282542 381511
Percent Net interest income 7365 7153 6920 6769 7381
Net fee amp commission inc 671 874 950 1066 1101
Investment income 1769 1731 1560 1797 1324
Other business income 195 242 569 368 194Net operating income 10000 10000 10000 10000 10000
Source Peoples Bank of China China Financial Stability Reports 2007-11
Big 4 and 11 JSCBsBig 5 = ICBC ABC BOC CCB BOCOMNext 12 Joint Stock Commercial Banks = China CITIC Bank Everbright Bank Huaxia BankGuangdong Development Bank Shenzhen Development Bank China Merchants Bank Shanghai PudongDevelopment Bank Industrial Bank China Minsheng Banking Corporation Evergrowing Bank ChinaZheshang Bank Bohai Bank
In conclusion bank change in China also appears to confirm our findings from
Brazil ndash that state banks have realized competitive advantages and increased marketshares since liberalization while providing counter cyclical credit to ameliorateadjustment to crisis The modernization of the China Postal Savings Bank is ofparticular interest given its social mission downmarket focus and 40000 branchOffices throughout the country Expansion of card payment services through the postalbank system confirms the importance of the Brazilian federal savings bank (CaixaEconocircmica Federal Caixa) as agent for federal government social policy and agentresponsible for management of citizenship cards (12 million) and payment of familygrants This back to the future modernization of savings banks has proved essential forovercoming notorious levels of social exclusion and inequality in Brazil Althoughenglish language materials are unavailable on the China Postal Savings Bank thisinstitution clearly presents profound opportunities for comparable policies in China
8132019 Government Banking and BRICs in the Recent Financial Crisis
httpslidepdfcomreaderfullgovernment-banking-and-brics-in-the-recent-financial-crisis 5057
983106983122983113983107 983111983151983158983141983154983150983149983141983150983156 983106983137983150983147983155 983137983150983140 983110983145983150983137983150983139983145983137983148 983123983156983137983156983141983139983154983137983142983156
50
Reported offer of microfinance services for poverty reduction as part of nationaleconomic stimulous plan may point to developments in this direction
Given that state planning capacity has long been at the center of attention intheories of financial statecraft the role of Chinese state banks in redirecting policiesaccording to the 12th 5 Year plan for 2011-15 seems critical From 2000-5 the 10th 5
Year plan emphasized infrastructure and the attraction of investment and labor skillsThe 11th 5 Year plan (2006-10) raised concerns about sustainability rather than growthlevels while also seeking to spread improvements to balance development better servepeople and improve the quality of life continue to support Center and West provincesand revitalize Northeast provinces In comparison the 12th 5 Year plan calls for morebalanced lsquoinclusiversquo growth and structural adjustemts more than 4 trillion RMB($US600 billion) for targeted industries and interior regions a focus on new energynew materials and information and high technologies biology and new medicineenergy converstaion and environmental protection aerospace marine and advancedmanufacturing This implies fundamental shifts away from industry to services that hasbeen reported in macroeconomic data for 2010 If past studies emphasized directed
credit and industrial change the role of Chinese state banks in realizing transformationscertainly warrants study
Although the domestic flow of funds process of liberalization (or the lackthereof) and insertion of banking into Chinese political economy is beyond the scope ofthis paper our findings from Brazil appear to provide valuable hypotheses about ChinaThat is to say the big state banks and other government banks in China remaincommanding heights not in the Marxist sense of providing means to reach socialismbut immense institutions with profound presence throughout politics and markets in thecountry In this sense our findings from Brazil appear to approximate patterns ofchange in China more than Washington Consensus expectations about liberalization andprivatizations to free private and foreign banks Financial statecraft draws attention tothe capitalization of Chinese state banks through stock Sales and listings on capitalmarkets However like the Banco do Brasil (that reformers in the 1990s sought to shiftcontrol to the private sector only to increase federal government shareholding) theChinese experience surely involves unexpected consequences and patterns of changedifferent than a linear transition to the Berle amp Means paradigm of corporategovernance
Russia The New State Duopoly
ldquoThe rush of 2003-8 increased the market share of foreign banks to 285 from
52 However the state-owned banks received enormous help from the federal budget in the days of the crisis thereby strengthening their dominant
position on the Russian financial market says Sergey Aleksashenko the formerDeputy chairman of Russias Central Bank quotes Russia Profile Today one
must not harbor any illusion of a fair competition with them all the main cash
flows in Russia are controlled by state-owned banks httpwwwbarentsnovacomnode1031
Description of banking policy in Russia during the global financial crisis can beobtained from Bank of Russia annual reports and related publications The figure on the
following page summarizes the financial flows to and from the Bank of RussiaAlthough central bank policy is beyond the scope of this study the role of state banks in
8132019 Government Banking and BRICs in the Recent Financial Crisis
httpslidepdfcomreaderfullgovernment-banking-and-brics-in-the-recent-financial-crisis 5157
983106983122983113983107 983111983151983158983141983154983150983149983141983150983156 983106983137983150983147983155 983137983150983140 983110983145983150983137983150983139983145983137983148 983123983156983137983156983141983139983154983137983142983156
51
channeling counter-cyclical credits released by the Bank of Russia appear to confirm thecore argument that emerges from our studies of the Brazilian banking system Furtherdata on the following pages also suggest that state banks in Russia performed wellduring 2008-10 confirming on the basis of sparse data taken from Bank of Russiareports and documents that public banks have modernized provided counter-cyclical
credit to reverse credit crunch and economic downturn while realizing competitiveadvantages over private and foreign banks
8132019 Government Banking and BRICs in the Recent Financial Crisis
httpslidepdfcomreaderfullgovernment-banking-and-brics-in-the-recent-financial-crisis 5257
983106983122983113983107 983111983151983158983141983154983150983149983141983150983156 983106983137983150983147983155 983137983150983140 983110983145983150983137983150983139983145983137983148 983123983156983137983156983141983139983154983137983142983156
52
The following aggregate figures reported by the Bank of Russia suggest severaltrends of significance First Chart 32 suggests that household deposits shifted fromRuble deposits to foreign currency pegged (or indexed) during 2008 Second Chart 33illustrates the substantial increase of non-bank overdue debt during second semester
2008
Consequently the financial results and profitability of banks declinedsignificantly during 2008 The greater confidence in deposits with government banksfound abroad suggests that this may have been critical in Russia
Performance data deom 2008-10 provides a clearer picture one that is consistentwith our findings in Brazil State banks appear to have outperformed all other types of
banks except medium and small regional banks The following table reports the averagereturns on assets and returns on equity reported by the Bank of Russia 2008-10
Returns on Assets and Equity by Type of Bank in Russia 2008-9
Return on assets Return on equity 2008 2009 2010 2008 2009 2010
-------------------------------------------------------------------------------------------------------------------State Banks 22 08 24 157 46 148Foreign Banks 18 11 21 146 83 145Large private banks 13 03 11 106 28 84Medium-Small Banks Moscow 15 12 14 68 52 67
Medium-Small Regional Banks 21 12 15 131 65 98--------------------------------------------------------------------------------------------------------------------Source Bank of Russia Bank Supervision Reports 2009 and 2010
8132019 Government Banking and BRICs in the Recent Financial Crisis
httpslidepdfcomreaderfullgovernment-banking-and-brics-in-the-recent-financial-crisis 5357
983106983122983113983107 983111983151983158983141983154983150983149983141983150983156 983106983137983150983147983155 983137983150983140 983110983145983150983137983150983139983145983137983148 983123983156983137983156983141983139983154983137983142983156
53
Further data from the Bank of Russia on the capital adequacy of Banks during2009-10 suggest that foreign banks and large private banks remain less capitalizedagainst risks according to Basel II guidelines albeit at levels almost double thatrecommended by the Bank for International Settlements (80 risk weighted) Although
further analysis is needed this data is consistent from that reported in Brazil thatgovernment banks tend to more cautious and more prudent in terms of placing asidehigher levels of reserves and patrimony against possible losses
Capital Adequacy of Banks by Type of Bank in Russia 2009-10
2009 2010 2011---------------------------------------------------------------------------------------------------------State Banks 184 227 186Foreign Banks 155 196 195Large Private Banks 140 181 155
Medium-Small Banks Moscow 316 312 268Medium-Small Regional Banks 219 241 207Non-Bank Credit Institutions 372 1038 678---------------------------------------------------------------------------------------------------------Source Bank of Russia Bank Supervision Report (Moscow) 2009 p 43
Finally Bank of Russia bank supervision reports also suggest that state banksexpanded their market shares of assets and capital during the years following the globalfinancial crisis While large private banks and foreign banks lost market share of bankassets and bank capital in Russia state banks increased their significant market sharefrom 405 ndash 426 percent and 471-476 percent of assets and capital respectivelyUnfortunately data from previous years and for specific banking groups was notobtained However this data does appear to indicate that our findings of competitiveadvantages and policy alternatives
Number and Market Share by Type of Bank
N Banks Assets Capital---------------------------- ---------------------------- ----------------------------
Type of Bank 2009 2010 2011 2009 2010 2011 2009 2010 2011-------------------------------------------------------------------------------------------------------------------------------State 17 22 27 405 439 458 471 489 473
Foreign 101 106 108 187 183 180 172 169 191Large Private 136 139 131 346 333 305 276 287 269Med-Small Moscow 361 335 317 27 26 26 43 34 35Medi-Small Regional 443 412 372 28 28 27 36 31 29Other Credit Institutions 50 51 57 07 04 04 01 02 03Total 1108 1058 100 100 100 100 100 100-------------------------------------------------------------------------------------------------------------------------------Source Bank of Russia Bank Supervision Report 2009 amp 2010
In sum politics and financial statecraft have led to the realization of significantcompetitive advantage by Russian state banks Sperbank and Vneshtorgbank increasedtheir share of bank assets from 32 percent in 2005 to over 50 percent by 2011 through
mergers and acquisitions and aggressive displacement of foreign banks Whatever thepolitics data from the Bank of Russia suggests that monetary authorities released a
8132019 Government Banking and BRICs in the Recent Financial Crisis
httpslidepdfcomreaderfullgovernment-banking-and-brics-in-the-recent-financial-crisis 5457
983106983122983113983107 983111983151983158983141983154983150983149983141983150983156 983106983137983150983147983155 983137983150983140 983110983145983150983137983150983139983145983137983148 983123983156983137983156983141983139983154983137983142983156
54
series of counter cyclical credit injections during 2008-9 to domestic bankinginstitutions Moreover data suggests that state banks continue to perform at or ahead oflevels reported by regional private and foreign banks The large market share andimproved performance of state banks reported in recent data suggests although the datais sparse that government banks in Russia have also modernized realized competitive
advantages and provided policy alternatives against the impact of financial crisisabroadWe were unable to find evidence of policy making toward social inclusion at the
Bank of Russia or Russian state banks despite the historical trajectory of the Sberbankas a savings bank under communism The context also appears to differ considerably Asurvey of the Zircon Research Group reportedly found that only 15 percent of Russiansretain bank accounts because of mistrust in banks and government This combination ofrealist politics and the realization of competitive advantages by Russian state bankssuggests that theories of economic statecraft in the realist tradition may indeed explainthe domestic developments under study
Conclusion
This paper reports evidence about government bank modernization and financialstatecraft in BRIC countries designed to counter the effects of crisis and shape domesticgrowth Government banks in BRIC countries have contributed to the widely notedadjustment of these economies to global financial crisis and economic downturnContrary to the Washington Consensus that prevailed during much of the 1980s and1990s (that privatization and liberalization especially of banking would free marketforces and deepen domestic financial systems) a quite different process of bank changeappears to have ensued after financial liberalization in the BRICs
Instead of replacement of state banks with private banks government banksremain central agents of domestic credit and growth and have modernized ldquojust intimerdquo The capitalization and realization of competitive advantages by large governmentbanks during the 2000s meant that once the US financial panic spread across capitalmarkets broke highly leveraged private and produced runs on private bank depositspolicy makers in BRIC countries nonetheless retained counter cyclical policyalternatives through their more solid large state banks
These findings counter traditional foci on the private sector individualentrepreneurship and ideals of free markets linked to the political and social advancesrecorded around the world in the last decades We report an anomaly for theories offinancial repression and the Washington Consensus about the virtues of privatization
and liberalization Although largely blamed for reproducing underdevelopment in thepast BRIC government banks averted excesses of private banking that drove creditbubbles such as home mortgages and derivatives in the US And since liberalization ofbanking (we have not adequately discussed how much liberalization occurred in eachcountry) government banks have modernized to compete with private and foreignbanks Government banks have realized competitive advantages and provided policyalternatives These two arguments help explain why BRIC countries have farecomparatively well in the face of financial crisis in core countries
Financial statecraft is therefore at the center of BRIC counter cyclical capacitiesand state planning Brazil Russia India and China fared significantly better thanadvanced and many developing countries in terms of adjusting to credit crunches and
export shocks This is because government banks proved critical interbank credit toretain confidence in domestic banking systems These institutions also presented other
8132019 Government Banking and BRICs in the Recent Financial Crisis
httpslidepdfcomreaderfullgovernment-banking-and-brics-in-the-recent-financial-crisis 5557
983106983122983113983107 983111983151983158983141983154983150983149983141983150983156 983106983137983150983147983155 983137983150983140 983110983145983150983137983150983139983145983137983148 983123983156983137983156983141983139983154983137983142983156
55
policy alternatives for political and social forces Politics shaped adjustment andrecovery through state banks differently in BRIC countries Given the realities of statecentered political realism in Russia the redirection of state banks toward goals ofChinese Five Year Plans and the modernization of the State Bank of India amidst anamorphous federalism the experience of Brazil with democratization and public bank
modernization may stand out (Armijo 2009)Further analysis of savings banks and cooperative banks also will be requiredAs members of the World Savings Bank Institute (a global association of savingsbanks) the Caixa in Brazil SNI and NABARD in India and China Postal Savings Bankappear to have provided access to very large numbers of previously unbanked citizensThis returns to traditional ideas of social banking and the history of savings banks thatwere founded throughout Europe since the late 18 th century The upmarket strategy andexpansion into investment banking and international banking of the Russian Sberbankconstrasts with downmarket strategies of savings banks in Brazil India and China
The financial press has recently reported doubts about bad loans in Chinese statebanks and cast doubt on the financial results posted and reported in this paper
However current estimates of 2-5 percent bad loans in Chinese state banks pale incomparison to the US$1240 billion in bad loans shifted to asset managementcompanies in the mid 2000s before capitalization of these institutions through sale ofshares Critics of state banking in Brazil also point to past levels of bad loans (reaching30-40 percent) because of their capture during military government delayed transitionBut the cost of capitalization and transfer of bad loans from Brazilian state banks alsoremained below US$400 billion and is still contingent on liquidation of assetmanagement companies created in 2001 In any case these numbers are very smallcompared to GAO estimates of US$120 trillion in emergency infusions by USmonetary authorities to banks and financial institutions from 2007-11
These are anomalies for recent market-based banking theory and neo-liberalpolicy designs However they do not run counter to orthodoxy in economics andbanking theory Over the last decades economic reforms (fiscal financial monetaryand banking) have improved transparency and brought public policy and marketexpectations closer However expectations about deregulation and free marketequilibria in banking and finance have succumbed in the face of panic and the stillsobering consequences of crisis The materials presented herein are descriptive and willrequire more careful analysis However given the urgency of searching for alternativedevelopment models and different approaches to financial statecraft in BRIC countriesand beyond we have taken the liberty to present research in initial stages and toprovoke thought along the lines suggested by our kind conveners
8132019 Government Banking and BRICs in the Recent Financial Crisis
httpslidepdfcomreaderfullgovernment-banking-and-brics-in-the-recent-financial-crisis 5657
983106983122983113983107 983111983151983158983141983154983150983149983141983150983156 983106983137983150983147983155 983137983150983140 983110983145983150983137983150983139983145983137983148 983123983156983137983156983141983139983154983137983142983156
56
Appendix on Alternative Banking and Social Inclusion
This appendix describes how ideas about government banking led to further work onalternative banking and social inclusion with help from the Rockefeller FoundationBellagio Center In July 2011 we were able to convene a conference designed to gather
scholars alternative banking executives and representatives from savings andcooperative bank associations to rethink strategies for social inclusion in the globalsouth and attempt to launch a new policy agenda Given the search for alternativestrategies to counter crisis and the advances of stabilization transparency and bankingsupervision in developing and emerging economies we call for alternative bankingcommunities in the global north and south to work together and help shape a new policyagenda for social inclusion Because savings banks credit cooperatives and otheralternative banking and finance institutions have realized competitive advantages andemerged from crisis we can now think beyond We believe that new policies may helpdeveloping and emerging nations redirect large domestic institutions such as postal andsavings banks toward meeting the UN millennium goals to eliminate poverty by 2015
Plans include writing a green paper on Core Principles for Alternative Bankingand Social Inclusion convening events to promote these principles through institutionalsupporters and networks and seeking adoption of these principles at policy venues suchas the World Savings Bank Institute the International Association of CooperativeBanks the Bank for International Settlements the International Financial ReportingStandards foundation the ISO International Standards Organization the Charter forResponsible Business regional development banks and the World Bank We also planto submit an edited volume of scholarly contributions on alternative banking and socialinclusion by year-end 2012 Interested parties are welcome to participate
Institutional supporters and networks include
Institutional SupportersColumbia University School of International and Public Affairs New YorkInstitute for Money Technology and Financial Inclusion University of CaliforniaIrvineKingacutes College Department of Management LondonSatildeo Paulo Business School Getulio Vargas FoundationSecond University of Naples
Networks
Association of Emerging Market Business Schools Satildeo Paulo BrazilCommunity of European Management Schools BrusselsCritical Political Economy NetworkEuropean Association of Co-operative Banks BrusselsGlobal Public Policy Network LondonInternational Cooperative Banking Association BrusselsSocial Science Finance Network AmsterdamSociety for Advancement of Social Economics PhiladelphiaWorld Savings Bank Institute Brussels
8132019 Government Banking and BRICs in the Recent Financial Crisis
httpslidepdfcomreaderfullgovernment-banking-and-brics-in-the-recent-financial-crisis 5757
983106983122983113983107 983111983151983158983141983154983150983149983141983150983156 983106983137983150983147983155 983137983150983140 983110983145983150983137983150983139983145983137983148 983123983156983137983156983141983139983154983137983142983156
Core Principles for Alternative Banking and Social Inclusion
Commitment to End Capital StarvationPromote access to and use of banking and financial services by all through newtechnologies and distribution channels to capitalize assets among the poor
Commitment to Universalize Income Savings Credit and FinanceProvide basic income via ATM cards and mobile banking to reach the poor and opennew channels of access to income savings credit finance insurance and opportunities
Prudent Banking and Regulatory ComplianceAlternative banking seeks to work within regulations guidelines and best practicesrecommended by domestic monetary authorities and international regulatory institutionssuch as the Bank for International Settlement Basel II Capital Risk Guidelines
Corporate Social Responsibility Leadership
Integrate corporate social responsibility into down-market business strategies andinstitutions of representation and democratization
Transparency and AccountabilityPublish annual reports and balance sheets in accord with international best practices offinancial social and sustainability reporting
Leadership in Provision of New Banking Services and Products to the PoorUse competitive advantages in banking and institutional networks to channel moreeffectively capital income and finance to the poor
Generate Sustainable Income and Household Asset AccumulationUse branch offices and new banking technologies to accelerate progress toward UNmillennium goals to eliminate poverty
Universalize Financial EducationPromote financial education to encourage responsible banking and finance and avertpredatory lending and unethical practices
Adopt Cutting Edge Technology and Management Practices to Provide
Competitive Alternative to Private Commercial and Investment Banks
Incorporate electronic card and mobile banking services to better serve the poorContribute to Realization of Bellagio Principles for SustainabilityPromote alternative banking and business practices that contribute to environmentallysustainable income consumption and production as stated in Bellagio Principles forSustainability
Respect and Build on National and Regional DifferencesI d f i l d l l i b ki i i i d i i l
8132019 Government Banking and BRICs in the Recent Financial Crisis
httpslidepdfcomreaderfullgovernment-banking-and-brics-in-the-recent-financial-crisis 357
983106983122983113983107 983111983151983158983141983154983150983149983141983150983156 983106983137983150983147983155 983137983150983140 983110983145983150983137983150983139983145983137983148 983123983156983137983156983141983139983154983137983142983156
3
The comparative political economy of finance is especially contested Financialdeepening approaches and bank-centered finance strategies (and liberal and coordinatedpolitical economy approaches) often see the same phenomena from profoundly differentperspectives8 Liberal market-economies are driven by equity markets thrive on publicinformation and spurn coordination Coordinated market-economies are driven by bank
credit thrive on limited sharing of firm strategy with financiers and spurn markets fortheir excessive volatility that produce sub-optimal equilibrium9 From a market-centeredperspective neo-institutionalism is largely neo-protectionism From the perspective ofcoordinated capitalism and developmental states excessive liberalization andprivatization would simply throw babies -- cherished institutions of social policy anddomestic control ndash out with the bathwater In terms of finance theory marketapproaches insist that policies should free agents to lsquoget prices rightrsquo while coordinatedmarket and bank-centered approaches argue that enough credit be directed to accelerateinnovation and lsquoget planning rightrsquo10
These deep differences shape views of financial statecraft and governmentbanking in BRICs The question of social inclusion may provide more grounds for
agreement Given the huge decline in the number of bankless Brazilians (those withoutbank account) from 80 - 50 percent 2000-2010 the relation between financial statecraftand democratization appears more positive sum than supposed by most scholars ofpolitical economy Most research on domestic finance (and especially monetary theoryand policy) assumes zero sum relations between social inclusion and proper financefiscal and monetary policy However in contexts of high inequality and financialexclusion positive sum relations may obtain This counters conceptions of fiscalconstraints to change and reverses causal relations of independent central bankingInstead of seeking to ensure central bank independence from politics and social forces(Alesina and Summers 1993) or free markets and private banks through privatizationsand deregulation (Williamson 1990) the construction of financial and monetaryauthority in Brazil (Whitehead 2002 Sola and Whitehead 2006) has involved therealization of competitive advantage by large public banks (Mettenheim 2010)Moreover basic income policies (albeit conditional see Soares et al 2010) and othersocial services have proved more successful than private banking for reaching thebankless
Reforms during the 1990s and modernization of public (and central) banksduring the 2000s thus require rethinking constraints to change Since the end of theelectoral road to socialism exemplified by military coup in Chile against PresidentAllende on 11 September 1973 social scientists and policy communities have largelyconcurred that markets severely constrain social inclusion For Gold Lo and Wright
(1975) structural theories of the state replaced earlier instrumental and functionaltraditions in Marxism by better describing how markets constrain social policy and vetopolitical change Since then social scientists emphasize how markets cleared byindividual investors impose fiscal austerity and set constraints to change Much ofcritical and mainstream social science agree that social policies tend to pressure fiscalaccounts and lead either to tax increases or adjustment policies that reduced profits and
8 On bank-centered and market centered financial systems see Zysman John Governents Markets and
Growth Financial Systems and the Politics of Industrial Change Ithaca NY Cornell University Press19839 The terms of this dichotomy are from Hall Peter amp David Soskice eds Varieties of Capitalism The
Institutional Foundations of Comparative Advantage Oxford Oxford University Press 200110
This distinction between prices and planning is from Dymski Gary A lsquoBanking on TransformationFinancing Development Overcoming Povertyrsquo Paper presented to UFRJ Economics Institute September2003
8132019 Government Banking and BRICs in the Recent Financial Crisis
httpslidepdfcomreaderfullgovernment-banking-and-brics-in-the-recent-financial-crisis 457
983106983122983113983107 983111983151983158983141983154983150983149983141983150983156 983106983137983150983147983155 983137983150983140 983110983145983150983137983150983139983145983137983148 983123983156983137983156983141983139983154983137983142983156
4
tax revenue This in the worst cases caused political-economic crisis and led to thebreakdown of democracy in developing countries (OacuteDonnell 1973) Similar forces inadvanced economies led to stagflation in the 1970s and electoral turns to neo-conservative governments and neo-liberal policies in the 1980s designed to downsizeWelfare States (Pierson 1996)
These structural explanations are now incomplete Old views of fiscaldominance fail to capture the implications of advances in monetary economics duringthe 1990s and bank modernization during the 2000s Government bank modernizationnew regulatory frameworks and better supervision of banks and markets (contrary toderegulation in the US and a few tax havens and financial centers) provide a new settingfor what we call financial roads to social economies In other words structural theoriesof the state and conceptions of vicious cycles that emphasize fiscal constraints predate studies of the credit channel interest rate channel and the modernization of publicbanks
Old views of fiscal dominance remain so prevalent that austerity has oftenremained in place far beyond necessary in developing countries Many developing
countries have accumulated significant foreign reserves and sustained trade surplusesduring years of economic growth Moreover in Brazil transparent policy frameworkssuch as inflation targeting and flexible foreign exchange regimes have been in place forover a decade (Fraga et al 2004) The situation of many ergo developing countries isthus different Bank modernization the accumulation of immense foreign reserves andthe consolidation of reforms have approximated markets and public policy Newchannels for change are at hand Our research focuses on the modernization of socialbanking especially the ability of new technologies such as electronic card paymentchannels and mobile banking to bring income grants and access to banking and publicservices in vast numbers Since opening the Brazilian banking industry in 1995 a backto the future modernization of government banks and basic income policies are biglargely untold storiesl organizations the competitiveness of private banks or the greaterefficiency of market-centered microfinance firms or funds
This also implies that advocates of central bank independence beg the questionof financial statecraft in developing and emerging economies The construction ofmonetary authority in Brazil during the 1990s and 2000s differs from standard theoriesof central bank independence in three ways First rather than the imposition oforthodoxy the construction of monetary authority in Brazil involved heterodox policiesof inertial inflation that were used to reduce high and persistent inflation Second thesuccessful reduction of inflation while redistributing wealth to the poor provided thepolitical impetus and legitimation for monetary statecraft after military rule both in
terms of economic policies and party politics Third central bank authority and capacityemerged in Brazil in precisely the reverse causal order expected by economists Contrary to claims about the need to establish central bank independence to ensure pricestability the reverse occurred The Central Bank of Brazil expanded prerogatives andbuilt capacity after price stability was secured by heterodox policies in 1994
Domestic Financial Statecraft
Our approach to financial statecraft remits to a long tradition in comparative politicaleconomy that focuses on how politics and government policies shape markets Thisapproach is epitomized by Polanyrsquos The Great Transformation Shonfieldrsquos Modern
Capitalism Zysmanrsquos Governments Markets and Growth Gourevitchrsquos Politics in Hard Times Conaghan amp Malloyacutes Unsettling Statecraft and Sola amp Whiteheadacutes
8132019 Government Banking and BRICs in the Recent Financial Crisis
httpslidepdfcomreaderfullgovernment-banking-and-brics-in-the-recent-financial-crisis 557
983106983122983113983107 983111983151983158983141983154983150983149983141983150983156 983106983137983150983147983155 983137983150983140 983110983145983150983137983150983139983145983137983148 983123983156983137983156983141983139983154983137983142983156
5
Statecrafting Monetary Authority Democracy and Financial Order in Brazil PeterKingstoneacutes analysis of coalitions Christine Kearneyacutes analysis of neo-liberal policiesand studies of recentralization and federalism by Leslie Armijo Kent Eaton and DavidSamuels all explore the political determinants of economic policies in Brazil11
Polanyirsquos The Great Transformation and Shonefieldrsquos Modern Capitalism
remain canonic studies of financial statecraft Polanyi argued that laissez faire liberalism during the 19th century generated movements of social self-defense in theform of organized labor efforts to address the social question and central banking toprotect private banks from downturns and currency devaluation under the gold standardOther interventions such as tarrifs imperialist expansion subsidies to agriculture andindustry and top-down social policies also prevailed over liberalism and free marketsespecially after the 1873 depression Statecrafting often in authoritarian forms thusreappeared in the latter 19th century after decades of liberalism Thereafter two worldwars and recovery from economic depression meant that political imperatives continuedto dominate domestic policymaking After 1945 Shonefield argues that ContinentalEuropeans reshaped government ownership in response to the political and economic
imperatives of recovery rather than ideology or nationalist design This emphasis onnecessity and improvisation places the statecrafting tradition closer to Lindblomrsquosmuddling-through conception of policymaking than Marxist-Leninist or nationalisttheories that saw large state banks as means to ideological ends
Recent scholarship has returned to core ideas of statecrafting For Kirschnerbecause the impact of alternative financial arrangements and policies on welfare is oftenequal or unpredictable politics rather than independent economic judgements bothshape and explain policy choices and the configuration of markets12 Statecrafting thusdescribes the political construction of coalitions to support economic policies and theadoptionadaptation of policies to the particularities of domestic markets institutionsand politics13 Hoffman traces how political ideas periodically recast the US financialsystem during critical junctures of change since independence14 Laurence Toya andAmyx also argue that politics explain the origin character and implementation of lsquobigbangrsquo financial reforms in Great Britain and Japan in the 1980s15 Peacuterez describes howdomestic groups determined banking and finance reforms in Spain16 This is consistentwith Maxfieldrsquos description of how the formation of a bankeracutes coalition shapedfinancial reforms and policies in Mexico17 However during the last decades domesticeconomic statecrafting has become virtually synonomous with imposing liberal reformsWe report fundamentally different developments from the BRICS The realization ofcompetitive advantages by government banks since liberalization and the importance of
11
Our approach also can be described from Claus Offe as a sociological approach to political economy ndashone that focuses on how social organizations interests and political coalitions sustain economic policiesOffe Claus lsquoPolitical Economy Sociological Perspectivesrsquo in Goodin Robert E amp Klingemann Hans-Dieter (eds) A New Handbook of Political Science Oxford Oxford University Press 1998 pp 675-69012 Kirschner Jonathan (ed) Monetary Orders Ambiguous Economics Ubiquitous Politics Ithaca NYCornell University Press 200313 Conaghan Catherine M amp James M Malloy Unsettling Statecraft Democracy and Neoliberalism in
the Central Andes Pittsburgh PA University of Pittsburgh Press 199414 Hoffmann Susan Politics and Banking Ideas Public Policy and the Creation of Financial
Institutions Ithaca NY Cornell University Press 200115 Laurence Henry Money Rules The New Politics of Finance in Britain and Japan Ithaca NY CornellUniversity Press 200116 Peacuterez Sofiacutea Banking on Privilege The Politics of Spanish Financial Reform Ithaca NY Cornell
University Press 200317 Maxfield Sylvia Governing Capital International Finance and Mexican Politics Ithaca NY CornellUniversity Press 1990
8132019 Government Banking and BRICs in the Recent Financial Crisis
httpslidepdfcomreaderfullgovernment-banking-and-brics-in-the-recent-financial-crisis 657
983106983122983113983107 983111983151983158983141983154983150983149983141983150983156 983106983137983150983147983155 983137983150983140 983110983145983150983137983150983139983145983137983148 983123983156983137983156983141983139983154983137983142983156
6
these large institutions for domestic policy making particularly for counter-cyclicalcredit and social inclusion This comes at a critical time of reassessment in the US andadvanced economies
Errors of Deregulation and Crisis in the US
A clearer explanation of the financial panic in US sub-prime mortgage markets alsohelps explain why BRIC countries suffered less and recovered more quickly From theperspectives of BRICs the excesses of deregulation and market based banking are theanomalies ndash not the reality of smoothing the growth curve and encouraging socialinclusion Competing hypotheses rushed to explain the origin and evolution of the USfinancial panic and crisis (Gorton 2008) The US Government Commission (2010) splitwith dissenters presenting separate explanations However for purposes of comparisonto BRICs review of antecedents crisis mechanisms and policy responses suggest botherrors of deregulation and particular complementarities in market-centered financecapitalism Asset bubbles are not new to financial markets However the deregulation
of capital markets and the dual bubble of long-term housing prices and quick valuationof mortgage backed securities and other derivatives produced unprecedented crisis in2007 Policy statements national accounts Federal Reserve balance sheets and markettrends and working papers indicate the following causes and consequences
First the steep valuation of the Case-Schiller Home Price Index from 1988-2009suggests a long-term asset bubble has changed US political economy and producedstructural imbalances From 1895-1995 home prices largely accompanied inflation(Baker 2007) However from 1995 to June 2006 home prices outpaced inflation by anestimated 70 percent This produced a US$ 25 trillion home price bubble and a fullUS$ 80 trillion in housing related wealth effects Construction alone during this periodincreased from an estimated 4-6 percent of US GDP
Second policies designed to counter financial crisis in 2000 such as low interestrates fueled another round of home price increases while construction and consumptionwere encouraged by further deregulation of financial markets Revocation of the Glass-Steagal law (1999) the Commodities and Futures Act of 2000 and the ConsolidatedEntity Supervision Act of the Securities and Exchange Commission (2004) freed USbanks to sell and securitize mortgages and other assets virtually without supervisionInstead of convergence toward International Financial Reporting Standards and Bankfor International Settlements (BIS) Basel II Accord capital reserve requirements USbanks were permitted to leverage freely and sell largely without consumer protectionregulations The US turn to deregulation remains an outlier Elsewhere domestic
regulators banks and financial institutions have adopted policies and reforms toconverge toward BIS domestic bank regulations and more effective capital marketsupervision
Third the valuation of mortgage backed securities and derivatives created afundamentally new situation once problems appeared in 2007 Data from the SecuritiesIndustry and Financial Markets Association suggest how the value of asset backedsecurities exploded after deregulation Values of outstanding debt and new debt issuedfrom 1996-2008 reveal an abrupt capitalization of mortgage related and asset backedsecurities typical of asset bubbles Longstanding bond markets such as municipal bondstreasury bonds corporate debt federal agency securities money markets and assetbacked bonds all remained on relatively stable growth trajectories until crisis hit in
2007 In comparison the market value of mortgage related bonds almost doubled fromUS$35 trillion in 2000 to reach US$89 trillion before crisis in 2007
8132019 Government Banking and BRICs in the Recent Financial Crisis
httpslidepdfcomreaderfullgovernment-banking-and-brics-in-the-recent-financial-crisis 757
983106983122983113983107 983111983151983158983141983154983150983149983141983150983156 983106983137983150983147983155 983137983150983140 983110983145983150983137983150983139983145983137983148 983123983156983137983156983141983139983154983137983142983156
7
Fourth central drivers of the financial market bubble in the US were secondarymarkets for mortgage backed securities and derivatives For example throughout thefinancial panic and crisis municipal bond markets remained largely stable despitefalling tax receipts and the impact of crisis on sub-national government budgets Thevalue of US Treasury bonds also increased during crisis reflecting a flight to quality
much criticized by surplus countries such as China This remains a comparativeadvantage of market-centered finance capitalism Despite originating crisis a flight toquality cheapens counter cyclical policies Corporate bonds also increased during crisisas US Federal Reserve banks and treasury injected funds to keep US firms afloatFurther analysis is needed However data from bond markets suggest that marketcentered finance capitalism retains particular sets of complementarities and policyalternatives
Fifth both government policies during crisis and proposals for new regulatoryframeworks are designed to tap these complementarities After September 2008 USgovernment reserves increased from US$ 900 billion to over two trillion dollars largelythrough new credit facilities created by the Federal Reserve Board and regional banks of
the Federal Reserve System US government reserves first increased through massiveextension of credit then through central bank swaps then through acquisition of federalgovernment securities by the US central bank These policies suggest particularconfigurations and complementarities in market-centered finance capitalism
The first program introduced in February 2008 was the Federal Reserve PrimaryDealer Credit Facility an overnight loan facility to ensure funds for primary dealers oftreasury securities to sustain demand in financial markets US government primarycredit borrowing increased from under US$200 billion through September 2008 to overUS$1100 billion by December 2008 but decreased thereafter to under US$400 billionby April 2009 US Federal Reserve Banks also purchased massive amounts of assetbacked securities to sustain markets In November 2008 the Federal Deposit InsuranceCorporation created a Temporary Liquidity Guarantee Program one that provided overUS$3340 billion by April 2009 (Given that FDIC funds are taken from charges onsavings accounts this transfer of funds from savings accounts to emergency financialpolicy credits has attracted criticism from community banking association members)US monetary authority purchases of GSE mortgage backed securities also reachedUS$125 trillion in GSE ldquoagencyrdquo mortgage backed securities US$2000 billion indirect agency obligations and permitted purchase of up to US$3000 billion in treasurysecurities during 2009 The Federal Reserve Board also created a Term Asset-BackedSecurities Loan Facility
In September 2008 the Federal Reserve Board created an Asset-Backed
Commercial Paper Money Market Mutual Fund Liquidity Facility to stave off financialpanic Lending through the Federal Reserve Bank of Boston reached US$1500 billionby September 2008 However loans under this program declined to near zero in Apriland remained below US$200 billion in May 2009 The Federal Reserve Board alsocreated a Commercial Paper Funding Facility through the Federal Reserve Bank of NewYork to avert financial panic spreading into commercial paper markets Loans to banksunder this facility reached US$3500 billion in January 2009 but declined to underUS$1400 billion by June 2009 The Federal Reserve Board also created a TermAuction Facility in December 2009 to ensure liquidity in uninsured interbank lendingmarkets Lending through this facility remained at approximately US$1400 billion intoOctober 2008 but increased to almost US$US5000 billion in March 2009 before
declining to an estimated US$ 3200 billion outstanding in June 2009
8132019 Government Banking and BRICs in the Recent Financial Crisis
httpslidepdfcomreaderfullgovernment-banking-and-brics-in-the-recent-financial-crisis 857
8132019 Government Banking and BRICs in the Recent Financial Crisis
httpslidepdfcomreaderfullgovernment-banking-and-brics-in-the-recent-financial-crisis 957
983106983122983113983107 983111983151983158983141983154983150983149983141983150983156 983106983137983150983147983155 983137983150983140 983110983145983150983137983150983139983145983137983148 983123983156983137983156983141983139983154983137983142983156
9
but should not conceal the counter intuitive modernization of government banksalongside (and often ahead) of private and foreign banks
A third explanation draws from the institutional complementarity hypothesis toargue that different policies in BRICS captured particular complementarities in bankingand finance to avert more severe impacts on economic activity This is a promising
approach but one that exceeds our ability to retrace the domestic policies amidst crisisacross four major countriesA fourth explanation is taken from the World Capitalist System approach and
focuses on the profound structural changes implied by recent growth and betteradjustment in BRIC countries This perspective also provides significant opportunitiesfor reflection and interpretation that must remain beyond the scope of this paper Theemergence of BRIC nations as driving force in the global economy is a fundamentallynew situation for theories of center-periphery north-south dependent development andtheories that focus on the specific trajectories of nations in what used to be called latelate development
A final explanation of why BRIC countries have fared comparatively better in
the face of global financial crisis is scale The very large size of these economiesprovided policy options unavailable to smaller countries From this perspective closedeconomies are less subject to the impacts of sudden stops in foreign finance during andafter the financial crisis and less exposed to export declines during global downturnsMoreover large closed BRIC economies retain options of turning away from exportstoward domestic investment and consumption a characteristic especially importantgiven atrocious income distribution and social exclusion This dimension also remainsbeyond the scope of this paper on public banking and domestic financial statecraft
Unless we are mistaken these explanations are complementary to our core claimsthat government banks made a difference in terms of avoiding the creation of asset bubblesrealizing competitive advantages over private and foreign banks since liberalization andproviding counter cyclical policy alternatives to ameliorate downturn Case studies of theBRICs follow
Brazil
We begin with Brazil Our research on Brazil suggests that since price stability the return todemocracy and liberalization of the banking system in 1995 federal banks have realizedcompetitive advantage over private and foreign banks while providing policy alternatives topolitical and social forces This article extends this argument to suggest that these institutionshave modernized amidst liberalization and globalization across BRIC countries ldquojust in timerdquo
to retain client confidence and provide counter-cyclical credit to avert domestic downturns inthe face of global crisis
8132019 Government Banking and BRICs in the Recent Financial Crisis
httpslidepdfcomreaderfullgovernment-banking-and-brics-in-the-recent-financial-crisis 1057
983106983122983113983107 983111983151983158983141983154983150983149983141983150983156 983106983137983150983147983155 983137983150983140 983110983145983150983137983150983139983145983137983148 983123983156983137983156983141983139983154983137983142983156
10
The market shares of government banks private banks and foreign banks in domesticBrazilian credit from 1988-2009 are reported in Figure 1 First the trajectories of credit fromgovernment private and foreign banks suggests that state presence in banking declined during the 1990s through privatization of state government banks However sincecapitalization and reform in 2001 government banks increased market share substantiallyconsistent with our argument that they have modernized to compete alongside private andforeign banks Further comparison of government private and foreign bank policies suggestthat government banks 1) provide more loans per capita 2) provide more counter-cyclicalcredit to help firms and households through economic downturns and 3) hold treasury bonds
for the term rather than trading or unloading a difference that helps reduce market pressuresto shorten the term and increase the cost of government debt
Bank Returns in Brazil and Select Latin American and Reference Countries 2003-20072003 2004 2005 2006 2007
------------------------------------------------------------------------------------------Brazil Government 235 215 265 337
Private 160 262 259 273Foreign 101 61 166 106Bank System 158 176 212 206 224
Argentina -227 -42 70 143 97Chile 167 167 179 186 162
Mexico 161 172 244 262 202Australia 242 228 253 270 281Canada 147 167 149 209 125Spain 132 141 169 199South Africa 116 162 152 183 184---------------------------------------------------------------------------------------------Excludes credits under guarantee Source Bankscope cited in Central Bank of Brazil Financial Stability
Report November 2008 p 56 and Central Bank of Brazil Financial Stability Reports 2004-7
The above table also suggests that government banks have also systematicallyoutperformed private and foreign banks operating in Brazil since capitalization of theseinstitutions to meet Basel II Capital Risk guidelines of the Bank for International Settlements
in 2001 This is an anomaly for theories of private bank efficiency and expectations of liberalreforms in the 1990s Moreover counter-cylical lending exposes government banks to late
983088
983093
983089983088
983089983093
983090983088
983090983093
983091983088
983089 983097 983096 983096
983089 983097 983096 983097
983089 983097 983097 983088
983089 983097 983097 983089
983089 983097 983097 983090
983089 983097 983097 983091
983089 983097 983097 983092
983089 983097 983097 983093
983089 983097 983097 983094
983089 983097 983097 983095
983089 983097 983097 983096
983089 983097 983097 983097
983090 983088 983088 983088
983090 983088 983088 983089
983090 983088 983088 983090
983090 983088 983088 983091
983090 983088 983088 983092
983090 983088 983088 983093
983090 983088 983088 983094
983090 983088 983088 983095
983090 983088 983088 983096
983090 983088 983088 983097
983077
983129983141983137983154
Figure 1 Government Private and Foreign Bank Lending as percent
of Brazilian GDP 1988-2009
983120983154983145983158983137983156983141
983111983151983158983141983154983150983149983141983150983156
983110983151983154983141983145983143983150
8132019 Government Banking and BRICs in the Recent Financial Crisis
httpslidepdfcomreaderfullgovernment-banking-and-brics-in-the-recent-financial-crisis 1157
983106983122983113983107 983111983151983158983141983154983150983149983141983150983156 983106983137983150983147983155 983137983150983140 983110983145983150983137983150983139983145983137983148 983123983156983137983156983141983139983154983137983142983156
11
and non-payment of loans This reduces profits Strategies to ldquoholdrdquo government securitiesalso reduce profits Nonetheless government banks have reported stronger returns thanforeign and domestic banks on average since capitalization in 2001
The above data may conceal bad banking practices such as crony credit bad loans andcosts that in the end must be passed on to others through fiscal accounts or the money supply
Data from the Central Bank of Brazil help control for these possibilities and provide furthercomparison of bank performance This section compares government private and foreignbanks in terms of the Basel Index bad credit late loans and stress tests that estimate theimpact of hypothetical shocks to bank portfolios from foreign exchange devaluation andorcredit problems
First the Basel Index for government domestic and foreign banks from 2002-2006suggests that government banks remain capitalized well above levels set in Central Bank ofBrazil guidelines (110 set in 1999) The Bank for International Settlements suggests an 80level of capital in reserve against possible losses in lending and finance The average BaselIndex for government banks increased from 167 percent in 2002 to 197 percent in 2006 Incomparison the average Basel Index for private domestic banks increased from 151 pecent
to 170 percent during this period while foreign banks on average reported Basel Indexes of152 in 2002 remaining at 154 in 2006 This suggests that government banks in Brazil retainsufficient capital in reserve against risks arising from bad credit or losses in financialmarkets
Bank System Basel Index in Brazil Select Latin American and Reference Countries
2002 2003 2004 2005 2006---------------------------------------------------------------------------------------------Brazil Government 167 148 165 174 197
Private 151 171 183 177 170Foreign 152 167 187 164 154
Chile 141 136 130 125 120Mexico 144 141 145 163 159Australia 100 104 104 104 103Canada 134 133 129 125 121Spain 126 123 122 119South Africa 124 140 127 123 122
---------------------------------------------------------------------------------------------Source Central Bank of Brazil Financial Stability Report 2002-2006Note Basel Index = recommended minimum eleven percent relation between required net worth and risk-
weighted total assets
A closer look at changing Basel indexes reveal the consequences of counter-cyclicallending from federal government banks Because private domestic and foreign banks adoptedmore cautious strategies and provided less credit during the downturn of 2002 theseinstitutions maintained levels of capital reserves above levels found in government banksThe average Basel index for the domestic financial system thus remained roughly the same atyear-end 2002 (06 percent increase to 162 over June 2002) However this average concealsan increase of 21 percent in the Basel Index for private banks (largely meaning they chose tohold low risk rated government paper) and a decline of 23 percent of the Basel Index forgovernment banks (meaning they incurred risks to lend during downturn and adjustment)Before assuming the worst readers should note two matters First the Central Bank of Brazilrequires banks to maintain a Basel Index of 110 This is three points greater than the 80
8132019 Government Banking and BRICs in the Recent Financial Crisis
httpslidepdfcomreaderfullgovernment-banking-and-brics-in-the-recent-financial-crisis 1257
983106983122983113983107 983111983151983158983141983154983150983149983141983150983156 983106983137983150983147983155 983137983150983140 983110983145983150983137983150983139983145983137983148 983123983156983137983156983141983139983154983137983142983156
12
suggested in the 1988 Basel Accord and subsequent revisions for capital guidelines In otherwords Brazilian banks set aside almost half again more in additional capital reserves thanlevels recommended by the Bank for International Settlements Second the different BaselIndex ratings of government and private banks also reflects the greater weight of credit andtherefore credit risk in these institutions And data on bad and late loans since 2001 suggest
that the slight and temporarily higher levels of average Basel Indexes reported by governmentbanks do not reflect broader deterioration of portfoliosFurthermore Banks in Brazil and especially government banks tend to be more
conservative setting aside not only frac12 of deposits as compulsory reserves at the Central Bankof Brazil but also retaining additional reserves against bad loans and losses Firstcomparative data suggests that Brazilian banks tend to set considerably larger sums aside inreserve against bad loans and other losses Of the four large Latin American countries andfour further economies reported by the IMF and Central Bank of Brazil Brazil retainedsubstantially larger reserves against bad loans than any country except Spain during 2007This confirms the particular characteristics of banking in Brazil that of a higher cost andlower operating efficiency combined with larger reserves and provisions against losses
Bank Reserves as Percent of Overdue amp Late Loans in Brazil Select Latin American andReference Countries
2003 2004 2005 2006 2007 2008---------------------------------------------------------------------------------------------Brazil 3200 3719 2874 2800 2862 2709Argentina 792 1029 1251 1303 1303Chile 1309 1655 1776 1985 2107Mexico 1671 2018 2321 2074 1947Australia 1318 1829 2030 2052 1889Canada 435 477 493 553 449Spain 2454 2196 2518 2733South Africa 542 613 643---------------------------------------------------------------------------------------------Source IMF Global Financial Stability Report 2008 cited in Central Bank of Brazil Financial Stability
Report November 2008 p 56
The level of bad and late loans in bank portfolios is another measure of bank solidityThe convergence of bad credit levels in government private and foreign banks from 1988-2008 introduced this study Further comparison suggests that although government banksretain higher levels of bad and late loans in specific sectors (especially home loans) the value
of late loans as a percent of total loans in government banks fell below levels in private andforeign banks during 2008 (See table on following page) The value of bad credit (loans over12 months past due) in government banks decreased from R$372 billion in 2001 to R$149billion in June 2006 This places the value of bad credit in government banks below the valuefound in private and foreign banks Bad credit in private banks increased from R$173 billionin 2001 to peak at R$255 billion during 2003 declining to R$180 billion in 2006 Foreignbanks also reported increased values of bad credit from R$123 billion in 2001 peaking atR$141 billion in 2003 and declining to R$130 billion in 2006 While late loans remained 85percent of total loans in government banks in 2001 (above 75 percent in private and 65percent in foreign banks) by 2008 the relation reverses In 2008 late loans declined to 32percent of total loans at government banks while remaining at 37 percent in private banksand 45 percent in foreign banks
8132019 Government Banking and BRICs in the Recent Financial Crisis
httpslidepdfcomreaderfullgovernment-banking-and-brics-in-the-recent-financial-crisis 1357
983106983122983113983107 983111983151983158983141983154983150983149983141983150983156 983106983137983150983147983155 983137983150983140 983110983145983150983137983150983139983145983137983148 983123983156983137983156983141983139983154983137983142983156
13
Moreover government banks in Brazil continue to set aside greater provisions againstbad and late loans than private or foreign banks In 2004 government banks retained 86percent of the value of total loans in provision against losses from non-paying loans whileprivate banks retained 60 percent and foreign banks 51 percent In 2008 the level ofprovisions at government banks had declined on average to 68 percent but still remained
well above the levels of 52 and 51 percent recorded at private and foreign banks
Late Loans and Provisions in Government Private and Foreign Banks 2001-2008
Government Banks Private Banks Foreign Banks--------------------------- ----------------------------- -----------------------------R$bi R$bi R$bigt12m Late Provision gt12m Late Provision gt12m Late Provision
----------------------------------------------------------------------------------------------------------------2001 372 85 173 75 123 652002 394 55 202 73 141 60
2003 326 70 255 74 159 662004 133 35 86 160 31 60 102 32 512005 134 39 81 163 35 59 107 35 482006 149 42 68 180 44 66 130 45 532007 35 75 37 55 43 502008 32 68 37 52 45 512009 30 56 612010 20 47 40 66 41 532011 20 43 46 71 50 58----------------------------------------------------------------------------------------------------------------Note Bad credit = loans past due over 12 months Late = percent of total loans gt120 days overdue
Provision = percent of total loan value set aside as reserves against losses Empty cells reflect lack of databecause of changing reporting standards at Central BankSource Central Bank of Brazil Financial Stability Report November 2008 p 56 and 2002-2006
Again in comparative perspective the levels of late loans in Brazilian bankingremains significantly higher than other countries Table 213 reports the value of late loans asa percent of bank portfolios in Brazil select Latin American and further countries forreference This suggests that differences found in Brazilian government banks have to dowith differences in the banking system such as judicial preference for debtors over creditorsrather than the inferior performance of government banks
Late Loans as percent of Total Loans in Brazil Select Latin American and ReferenceCountries
2003 2004 2005 2006 2007----------------------------------------------------------------------------------------------------------------Brazil 39 30 35 37 32Chile 16 12 09 08 08Mexico 28 22 18 21 25Australia 03 02 02 02 02Canada 12 07 05 04 04Spain 17 17 16 14 11South Africa 24 18 15 11 12
---------------------------------------------------------------------------------------------------------------- Does not include credits covered by guaranteeSource Bankscope cited in Central Bank of Brazil Financial Stability Report November 2008 p 56
8132019 Government Banking and BRICs in the Recent Financial Crisis
httpslidepdfcomreaderfullgovernment-banking-and-brics-in-the-recent-financial-crisis 1457
983106983122983113983107 983111983151983158983141983154983150983149983141983150983156 983106983137983150983147983155 983137983150983140 983110983145983150983137983150983139983145983137983148 983123983156983137983156983141983139983154983137983142983156
14
Further comparative data confirms that the Brazilian banking system tends to run onmore expensive credit higher returns and profits and higher levels of late and bad loansBanks operating in Brazil also retain higher levels of administrative and personnel costsHowever Brazilian banks also tend to set aside more generous reserves and provisions
against losses These structural characteristics can be seen in the comparative data in the tablebelow The data on government private and foreign banks in Brazil and comparisons suggestthat the Brazilian banking system incurs higher operating costs maintains higher reservesprovisions and capital against losses and risk but nonetheless produces strong returns
Indicators of Bank Efficiency Performance and Provisions in Brazil Select Latin Americanand Reference Countries
Cost Op Exps NPL Provisions EquityIncome Assets Loans NPL Assets
----------------------------------------------------------------------------------------------------------------
Brazil 62 65 41 153 9Argentina 84 41 66 116 12Chile 53 28 10 166 7Colombia 52 59 32 144 11Mexico 58 47 20 232 12US 54 33 07 163 8Spain 56 16 07 313 12----------------------------------------------------------------------------------------------------------------Source World Bank ldquoBrazil The Industry Structure of Banking Servicesrdquo Brasiacutelia June 2007 pp
Comparison of administrative costs in Brazilian banking with levels in other large
Latin American and emerging and reference economies suggest that Brazilian banks retainhigher costs From 2001 through 2005 the value of administrative costs as a percent of bankassets in Brazil declined from 69 percent to 58 percent but remained significantly abovelevels reported from Chile (30 to 27 percent) Mexico (47 to 46 percent) and well abovereference countries such as Australia Canada and Spain (16 36 and 11 percentrespectively) Although time series lacks comparison after 2005 administrative costs inBrazilian banks decline significantly from 58 in 2005 to 42 in 2008
Bank Administrative Costs in Brazil Select Latin American and Reference Countries (Assets)
2001 2002 2003 2004 2005 2006 2007 2008-------------------------------------------------------------------------------------------------Brazil 69 61 60 61 58 55 51 42Chile 30 30 27 27 27Mexico 47 48 46 43 46Australia 17 17 16 16 16Canada 27 27 27 27 26Spain 17 17 16 14 11-------------------------------------------------------------------------------------------------- Adjusted average of total assetsSource Bankscope cited in Central Bank of Brazil Financial Stability Report November 2008 p 56
A final comparison of government private and foreign bank solidity is based onCentral Bank of Brazil estimates of the impact of hypothetical shocks to the Brazilian
8132019 Government Banking and BRICs in the Recent Financial Crisis
httpslidepdfcomreaderfullgovernment-banking-and-brics-in-the-recent-financial-crisis 1557
983106983122983113983107 983111983151983158983141983154983150983149983141983150983156 983106983137983150983147983155 983137983150983140 983110983145983150983137983150983139983145983137983148 983123983156983137983156983141983139983154983137983142983156
15
economy on domestic banks These estimates are based on the revisions of the widely usedValue-at-Risk estimates proposed by Boudoukh Richardson and Whitelaw that adapts theoriginal VaR method developed and commercialised by JP Morgan19
Stress Tests for Impact of Credit Interest Rate and Foreign Exchange Shock on Basel Index
Comparison of Government Domestic and Foreign Banks 2001-2006
2002 2003 2004 2005 2006-------------------------------------------------------------------------------------------------------------
Government 112 104 114 113 109Domestic 112 132 126 121 103Private 103 131 135 108 84-------------------------------------------------------------------------------------------------------------Source Central Bank of Brazil Financial Stability Reports 2002-2006Note Basel Index = Capital risk guideline measure defined by Bank for International Settlements BaselCommittee that recommends 8 percent relation between PR and total assets weighted by risk level Since 2002Central Bank of Brazil minimum requirements of Basel Index remains 11 percent For methods of calculationsee Central Bank of Brazil Financial Stability Report Brasilia 2006 p 76
Central Bank of Brazil tests estimate that in the face of foreign currency valuationand interest rate shock government banks would nonetheless remain at or slightly below thecapital requirements against credit risk recommended by the central bank Again it should benoted that Basel Index levels recommended in the BIS Capital Requirements guidelines forthe Basel Index of banks are 80 while the Central Bank of Brazil has set minimum BaselIndex levels of 110 Given that federal government bank portfolios include more credit thanprivate banks and especially foreign banks the estimate of a shift to 109 in the averageBasle index for federal government banks in the face of a credit shock provides furtherevidence that these financial institutions are solid and their capital reserves sufficient Insum comparison of results for government private and foreign banks in the estimatesreported by the Central Bank of Brazil of the likely impact of a shock to the Brazilianeconomy in terms of interest rates and foreign exchange rates also suggests that governmentbanks appear solid The average Basel Index reported for government banks in this stress testwas 135 above the 110 Central Bank of Brazil guideline and well above the 80 levelsuggested by the BIS
Understanding the capacity of Brazilian banks to cope with shocks and risk is not justa theoretical exercise Since the currency crisis in Mexico during 1994-1995 the newlystabilized currency was tested by shocks from home and abroad Policies first dramaticallyincreased interest rates under a fixed exchange rate regime then freed the real to devalue
under a flexible foreign exchange rate regime in January 1999 The Asian currency crisesduring second semester 1997 led the Central Bank of Brazil to increase benchmark Selicinterest rates to 434 percent in November In August 1998 the declaration of moratorium onforeign debt payments by Russia the central bank to once again increase Selic interest ratesfrom 20 to 40 percent under the fixed exchange rate regime by November of that year Theseshocks from abroad coincided with preparations for national elections during 1998 leadingthe IMF and other official creditors to provide strong support for the Brazilan governmentNonetheless by January 1999 (after the election) market pressure led to the abandonment ofthe fixed foreign exchange rate regime that had served as nominal anchor for economic
19 Calculation first published in Resenha BMampF Vol 122 1998 (described in Central Bank of Brazil
Financial Stability Report 2002 amp 2003 then as Boudoukh Jacob Matthew Richardson RichardStanton amp Robert Whitelaw ldquoMaxVaR Long Horizon Value at Risk in a Mark-to-Market Environmentrdquo Journal of Investment Management 2004Vol 2 No 3 pp 14-19
8132019 Government Banking and BRICs in the Recent Financial Crisis
httpslidepdfcomreaderfullgovernment-banking-and-brics-in-the-recent-financial-crisis 1657
983106983122983113983107 983111983151983158983141983154983150983149983141983150983156 983106983137983150983147983155 983137983150983140 983110983145983150983137983150983139983145983137983148 983123983156983137983156983141983139983154983137983142983156
16
policy since 1994 The real quickly devalued from 121 to 20 against the US dollar by theend of January and led to considerable changes in policy (a flexible foreign exhange rateregime inflation targeting and the implementation of further fiscal reforms) Once the realrevalued from R$22 against the dollar in March to R$166 in April 1999 the governmentmoved to consolidate this new triad of economic policies Since 1999 flexible foreign
exchange markets inflation targeting and fiscal reform have remained in place This suggeststhat Brazilian banks have weathered volatile parameters and large risks during a markedpolitical business cycle One involving the transition from reformist President Cardoso to PTPresident Lula Since recovery of the economy during 2004 the coalition government underPT President Lula has sought to expand the contribution of government banks to accelerategrowth and social inclusion These policies have not undermined economic fundamentals oreroded the institutional foundations of comparative advantage retained by Brazilian federalgovernment banks
In sum the advances of Brazilian banking toward Basel Accord regulations during the1990s and 2000s the adoption of more transparent and timely reporting standards and themodernization of government banks under pressures from liberalization placed federal banks
in a new situation in the face of crisis once it hit the country in 2008 A closer look at the bigthree federal government banks is in order to better understand these changes
The Banco do Brasil
Upon taking office in 2003 President Lula retained the central economic policies of theCardoso administration such as inflation targeting tight fiscal and monetary policy andthe operational independence of the Banco do Brasil However the recovery of investorconfidence during 2003 and the return of stronger growth levels during 2004 led to aperiod of what the Central Bank of Brazil describes as organic growth at the Banco doBrasil From 2004-2008 the Banco do Brasil contributed to the deepning of domesticcredit markets and emerged as leading investment bank at the Bovespa stock marketFurthermore once the Bovespa collapsed credit became short and a sharp downturnensued during 2008 the Banco do Brasil provided emergency loans infusions of capitalthrough stock purchases and the acquisition of small and mid-sized firms and banksunable to weather the sharp decline and lack of credit Although the merger of Itauacute andUnibanco in 2008 displaced the Banco do Brasil as the largest financial institution inLatin America the bank retains powerful institutional foundations of comparativeadvantage and networks that cross Brazilian society politics and markets
The Banco do Brasil also remains at the center of Brazilian politics and policydisputes Indeed leaders of the PT party faction articulaccedilatildeo (articulation) includes
career employees of the Banco do Brasil and presidents of the Brazilian bank workersunion such as Luiz Gushiken and Ricardo Berzioni Both were nominated to ministerialposts by President Silva in January 2003 By August 2003 21 of 33 top positions at theBanco do Brasil had been filled by new representatives of the PT most Banco do Brasilemployees and members of the Brazilian bank workers union Critics decriedpoliticization However the resistance of bank representatives described above topresidential appeals to increase credit during 2003 was followed by more neutralappointments during 2004 When Banco do Brasil President Cassio Casseb Limaresigned in November 2004 (under charges of irregularities in consulting contracts atthe bank) President Lula nominated Rossano Maranhatildeo Pinto a career employee andBanco do Brasil vice president to head the bank Further appointments of PMDB
political leaders to cement support for the PT coalition government were also criticizedas politicization of the bank However Banco do Brasil officials responded that these
8132019 Government Banking and BRICs in the Recent Financial Crisis
httpslidepdfcomreaderfullgovernment-banking-and-brics-in-the-recent-financial-crisis 1757
983106983122983113983107 983111983151983158983141983154983150983149983141983150983156 983106983137983150983147983155 983137983150983140 983110983145983150983137983150983139983145983137983148 983123983156983137983156983141983139983154983137983142983156
17
experienced political leaders of the PMDB brought competitive advantages to the bankbased on their networks that cross the public and private sector These networks andrelations during the second PT coalition government of President Lula also appearsdifferent than the first given the departure from core offices of the presency bylongtime advisors to Lula that came from the Banco do Brasil and bank workers union
By late 2006 only one of seven vice presidents of the Banco do Brasil was a member ofPresident Lulaacutes Workersacute Party (PT)Again Banco do Brasil policies and growth since recovery of the economy in
2004 involved first a period of expansion during four years of growth followed by aturn to counter cyclical lending and finance once financial crisis abroad produced first asevere contraction in credit supply then a sharp economic downturn in fourth quarter2008 Institutional foundations of comparative advantage are behind Banco do Brasilpolicies during both periods First the capitalization of Brazilian firms on the Bovespastock market is closely related to the groups that cross politics government banks thepowerful bank worker labor union the Banco do Brasil employee private pension fundand bank consortia often led by the Banco do Brasil investment banking division (often
joined by the BNDESpar and Caixa investment banking division) Recent developmentsare complex and will require further research However rather than convergence towardprivate banking and a market-centered financial system examination of Banco do Brasilpolicies and market shares during the 2000s suggests that federal government banks notonly remain at the center of politics policy and development strategies but that theseinstitutions have modernized to compete against private and foreign banks
The large scale and scope of the Banco do Brasil has permitted use of the bankfor counter-cyclical lending and leadership in capital markets without deteriorating bankbalance sheets Since 2003 the Banco do Brasil has remained well within domesticbank regulations and Basel Accord guidelines During 2002 and 2003 reforms at theBanco do Brasil sought to reduce costs and increase efficiency ratings Indeed therelation between the Banco do Brasil and President Lula reversed past patterns In the1950s conflicts were between national developmentalist groups at the Banco do Brasiland more orthodox Ministers of Finance In 2003 and once again during the 2008financial crisis differences between President Lula and the Banco do Brasil were thereverse Banco do Brasil management refused to dramatically increase loans in 2003and resisted requests to reduce the price of credit in 2008 In 2003 the caution imposedby political risk perceptions led President Lula to respect the operational autonomy ofthe Banco do Brasil In April 2009 Banco do Brasil President Antonio Francisco deLima Neto was fired after refusing to reduce interest rates on loans This reversal ofpolicy positions from the 1950s suggests in a broader sense a transition from the
macroeconomics of populism to the microeconomics of government banking in the 21
st
century Government banks do not provide easy or all solutions Instead credit andfinance policies are subject to market discipline credit risk analysis and the realities ofbusiness cycles
Review of the Banco do Brasilrsquos balance sheet from 2002-2008 suggests that the bankdeveloped organically from 2002-2007 with gradual increases reflecting the competitiveadvantages at the top of Brazilian banking and finance Policies changed during 2007 and2008 as the credit shortage caused by international financial crisis led to the Banco do Brasilassuming once again lending of last resort functions by extending interbank investments andloans to small and medium sized banks to avert further declines in domestic liquidity TheBanco do Brasil also acquired a 51 percent stake in the Votarantim bank to avert a run on
deposits and possible failure while acquiring Satildeo Paulo state government savings bankNossa Caixa for R$76 billion in 2008 These acquisitions reflect concern about the
8132019 Government Banking and BRICs in the Recent Financial Crisis
httpslidepdfcomreaderfullgovernment-banking-and-brics-in-the-recent-financial-crisis 1857
983106983122983113983107 983111983151983158983141983154983150983149983141983150983156 983106983137983150983147983155 983137983150983140 983110983145983150983137983150983139983145983137983148 983123983156983137983156983141983139983154983137983142983156
18
replacement of the Banco do Brasil as the largest financial conglomerate in Brazil after themerger of Itauacute and Unibanco
Banco do Brasil Balance Sheet Summary 2002-2008 R$ billion
2002 2003 2004 2005 2006 2007 2008 2009 2010 2011Assets --------------------------------------------------------------------------------------------------------Interbank Investments 101 50 27 80 175 434 951Interbank Deposits 76 283 137 209 116 77 242Securities 709 696 734 664 731 752 732Central Bank Deposits 81 186 221 244 281 334 212Loans to Private Sector 89 652 757 885 1178 1463 1810Loans to Public Sector 56 43 41 37 43 24 230Receivables 297 273 312 351 404 548 808Other AssetsTotal Assets 2046 2301 2390 2529 2963 3672 5073Liabilities ---------------------------------------------------------------------------------------------------Deposits 972 1100 1155 1376 1588 1882 2711
M MKT Borrowing 483 400 445 305 492 722 914Treasury amp BNDES 59 74 106 133 143 175 224Shareholder Equity 92 121 141 168 207 242 299Other LiabilitiesTotal Liabilities 2046 2301 2390 2529 2963 3672 5073---------------------------------------------------------------------------------------------------------------- Compulsory deposits for commercial banks according to Central Bank regulationsSource Banco do Brasil Annual Reports Historical Series 2002-2008
From 2002 through 2006 the balance sheet of the Banco do Brasil suggests a periodof growth based on loans to the private sector with deposits and shareholder equityincreasing largely apace After 2006 the balance sheet changes fundamentally with capitalinjections from money market borrowing increasing from R$492 billion in 2006 to R$914billion in 2008 while Banco do Brasil liabilities with Treasury and BNDES increased fromR$143 billion in 2006 to R$224 billion in 2008 The asset side of the balance sheet alsosuggests fundamental change Private sector lending increased from R$1178 billion in 2006to R$1810 billion in 2008 reflecting acquisition of portfolios from Nossa Caixa Interbankinvestments increased from R$175 billion in 2006 to R$951 billion in 2008 while interbankdeposits also increased from R$116 billion in 2006 to R$242 billion in 2008 The counter-cyclical lending strategies of the Banco do Brasil during 2008 also included an increase oflending to the public sector from R$24 billion in 2007 to R$230 billion Banco do Brasilreponses to government credit policy can also be seen in the release of 40 percent of
compulsory deposits retained at the central bank Banco do Brasil deposits at the central bankdeclined from R$334 billion in 2007 to R$212 billion in 2008 ndash freeing this value for loansand investments
Networks and relations during the second government of President Lula appeardifferent than the first given the departure from core offices of the presency by longtimeadvisors to Lula that came from the Banco do Brasil and bank workers union By late 2006only one of seven vice presidents of the Banco do Brasil was a member of President LulaacutesWorkersacute Party (PT) The corporate profile of the Banco do Brasil suggests once again thehybrid character of this government bank one listed on the Bovespa Novo Mercado but withover 65 percent of shares owned by the Brazilian federal government Treasury
8132019 Government Banking and BRICs in the Recent Financial Crisis
httpslidepdfcomreaderfullgovernment-banking-and-brics-in-the-recent-financial-crisis 1957
8132019 Government Banking and BRICs in the Recent Financial Crisis
httpslidepdfcomreaderfullgovernment-banking-and-brics-in-the-recent-financial-crisis 2057
983106983122983113983107 983111983151983158983141983154983150983149983141983150983156 983106983137983150983147983155 983137983150983140 983110983145983150983137983150983139983145983137983148 983123983156983137983156983141983139983154983137983142983156
20
customers in 2008 reached 479 million with the bank retaining 39700 AMTs and 766million bank cards (239 million credit cards and 527 million debit cards) Like the CaixaEconocircmica Federal the Banco do Brasil also processes government payments withretirement and social security payments numbering 745 million transactions during 2008Although this implies administrative costs (and receipts) this also brings customers and
prospective customers into Banco do Brasil branch officesDuring 2008 the Banco do Brasil continued to expand operations form jointventures acquire private and government banks and modernize operations A secondaryoffering of stock in January 2008 granting of shares by VISA to the Banco do Brasil andupgrading of the bank to investment grade BB- by Standard amp Poors in April 2008 suggestthat market orientation of the bank continues during the Lula administration despite counter-cyclical credit policies A Lower Income Segment Department was also created to assumeBanco Popular do Brasil operations along with correspondent banking relations and regionalsustainable development programs The Banco do Brasil also received permission to usesavings accounts for home loans enabling the bank to compete on level ground with CaixaEconocircmica Federal During 2008 the Banco do Brasil also acquired the state government
banks Banco do Piaui Banco de Santa Catarina (33rd largest bank in Brazil with US$30billion assets at year end 2007) and Satildeo Paulo government savings bank Nossa Caixa (12thlargest Bank in Brazil with US$267 billion in assets at year end 2007) In sum the diversecorporate divisions and financial operations of the Banco do Brasil provided policy optionsduring 2008 to counter the credit shortage and help firms and domestic banks to adjust
Banco do Brasil and Private Bank Returns and Capital Adequacy 2002-2009
Basel Index Return on Assets Return on Liquid Assets----------------------------- ----------------------------- -----------------------------BB Itauacute Bradesco BB Itauacute Bradesco BB Itauacute Bradesco
--------------------------------------------------------------------------------------------------------------2002 122 184 179 12 26 20 302 288 2832003 137 198 199 11 28 16 231 297 2282004 152 206 188 13 30 23 240 292 3092005 171 170 173 12 37 26 187 353 2842006 173 171 188 28 31 25 267 288 2632007 156 179 156 14 32 22 222 321 2442008 152 161 169 25 19 16 304 221 2112009 150 165 166 12 13 14 238 182 195-------------------------------------------------------------------------------------------------------------- Annualized first quarter 2009 resultsSource Banco do Brasil Itauacute and Bradesco Annual Reports 2002-2009
Comparison of Banco do Brasil returns and capital adequacy with the two majorprivate Brazilian banks Itauacute and Bradesco suggests that the performance and solidity of theBanco do Brasil remains equal or superior to private banks During 2002 and 2003 thecapital adequacy of the Banco do Brasil and return on assets remained below levels reportedby the two largest Brazilian private banks suggesting the impact of counter-cyclical lendingHowever after 2004 the Basel index of the Banco do Brasil reached 171 far above BISstandards of 80 and Central Bank of Brazil requirements of 110 Furthermore from 2006through first quarter 2009 returns on assets returns on liquid assets and the Basel index ofthe Banco do Brasil exceed levels reported by Itauacute and Bradesco In sum despite providingcounter cyclical credit and despite having been replaced by the Itau-Unibanco merger as the
8132019 Government Banking and BRICs in the Recent Financial Crisis
httpslidepdfcomreaderfullgovernment-banking-and-brics-in-the-recent-financial-crisis 2157
983106983122983113983107 983111983151983158983141983154983150983149983141983150983156 983106983137983150983147983155 983137983150983140 983110983145983150983137983150983139983145983137983148 983123983156983137983156983141983139983154983137983142983156
21
largest Brazilian bank the performance and capital adequacy of the Banco do Brasil remainsat or above levels reported by the two largest private banks
In sum since liberalization of banking and finance and privatization of stategovernment banks during the 1990s the Banco do Brasil has been transformed from directstate owned bank into one of two very large financial conglomerates that dominate domestic
banking in Brazil Instead of retaining easy access to funds at Treasury to cover losses theBanco do Brasil has adopted international corporate governance standards to become listedon the Bovespa Novo Mercado and retains an important role in virtually every aspect ofBrazilian banking and finance Although sale of shares in the 1990s were designed to transfercorporate governance and control of the national bank to the private sector the federalgovernment retains 65 percent of stocks after two sale of stocks capitalized the bank duringthe 2000s The massive size and wide scope of Banco do Brasil networks across bankingfinancial markets political and social forces and business have led the bank to realize recordprofits during the period of growth from 2004-2008 and provide counter-cyclical credit toavert a further decline in industrial activity and the economy as the US and global financialcrisis hit Brazil first with a 50 percent decline in the Bovespa stock market and credit
shortage followed by a steep but short decline in industrial production in late 2008 Thetransparency of Banco do Brasil quarterly reports and advances in Central Bank of Brazilsupervision of domestic banking clarify the new tensions that have emerged during the PTgovernment of President Lula These tensions reflect the modernization and competitiveadvantages of the Banco do Brasil
Caixa Econocircmica Federal (Federal Savings Bank Caixa)
The third largest domestic bank the wholly government owned Federal Savings Bank Caixawas also called on by President Lula during the recent financial crisis to increase the pace ofgrowth provide counter cyclical credit during downturns and to reduce consumer andcorporate interest rates and bank spreads Review of balance sheets and policies since 2001suggest that the Caixa retains its core business in urban development home loans real estatetransfer of funds for government programs and services and lottery administration Howeverinvestment banking management of third party funds and the creation of of new products andservices have both increased profits and increased popular access to banking and socialservices The bank has recorded record profits since R$108 billion (2002) R$16 billion(2003) and R$14 billion (2004) The Caixa became the fourth largest Brazilian investmentbank by 2003 while gaining dealer status from the Central Bank of Brazil in primary andsecondary markets for government securities At year-end 2003 the bank retained anestimated R$767 billion of government paper (over ten percent of government paper) in its
portfolio assets earning over R$135 billion that year Since recovery of the Brazilianeconomy in 2004 the Caixa has reported strong profits and continued to improve thestructure of its balance sheet and converge toward international bank reporting standards
In terms of assets deposit base and the number of employees and branches the datasuggest that the Caixa has emerged from a process of rationalization and downsizing duringthe late 1990s and expanded ldquoorganicallyrdquo since capitalization in 2001 Assets declined fromover US$999 billion in 1997 to US$363 billion in 2002 after reorganization andcapitalization Deposits also declined from US$541 billion in 1997 to US$216 billion in2002 The number of employees and branches declined from 104253 and 2316 to 98971 and1803 respectively but returned to 104934 and 2428 by 2006 After reorganization andcapitalization in June 2001 Basel indexes and the ratio of fixed assets over equity indicate
substantial reform and transition toward international banking standards The Basel Index thatmeasures the adequacy of capital reserves against possible losses and risks increased from
8132019 Government Banking and BRICs in the Recent Financial Crisis
httpslidepdfcomreaderfullgovernment-banking-and-brics-in-the-recent-financial-crisis 2257
983106983122983113983107 983111983151983158983141983154983150983149983141983150983156 983106983137983150983147983155 983137983150983140 983110983145983150983137983150983139983145983137983148 983123983156983137983156983141983139983154983137983142983156
22
135 (49 in March 2001 before capitalization) to reach 278 and remain twice above theCentral Bank minimum of 110 at 252 in 2006 The ratio of fixed assets as a proportion ofequity also declines substantially from 638 at year end 2001 to 197 in 2007
Summary of Caixa Structure and Performance 1995-2007
Assets Profits Deposits Employees Branches Basel FAEquity1995 826 672 503 99866 23161996 907 2351 515 99343 21051997 999 875 541 96300 18031998 948 1693 499 94859 18191999 684 1571 344 94194 19192000 644 1362 322 104253 19212001 436 -1265 298 98971 2013 135 6382002 363 1462 216 106548 2147 146 5372003 521 2617 281 100498 2046 192 413
2004 556 2999 345 100164 2135 202 3612005 806 4852 456 106729 2321 278 2012006 981 4874 567 104934 2428 252 1972007 1409 4485 800 106770 2052 288 1282008 1266 5735 708 103895 2069 206 119
Note Assets amp Deposits = US$billion Profits = US$million Basel = BIS Basel Accord index of capital reserveadequacy FAEquity = Fixed Assets Equity a summary indicator of bank modernizationSource Central Bank of Brazil Top 50 Banks in Brazil available at wwwbcbgovbr
Caixa Annual Reports and transition toward Central Bank and international bankaccounting standards introduce breaks in the time series of financial performance after 2001
However international bank reporting standards have been used by the Caixa since 2005 andthe data provide further view of the policies and performance of the bank Table X reportsreturns on stockholder equity assets Basel solvency index immobilization index provisionsas a percent of credit operations bank efficiency index and coverage of personnel costs Thedata are consistent with the broader comparisons reported in chapter two that suggest highprofits and returns alongside higher levels of provisions and reserves against capital riskReturns on stockholder equity have remained above 20 percent per year reaching 306percent in 2008 Returns on liquid assets remained between 09 percent and 13 percentbelow the average levels recorded by private and foreign banks The Basel Index of the Caixaremained well above the 11 percent level required by the Central Bank declining from 279in 2005 to 206 in 2008
Caixa Performance Indicators 2005-2008
Indicator 2005 2006 2007 2008 2009 2010 2011--------------------------------------------------------------------------------------------------------------------------Return on Shareholder Equity 261 260 226 306Return on Liquid Assets 11 11 09 13Basel Solvency Index 279 253 289 206Immobilization Index 201 197 129 120Provisions as Credit Operations 101 98 91 86Efficiency Index 645 642 755 718Coverage of Personnel Costs 925 896 943 868
---------------------------------------------------------------------------------------------------------------------------Source Caixa Econocircmica Federal Relatoacuterios de Administraccedilatildeo 2005-2011
8132019 Government Banking and BRICs in the Recent Financial Crisis
httpslidepdfcomreaderfullgovernment-banking-and-brics-in-the-recent-financial-crisis 2357
983106983122983113983107 983111983151983158983141983154983150983149983141983150983156 983106983137983150983147983155 983137983150983140 983110983145983150983137983150983139983145983137983148 983123983156983137983156983141983139983154983137983142983156
23
The immobilization index of the Caixa also declined from 201 percent in 2005 to120 percent in 2008 suggesting transition toward standard levels of international bankingHowever the value of provisions as a percent of credit operations remains much higher thaninternational bank practices albeit declining from 101 percent in 2005 to 86 percent in2008 Finally both the substantial increase in efficiency index from 645 to 718 percent
suggests that the Caixa has distanced further from international private bank levels that tendto approach 500 percent This has resulted in the declining level of coverage of personnelcosts and indicates the comparatively larger organizational structure and less use ofoutsourced labor at the Caixa
Caixa Deposits and Sources of Funds 2005-2008 R$million
2005 2006 2007 2008 2009 2010 2011----------------------------------------------------------------------------------------------------------------Bank Deposits 692 863 1155 1320Savings Deposits 5328 6006 7560 9255Mid-Term Savings Deposits 3873 4219 4136 4862
Certificates (1270) (1412) (1244) (1831)Escrow (2602) (2806) (2891) (3031)
Funds and Programs 794 1034 1307 1100Other 009 015 019 013Caixa Total 10690 2139 14179 6552Bank System Total 68268 78148 92672 27482Caixa Deposits as Total (156) (155) (1531) (129)----------------------------------------------------------------------------------------------------------------Source Caixa Econocircmica Federal Relatoacuterios de Administraccedilatildeo 2005-2008
The liability side of Caixa balance sheets from 2005-8 suggests that the bank hasdistanced itself from reliance on official savings programs and funding toward consumerbank and savings deposits Bank deposits increased from R$69 billion in 2005 to overR$132 billion in 2008 Savings deposits increased from R$532 billion in 2005 to overR$925 billion in 2008 Furthermore the increase of mid-term savings deposits originatedfrom sale of savings certificates instead of escrow held by the Caixa the latter subject to
judicial review and removed from balance sheets in 2008 The value of funds deposited at theCaixa from government funds and programs increased from R$79 billion in 2005 to R$110billion in 2008 although it remains less than ten percent of total deposits In terms of totalvalue of deposits and savings the Caixa increased total value of deposits from 107 billion toover 165 billion from 2005-8
Caixa Loans 2005-8 R$ million2005 2006 2007 2008 2009 2020 2011
----------------------------------------------------------------------------------------------------------------Commercial 14652 16329 19134 28854
Consumer 8925 9474 11063 13747Business 5727 6854 8071 15107
Home 20208 26113 32475 45075Sewage and Infrastructure 1646 2556 3585 5445Other 690 691 694 689Risk Provision -3773 -4469 -5090 -6900Total Caixa Loans 37195 45689 55888 80062----------------------------------------------------------------------------------------------------------------Source Caixa Econocircmica Federal Relatoacuterios de Administraccedilatildeo 2005-8
8132019 Government Banking and BRICs in the Recent Financial Crisis
httpslidepdfcomreaderfullgovernment-banking-and-brics-in-the-recent-financial-crisis 2457
983106983122983113983107 983111983151983158983141983154983150983149983141983150983156 983106983137983150983147983155 983137983150983140 983110983145983150983137983150983139983145983137983148 983123983156983137983156983141983139983154983137983142983156
24
In terms of lending the data suggests that the primary focus of the Caixa on homeloans continued during the late 2000s although substantial increases in commercial lendingfor consumer credit and businesses suggest the diversification of the Caixa across creditmarkets Since 2005 Caixa lending to consumers and business increased from R$89 billionto R$137 billion and from R$57 billion to R$151 billion respectively in 2008
And unlike the high levels of bad and late credit reported during the adjustment to theend of high inflation in 1994-6 and financial crises (1994-5 1997 1998 1999 2001 2003)the level level of late loans at the Caixa fell substantially during the years of economicgrowth and credit expansion from 2006-2008 The percent of late over total loans at the Caixafell from 68 percent in 2006 to 40 percent in 2008 for commercial loans generally and from62 percent to 59 percent for consumer loans and 75 percent to 22 percent for loans tobusiness The value of late home loans as a percent of total home loans also fell from 31 to17 percent in 2008
Caixa AA-H Credit Classification 2001-8
Days Prov-Late ision 2001 2002 2003 2004 2005 2006 2007 2008 2009 2010 2011
---------------------------------------------------------------------------------------------------------------------------------------AA lt15 0 59 56 66 63 54 50 63 94A lt15 05 243 264 313 288 393 435 401 333---------------------------------------------------------------------------------------------------------------------------------------B 15-30 1 127 126 137 139 143 158 206 271C 31-60 3 203 166 145 169 167 192 194 192D 61-90 10 178 261 207 217 133 60 45 33---------------------------------------------------------------------------------------------------------------------------------------E 91-120 30 18 19 20 20 22 13 09 07F 121-50 50 49 15 15 14 10 07 07 07G 151-80 70 15 08 09 10 08 10 10 09
H gt180 100 104 87 85 77 68 72 61 51R$billion 2094 2353 2614 3016 3855 4736 5739 818---------------------------------------------------------------------------------------------------------------------------------------Source Caixa Annual Reports 2002-2008
The credit risk matrix of Caixa loans from 2001 to 2008 confirms this trend ofimprovement (See above table) The data also provide evidence of greater transparency andthe improvement of bank reporting and accounting standards as well as Central Banksupervision of banks Instead of two categories of credit (good = all loans up to 90 daysoverdue bad = loans over 90 days overdue) the Central Bank of Brazil has adoptedinternational standards of credit classification (from AA to H) and imposed regulations that
banks increase or decrease provisions according to the distribution of loans in thesecategories The scale of provisions required by the Central Bank vary from zero percentagainst loans classified as AA to provision of 100 percent of loan values for credits classifiedas H that is to say over 180 days late
The percent of loans over 180 days late has decreased from 104 percent of total in2001 to 51 percent in 2008 Furthermore all categories of late payment except for loansbetween 15-30 days late decreased significantly from 2001 through 2008 In comparisonloans classified as AA (paid and guaranteed) and A (paid on time) increased from 59 percentto 94 percent and 243 percent to 333 percent of total loans The only category of late loansthat increased over the period is that of loans 15-30 days overdue from 127 percent to 271percent of total
The central argument of this study is that Brazilian federal government banks retaininstitutional foundations of competitive advantage over private and foreign banks Further
8132019 Government Banking and BRICs in the Recent Financial Crisis
httpslidepdfcomreaderfullgovernment-banking-and-brics-in-the-recent-financial-crisis 2557
983106983122983113983107 983111983151983158983141983154983150983149983141983150983156 983106983137983150983147983155 983137983150983140 983110983145983150983137983150983139983145983137983148 983123983156983137983156983141983139983154983137983142983156
25
data that suggests this advantage can be seen in the increasing volume and market share ofthe Caixa in debit and credit cards The number of Caixa debit cards increased from 224million in 2002 to over 482 million in 2008 with Caixa market share of debit cards increasedfrom 196 percent ot total card market in 2002 to peak at 230 percent in 2005 and remainingat 219 percent of the total number of debit cards in Brazil in 2005
Two examples illustrate the institutional foundations of comparative advantage of theCaixa in the card payment industry First like other banks in Brazil the Caixa shares anagreement with Visa for payment processing However unlike other banks in Brazil theCaixa was contracted by the federal government to distribute ATM citizenship cards torecepients of federal government family grants and other transfer programs Apparentlywithout seeking approval the Caixa stamped its brandname on the federal government ATMcitizenship card and has continued to do so despite charges of unfair competition fromprivate domestic banks Furthermore a Caixa request to transform its 110 million ATMcitizenship cards into bank cards currently pending at the Central Bank would dramaticallyincrease the number of bank card holders in Brazil (1824 million at year end 2007)
Caixa Debit and Credit Card Market Shares 2002-2008
Million Debit Cards Million Credit Cards MillionCaixa Total Mkt Caixa Total Mkt Interbank Checks
----------------------------------------------------------------------------------------------------------------2002 224 1142 (196) 16 407 (39) 229502003 280 1254 (223) 18 440 (40) 213602004 320 1491 (213) 20 535 (37) 196702005 377 1639 (230) 25 675 (37) 183902006 384 1744 (220) 31 952 (32) 162202007 400 1824 (219) 39 1177 (33) 144902008 482 42----------------------------------------------------------------------------------------------------------------Source Central Bank of Brazil Diagnoacutestico do Sistema de Pagamentos de Varejo do Brasil Adendo Estatiacutesticondash 2007 p 9 and Caixa annual reports 2003-2008
Having reviewed the Banco do Brasil and Caixa a brief look at the counter-cyclicalpolicies and performance of the third Brazilian federal government bank ndash the BNDES ndash is inorder
Banco Nacional de Desenvolvimento Econocircmico e Social (National Bank for Economic
and Social Development BNDES)
The BNDES is a paradigmatic development bank The trajectory of the BNDES involves asequence of policies and financial practices that have shaped Brazilian development Duringthe 1950s the BNDE supplied direct credits for transportation electric energy infrastructureand steel production During the 1960s the bank diversified under financial reforms Duringthe 1970s the BNDE acted to complete state-led import substitution industrialization bychanneling foreign finance and forced savings into capital goods project lending and regionaldevelopment programs During the 1980s the bank shifted away from public investmentunder pressure of fiscal crisis and foreign debt During the 1990s the BNDES became agentfor the privatization of state owned enterprises The BNDES remained virtually the onlysource of long-term finance during a decade of financial crises in emerging markets (1994-2003) Since 2000 the bank has shifted toward ldquosecond generationrdquo reforms designed tofinance the private sector and free market forces deepen domestic capital and equity markets
8132019 Government Banking and BRICs in the Recent Financial Crisis
httpslidepdfcomreaderfullgovernment-banking-and-brics-in-the-recent-financial-crisis 2657
983106983122983113983107 983111983151983158983141983154983150983149983141983150983156 983106983137983150983147983155 983137983150983140 983110983145983150983137983150983139983145983137983148 983123983156983137983156983141983139983154983137983142983156
26
and lend to small medium and micro-enterprises Since 2004 capital inflows and a boomingdomestic stock market have reinforced the capacity of the BNDES to underwrite long-terminvestments and transform large Brazilian firms into multinational corporations Since 2007BNDES President Coutinho has pursued a full service approach attempting to help star-upsmall and medium firms provide funds to expand successful firms and participate in venture
capital funds to help enterprises transit toward corporate governance standards and initial orsecondary offerings of stock on the Bovespa exchange In 2008 as financial crisis led to ashortage of credit collapse of share prices and sharp decline in industrial production byfourth quarter 2008 the BNDES also provided lending of last resort to major Braziliancorporations while retaining long term goals for massive investments in deep sea petroleumproduction
BNDES Market Share of Interbank and Non-Bank Loans 1995-2008 US$ Billion
Interbank Loans Non-Bank Loans------------------------------------------ ------------------------------------------
BNDES Mkt Total BNDES Mkt Total-----------------------------------------------------------------------------------------------------------1995 156 (324) 481 80 (38) 20711996 181 (354) 511 109 (49) 21981997 197 (278) 707 145 (68) 21031998 216 (355) 608 230 (113) 20201999 204 (410) 497 150 (35) 14282000 243 (439) 553 152 (96) 15772001 259 (504) 515 145 (104) 13912002 233 (443) 525 137 (130) 10512003 261 (419) 622 200 (141) 14152004 306 (408) 749 218 (122) 17862005 343 (373) 918 277 (113) 24312006 388 (350) 1106 329 (102) 32312007 524 (335) 1563 432 (88) 48852008 530 (493) 1073 456 (96) 4743200920102011-----------------------------------------------------------------------------------------------------------Source Central Bank of Brazil Top 50 Banks 1995-2008
Revew of BNDES lending since 1995 suggests the realization of competitiveadvantages typical of a large centralized development bank Contrary to the extensive branchoffice networks retained by the Banco do Brasil and Caixa the BNDES retains under 1900employees (compared to 105000 at Caixa) in the Rio de Janeiro and four regional officesSince 1995 the BNDES increased its market share of non-bank loans from R$80 billion (38percent) to R$200 billion (141 percent) during the economic downturn risk aversion andcredit shortage in 2003 After 2003 the BNDES market share of loans to non-financialentities decreased to 88 percent of total loans albeit increasing during 2008 to 96 percentThis suggests that the BNDES has increased its market share of lending to non-financialsector since liberalization of the industry and privatization of state government banks
8132019 Government Banking and BRICs in the Recent Financial Crisis
httpslidepdfcomreaderfullgovernment-banking-and-brics-in-the-recent-financial-crisis 2757
983106983122983113983107 983111983151983158983141983154983150983149983141983150983156 983106983137983150983147983155 983137983150983140 983110983145983150983137983150983139983145983137983148 983123983156983137983156983141983139983154983137983142983156
27
BNDES inter-bank lending also increases substantially Since the Real Plan endedinertial inflation in 1994 the BNDES has expanded its market share of interbank lendingfrom 156 billion (324 percent) in 1995 to 530 billion (493 percent) in 2008 during creditshortage and stock market collapse During previous years of financial crisis and economicreversals the BNDES also increased interbank lending significantly For example during the
1999 and 2001 crises BNDES interbank lending increased to 410 percent and 504 percentof total This marked presence in interbank loan market reflects the role of the BNDES inproviding indirect lending to targeted sectors through private foreign and other governmentbanks in Brazil
BNDES Loan Approvals by Program 1995-2007 R$ Billion
Direct Lending 1999 2000 2001 2002 2003 2004 2005 2006 2007 2008 2009--------------------------------------------------------------------------------------------------------------------------------------Finem 51 55 68 133 79 114 132 145 220 285Capital Markets 16 19 09 08 09 06 20 34 35 104Export-Import 23 34 39 77 63 56 67 40 13 32
Sub-Total 91 109 118 219 153 177 220 221 269 424Percent Total (505) (474) (468) (585) (456) (447) (469) (430) (415) (464)
Indirect Lending--------------------------------------------------------------------------------------------------------------------------------------Finem 31 40 37 16 12 16 18 27 51 60Finame 16 25 33 40 53 66 93 107 170 221Finame Agro 07 13 18 30 28 45 21 14 20 27Finame Leasing 00 000 02 02 03 02 04 06 14 16Export-Import 14 23 20 40 56 54 73 97 67 95BNDESautom 18 17 22 24 27 34 36 35 50 55Sub-Total 89 120 134 154 182 220 249 292 379 484Percent Total (495) (526) (532) (415) (544) (553) (531) (570) (585)(536)
BNDES Total 180 230 252 374 335 398 469 513 648 908----------------------------------------------------------------------------------------------------------------Source BNDES statistics by modality available on wwwbndesgovbr
Review of BNDES finance by program suggests the evolution of credit policies from1995 through 2008 and increasing reliance on indirect lending through other financialintermediaries The three major programs of direct finance Financiamento aEmpreendimentos (Business Finance Finem) Mercado de Capitais (Capital Markets) andExport-Import finance remained between 505 percent and 415 percent of total BNDESlending with the exception of 2002 Indirect lending through six broad programs remained
between 495 percent and 585 pecent of total BNDES lending with the exception of 2002Indirect lending programs include Finem business lending Financiamento de Maquinas(Machine Finance Fineme) with agricultural and leasing modalities Export-Import financingand BNDES automatic lending provisions
These trends suggest the realization of competitive advantages over private andforeign banks in Brazil BNDES long term interest rates remained substantially lower thanSelic benchmark overnight inter-bank interest rates throughout this period while the lowercost of small staff and operations of the BNDES made lending at these rates viable Anothercompetitive advantage of the BNDES over private and foreign banks is the developmentbankacutes mandate as manager of funds from the forced savings fund Fundo de Amparo ao
Trabalhador (Worker Asssistance Fund FAT) Constitutionally mandated investments inproductive activities (not government bonds) increased from R$31 billion in 2000 to R$101
8132019 Government Banking and BRICs in the Recent Financial Crisis
httpslidepdfcomreaderfullgovernment-banking-and-brics-in-the-recent-financial-crisis 2857
983106983122983113983107 983111983151983158983141983154983150983149983141983150983156 983106983137983150983147983155 983137983150983140 983110983145983150983137983150983139983145983137983148 983123983156983137983156983141983139983154983137983142983156
28
billion in 2008 comprising 170 percent of BNDES liabilities This means that 170 percentof BNDES finance and lending is based on long-term deposits that provide no liquidity riskThis provides a competitive advantage over private and foreign banks
A closer look at BNDES lending by sector suggests that the bank still focuses
primarily on industry and infrastructure Despite the adoption of second generation reformsthat seek to free market forces and accelerate innovation and productivity through small andmedium enterprises BNDES lending still focuses on large scale industrial and long-terminfrastructure finance In this respect the BNDES embodies a persistent need in developingeconomy for state-led development banking along the lines emphasized by Lewis Myrdaland development economists 50 years ago This traditional sense of commanding heights thusstill captures the role of the BNDES in Brazilian political economy Despite more than twodecades of privatizations financial liberalization bank reforms and a variety of fiscalfinancial and economic reforms that have substantially modernized the domestic Brazilianeconomy and freed market forces the BNDES remains the single most important source forlong-term finance and credit The capitalization of the Bovespa stock market from 2004-
2008 for the first time in Brazilian history reduced the virtual monopoly of BNDES overlong term finance
BNDES Operations approved and invested by Sector 1998-2007 R$billion
1998 1999 2000 2001 2002 2003 2004 2005 2006 2007Industry ----------------------------------------------------------------------------------------------------------------------------approved 96 79 126 152 171 163 145 290 395 402invested 76 84 104 132 174 161 158 234 272 306
Infrastructure ----------------------------------------------------------------------------------------------------------------------approved 116 69 110 65 161 149 137 186 240 369invested 83 66 86 75 130 100 152 171 170 209
Other--------------------------------------------------------------------------------------------------------------------------------approved 18 47 40 54 79 93 117 69 108 126investedTotal --------------------------------------------------------------------------------------------------------------------------------approved 230 195 276 271 411 404 379 545 743 897invested 190 181 230 252 374 335 398 470 513 617
----------------------------------------------------------------------------------------------------------------Source BNDES Annual Reports 2003-2008 and testimony of BNDES President to Congress March 2009
Long-term investments have produced substantial profits at the BNDES The bank hasrecorded profits each year since 1999 increasing from over R$600 million in 1999 overR$32 billion during 2005 reaching over R$73 billion in 2007 The long-term character of
BNDES finance stands in stark contrast to policies at private banks Contrary to strategy ofprivate and foreign banks to trade and hold government paper described in chapter three theBNDES suspended purchase and trading in government paper because of constitutionalmandates to contribute to development and employment Furthermore the turn to capitalmarkets at the BNDES has provided substantial returns since 2004
However this does not mean that BNDES lending protected unproductive industriesInstead of wasting resources to unnecessarily bail out firms or provide crony credit highreturns and strong profits at the BNDES suggest that lending was sound Standard indicatorsof bank performance asset quality and capital reserves against credit and capital risk provideempirical control for this All these measures suggest that the BNDES weathered the periodof adjustment and sustained counter-cyclical investment policies without placing resources atrisk beyond Central Bank of Brazil regulations and BIS guidelines And returns have
8132019 Government Banking and BRICs in the Recent Financial Crisis
httpslidepdfcomreaderfullgovernment-banking-and-brics-in-the-recent-financial-crisis 2957
983106983122983113983107 983111983151983158983141983154983150983149983141983150983156 983106983137983150983147983155 983137983150983140 983110983145983150983137983150983139983145983137983148 983123983156983137983156983141983139983154983137983142983156
29
increased since recovery in 2004 BNDES participation in the booming Bovespa stock marketsince 2003 has provided record returns
The BNDESpar subsidiary that invests in capital markets has also recorded strongreturns during the period of economic growth and into the 2008 financial crisis BNDESparreturns on liquid assets increased from 75 percent in 2004 to 277 percent in 2007 declining
to 245 percent in 2008 Average returns on assets and stock holdings also remained highbuilding the assets held by the BNDESpar subsidiary from 141 billion in 2005 to 359 billionin 2008
This increased participation of the BNDES in capital markets involves new relationsand networks across government private sector labor unions the private pension funds ofgovernment bank and government enterprise employees and financial markets By 2007BNDES participation in stockholding and mutual funds reached across 261 forms and 25mutual funds totaling over R$910 billion reals The BNDES thereby retains broad portfoliothat represents institutional foundations of comparative advantage Furthermore unlike thepolicy of private and foreign banks to trade and hold high interest rate paying short termgovernment paper during the sudden stop of foreign finance and downturn in the Brazilian
business cycle (2002-3) the BNDES expanded credit operations and reduced financialoperations in secondary markets for indexed government paper This countered the perverseimpact of the liquidity preference among private and other government banks that increasedmarket pressures and led to shorter terms and higher cost of Brazilian government debt
BNDES aversion of government paper is required by constitutional mandate tomanage forced savings funds in ways that generate employment and income As noted alarge part of BNDES resources (liabilities) are from domestic official savings programs Thevalue of FAT resources increased from R$492 billion in 2003 to R$662 billion in 2005while the PIS-Pasep fund remained at approximately R$200 billion Foreign capital has alsobeen channeled to the BNDES through multilateral agencies and foreign bond issues Foreignloans to the BNDES have declined Multilateral agencies provided R$70 billion in 2003increased funding to R$129 billion during 2004 and continued to provide R$107 billion tothe BNDES during 2005
Comparison of BNDES structure and performance with development banks abroadsuggests both the large scale and scope of BNDES operations and controls formismanagement and political abuse of the bank In 2007 BNDES total assets are almostdouble the value reported by the Inter-American Development Bank (IADB) over frac12 thevalue of total assets held by the World Bank and almost ten times the value of assets held bythe French government development bank CAF Furthermore profits and loans from theBNDES far exceeded all three institutions The US$330 billion in loans reported by theBNDES far exceed the US$67 billion from the IADB the US$110 reported by the World
Bank and US$58 billion reported by the CAF BNDES profis returns on assets and return onliquid patrimony also far exceeded those reported by these three development banks thatserve as comparative control over performance and policies at the BNDES Finally lateloans at the BNDES remained at 011 percent of total loans well below levels reported by theWorld Bank comparable to the 010 percent reported by the IADB while considerably abovethe 001 percent reported by CAF
8132019 Government Banking and BRICs in the Recent Financial Crisis
httpslidepdfcomreaderfullgovernment-banking-and-brics-in-the-recent-financial-crisis 3057
983106983122983113983107 983111983151983158983141983154983150983149983141983150983156 983106983137983150983147983155 983137983150983140 983110983145983150983137983150983139983145983137983148 983123983156983137983156983141983139983154983137983142983156
30
Comparison of BNDES and Regional Development Banks 2007 US$ billion
BNDES IADB World Bank CAF----------------------------------------------------------------------------------------------------------------Total Assets 1144 699 2080 125
Liquid Patrimony 140 203 399 41Liquid Profits 38 01 -01 04Desembolsos 339 67 110 58Credit Portfolio 928 479 978 95Capitalization percent 123 291 192 328Return on Assets percent 38 47 na 36Return on PL percent 332 07 na 105Late Loans percent 011 010 086 001----------------------------------------------------------------------------------------------------------------Source BNDES Annual Report 2007
The large scale of BNDES lending and finance make it possible for governmentpolicy to provide counter cyclical credit to avert or ameliorate economic downturns andsubstitute private and foreign credit shortages In March 2009 testimony to Congress ongovernment policies during financial crisis BNDES President Coutinho argued that bankpolicy was to reduce the cost and increase the supply of credit Resources for counter cyclicallending during 2008-2009 came from Treasury loans to BNDES released by provisionaldecrees 439 and 414 summing R$175 billion transfer of R$60 billion in CVS funds sale ofFGTS Investment Fund and bank certificates summing R$170 billion Furthermore the thirdphase of conditional credit facility shared by Inter-American Development Bank and theBNDES provided the last tranch of a total US$60 billion for BNDES operations
Two further means were used by the BNDES to infuse capital during the collapse of
the stock market and shortage of credit during 2007-8 The counter cyclical policies of theBNDES can also be seen in the over two fold increase of BNDES holdings in private equityand investment funds Table 512 reports the value of private equity and investment fundholdings of the BNDES in 2007 and 2008 BNDES funds in private equity and mutual fundsincreased from R$4038 million in 2007 to over R$10 billion in 2008 The capitalization ofmutual funds and private equity firms by the BNDES also played an important countercyclical role during this period
BNDESpar Shareholding 2007-8 R$million
Percent Value ValueShares 2008 2007
----------------------------------------------------------------------------------------------------------------Ameacuterica Latina Logiacutestica 106 6386 -Aracruz 55 1292 1292Banco do Brasil 25 10854 12752Bom Gosto (2) 345 2458 -Brasil Telecom Part 30 1666 1958Braskem 52 2275 2432Brenco 209 1400 -CEG 345 1406 -CESP 57 2347 1397Coteminas 103 1150 1340
CPFL Energia 62 6081 5506Cia Sideruacutergica Nacional 36 1513 2686CVRD 40 15082 7098
8132019 Government Banking and BRICs in the Recent Financial Crisis
httpslidepdfcomreaderfullgovernment-banking-and-brics-in-the-recent-financial-crisis 3157
983106983122983113983107 983111983151983158983141983154983150983149983141983150983156 983106983137983150983147983155 983137983150983140 983110983145983150983137983150983139983145983137983148 983123983156983137983156983141983139983154983137983142983156
31
ELETROBRAacuteS (1) 118 22400 22400EMBRAER 50 1096 1096Gerdau 35 1533 490Independecircncia 139 2500 -JBS 130 14722 11370Klabin 202 5621 -
Light 336 8225 -Marfrig 146 8176 1020MPX Mineraccedilatildeo 26 1791 1791Ouro Fino 200 1057 840Paranapanema 175 1252 08Petrobraacutes 76 10226 10226Rede Energia SA 253 2633 -Tele Norte Leste Participaccedilotildees 16 1645 1645Valepar 97 26254 15585Subtotal 163055 102941Other firms 12223 12606Total 175278 115548----------------------------------------------------------------------------------------------------------------
Source BNDESpar Financial Statements 2008 pp
The BNDES also holds blocks of shares in many major Brazilian corporationsthrough its participation subsidiary BNDESpar Comparing value of investments in 2007 and2008 suggests that large purchases capitalized firms precisely as financial crisis and downturnin Bovespa stock market made it difficult for firms to find working capital Table X reportsthe percent of total company shares held by the BNDES and their respective market values(adjusted for risk of future losses) at year end 2007 and 2008 During this year of extremelyshort and expensive credit in Brazil caused by the international financial and banking crisisthe BNDES increased shareholding by over R$60 billion reals in 28 private Brazilianenterprises Further shareholding classified as X in Five firms (Bertin 269 Brasiliana 538
Copel 239 Rio Poliacutemeros 250 Telemar 313) Once again the BNDES provided access tocapital for firms caught in the sudden credit crunch and stock market collapse unable to meetobligations or raise funds through equity issues or commercial bank credit This countercyclical role of government banks has been critical in Brazil since the 19 th century
BNDESpar Private Equity and Fund Participation 2007-2008 R$million
Fund Manager 2008 2007-------------------------------------------------------------------------------------------------------------------------Brasil 21 Dynamo 46 60PROT Mellon Financial Services 4628 -
Logiacutestica Brasil Bradesco 135 -Fire BrasilPrivate 269 250FIPGG Governanccedila amp Gestatildeo Inv 289 311Opportunity Equity Partners Mellon Financial Services 1046 578Brasil Energia Bradesco 1184 655InfraBrasil ABN-Amro 677 251Rio Bravo Cinema Rio Bravo 116 110Brascan Petro amp Gaacutes Bank Brascan 136 113AG Angra Infra-Estrutura Bradesco 380 301Satildeo Paulo Metro Fund Bradesco 791 831Other Funds 653 572Total 10356 4038---------------------------------------------------------------------------------------------------------------------------
Source BNDESpar Financial Statements 2008
8132019 Government Banking and BRICs in the Recent Financial Crisis
httpslidepdfcomreaderfullgovernment-banking-and-brics-in-the-recent-financial-crisis 3257
983106983122983113983107 983111983151983158983141983154983150983149983141983150983156 983106983137983150983147983155 983137983150983140 983110983145983150983137983150983139983145983137983148 983123983156983137983156983141983139983154983137983142983156
32
Finally Brazilian federal government triennial plans include investment targets by theBNDES If current plans are compared to 2004-7 investments several structural changes inBNDES lending appear First BNDES plans for Oil and Petroleum production reveal aprofound change for Brazilian political economy In 1990 roughly 45 percent of oilconsumed in Brazil was imported In 2007 before oil price increased reversed the balance
Brazil reported domestic production levels sufficient to meet domestic consumptionFurthermore discoveries of substantial deep sea oil reserves have led the BNDES to planmassive investments involving Petrobras and other global petroleum firms For the 2009-2012 period investments in petroleum and gas (R$2697 billion) Petrochemicals (237) andEthanol (197) sum to over R$3130 billion
BNDES Triennial Investment Plans 2004-2012
2004-7 2007-10 2008-11 2009-12----------------------------------------------------------------------------------------------------------------Petroleum amp Gas 1472 1836 2028 2697
Mining 472 527 813 480Petrochemicals 64 174 264 237Steel 198 371 312 245Automotive 150 176 264 235Electronics 143 156 140 240Ethanol 166 205 205 197Paper amp Celulose 104 200 274 90Health 51 46 51 80Industry Total 2816 3802 4437 4501----------------------------------------------------------------------------------------------------------------Source BNDES Annual Reports 2002-2006
It is of note that President Dilma Roussef was instrumental in reducing the targets for2009-12 in petroleum and gas given indications that Petrobras and existing framework foroffshore oil prospecting and production proved unable to increase investments accordingly
The BNDES also retains a presence in government projects by providing managementassistance During 2008 BNDES staff provided management support for implementation of192 projects involving R$710 billion of total R$142 billion PT government growthacceleration projects BNDES staff also participated in the design management andimplementation of President Lularsquos Poliacutetica de Desenvolvimento Produtivo (Policy forProduction Development) involving R$2100 billion targeting production chains designed tomaximize employment and regional development benefits Finally the BNDES was alsocharged to create and co-manage a Fundo Amazonia with the Ministry of Environment toprovide incentives to reduce deforestation of the Amazon region BNDES Plans for 2009include completion of concession for construction of high speed train line and service for Riode Janeiro-Satildeo Paulo corridor two blocks of highway concession sales involving three majorhighways in each block of sales sale of management concessions for regional airports andthe reorganization of INFRAERO federal government airport management company
These policies reflect the goal of BNDES policy to launch firms on the stock marketrather than maintain direct credit and finance Exceptions during 2008 involve Auto andEthanol industies both for strategic and broader policy reasons Given the sharp downturn inauto sales during fourth quarter 2008 the BNDES provided significant lending to avert
further downsizing or failure of auto companies in Brazil Given the current globalredistribution of automobile production BNDES policies are designed to help the Brazilian
8132019 Government Banking and BRICs in the Recent Financial Crisis
httpslidepdfcomreaderfullgovernment-banking-and-brics-in-the-recent-financial-crisis 3357
983106983122983113983107 983111983151983158983141983154983150983149983141983150983156 983106983137983150983147983155 983137983150983140 983110983145983150983137983150983139983145983137983148 983123983156983137983156983141983139983154983137983142983156
33
operations of major auto firms through the period of adjustment and increase theattractiveness of domestic operations in global production strategies of multinational autocompanies Ethanol production also received massive funds to sustain an industry seen ascritical for alternative and sustainable fuel source capable of replacing petroleum Ethanolreached over 50 percent of automotive fuel sales in 2007
Under the Lula government (2003-10 the BNDES also resumed lending to state andmunicipal governments Since the renegotiation of municipal and state government debts inthe late 1990s states and municipalities have been largely prohibited from taking on debtThis was emplematic of the recentralization required to control fiscal excesses during militaryrule and the prolonged period of transition to democracy Policies during the 1990s weredesigned to avert overspending seen as critical to maintain price stability under the Real Plan(1994) In 2000 the Lei de Responsibilidade Fiscal (Fiscal Responsibility Law) largelyprohibited credit and finance to state and municipal governments Since 2000 municipalitiesand states have been required to submit detailed budget statements that in turn have been thebasis for a gradual return to sub-national government finance In August 2006 central bankand Treasury regulations freed municipalities to take on credit up to 12 times liquid receipts
Since then the BNDES has led in terms of credits and finance to subnational governmentsthrough a Programa Especial de Financiamento aos Estados e Distrito Federal
The BNDES also has developed the first system in Brazil for risk analysis ofmunicipal governments and has led in the market for municipal credit freed by August 2006procedures for approval at Treasury the Central Bank and Conselho Monetaacuterio Nacional(National Monetary Council) Prosecution of mayors and firms charged with managingmunicipal credits with the BNDES revealed fraudulent practices These funds for sub-national public finance also became critical mechanisms to counter severe budget shortfallscaused by financial crisis during 2008 Given that municipal and state government tax basesare shallow and that federal government transfers provide the bulk of sub-nationalgovernment resources the Lula administration allocated R$ 40 billion to the Fundo deParticipaccedilatildeo dos Estados (State Participation Fund) through a Programa Emergencial deFinanciamento (Emergency Finance Fund) administered by the BNDES
In sum the BNDES expanded credit and finance operations substantially during fouryears of sustained growth from 2004-2007 And having helped underwrite the stock marketboom and capitalized Brazilian firms directly and indirectly through credit finance mutualfunds and private equity funds the BNDES retained sufficient scale scope and capital baseto provide counter cyclical credit and finance to help firms adjust to financial crisis and creditshortage during 2008 In retrospect the growth of the BNDES since liberalization andprivatizations of state government banks in the 1990s suggest the comparative advantages of
development banking BNDES credit and finance fell to 52 percent of fixed capitalformation in 1995 Since then the turn to neo-developmentalism and a period of sustainedeconomic growth during the Lula administration increased the BNDES share of total fixedcapital formation during 2006 and 2007 to 126 and 141 percent Critics charge thatmonopoly over FGTS and PIS-PASEP official savings funds as liabilities provide theBNDES with unfair competitive advantage over private banks In 2008 forced savings fundssummed to only 17 percent of BNDES liabilities (resources) The BNDES does not relyexclusively on forced savings for competitive advantage Instead market-oriented policies
joint-ventures with private mutual funds investment funds private equity firms large blocksof shareholding in Brazilian firms and massive amounts of credit and investment to theprivate sector at below market but still profitable long term interest rates of 625 percent
suggest that the large scale and scope of BNDES operations provide institutional foundationsof competitive advantage over private and foreign banks
8132019 Government Banking and BRICs in the Recent Financial Crisis
httpslidepdfcomreaderfullgovernment-banking-and-brics-in-the-recent-financial-crisis 3457
983106983122983113983107 983111983151983158983141983154983150983149983141983150983156 983106983137983150983147983155 983137983150983140 983110983145983150983137983150983139983145983137983148 983123983156983137983156983141983139983154983137983142983156
34
Capitalization of the BNDES by Treasury of over R$2300 billion 2009-11hascaptured attention of many observers of Brazilian development Critics and advocates agreethat the BNDES has realized significant competitive advantages over private and foreignbanks and continues to serve as significant alternative to capital markets for large scaledevelopment projects However like the downturn in planned investments by Petrobras for
oil and gas exploration and production BNDES decreased planned investments fromR$1684 billion in 2010 to R$1397 billion in 2011 We believe this indicates the limits ofmanagement and passing of period of crisis both favoring finance from capital marketsbanks and public-private partnerships
India
Analysis of Brazilian federal banks suggests that these institutions provided policy alternativewhile realizing competitive advantage over private and foreign banks The modernization ofthese institutions helps explain why these large institutions were able to stay the effects ofcredit crunch and financial market downturn in Brazil This section explores data from the
Reserve Bank of India to compare market shares of types of banks from 1972-2008 and bankperformance from 2006-10 Further analysis will be required However the data appears tosupport our core argument that government banks have modernized and realized competitiveadvantages over private and foreign banks
First the number of branch offices which serves as a measure of institutionalcoverage across India of special concern for financial inclusion and the theory thatliberalization and privatizations would lead private banks to expand branch offices andincrease the supply of services From this perspective the trajectory of branch officessuggests that nationalized banks the State Bank of India and regional rural bankssustain much larger networks of branch offices that predominate while otherscheduled commercial (private and foreign) banks retain less than 8000 branch offices
Data from the Reserve Bank of India on the number of current accounts retainedby type of bank provide further evidence that the State Bank of India and its associates
8132019 Government Banking and BRICs in the Recent Financial Crisis
httpslidepdfcomreaderfullgovernment-banking-and-brics-in-the-recent-financial-crisis 3557
983106983122983113983107 983111983151983158983141983154983150983149983141983150983156 983106983137983150983147983155 983137983150983140 983110983145983150983137983150983139983145983137983148 983123983156983137983156983141983139983154983137983142983156
35
national banks and regional rural banks provide the bulk of banking accounts to theIndian population while private and foreign banks cherry pick upscale urban marketsreproducing capital drain and inequalities
Number of Current Accounts by Type of Bank 1972-1995
Since 1999 the pattern of predominance by alternative banking institutions and the minorrole of other scheduled commercial banks and foreign banks continues
The following figures report the value held in current accounts by type of banks first fromthe 1972-1995 period then from the 1999-2008 period For both time periods the trendconfirms that private and foreign banks remain at a competitive disadvantage in terms of thebroader market while the State Bank of India and its associates nationalized banks andregional rural banks tend to predominate
8132019 Government Banking and BRICs in the Recent Financial Crisis
httpslidepdfcomreaderfullgovernment-banking-and-brics-in-the-recent-financial-crisis 3657
983106983122983113983107 983111983151983158983141983154983150983149983141983150983156 983106983137983150983147983155 983137983150983140 983110983145983150983137983150983139983145983137983148 983123983156983137983156983141983139983154983137983142983156
36
Current Account Value by Type of Bank 1972-1995 R
Number of Deposit Accounts by type of bank 1999-2008
A similar pattern appears for the trajectory of savings accounts both the number of
accounts and the value held in savings accounts both for the 1972-1995 period We wereunable to organize data from the more recent period
8132019 Government Banking and BRICs in the Recent Financial Crisis
httpslidepdfcomreaderfullgovernment-banking-and-brics-in-the-recent-financial-crisis 3757
983106983122983113983107 983111983151983158983141983154983150983149983141983150983156 983106983137983150983147983155 983137983150983140 983110983145983150983137983150983139983145983137983148 983123983156983137983156983141983139983154983137983142983156
37
Number of Savings Accounts by Type of Bank 1972-1995
Value in Savings Accounts by Type of Bank 1972-1995
Number of Term Savings Accounts by Type of Bank 1972-1995
8132019 Government Banking and BRICs in the Recent Financial Crisis
httpslidepdfcomreaderfullgovernment-banking-and-brics-in-the-recent-financial-crisis 3857
983106983122983113983107 983111983151983158983141983154983150983149983141983150983156 983106983137983150983147983155 983137983150983140 983110983145983150983137983150983139983145983137983148 983123983156983137983156983141983139983154983137983142983156
38
Value in Term Savings Accounts by Type of Bank 1972-1995
The number and value of credits extended by banks from 1999-2008 appears mostpromising in terms of comparative analysis of bank performance and behavior Thesignificant spread at the end of the time series between the State Bank of India and itsassociates and foreign banks suggests the impact of foreign financial crisis and differentdomestic policies by these types of banks in India similar to that noted in the Brazilianexperience
Number of credits by type of bank 1999-2008
Value of credit by type of bank 1996-2008
8132019 Government Banking and BRICs in the Recent Financial Crisis
httpslidepdfcomreaderfullgovernment-banking-and-brics-in-the-recent-financial-crisis 3957
983106983122983113983107 983111983151983158983141983154983150983149983141983150983156 983106983137983150983147983155 983137983150983140 983110983145983150983137983150983139983145983137983148 983123983156983137983156983141983139983154983137983142983156
39
Further data from the Reserve Bank of India from 2008-10 permit closercomparison of government private and foreign banks in the recent financial crisis Interms of deposits investments total assets and net profits the dominant and expandingrole of government banking in India is apparent Further control variables (not reported)
include gross and net NPA types of income expenses and expenditures provisions andcontingencies and credit- and investment-deposit ratios provide control for bad bankingand confirm the counter cyclical policies during 2008-10 in India
THE FOLLOWING TABLES REQUIRE INTERPRETATION
Number of Banks 2006-7 2007-8 2008-9 2009-10 2010-11
State Bank of India amp Associates 8 8 7 7 6Nationalized Banks 20 20 20 20 20Old Private Sector Banks 17 15 15 15 14
New Private Sector Banks 8 8 7 7 7Foreign Banks 29 28 31 32 33Source RBI A Profile of Banks 2010-11
Number of Branch Offices 2006-7 2007-8 2008-9 2009-10 2010-11
State Bank of India amp Associates 14673 15848 16894 18178 18772Nationalized Banks 37435 39255 40956 43452 45640Old Private Sector Banks 4723 4690 4908 5220 5011New Private Sector Banks 2599 3635 4333 5232 6957
Foreign Banks 272 277 295 308 316Source RBI A Profile of Banks 2010-11
Number of Employees 2006-7 2007-8 2008-9 2009-10 2010-11
State Bank of India amp Associates 255699 249008 268598 266605 282453Nationalized Banks 473179 466400 462926 473041 475082Old Private Sector Banks 47994 48700 51341 55052 55075New Private Sector Banks 91060 110123 124998 127468 163604Foreign Banks 28426 31301 29582 28012 27968
Source RBI - India BanksAssociation
Business per employee (in lakh) 2006-7 2007-8 2008-9 2009-10 2010-11
State Bank of India amp Associates 43635 54922 65022 73743 79306Nationalized Banks 49001 61828 78316 93586 114477Old Private Sector Banks 48159 56932 63843 69749 8149New Private Sector Banks 80782 83196 78715 84041 82607Foreign Banks 97477 11255 128274 141139 155974Note Business = Deposits + Advances
8132019 Government Banking and BRICs in the Recent Financial Crisis
httpslidepdfcomreaderfullgovernment-banking-and-brics-in-the-recent-financial-crisis 4057
983106983122983113983107 983111983151983158983141983154983150983149983141983150983156 983106983137983150983147983155 983137983150983140 983110983145983150983137983150983139983145983137983148 983123983156983137983156983141983139983154983137983142983156
40
Profit per employee (in lakh) 2006-7 2007-8 2008-9 2009-10 2010-11
State Bank of India amp Associates 257 362 443 466 42Nationalized Banks 287 377 486 567 695Old Private Sector Banks 234 406 469 42 563New Private Sector Banks 587 685 677 847 893Foreign Banks 1613 2112 2539 1692 2759
Capital amp Reserves amp Surplus(Ycrore) 2006-7 2007-8 2008-9 2009-10 2010-11
State Bank of India amp Associates 42941 61706 72422 83726 84394Nationalized Banks 92689 113079 135920 157276 205857Old Private Sector Banks 10736 15315 17477 20171 23821New Private Sector Banks 39736 76056 82192 99813 114768Foreign Banks 33075 49332 59937 69176 80972
Deposits Ycrore 2006-7 2007-8 2008-9 2009-10 2010-11
State Bank of India amp Associates 633476 773875 1007041 1108086 1245862Nationalized Banks 1360724 1679993 2105706 2583934 3127122Old Private Sector Banks 138249 165589 199274 229897 264157New Private Sector Banks 413738 509444 537104 592904 738602Foreign Banks 150750 191161 214076 232099 240689
Investments Ycrore 2006-7 2007-8 2008-9 2009-10 2010-11
State Bank of India amp Associates 211875 263823 357624 387473 385697Nationalized Banks 452981 536018 655042 828125 942837Old Private Sector Banks 43647 54080 72393 83499 92617New Private Sector Banks 171008 224498 234139 270618 329403Foreign Banks 71471 98910 130354 159291 165499
Advances Ycrore 2006-7 2007-8 2008-9 2009-10 2010-11
State Bank of India amp Associates 482270 593722 739450 857937 994154Nationalized Banks 957877 1203678 1519762 1843082 2311478
Old Private Sector Banks 92887 111670 128504 154085 184647New Private Sector Banks 321865 406733 446824 478356 612886Foreign Banks 126339 161133 165385 163260 195539
Interest Income Ycrore 2006-7 2007-8 2008-9 2009-10 2010-11
State Bank of India amp Associates 53465 70428 89196 97954 109828Nationalized Banks 110720 142647 183892 208029 256490Old Private Sector Banks 11474 14614 18790 20497 23299New Private Sector Banks 38092 56377 66282 62309 73528
Foreign Banks 17924 24417 30322 26390 28520
8132019 Government Banking and BRICs in the Recent Financial Crisis
httpslidepdfcomreaderfullgovernment-banking-and-brics-in-the-recent-financial-crisis 4157
983106983122983113983107 983111983151983158983141983154983150983149983141983150983156 983106983137983150983147983155 983137983150983140 983110983145983150983137983150983139983145983137983148 983123983156983137983156983141983139983154983137983142983156
41
Other Income Ycrore 2006-7 2007-8 2008-9 2009-10 2010-11
State Bank of India amp Associates 9420 11818 16073 18394 19240Nationalized Banks 14264 20979 26394 30500 28625Old Private Sector Banks 1568 2184 2782 3152 3029
New Private Sector Banks 10745 14822 15078 17271 17697Foreign Banks 7044 10588 14894 9951 10972
Interest Expended Ycrore 2006-7 2007-8 2008-9 2009-10 2010-11
State Bank of India amp Associates 32607 47809 61770 66229 67018Nationalized Banks 69353 101093 131676 145712 164135Old Private Sector Banks 7055 9960 12834 14076 14768New Private Sector Banks 25802 38535 44123 37130 42347Foreign Banks 7603 10604 12819 8938 10622
Operating Expenses Ycrore 2006-7 2007-8 2008-9 2009-10 2010-11
State Bank of India amp Associates 15987 16993 20088 25283 29146Nationalized Banks 27268 29670 35416 40792 53819Old Private Sector Banks 2967 3235 3939 4715 5600New Private Sector Banks 12353 17032 17840 18136 22006Foreign Banks 7745 10353 12298 11102 12557
Cost of Funds 2006-7 2007-8 2008-9 2009-10 2010-11
State Bank of India amp Associates 475 59 594 532 48Nationalized Banks 48 582 609 537 493Old Private Sector Banks 498 62 667 613 55New Private Sector Banks 524 611 604 442 427Foreign Banks 403 433 446 283 311Cost of Funds = Ratio () of interest paid on deposits and borrowings to averageof opening and closing balances of deposits and borrowings
Return on advances adjusted toCoF 2006-7 2007-8 2008-9 2009-10 2010-11
State Bank of India amp Associates 372 365 395 36 405Nationalized Banks 399 369 409 382 427Old Private Sector Banks 406 426 515 482 492New Private Sector Banks 447 505 526 514 516Foreign Banks 574 66 815 716 564
2006-7 2007-8 2008-9 2009-10 2010-11
8132019 Government Banking and BRICs in the Recent Financial Crisis
httpslidepdfcomreaderfullgovernment-banking-and-brics-in-the-recent-financial-crisis 4257
983106983122983113983107 983111983151983158983141983154983150983149983141983150983156 983106983137983150983147983155 983137983150983140 983110983145983150983137983150983139983145983137983148 983123983156983137983156983141983139983154983137983142983156
42
Wages as of Total Expenses
State Bank of India amp Associates 2155 1589 1506 171 1921Nationalized Banks 1794 1405 1331 1365 1641Old Private Sector Banks 1689 1367 1326 1457 1675
New Private Sector Banks 936 956 1017 121 1383Foreign Banks 2008 1995 1944 2348 2331
Returns on Assets 2006-7 2007-8 2008-9 2009-10 2010-11
State Bank of India amp Associates 086 097 102 091 079Nationalized Banks 094 101 103 100 103Old Private Sector Banks 078 114 115 095 112New Private Sector Banks 109 113 112 138 151Foreign Banks 228 209 199 126 174
Capital Adequacy Ratio 2006-7 2007-8 2008-9 2009-10 2010-11
State Bank of India amp Associates 1232 1321 1396 1346 1225Nationalized Banks 1237 1213 1324 1318 1347Old Private Sector Banks 1208 1408 1476 1485 1456New Private Sector Banks 1199 1439 1533 1803 1687Foreign Banks 1239 1305 1432 1726 1672Note To 2007-8 = Basel I From 2008-09 = Basel-II
Net NPA Ratio 2006-7 2007-8 2008-9 2009-10 2010-11
State Bank of India amp Associates 132 143 147 150 149Nationalized Banks 094 077 068 091 092Old Private Sector Banks 096 066 09 082 053New Private Sector Banks 097 109 129 103 056Foreign Banks 073 077 181 182 067Net NPA Ratio = Net non-performing assets as net advances
In sum descriptive data from the Reserve Bank of India confirm the anomaly
and argument drawn from the Brazilian experience An important dimension of BRICcountry recovery from the global financial crisis and downturn is the counter cyclicallending policies and realization of competitive advantages of government banks Thisposes a series of new questions for business schools and scholars of public policyInstead of liberalization and privatization leading to transitions in BRIC countriestoward capital market centered financial systems and liberal market economies publicbanks have realized competitive advantages over private and foreign banks whileproviding policy alternatives to BRIC governments in the face of financial crisis andglobal economic slowdown We return to these implications in the conclusion
One development of note at the Reserve Bank of India is a policy focus onfinancial inclusion The 2008 report of the Committee on Financial Inclusion has beenfollowed by sections of the Reserve Bank of India Annual Report reserved fordiscussion of financial inclusion And instead of focusing on liberalization and
8132019 Government Banking and BRICs in the Recent Financial Crisis
httpslidepdfcomreaderfullgovernment-banking-and-brics-in-the-recent-financial-crisis 4357
983106983122983113983107 983111983151983158983141983154983150983149983141983150983156 983106983137983150983147983155 983137983150983140 983110983145983150983137983150983139983145983137983148 983123983156983137983156983141983139983154983137983142983156
43
privatization to ensure the spread of banking products and services alternative policieshave been explored One is of special note The Committee on Financial Inclusionrecommended issue of identity cards as bank cards This would profoundly change thelandscape of banking in India and has attracted attention from analysts at the CentralBank of Brazil charged with financial inclusion as well as the President of Indonesia
and apparently Uganda officials Given the revolution in information and card paymenttechnologies this policy proposal and pilot studies deserve close attention asalternatives to dramatically increase the pace of social inclusion of the bankless
8132019 Government Banking and BRICs in the Recent Financial Crisis
httpslidepdfcomreaderfullgovernment-banking-and-brics-in-the-recent-financial-crisis 4457
983106983122983113983107 983111983151983158983141983154983150983149983141983150983156 983106983137983150983147983155 983137983150983140 983110983145983150983137983150983139983145983137983148 983123983156983137983156983141983139983154983137983142983156
44
China
This section turns to a brief review of the Chinese banking sector to further explore therole of government banks in terms of their modernization competitive advantages
policy roles and capacity for counter cyclical credit that help explain why BRICcountries were able to avert the severe consequences of the global financial crisis
First figure A11 reports the basic structure of the banking system in China
Although we have been unable to compare the evolution of types of banks acrosstime in similar ways to the above data on India taken from the Reserve Bank of Indiaour research assistants have gathered the following comparative macroeconomicfinancial and balance sheet data on banking in China The data appear to be consistentwith the core argument presented in this paper ndash that government banks havemodernized since liberalization and provided policy makers with alternative means tocounter the effects of financial crisis abroad
8132019 Government Banking and BRICs in the Recent Financial Crisis
httpslidepdfcomreaderfullgovernment-banking-and-brics-in-the-recent-financial-crisis 4557
983106983122983113983107 983111983151983158983141983154983150983149983141983150983156 983106983137983150983147983155 983137983150983140 983110983145983150983137983150983139983145983137983148 983123983156983137983156983141983139983154983137983142983156
45
We lack more current information and were unable to collect data directly fromofficial sources in China to compare the trajectory of state owned private and foreignbanks As a substitute Figure 1 reports data from 2000-4 that permits initial observationof trends for this earlier period
Those present may not need reminding of the formidable record of economicgrowth in China during this 200-4 period that continues until today However data fromthe National Bureau of Statistics suggests that the Chinese banking system expanded atan even greater pace than the remarkable levels of GDP growth recorded for the 2000-4period Furthermore credit expansion was ldquoorganicrdquo in the sense that deposits
outpaced credit growth from 2000-4
Expansion of Loans in China 1999-2004
Loan Growth Total LoansYear on Year
Growth Total Depositssup1Year on Year
GrowthYear CNY billion CNY () CNY billion CNY()1999 9373 83 10878 1372000 9937 60 1238 1382001 11231 130 14362 1602002 13129 169 17092 1902003 159 211 20806 217
2004 18857 186 25319 217
sup1Based on preliminary estimates by the National Bureau of Statistics of the Peoplersquos Republic of ChinaSource National Bureau of Statistics of the PRC
Although we lack data comparable to that from the Reserve Bank of India ableto compare the trajectory of state private and foreign banks in China the sectoralbreakdown of loans and other banking and national account data confirms the profoundcapitalization of the Chinese banking system and GDP growth during from 1995-2004
8132019 Government Banking and BRICs in the Recent Financial Crisis
httpslidepdfcomreaderfullgovernment-banking-and-brics-in-the-recent-financial-crisis 4657
983106983122983113983107 983111983151983158983141983154983150983149983141983150983156 983106983137983150983147983155 983137983150983140 983110983145983150983137983150983139983145983137983148 983123983156983137983156983141983139983154983137983142983156
46
China Banking Sector Market Dimensions (1995 - 2004)
YearTotal
LoansCorp
LoansConsuLoans
HomeLoans
TotalDeposits Excess
GovBonds
CorpBonds GDP
GDPGrowth
()1995 52310 mdash mdash mdash 5376 145 330 65 5848 2511996 63100 mdash mdash mdash 6847 538 436 60 6788 1611997 73585 7341 17 130 8212 853 551 52 7446 971998 85002 8447 53 430 9529 102 9 777 68 7835 521999 95587 9394 164 1360 10831 1273 1054 78 8207 482000 108763 10453 424 3320 13486 261 1302 86 894 892001 118990 112 699 5600 15472 3573 1562 101 9593 732002 139800 12913 1067 8258 18339 4359 mdash mdash 10479 922003 169770 15401 1576 13302 22036 5059 mdash mdash 11669 1142004 194220 16848 1988 15800 25319 5897 mdash mdash 13657 170Figures = CNYB
This data reported in terms of percent GDP provides further clarity on the rapid
capitalization of loans It is of note that the bulk of loans during this period were to thecorporate sector with consumer and home loans lagging significantly
China Banking Sector Percent GDP
YEARTotal
LoansCorporate
LoansConsumer
LoansHomeLoans Deposits
ExcessDeposits
GovBonds
CorpBonds
1995 895 00 00 00 919 25 56 111996 929 00 00 00 1009 79 64 091997 988 986 02 02 1103 115 74 071998 1085 1078 07 05 1216 131 99 091999 1165 1145 20 17 1320 155 128 092000 1217 1169 47 37 1508 292 146 102001 1240 1167 73 58 1613 372 163 112002 1334 1232 102 79 1750 4162003 1455 1320 135 114 1888 4342004 1422 1234 146 116 1854 432
Sources China Banking Regulatory Commission Peoplersquos Bank of China and GoldmanSachs research estimates
Compilation of financial data from a select number of banks in China suggeststhat the pattern of bank change encountered in Brazil and India also describes theexperience of China The liberalization of the Chinese economy and the modernization
of state banks appear to describe the process of bank change instead of a process oftransition toward private banking and capital market centered financial systemAlthough we have been unable to draw data from Chinese monetary authorities thebalance sheet data suggests the clear predominance of large state banks in the politicaleconomy of banking and finance in China How these institutions were used to counterthe effects of financial crisis abroad and redirect domestic investment production andconsumption must remain a subject for further research
8132019 Government Banking and BRICs in the Recent Financial Crisis
httpslidepdfcomreaderfullgovernment-banking-and-brics-in-the-recent-financial-crisis 4757
983106983122983113983107 983111983151983158983141983154983150983149983141983150983156 983106983137983150983147983155 983137983150983140 983110983145983150983137983150983139983145983137983148 983123983156983137983156983141983139983154983137983142983156
47
Select Financial Data from Chinese Banks 2004()
CNY (billion)Total
AssetsGrossLoans
CustomerDeposits Equity
NPLRatio
()
Pre-prov
ProfitsNet
Profits
State Banks
ICBC 5671 3705 5105 163 190 653 23CCB 3905 2226 3489 195 39 605 484ABC (NA) mdashBOC 427 2146 3342 205 51 578 209Quasi-State
BoCom 1145 639 1023 54 30 131 16CMB 587 376 513 22 29 82 32CITIC Industrial 515 306 429 20 60 52 03SPDB 456 311 397 14 24 62 20China Everbright mdashGuangdong Development 345 216 301 mdash mdash mdash 32
Industrial Bank 341 203 283 10 25 37 11Quase-Private
Bank of Shanghai 216 106 179 83 51 32 26Hua Xia 304 181 270 92 40 29 10Shenzhen Development 198 126 166 43 114 28 03Bank of Beijing 209 85 174 71 mdash 26 07
Sector total 19422 25319 129Three state-banks 2692 3979 188Second tier banks 2549 3733 148
ABC = Agriculture Bank of China BOC = Bank of China
BOCOM = Bank of Communications CCB = China Construction BankCMB = China Merchantrsquos Bank CNY = yuanICBC = Industrial and Commercial Bank of ChinaNPL = nonperforming loanROA = return on assets ROE = return on equityprov = provisioningPRC = Peoplersquos Republic of ChinaSPDB = Shanghai Pudong Development BankNote Loan and deposit market share for BOC and ICBC are for their domestic operations onlySources Company data Goldman Sachs research estimates
Returns on Assets Equity and Domestic Market Shares of Major China Banks 2004()
CNY (billion) ROA () ROE ()Deposit Mkt
Share ()Loan MktShare ()
Mortgage MktShare()
State Banks
ICBC 004 14 199 187 253CCB 130 254 138 115 217ABC (NA)BOC 051 102 101 89 152Quasi-State
BoCom 015 45 37 29 34CMB 060 161 20 19 29
CITIC Industrial 007 17 17 16 18SPDB 048 153 16 16 26
8132019 Government Banking and BRICs in the Recent Financial Crisis
httpslidepdfcomreaderfullgovernment-banking-and-brics-in-the-recent-financial-crisis 4857
983106983122983113983107 983111983151983158983141983154983150983149983141983150983156 983106983137983150983147983155 983137983150983140 983110983145983150983137983150983139983145983137983148 983123983156983137983156983141983139983154983137983142983156
48
China EverbrightGuangdong Development mdash mdash 12 11 mdashIndustrial Bank 037 126 11 10 10Quase-Private
Bank of Shanghai 129 360 07 05 14Hua Xia 038 116 11 09 07Shenzhen Development 017 75 07 06 08Bank of Beijing 037 108 07 04 07
Sector totalThree state-banks 438 391 622Second tier banks 144 127 154
ABC = Agriculture Bank of China BOC = Bank of China BOCOM = Bank of Communications CCB =China Construction Bank CMB = China Merchantrsquos Bank CNY = yuanICBC = Industrial and Commercial Bank of China mkt = market NPL = nonperforming loan ROA =return on asset ROE = return on equity prov = provisioning PRC =Peoplersquos Republic of China SPDB = Shanghai Pudong Development BankNote Loan and deposit market share for BOC and ICBC are for their domestic operations onlySources Company data Goldman Sachs research estimates
Further data from 2006-10 from the Peoples Bank of China suggests that the big5 state banks continue to outperform the next 12 largest joint stock commercial banksThe big five have launched sales of shares to capitalize while listing on capital marketsand adopting reporting of financial data along lines of international standards Thisappears to be similar to Banco do Brasil policies that retain majority of shares in federalgovernment control while capitalizing the bank through issues of stock
Comparing the Performance of Big 5 State Banks and Next 12 Joint Stock CommercialBanks in China
2006 2007 2008 2009 2010
Profit Margin Big 5 State Banks 3116 3143 2586 3026 3269
Next 12 JS Commercial Banks 2050 2791 1796 2159 2365
Returns Big 5 State Banks 507 606 860 691 675(risk adj) Next 12 JS Commercial Banks 459 570 1016 714 723
Op Risk Big 5 State Banks 5548 5539 5215 5319 5322Next 12 JS Commercial Banks 5886 5721 5725 5831 5947
Leverage Big 5 State Banks 1626 1482 1724 173 1734Next 12 JS Commercial Banks 2826 2251 2064 2048 1936
ROE Big 5 State Banks 1424 1557 1999 1925 2037Next 12 JS Commercial Banks 1564 2049 2156 1840 1967
Big 4 and 11 JSCBsSource Peoples Bank of China China Financial Stability Reports 2007-11
Performance indicators reported by the Peoples Bank of China for the big 5 statebanks and 12 next largest joint stock commercial banks also suggest that the largestgovernment banks in China retain significant competitive advantages ndash and may providepolicy alternatives Given the current shift of economic policy in China away fromindustry and export led growth to more sustainable domestic oriented growth and socialinclusion the role of state banks clearly comes to the fore
8132019 Government Banking and BRICs in the Recent Financial Crisis
httpslidepdfcomreaderfullgovernment-banking-and-brics-in-the-recent-financial-crisis 4957
983106983122983113983107 983111983151983158983141983154983150983149983141983150983156 983106983137983150983147983155 983137983150983140 983110983145983150983137983150983139983145983137983148 983123983156983137983156983141983139983154983137983142983156
49
Net Operating Income of Big 5 State Banks and Next 12 CommercialBanks 100 million RMB YuanBig 5 State Banks 2006 2007 2008 2009 2010
Balance Net interest income 349703 500456 556790 532206 720152Net fee amp commission inc 48524 103817 138464 175469 232491
Investment income 216089 283725 338865 324037 340440
Other business income (1807) (17054) 47548 33791 2186
Net operating income 612509 870944 1081667 1065503 1314943
Percent Net interest income 5709 5746 5148 4995 5477
Net fee amp commission inc 792 1192 1280 1646 1768
Investment income 3528 3258 3133 3041 2589
Other business income (030) (196) 440 318 166
Net operating income 10000 10000 10000 100 100
Next 12 Joint Stock CommercialBanks 2006 2007 2008 2009 2010
Net interest income 87253 132945 198965 191276 281588
Net fee amp commission inc 7850 16247 27319 30115 42023
Investment income 20959 32172 44864 50767 50500
Other business income 2306 4498 16359 10384 7400
Net operating income 118468 185861 287507 282542 381511
Percent Net interest income 7365 7153 6920 6769 7381
Net fee amp commission inc 671 874 950 1066 1101
Investment income 1769 1731 1560 1797 1324
Other business income 195 242 569 368 194Net operating income 10000 10000 10000 10000 10000
Source Peoples Bank of China China Financial Stability Reports 2007-11
Big 4 and 11 JSCBsBig 5 = ICBC ABC BOC CCB BOCOMNext 12 Joint Stock Commercial Banks = China CITIC Bank Everbright Bank Huaxia BankGuangdong Development Bank Shenzhen Development Bank China Merchants Bank Shanghai PudongDevelopment Bank Industrial Bank China Minsheng Banking Corporation Evergrowing Bank ChinaZheshang Bank Bohai Bank
In conclusion bank change in China also appears to confirm our findings from
Brazil ndash that state banks have realized competitive advantages and increased marketshares since liberalization while providing counter cyclical credit to ameliorateadjustment to crisis The modernization of the China Postal Savings Bank is ofparticular interest given its social mission downmarket focus and 40000 branchOffices throughout the country Expansion of card payment services through the postalbank system confirms the importance of the Brazilian federal savings bank (CaixaEconocircmica Federal Caixa) as agent for federal government social policy and agentresponsible for management of citizenship cards (12 million) and payment of familygrants This back to the future modernization of savings banks has proved essential forovercoming notorious levels of social exclusion and inequality in Brazil Althoughenglish language materials are unavailable on the China Postal Savings Bank thisinstitution clearly presents profound opportunities for comparable policies in China
8132019 Government Banking and BRICs in the Recent Financial Crisis
httpslidepdfcomreaderfullgovernment-banking-and-brics-in-the-recent-financial-crisis 5057
983106983122983113983107 983111983151983158983141983154983150983149983141983150983156 983106983137983150983147983155 983137983150983140 983110983145983150983137983150983139983145983137983148 983123983156983137983156983141983139983154983137983142983156
50
Reported offer of microfinance services for poverty reduction as part of nationaleconomic stimulous plan may point to developments in this direction
Given that state planning capacity has long been at the center of attention intheories of financial statecraft the role of Chinese state banks in redirecting policiesaccording to the 12th 5 Year plan for 2011-15 seems critical From 2000-5 the 10th 5
Year plan emphasized infrastructure and the attraction of investment and labor skillsThe 11th 5 Year plan (2006-10) raised concerns about sustainability rather than growthlevels while also seeking to spread improvements to balance development better servepeople and improve the quality of life continue to support Center and West provincesand revitalize Northeast provinces In comparison the 12th 5 Year plan calls for morebalanced lsquoinclusiversquo growth and structural adjustemts more than 4 trillion RMB($US600 billion) for targeted industries and interior regions a focus on new energynew materials and information and high technologies biology and new medicineenergy converstaion and environmental protection aerospace marine and advancedmanufacturing This implies fundamental shifts away from industry to services that hasbeen reported in macroeconomic data for 2010 If past studies emphasized directed
credit and industrial change the role of Chinese state banks in realizing transformationscertainly warrants study
Although the domestic flow of funds process of liberalization (or the lackthereof) and insertion of banking into Chinese political economy is beyond the scope ofthis paper our findings from Brazil appear to provide valuable hypotheses about ChinaThat is to say the big state banks and other government banks in China remaincommanding heights not in the Marxist sense of providing means to reach socialismbut immense institutions with profound presence throughout politics and markets in thecountry In this sense our findings from Brazil appear to approximate patterns ofchange in China more than Washington Consensus expectations about liberalization andprivatizations to free private and foreign banks Financial statecraft draws attention tothe capitalization of Chinese state banks through stock Sales and listings on capitalmarkets However like the Banco do Brasil (that reformers in the 1990s sought to shiftcontrol to the private sector only to increase federal government shareholding) theChinese experience surely involves unexpected consequences and patterns of changedifferent than a linear transition to the Berle amp Means paradigm of corporategovernance
Russia The New State Duopoly
ldquoThe rush of 2003-8 increased the market share of foreign banks to 285 from
52 However the state-owned banks received enormous help from the federal budget in the days of the crisis thereby strengthening their dominant
position on the Russian financial market says Sergey Aleksashenko the formerDeputy chairman of Russias Central Bank quotes Russia Profile Today one
must not harbor any illusion of a fair competition with them all the main cash
flows in Russia are controlled by state-owned banks httpwwwbarentsnovacomnode1031
Description of banking policy in Russia during the global financial crisis can beobtained from Bank of Russia annual reports and related publications The figure on the
following page summarizes the financial flows to and from the Bank of RussiaAlthough central bank policy is beyond the scope of this study the role of state banks in
8132019 Government Banking and BRICs in the Recent Financial Crisis
httpslidepdfcomreaderfullgovernment-banking-and-brics-in-the-recent-financial-crisis 5157
983106983122983113983107 983111983151983158983141983154983150983149983141983150983156 983106983137983150983147983155 983137983150983140 983110983145983150983137983150983139983145983137983148 983123983156983137983156983141983139983154983137983142983156
51
channeling counter-cyclical credits released by the Bank of Russia appear to confirm thecore argument that emerges from our studies of the Brazilian banking system Furtherdata on the following pages also suggest that state banks in Russia performed wellduring 2008-10 confirming on the basis of sparse data taken from Bank of Russiareports and documents that public banks have modernized provided counter-cyclical
credit to reverse credit crunch and economic downturn while realizing competitiveadvantages over private and foreign banks
8132019 Government Banking and BRICs in the Recent Financial Crisis
httpslidepdfcomreaderfullgovernment-banking-and-brics-in-the-recent-financial-crisis 5257
983106983122983113983107 983111983151983158983141983154983150983149983141983150983156 983106983137983150983147983155 983137983150983140 983110983145983150983137983150983139983145983137983148 983123983156983137983156983141983139983154983137983142983156
52
The following aggregate figures reported by the Bank of Russia suggest severaltrends of significance First Chart 32 suggests that household deposits shifted fromRuble deposits to foreign currency pegged (or indexed) during 2008 Second Chart 33illustrates the substantial increase of non-bank overdue debt during second semester
2008
Consequently the financial results and profitability of banks declinedsignificantly during 2008 The greater confidence in deposits with government banksfound abroad suggests that this may have been critical in Russia
Performance data deom 2008-10 provides a clearer picture one that is consistentwith our findings in Brazil State banks appear to have outperformed all other types of
banks except medium and small regional banks The following table reports the averagereturns on assets and returns on equity reported by the Bank of Russia 2008-10
Returns on Assets and Equity by Type of Bank in Russia 2008-9
Return on assets Return on equity 2008 2009 2010 2008 2009 2010
-------------------------------------------------------------------------------------------------------------------State Banks 22 08 24 157 46 148Foreign Banks 18 11 21 146 83 145Large private banks 13 03 11 106 28 84Medium-Small Banks Moscow 15 12 14 68 52 67
Medium-Small Regional Banks 21 12 15 131 65 98--------------------------------------------------------------------------------------------------------------------Source Bank of Russia Bank Supervision Reports 2009 and 2010
8132019 Government Banking and BRICs in the Recent Financial Crisis
httpslidepdfcomreaderfullgovernment-banking-and-brics-in-the-recent-financial-crisis 5357
983106983122983113983107 983111983151983158983141983154983150983149983141983150983156 983106983137983150983147983155 983137983150983140 983110983145983150983137983150983139983145983137983148 983123983156983137983156983141983139983154983137983142983156
53
Further data from the Bank of Russia on the capital adequacy of Banks during2009-10 suggest that foreign banks and large private banks remain less capitalizedagainst risks according to Basel II guidelines albeit at levels almost double thatrecommended by the Bank for International Settlements (80 risk weighted) Although
further analysis is needed this data is consistent from that reported in Brazil thatgovernment banks tend to more cautious and more prudent in terms of placing asidehigher levels of reserves and patrimony against possible losses
Capital Adequacy of Banks by Type of Bank in Russia 2009-10
2009 2010 2011---------------------------------------------------------------------------------------------------------State Banks 184 227 186Foreign Banks 155 196 195Large Private Banks 140 181 155
Medium-Small Banks Moscow 316 312 268Medium-Small Regional Banks 219 241 207Non-Bank Credit Institutions 372 1038 678---------------------------------------------------------------------------------------------------------Source Bank of Russia Bank Supervision Report (Moscow) 2009 p 43
Finally Bank of Russia bank supervision reports also suggest that state banksexpanded their market shares of assets and capital during the years following the globalfinancial crisis While large private banks and foreign banks lost market share of bankassets and bank capital in Russia state banks increased their significant market sharefrom 405 ndash 426 percent and 471-476 percent of assets and capital respectivelyUnfortunately data from previous years and for specific banking groups was notobtained However this data does appear to indicate that our findings of competitiveadvantages and policy alternatives
Number and Market Share by Type of Bank
N Banks Assets Capital---------------------------- ---------------------------- ----------------------------
Type of Bank 2009 2010 2011 2009 2010 2011 2009 2010 2011-------------------------------------------------------------------------------------------------------------------------------State 17 22 27 405 439 458 471 489 473
Foreign 101 106 108 187 183 180 172 169 191Large Private 136 139 131 346 333 305 276 287 269Med-Small Moscow 361 335 317 27 26 26 43 34 35Medi-Small Regional 443 412 372 28 28 27 36 31 29Other Credit Institutions 50 51 57 07 04 04 01 02 03Total 1108 1058 100 100 100 100 100 100-------------------------------------------------------------------------------------------------------------------------------Source Bank of Russia Bank Supervision Report 2009 amp 2010
In sum politics and financial statecraft have led to the realization of significantcompetitive advantage by Russian state banks Sperbank and Vneshtorgbank increasedtheir share of bank assets from 32 percent in 2005 to over 50 percent by 2011 through
mergers and acquisitions and aggressive displacement of foreign banks Whatever thepolitics data from the Bank of Russia suggests that monetary authorities released a
8132019 Government Banking and BRICs in the Recent Financial Crisis
httpslidepdfcomreaderfullgovernment-banking-and-brics-in-the-recent-financial-crisis 5457
983106983122983113983107 983111983151983158983141983154983150983149983141983150983156 983106983137983150983147983155 983137983150983140 983110983145983150983137983150983139983145983137983148 983123983156983137983156983141983139983154983137983142983156
54
series of counter cyclical credit injections during 2008-9 to domestic bankinginstitutions Moreover data suggests that state banks continue to perform at or ahead oflevels reported by regional private and foreign banks The large market share andimproved performance of state banks reported in recent data suggests although the datais sparse that government banks in Russia have also modernized realized competitive
advantages and provided policy alternatives against the impact of financial crisisabroadWe were unable to find evidence of policy making toward social inclusion at the
Bank of Russia or Russian state banks despite the historical trajectory of the Sberbankas a savings bank under communism The context also appears to differ considerably Asurvey of the Zircon Research Group reportedly found that only 15 percent of Russiansretain bank accounts because of mistrust in banks and government This combination ofrealist politics and the realization of competitive advantages by Russian state bankssuggests that theories of economic statecraft in the realist tradition may indeed explainthe domestic developments under study
Conclusion
This paper reports evidence about government bank modernization and financialstatecraft in BRIC countries designed to counter the effects of crisis and shape domesticgrowth Government banks in BRIC countries have contributed to the widely notedadjustment of these economies to global financial crisis and economic downturnContrary to the Washington Consensus that prevailed during much of the 1980s and1990s (that privatization and liberalization especially of banking would free marketforces and deepen domestic financial systems) a quite different process of bank changeappears to have ensued after financial liberalization in the BRICs
Instead of replacement of state banks with private banks government banksremain central agents of domestic credit and growth and have modernized ldquojust intimerdquo The capitalization and realization of competitive advantages by large governmentbanks during the 2000s meant that once the US financial panic spread across capitalmarkets broke highly leveraged private and produced runs on private bank depositspolicy makers in BRIC countries nonetheless retained counter cyclical policyalternatives through their more solid large state banks
These findings counter traditional foci on the private sector individualentrepreneurship and ideals of free markets linked to the political and social advancesrecorded around the world in the last decades We report an anomaly for theories offinancial repression and the Washington Consensus about the virtues of privatization
and liberalization Although largely blamed for reproducing underdevelopment in thepast BRIC government banks averted excesses of private banking that drove creditbubbles such as home mortgages and derivatives in the US And since liberalization ofbanking (we have not adequately discussed how much liberalization occurred in eachcountry) government banks have modernized to compete with private and foreignbanks Government banks have realized competitive advantages and provided policyalternatives These two arguments help explain why BRIC countries have farecomparatively well in the face of financial crisis in core countries
Financial statecraft is therefore at the center of BRIC counter cyclical capacitiesand state planning Brazil Russia India and China fared significantly better thanadvanced and many developing countries in terms of adjusting to credit crunches and
export shocks This is because government banks proved critical interbank credit toretain confidence in domestic banking systems These institutions also presented other
8132019 Government Banking and BRICs in the Recent Financial Crisis
httpslidepdfcomreaderfullgovernment-banking-and-brics-in-the-recent-financial-crisis 5557
983106983122983113983107 983111983151983158983141983154983150983149983141983150983156 983106983137983150983147983155 983137983150983140 983110983145983150983137983150983139983145983137983148 983123983156983137983156983141983139983154983137983142983156
55
policy alternatives for political and social forces Politics shaped adjustment andrecovery through state banks differently in BRIC countries Given the realities of statecentered political realism in Russia the redirection of state banks toward goals ofChinese Five Year Plans and the modernization of the State Bank of India amidst anamorphous federalism the experience of Brazil with democratization and public bank
modernization may stand out (Armijo 2009)Further analysis of savings banks and cooperative banks also will be requiredAs members of the World Savings Bank Institute (a global association of savingsbanks) the Caixa in Brazil SNI and NABARD in India and China Postal Savings Bankappear to have provided access to very large numbers of previously unbanked citizensThis returns to traditional ideas of social banking and the history of savings banks thatwere founded throughout Europe since the late 18 th century The upmarket strategy andexpansion into investment banking and international banking of the Russian Sberbankconstrasts with downmarket strategies of savings banks in Brazil India and China
The financial press has recently reported doubts about bad loans in Chinese statebanks and cast doubt on the financial results posted and reported in this paper
However current estimates of 2-5 percent bad loans in Chinese state banks pale incomparison to the US$1240 billion in bad loans shifted to asset managementcompanies in the mid 2000s before capitalization of these institutions through sale ofshares Critics of state banking in Brazil also point to past levels of bad loans (reaching30-40 percent) because of their capture during military government delayed transitionBut the cost of capitalization and transfer of bad loans from Brazilian state banks alsoremained below US$400 billion and is still contingent on liquidation of assetmanagement companies created in 2001 In any case these numbers are very smallcompared to GAO estimates of US$120 trillion in emergency infusions by USmonetary authorities to banks and financial institutions from 2007-11
These are anomalies for recent market-based banking theory and neo-liberalpolicy designs However they do not run counter to orthodoxy in economics andbanking theory Over the last decades economic reforms (fiscal financial monetaryand banking) have improved transparency and brought public policy and marketexpectations closer However expectations about deregulation and free marketequilibria in banking and finance have succumbed in the face of panic and the stillsobering consequences of crisis The materials presented herein are descriptive and willrequire more careful analysis However given the urgency of searching for alternativedevelopment models and different approaches to financial statecraft in BRIC countriesand beyond we have taken the liberty to present research in initial stages and toprovoke thought along the lines suggested by our kind conveners
8132019 Government Banking and BRICs in the Recent Financial Crisis
httpslidepdfcomreaderfullgovernment-banking-and-brics-in-the-recent-financial-crisis 5657
983106983122983113983107 983111983151983158983141983154983150983149983141983150983156 983106983137983150983147983155 983137983150983140 983110983145983150983137983150983139983145983137983148 983123983156983137983156983141983139983154983137983142983156
56
Appendix on Alternative Banking and Social Inclusion
This appendix describes how ideas about government banking led to further work onalternative banking and social inclusion with help from the Rockefeller FoundationBellagio Center In July 2011 we were able to convene a conference designed to gather
scholars alternative banking executives and representatives from savings andcooperative bank associations to rethink strategies for social inclusion in the globalsouth and attempt to launch a new policy agenda Given the search for alternativestrategies to counter crisis and the advances of stabilization transparency and bankingsupervision in developing and emerging economies we call for alternative bankingcommunities in the global north and south to work together and help shape a new policyagenda for social inclusion Because savings banks credit cooperatives and otheralternative banking and finance institutions have realized competitive advantages andemerged from crisis we can now think beyond We believe that new policies may helpdeveloping and emerging nations redirect large domestic institutions such as postal andsavings banks toward meeting the UN millennium goals to eliminate poverty by 2015
Plans include writing a green paper on Core Principles for Alternative Bankingand Social Inclusion convening events to promote these principles through institutionalsupporters and networks and seeking adoption of these principles at policy venues suchas the World Savings Bank Institute the International Association of CooperativeBanks the Bank for International Settlements the International Financial ReportingStandards foundation the ISO International Standards Organization the Charter forResponsible Business regional development banks and the World Bank We also planto submit an edited volume of scholarly contributions on alternative banking and socialinclusion by year-end 2012 Interested parties are welcome to participate
Institutional supporters and networks include
Institutional SupportersColumbia University School of International and Public Affairs New YorkInstitute for Money Technology and Financial Inclusion University of CaliforniaIrvineKingacutes College Department of Management LondonSatildeo Paulo Business School Getulio Vargas FoundationSecond University of Naples
Networks
Association of Emerging Market Business Schools Satildeo Paulo BrazilCommunity of European Management Schools BrusselsCritical Political Economy NetworkEuropean Association of Co-operative Banks BrusselsGlobal Public Policy Network LondonInternational Cooperative Banking Association BrusselsSocial Science Finance Network AmsterdamSociety for Advancement of Social Economics PhiladelphiaWorld Savings Bank Institute Brussels
8132019 Government Banking and BRICs in the Recent Financial Crisis
httpslidepdfcomreaderfullgovernment-banking-and-brics-in-the-recent-financial-crisis 5757
983106983122983113983107 983111983151983158983141983154983150983149983141983150983156 983106983137983150983147983155 983137983150983140 983110983145983150983137983150983139983145983137983148 983123983156983137983156983141983139983154983137983142983156
Core Principles for Alternative Banking and Social Inclusion
Commitment to End Capital StarvationPromote access to and use of banking and financial services by all through newtechnologies and distribution channels to capitalize assets among the poor
Commitment to Universalize Income Savings Credit and FinanceProvide basic income via ATM cards and mobile banking to reach the poor and opennew channels of access to income savings credit finance insurance and opportunities
Prudent Banking and Regulatory ComplianceAlternative banking seeks to work within regulations guidelines and best practicesrecommended by domestic monetary authorities and international regulatory institutionssuch as the Bank for International Settlement Basel II Capital Risk Guidelines
Corporate Social Responsibility Leadership
Integrate corporate social responsibility into down-market business strategies andinstitutions of representation and democratization
Transparency and AccountabilityPublish annual reports and balance sheets in accord with international best practices offinancial social and sustainability reporting
Leadership in Provision of New Banking Services and Products to the PoorUse competitive advantages in banking and institutional networks to channel moreeffectively capital income and finance to the poor
Generate Sustainable Income and Household Asset AccumulationUse branch offices and new banking technologies to accelerate progress toward UNmillennium goals to eliminate poverty
Universalize Financial EducationPromote financial education to encourage responsible banking and finance and avertpredatory lending and unethical practices
Adopt Cutting Edge Technology and Management Practices to Provide
Competitive Alternative to Private Commercial and Investment Banks
Incorporate electronic card and mobile banking services to better serve the poorContribute to Realization of Bellagio Principles for SustainabilityPromote alternative banking and business practices that contribute to environmentallysustainable income consumption and production as stated in Bellagio Principles forSustainability
Respect and Build on National and Regional DifferencesI d f i l d l l i b ki i i i d i i l

8132019 Government Banking and BRICs in the Recent Financial Crisis
httpslidepdfcomreaderfullgovernment-banking-and-brics-in-the-recent-financial-crisis 557
983106983122983113983107 983111983151983158983141983154983150983149983141983150983156 983106983137983150983147983155 983137983150983140 983110983145983150983137983150983139983145983137983148 983123983156983137983156983141983139983154983137983142983156
5
Statecrafting Monetary Authority Democracy and Financial Order in Brazil PeterKingstoneacutes analysis of coalitions Christine Kearneyacutes analysis of neo-liberal policiesand studies of recentralization and federalism by Leslie Armijo Kent Eaton and DavidSamuels all explore the political determinants of economic policies in Brazil11
Polanyirsquos The Great Transformation and Shonefieldrsquos Modern Capitalism
remain canonic studies of financial statecraft Polanyi argued that laissez faire liberalism during the 19th century generated movements of social self-defense in theform of organized labor efforts to address the social question and central banking toprotect private banks from downturns and currency devaluation under the gold standardOther interventions such as tarrifs imperialist expansion subsidies to agriculture andindustry and top-down social policies also prevailed over liberalism and free marketsespecially after the 1873 depression Statecrafting often in authoritarian forms thusreappeared in the latter 19th century after decades of liberalism Thereafter two worldwars and recovery from economic depression meant that political imperatives continuedto dominate domestic policymaking After 1945 Shonefield argues that ContinentalEuropeans reshaped government ownership in response to the political and economic
imperatives of recovery rather than ideology or nationalist design This emphasis onnecessity and improvisation places the statecrafting tradition closer to Lindblomrsquosmuddling-through conception of policymaking than Marxist-Leninist or nationalisttheories that saw large state banks as means to ideological ends
Recent scholarship has returned to core ideas of statecrafting For Kirschnerbecause the impact of alternative financial arrangements and policies on welfare is oftenequal or unpredictable politics rather than independent economic judgements bothshape and explain policy choices and the configuration of markets12 Statecrafting thusdescribes the political construction of coalitions to support economic policies and theadoptionadaptation of policies to the particularities of domestic markets institutionsand politics13 Hoffman traces how political ideas periodically recast the US financialsystem during critical junctures of change since independence14 Laurence Toya andAmyx also argue that politics explain the origin character and implementation of lsquobigbangrsquo financial reforms in Great Britain and Japan in the 1980s15 Peacuterez describes howdomestic groups determined banking and finance reforms in Spain16 This is consistentwith Maxfieldrsquos description of how the formation of a bankeracutes coalition shapedfinancial reforms and policies in Mexico17 However during the last decades domesticeconomic statecrafting has become virtually synonomous with imposing liberal reformsWe report fundamentally different developments from the BRICS The realization ofcompetitive advantages by government banks since liberalization and the importance of
11
Our approach also can be described from Claus Offe as a sociological approach to political economy ndashone that focuses on how social organizations interests and political coalitions sustain economic policiesOffe Claus lsquoPolitical Economy Sociological Perspectivesrsquo in Goodin Robert E amp Klingemann Hans-Dieter (eds) A New Handbook of Political Science Oxford Oxford University Press 1998 pp 675-69012 Kirschner Jonathan (ed) Monetary Orders Ambiguous Economics Ubiquitous Politics Ithaca NYCornell University Press 200313 Conaghan Catherine M amp James M Malloy Unsettling Statecraft Democracy and Neoliberalism in
the Central Andes Pittsburgh PA University of Pittsburgh Press 199414 Hoffmann Susan Politics and Banking Ideas Public Policy and the Creation of Financial
Institutions Ithaca NY Cornell University Press 200115 Laurence Henry Money Rules The New Politics of Finance in Britain and Japan Ithaca NY CornellUniversity Press 200116 Peacuterez Sofiacutea Banking on Privilege The Politics of Spanish Financial Reform Ithaca NY Cornell
University Press 200317 Maxfield Sylvia Governing Capital International Finance and Mexican Politics Ithaca NY CornellUniversity Press 1990
8132019 Government Banking and BRICs in the Recent Financial Crisis
httpslidepdfcomreaderfullgovernment-banking-and-brics-in-the-recent-financial-crisis 657
983106983122983113983107 983111983151983158983141983154983150983149983141983150983156 983106983137983150983147983155 983137983150983140 983110983145983150983137983150983139983145983137983148 983123983156983137983156983141983139983154983137983142983156
6
these large institutions for domestic policy making particularly for counter-cyclicalcredit and social inclusion This comes at a critical time of reassessment in the US andadvanced economies
Errors of Deregulation and Crisis in the US
A clearer explanation of the financial panic in US sub-prime mortgage markets alsohelps explain why BRIC countries suffered less and recovered more quickly From theperspectives of BRICs the excesses of deregulation and market based banking are theanomalies ndash not the reality of smoothing the growth curve and encouraging socialinclusion Competing hypotheses rushed to explain the origin and evolution of the USfinancial panic and crisis (Gorton 2008) The US Government Commission (2010) splitwith dissenters presenting separate explanations However for purposes of comparisonto BRICs review of antecedents crisis mechanisms and policy responses suggest botherrors of deregulation and particular complementarities in market-centered financecapitalism Asset bubbles are not new to financial markets However the deregulation
of capital markets and the dual bubble of long-term housing prices and quick valuationof mortgage backed securities and other derivatives produced unprecedented crisis in2007 Policy statements national accounts Federal Reserve balance sheets and markettrends and working papers indicate the following causes and consequences
First the steep valuation of the Case-Schiller Home Price Index from 1988-2009suggests a long-term asset bubble has changed US political economy and producedstructural imbalances From 1895-1995 home prices largely accompanied inflation(Baker 2007) However from 1995 to June 2006 home prices outpaced inflation by anestimated 70 percent This produced a US$ 25 trillion home price bubble and a fullUS$ 80 trillion in housing related wealth effects Construction alone during this periodincreased from an estimated 4-6 percent of US GDP
Second policies designed to counter financial crisis in 2000 such as low interestrates fueled another round of home price increases while construction and consumptionwere encouraged by further deregulation of financial markets Revocation of the Glass-Steagal law (1999) the Commodities and Futures Act of 2000 and the ConsolidatedEntity Supervision Act of the Securities and Exchange Commission (2004) freed USbanks to sell and securitize mortgages and other assets virtually without supervisionInstead of convergence toward International Financial Reporting Standards and Bankfor International Settlements (BIS) Basel II Accord capital reserve requirements USbanks were permitted to leverage freely and sell largely without consumer protectionregulations The US turn to deregulation remains an outlier Elsewhere domestic
regulators banks and financial institutions have adopted policies and reforms toconverge toward BIS domestic bank regulations and more effective capital marketsupervision
Third the valuation of mortgage backed securities and derivatives created afundamentally new situation once problems appeared in 2007 Data from the SecuritiesIndustry and Financial Markets Association suggest how the value of asset backedsecurities exploded after deregulation Values of outstanding debt and new debt issuedfrom 1996-2008 reveal an abrupt capitalization of mortgage related and asset backedsecurities typical of asset bubbles Longstanding bond markets such as municipal bondstreasury bonds corporate debt federal agency securities money markets and assetbacked bonds all remained on relatively stable growth trajectories until crisis hit in
2007 In comparison the market value of mortgage related bonds almost doubled fromUS$35 trillion in 2000 to reach US$89 trillion before crisis in 2007
8132019 Government Banking and BRICs in the Recent Financial Crisis
httpslidepdfcomreaderfullgovernment-banking-and-brics-in-the-recent-financial-crisis 757
983106983122983113983107 983111983151983158983141983154983150983149983141983150983156 983106983137983150983147983155 983137983150983140 983110983145983150983137983150983139983145983137983148 983123983156983137983156983141983139983154983137983142983156
7
Fourth central drivers of the financial market bubble in the US were secondarymarkets for mortgage backed securities and derivatives For example throughout thefinancial panic and crisis municipal bond markets remained largely stable despitefalling tax receipts and the impact of crisis on sub-national government budgets Thevalue of US Treasury bonds also increased during crisis reflecting a flight to quality
much criticized by surplus countries such as China This remains a comparativeadvantage of market-centered finance capitalism Despite originating crisis a flight toquality cheapens counter cyclical policies Corporate bonds also increased during crisisas US Federal Reserve banks and treasury injected funds to keep US firms afloatFurther analysis is needed However data from bond markets suggest that marketcentered finance capitalism retains particular sets of complementarities and policyalternatives
Fifth both government policies during crisis and proposals for new regulatoryframeworks are designed to tap these complementarities After September 2008 USgovernment reserves increased from US$ 900 billion to over two trillion dollars largelythrough new credit facilities created by the Federal Reserve Board and regional banks of
the Federal Reserve System US government reserves first increased through massiveextension of credit then through central bank swaps then through acquisition of federalgovernment securities by the US central bank These policies suggest particularconfigurations and complementarities in market-centered finance capitalism
The first program introduced in February 2008 was the Federal Reserve PrimaryDealer Credit Facility an overnight loan facility to ensure funds for primary dealers oftreasury securities to sustain demand in financial markets US government primarycredit borrowing increased from under US$200 billion through September 2008 to overUS$1100 billion by December 2008 but decreased thereafter to under US$400 billionby April 2009 US Federal Reserve Banks also purchased massive amounts of assetbacked securities to sustain markets In November 2008 the Federal Deposit InsuranceCorporation created a Temporary Liquidity Guarantee Program one that provided overUS$3340 billion by April 2009 (Given that FDIC funds are taken from charges onsavings accounts this transfer of funds from savings accounts to emergency financialpolicy credits has attracted criticism from community banking association members)US monetary authority purchases of GSE mortgage backed securities also reachedUS$125 trillion in GSE ldquoagencyrdquo mortgage backed securities US$2000 billion indirect agency obligations and permitted purchase of up to US$3000 billion in treasurysecurities during 2009 The Federal Reserve Board also created a Term Asset-BackedSecurities Loan Facility
In September 2008 the Federal Reserve Board created an Asset-Backed
Commercial Paper Money Market Mutual Fund Liquidity Facility to stave off financialpanic Lending through the Federal Reserve Bank of Boston reached US$1500 billionby September 2008 However loans under this program declined to near zero in Apriland remained below US$200 billion in May 2009 The Federal Reserve Board alsocreated a Commercial Paper Funding Facility through the Federal Reserve Bank of NewYork to avert financial panic spreading into commercial paper markets Loans to banksunder this facility reached US$3500 billion in January 2009 but declined to underUS$1400 billion by June 2009 The Federal Reserve Board also created a TermAuction Facility in December 2009 to ensure liquidity in uninsured interbank lendingmarkets Lending through this facility remained at approximately US$1400 billion intoOctober 2008 but increased to almost US$US5000 billion in March 2009 before
declining to an estimated US$ 3200 billion outstanding in June 2009
8132019 Government Banking and BRICs in the Recent Financial Crisis
httpslidepdfcomreaderfullgovernment-banking-and-brics-in-the-recent-financial-crisis 857
8132019 Government Banking and BRICs in the Recent Financial Crisis
httpslidepdfcomreaderfullgovernment-banking-and-brics-in-the-recent-financial-crisis 957
983106983122983113983107 983111983151983158983141983154983150983149983141983150983156 983106983137983150983147983155 983137983150983140 983110983145983150983137983150983139983145983137983148 983123983156983137983156983141983139983154983137983142983156
9
but should not conceal the counter intuitive modernization of government banksalongside (and often ahead) of private and foreign banks
A third explanation draws from the institutional complementarity hypothesis toargue that different policies in BRICS captured particular complementarities in bankingand finance to avert more severe impacts on economic activity This is a promising
approach but one that exceeds our ability to retrace the domestic policies amidst crisisacross four major countriesA fourth explanation is taken from the World Capitalist System approach and
focuses on the profound structural changes implied by recent growth and betteradjustment in BRIC countries This perspective also provides significant opportunitiesfor reflection and interpretation that must remain beyond the scope of this paper Theemergence of BRIC nations as driving force in the global economy is a fundamentallynew situation for theories of center-periphery north-south dependent development andtheories that focus on the specific trajectories of nations in what used to be called latelate development
A final explanation of why BRIC countries have fared comparatively better in
the face of global financial crisis is scale The very large size of these economiesprovided policy options unavailable to smaller countries From this perspective closedeconomies are less subject to the impacts of sudden stops in foreign finance during andafter the financial crisis and less exposed to export declines during global downturnsMoreover large closed BRIC economies retain options of turning away from exportstoward domestic investment and consumption a characteristic especially importantgiven atrocious income distribution and social exclusion This dimension also remainsbeyond the scope of this paper on public banking and domestic financial statecraft
Unless we are mistaken these explanations are complementary to our core claimsthat government banks made a difference in terms of avoiding the creation of asset bubblesrealizing competitive advantages over private and foreign banks since liberalization andproviding counter cyclical policy alternatives to ameliorate downturn Case studies of theBRICs follow
Brazil
We begin with Brazil Our research on Brazil suggests that since price stability the return todemocracy and liberalization of the banking system in 1995 federal banks have realizedcompetitive advantage over private and foreign banks while providing policy alternatives topolitical and social forces This article extends this argument to suggest that these institutionshave modernized amidst liberalization and globalization across BRIC countries ldquojust in timerdquo
to retain client confidence and provide counter-cyclical credit to avert domestic downturns inthe face of global crisis
8132019 Government Banking and BRICs in the Recent Financial Crisis
httpslidepdfcomreaderfullgovernment-banking-and-brics-in-the-recent-financial-crisis 1057
983106983122983113983107 983111983151983158983141983154983150983149983141983150983156 983106983137983150983147983155 983137983150983140 983110983145983150983137983150983139983145983137983148 983123983156983137983156983141983139983154983137983142983156
10
The market shares of government banks private banks and foreign banks in domesticBrazilian credit from 1988-2009 are reported in Figure 1 First the trajectories of credit fromgovernment private and foreign banks suggests that state presence in banking declined during the 1990s through privatization of state government banks However sincecapitalization and reform in 2001 government banks increased market share substantiallyconsistent with our argument that they have modernized to compete alongside private andforeign banks Further comparison of government private and foreign bank policies suggestthat government banks 1) provide more loans per capita 2) provide more counter-cyclicalcredit to help firms and households through economic downturns and 3) hold treasury bonds
for the term rather than trading or unloading a difference that helps reduce market pressuresto shorten the term and increase the cost of government debt
Bank Returns in Brazil and Select Latin American and Reference Countries 2003-20072003 2004 2005 2006 2007
------------------------------------------------------------------------------------------Brazil Government 235 215 265 337
Private 160 262 259 273Foreign 101 61 166 106Bank System 158 176 212 206 224
Argentina -227 -42 70 143 97Chile 167 167 179 186 162
Mexico 161 172 244 262 202Australia 242 228 253 270 281Canada 147 167 149 209 125Spain 132 141 169 199South Africa 116 162 152 183 184---------------------------------------------------------------------------------------------Excludes credits under guarantee Source Bankscope cited in Central Bank of Brazil Financial Stability
Report November 2008 p 56 and Central Bank of Brazil Financial Stability Reports 2004-7
The above table also suggests that government banks have also systematicallyoutperformed private and foreign banks operating in Brazil since capitalization of theseinstitutions to meet Basel II Capital Risk guidelines of the Bank for International Settlements
in 2001 This is an anomaly for theories of private bank efficiency and expectations of liberalreforms in the 1990s Moreover counter-cylical lending exposes government banks to late
983088
983093
983089983088
983089983093
983090983088
983090983093
983091983088
983089 983097 983096 983096
983089 983097 983096 983097
983089 983097 983097 983088
983089 983097 983097 983089
983089 983097 983097 983090
983089 983097 983097 983091
983089 983097 983097 983092
983089 983097 983097 983093
983089 983097 983097 983094
983089 983097 983097 983095
983089 983097 983097 983096
983089 983097 983097 983097
983090 983088 983088 983088
983090 983088 983088 983089
983090 983088 983088 983090
983090 983088 983088 983091
983090 983088 983088 983092
983090 983088 983088 983093
983090 983088 983088 983094
983090 983088 983088 983095
983090 983088 983088 983096
983090 983088 983088 983097
983077
983129983141983137983154
Figure 1 Government Private and Foreign Bank Lending as percent
of Brazilian GDP 1988-2009
983120983154983145983158983137983156983141
983111983151983158983141983154983150983149983141983150983156
983110983151983154983141983145983143983150
8132019 Government Banking and BRICs in the Recent Financial Crisis
httpslidepdfcomreaderfullgovernment-banking-and-brics-in-the-recent-financial-crisis 1157
983106983122983113983107 983111983151983158983141983154983150983149983141983150983156 983106983137983150983147983155 983137983150983140 983110983145983150983137983150983139983145983137983148 983123983156983137983156983141983139983154983137983142983156
11
and non-payment of loans This reduces profits Strategies to ldquoholdrdquo government securitiesalso reduce profits Nonetheless government banks have reported stronger returns thanforeign and domestic banks on average since capitalization in 2001
The above data may conceal bad banking practices such as crony credit bad loans andcosts that in the end must be passed on to others through fiscal accounts or the money supply
Data from the Central Bank of Brazil help control for these possibilities and provide furthercomparison of bank performance This section compares government private and foreignbanks in terms of the Basel Index bad credit late loans and stress tests that estimate theimpact of hypothetical shocks to bank portfolios from foreign exchange devaluation andorcredit problems
First the Basel Index for government domestic and foreign banks from 2002-2006suggests that government banks remain capitalized well above levels set in Central Bank ofBrazil guidelines (110 set in 1999) The Bank for International Settlements suggests an 80level of capital in reserve against possible losses in lending and finance The average BaselIndex for government banks increased from 167 percent in 2002 to 197 percent in 2006 Incomparison the average Basel Index for private domestic banks increased from 151 pecent
to 170 percent during this period while foreign banks on average reported Basel Indexes of152 in 2002 remaining at 154 in 2006 This suggests that government banks in Brazil retainsufficient capital in reserve against risks arising from bad credit or losses in financialmarkets
Bank System Basel Index in Brazil Select Latin American and Reference Countries
2002 2003 2004 2005 2006---------------------------------------------------------------------------------------------Brazil Government 167 148 165 174 197
Private 151 171 183 177 170Foreign 152 167 187 164 154
Chile 141 136 130 125 120Mexico 144 141 145 163 159Australia 100 104 104 104 103Canada 134 133 129 125 121Spain 126 123 122 119South Africa 124 140 127 123 122
---------------------------------------------------------------------------------------------Source Central Bank of Brazil Financial Stability Report 2002-2006Note Basel Index = recommended minimum eleven percent relation between required net worth and risk-
weighted total assets
A closer look at changing Basel indexes reveal the consequences of counter-cyclicallending from federal government banks Because private domestic and foreign banks adoptedmore cautious strategies and provided less credit during the downturn of 2002 theseinstitutions maintained levels of capital reserves above levels found in government banksThe average Basel index for the domestic financial system thus remained roughly the same atyear-end 2002 (06 percent increase to 162 over June 2002) However this average concealsan increase of 21 percent in the Basel Index for private banks (largely meaning they chose tohold low risk rated government paper) and a decline of 23 percent of the Basel Index forgovernment banks (meaning they incurred risks to lend during downturn and adjustment)Before assuming the worst readers should note two matters First the Central Bank of Brazilrequires banks to maintain a Basel Index of 110 This is three points greater than the 80
8132019 Government Banking and BRICs in the Recent Financial Crisis
httpslidepdfcomreaderfullgovernment-banking-and-brics-in-the-recent-financial-crisis 1257
983106983122983113983107 983111983151983158983141983154983150983149983141983150983156 983106983137983150983147983155 983137983150983140 983110983145983150983137983150983139983145983137983148 983123983156983137983156983141983139983154983137983142983156
12
suggested in the 1988 Basel Accord and subsequent revisions for capital guidelines In otherwords Brazilian banks set aside almost half again more in additional capital reserves thanlevels recommended by the Bank for International Settlements Second the different BaselIndex ratings of government and private banks also reflects the greater weight of credit andtherefore credit risk in these institutions And data on bad and late loans since 2001 suggest
that the slight and temporarily higher levels of average Basel Indexes reported by governmentbanks do not reflect broader deterioration of portfoliosFurthermore Banks in Brazil and especially government banks tend to be more
conservative setting aside not only frac12 of deposits as compulsory reserves at the Central Bankof Brazil but also retaining additional reserves against bad loans and losses Firstcomparative data suggests that Brazilian banks tend to set considerably larger sums aside inreserve against bad loans and other losses Of the four large Latin American countries andfour further economies reported by the IMF and Central Bank of Brazil Brazil retainedsubstantially larger reserves against bad loans than any country except Spain during 2007This confirms the particular characteristics of banking in Brazil that of a higher cost andlower operating efficiency combined with larger reserves and provisions against losses
Bank Reserves as Percent of Overdue amp Late Loans in Brazil Select Latin American andReference Countries
2003 2004 2005 2006 2007 2008---------------------------------------------------------------------------------------------Brazil 3200 3719 2874 2800 2862 2709Argentina 792 1029 1251 1303 1303Chile 1309 1655 1776 1985 2107Mexico 1671 2018 2321 2074 1947Australia 1318 1829 2030 2052 1889Canada 435 477 493 553 449Spain 2454 2196 2518 2733South Africa 542 613 643---------------------------------------------------------------------------------------------Source IMF Global Financial Stability Report 2008 cited in Central Bank of Brazil Financial Stability
Report November 2008 p 56
The level of bad and late loans in bank portfolios is another measure of bank solidityThe convergence of bad credit levels in government private and foreign banks from 1988-2008 introduced this study Further comparison suggests that although government banksretain higher levels of bad and late loans in specific sectors (especially home loans) the value
of late loans as a percent of total loans in government banks fell below levels in private andforeign banks during 2008 (See table on following page) The value of bad credit (loans over12 months past due) in government banks decreased from R$372 billion in 2001 to R$149billion in June 2006 This places the value of bad credit in government banks below the valuefound in private and foreign banks Bad credit in private banks increased from R$173 billionin 2001 to peak at R$255 billion during 2003 declining to R$180 billion in 2006 Foreignbanks also reported increased values of bad credit from R$123 billion in 2001 peaking atR$141 billion in 2003 and declining to R$130 billion in 2006 While late loans remained 85percent of total loans in government banks in 2001 (above 75 percent in private and 65percent in foreign banks) by 2008 the relation reverses In 2008 late loans declined to 32percent of total loans at government banks while remaining at 37 percent in private banksand 45 percent in foreign banks
8132019 Government Banking and BRICs in the Recent Financial Crisis
httpslidepdfcomreaderfullgovernment-banking-and-brics-in-the-recent-financial-crisis 1357
983106983122983113983107 983111983151983158983141983154983150983149983141983150983156 983106983137983150983147983155 983137983150983140 983110983145983150983137983150983139983145983137983148 983123983156983137983156983141983139983154983137983142983156
13
Moreover government banks in Brazil continue to set aside greater provisions againstbad and late loans than private or foreign banks In 2004 government banks retained 86percent of the value of total loans in provision against losses from non-paying loans whileprivate banks retained 60 percent and foreign banks 51 percent In 2008 the level ofprovisions at government banks had declined on average to 68 percent but still remained
well above the levels of 52 and 51 percent recorded at private and foreign banks
Late Loans and Provisions in Government Private and Foreign Banks 2001-2008
Government Banks Private Banks Foreign Banks--------------------------- ----------------------------- -----------------------------R$bi R$bi R$bigt12m Late Provision gt12m Late Provision gt12m Late Provision
----------------------------------------------------------------------------------------------------------------2001 372 85 173 75 123 652002 394 55 202 73 141 60
2003 326 70 255 74 159 662004 133 35 86 160 31 60 102 32 512005 134 39 81 163 35 59 107 35 482006 149 42 68 180 44 66 130 45 532007 35 75 37 55 43 502008 32 68 37 52 45 512009 30 56 612010 20 47 40 66 41 532011 20 43 46 71 50 58----------------------------------------------------------------------------------------------------------------Note Bad credit = loans past due over 12 months Late = percent of total loans gt120 days overdue
Provision = percent of total loan value set aside as reserves against losses Empty cells reflect lack of databecause of changing reporting standards at Central BankSource Central Bank of Brazil Financial Stability Report November 2008 p 56 and 2002-2006
Again in comparative perspective the levels of late loans in Brazilian bankingremains significantly higher than other countries Table 213 reports the value of late loans asa percent of bank portfolios in Brazil select Latin American and further countries forreference This suggests that differences found in Brazilian government banks have to dowith differences in the banking system such as judicial preference for debtors over creditorsrather than the inferior performance of government banks
Late Loans as percent of Total Loans in Brazil Select Latin American and ReferenceCountries
2003 2004 2005 2006 2007----------------------------------------------------------------------------------------------------------------Brazil 39 30 35 37 32Chile 16 12 09 08 08Mexico 28 22 18 21 25Australia 03 02 02 02 02Canada 12 07 05 04 04Spain 17 17 16 14 11South Africa 24 18 15 11 12
---------------------------------------------------------------------------------------------------------------- Does not include credits covered by guaranteeSource Bankscope cited in Central Bank of Brazil Financial Stability Report November 2008 p 56
8132019 Government Banking and BRICs in the Recent Financial Crisis
httpslidepdfcomreaderfullgovernment-banking-and-brics-in-the-recent-financial-crisis 1457
983106983122983113983107 983111983151983158983141983154983150983149983141983150983156 983106983137983150983147983155 983137983150983140 983110983145983150983137983150983139983145983137983148 983123983156983137983156983141983139983154983137983142983156
14
Further comparative data confirms that the Brazilian banking system tends to run onmore expensive credit higher returns and profits and higher levels of late and bad loansBanks operating in Brazil also retain higher levels of administrative and personnel costsHowever Brazilian banks also tend to set aside more generous reserves and provisions
against losses These structural characteristics can be seen in the comparative data in the tablebelow The data on government private and foreign banks in Brazil and comparisons suggestthat the Brazilian banking system incurs higher operating costs maintains higher reservesprovisions and capital against losses and risk but nonetheless produces strong returns
Indicators of Bank Efficiency Performance and Provisions in Brazil Select Latin Americanand Reference Countries
Cost Op Exps NPL Provisions EquityIncome Assets Loans NPL Assets
----------------------------------------------------------------------------------------------------------------
Brazil 62 65 41 153 9Argentina 84 41 66 116 12Chile 53 28 10 166 7Colombia 52 59 32 144 11Mexico 58 47 20 232 12US 54 33 07 163 8Spain 56 16 07 313 12----------------------------------------------------------------------------------------------------------------Source World Bank ldquoBrazil The Industry Structure of Banking Servicesrdquo Brasiacutelia June 2007 pp
Comparison of administrative costs in Brazilian banking with levels in other large
Latin American and emerging and reference economies suggest that Brazilian banks retainhigher costs From 2001 through 2005 the value of administrative costs as a percent of bankassets in Brazil declined from 69 percent to 58 percent but remained significantly abovelevels reported from Chile (30 to 27 percent) Mexico (47 to 46 percent) and well abovereference countries such as Australia Canada and Spain (16 36 and 11 percentrespectively) Although time series lacks comparison after 2005 administrative costs inBrazilian banks decline significantly from 58 in 2005 to 42 in 2008
Bank Administrative Costs in Brazil Select Latin American and Reference Countries (Assets)
2001 2002 2003 2004 2005 2006 2007 2008-------------------------------------------------------------------------------------------------Brazil 69 61 60 61 58 55 51 42Chile 30 30 27 27 27Mexico 47 48 46 43 46Australia 17 17 16 16 16Canada 27 27 27 27 26Spain 17 17 16 14 11-------------------------------------------------------------------------------------------------- Adjusted average of total assetsSource Bankscope cited in Central Bank of Brazil Financial Stability Report November 2008 p 56
A final comparison of government private and foreign bank solidity is based onCentral Bank of Brazil estimates of the impact of hypothetical shocks to the Brazilian
8132019 Government Banking and BRICs in the Recent Financial Crisis
httpslidepdfcomreaderfullgovernment-banking-and-brics-in-the-recent-financial-crisis 1557
983106983122983113983107 983111983151983158983141983154983150983149983141983150983156 983106983137983150983147983155 983137983150983140 983110983145983150983137983150983139983145983137983148 983123983156983137983156983141983139983154983137983142983156
15
economy on domestic banks These estimates are based on the revisions of the widely usedValue-at-Risk estimates proposed by Boudoukh Richardson and Whitelaw that adapts theoriginal VaR method developed and commercialised by JP Morgan19
Stress Tests for Impact of Credit Interest Rate and Foreign Exchange Shock on Basel Index
Comparison of Government Domestic and Foreign Banks 2001-2006
2002 2003 2004 2005 2006-------------------------------------------------------------------------------------------------------------
Government 112 104 114 113 109Domestic 112 132 126 121 103Private 103 131 135 108 84-------------------------------------------------------------------------------------------------------------Source Central Bank of Brazil Financial Stability Reports 2002-2006Note Basel Index = Capital risk guideline measure defined by Bank for International Settlements BaselCommittee that recommends 8 percent relation between PR and total assets weighted by risk level Since 2002Central Bank of Brazil minimum requirements of Basel Index remains 11 percent For methods of calculationsee Central Bank of Brazil Financial Stability Report Brasilia 2006 p 76
Central Bank of Brazil tests estimate that in the face of foreign currency valuationand interest rate shock government banks would nonetheless remain at or slightly below thecapital requirements against credit risk recommended by the central bank Again it should benoted that Basel Index levels recommended in the BIS Capital Requirements guidelines forthe Basel Index of banks are 80 while the Central Bank of Brazil has set minimum BaselIndex levels of 110 Given that federal government bank portfolios include more credit thanprivate banks and especially foreign banks the estimate of a shift to 109 in the averageBasle index for federal government banks in the face of a credit shock provides furtherevidence that these financial institutions are solid and their capital reserves sufficient Insum comparison of results for government private and foreign banks in the estimatesreported by the Central Bank of Brazil of the likely impact of a shock to the Brazilianeconomy in terms of interest rates and foreign exchange rates also suggests that governmentbanks appear solid The average Basel Index reported for government banks in this stress testwas 135 above the 110 Central Bank of Brazil guideline and well above the 80 levelsuggested by the BIS
Understanding the capacity of Brazilian banks to cope with shocks and risk is not justa theoretical exercise Since the currency crisis in Mexico during 1994-1995 the newlystabilized currency was tested by shocks from home and abroad Policies first dramaticallyincreased interest rates under a fixed exchange rate regime then freed the real to devalue
under a flexible foreign exchange rate regime in January 1999 The Asian currency crisesduring second semester 1997 led the Central Bank of Brazil to increase benchmark Selicinterest rates to 434 percent in November In August 1998 the declaration of moratorium onforeign debt payments by Russia the central bank to once again increase Selic interest ratesfrom 20 to 40 percent under the fixed exchange rate regime by November of that year Theseshocks from abroad coincided with preparations for national elections during 1998 leadingthe IMF and other official creditors to provide strong support for the Brazilan governmentNonetheless by January 1999 (after the election) market pressure led to the abandonment ofthe fixed foreign exchange rate regime that had served as nominal anchor for economic
19 Calculation first published in Resenha BMampF Vol 122 1998 (described in Central Bank of Brazil
Financial Stability Report 2002 amp 2003 then as Boudoukh Jacob Matthew Richardson RichardStanton amp Robert Whitelaw ldquoMaxVaR Long Horizon Value at Risk in a Mark-to-Market Environmentrdquo Journal of Investment Management 2004Vol 2 No 3 pp 14-19
8132019 Government Banking and BRICs in the Recent Financial Crisis
httpslidepdfcomreaderfullgovernment-banking-and-brics-in-the-recent-financial-crisis 1657
983106983122983113983107 983111983151983158983141983154983150983149983141983150983156 983106983137983150983147983155 983137983150983140 983110983145983150983137983150983139983145983137983148 983123983156983137983156983141983139983154983137983142983156
16
policy since 1994 The real quickly devalued from 121 to 20 against the US dollar by theend of January and led to considerable changes in policy (a flexible foreign exhange rateregime inflation targeting and the implementation of further fiscal reforms) Once the realrevalued from R$22 against the dollar in March to R$166 in April 1999 the governmentmoved to consolidate this new triad of economic policies Since 1999 flexible foreign
exchange markets inflation targeting and fiscal reform have remained in place This suggeststhat Brazilian banks have weathered volatile parameters and large risks during a markedpolitical business cycle One involving the transition from reformist President Cardoso to PTPresident Lula Since recovery of the economy during 2004 the coalition government underPT President Lula has sought to expand the contribution of government banks to accelerategrowth and social inclusion These policies have not undermined economic fundamentals oreroded the institutional foundations of comparative advantage retained by Brazilian federalgovernment banks
In sum the advances of Brazilian banking toward Basel Accord regulations during the1990s and 2000s the adoption of more transparent and timely reporting standards and themodernization of government banks under pressures from liberalization placed federal banks
in a new situation in the face of crisis once it hit the country in 2008 A closer look at the bigthree federal government banks is in order to better understand these changes
The Banco do Brasil
Upon taking office in 2003 President Lula retained the central economic policies of theCardoso administration such as inflation targeting tight fiscal and monetary policy andthe operational independence of the Banco do Brasil However the recovery of investorconfidence during 2003 and the return of stronger growth levels during 2004 led to aperiod of what the Central Bank of Brazil describes as organic growth at the Banco doBrasil From 2004-2008 the Banco do Brasil contributed to the deepning of domesticcredit markets and emerged as leading investment bank at the Bovespa stock marketFurthermore once the Bovespa collapsed credit became short and a sharp downturnensued during 2008 the Banco do Brasil provided emergency loans infusions of capitalthrough stock purchases and the acquisition of small and mid-sized firms and banksunable to weather the sharp decline and lack of credit Although the merger of Itauacute andUnibanco in 2008 displaced the Banco do Brasil as the largest financial institution inLatin America the bank retains powerful institutional foundations of comparativeadvantage and networks that cross Brazilian society politics and markets
The Banco do Brasil also remains at the center of Brazilian politics and policydisputes Indeed leaders of the PT party faction articulaccedilatildeo (articulation) includes
career employees of the Banco do Brasil and presidents of the Brazilian bank workersunion such as Luiz Gushiken and Ricardo Berzioni Both were nominated to ministerialposts by President Silva in January 2003 By August 2003 21 of 33 top positions at theBanco do Brasil had been filled by new representatives of the PT most Banco do Brasilemployees and members of the Brazilian bank workers union Critics decriedpoliticization However the resistance of bank representatives described above topresidential appeals to increase credit during 2003 was followed by more neutralappointments during 2004 When Banco do Brasil President Cassio Casseb Limaresigned in November 2004 (under charges of irregularities in consulting contracts atthe bank) President Lula nominated Rossano Maranhatildeo Pinto a career employee andBanco do Brasil vice president to head the bank Further appointments of PMDB
political leaders to cement support for the PT coalition government were also criticizedas politicization of the bank However Banco do Brasil officials responded that these
8132019 Government Banking and BRICs in the Recent Financial Crisis
httpslidepdfcomreaderfullgovernment-banking-and-brics-in-the-recent-financial-crisis 1757
983106983122983113983107 983111983151983158983141983154983150983149983141983150983156 983106983137983150983147983155 983137983150983140 983110983145983150983137983150983139983145983137983148 983123983156983137983156983141983139983154983137983142983156
17
experienced political leaders of the PMDB brought competitive advantages to the bankbased on their networks that cross the public and private sector These networks andrelations during the second PT coalition government of President Lula also appearsdifferent than the first given the departure from core offices of the presency bylongtime advisors to Lula that came from the Banco do Brasil and bank workers union
By late 2006 only one of seven vice presidents of the Banco do Brasil was a member ofPresident Lulaacutes Workersacute Party (PT)Again Banco do Brasil policies and growth since recovery of the economy in
2004 involved first a period of expansion during four years of growth followed by aturn to counter cyclical lending and finance once financial crisis abroad produced first asevere contraction in credit supply then a sharp economic downturn in fourth quarter2008 Institutional foundations of comparative advantage are behind Banco do Brasilpolicies during both periods First the capitalization of Brazilian firms on the Bovespastock market is closely related to the groups that cross politics government banks thepowerful bank worker labor union the Banco do Brasil employee private pension fundand bank consortia often led by the Banco do Brasil investment banking division (often
joined by the BNDESpar and Caixa investment banking division) Recent developmentsare complex and will require further research However rather than convergence towardprivate banking and a market-centered financial system examination of Banco do Brasilpolicies and market shares during the 2000s suggests that federal government banks notonly remain at the center of politics policy and development strategies but that theseinstitutions have modernized to compete against private and foreign banks
The large scale and scope of the Banco do Brasil has permitted use of the bankfor counter-cyclical lending and leadership in capital markets without deteriorating bankbalance sheets Since 2003 the Banco do Brasil has remained well within domesticbank regulations and Basel Accord guidelines During 2002 and 2003 reforms at theBanco do Brasil sought to reduce costs and increase efficiency ratings Indeed therelation between the Banco do Brasil and President Lula reversed past patterns In the1950s conflicts were between national developmentalist groups at the Banco do Brasiland more orthodox Ministers of Finance In 2003 and once again during the 2008financial crisis differences between President Lula and the Banco do Brasil were thereverse Banco do Brasil management refused to dramatically increase loans in 2003and resisted requests to reduce the price of credit in 2008 In 2003 the caution imposedby political risk perceptions led President Lula to respect the operational autonomy ofthe Banco do Brasil In April 2009 Banco do Brasil President Antonio Francisco deLima Neto was fired after refusing to reduce interest rates on loans This reversal ofpolicy positions from the 1950s suggests in a broader sense a transition from the
macroeconomics of populism to the microeconomics of government banking in the 21
st
century Government banks do not provide easy or all solutions Instead credit andfinance policies are subject to market discipline credit risk analysis and the realities ofbusiness cycles
Review of the Banco do Brasilrsquos balance sheet from 2002-2008 suggests that the bankdeveloped organically from 2002-2007 with gradual increases reflecting the competitiveadvantages at the top of Brazilian banking and finance Policies changed during 2007 and2008 as the credit shortage caused by international financial crisis led to the Banco do Brasilassuming once again lending of last resort functions by extending interbank investments andloans to small and medium sized banks to avert further declines in domestic liquidity TheBanco do Brasil also acquired a 51 percent stake in the Votarantim bank to avert a run on
deposits and possible failure while acquiring Satildeo Paulo state government savings bankNossa Caixa for R$76 billion in 2008 These acquisitions reflect concern about the
8132019 Government Banking and BRICs in the Recent Financial Crisis
httpslidepdfcomreaderfullgovernment-banking-and-brics-in-the-recent-financial-crisis 1857
983106983122983113983107 983111983151983158983141983154983150983149983141983150983156 983106983137983150983147983155 983137983150983140 983110983145983150983137983150983139983145983137983148 983123983156983137983156983141983139983154983137983142983156
18
replacement of the Banco do Brasil as the largest financial conglomerate in Brazil after themerger of Itauacute and Unibanco
Banco do Brasil Balance Sheet Summary 2002-2008 R$ billion
2002 2003 2004 2005 2006 2007 2008 2009 2010 2011Assets --------------------------------------------------------------------------------------------------------Interbank Investments 101 50 27 80 175 434 951Interbank Deposits 76 283 137 209 116 77 242Securities 709 696 734 664 731 752 732Central Bank Deposits 81 186 221 244 281 334 212Loans to Private Sector 89 652 757 885 1178 1463 1810Loans to Public Sector 56 43 41 37 43 24 230Receivables 297 273 312 351 404 548 808Other AssetsTotal Assets 2046 2301 2390 2529 2963 3672 5073Liabilities ---------------------------------------------------------------------------------------------------Deposits 972 1100 1155 1376 1588 1882 2711
M MKT Borrowing 483 400 445 305 492 722 914Treasury amp BNDES 59 74 106 133 143 175 224Shareholder Equity 92 121 141 168 207 242 299Other LiabilitiesTotal Liabilities 2046 2301 2390 2529 2963 3672 5073---------------------------------------------------------------------------------------------------------------- Compulsory deposits for commercial banks according to Central Bank regulationsSource Banco do Brasil Annual Reports Historical Series 2002-2008
From 2002 through 2006 the balance sheet of the Banco do Brasil suggests a periodof growth based on loans to the private sector with deposits and shareholder equityincreasing largely apace After 2006 the balance sheet changes fundamentally with capitalinjections from money market borrowing increasing from R$492 billion in 2006 to R$914billion in 2008 while Banco do Brasil liabilities with Treasury and BNDES increased fromR$143 billion in 2006 to R$224 billion in 2008 The asset side of the balance sheet alsosuggests fundamental change Private sector lending increased from R$1178 billion in 2006to R$1810 billion in 2008 reflecting acquisition of portfolios from Nossa Caixa Interbankinvestments increased from R$175 billion in 2006 to R$951 billion in 2008 while interbankdeposits also increased from R$116 billion in 2006 to R$242 billion in 2008 The counter-cyclical lending strategies of the Banco do Brasil during 2008 also included an increase oflending to the public sector from R$24 billion in 2007 to R$230 billion Banco do Brasilreponses to government credit policy can also be seen in the release of 40 percent of
compulsory deposits retained at the central bank Banco do Brasil deposits at the central bankdeclined from R$334 billion in 2007 to R$212 billion in 2008 ndash freeing this value for loansand investments
Networks and relations during the second government of President Lula appeardifferent than the first given the departure from core offices of the presency by longtimeadvisors to Lula that came from the Banco do Brasil and bank workers union By late 2006only one of seven vice presidents of the Banco do Brasil was a member of President LulaacutesWorkersacute Party (PT) The corporate profile of the Banco do Brasil suggests once again thehybrid character of this government bank one listed on the Bovespa Novo Mercado but withover 65 percent of shares owned by the Brazilian federal government Treasury
8132019 Government Banking and BRICs in the Recent Financial Crisis
httpslidepdfcomreaderfullgovernment-banking-and-brics-in-the-recent-financial-crisis 1957
8132019 Government Banking and BRICs in the Recent Financial Crisis
httpslidepdfcomreaderfullgovernment-banking-and-brics-in-the-recent-financial-crisis 2057
983106983122983113983107 983111983151983158983141983154983150983149983141983150983156 983106983137983150983147983155 983137983150983140 983110983145983150983137983150983139983145983137983148 983123983156983137983156983141983139983154983137983142983156
20
customers in 2008 reached 479 million with the bank retaining 39700 AMTs and 766million bank cards (239 million credit cards and 527 million debit cards) Like the CaixaEconocircmica Federal the Banco do Brasil also processes government payments withretirement and social security payments numbering 745 million transactions during 2008Although this implies administrative costs (and receipts) this also brings customers and
prospective customers into Banco do Brasil branch officesDuring 2008 the Banco do Brasil continued to expand operations form jointventures acquire private and government banks and modernize operations A secondaryoffering of stock in January 2008 granting of shares by VISA to the Banco do Brasil andupgrading of the bank to investment grade BB- by Standard amp Poors in April 2008 suggestthat market orientation of the bank continues during the Lula administration despite counter-cyclical credit policies A Lower Income Segment Department was also created to assumeBanco Popular do Brasil operations along with correspondent banking relations and regionalsustainable development programs The Banco do Brasil also received permission to usesavings accounts for home loans enabling the bank to compete on level ground with CaixaEconocircmica Federal During 2008 the Banco do Brasil also acquired the state government
banks Banco do Piaui Banco de Santa Catarina (33rd largest bank in Brazil with US$30billion assets at year end 2007) and Satildeo Paulo government savings bank Nossa Caixa (12thlargest Bank in Brazil with US$267 billion in assets at year end 2007) In sum the diversecorporate divisions and financial operations of the Banco do Brasil provided policy optionsduring 2008 to counter the credit shortage and help firms and domestic banks to adjust
Banco do Brasil and Private Bank Returns and Capital Adequacy 2002-2009
Basel Index Return on Assets Return on Liquid Assets----------------------------- ----------------------------- -----------------------------BB Itauacute Bradesco BB Itauacute Bradesco BB Itauacute Bradesco
--------------------------------------------------------------------------------------------------------------2002 122 184 179 12 26 20 302 288 2832003 137 198 199 11 28 16 231 297 2282004 152 206 188 13 30 23 240 292 3092005 171 170 173 12 37 26 187 353 2842006 173 171 188 28 31 25 267 288 2632007 156 179 156 14 32 22 222 321 2442008 152 161 169 25 19 16 304 221 2112009 150 165 166 12 13 14 238 182 195-------------------------------------------------------------------------------------------------------------- Annualized first quarter 2009 resultsSource Banco do Brasil Itauacute and Bradesco Annual Reports 2002-2009
Comparison of Banco do Brasil returns and capital adequacy with the two majorprivate Brazilian banks Itauacute and Bradesco suggests that the performance and solidity of theBanco do Brasil remains equal or superior to private banks During 2002 and 2003 thecapital adequacy of the Banco do Brasil and return on assets remained below levels reportedby the two largest Brazilian private banks suggesting the impact of counter-cyclical lendingHowever after 2004 the Basel index of the Banco do Brasil reached 171 far above BISstandards of 80 and Central Bank of Brazil requirements of 110 Furthermore from 2006through first quarter 2009 returns on assets returns on liquid assets and the Basel index ofthe Banco do Brasil exceed levels reported by Itauacute and Bradesco In sum despite providingcounter cyclical credit and despite having been replaced by the Itau-Unibanco merger as the
8132019 Government Banking and BRICs in the Recent Financial Crisis
httpslidepdfcomreaderfullgovernment-banking-and-brics-in-the-recent-financial-crisis 2157
983106983122983113983107 983111983151983158983141983154983150983149983141983150983156 983106983137983150983147983155 983137983150983140 983110983145983150983137983150983139983145983137983148 983123983156983137983156983141983139983154983137983142983156
21
largest Brazilian bank the performance and capital adequacy of the Banco do Brasil remainsat or above levels reported by the two largest private banks
In sum since liberalization of banking and finance and privatization of stategovernment banks during the 1990s the Banco do Brasil has been transformed from directstate owned bank into one of two very large financial conglomerates that dominate domestic
banking in Brazil Instead of retaining easy access to funds at Treasury to cover losses theBanco do Brasil has adopted international corporate governance standards to become listedon the Bovespa Novo Mercado and retains an important role in virtually every aspect ofBrazilian banking and finance Although sale of shares in the 1990s were designed to transfercorporate governance and control of the national bank to the private sector the federalgovernment retains 65 percent of stocks after two sale of stocks capitalized the bank duringthe 2000s The massive size and wide scope of Banco do Brasil networks across bankingfinancial markets political and social forces and business have led the bank to realize recordprofits during the period of growth from 2004-2008 and provide counter-cyclical credit toavert a further decline in industrial activity and the economy as the US and global financialcrisis hit Brazil first with a 50 percent decline in the Bovespa stock market and credit
shortage followed by a steep but short decline in industrial production in late 2008 Thetransparency of Banco do Brasil quarterly reports and advances in Central Bank of Brazilsupervision of domestic banking clarify the new tensions that have emerged during the PTgovernment of President Lula These tensions reflect the modernization and competitiveadvantages of the Banco do Brasil
Caixa Econocircmica Federal (Federal Savings Bank Caixa)
The third largest domestic bank the wholly government owned Federal Savings Bank Caixawas also called on by President Lula during the recent financial crisis to increase the pace ofgrowth provide counter cyclical credit during downturns and to reduce consumer andcorporate interest rates and bank spreads Review of balance sheets and policies since 2001suggest that the Caixa retains its core business in urban development home loans real estatetransfer of funds for government programs and services and lottery administration Howeverinvestment banking management of third party funds and the creation of of new products andservices have both increased profits and increased popular access to banking and socialservices The bank has recorded record profits since R$108 billion (2002) R$16 billion(2003) and R$14 billion (2004) The Caixa became the fourth largest Brazilian investmentbank by 2003 while gaining dealer status from the Central Bank of Brazil in primary andsecondary markets for government securities At year-end 2003 the bank retained anestimated R$767 billion of government paper (over ten percent of government paper) in its
portfolio assets earning over R$135 billion that year Since recovery of the Brazilianeconomy in 2004 the Caixa has reported strong profits and continued to improve thestructure of its balance sheet and converge toward international bank reporting standards
In terms of assets deposit base and the number of employees and branches the datasuggest that the Caixa has emerged from a process of rationalization and downsizing duringthe late 1990s and expanded ldquoorganicallyrdquo since capitalization in 2001 Assets declined fromover US$999 billion in 1997 to US$363 billion in 2002 after reorganization andcapitalization Deposits also declined from US$541 billion in 1997 to US$216 billion in2002 The number of employees and branches declined from 104253 and 2316 to 98971 and1803 respectively but returned to 104934 and 2428 by 2006 After reorganization andcapitalization in June 2001 Basel indexes and the ratio of fixed assets over equity indicate
substantial reform and transition toward international banking standards The Basel Index thatmeasures the adequacy of capital reserves against possible losses and risks increased from
8132019 Government Banking and BRICs in the Recent Financial Crisis
httpslidepdfcomreaderfullgovernment-banking-and-brics-in-the-recent-financial-crisis 2257
983106983122983113983107 983111983151983158983141983154983150983149983141983150983156 983106983137983150983147983155 983137983150983140 983110983145983150983137983150983139983145983137983148 983123983156983137983156983141983139983154983137983142983156
22
135 (49 in March 2001 before capitalization) to reach 278 and remain twice above theCentral Bank minimum of 110 at 252 in 2006 The ratio of fixed assets as a proportion ofequity also declines substantially from 638 at year end 2001 to 197 in 2007
Summary of Caixa Structure and Performance 1995-2007
Assets Profits Deposits Employees Branches Basel FAEquity1995 826 672 503 99866 23161996 907 2351 515 99343 21051997 999 875 541 96300 18031998 948 1693 499 94859 18191999 684 1571 344 94194 19192000 644 1362 322 104253 19212001 436 -1265 298 98971 2013 135 6382002 363 1462 216 106548 2147 146 5372003 521 2617 281 100498 2046 192 413
2004 556 2999 345 100164 2135 202 3612005 806 4852 456 106729 2321 278 2012006 981 4874 567 104934 2428 252 1972007 1409 4485 800 106770 2052 288 1282008 1266 5735 708 103895 2069 206 119
Note Assets amp Deposits = US$billion Profits = US$million Basel = BIS Basel Accord index of capital reserveadequacy FAEquity = Fixed Assets Equity a summary indicator of bank modernizationSource Central Bank of Brazil Top 50 Banks in Brazil available at wwwbcbgovbr
Caixa Annual Reports and transition toward Central Bank and international bankaccounting standards introduce breaks in the time series of financial performance after 2001
However international bank reporting standards have been used by the Caixa since 2005 andthe data provide further view of the policies and performance of the bank Table X reportsreturns on stockholder equity assets Basel solvency index immobilization index provisionsas a percent of credit operations bank efficiency index and coverage of personnel costs Thedata are consistent with the broader comparisons reported in chapter two that suggest highprofits and returns alongside higher levels of provisions and reserves against capital riskReturns on stockholder equity have remained above 20 percent per year reaching 306percent in 2008 Returns on liquid assets remained between 09 percent and 13 percentbelow the average levels recorded by private and foreign banks The Basel Index of the Caixaremained well above the 11 percent level required by the Central Bank declining from 279in 2005 to 206 in 2008
Caixa Performance Indicators 2005-2008
Indicator 2005 2006 2007 2008 2009 2010 2011--------------------------------------------------------------------------------------------------------------------------Return on Shareholder Equity 261 260 226 306Return on Liquid Assets 11 11 09 13Basel Solvency Index 279 253 289 206Immobilization Index 201 197 129 120Provisions as Credit Operations 101 98 91 86Efficiency Index 645 642 755 718Coverage of Personnel Costs 925 896 943 868
---------------------------------------------------------------------------------------------------------------------------Source Caixa Econocircmica Federal Relatoacuterios de Administraccedilatildeo 2005-2011
8132019 Government Banking and BRICs in the Recent Financial Crisis
httpslidepdfcomreaderfullgovernment-banking-and-brics-in-the-recent-financial-crisis 2357
983106983122983113983107 983111983151983158983141983154983150983149983141983150983156 983106983137983150983147983155 983137983150983140 983110983145983150983137983150983139983145983137983148 983123983156983137983156983141983139983154983137983142983156
23
The immobilization index of the Caixa also declined from 201 percent in 2005 to120 percent in 2008 suggesting transition toward standard levels of international bankingHowever the value of provisions as a percent of credit operations remains much higher thaninternational bank practices albeit declining from 101 percent in 2005 to 86 percent in2008 Finally both the substantial increase in efficiency index from 645 to 718 percent
suggests that the Caixa has distanced further from international private bank levels that tendto approach 500 percent This has resulted in the declining level of coverage of personnelcosts and indicates the comparatively larger organizational structure and less use ofoutsourced labor at the Caixa
Caixa Deposits and Sources of Funds 2005-2008 R$million
2005 2006 2007 2008 2009 2010 2011----------------------------------------------------------------------------------------------------------------Bank Deposits 692 863 1155 1320Savings Deposits 5328 6006 7560 9255Mid-Term Savings Deposits 3873 4219 4136 4862
Certificates (1270) (1412) (1244) (1831)Escrow (2602) (2806) (2891) (3031)
Funds and Programs 794 1034 1307 1100Other 009 015 019 013Caixa Total 10690 2139 14179 6552Bank System Total 68268 78148 92672 27482Caixa Deposits as Total (156) (155) (1531) (129)----------------------------------------------------------------------------------------------------------------Source Caixa Econocircmica Federal Relatoacuterios de Administraccedilatildeo 2005-2008
The liability side of Caixa balance sheets from 2005-8 suggests that the bank hasdistanced itself from reliance on official savings programs and funding toward consumerbank and savings deposits Bank deposits increased from R$69 billion in 2005 to overR$132 billion in 2008 Savings deposits increased from R$532 billion in 2005 to overR$925 billion in 2008 Furthermore the increase of mid-term savings deposits originatedfrom sale of savings certificates instead of escrow held by the Caixa the latter subject to
judicial review and removed from balance sheets in 2008 The value of funds deposited at theCaixa from government funds and programs increased from R$79 billion in 2005 to R$110billion in 2008 although it remains less than ten percent of total deposits In terms of totalvalue of deposits and savings the Caixa increased total value of deposits from 107 billion toover 165 billion from 2005-8
Caixa Loans 2005-8 R$ million2005 2006 2007 2008 2009 2020 2011
----------------------------------------------------------------------------------------------------------------Commercial 14652 16329 19134 28854
Consumer 8925 9474 11063 13747Business 5727 6854 8071 15107
Home 20208 26113 32475 45075Sewage and Infrastructure 1646 2556 3585 5445Other 690 691 694 689Risk Provision -3773 -4469 -5090 -6900Total Caixa Loans 37195 45689 55888 80062----------------------------------------------------------------------------------------------------------------Source Caixa Econocircmica Federal Relatoacuterios de Administraccedilatildeo 2005-8
8132019 Government Banking and BRICs in the Recent Financial Crisis
httpslidepdfcomreaderfullgovernment-banking-and-brics-in-the-recent-financial-crisis 2457
983106983122983113983107 983111983151983158983141983154983150983149983141983150983156 983106983137983150983147983155 983137983150983140 983110983145983150983137983150983139983145983137983148 983123983156983137983156983141983139983154983137983142983156
24
In terms of lending the data suggests that the primary focus of the Caixa on homeloans continued during the late 2000s although substantial increases in commercial lendingfor consumer credit and businesses suggest the diversification of the Caixa across creditmarkets Since 2005 Caixa lending to consumers and business increased from R$89 billionto R$137 billion and from R$57 billion to R$151 billion respectively in 2008
And unlike the high levels of bad and late credit reported during the adjustment to theend of high inflation in 1994-6 and financial crises (1994-5 1997 1998 1999 2001 2003)the level level of late loans at the Caixa fell substantially during the years of economicgrowth and credit expansion from 2006-2008 The percent of late over total loans at the Caixafell from 68 percent in 2006 to 40 percent in 2008 for commercial loans generally and from62 percent to 59 percent for consumer loans and 75 percent to 22 percent for loans tobusiness The value of late home loans as a percent of total home loans also fell from 31 to17 percent in 2008
Caixa AA-H Credit Classification 2001-8
Days Prov-Late ision 2001 2002 2003 2004 2005 2006 2007 2008 2009 2010 2011
---------------------------------------------------------------------------------------------------------------------------------------AA lt15 0 59 56 66 63 54 50 63 94A lt15 05 243 264 313 288 393 435 401 333---------------------------------------------------------------------------------------------------------------------------------------B 15-30 1 127 126 137 139 143 158 206 271C 31-60 3 203 166 145 169 167 192 194 192D 61-90 10 178 261 207 217 133 60 45 33---------------------------------------------------------------------------------------------------------------------------------------E 91-120 30 18 19 20 20 22 13 09 07F 121-50 50 49 15 15 14 10 07 07 07G 151-80 70 15 08 09 10 08 10 10 09
H gt180 100 104 87 85 77 68 72 61 51R$billion 2094 2353 2614 3016 3855 4736 5739 818---------------------------------------------------------------------------------------------------------------------------------------Source Caixa Annual Reports 2002-2008
The credit risk matrix of Caixa loans from 2001 to 2008 confirms this trend ofimprovement (See above table) The data also provide evidence of greater transparency andthe improvement of bank reporting and accounting standards as well as Central Banksupervision of banks Instead of two categories of credit (good = all loans up to 90 daysoverdue bad = loans over 90 days overdue) the Central Bank of Brazil has adoptedinternational standards of credit classification (from AA to H) and imposed regulations that
banks increase or decrease provisions according to the distribution of loans in thesecategories The scale of provisions required by the Central Bank vary from zero percentagainst loans classified as AA to provision of 100 percent of loan values for credits classifiedas H that is to say over 180 days late
The percent of loans over 180 days late has decreased from 104 percent of total in2001 to 51 percent in 2008 Furthermore all categories of late payment except for loansbetween 15-30 days late decreased significantly from 2001 through 2008 In comparisonloans classified as AA (paid and guaranteed) and A (paid on time) increased from 59 percentto 94 percent and 243 percent to 333 percent of total loans The only category of late loansthat increased over the period is that of loans 15-30 days overdue from 127 percent to 271percent of total
The central argument of this study is that Brazilian federal government banks retaininstitutional foundations of competitive advantage over private and foreign banks Further
8132019 Government Banking and BRICs in the Recent Financial Crisis
httpslidepdfcomreaderfullgovernment-banking-and-brics-in-the-recent-financial-crisis 2557
983106983122983113983107 983111983151983158983141983154983150983149983141983150983156 983106983137983150983147983155 983137983150983140 983110983145983150983137983150983139983145983137983148 983123983156983137983156983141983139983154983137983142983156
25
data that suggests this advantage can be seen in the increasing volume and market share ofthe Caixa in debit and credit cards The number of Caixa debit cards increased from 224million in 2002 to over 482 million in 2008 with Caixa market share of debit cards increasedfrom 196 percent ot total card market in 2002 to peak at 230 percent in 2005 and remainingat 219 percent of the total number of debit cards in Brazil in 2005
Two examples illustrate the institutional foundations of comparative advantage of theCaixa in the card payment industry First like other banks in Brazil the Caixa shares anagreement with Visa for payment processing However unlike other banks in Brazil theCaixa was contracted by the federal government to distribute ATM citizenship cards torecepients of federal government family grants and other transfer programs Apparentlywithout seeking approval the Caixa stamped its brandname on the federal government ATMcitizenship card and has continued to do so despite charges of unfair competition fromprivate domestic banks Furthermore a Caixa request to transform its 110 million ATMcitizenship cards into bank cards currently pending at the Central Bank would dramaticallyincrease the number of bank card holders in Brazil (1824 million at year end 2007)
Caixa Debit and Credit Card Market Shares 2002-2008
Million Debit Cards Million Credit Cards MillionCaixa Total Mkt Caixa Total Mkt Interbank Checks
----------------------------------------------------------------------------------------------------------------2002 224 1142 (196) 16 407 (39) 229502003 280 1254 (223) 18 440 (40) 213602004 320 1491 (213) 20 535 (37) 196702005 377 1639 (230) 25 675 (37) 183902006 384 1744 (220) 31 952 (32) 162202007 400 1824 (219) 39 1177 (33) 144902008 482 42----------------------------------------------------------------------------------------------------------------Source Central Bank of Brazil Diagnoacutestico do Sistema de Pagamentos de Varejo do Brasil Adendo Estatiacutesticondash 2007 p 9 and Caixa annual reports 2003-2008
Having reviewed the Banco do Brasil and Caixa a brief look at the counter-cyclicalpolicies and performance of the third Brazilian federal government bank ndash the BNDES ndash is inorder
Banco Nacional de Desenvolvimento Econocircmico e Social (National Bank for Economic
and Social Development BNDES)
The BNDES is a paradigmatic development bank The trajectory of the BNDES involves asequence of policies and financial practices that have shaped Brazilian development Duringthe 1950s the BNDE supplied direct credits for transportation electric energy infrastructureand steel production During the 1960s the bank diversified under financial reforms Duringthe 1970s the BNDE acted to complete state-led import substitution industrialization bychanneling foreign finance and forced savings into capital goods project lending and regionaldevelopment programs During the 1980s the bank shifted away from public investmentunder pressure of fiscal crisis and foreign debt During the 1990s the BNDES became agentfor the privatization of state owned enterprises The BNDES remained virtually the onlysource of long-term finance during a decade of financial crises in emerging markets (1994-2003) Since 2000 the bank has shifted toward ldquosecond generationrdquo reforms designed tofinance the private sector and free market forces deepen domestic capital and equity markets
8132019 Government Banking and BRICs in the Recent Financial Crisis
httpslidepdfcomreaderfullgovernment-banking-and-brics-in-the-recent-financial-crisis 2657
983106983122983113983107 983111983151983158983141983154983150983149983141983150983156 983106983137983150983147983155 983137983150983140 983110983145983150983137983150983139983145983137983148 983123983156983137983156983141983139983154983137983142983156
26
and lend to small medium and micro-enterprises Since 2004 capital inflows and a boomingdomestic stock market have reinforced the capacity of the BNDES to underwrite long-terminvestments and transform large Brazilian firms into multinational corporations Since 2007BNDES President Coutinho has pursued a full service approach attempting to help star-upsmall and medium firms provide funds to expand successful firms and participate in venture
capital funds to help enterprises transit toward corporate governance standards and initial orsecondary offerings of stock on the Bovespa exchange In 2008 as financial crisis led to ashortage of credit collapse of share prices and sharp decline in industrial production byfourth quarter 2008 the BNDES also provided lending of last resort to major Braziliancorporations while retaining long term goals for massive investments in deep sea petroleumproduction
BNDES Market Share of Interbank and Non-Bank Loans 1995-2008 US$ Billion
Interbank Loans Non-Bank Loans------------------------------------------ ------------------------------------------
BNDES Mkt Total BNDES Mkt Total-----------------------------------------------------------------------------------------------------------1995 156 (324) 481 80 (38) 20711996 181 (354) 511 109 (49) 21981997 197 (278) 707 145 (68) 21031998 216 (355) 608 230 (113) 20201999 204 (410) 497 150 (35) 14282000 243 (439) 553 152 (96) 15772001 259 (504) 515 145 (104) 13912002 233 (443) 525 137 (130) 10512003 261 (419) 622 200 (141) 14152004 306 (408) 749 218 (122) 17862005 343 (373) 918 277 (113) 24312006 388 (350) 1106 329 (102) 32312007 524 (335) 1563 432 (88) 48852008 530 (493) 1073 456 (96) 4743200920102011-----------------------------------------------------------------------------------------------------------Source Central Bank of Brazil Top 50 Banks 1995-2008
Revew of BNDES lending since 1995 suggests the realization of competitiveadvantages typical of a large centralized development bank Contrary to the extensive branchoffice networks retained by the Banco do Brasil and Caixa the BNDES retains under 1900employees (compared to 105000 at Caixa) in the Rio de Janeiro and four regional officesSince 1995 the BNDES increased its market share of non-bank loans from R$80 billion (38percent) to R$200 billion (141 percent) during the economic downturn risk aversion andcredit shortage in 2003 After 2003 the BNDES market share of loans to non-financialentities decreased to 88 percent of total loans albeit increasing during 2008 to 96 percentThis suggests that the BNDES has increased its market share of lending to non-financialsector since liberalization of the industry and privatization of state government banks
8132019 Government Banking and BRICs in the Recent Financial Crisis
httpslidepdfcomreaderfullgovernment-banking-and-brics-in-the-recent-financial-crisis 2757
983106983122983113983107 983111983151983158983141983154983150983149983141983150983156 983106983137983150983147983155 983137983150983140 983110983145983150983137983150983139983145983137983148 983123983156983137983156983141983139983154983137983142983156
27
BNDES inter-bank lending also increases substantially Since the Real Plan endedinertial inflation in 1994 the BNDES has expanded its market share of interbank lendingfrom 156 billion (324 percent) in 1995 to 530 billion (493 percent) in 2008 during creditshortage and stock market collapse During previous years of financial crisis and economicreversals the BNDES also increased interbank lending significantly For example during the
1999 and 2001 crises BNDES interbank lending increased to 410 percent and 504 percentof total This marked presence in interbank loan market reflects the role of the BNDES inproviding indirect lending to targeted sectors through private foreign and other governmentbanks in Brazil
BNDES Loan Approvals by Program 1995-2007 R$ Billion
Direct Lending 1999 2000 2001 2002 2003 2004 2005 2006 2007 2008 2009--------------------------------------------------------------------------------------------------------------------------------------Finem 51 55 68 133 79 114 132 145 220 285Capital Markets 16 19 09 08 09 06 20 34 35 104Export-Import 23 34 39 77 63 56 67 40 13 32
Sub-Total 91 109 118 219 153 177 220 221 269 424Percent Total (505) (474) (468) (585) (456) (447) (469) (430) (415) (464)
Indirect Lending--------------------------------------------------------------------------------------------------------------------------------------Finem 31 40 37 16 12 16 18 27 51 60Finame 16 25 33 40 53 66 93 107 170 221Finame Agro 07 13 18 30 28 45 21 14 20 27Finame Leasing 00 000 02 02 03 02 04 06 14 16Export-Import 14 23 20 40 56 54 73 97 67 95BNDESautom 18 17 22 24 27 34 36 35 50 55Sub-Total 89 120 134 154 182 220 249 292 379 484Percent Total (495) (526) (532) (415) (544) (553) (531) (570) (585)(536)
BNDES Total 180 230 252 374 335 398 469 513 648 908----------------------------------------------------------------------------------------------------------------Source BNDES statistics by modality available on wwwbndesgovbr
Review of BNDES finance by program suggests the evolution of credit policies from1995 through 2008 and increasing reliance on indirect lending through other financialintermediaries The three major programs of direct finance Financiamento aEmpreendimentos (Business Finance Finem) Mercado de Capitais (Capital Markets) andExport-Import finance remained between 505 percent and 415 percent of total BNDESlending with the exception of 2002 Indirect lending through six broad programs remained
between 495 percent and 585 pecent of total BNDES lending with the exception of 2002Indirect lending programs include Finem business lending Financiamento de Maquinas(Machine Finance Fineme) with agricultural and leasing modalities Export-Import financingand BNDES automatic lending provisions
These trends suggest the realization of competitive advantages over private andforeign banks in Brazil BNDES long term interest rates remained substantially lower thanSelic benchmark overnight inter-bank interest rates throughout this period while the lowercost of small staff and operations of the BNDES made lending at these rates viable Anothercompetitive advantage of the BNDES over private and foreign banks is the developmentbankacutes mandate as manager of funds from the forced savings fund Fundo de Amparo ao
Trabalhador (Worker Asssistance Fund FAT) Constitutionally mandated investments inproductive activities (not government bonds) increased from R$31 billion in 2000 to R$101
8132019 Government Banking and BRICs in the Recent Financial Crisis
httpslidepdfcomreaderfullgovernment-banking-and-brics-in-the-recent-financial-crisis 2857
983106983122983113983107 983111983151983158983141983154983150983149983141983150983156 983106983137983150983147983155 983137983150983140 983110983145983150983137983150983139983145983137983148 983123983156983137983156983141983139983154983137983142983156
28
billion in 2008 comprising 170 percent of BNDES liabilities This means that 170 percentof BNDES finance and lending is based on long-term deposits that provide no liquidity riskThis provides a competitive advantage over private and foreign banks
A closer look at BNDES lending by sector suggests that the bank still focuses
primarily on industry and infrastructure Despite the adoption of second generation reformsthat seek to free market forces and accelerate innovation and productivity through small andmedium enterprises BNDES lending still focuses on large scale industrial and long-terminfrastructure finance In this respect the BNDES embodies a persistent need in developingeconomy for state-led development banking along the lines emphasized by Lewis Myrdaland development economists 50 years ago This traditional sense of commanding heights thusstill captures the role of the BNDES in Brazilian political economy Despite more than twodecades of privatizations financial liberalization bank reforms and a variety of fiscalfinancial and economic reforms that have substantially modernized the domestic Brazilianeconomy and freed market forces the BNDES remains the single most important source forlong-term finance and credit The capitalization of the Bovespa stock market from 2004-
2008 for the first time in Brazilian history reduced the virtual monopoly of BNDES overlong term finance
BNDES Operations approved and invested by Sector 1998-2007 R$billion
1998 1999 2000 2001 2002 2003 2004 2005 2006 2007Industry ----------------------------------------------------------------------------------------------------------------------------approved 96 79 126 152 171 163 145 290 395 402invested 76 84 104 132 174 161 158 234 272 306
Infrastructure ----------------------------------------------------------------------------------------------------------------------approved 116 69 110 65 161 149 137 186 240 369invested 83 66 86 75 130 100 152 171 170 209
Other--------------------------------------------------------------------------------------------------------------------------------approved 18 47 40 54 79 93 117 69 108 126investedTotal --------------------------------------------------------------------------------------------------------------------------------approved 230 195 276 271 411 404 379 545 743 897invested 190 181 230 252 374 335 398 470 513 617
----------------------------------------------------------------------------------------------------------------Source BNDES Annual Reports 2003-2008 and testimony of BNDES President to Congress March 2009
Long-term investments have produced substantial profits at the BNDES The bank hasrecorded profits each year since 1999 increasing from over R$600 million in 1999 overR$32 billion during 2005 reaching over R$73 billion in 2007 The long-term character of
BNDES finance stands in stark contrast to policies at private banks Contrary to strategy ofprivate and foreign banks to trade and hold government paper described in chapter three theBNDES suspended purchase and trading in government paper because of constitutionalmandates to contribute to development and employment Furthermore the turn to capitalmarkets at the BNDES has provided substantial returns since 2004
However this does not mean that BNDES lending protected unproductive industriesInstead of wasting resources to unnecessarily bail out firms or provide crony credit highreturns and strong profits at the BNDES suggest that lending was sound Standard indicatorsof bank performance asset quality and capital reserves against credit and capital risk provideempirical control for this All these measures suggest that the BNDES weathered the periodof adjustment and sustained counter-cyclical investment policies without placing resources atrisk beyond Central Bank of Brazil regulations and BIS guidelines And returns have
8132019 Government Banking and BRICs in the Recent Financial Crisis
httpslidepdfcomreaderfullgovernment-banking-and-brics-in-the-recent-financial-crisis 2957
983106983122983113983107 983111983151983158983141983154983150983149983141983150983156 983106983137983150983147983155 983137983150983140 983110983145983150983137983150983139983145983137983148 983123983156983137983156983141983139983154983137983142983156
29
increased since recovery in 2004 BNDES participation in the booming Bovespa stock marketsince 2003 has provided record returns
The BNDESpar subsidiary that invests in capital markets has also recorded strongreturns during the period of economic growth and into the 2008 financial crisis BNDESparreturns on liquid assets increased from 75 percent in 2004 to 277 percent in 2007 declining
to 245 percent in 2008 Average returns on assets and stock holdings also remained highbuilding the assets held by the BNDESpar subsidiary from 141 billion in 2005 to 359 billionin 2008
This increased participation of the BNDES in capital markets involves new relationsand networks across government private sector labor unions the private pension funds ofgovernment bank and government enterprise employees and financial markets By 2007BNDES participation in stockholding and mutual funds reached across 261 forms and 25mutual funds totaling over R$910 billion reals The BNDES thereby retains broad portfoliothat represents institutional foundations of comparative advantage Furthermore unlike thepolicy of private and foreign banks to trade and hold high interest rate paying short termgovernment paper during the sudden stop of foreign finance and downturn in the Brazilian
business cycle (2002-3) the BNDES expanded credit operations and reduced financialoperations in secondary markets for indexed government paper This countered the perverseimpact of the liquidity preference among private and other government banks that increasedmarket pressures and led to shorter terms and higher cost of Brazilian government debt
BNDES aversion of government paper is required by constitutional mandate tomanage forced savings funds in ways that generate employment and income As noted alarge part of BNDES resources (liabilities) are from domestic official savings programs Thevalue of FAT resources increased from R$492 billion in 2003 to R$662 billion in 2005while the PIS-Pasep fund remained at approximately R$200 billion Foreign capital has alsobeen channeled to the BNDES through multilateral agencies and foreign bond issues Foreignloans to the BNDES have declined Multilateral agencies provided R$70 billion in 2003increased funding to R$129 billion during 2004 and continued to provide R$107 billion tothe BNDES during 2005
Comparison of BNDES structure and performance with development banks abroadsuggests both the large scale and scope of BNDES operations and controls formismanagement and political abuse of the bank In 2007 BNDES total assets are almostdouble the value reported by the Inter-American Development Bank (IADB) over frac12 thevalue of total assets held by the World Bank and almost ten times the value of assets held bythe French government development bank CAF Furthermore profits and loans from theBNDES far exceeded all three institutions The US$330 billion in loans reported by theBNDES far exceed the US$67 billion from the IADB the US$110 reported by the World
Bank and US$58 billion reported by the CAF BNDES profis returns on assets and return onliquid patrimony also far exceeded those reported by these three development banks thatserve as comparative control over performance and policies at the BNDES Finally lateloans at the BNDES remained at 011 percent of total loans well below levels reported by theWorld Bank comparable to the 010 percent reported by the IADB while considerably abovethe 001 percent reported by CAF
8132019 Government Banking and BRICs in the Recent Financial Crisis
httpslidepdfcomreaderfullgovernment-banking-and-brics-in-the-recent-financial-crisis 3057
983106983122983113983107 983111983151983158983141983154983150983149983141983150983156 983106983137983150983147983155 983137983150983140 983110983145983150983137983150983139983145983137983148 983123983156983137983156983141983139983154983137983142983156
30
Comparison of BNDES and Regional Development Banks 2007 US$ billion
BNDES IADB World Bank CAF----------------------------------------------------------------------------------------------------------------Total Assets 1144 699 2080 125
Liquid Patrimony 140 203 399 41Liquid Profits 38 01 -01 04Desembolsos 339 67 110 58Credit Portfolio 928 479 978 95Capitalization percent 123 291 192 328Return on Assets percent 38 47 na 36Return on PL percent 332 07 na 105Late Loans percent 011 010 086 001----------------------------------------------------------------------------------------------------------------Source BNDES Annual Report 2007
The large scale of BNDES lending and finance make it possible for governmentpolicy to provide counter cyclical credit to avert or ameliorate economic downturns andsubstitute private and foreign credit shortages In March 2009 testimony to Congress ongovernment policies during financial crisis BNDES President Coutinho argued that bankpolicy was to reduce the cost and increase the supply of credit Resources for counter cyclicallending during 2008-2009 came from Treasury loans to BNDES released by provisionaldecrees 439 and 414 summing R$175 billion transfer of R$60 billion in CVS funds sale ofFGTS Investment Fund and bank certificates summing R$170 billion Furthermore the thirdphase of conditional credit facility shared by Inter-American Development Bank and theBNDES provided the last tranch of a total US$60 billion for BNDES operations
Two further means were used by the BNDES to infuse capital during the collapse of
the stock market and shortage of credit during 2007-8 The counter cyclical policies of theBNDES can also be seen in the over two fold increase of BNDES holdings in private equityand investment funds Table 512 reports the value of private equity and investment fundholdings of the BNDES in 2007 and 2008 BNDES funds in private equity and mutual fundsincreased from R$4038 million in 2007 to over R$10 billion in 2008 The capitalization ofmutual funds and private equity firms by the BNDES also played an important countercyclical role during this period
BNDESpar Shareholding 2007-8 R$million
Percent Value ValueShares 2008 2007
----------------------------------------------------------------------------------------------------------------Ameacuterica Latina Logiacutestica 106 6386 -Aracruz 55 1292 1292Banco do Brasil 25 10854 12752Bom Gosto (2) 345 2458 -Brasil Telecom Part 30 1666 1958Braskem 52 2275 2432Brenco 209 1400 -CEG 345 1406 -CESP 57 2347 1397Coteminas 103 1150 1340
CPFL Energia 62 6081 5506Cia Sideruacutergica Nacional 36 1513 2686CVRD 40 15082 7098
8132019 Government Banking and BRICs in the Recent Financial Crisis
httpslidepdfcomreaderfullgovernment-banking-and-brics-in-the-recent-financial-crisis 3157
983106983122983113983107 983111983151983158983141983154983150983149983141983150983156 983106983137983150983147983155 983137983150983140 983110983145983150983137983150983139983145983137983148 983123983156983137983156983141983139983154983137983142983156
31
ELETROBRAacuteS (1) 118 22400 22400EMBRAER 50 1096 1096Gerdau 35 1533 490Independecircncia 139 2500 -JBS 130 14722 11370Klabin 202 5621 -
Light 336 8225 -Marfrig 146 8176 1020MPX Mineraccedilatildeo 26 1791 1791Ouro Fino 200 1057 840Paranapanema 175 1252 08Petrobraacutes 76 10226 10226Rede Energia SA 253 2633 -Tele Norte Leste Participaccedilotildees 16 1645 1645Valepar 97 26254 15585Subtotal 163055 102941Other firms 12223 12606Total 175278 115548----------------------------------------------------------------------------------------------------------------
Source BNDESpar Financial Statements 2008 pp
The BNDES also holds blocks of shares in many major Brazilian corporationsthrough its participation subsidiary BNDESpar Comparing value of investments in 2007 and2008 suggests that large purchases capitalized firms precisely as financial crisis and downturnin Bovespa stock market made it difficult for firms to find working capital Table X reportsthe percent of total company shares held by the BNDES and their respective market values(adjusted for risk of future losses) at year end 2007 and 2008 During this year of extremelyshort and expensive credit in Brazil caused by the international financial and banking crisisthe BNDES increased shareholding by over R$60 billion reals in 28 private Brazilianenterprises Further shareholding classified as X in Five firms (Bertin 269 Brasiliana 538
Copel 239 Rio Poliacutemeros 250 Telemar 313) Once again the BNDES provided access tocapital for firms caught in the sudden credit crunch and stock market collapse unable to meetobligations or raise funds through equity issues or commercial bank credit This countercyclical role of government banks has been critical in Brazil since the 19 th century
BNDESpar Private Equity and Fund Participation 2007-2008 R$million
Fund Manager 2008 2007-------------------------------------------------------------------------------------------------------------------------Brasil 21 Dynamo 46 60PROT Mellon Financial Services 4628 -
Logiacutestica Brasil Bradesco 135 -Fire BrasilPrivate 269 250FIPGG Governanccedila amp Gestatildeo Inv 289 311Opportunity Equity Partners Mellon Financial Services 1046 578Brasil Energia Bradesco 1184 655InfraBrasil ABN-Amro 677 251Rio Bravo Cinema Rio Bravo 116 110Brascan Petro amp Gaacutes Bank Brascan 136 113AG Angra Infra-Estrutura Bradesco 380 301Satildeo Paulo Metro Fund Bradesco 791 831Other Funds 653 572Total 10356 4038---------------------------------------------------------------------------------------------------------------------------
Source BNDESpar Financial Statements 2008
8132019 Government Banking and BRICs in the Recent Financial Crisis
httpslidepdfcomreaderfullgovernment-banking-and-brics-in-the-recent-financial-crisis 3257
983106983122983113983107 983111983151983158983141983154983150983149983141983150983156 983106983137983150983147983155 983137983150983140 983110983145983150983137983150983139983145983137983148 983123983156983137983156983141983139983154983137983142983156
32
Finally Brazilian federal government triennial plans include investment targets by theBNDES If current plans are compared to 2004-7 investments several structural changes inBNDES lending appear First BNDES plans for Oil and Petroleum production reveal aprofound change for Brazilian political economy In 1990 roughly 45 percent of oilconsumed in Brazil was imported In 2007 before oil price increased reversed the balance
Brazil reported domestic production levels sufficient to meet domestic consumptionFurthermore discoveries of substantial deep sea oil reserves have led the BNDES to planmassive investments involving Petrobras and other global petroleum firms For the 2009-2012 period investments in petroleum and gas (R$2697 billion) Petrochemicals (237) andEthanol (197) sum to over R$3130 billion
BNDES Triennial Investment Plans 2004-2012
2004-7 2007-10 2008-11 2009-12----------------------------------------------------------------------------------------------------------------Petroleum amp Gas 1472 1836 2028 2697
Mining 472 527 813 480Petrochemicals 64 174 264 237Steel 198 371 312 245Automotive 150 176 264 235Electronics 143 156 140 240Ethanol 166 205 205 197Paper amp Celulose 104 200 274 90Health 51 46 51 80Industry Total 2816 3802 4437 4501----------------------------------------------------------------------------------------------------------------Source BNDES Annual Reports 2002-2006
It is of note that President Dilma Roussef was instrumental in reducing the targets for2009-12 in petroleum and gas given indications that Petrobras and existing framework foroffshore oil prospecting and production proved unable to increase investments accordingly
The BNDES also retains a presence in government projects by providing managementassistance During 2008 BNDES staff provided management support for implementation of192 projects involving R$710 billion of total R$142 billion PT government growthacceleration projects BNDES staff also participated in the design management andimplementation of President Lularsquos Poliacutetica de Desenvolvimento Produtivo (Policy forProduction Development) involving R$2100 billion targeting production chains designed tomaximize employment and regional development benefits Finally the BNDES was alsocharged to create and co-manage a Fundo Amazonia with the Ministry of Environment toprovide incentives to reduce deforestation of the Amazon region BNDES Plans for 2009include completion of concession for construction of high speed train line and service for Riode Janeiro-Satildeo Paulo corridor two blocks of highway concession sales involving three majorhighways in each block of sales sale of management concessions for regional airports andthe reorganization of INFRAERO federal government airport management company
These policies reflect the goal of BNDES policy to launch firms on the stock marketrather than maintain direct credit and finance Exceptions during 2008 involve Auto andEthanol industies both for strategic and broader policy reasons Given the sharp downturn inauto sales during fourth quarter 2008 the BNDES provided significant lending to avert
further downsizing or failure of auto companies in Brazil Given the current globalredistribution of automobile production BNDES policies are designed to help the Brazilian
8132019 Government Banking and BRICs in the Recent Financial Crisis
httpslidepdfcomreaderfullgovernment-banking-and-brics-in-the-recent-financial-crisis 3357
983106983122983113983107 983111983151983158983141983154983150983149983141983150983156 983106983137983150983147983155 983137983150983140 983110983145983150983137983150983139983145983137983148 983123983156983137983156983141983139983154983137983142983156
33
operations of major auto firms through the period of adjustment and increase theattractiveness of domestic operations in global production strategies of multinational autocompanies Ethanol production also received massive funds to sustain an industry seen ascritical for alternative and sustainable fuel source capable of replacing petroleum Ethanolreached over 50 percent of automotive fuel sales in 2007
Under the Lula government (2003-10 the BNDES also resumed lending to state andmunicipal governments Since the renegotiation of municipal and state government debts inthe late 1990s states and municipalities have been largely prohibited from taking on debtThis was emplematic of the recentralization required to control fiscal excesses during militaryrule and the prolonged period of transition to democracy Policies during the 1990s weredesigned to avert overspending seen as critical to maintain price stability under the Real Plan(1994) In 2000 the Lei de Responsibilidade Fiscal (Fiscal Responsibility Law) largelyprohibited credit and finance to state and municipal governments Since 2000 municipalitiesand states have been required to submit detailed budget statements that in turn have been thebasis for a gradual return to sub-national government finance In August 2006 central bankand Treasury regulations freed municipalities to take on credit up to 12 times liquid receipts
Since then the BNDES has led in terms of credits and finance to subnational governmentsthrough a Programa Especial de Financiamento aos Estados e Distrito Federal
The BNDES also has developed the first system in Brazil for risk analysis ofmunicipal governments and has led in the market for municipal credit freed by August 2006procedures for approval at Treasury the Central Bank and Conselho Monetaacuterio Nacional(National Monetary Council) Prosecution of mayors and firms charged with managingmunicipal credits with the BNDES revealed fraudulent practices These funds for sub-national public finance also became critical mechanisms to counter severe budget shortfallscaused by financial crisis during 2008 Given that municipal and state government tax basesare shallow and that federal government transfers provide the bulk of sub-nationalgovernment resources the Lula administration allocated R$ 40 billion to the Fundo deParticipaccedilatildeo dos Estados (State Participation Fund) through a Programa Emergencial deFinanciamento (Emergency Finance Fund) administered by the BNDES
In sum the BNDES expanded credit and finance operations substantially during fouryears of sustained growth from 2004-2007 And having helped underwrite the stock marketboom and capitalized Brazilian firms directly and indirectly through credit finance mutualfunds and private equity funds the BNDES retained sufficient scale scope and capital baseto provide counter cyclical credit and finance to help firms adjust to financial crisis and creditshortage during 2008 In retrospect the growth of the BNDES since liberalization andprivatizations of state government banks in the 1990s suggest the comparative advantages of
development banking BNDES credit and finance fell to 52 percent of fixed capitalformation in 1995 Since then the turn to neo-developmentalism and a period of sustainedeconomic growth during the Lula administration increased the BNDES share of total fixedcapital formation during 2006 and 2007 to 126 and 141 percent Critics charge thatmonopoly over FGTS and PIS-PASEP official savings funds as liabilities provide theBNDES with unfair competitive advantage over private banks In 2008 forced savings fundssummed to only 17 percent of BNDES liabilities (resources) The BNDES does not relyexclusively on forced savings for competitive advantage Instead market-oriented policies
joint-ventures with private mutual funds investment funds private equity firms large blocksof shareholding in Brazilian firms and massive amounts of credit and investment to theprivate sector at below market but still profitable long term interest rates of 625 percent
suggest that the large scale and scope of BNDES operations provide institutional foundationsof competitive advantage over private and foreign banks
8132019 Government Banking and BRICs in the Recent Financial Crisis
httpslidepdfcomreaderfullgovernment-banking-and-brics-in-the-recent-financial-crisis 3457
983106983122983113983107 983111983151983158983141983154983150983149983141983150983156 983106983137983150983147983155 983137983150983140 983110983145983150983137983150983139983145983137983148 983123983156983137983156983141983139983154983137983142983156
34
Capitalization of the BNDES by Treasury of over R$2300 billion 2009-11hascaptured attention of many observers of Brazilian development Critics and advocates agreethat the BNDES has realized significant competitive advantages over private and foreignbanks and continues to serve as significant alternative to capital markets for large scaledevelopment projects However like the downturn in planned investments by Petrobras for
oil and gas exploration and production BNDES decreased planned investments fromR$1684 billion in 2010 to R$1397 billion in 2011 We believe this indicates the limits ofmanagement and passing of period of crisis both favoring finance from capital marketsbanks and public-private partnerships
India
Analysis of Brazilian federal banks suggests that these institutions provided policy alternativewhile realizing competitive advantage over private and foreign banks The modernization ofthese institutions helps explain why these large institutions were able to stay the effects ofcredit crunch and financial market downturn in Brazil This section explores data from the
Reserve Bank of India to compare market shares of types of banks from 1972-2008 and bankperformance from 2006-10 Further analysis will be required However the data appears tosupport our core argument that government banks have modernized and realized competitiveadvantages over private and foreign banks
First the number of branch offices which serves as a measure of institutionalcoverage across India of special concern for financial inclusion and the theory thatliberalization and privatizations would lead private banks to expand branch offices andincrease the supply of services From this perspective the trajectory of branch officessuggests that nationalized banks the State Bank of India and regional rural bankssustain much larger networks of branch offices that predominate while otherscheduled commercial (private and foreign) banks retain less than 8000 branch offices
Data from the Reserve Bank of India on the number of current accounts retainedby type of bank provide further evidence that the State Bank of India and its associates
8132019 Government Banking and BRICs in the Recent Financial Crisis
httpslidepdfcomreaderfullgovernment-banking-and-brics-in-the-recent-financial-crisis 3557
983106983122983113983107 983111983151983158983141983154983150983149983141983150983156 983106983137983150983147983155 983137983150983140 983110983145983150983137983150983139983145983137983148 983123983156983137983156983141983139983154983137983142983156
35
national banks and regional rural banks provide the bulk of banking accounts to theIndian population while private and foreign banks cherry pick upscale urban marketsreproducing capital drain and inequalities
Number of Current Accounts by Type of Bank 1972-1995
Since 1999 the pattern of predominance by alternative banking institutions and the minorrole of other scheduled commercial banks and foreign banks continues
The following figures report the value held in current accounts by type of banks first fromthe 1972-1995 period then from the 1999-2008 period For both time periods the trendconfirms that private and foreign banks remain at a competitive disadvantage in terms of thebroader market while the State Bank of India and its associates nationalized banks andregional rural banks tend to predominate
8132019 Government Banking and BRICs in the Recent Financial Crisis
httpslidepdfcomreaderfullgovernment-banking-and-brics-in-the-recent-financial-crisis 3657
983106983122983113983107 983111983151983158983141983154983150983149983141983150983156 983106983137983150983147983155 983137983150983140 983110983145983150983137983150983139983145983137983148 983123983156983137983156983141983139983154983137983142983156
36
Current Account Value by Type of Bank 1972-1995 R
Number of Deposit Accounts by type of bank 1999-2008
A similar pattern appears for the trajectory of savings accounts both the number of
accounts and the value held in savings accounts both for the 1972-1995 period We wereunable to organize data from the more recent period
8132019 Government Banking and BRICs in the Recent Financial Crisis
httpslidepdfcomreaderfullgovernment-banking-and-brics-in-the-recent-financial-crisis 3757
983106983122983113983107 983111983151983158983141983154983150983149983141983150983156 983106983137983150983147983155 983137983150983140 983110983145983150983137983150983139983145983137983148 983123983156983137983156983141983139983154983137983142983156
37
Number of Savings Accounts by Type of Bank 1972-1995
Value in Savings Accounts by Type of Bank 1972-1995
Number of Term Savings Accounts by Type of Bank 1972-1995
8132019 Government Banking and BRICs in the Recent Financial Crisis
httpslidepdfcomreaderfullgovernment-banking-and-brics-in-the-recent-financial-crisis 3857
983106983122983113983107 983111983151983158983141983154983150983149983141983150983156 983106983137983150983147983155 983137983150983140 983110983145983150983137983150983139983145983137983148 983123983156983137983156983141983139983154983137983142983156
38
Value in Term Savings Accounts by Type of Bank 1972-1995
The number and value of credits extended by banks from 1999-2008 appears mostpromising in terms of comparative analysis of bank performance and behavior Thesignificant spread at the end of the time series between the State Bank of India and itsassociates and foreign banks suggests the impact of foreign financial crisis and differentdomestic policies by these types of banks in India similar to that noted in the Brazilianexperience
Number of credits by type of bank 1999-2008
Value of credit by type of bank 1996-2008
8132019 Government Banking and BRICs in the Recent Financial Crisis
httpslidepdfcomreaderfullgovernment-banking-and-brics-in-the-recent-financial-crisis 3957
983106983122983113983107 983111983151983158983141983154983150983149983141983150983156 983106983137983150983147983155 983137983150983140 983110983145983150983137983150983139983145983137983148 983123983156983137983156983141983139983154983137983142983156
39
Further data from the Reserve Bank of India from 2008-10 permit closercomparison of government private and foreign banks in the recent financial crisis Interms of deposits investments total assets and net profits the dominant and expandingrole of government banking in India is apparent Further control variables (not reported)
include gross and net NPA types of income expenses and expenditures provisions andcontingencies and credit- and investment-deposit ratios provide control for bad bankingand confirm the counter cyclical policies during 2008-10 in India
THE FOLLOWING TABLES REQUIRE INTERPRETATION
Number of Banks 2006-7 2007-8 2008-9 2009-10 2010-11
State Bank of India amp Associates 8 8 7 7 6Nationalized Banks 20 20 20 20 20Old Private Sector Banks 17 15 15 15 14
New Private Sector Banks 8 8 7 7 7Foreign Banks 29 28 31 32 33Source RBI A Profile of Banks 2010-11
Number of Branch Offices 2006-7 2007-8 2008-9 2009-10 2010-11
State Bank of India amp Associates 14673 15848 16894 18178 18772Nationalized Banks 37435 39255 40956 43452 45640Old Private Sector Banks 4723 4690 4908 5220 5011New Private Sector Banks 2599 3635 4333 5232 6957
Foreign Banks 272 277 295 308 316Source RBI A Profile of Banks 2010-11
Number of Employees 2006-7 2007-8 2008-9 2009-10 2010-11
State Bank of India amp Associates 255699 249008 268598 266605 282453Nationalized Banks 473179 466400 462926 473041 475082Old Private Sector Banks 47994 48700 51341 55052 55075New Private Sector Banks 91060 110123 124998 127468 163604Foreign Banks 28426 31301 29582 28012 27968
Source RBI - India BanksAssociation
Business per employee (in lakh) 2006-7 2007-8 2008-9 2009-10 2010-11
State Bank of India amp Associates 43635 54922 65022 73743 79306Nationalized Banks 49001 61828 78316 93586 114477Old Private Sector Banks 48159 56932 63843 69749 8149New Private Sector Banks 80782 83196 78715 84041 82607Foreign Banks 97477 11255 128274 141139 155974Note Business = Deposits + Advances
8132019 Government Banking and BRICs in the Recent Financial Crisis
httpslidepdfcomreaderfullgovernment-banking-and-brics-in-the-recent-financial-crisis 4057
983106983122983113983107 983111983151983158983141983154983150983149983141983150983156 983106983137983150983147983155 983137983150983140 983110983145983150983137983150983139983145983137983148 983123983156983137983156983141983139983154983137983142983156
40
Profit per employee (in lakh) 2006-7 2007-8 2008-9 2009-10 2010-11
State Bank of India amp Associates 257 362 443 466 42Nationalized Banks 287 377 486 567 695Old Private Sector Banks 234 406 469 42 563New Private Sector Banks 587 685 677 847 893Foreign Banks 1613 2112 2539 1692 2759
Capital amp Reserves amp Surplus(Ycrore) 2006-7 2007-8 2008-9 2009-10 2010-11
State Bank of India amp Associates 42941 61706 72422 83726 84394Nationalized Banks 92689 113079 135920 157276 205857Old Private Sector Banks 10736 15315 17477 20171 23821New Private Sector Banks 39736 76056 82192 99813 114768Foreign Banks 33075 49332 59937 69176 80972
Deposits Ycrore 2006-7 2007-8 2008-9 2009-10 2010-11
State Bank of India amp Associates 633476 773875 1007041 1108086 1245862Nationalized Banks 1360724 1679993 2105706 2583934 3127122Old Private Sector Banks 138249 165589 199274 229897 264157New Private Sector Banks 413738 509444 537104 592904 738602Foreign Banks 150750 191161 214076 232099 240689
Investments Ycrore 2006-7 2007-8 2008-9 2009-10 2010-11
State Bank of India amp Associates 211875 263823 357624 387473 385697Nationalized Banks 452981 536018 655042 828125 942837Old Private Sector Banks 43647 54080 72393 83499 92617New Private Sector Banks 171008 224498 234139 270618 329403Foreign Banks 71471 98910 130354 159291 165499
Advances Ycrore 2006-7 2007-8 2008-9 2009-10 2010-11
State Bank of India amp Associates 482270 593722 739450 857937 994154Nationalized Banks 957877 1203678 1519762 1843082 2311478
Old Private Sector Banks 92887 111670 128504 154085 184647New Private Sector Banks 321865 406733 446824 478356 612886Foreign Banks 126339 161133 165385 163260 195539
Interest Income Ycrore 2006-7 2007-8 2008-9 2009-10 2010-11
State Bank of India amp Associates 53465 70428 89196 97954 109828Nationalized Banks 110720 142647 183892 208029 256490Old Private Sector Banks 11474 14614 18790 20497 23299New Private Sector Banks 38092 56377 66282 62309 73528
Foreign Banks 17924 24417 30322 26390 28520
8132019 Government Banking and BRICs in the Recent Financial Crisis
httpslidepdfcomreaderfullgovernment-banking-and-brics-in-the-recent-financial-crisis 4157
983106983122983113983107 983111983151983158983141983154983150983149983141983150983156 983106983137983150983147983155 983137983150983140 983110983145983150983137983150983139983145983137983148 983123983156983137983156983141983139983154983137983142983156
41
Other Income Ycrore 2006-7 2007-8 2008-9 2009-10 2010-11
State Bank of India amp Associates 9420 11818 16073 18394 19240Nationalized Banks 14264 20979 26394 30500 28625Old Private Sector Banks 1568 2184 2782 3152 3029
New Private Sector Banks 10745 14822 15078 17271 17697Foreign Banks 7044 10588 14894 9951 10972
Interest Expended Ycrore 2006-7 2007-8 2008-9 2009-10 2010-11
State Bank of India amp Associates 32607 47809 61770 66229 67018Nationalized Banks 69353 101093 131676 145712 164135Old Private Sector Banks 7055 9960 12834 14076 14768New Private Sector Banks 25802 38535 44123 37130 42347Foreign Banks 7603 10604 12819 8938 10622
Operating Expenses Ycrore 2006-7 2007-8 2008-9 2009-10 2010-11
State Bank of India amp Associates 15987 16993 20088 25283 29146Nationalized Banks 27268 29670 35416 40792 53819Old Private Sector Banks 2967 3235 3939 4715 5600New Private Sector Banks 12353 17032 17840 18136 22006Foreign Banks 7745 10353 12298 11102 12557
Cost of Funds 2006-7 2007-8 2008-9 2009-10 2010-11
State Bank of India amp Associates 475 59 594 532 48Nationalized Banks 48 582 609 537 493Old Private Sector Banks 498 62 667 613 55New Private Sector Banks 524 611 604 442 427Foreign Banks 403 433 446 283 311Cost of Funds = Ratio () of interest paid on deposits and borrowings to averageof opening and closing balances of deposits and borrowings
Return on advances adjusted toCoF 2006-7 2007-8 2008-9 2009-10 2010-11
State Bank of India amp Associates 372 365 395 36 405Nationalized Banks 399 369 409 382 427Old Private Sector Banks 406 426 515 482 492New Private Sector Banks 447 505 526 514 516Foreign Banks 574 66 815 716 564
2006-7 2007-8 2008-9 2009-10 2010-11
8132019 Government Banking and BRICs in the Recent Financial Crisis
httpslidepdfcomreaderfullgovernment-banking-and-brics-in-the-recent-financial-crisis 4257
983106983122983113983107 983111983151983158983141983154983150983149983141983150983156 983106983137983150983147983155 983137983150983140 983110983145983150983137983150983139983145983137983148 983123983156983137983156983141983139983154983137983142983156
42
Wages as of Total Expenses
State Bank of India amp Associates 2155 1589 1506 171 1921Nationalized Banks 1794 1405 1331 1365 1641Old Private Sector Banks 1689 1367 1326 1457 1675
New Private Sector Banks 936 956 1017 121 1383Foreign Banks 2008 1995 1944 2348 2331
Returns on Assets 2006-7 2007-8 2008-9 2009-10 2010-11
State Bank of India amp Associates 086 097 102 091 079Nationalized Banks 094 101 103 100 103Old Private Sector Banks 078 114 115 095 112New Private Sector Banks 109 113 112 138 151Foreign Banks 228 209 199 126 174
Capital Adequacy Ratio 2006-7 2007-8 2008-9 2009-10 2010-11
State Bank of India amp Associates 1232 1321 1396 1346 1225Nationalized Banks 1237 1213 1324 1318 1347Old Private Sector Banks 1208 1408 1476 1485 1456New Private Sector Banks 1199 1439 1533 1803 1687Foreign Banks 1239 1305 1432 1726 1672Note To 2007-8 = Basel I From 2008-09 = Basel-II
Net NPA Ratio 2006-7 2007-8 2008-9 2009-10 2010-11
State Bank of India amp Associates 132 143 147 150 149Nationalized Banks 094 077 068 091 092Old Private Sector Banks 096 066 09 082 053New Private Sector Banks 097 109 129 103 056Foreign Banks 073 077 181 182 067Net NPA Ratio = Net non-performing assets as net advances
In sum descriptive data from the Reserve Bank of India confirm the anomaly
and argument drawn from the Brazilian experience An important dimension of BRICcountry recovery from the global financial crisis and downturn is the counter cyclicallending policies and realization of competitive advantages of government banks Thisposes a series of new questions for business schools and scholars of public policyInstead of liberalization and privatization leading to transitions in BRIC countriestoward capital market centered financial systems and liberal market economies publicbanks have realized competitive advantages over private and foreign banks whileproviding policy alternatives to BRIC governments in the face of financial crisis andglobal economic slowdown We return to these implications in the conclusion
One development of note at the Reserve Bank of India is a policy focus onfinancial inclusion The 2008 report of the Committee on Financial Inclusion has beenfollowed by sections of the Reserve Bank of India Annual Report reserved fordiscussion of financial inclusion And instead of focusing on liberalization and
8132019 Government Banking and BRICs in the Recent Financial Crisis
httpslidepdfcomreaderfullgovernment-banking-and-brics-in-the-recent-financial-crisis 4357
983106983122983113983107 983111983151983158983141983154983150983149983141983150983156 983106983137983150983147983155 983137983150983140 983110983145983150983137983150983139983145983137983148 983123983156983137983156983141983139983154983137983142983156
43
privatization to ensure the spread of banking products and services alternative policieshave been explored One is of special note The Committee on Financial Inclusionrecommended issue of identity cards as bank cards This would profoundly change thelandscape of banking in India and has attracted attention from analysts at the CentralBank of Brazil charged with financial inclusion as well as the President of Indonesia
and apparently Uganda officials Given the revolution in information and card paymenttechnologies this policy proposal and pilot studies deserve close attention asalternatives to dramatically increase the pace of social inclusion of the bankless
8132019 Government Banking and BRICs in the Recent Financial Crisis
httpslidepdfcomreaderfullgovernment-banking-and-brics-in-the-recent-financial-crisis 4457
983106983122983113983107 983111983151983158983141983154983150983149983141983150983156 983106983137983150983147983155 983137983150983140 983110983145983150983137983150983139983145983137983148 983123983156983137983156983141983139983154983137983142983156
44
China
This section turns to a brief review of the Chinese banking sector to further explore therole of government banks in terms of their modernization competitive advantages
policy roles and capacity for counter cyclical credit that help explain why BRICcountries were able to avert the severe consequences of the global financial crisis
First figure A11 reports the basic structure of the banking system in China
Although we have been unable to compare the evolution of types of banks acrosstime in similar ways to the above data on India taken from the Reserve Bank of Indiaour research assistants have gathered the following comparative macroeconomicfinancial and balance sheet data on banking in China The data appear to be consistentwith the core argument presented in this paper ndash that government banks havemodernized since liberalization and provided policy makers with alternative means tocounter the effects of financial crisis abroad
8132019 Government Banking and BRICs in the Recent Financial Crisis
httpslidepdfcomreaderfullgovernment-banking-and-brics-in-the-recent-financial-crisis 4557
983106983122983113983107 983111983151983158983141983154983150983149983141983150983156 983106983137983150983147983155 983137983150983140 983110983145983150983137983150983139983145983137983148 983123983156983137983156983141983139983154983137983142983156
45
We lack more current information and were unable to collect data directly fromofficial sources in China to compare the trajectory of state owned private and foreignbanks As a substitute Figure 1 reports data from 2000-4 that permits initial observationof trends for this earlier period
Those present may not need reminding of the formidable record of economicgrowth in China during this 200-4 period that continues until today However data fromthe National Bureau of Statistics suggests that the Chinese banking system expanded atan even greater pace than the remarkable levels of GDP growth recorded for the 2000-4period Furthermore credit expansion was ldquoorganicrdquo in the sense that deposits
outpaced credit growth from 2000-4
Expansion of Loans in China 1999-2004
Loan Growth Total LoansYear on Year
Growth Total Depositssup1Year on Year
GrowthYear CNY billion CNY () CNY billion CNY()1999 9373 83 10878 1372000 9937 60 1238 1382001 11231 130 14362 1602002 13129 169 17092 1902003 159 211 20806 217
2004 18857 186 25319 217
sup1Based on preliminary estimates by the National Bureau of Statistics of the Peoplersquos Republic of ChinaSource National Bureau of Statistics of the PRC
Although we lack data comparable to that from the Reserve Bank of India ableto compare the trajectory of state private and foreign banks in China the sectoralbreakdown of loans and other banking and national account data confirms the profoundcapitalization of the Chinese banking system and GDP growth during from 1995-2004
8132019 Government Banking and BRICs in the Recent Financial Crisis
httpslidepdfcomreaderfullgovernment-banking-and-brics-in-the-recent-financial-crisis 4657
983106983122983113983107 983111983151983158983141983154983150983149983141983150983156 983106983137983150983147983155 983137983150983140 983110983145983150983137983150983139983145983137983148 983123983156983137983156983141983139983154983137983142983156
46
China Banking Sector Market Dimensions (1995 - 2004)
YearTotal
LoansCorp
LoansConsuLoans
HomeLoans
TotalDeposits Excess
GovBonds
CorpBonds GDP
GDPGrowth
()1995 52310 mdash mdash mdash 5376 145 330 65 5848 2511996 63100 mdash mdash mdash 6847 538 436 60 6788 1611997 73585 7341 17 130 8212 853 551 52 7446 971998 85002 8447 53 430 9529 102 9 777 68 7835 521999 95587 9394 164 1360 10831 1273 1054 78 8207 482000 108763 10453 424 3320 13486 261 1302 86 894 892001 118990 112 699 5600 15472 3573 1562 101 9593 732002 139800 12913 1067 8258 18339 4359 mdash mdash 10479 922003 169770 15401 1576 13302 22036 5059 mdash mdash 11669 1142004 194220 16848 1988 15800 25319 5897 mdash mdash 13657 170Figures = CNYB
This data reported in terms of percent GDP provides further clarity on the rapid
capitalization of loans It is of note that the bulk of loans during this period were to thecorporate sector with consumer and home loans lagging significantly
China Banking Sector Percent GDP
YEARTotal
LoansCorporate
LoansConsumer
LoansHomeLoans Deposits
ExcessDeposits
GovBonds
CorpBonds
1995 895 00 00 00 919 25 56 111996 929 00 00 00 1009 79 64 091997 988 986 02 02 1103 115 74 071998 1085 1078 07 05 1216 131 99 091999 1165 1145 20 17 1320 155 128 092000 1217 1169 47 37 1508 292 146 102001 1240 1167 73 58 1613 372 163 112002 1334 1232 102 79 1750 4162003 1455 1320 135 114 1888 4342004 1422 1234 146 116 1854 432
Sources China Banking Regulatory Commission Peoplersquos Bank of China and GoldmanSachs research estimates
Compilation of financial data from a select number of banks in China suggeststhat the pattern of bank change encountered in Brazil and India also describes theexperience of China The liberalization of the Chinese economy and the modernization
of state banks appear to describe the process of bank change instead of a process oftransition toward private banking and capital market centered financial systemAlthough we have been unable to draw data from Chinese monetary authorities thebalance sheet data suggests the clear predominance of large state banks in the politicaleconomy of banking and finance in China How these institutions were used to counterthe effects of financial crisis abroad and redirect domestic investment production andconsumption must remain a subject for further research
8132019 Government Banking and BRICs in the Recent Financial Crisis
httpslidepdfcomreaderfullgovernment-banking-and-brics-in-the-recent-financial-crisis 4757
983106983122983113983107 983111983151983158983141983154983150983149983141983150983156 983106983137983150983147983155 983137983150983140 983110983145983150983137983150983139983145983137983148 983123983156983137983156983141983139983154983137983142983156
47
Select Financial Data from Chinese Banks 2004()
CNY (billion)Total
AssetsGrossLoans
CustomerDeposits Equity
NPLRatio
()
Pre-prov
ProfitsNet
Profits
State Banks
ICBC 5671 3705 5105 163 190 653 23CCB 3905 2226 3489 195 39 605 484ABC (NA) mdashBOC 427 2146 3342 205 51 578 209Quasi-State
BoCom 1145 639 1023 54 30 131 16CMB 587 376 513 22 29 82 32CITIC Industrial 515 306 429 20 60 52 03SPDB 456 311 397 14 24 62 20China Everbright mdashGuangdong Development 345 216 301 mdash mdash mdash 32
Industrial Bank 341 203 283 10 25 37 11Quase-Private
Bank of Shanghai 216 106 179 83 51 32 26Hua Xia 304 181 270 92 40 29 10Shenzhen Development 198 126 166 43 114 28 03Bank of Beijing 209 85 174 71 mdash 26 07
Sector total 19422 25319 129Three state-banks 2692 3979 188Second tier banks 2549 3733 148
ABC = Agriculture Bank of China BOC = Bank of China
BOCOM = Bank of Communications CCB = China Construction BankCMB = China Merchantrsquos Bank CNY = yuanICBC = Industrial and Commercial Bank of ChinaNPL = nonperforming loanROA = return on assets ROE = return on equityprov = provisioningPRC = Peoplersquos Republic of ChinaSPDB = Shanghai Pudong Development BankNote Loan and deposit market share for BOC and ICBC are for their domestic operations onlySources Company data Goldman Sachs research estimates
Returns on Assets Equity and Domestic Market Shares of Major China Banks 2004()
CNY (billion) ROA () ROE ()Deposit Mkt
Share ()Loan MktShare ()
Mortgage MktShare()
State Banks
ICBC 004 14 199 187 253CCB 130 254 138 115 217ABC (NA)BOC 051 102 101 89 152Quasi-State
BoCom 015 45 37 29 34CMB 060 161 20 19 29
CITIC Industrial 007 17 17 16 18SPDB 048 153 16 16 26
8132019 Government Banking and BRICs in the Recent Financial Crisis
httpslidepdfcomreaderfullgovernment-banking-and-brics-in-the-recent-financial-crisis 4857
983106983122983113983107 983111983151983158983141983154983150983149983141983150983156 983106983137983150983147983155 983137983150983140 983110983145983150983137983150983139983145983137983148 983123983156983137983156983141983139983154983137983142983156
48
China EverbrightGuangdong Development mdash mdash 12 11 mdashIndustrial Bank 037 126 11 10 10Quase-Private
Bank of Shanghai 129 360 07 05 14Hua Xia 038 116 11 09 07Shenzhen Development 017 75 07 06 08Bank of Beijing 037 108 07 04 07
Sector totalThree state-banks 438 391 622Second tier banks 144 127 154
ABC = Agriculture Bank of China BOC = Bank of China BOCOM = Bank of Communications CCB =China Construction Bank CMB = China Merchantrsquos Bank CNY = yuanICBC = Industrial and Commercial Bank of China mkt = market NPL = nonperforming loan ROA =return on asset ROE = return on equity prov = provisioning PRC =Peoplersquos Republic of China SPDB = Shanghai Pudong Development BankNote Loan and deposit market share for BOC and ICBC are for their domestic operations onlySources Company data Goldman Sachs research estimates
Further data from 2006-10 from the Peoples Bank of China suggests that the big5 state banks continue to outperform the next 12 largest joint stock commercial banksThe big five have launched sales of shares to capitalize while listing on capital marketsand adopting reporting of financial data along lines of international standards Thisappears to be similar to Banco do Brasil policies that retain majority of shares in federalgovernment control while capitalizing the bank through issues of stock
Comparing the Performance of Big 5 State Banks and Next 12 Joint Stock CommercialBanks in China
2006 2007 2008 2009 2010
Profit Margin Big 5 State Banks 3116 3143 2586 3026 3269
Next 12 JS Commercial Banks 2050 2791 1796 2159 2365
Returns Big 5 State Banks 507 606 860 691 675(risk adj) Next 12 JS Commercial Banks 459 570 1016 714 723
Op Risk Big 5 State Banks 5548 5539 5215 5319 5322Next 12 JS Commercial Banks 5886 5721 5725 5831 5947
Leverage Big 5 State Banks 1626 1482 1724 173 1734Next 12 JS Commercial Banks 2826 2251 2064 2048 1936
ROE Big 5 State Banks 1424 1557 1999 1925 2037Next 12 JS Commercial Banks 1564 2049 2156 1840 1967
Big 4 and 11 JSCBsSource Peoples Bank of China China Financial Stability Reports 2007-11
Performance indicators reported by the Peoples Bank of China for the big 5 statebanks and 12 next largest joint stock commercial banks also suggest that the largestgovernment banks in China retain significant competitive advantages ndash and may providepolicy alternatives Given the current shift of economic policy in China away fromindustry and export led growth to more sustainable domestic oriented growth and socialinclusion the role of state banks clearly comes to the fore
8132019 Government Banking and BRICs in the Recent Financial Crisis
httpslidepdfcomreaderfullgovernment-banking-and-brics-in-the-recent-financial-crisis 4957
983106983122983113983107 983111983151983158983141983154983150983149983141983150983156 983106983137983150983147983155 983137983150983140 983110983145983150983137983150983139983145983137983148 983123983156983137983156983141983139983154983137983142983156
49
Net Operating Income of Big 5 State Banks and Next 12 CommercialBanks 100 million RMB YuanBig 5 State Banks 2006 2007 2008 2009 2010
Balance Net interest income 349703 500456 556790 532206 720152Net fee amp commission inc 48524 103817 138464 175469 232491
Investment income 216089 283725 338865 324037 340440
Other business income (1807) (17054) 47548 33791 2186
Net operating income 612509 870944 1081667 1065503 1314943
Percent Net interest income 5709 5746 5148 4995 5477
Net fee amp commission inc 792 1192 1280 1646 1768
Investment income 3528 3258 3133 3041 2589
Other business income (030) (196) 440 318 166
Net operating income 10000 10000 10000 100 100
Next 12 Joint Stock CommercialBanks 2006 2007 2008 2009 2010
Net interest income 87253 132945 198965 191276 281588
Net fee amp commission inc 7850 16247 27319 30115 42023
Investment income 20959 32172 44864 50767 50500
Other business income 2306 4498 16359 10384 7400
Net operating income 118468 185861 287507 282542 381511
Percent Net interest income 7365 7153 6920 6769 7381
Net fee amp commission inc 671 874 950 1066 1101
Investment income 1769 1731 1560 1797 1324
Other business income 195 242 569 368 194Net operating income 10000 10000 10000 10000 10000
Source Peoples Bank of China China Financial Stability Reports 2007-11
Big 4 and 11 JSCBsBig 5 = ICBC ABC BOC CCB BOCOMNext 12 Joint Stock Commercial Banks = China CITIC Bank Everbright Bank Huaxia BankGuangdong Development Bank Shenzhen Development Bank China Merchants Bank Shanghai PudongDevelopment Bank Industrial Bank China Minsheng Banking Corporation Evergrowing Bank ChinaZheshang Bank Bohai Bank
In conclusion bank change in China also appears to confirm our findings from
Brazil ndash that state banks have realized competitive advantages and increased marketshares since liberalization while providing counter cyclical credit to ameliorateadjustment to crisis The modernization of the China Postal Savings Bank is ofparticular interest given its social mission downmarket focus and 40000 branchOffices throughout the country Expansion of card payment services through the postalbank system confirms the importance of the Brazilian federal savings bank (CaixaEconocircmica Federal Caixa) as agent for federal government social policy and agentresponsible for management of citizenship cards (12 million) and payment of familygrants This back to the future modernization of savings banks has proved essential forovercoming notorious levels of social exclusion and inequality in Brazil Althoughenglish language materials are unavailable on the China Postal Savings Bank thisinstitution clearly presents profound opportunities for comparable policies in China
8132019 Government Banking and BRICs in the Recent Financial Crisis
httpslidepdfcomreaderfullgovernment-banking-and-brics-in-the-recent-financial-crisis 5057
983106983122983113983107 983111983151983158983141983154983150983149983141983150983156 983106983137983150983147983155 983137983150983140 983110983145983150983137983150983139983145983137983148 983123983156983137983156983141983139983154983137983142983156
50
Reported offer of microfinance services for poverty reduction as part of nationaleconomic stimulous plan may point to developments in this direction
Given that state planning capacity has long been at the center of attention intheories of financial statecraft the role of Chinese state banks in redirecting policiesaccording to the 12th 5 Year plan for 2011-15 seems critical From 2000-5 the 10th 5
Year plan emphasized infrastructure and the attraction of investment and labor skillsThe 11th 5 Year plan (2006-10) raised concerns about sustainability rather than growthlevels while also seeking to spread improvements to balance development better servepeople and improve the quality of life continue to support Center and West provincesand revitalize Northeast provinces In comparison the 12th 5 Year plan calls for morebalanced lsquoinclusiversquo growth and structural adjustemts more than 4 trillion RMB($US600 billion) for targeted industries and interior regions a focus on new energynew materials and information and high technologies biology and new medicineenergy converstaion and environmental protection aerospace marine and advancedmanufacturing This implies fundamental shifts away from industry to services that hasbeen reported in macroeconomic data for 2010 If past studies emphasized directed
credit and industrial change the role of Chinese state banks in realizing transformationscertainly warrants study
Although the domestic flow of funds process of liberalization (or the lackthereof) and insertion of banking into Chinese political economy is beyond the scope ofthis paper our findings from Brazil appear to provide valuable hypotheses about ChinaThat is to say the big state banks and other government banks in China remaincommanding heights not in the Marxist sense of providing means to reach socialismbut immense institutions with profound presence throughout politics and markets in thecountry In this sense our findings from Brazil appear to approximate patterns ofchange in China more than Washington Consensus expectations about liberalization andprivatizations to free private and foreign banks Financial statecraft draws attention tothe capitalization of Chinese state banks through stock Sales and listings on capitalmarkets However like the Banco do Brasil (that reformers in the 1990s sought to shiftcontrol to the private sector only to increase federal government shareholding) theChinese experience surely involves unexpected consequences and patterns of changedifferent than a linear transition to the Berle amp Means paradigm of corporategovernance
Russia The New State Duopoly
ldquoThe rush of 2003-8 increased the market share of foreign banks to 285 from
52 However the state-owned banks received enormous help from the federal budget in the days of the crisis thereby strengthening their dominant
position on the Russian financial market says Sergey Aleksashenko the formerDeputy chairman of Russias Central Bank quotes Russia Profile Today one
must not harbor any illusion of a fair competition with them all the main cash
flows in Russia are controlled by state-owned banks httpwwwbarentsnovacomnode1031
Description of banking policy in Russia during the global financial crisis can beobtained from Bank of Russia annual reports and related publications The figure on the
following page summarizes the financial flows to and from the Bank of RussiaAlthough central bank policy is beyond the scope of this study the role of state banks in
8132019 Government Banking and BRICs in the Recent Financial Crisis
httpslidepdfcomreaderfullgovernment-banking-and-brics-in-the-recent-financial-crisis 5157
983106983122983113983107 983111983151983158983141983154983150983149983141983150983156 983106983137983150983147983155 983137983150983140 983110983145983150983137983150983139983145983137983148 983123983156983137983156983141983139983154983137983142983156
51
channeling counter-cyclical credits released by the Bank of Russia appear to confirm thecore argument that emerges from our studies of the Brazilian banking system Furtherdata on the following pages also suggest that state banks in Russia performed wellduring 2008-10 confirming on the basis of sparse data taken from Bank of Russiareports and documents that public banks have modernized provided counter-cyclical
credit to reverse credit crunch and economic downturn while realizing competitiveadvantages over private and foreign banks
8132019 Government Banking and BRICs in the Recent Financial Crisis
httpslidepdfcomreaderfullgovernment-banking-and-brics-in-the-recent-financial-crisis 5257
983106983122983113983107 983111983151983158983141983154983150983149983141983150983156 983106983137983150983147983155 983137983150983140 983110983145983150983137983150983139983145983137983148 983123983156983137983156983141983139983154983137983142983156
52
The following aggregate figures reported by the Bank of Russia suggest severaltrends of significance First Chart 32 suggests that household deposits shifted fromRuble deposits to foreign currency pegged (or indexed) during 2008 Second Chart 33illustrates the substantial increase of non-bank overdue debt during second semester
2008
Consequently the financial results and profitability of banks declinedsignificantly during 2008 The greater confidence in deposits with government banksfound abroad suggests that this may have been critical in Russia
Performance data deom 2008-10 provides a clearer picture one that is consistentwith our findings in Brazil State banks appear to have outperformed all other types of
banks except medium and small regional banks The following table reports the averagereturns on assets and returns on equity reported by the Bank of Russia 2008-10
Returns on Assets and Equity by Type of Bank in Russia 2008-9
Return on assets Return on equity 2008 2009 2010 2008 2009 2010
-------------------------------------------------------------------------------------------------------------------State Banks 22 08 24 157 46 148Foreign Banks 18 11 21 146 83 145Large private banks 13 03 11 106 28 84Medium-Small Banks Moscow 15 12 14 68 52 67
Medium-Small Regional Banks 21 12 15 131 65 98--------------------------------------------------------------------------------------------------------------------Source Bank of Russia Bank Supervision Reports 2009 and 2010
8132019 Government Banking and BRICs in the Recent Financial Crisis
httpslidepdfcomreaderfullgovernment-banking-and-brics-in-the-recent-financial-crisis 5357
983106983122983113983107 983111983151983158983141983154983150983149983141983150983156 983106983137983150983147983155 983137983150983140 983110983145983150983137983150983139983145983137983148 983123983156983137983156983141983139983154983137983142983156
53
Further data from the Bank of Russia on the capital adequacy of Banks during2009-10 suggest that foreign banks and large private banks remain less capitalizedagainst risks according to Basel II guidelines albeit at levels almost double thatrecommended by the Bank for International Settlements (80 risk weighted) Although
further analysis is needed this data is consistent from that reported in Brazil thatgovernment banks tend to more cautious and more prudent in terms of placing asidehigher levels of reserves and patrimony against possible losses
Capital Adequacy of Banks by Type of Bank in Russia 2009-10
2009 2010 2011---------------------------------------------------------------------------------------------------------State Banks 184 227 186Foreign Banks 155 196 195Large Private Banks 140 181 155
Medium-Small Banks Moscow 316 312 268Medium-Small Regional Banks 219 241 207Non-Bank Credit Institutions 372 1038 678---------------------------------------------------------------------------------------------------------Source Bank of Russia Bank Supervision Report (Moscow) 2009 p 43
Finally Bank of Russia bank supervision reports also suggest that state banksexpanded their market shares of assets and capital during the years following the globalfinancial crisis While large private banks and foreign banks lost market share of bankassets and bank capital in Russia state banks increased their significant market sharefrom 405 ndash 426 percent and 471-476 percent of assets and capital respectivelyUnfortunately data from previous years and for specific banking groups was notobtained However this data does appear to indicate that our findings of competitiveadvantages and policy alternatives
Number and Market Share by Type of Bank
N Banks Assets Capital---------------------------- ---------------------------- ----------------------------
Type of Bank 2009 2010 2011 2009 2010 2011 2009 2010 2011-------------------------------------------------------------------------------------------------------------------------------State 17 22 27 405 439 458 471 489 473
Foreign 101 106 108 187 183 180 172 169 191Large Private 136 139 131 346 333 305 276 287 269Med-Small Moscow 361 335 317 27 26 26 43 34 35Medi-Small Regional 443 412 372 28 28 27 36 31 29Other Credit Institutions 50 51 57 07 04 04 01 02 03Total 1108 1058 100 100 100 100 100 100-------------------------------------------------------------------------------------------------------------------------------Source Bank of Russia Bank Supervision Report 2009 amp 2010
In sum politics and financial statecraft have led to the realization of significantcompetitive advantage by Russian state banks Sperbank and Vneshtorgbank increasedtheir share of bank assets from 32 percent in 2005 to over 50 percent by 2011 through
mergers and acquisitions and aggressive displacement of foreign banks Whatever thepolitics data from the Bank of Russia suggests that monetary authorities released a
8132019 Government Banking and BRICs in the Recent Financial Crisis
httpslidepdfcomreaderfullgovernment-banking-and-brics-in-the-recent-financial-crisis 5457
983106983122983113983107 983111983151983158983141983154983150983149983141983150983156 983106983137983150983147983155 983137983150983140 983110983145983150983137983150983139983145983137983148 983123983156983137983156983141983139983154983137983142983156
54
series of counter cyclical credit injections during 2008-9 to domestic bankinginstitutions Moreover data suggests that state banks continue to perform at or ahead oflevels reported by regional private and foreign banks The large market share andimproved performance of state banks reported in recent data suggests although the datais sparse that government banks in Russia have also modernized realized competitive
advantages and provided policy alternatives against the impact of financial crisisabroadWe were unable to find evidence of policy making toward social inclusion at the
Bank of Russia or Russian state banks despite the historical trajectory of the Sberbankas a savings bank under communism The context also appears to differ considerably Asurvey of the Zircon Research Group reportedly found that only 15 percent of Russiansretain bank accounts because of mistrust in banks and government This combination ofrealist politics and the realization of competitive advantages by Russian state bankssuggests that theories of economic statecraft in the realist tradition may indeed explainthe domestic developments under study
Conclusion
This paper reports evidence about government bank modernization and financialstatecraft in BRIC countries designed to counter the effects of crisis and shape domesticgrowth Government banks in BRIC countries have contributed to the widely notedadjustment of these economies to global financial crisis and economic downturnContrary to the Washington Consensus that prevailed during much of the 1980s and1990s (that privatization and liberalization especially of banking would free marketforces and deepen domestic financial systems) a quite different process of bank changeappears to have ensued after financial liberalization in the BRICs
Instead of replacement of state banks with private banks government banksremain central agents of domestic credit and growth and have modernized ldquojust intimerdquo The capitalization and realization of competitive advantages by large governmentbanks during the 2000s meant that once the US financial panic spread across capitalmarkets broke highly leveraged private and produced runs on private bank depositspolicy makers in BRIC countries nonetheless retained counter cyclical policyalternatives through their more solid large state banks
These findings counter traditional foci on the private sector individualentrepreneurship and ideals of free markets linked to the political and social advancesrecorded around the world in the last decades We report an anomaly for theories offinancial repression and the Washington Consensus about the virtues of privatization
and liberalization Although largely blamed for reproducing underdevelopment in thepast BRIC government banks averted excesses of private banking that drove creditbubbles such as home mortgages and derivatives in the US And since liberalization ofbanking (we have not adequately discussed how much liberalization occurred in eachcountry) government banks have modernized to compete with private and foreignbanks Government banks have realized competitive advantages and provided policyalternatives These two arguments help explain why BRIC countries have farecomparatively well in the face of financial crisis in core countries
Financial statecraft is therefore at the center of BRIC counter cyclical capacitiesand state planning Brazil Russia India and China fared significantly better thanadvanced and many developing countries in terms of adjusting to credit crunches and
export shocks This is because government banks proved critical interbank credit toretain confidence in domestic banking systems These institutions also presented other
8132019 Government Banking and BRICs in the Recent Financial Crisis
httpslidepdfcomreaderfullgovernment-banking-and-brics-in-the-recent-financial-crisis 5557
983106983122983113983107 983111983151983158983141983154983150983149983141983150983156 983106983137983150983147983155 983137983150983140 983110983145983150983137983150983139983145983137983148 983123983156983137983156983141983139983154983137983142983156
55
policy alternatives for political and social forces Politics shaped adjustment andrecovery through state banks differently in BRIC countries Given the realities of statecentered political realism in Russia the redirection of state banks toward goals ofChinese Five Year Plans and the modernization of the State Bank of India amidst anamorphous federalism the experience of Brazil with democratization and public bank
modernization may stand out (Armijo 2009)Further analysis of savings banks and cooperative banks also will be requiredAs members of the World Savings Bank Institute (a global association of savingsbanks) the Caixa in Brazil SNI and NABARD in India and China Postal Savings Bankappear to have provided access to very large numbers of previously unbanked citizensThis returns to traditional ideas of social banking and the history of savings banks thatwere founded throughout Europe since the late 18 th century The upmarket strategy andexpansion into investment banking and international banking of the Russian Sberbankconstrasts with downmarket strategies of savings banks in Brazil India and China
The financial press has recently reported doubts about bad loans in Chinese statebanks and cast doubt on the financial results posted and reported in this paper
However current estimates of 2-5 percent bad loans in Chinese state banks pale incomparison to the US$1240 billion in bad loans shifted to asset managementcompanies in the mid 2000s before capitalization of these institutions through sale ofshares Critics of state banking in Brazil also point to past levels of bad loans (reaching30-40 percent) because of their capture during military government delayed transitionBut the cost of capitalization and transfer of bad loans from Brazilian state banks alsoremained below US$400 billion and is still contingent on liquidation of assetmanagement companies created in 2001 In any case these numbers are very smallcompared to GAO estimates of US$120 trillion in emergency infusions by USmonetary authorities to banks and financial institutions from 2007-11
These are anomalies for recent market-based banking theory and neo-liberalpolicy designs However they do not run counter to orthodoxy in economics andbanking theory Over the last decades economic reforms (fiscal financial monetaryand banking) have improved transparency and brought public policy and marketexpectations closer However expectations about deregulation and free marketequilibria in banking and finance have succumbed in the face of panic and the stillsobering consequences of crisis The materials presented herein are descriptive and willrequire more careful analysis However given the urgency of searching for alternativedevelopment models and different approaches to financial statecraft in BRIC countriesand beyond we have taken the liberty to present research in initial stages and toprovoke thought along the lines suggested by our kind conveners
8132019 Government Banking and BRICs in the Recent Financial Crisis
httpslidepdfcomreaderfullgovernment-banking-and-brics-in-the-recent-financial-crisis 5657
983106983122983113983107 983111983151983158983141983154983150983149983141983150983156 983106983137983150983147983155 983137983150983140 983110983145983150983137983150983139983145983137983148 983123983156983137983156983141983139983154983137983142983156
56
Appendix on Alternative Banking and Social Inclusion
This appendix describes how ideas about government banking led to further work onalternative banking and social inclusion with help from the Rockefeller FoundationBellagio Center In July 2011 we were able to convene a conference designed to gather
scholars alternative banking executives and representatives from savings andcooperative bank associations to rethink strategies for social inclusion in the globalsouth and attempt to launch a new policy agenda Given the search for alternativestrategies to counter crisis and the advances of stabilization transparency and bankingsupervision in developing and emerging economies we call for alternative bankingcommunities in the global north and south to work together and help shape a new policyagenda for social inclusion Because savings banks credit cooperatives and otheralternative banking and finance institutions have realized competitive advantages andemerged from crisis we can now think beyond We believe that new policies may helpdeveloping and emerging nations redirect large domestic institutions such as postal andsavings banks toward meeting the UN millennium goals to eliminate poverty by 2015
Plans include writing a green paper on Core Principles for Alternative Bankingand Social Inclusion convening events to promote these principles through institutionalsupporters and networks and seeking adoption of these principles at policy venues suchas the World Savings Bank Institute the International Association of CooperativeBanks the Bank for International Settlements the International Financial ReportingStandards foundation the ISO International Standards Organization the Charter forResponsible Business regional development banks and the World Bank We also planto submit an edited volume of scholarly contributions on alternative banking and socialinclusion by year-end 2012 Interested parties are welcome to participate
Institutional supporters and networks include
Institutional SupportersColumbia University School of International and Public Affairs New YorkInstitute for Money Technology and Financial Inclusion University of CaliforniaIrvineKingacutes College Department of Management LondonSatildeo Paulo Business School Getulio Vargas FoundationSecond University of Naples
Networks
Association of Emerging Market Business Schools Satildeo Paulo BrazilCommunity of European Management Schools BrusselsCritical Political Economy NetworkEuropean Association of Co-operative Banks BrusselsGlobal Public Policy Network LondonInternational Cooperative Banking Association BrusselsSocial Science Finance Network AmsterdamSociety for Advancement of Social Economics PhiladelphiaWorld Savings Bank Institute Brussels
8132019 Government Banking and BRICs in the Recent Financial Crisis
httpslidepdfcomreaderfullgovernment-banking-and-brics-in-the-recent-financial-crisis 5757
983106983122983113983107 983111983151983158983141983154983150983149983141983150983156 983106983137983150983147983155 983137983150983140 983110983145983150983137983150983139983145983137983148 983123983156983137983156983141983139983154983137983142983156
Core Principles for Alternative Banking and Social Inclusion
Commitment to End Capital StarvationPromote access to and use of banking and financial services by all through newtechnologies and distribution channels to capitalize assets among the poor
Commitment to Universalize Income Savings Credit and FinanceProvide basic income via ATM cards and mobile banking to reach the poor and opennew channels of access to income savings credit finance insurance and opportunities
Prudent Banking and Regulatory ComplianceAlternative banking seeks to work within regulations guidelines and best practicesrecommended by domestic monetary authorities and international regulatory institutionssuch as the Bank for International Settlement Basel II Capital Risk Guidelines
Corporate Social Responsibility Leadership
Integrate corporate social responsibility into down-market business strategies andinstitutions of representation and democratization
Transparency and AccountabilityPublish annual reports and balance sheets in accord with international best practices offinancial social and sustainability reporting
Leadership in Provision of New Banking Services and Products to the PoorUse competitive advantages in banking and institutional networks to channel moreeffectively capital income and finance to the poor
Generate Sustainable Income and Household Asset AccumulationUse branch offices and new banking technologies to accelerate progress toward UNmillennium goals to eliminate poverty
Universalize Financial EducationPromote financial education to encourage responsible banking and finance and avertpredatory lending and unethical practices
Adopt Cutting Edge Technology and Management Practices to Provide
Competitive Alternative to Private Commercial and Investment Banks
Incorporate electronic card and mobile banking services to better serve the poorContribute to Realization of Bellagio Principles for SustainabilityPromote alternative banking and business practices that contribute to environmentallysustainable income consumption and production as stated in Bellagio Principles forSustainability
Respect and Build on National and Regional DifferencesI d f i l d l l i b ki i i i d i i l
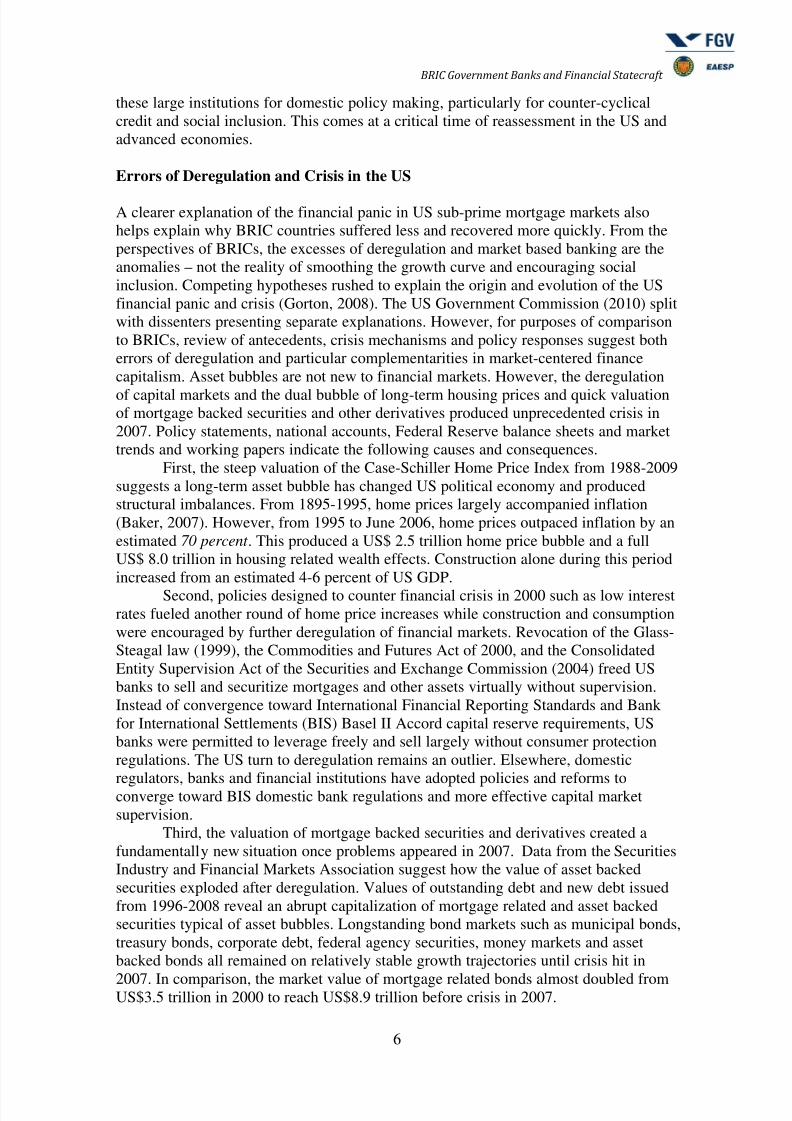
8132019 Government Banking and BRICs in the Recent Financial Crisis
httpslidepdfcomreaderfullgovernment-banking-and-brics-in-the-recent-financial-crisis 757
983106983122983113983107 983111983151983158983141983154983150983149983141983150983156 983106983137983150983147983155 983137983150983140 983110983145983150983137983150983139983145983137983148 983123983156983137983156983141983139983154983137983142983156
7
Fourth central drivers of the financial market bubble in the US were secondarymarkets for mortgage backed securities and derivatives For example throughout thefinancial panic and crisis municipal bond markets remained largely stable despitefalling tax receipts and the impact of crisis on sub-national government budgets Thevalue of US Treasury bonds also increased during crisis reflecting a flight to quality
much criticized by surplus countries such as China This remains a comparativeadvantage of market-centered finance capitalism Despite originating crisis a flight toquality cheapens counter cyclical policies Corporate bonds also increased during crisisas US Federal Reserve banks and treasury injected funds to keep US firms afloatFurther analysis is needed However data from bond markets suggest that marketcentered finance capitalism retains particular sets of complementarities and policyalternatives
Fifth both government policies during crisis and proposals for new regulatoryframeworks are designed to tap these complementarities After September 2008 USgovernment reserves increased from US$ 900 billion to over two trillion dollars largelythrough new credit facilities created by the Federal Reserve Board and regional banks of
the Federal Reserve System US government reserves first increased through massiveextension of credit then through central bank swaps then through acquisition of federalgovernment securities by the US central bank These policies suggest particularconfigurations and complementarities in market-centered finance capitalism
The first program introduced in February 2008 was the Federal Reserve PrimaryDealer Credit Facility an overnight loan facility to ensure funds for primary dealers oftreasury securities to sustain demand in financial markets US government primarycredit borrowing increased from under US$200 billion through September 2008 to overUS$1100 billion by December 2008 but decreased thereafter to under US$400 billionby April 2009 US Federal Reserve Banks also purchased massive amounts of assetbacked securities to sustain markets In November 2008 the Federal Deposit InsuranceCorporation created a Temporary Liquidity Guarantee Program one that provided overUS$3340 billion by April 2009 (Given that FDIC funds are taken from charges onsavings accounts this transfer of funds from savings accounts to emergency financialpolicy credits has attracted criticism from community banking association members)US monetary authority purchases of GSE mortgage backed securities also reachedUS$125 trillion in GSE ldquoagencyrdquo mortgage backed securities US$2000 billion indirect agency obligations and permitted purchase of up to US$3000 billion in treasurysecurities during 2009 The Federal Reserve Board also created a Term Asset-BackedSecurities Loan Facility
In September 2008 the Federal Reserve Board created an Asset-Backed
Commercial Paper Money Market Mutual Fund Liquidity Facility to stave off financialpanic Lending through the Federal Reserve Bank of Boston reached US$1500 billionby September 2008 However loans under this program declined to near zero in Apriland remained below US$200 billion in May 2009 The Federal Reserve Board alsocreated a Commercial Paper Funding Facility through the Federal Reserve Bank of NewYork to avert financial panic spreading into commercial paper markets Loans to banksunder this facility reached US$3500 billion in January 2009 but declined to underUS$1400 billion by June 2009 The Federal Reserve Board also created a TermAuction Facility in December 2009 to ensure liquidity in uninsured interbank lendingmarkets Lending through this facility remained at approximately US$1400 billion intoOctober 2008 but increased to almost US$US5000 billion in March 2009 before
declining to an estimated US$ 3200 billion outstanding in June 2009
8132019 Government Banking and BRICs in the Recent Financial Crisis
httpslidepdfcomreaderfullgovernment-banking-and-brics-in-the-recent-financial-crisis 857
8132019 Government Banking and BRICs in the Recent Financial Crisis
httpslidepdfcomreaderfullgovernment-banking-and-brics-in-the-recent-financial-crisis 957
983106983122983113983107 983111983151983158983141983154983150983149983141983150983156 983106983137983150983147983155 983137983150983140 983110983145983150983137983150983139983145983137983148 983123983156983137983156983141983139983154983137983142983156
9
but should not conceal the counter intuitive modernization of government banksalongside (and often ahead) of private and foreign banks
A third explanation draws from the institutional complementarity hypothesis toargue that different policies in BRICS captured particular complementarities in bankingand finance to avert more severe impacts on economic activity This is a promising
approach but one that exceeds our ability to retrace the domestic policies amidst crisisacross four major countriesA fourth explanation is taken from the World Capitalist System approach and
focuses on the profound structural changes implied by recent growth and betteradjustment in BRIC countries This perspective also provides significant opportunitiesfor reflection and interpretation that must remain beyond the scope of this paper Theemergence of BRIC nations as driving force in the global economy is a fundamentallynew situation for theories of center-periphery north-south dependent development andtheories that focus on the specific trajectories of nations in what used to be called latelate development
A final explanation of why BRIC countries have fared comparatively better in
the face of global financial crisis is scale The very large size of these economiesprovided policy options unavailable to smaller countries From this perspective closedeconomies are less subject to the impacts of sudden stops in foreign finance during andafter the financial crisis and less exposed to export declines during global downturnsMoreover large closed BRIC economies retain options of turning away from exportstoward domestic investment and consumption a characteristic especially importantgiven atrocious income distribution and social exclusion This dimension also remainsbeyond the scope of this paper on public banking and domestic financial statecraft
Unless we are mistaken these explanations are complementary to our core claimsthat government banks made a difference in terms of avoiding the creation of asset bubblesrealizing competitive advantages over private and foreign banks since liberalization andproviding counter cyclical policy alternatives to ameliorate downturn Case studies of theBRICs follow
Brazil
We begin with Brazil Our research on Brazil suggests that since price stability the return todemocracy and liberalization of the banking system in 1995 federal banks have realizedcompetitive advantage over private and foreign banks while providing policy alternatives topolitical and social forces This article extends this argument to suggest that these institutionshave modernized amidst liberalization and globalization across BRIC countries ldquojust in timerdquo
to retain client confidence and provide counter-cyclical credit to avert domestic downturns inthe face of global crisis
8132019 Government Banking and BRICs in the Recent Financial Crisis
httpslidepdfcomreaderfullgovernment-banking-and-brics-in-the-recent-financial-crisis 1057
983106983122983113983107 983111983151983158983141983154983150983149983141983150983156 983106983137983150983147983155 983137983150983140 983110983145983150983137983150983139983145983137983148 983123983156983137983156983141983139983154983137983142983156
10
The market shares of government banks private banks and foreign banks in domesticBrazilian credit from 1988-2009 are reported in Figure 1 First the trajectories of credit fromgovernment private and foreign banks suggests that state presence in banking declined during the 1990s through privatization of state government banks However sincecapitalization and reform in 2001 government banks increased market share substantiallyconsistent with our argument that they have modernized to compete alongside private andforeign banks Further comparison of government private and foreign bank policies suggestthat government banks 1) provide more loans per capita 2) provide more counter-cyclicalcredit to help firms and households through economic downturns and 3) hold treasury bonds
for the term rather than trading or unloading a difference that helps reduce market pressuresto shorten the term and increase the cost of government debt
Bank Returns in Brazil and Select Latin American and Reference Countries 2003-20072003 2004 2005 2006 2007
------------------------------------------------------------------------------------------Brazil Government 235 215 265 337
Private 160 262 259 273Foreign 101 61 166 106Bank System 158 176 212 206 224
Argentina -227 -42 70 143 97Chile 167 167 179 186 162
Mexico 161 172 244 262 202Australia 242 228 253 270 281Canada 147 167 149 209 125Spain 132 141 169 199South Africa 116 162 152 183 184---------------------------------------------------------------------------------------------Excludes credits under guarantee Source Bankscope cited in Central Bank of Brazil Financial Stability
Report November 2008 p 56 and Central Bank of Brazil Financial Stability Reports 2004-7
The above table also suggests that government banks have also systematicallyoutperformed private and foreign banks operating in Brazil since capitalization of theseinstitutions to meet Basel II Capital Risk guidelines of the Bank for International Settlements
in 2001 This is an anomaly for theories of private bank efficiency and expectations of liberalreforms in the 1990s Moreover counter-cylical lending exposes government banks to late
983088
983093
983089983088
983089983093
983090983088
983090983093
983091983088
983089 983097 983096 983096
983089 983097 983096 983097
983089 983097 983097 983088
983089 983097 983097 983089
983089 983097 983097 983090
983089 983097 983097 983091
983089 983097 983097 983092
983089 983097 983097 983093
983089 983097 983097 983094
983089 983097 983097 983095
983089 983097 983097 983096
983089 983097 983097 983097
983090 983088 983088 983088
983090 983088 983088 983089
983090 983088 983088 983090
983090 983088 983088 983091
983090 983088 983088 983092
983090 983088 983088 983093
983090 983088 983088 983094
983090 983088 983088 983095
983090 983088 983088 983096
983090 983088 983088 983097
983077
983129983141983137983154
Figure 1 Government Private and Foreign Bank Lending as percent
of Brazilian GDP 1988-2009
983120983154983145983158983137983156983141
983111983151983158983141983154983150983149983141983150983156
983110983151983154983141983145983143983150
8132019 Government Banking and BRICs in the Recent Financial Crisis
httpslidepdfcomreaderfullgovernment-banking-and-brics-in-the-recent-financial-crisis 1157
983106983122983113983107 983111983151983158983141983154983150983149983141983150983156 983106983137983150983147983155 983137983150983140 983110983145983150983137983150983139983145983137983148 983123983156983137983156983141983139983154983137983142983156
11
and non-payment of loans This reduces profits Strategies to ldquoholdrdquo government securitiesalso reduce profits Nonetheless government banks have reported stronger returns thanforeign and domestic banks on average since capitalization in 2001
The above data may conceal bad banking practices such as crony credit bad loans andcosts that in the end must be passed on to others through fiscal accounts or the money supply
Data from the Central Bank of Brazil help control for these possibilities and provide furthercomparison of bank performance This section compares government private and foreignbanks in terms of the Basel Index bad credit late loans and stress tests that estimate theimpact of hypothetical shocks to bank portfolios from foreign exchange devaluation andorcredit problems
First the Basel Index for government domestic and foreign banks from 2002-2006suggests that government banks remain capitalized well above levels set in Central Bank ofBrazil guidelines (110 set in 1999) The Bank for International Settlements suggests an 80level of capital in reserve against possible losses in lending and finance The average BaselIndex for government banks increased from 167 percent in 2002 to 197 percent in 2006 Incomparison the average Basel Index for private domestic banks increased from 151 pecent
to 170 percent during this period while foreign banks on average reported Basel Indexes of152 in 2002 remaining at 154 in 2006 This suggests that government banks in Brazil retainsufficient capital in reserve against risks arising from bad credit or losses in financialmarkets
Bank System Basel Index in Brazil Select Latin American and Reference Countries
2002 2003 2004 2005 2006---------------------------------------------------------------------------------------------Brazil Government 167 148 165 174 197
Private 151 171 183 177 170Foreign 152 167 187 164 154
Chile 141 136 130 125 120Mexico 144 141 145 163 159Australia 100 104 104 104 103Canada 134 133 129 125 121Spain 126 123 122 119South Africa 124 140 127 123 122
---------------------------------------------------------------------------------------------Source Central Bank of Brazil Financial Stability Report 2002-2006Note Basel Index = recommended minimum eleven percent relation between required net worth and risk-
weighted total assets
A closer look at changing Basel indexes reveal the consequences of counter-cyclicallending from federal government banks Because private domestic and foreign banks adoptedmore cautious strategies and provided less credit during the downturn of 2002 theseinstitutions maintained levels of capital reserves above levels found in government banksThe average Basel index for the domestic financial system thus remained roughly the same atyear-end 2002 (06 percent increase to 162 over June 2002) However this average concealsan increase of 21 percent in the Basel Index for private banks (largely meaning they chose tohold low risk rated government paper) and a decline of 23 percent of the Basel Index forgovernment banks (meaning they incurred risks to lend during downturn and adjustment)Before assuming the worst readers should note two matters First the Central Bank of Brazilrequires banks to maintain a Basel Index of 110 This is three points greater than the 80
8132019 Government Banking and BRICs in the Recent Financial Crisis
httpslidepdfcomreaderfullgovernment-banking-and-brics-in-the-recent-financial-crisis 1257
983106983122983113983107 983111983151983158983141983154983150983149983141983150983156 983106983137983150983147983155 983137983150983140 983110983145983150983137983150983139983145983137983148 983123983156983137983156983141983139983154983137983142983156
12
suggested in the 1988 Basel Accord and subsequent revisions for capital guidelines In otherwords Brazilian banks set aside almost half again more in additional capital reserves thanlevels recommended by the Bank for International Settlements Second the different BaselIndex ratings of government and private banks also reflects the greater weight of credit andtherefore credit risk in these institutions And data on bad and late loans since 2001 suggest
that the slight and temporarily higher levels of average Basel Indexes reported by governmentbanks do not reflect broader deterioration of portfoliosFurthermore Banks in Brazil and especially government banks tend to be more
conservative setting aside not only frac12 of deposits as compulsory reserves at the Central Bankof Brazil but also retaining additional reserves against bad loans and losses Firstcomparative data suggests that Brazilian banks tend to set considerably larger sums aside inreserve against bad loans and other losses Of the four large Latin American countries andfour further economies reported by the IMF and Central Bank of Brazil Brazil retainedsubstantially larger reserves against bad loans than any country except Spain during 2007This confirms the particular characteristics of banking in Brazil that of a higher cost andlower operating efficiency combined with larger reserves and provisions against losses
Bank Reserves as Percent of Overdue amp Late Loans in Brazil Select Latin American andReference Countries
2003 2004 2005 2006 2007 2008---------------------------------------------------------------------------------------------Brazil 3200 3719 2874 2800 2862 2709Argentina 792 1029 1251 1303 1303Chile 1309 1655 1776 1985 2107Mexico 1671 2018 2321 2074 1947Australia 1318 1829 2030 2052 1889Canada 435 477 493 553 449Spain 2454 2196 2518 2733South Africa 542 613 643---------------------------------------------------------------------------------------------Source IMF Global Financial Stability Report 2008 cited in Central Bank of Brazil Financial Stability
Report November 2008 p 56
The level of bad and late loans in bank portfolios is another measure of bank solidityThe convergence of bad credit levels in government private and foreign banks from 1988-2008 introduced this study Further comparison suggests that although government banksretain higher levels of bad and late loans in specific sectors (especially home loans) the value
of late loans as a percent of total loans in government banks fell below levels in private andforeign banks during 2008 (See table on following page) The value of bad credit (loans over12 months past due) in government banks decreased from R$372 billion in 2001 to R$149billion in June 2006 This places the value of bad credit in government banks below the valuefound in private and foreign banks Bad credit in private banks increased from R$173 billionin 2001 to peak at R$255 billion during 2003 declining to R$180 billion in 2006 Foreignbanks also reported increased values of bad credit from R$123 billion in 2001 peaking atR$141 billion in 2003 and declining to R$130 billion in 2006 While late loans remained 85percent of total loans in government banks in 2001 (above 75 percent in private and 65percent in foreign banks) by 2008 the relation reverses In 2008 late loans declined to 32percent of total loans at government banks while remaining at 37 percent in private banksand 45 percent in foreign banks
8132019 Government Banking and BRICs in the Recent Financial Crisis
httpslidepdfcomreaderfullgovernment-banking-and-brics-in-the-recent-financial-crisis 1357
983106983122983113983107 983111983151983158983141983154983150983149983141983150983156 983106983137983150983147983155 983137983150983140 983110983145983150983137983150983139983145983137983148 983123983156983137983156983141983139983154983137983142983156
13
Moreover government banks in Brazil continue to set aside greater provisions againstbad and late loans than private or foreign banks In 2004 government banks retained 86percent of the value of total loans in provision against losses from non-paying loans whileprivate banks retained 60 percent and foreign banks 51 percent In 2008 the level ofprovisions at government banks had declined on average to 68 percent but still remained
well above the levels of 52 and 51 percent recorded at private and foreign banks
Late Loans and Provisions in Government Private and Foreign Banks 2001-2008
Government Banks Private Banks Foreign Banks--------------------------- ----------------------------- -----------------------------R$bi R$bi R$bigt12m Late Provision gt12m Late Provision gt12m Late Provision
----------------------------------------------------------------------------------------------------------------2001 372 85 173 75 123 652002 394 55 202 73 141 60
2003 326 70 255 74 159 662004 133 35 86 160 31 60 102 32 512005 134 39 81 163 35 59 107 35 482006 149 42 68 180 44 66 130 45 532007 35 75 37 55 43 502008 32 68 37 52 45 512009 30 56 612010 20 47 40 66 41 532011 20 43 46 71 50 58----------------------------------------------------------------------------------------------------------------Note Bad credit = loans past due over 12 months Late = percent of total loans gt120 days overdue
Provision = percent of total loan value set aside as reserves against losses Empty cells reflect lack of databecause of changing reporting standards at Central BankSource Central Bank of Brazil Financial Stability Report November 2008 p 56 and 2002-2006
Again in comparative perspective the levels of late loans in Brazilian bankingremains significantly higher than other countries Table 213 reports the value of late loans asa percent of bank portfolios in Brazil select Latin American and further countries forreference This suggests that differences found in Brazilian government banks have to dowith differences in the banking system such as judicial preference for debtors over creditorsrather than the inferior performance of government banks
Late Loans as percent of Total Loans in Brazil Select Latin American and ReferenceCountries
2003 2004 2005 2006 2007----------------------------------------------------------------------------------------------------------------Brazil 39 30 35 37 32Chile 16 12 09 08 08Mexico 28 22 18 21 25Australia 03 02 02 02 02Canada 12 07 05 04 04Spain 17 17 16 14 11South Africa 24 18 15 11 12
---------------------------------------------------------------------------------------------------------------- Does not include credits covered by guaranteeSource Bankscope cited in Central Bank of Brazil Financial Stability Report November 2008 p 56
8132019 Government Banking and BRICs in the Recent Financial Crisis
httpslidepdfcomreaderfullgovernment-banking-and-brics-in-the-recent-financial-crisis 1457
983106983122983113983107 983111983151983158983141983154983150983149983141983150983156 983106983137983150983147983155 983137983150983140 983110983145983150983137983150983139983145983137983148 983123983156983137983156983141983139983154983137983142983156
14
Further comparative data confirms that the Brazilian banking system tends to run onmore expensive credit higher returns and profits and higher levels of late and bad loansBanks operating in Brazil also retain higher levels of administrative and personnel costsHowever Brazilian banks also tend to set aside more generous reserves and provisions
against losses These structural characteristics can be seen in the comparative data in the tablebelow The data on government private and foreign banks in Brazil and comparisons suggestthat the Brazilian banking system incurs higher operating costs maintains higher reservesprovisions and capital against losses and risk but nonetheless produces strong returns
Indicators of Bank Efficiency Performance and Provisions in Brazil Select Latin Americanand Reference Countries
Cost Op Exps NPL Provisions EquityIncome Assets Loans NPL Assets
----------------------------------------------------------------------------------------------------------------
Brazil 62 65 41 153 9Argentina 84 41 66 116 12Chile 53 28 10 166 7Colombia 52 59 32 144 11Mexico 58 47 20 232 12US 54 33 07 163 8Spain 56 16 07 313 12----------------------------------------------------------------------------------------------------------------Source World Bank ldquoBrazil The Industry Structure of Banking Servicesrdquo Brasiacutelia June 2007 pp
Comparison of administrative costs in Brazilian banking with levels in other large
Latin American and emerging and reference economies suggest that Brazilian banks retainhigher costs From 2001 through 2005 the value of administrative costs as a percent of bankassets in Brazil declined from 69 percent to 58 percent but remained significantly abovelevels reported from Chile (30 to 27 percent) Mexico (47 to 46 percent) and well abovereference countries such as Australia Canada and Spain (16 36 and 11 percentrespectively) Although time series lacks comparison after 2005 administrative costs inBrazilian banks decline significantly from 58 in 2005 to 42 in 2008
Bank Administrative Costs in Brazil Select Latin American and Reference Countries (Assets)
2001 2002 2003 2004 2005 2006 2007 2008-------------------------------------------------------------------------------------------------Brazil 69 61 60 61 58 55 51 42Chile 30 30 27 27 27Mexico 47 48 46 43 46Australia 17 17 16 16 16Canada 27 27 27 27 26Spain 17 17 16 14 11-------------------------------------------------------------------------------------------------- Adjusted average of total assetsSource Bankscope cited in Central Bank of Brazil Financial Stability Report November 2008 p 56
A final comparison of government private and foreign bank solidity is based onCentral Bank of Brazil estimates of the impact of hypothetical shocks to the Brazilian
8132019 Government Banking and BRICs in the Recent Financial Crisis
httpslidepdfcomreaderfullgovernment-banking-and-brics-in-the-recent-financial-crisis 1557
983106983122983113983107 983111983151983158983141983154983150983149983141983150983156 983106983137983150983147983155 983137983150983140 983110983145983150983137983150983139983145983137983148 983123983156983137983156983141983139983154983137983142983156
15
economy on domestic banks These estimates are based on the revisions of the widely usedValue-at-Risk estimates proposed by Boudoukh Richardson and Whitelaw that adapts theoriginal VaR method developed and commercialised by JP Morgan19
Stress Tests for Impact of Credit Interest Rate and Foreign Exchange Shock on Basel Index
Comparison of Government Domestic and Foreign Banks 2001-2006
2002 2003 2004 2005 2006-------------------------------------------------------------------------------------------------------------
Government 112 104 114 113 109Domestic 112 132 126 121 103Private 103 131 135 108 84-------------------------------------------------------------------------------------------------------------Source Central Bank of Brazil Financial Stability Reports 2002-2006Note Basel Index = Capital risk guideline measure defined by Bank for International Settlements BaselCommittee that recommends 8 percent relation between PR and total assets weighted by risk level Since 2002Central Bank of Brazil minimum requirements of Basel Index remains 11 percent For methods of calculationsee Central Bank of Brazil Financial Stability Report Brasilia 2006 p 76
Central Bank of Brazil tests estimate that in the face of foreign currency valuationand interest rate shock government banks would nonetheless remain at or slightly below thecapital requirements against credit risk recommended by the central bank Again it should benoted that Basel Index levels recommended in the BIS Capital Requirements guidelines forthe Basel Index of banks are 80 while the Central Bank of Brazil has set minimum BaselIndex levels of 110 Given that federal government bank portfolios include more credit thanprivate banks and especially foreign banks the estimate of a shift to 109 in the averageBasle index for federal government banks in the face of a credit shock provides furtherevidence that these financial institutions are solid and their capital reserves sufficient Insum comparison of results for government private and foreign banks in the estimatesreported by the Central Bank of Brazil of the likely impact of a shock to the Brazilianeconomy in terms of interest rates and foreign exchange rates also suggests that governmentbanks appear solid The average Basel Index reported for government banks in this stress testwas 135 above the 110 Central Bank of Brazil guideline and well above the 80 levelsuggested by the BIS
Understanding the capacity of Brazilian banks to cope with shocks and risk is not justa theoretical exercise Since the currency crisis in Mexico during 1994-1995 the newlystabilized currency was tested by shocks from home and abroad Policies first dramaticallyincreased interest rates under a fixed exchange rate regime then freed the real to devalue
under a flexible foreign exchange rate regime in January 1999 The Asian currency crisesduring second semester 1997 led the Central Bank of Brazil to increase benchmark Selicinterest rates to 434 percent in November In August 1998 the declaration of moratorium onforeign debt payments by Russia the central bank to once again increase Selic interest ratesfrom 20 to 40 percent under the fixed exchange rate regime by November of that year Theseshocks from abroad coincided with preparations for national elections during 1998 leadingthe IMF and other official creditors to provide strong support for the Brazilan governmentNonetheless by January 1999 (after the election) market pressure led to the abandonment ofthe fixed foreign exchange rate regime that had served as nominal anchor for economic
19 Calculation first published in Resenha BMampF Vol 122 1998 (described in Central Bank of Brazil
Financial Stability Report 2002 amp 2003 then as Boudoukh Jacob Matthew Richardson RichardStanton amp Robert Whitelaw ldquoMaxVaR Long Horizon Value at Risk in a Mark-to-Market Environmentrdquo Journal of Investment Management 2004Vol 2 No 3 pp 14-19
8132019 Government Banking and BRICs in the Recent Financial Crisis
httpslidepdfcomreaderfullgovernment-banking-and-brics-in-the-recent-financial-crisis 1657
983106983122983113983107 983111983151983158983141983154983150983149983141983150983156 983106983137983150983147983155 983137983150983140 983110983145983150983137983150983139983145983137983148 983123983156983137983156983141983139983154983137983142983156
16
policy since 1994 The real quickly devalued from 121 to 20 against the US dollar by theend of January and led to considerable changes in policy (a flexible foreign exhange rateregime inflation targeting and the implementation of further fiscal reforms) Once the realrevalued from R$22 against the dollar in March to R$166 in April 1999 the governmentmoved to consolidate this new triad of economic policies Since 1999 flexible foreign
exchange markets inflation targeting and fiscal reform have remained in place This suggeststhat Brazilian banks have weathered volatile parameters and large risks during a markedpolitical business cycle One involving the transition from reformist President Cardoso to PTPresident Lula Since recovery of the economy during 2004 the coalition government underPT President Lula has sought to expand the contribution of government banks to accelerategrowth and social inclusion These policies have not undermined economic fundamentals oreroded the institutional foundations of comparative advantage retained by Brazilian federalgovernment banks
In sum the advances of Brazilian banking toward Basel Accord regulations during the1990s and 2000s the adoption of more transparent and timely reporting standards and themodernization of government banks under pressures from liberalization placed federal banks
in a new situation in the face of crisis once it hit the country in 2008 A closer look at the bigthree federal government banks is in order to better understand these changes
The Banco do Brasil
Upon taking office in 2003 President Lula retained the central economic policies of theCardoso administration such as inflation targeting tight fiscal and monetary policy andthe operational independence of the Banco do Brasil However the recovery of investorconfidence during 2003 and the return of stronger growth levels during 2004 led to aperiod of what the Central Bank of Brazil describes as organic growth at the Banco doBrasil From 2004-2008 the Banco do Brasil contributed to the deepning of domesticcredit markets and emerged as leading investment bank at the Bovespa stock marketFurthermore once the Bovespa collapsed credit became short and a sharp downturnensued during 2008 the Banco do Brasil provided emergency loans infusions of capitalthrough stock purchases and the acquisition of small and mid-sized firms and banksunable to weather the sharp decline and lack of credit Although the merger of Itauacute andUnibanco in 2008 displaced the Banco do Brasil as the largest financial institution inLatin America the bank retains powerful institutional foundations of comparativeadvantage and networks that cross Brazilian society politics and markets
The Banco do Brasil also remains at the center of Brazilian politics and policydisputes Indeed leaders of the PT party faction articulaccedilatildeo (articulation) includes
career employees of the Banco do Brasil and presidents of the Brazilian bank workersunion such as Luiz Gushiken and Ricardo Berzioni Both were nominated to ministerialposts by President Silva in January 2003 By August 2003 21 of 33 top positions at theBanco do Brasil had been filled by new representatives of the PT most Banco do Brasilemployees and members of the Brazilian bank workers union Critics decriedpoliticization However the resistance of bank representatives described above topresidential appeals to increase credit during 2003 was followed by more neutralappointments during 2004 When Banco do Brasil President Cassio Casseb Limaresigned in November 2004 (under charges of irregularities in consulting contracts atthe bank) President Lula nominated Rossano Maranhatildeo Pinto a career employee andBanco do Brasil vice president to head the bank Further appointments of PMDB
political leaders to cement support for the PT coalition government were also criticizedas politicization of the bank However Banco do Brasil officials responded that these
8132019 Government Banking and BRICs in the Recent Financial Crisis
httpslidepdfcomreaderfullgovernment-banking-and-brics-in-the-recent-financial-crisis 1757
983106983122983113983107 983111983151983158983141983154983150983149983141983150983156 983106983137983150983147983155 983137983150983140 983110983145983150983137983150983139983145983137983148 983123983156983137983156983141983139983154983137983142983156
17
experienced political leaders of the PMDB brought competitive advantages to the bankbased on their networks that cross the public and private sector These networks andrelations during the second PT coalition government of President Lula also appearsdifferent than the first given the departure from core offices of the presency bylongtime advisors to Lula that came from the Banco do Brasil and bank workers union
By late 2006 only one of seven vice presidents of the Banco do Brasil was a member ofPresident Lulaacutes Workersacute Party (PT)Again Banco do Brasil policies and growth since recovery of the economy in
2004 involved first a period of expansion during four years of growth followed by aturn to counter cyclical lending and finance once financial crisis abroad produced first asevere contraction in credit supply then a sharp economic downturn in fourth quarter2008 Institutional foundations of comparative advantage are behind Banco do Brasilpolicies during both periods First the capitalization of Brazilian firms on the Bovespastock market is closely related to the groups that cross politics government banks thepowerful bank worker labor union the Banco do Brasil employee private pension fundand bank consortia often led by the Banco do Brasil investment banking division (often
joined by the BNDESpar and Caixa investment banking division) Recent developmentsare complex and will require further research However rather than convergence towardprivate banking and a market-centered financial system examination of Banco do Brasilpolicies and market shares during the 2000s suggests that federal government banks notonly remain at the center of politics policy and development strategies but that theseinstitutions have modernized to compete against private and foreign banks
The large scale and scope of the Banco do Brasil has permitted use of the bankfor counter-cyclical lending and leadership in capital markets without deteriorating bankbalance sheets Since 2003 the Banco do Brasil has remained well within domesticbank regulations and Basel Accord guidelines During 2002 and 2003 reforms at theBanco do Brasil sought to reduce costs and increase efficiency ratings Indeed therelation between the Banco do Brasil and President Lula reversed past patterns In the1950s conflicts were between national developmentalist groups at the Banco do Brasiland more orthodox Ministers of Finance In 2003 and once again during the 2008financial crisis differences between President Lula and the Banco do Brasil were thereverse Banco do Brasil management refused to dramatically increase loans in 2003and resisted requests to reduce the price of credit in 2008 In 2003 the caution imposedby political risk perceptions led President Lula to respect the operational autonomy ofthe Banco do Brasil In April 2009 Banco do Brasil President Antonio Francisco deLima Neto was fired after refusing to reduce interest rates on loans This reversal ofpolicy positions from the 1950s suggests in a broader sense a transition from the
macroeconomics of populism to the microeconomics of government banking in the 21
st
century Government banks do not provide easy or all solutions Instead credit andfinance policies are subject to market discipline credit risk analysis and the realities ofbusiness cycles
Review of the Banco do Brasilrsquos balance sheet from 2002-2008 suggests that the bankdeveloped organically from 2002-2007 with gradual increases reflecting the competitiveadvantages at the top of Brazilian banking and finance Policies changed during 2007 and2008 as the credit shortage caused by international financial crisis led to the Banco do Brasilassuming once again lending of last resort functions by extending interbank investments andloans to small and medium sized banks to avert further declines in domestic liquidity TheBanco do Brasil also acquired a 51 percent stake in the Votarantim bank to avert a run on
deposits and possible failure while acquiring Satildeo Paulo state government savings bankNossa Caixa for R$76 billion in 2008 These acquisitions reflect concern about the
8132019 Government Banking and BRICs in the Recent Financial Crisis
httpslidepdfcomreaderfullgovernment-banking-and-brics-in-the-recent-financial-crisis 1857
983106983122983113983107 983111983151983158983141983154983150983149983141983150983156 983106983137983150983147983155 983137983150983140 983110983145983150983137983150983139983145983137983148 983123983156983137983156983141983139983154983137983142983156
18
replacement of the Banco do Brasil as the largest financial conglomerate in Brazil after themerger of Itauacute and Unibanco
Banco do Brasil Balance Sheet Summary 2002-2008 R$ billion
2002 2003 2004 2005 2006 2007 2008 2009 2010 2011Assets --------------------------------------------------------------------------------------------------------Interbank Investments 101 50 27 80 175 434 951Interbank Deposits 76 283 137 209 116 77 242Securities 709 696 734 664 731 752 732Central Bank Deposits 81 186 221 244 281 334 212Loans to Private Sector 89 652 757 885 1178 1463 1810Loans to Public Sector 56 43 41 37 43 24 230Receivables 297 273 312 351 404 548 808Other AssetsTotal Assets 2046 2301 2390 2529 2963 3672 5073Liabilities ---------------------------------------------------------------------------------------------------Deposits 972 1100 1155 1376 1588 1882 2711
M MKT Borrowing 483 400 445 305 492 722 914Treasury amp BNDES 59 74 106 133 143 175 224Shareholder Equity 92 121 141 168 207 242 299Other LiabilitiesTotal Liabilities 2046 2301 2390 2529 2963 3672 5073---------------------------------------------------------------------------------------------------------------- Compulsory deposits for commercial banks according to Central Bank regulationsSource Banco do Brasil Annual Reports Historical Series 2002-2008
From 2002 through 2006 the balance sheet of the Banco do Brasil suggests a periodof growth based on loans to the private sector with deposits and shareholder equityincreasing largely apace After 2006 the balance sheet changes fundamentally with capitalinjections from money market borrowing increasing from R$492 billion in 2006 to R$914billion in 2008 while Banco do Brasil liabilities with Treasury and BNDES increased fromR$143 billion in 2006 to R$224 billion in 2008 The asset side of the balance sheet alsosuggests fundamental change Private sector lending increased from R$1178 billion in 2006to R$1810 billion in 2008 reflecting acquisition of portfolios from Nossa Caixa Interbankinvestments increased from R$175 billion in 2006 to R$951 billion in 2008 while interbankdeposits also increased from R$116 billion in 2006 to R$242 billion in 2008 The counter-cyclical lending strategies of the Banco do Brasil during 2008 also included an increase oflending to the public sector from R$24 billion in 2007 to R$230 billion Banco do Brasilreponses to government credit policy can also be seen in the release of 40 percent of
compulsory deposits retained at the central bank Banco do Brasil deposits at the central bankdeclined from R$334 billion in 2007 to R$212 billion in 2008 ndash freeing this value for loansand investments
Networks and relations during the second government of President Lula appeardifferent than the first given the departure from core offices of the presency by longtimeadvisors to Lula that came from the Banco do Brasil and bank workers union By late 2006only one of seven vice presidents of the Banco do Brasil was a member of President LulaacutesWorkersacute Party (PT) The corporate profile of the Banco do Brasil suggests once again thehybrid character of this government bank one listed on the Bovespa Novo Mercado but withover 65 percent of shares owned by the Brazilian federal government Treasury
8132019 Government Banking and BRICs in the Recent Financial Crisis
httpslidepdfcomreaderfullgovernment-banking-and-brics-in-the-recent-financial-crisis 1957
8132019 Government Banking and BRICs in the Recent Financial Crisis
httpslidepdfcomreaderfullgovernment-banking-and-brics-in-the-recent-financial-crisis 2057
983106983122983113983107 983111983151983158983141983154983150983149983141983150983156 983106983137983150983147983155 983137983150983140 983110983145983150983137983150983139983145983137983148 983123983156983137983156983141983139983154983137983142983156
20
customers in 2008 reached 479 million with the bank retaining 39700 AMTs and 766million bank cards (239 million credit cards and 527 million debit cards) Like the CaixaEconocircmica Federal the Banco do Brasil also processes government payments withretirement and social security payments numbering 745 million transactions during 2008Although this implies administrative costs (and receipts) this also brings customers and
prospective customers into Banco do Brasil branch officesDuring 2008 the Banco do Brasil continued to expand operations form jointventures acquire private and government banks and modernize operations A secondaryoffering of stock in January 2008 granting of shares by VISA to the Banco do Brasil andupgrading of the bank to investment grade BB- by Standard amp Poors in April 2008 suggestthat market orientation of the bank continues during the Lula administration despite counter-cyclical credit policies A Lower Income Segment Department was also created to assumeBanco Popular do Brasil operations along with correspondent banking relations and regionalsustainable development programs The Banco do Brasil also received permission to usesavings accounts for home loans enabling the bank to compete on level ground with CaixaEconocircmica Federal During 2008 the Banco do Brasil also acquired the state government
banks Banco do Piaui Banco de Santa Catarina (33rd largest bank in Brazil with US$30billion assets at year end 2007) and Satildeo Paulo government savings bank Nossa Caixa (12thlargest Bank in Brazil with US$267 billion in assets at year end 2007) In sum the diversecorporate divisions and financial operations of the Banco do Brasil provided policy optionsduring 2008 to counter the credit shortage and help firms and domestic banks to adjust
Banco do Brasil and Private Bank Returns and Capital Adequacy 2002-2009
Basel Index Return on Assets Return on Liquid Assets----------------------------- ----------------------------- -----------------------------BB Itauacute Bradesco BB Itauacute Bradesco BB Itauacute Bradesco
--------------------------------------------------------------------------------------------------------------2002 122 184 179 12 26 20 302 288 2832003 137 198 199 11 28 16 231 297 2282004 152 206 188 13 30 23 240 292 3092005 171 170 173 12 37 26 187 353 2842006 173 171 188 28 31 25 267 288 2632007 156 179 156 14 32 22 222 321 2442008 152 161 169 25 19 16 304 221 2112009 150 165 166 12 13 14 238 182 195-------------------------------------------------------------------------------------------------------------- Annualized first quarter 2009 resultsSource Banco do Brasil Itauacute and Bradesco Annual Reports 2002-2009
Comparison of Banco do Brasil returns and capital adequacy with the two majorprivate Brazilian banks Itauacute and Bradesco suggests that the performance and solidity of theBanco do Brasil remains equal or superior to private banks During 2002 and 2003 thecapital adequacy of the Banco do Brasil and return on assets remained below levels reportedby the two largest Brazilian private banks suggesting the impact of counter-cyclical lendingHowever after 2004 the Basel index of the Banco do Brasil reached 171 far above BISstandards of 80 and Central Bank of Brazil requirements of 110 Furthermore from 2006through first quarter 2009 returns on assets returns on liquid assets and the Basel index ofthe Banco do Brasil exceed levels reported by Itauacute and Bradesco In sum despite providingcounter cyclical credit and despite having been replaced by the Itau-Unibanco merger as the
8132019 Government Banking and BRICs in the Recent Financial Crisis
httpslidepdfcomreaderfullgovernment-banking-and-brics-in-the-recent-financial-crisis 2157
983106983122983113983107 983111983151983158983141983154983150983149983141983150983156 983106983137983150983147983155 983137983150983140 983110983145983150983137983150983139983145983137983148 983123983156983137983156983141983139983154983137983142983156
21
largest Brazilian bank the performance and capital adequacy of the Banco do Brasil remainsat or above levels reported by the two largest private banks
In sum since liberalization of banking and finance and privatization of stategovernment banks during the 1990s the Banco do Brasil has been transformed from directstate owned bank into one of two very large financial conglomerates that dominate domestic
banking in Brazil Instead of retaining easy access to funds at Treasury to cover losses theBanco do Brasil has adopted international corporate governance standards to become listedon the Bovespa Novo Mercado and retains an important role in virtually every aspect ofBrazilian banking and finance Although sale of shares in the 1990s were designed to transfercorporate governance and control of the national bank to the private sector the federalgovernment retains 65 percent of stocks after two sale of stocks capitalized the bank duringthe 2000s The massive size and wide scope of Banco do Brasil networks across bankingfinancial markets political and social forces and business have led the bank to realize recordprofits during the period of growth from 2004-2008 and provide counter-cyclical credit toavert a further decline in industrial activity and the economy as the US and global financialcrisis hit Brazil first with a 50 percent decline in the Bovespa stock market and credit
shortage followed by a steep but short decline in industrial production in late 2008 Thetransparency of Banco do Brasil quarterly reports and advances in Central Bank of Brazilsupervision of domestic banking clarify the new tensions that have emerged during the PTgovernment of President Lula These tensions reflect the modernization and competitiveadvantages of the Banco do Brasil
Caixa Econocircmica Federal (Federal Savings Bank Caixa)
The third largest domestic bank the wholly government owned Federal Savings Bank Caixawas also called on by President Lula during the recent financial crisis to increase the pace ofgrowth provide counter cyclical credit during downturns and to reduce consumer andcorporate interest rates and bank spreads Review of balance sheets and policies since 2001suggest that the Caixa retains its core business in urban development home loans real estatetransfer of funds for government programs and services and lottery administration Howeverinvestment banking management of third party funds and the creation of of new products andservices have both increased profits and increased popular access to banking and socialservices The bank has recorded record profits since R$108 billion (2002) R$16 billion(2003) and R$14 billion (2004) The Caixa became the fourth largest Brazilian investmentbank by 2003 while gaining dealer status from the Central Bank of Brazil in primary andsecondary markets for government securities At year-end 2003 the bank retained anestimated R$767 billion of government paper (over ten percent of government paper) in its
portfolio assets earning over R$135 billion that year Since recovery of the Brazilianeconomy in 2004 the Caixa has reported strong profits and continued to improve thestructure of its balance sheet and converge toward international bank reporting standards
In terms of assets deposit base and the number of employees and branches the datasuggest that the Caixa has emerged from a process of rationalization and downsizing duringthe late 1990s and expanded ldquoorganicallyrdquo since capitalization in 2001 Assets declined fromover US$999 billion in 1997 to US$363 billion in 2002 after reorganization andcapitalization Deposits also declined from US$541 billion in 1997 to US$216 billion in2002 The number of employees and branches declined from 104253 and 2316 to 98971 and1803 respectively but returned to 104934 and 2428 by 2006 After reorganization andcapitalization in June 2001 Basel indexes and the ratio of fixed assets over equity indicate
substantial reform and transition toward international banking standards The Basel Index thatmeasures the adequacy of capital reserves against possible losses and risks increased from
8132019 Government Banking and BRICs in the Recent Financial Crisis
httpslidepdfcomreaderfullgovernment-banking-and-brics-in-the-recent-financial-crisis 2257
983106983122983113983107 983111983151983158983141983154983150983149983141983150983156 983106983137983150983147983155 983137983150983140 983110983145983150983137983150983139983145983137983148 983123983156983137983156983141983139983154983137983142983156
22
135 (49 in March 2001 before capitalization) to reach 278 and remain twice above theCentral Bank minimum of 110 at 252 in 2006 The ratio of fixed assets as a proportion ofequity also declines substantially from 638 at year end 2001 to 197 in 2007
Summary of Caixa Structure and Performance 1995-2007
Assets Profits Deposits Employees Branches Basel FAEquity1995 826 672 503 99866 23161996 907 2351 515 99343 21051997 999 875 541 96300 18031998 948 1693 499 94859 18191999 684 1571 344 94194 19192000 644 1362 322 104253 19212001 436 -1265 298 98971 2013 135 6382002 363 1462 216 106548 2147 146 5372003 521 2617 281 100498 2046 192 413
2004 556 2999 345 100164 2135 202 3612005 806 4852 456 106729 2321 278 2012006 981 4874 567 104934 2428 252 1972007 1409 4485 800 106770 2052 288 1282008 1266 5735 708 103895 2069 206 119
Note Assets amp Deposits = US$billion Profits = US$million Basel = BIS Basel Accord index of capital reserveadequacy FAEquity = Fixed Assets Equity a summary indicator of bank modernizationSource Central Bank of Brazil Top 50 Banks in Brazil available at wwwbcbgovbr
Caixa Annual Reports and transition toward Central Bank and international bankaccounting standards introduce breaks in the time series of financial performance after 2001
However international bank reporting standards have been used by the Caixa since 2005 andthe data provide further view of the policies and performance of the bank Table X reportsreturns on stockholder equity assets Basel solvency index immobilization index provisionsas a percent of credit operations bank efficiency index and coverage of personnel costs Thedata are consistent with the broader comparisons reported in chapter two that suggest highprofits and returns alongside higher levels of provisions and reserves against capital riskReturns on stockholder equity have remained above 20 percent per year reaching 306percent in 2008 Returns on liquid assets remained between 09 percent and 13 percentbelow the average levels recorded by private and foreign banks The Basel Index of the Caixaremained well above the 11 percent level required by the Central Bank declining from 279in 2005 to 206 in 2008
Caixa Performance Indicators 2005-2008
Indicator 2005 2006 2007 2008 2009 2010 2011--------------------------------------------------------------------------------------------------------------------------Return on Shareholder Equity 261 260 226 306Return on Liquid Assets 11 11 09 13Basel Solvency Index 279 253 289 206Immobilization Index 201 197 129 120Provisions as Credit Operations 101 98 91 86Efficiency Index 645 642 755 718Coverage of Personnel Costs 925 896 943 868
---------------------------------------------------------------------------------------------------------------------------Source Caixa Econocircmica Federal Relatoacuterios de Administraccedilatildeo 2005-2011
8132019 Government Banking and BRICs in the Recent Financial Crisis
httpslidepdfcomreaderfullgovernment-banking-and-brics-in-the-recent-financial-crisis 2357
983106983122983113983107 983111983151983158983141983154983150983149983141983150983156 983106983137983150983147983155 983137983150983140 983110983145983150983137983150983139983145983137983148 983123983156983137983156983141983139983154983137983142983156
23
The immobilization index of the Caixa also declined from 201 percent in 2005 to120 percent in 2008 suggesting transition toward standard levels of international bankingHowever the value of provisions as a percent of credit operations remains much higher thaninternational bank practices albeit declining from 101 percent in 2005 to 86 percent in2008 Finally both the substantial increase in efficiency index from 645 to 718 percent
suggests that the Caixa has distanced further from international private bank levels that tendto approach 500 percent This has resulted in the declining level of coverage of personnelcosts and indicates the comparatively larger organizational structure and less use ofoutsourced labor at the Caixa
Caixa Deposits and Sources of Funds 2005-2008 R$million
2005 2006 2007 2008 2009 2010 2011----------------------------------------------------------------------------------------------------------------Bank Deposits 692 863 1155 1320Savings Deposits 5328 6006 7560 9255Mid-Term Savings Deposits 3873 4219 4136 4862
Certificates (1270) (1412) (1244) (1831)Escrow (2602) (2806) (2891) (3031)
Funds and Programs 794 1034 1307 1100Other 009 015 019 013Caixa Total 10690 2139 14179 6552Bank System Total 68268 78148 92672 27482Caixa Deposits as Total (156) (155) (1531) (129)----------------------------------------------------------------------------------------------------------------Source Caixa Econocircmica Federal Relatoacuterios de Administraccedilatildeo 2005-2008
The liability side of Caixa balance sheets from 2005-8 suggests that the bank hasdistanced itself from reliance on official savings programs and funding toward consumerbank and savings deposits Bank deposits increased from R$69 billion in 2005 to overR$132 billion in 2008 Savings deposits increased from R$532 billion in 2005 to overR$925 billion in 2008 Furthermore the increase of mid-term savings deposits originatedfrom sale of savings certificates instead of escrow held by the Caixa the latter subject to
judicial review and removed from balance sheets in 2008 The value of funds deposited at theCaixa from government funds and programs increased from R$79 billion in 2005 to R$110billion in 2008 although it remains less than ten percent of total deposits In terms of totalvalue of deposits and savings the Caixa increased total value of deposits from 107 billion toover 165 billion from 2005-8
Caixa Loans 2005-8 R$ million2005 2006 2007 2008 2009 2020 2011
----------------------------------------------------------------------------------------------------------------Commercial 14652 16329 19134 28854
Consumer 8925 9474 11063 13747Business 5727 6854 8071 15107
Home 20208 26113 32475 45075Sewage and Infrastructure 1646 2556 3585 5445Other 690 691 694 689Risk Provision -3773 -4469 -5090 -6900Total Caixa Loans 37195 45689 55888 80062----------------------------------------------------------------------------------------------------------------Source Caixa Econocircmica Federal Relatoacuterios de Administraccedilatildeo 2005-8
8132019 Government Banking and BRICs in the Recent Financial Crisis
httpslidepdfcomreaderfullgovernment-banking-and-brics-in-the-recent-financial-crisis 2457
983106983122983113983107 983111983151983158983141983154983150983149983141983150983156 983106983137983150983147983155 983137983150983140 983110983145983150983137983150983139983145983137983148 983123983156983137983156983141983139983154983137983142983156
24
In terms of lending the data suggests that the primary focus of the Caixa on homeloans continued during the late 2000s although substantial increases in commercial lendingfor consumer credit and businesses suggest the diversification of the Caixa across creditmarkets Since 2005 Caixa lending to consumers and business increased from R$89 billionto R$137 billion and from R$57 billion to R$151 billion respectively in 2008
And unlike the high levels of bad and late credit reported during the adjustment to theend of high inflation in 1994-6 and financial crises (1994-5 1997 1998 1999 2001 2003)the level level of late loans at the Caixa fell substantially during the years of economicgrowth and credit expansion from 2006-2008 The percent of late over total loans at the Caixafell from 68 percent in 2006 to 40 percent in 2008 for commercial loans generally and from62 percent to 59 percent for consumer loans and 75 percent to 22 percent for loans tobusiness The value of late home loans as a percent of total home loans also fell from 31 to17 percent in 2008
Caixa AA-H Credit Classification 2001-8
Days Prov-Late ision 2001 2002 2003 2004 2005 2006 2007 2008 2009 2010 2011
---------------------------------------------------------------------------------------------------------------------------------------AA lt15 0 59 56 66 63 54 50 63 94A lt15 05 243 264 313 288 393 435 401 333---------------------------------------------------------------------------------------------------------------------------------------B 15-30 1 127 126 137 139 143 158 206 271C 31-60 3 203 166 145 169 167 192 194 192D 61-90 10 178 261 207 217 133 60 45 33---------------------------------------------------------------------------------------------------------------------------------------E 91-120 30 18 19 20 20 22 13 09 07F 121-50 50 49 15 15 14 10 07 07 07G 151-80 70 15 08 09 10 08 10 10 09
H gt180 100 104 87 85 77 68 72 61 51R$billion 2094 2353 2614 3016 3855 4736 5739 818---------------------------------------------------------------------------------------------------------------------------------------Source Caixa Annual Reports 2002-2008
The credit risk matrix of Caixa loans from 2001 to 2008 confirms this trend ofimprovement (See above table) The data also provide evidence of greater transparency andthe improvement of bank reporting and accounting standards as well as Central Banksupervision of banks Instead of two categories of credit (good = all loans up to 90 daysoverdue bad = loans over 90 days overdue) the Central Bank of Brazil has adoptedinternational standards of credit classification (from AA to H) and imposed regulations that
banks increase or decrease provisions according to the distribution of loans in thesecategories The scale of provisions required by the Central Bank vary from zero percentagainst loans classified as AA to provision of 100 percent of loan values for credits classifiedas H that is to say over 180 days late
The percent of loans over 180 days late has decreased from 104 percent of total in2001 to 51 percent in 2008 Furthermore all categories of late payment except for loansbetween 15-30 days late decreased significantly from 2001 through 2008 In comparisonloans classified as AA (paid and guaranteed) and A (paid on time) increased from 59 percentto 94 percent and 243 percent to 333 percent of total loans The only category of late loansthat increased over the period is that of loans 15-30 days overdue from 127 percent to 271percent of total
The central argument of this study is that Brazilian federal government banks retaininstitutional foundations of competitive advantage over private and foreign banks Further
8132019 Government Banking and BRICs in the Recent Financial Crisis
httpslidepdfcomreaderfullgovernment-banking-and-brics-in-the-recent-financial-crisis 2557
983106983122983113983107 983111983151983158983141983154983150983149983141983150983156 983106983137983150983147983155 983137983150983140 983110983145983150983137983150983139983145983137983148 983123983156983137983156983141983139983154983137983142983156
25
data that suggests this advantage can be seen in the increasing volume and market share ofthe Caixa in debit and credit cards The number of Caixa debit cards increased from 224million in 2002 to over 482 million in 2008 with Caixa market share of debit cards increasedfrom 196 percent ot total card market in 2002 to peak at 230 percent in 2005 and remainingat 219 percent of the total number of debit cards in Brazil in 2005
Two examples illustrate the institutional foundations of comparative advantage of theCaixa in the card payment industry First like other banks in Brazil the Caixa shares anagreement with Visa for payment processing However unlike other banks in Brazil theCaixa was contracted by the federal government to distribute ATM citizenship cards torecepients of federal government family grants and other transfer programs Apparentlywithout seeking approval the Caixa stamped its brandname on the federal government ATMcitizenship card and has continued to do so despite charges of unfair competition fromprivate domestic banks Furthermore a Caixa request to transform its 110 million ATMcitizenship cards into bank cards currently pending at the Central Bank would dramaticallyincrease the number of bank card holders in Brazil (1824 million at year end 2007)
Caixa Debit and Credit Card Market Shares 2002-2008
Million Debit Cards Million Credit Cards MillionCaixa Total Mkt Caixa Total Mkt Interbank Checks
----------------------------------------------------------------------------------------------------------------2002 224 1142 (196) 16 407 (39) 229502003 280 1254 (223) 18 440 (40) 213602004 320 1491 (213) 20 535 (37) 196702005 377 1639 (230) 25 675 (37) 183902006 384 1744 (220) 31 952 (32) 162202007 400 1824 (219) 39 1177 (33) 144902008 482 42----------------------------------------------------------------------------------------------------------------Source Central Bank of Brazil Diagnoacutestico do Sistema de Pagamentos de Varejo do Brasil Adendo Estatiacutesticondash 2007 p 9 and Caixa annual reports 2003-2008
Having reviewed the Banco do Brasil and Caixa a brief look at the counter-cyclicalpolicies and performance of the third Brazilian federal government bank ndash the BNDES ndash is inorder
Banco Nacional de Desenvolvimento Econocircmico e Social (National Bank for Economic
and Social Development BNDES)
The BNDES is a paradigmatic development bank The trajectory of the BNDES involves asequence of policies and financial practices that have shaped Brazilian development Duringthe 1950s the BNDE supplied direct credits for transportation electric energy infrastructureand steel production During the 1960s the bank diversified under financial reforms Duringthe 1970s the BNDE acted to complete state-led import substitution industrialization bychanneling foreign finance and forced savings into capital goods project lending and regionaldevelopment programs During the 1980s the bank shifted away from public investmentunder pressure of fiscal crisis and foreign debt During the 1990s the BNDES became agentfor the privatization of state owned enterprises The BNDES remained virtually the onlysource of long-term finance during a decade of financial crises in emerging markets (1994-2003) Since 2000 the bank has shifted toward ldquosecond generationrdquo reforms designed tofinance the private sector and free market forces deepen domestic capital and equity markets
8132019 Government Banking and BRICs in the Recent Financial Crisis
httpslidepdfcomreaderfullgovernment-banking-and-brics-in-the-recent-financial-crisis 2657
983106983122983113983107 983111983151983158983141983154983150983149983141983150983156 983106983137983150983147983155 983137983150983140 983110983145983150983137983150983139983145983137983148 983123983156983137983156983141983139983154983137983142983156
26
and lend to small medium and micro-enterprises Since 2004 capital inflows and a boomingdomestic stock market have reinforced the capacity of the BNDES to underwrite long-terminvestments and transform large Brazilian firms into multinational corporations Since 2007BNDES President Coutinho has pursued a full service approach attempting to help star-upsmall and medium firms provide funds to expand successful firms and participate in venture
capital funds to help enterprises transit toward corporate governance standards and initial orsecondary offerings of stock on the Bovespa exchange In 2008 as financial crisis led to ashortage of credit collapse of share prices and sharp decline in industrial production byfourth quarter 2008 the BNDES also provided lending of last resort to major Braziliancorporations while retaining long term goals for massive investments in deep sea petroleumproduction
BNDES Market Share of Interbank and Non-Bank Loans 1995-2008 US$ Billion
Interbank Loans Non-Bank Loans------------------------------------------ ------------------------------------------
BNDES Mkt Total BNDES Mkt Total-----------------------------------------------------------------------------------------------------------1995 156 (324) 481 80 (38) 20711996 181 (354) 511 109 (49) 21981997 197 (278) 707 145 (68) 21031998 216 (355) 608 230 (113) 20201999 204 (410) 497 150 (35) 14282000 243 (439) 553 152 (96) 15772001 259 (504) 515 145 (104) 13912002 233 (443) 525 137 (130) 10512003 261 (419) 622 200 (141) 14152004 306 (408) 749 218 (122) 17862005 343 (373) 918 277 (113) 24312006 388 (350) 1106 329 (102) 32312007 524 (335) 1563 432 (88) 48852008 530 (493) 1073 456 (96) 4743200920102011-----------------------------------------------------------------------------------------------------------Source Central Bank of Brazil Top 50 Banks 1995-2008
Revew of BNDES lending since 1995 suggests the realization of competitiveadvantages typical of a large centralized development bank Contrary to the extensive branchoffice networks retained by the Banco do Brasil and Caixa the BNDES retains under 1900employees (compared to 105000 at Caixa) in the Rio de Janeiro and four regional officesSince 1995 the BNDES increased its market share of non-bank loans from R$80 billion (38percent) to R$200 billion (141 percent) during the economic downturn risk aversion andcredit shortage in 2003 After 2003 the BNDES market share of loans to non-financialentities decreased to 88 percent of total loans albeit increasing during 2008 to 96 percentThis suggests that the BNDES has increased its market share of lending to non-financialsector since liberalization of the industry and privatization of state government banks
8132019 Government Banking and BRICs in the Recent Financial Crisis
httpslidepdfcomreaderfullgovernment-banking-and-brics-in-the-recent-financial-crisis 2757
983106983122983113983107 983111983151983158983141983154983150983149983141983150983156 983106983137983150983147983155 983137983150983140 983110983145983150983137983150983139983145983137983148 983123983156983137983156983141983139983154983137983142983156
27
BNDES inter-bank lending also increases substantially Since the Real Plan endedinertial inflation in 1994 the BNDES has expanded its market share of interbank lendingfrom 156 billion (324 percent) in 1995 to 530 billion (493 percent) in 2008 during creditshortage and stock market collapse During previous years of financial crisis and economicreversals the BNDES also increased interbank lending significantly For example during the
1999 and 2001 crises BNDES interbank lending increased to 410 percent and 504 percentof total This marked presence in interbank loan market reflects the role of the BNDES inproviding indirect lending to targeted sectors through private foreign and other governmentbanks in Brazil
BNDES Loan Approvals by Program 1995-2007 R$ Billion
Direct Lending 1999 2000 2001 2002 2003 2004 2005 2006 2007 2008 2009--------------------------------------------------------------------------------------------------------------------------------------Finem 51 55 68 133 79 114 132 145 220 285Capital Markets 16 19 09 08 09 06 20 34 35 104Export-Import 23 34 39 77 63 56 67 40 13 32
Sub-Total 91 109 118 219 153 177 220 221 269 424Percent Total (505) (474) (468) (585) (456) (447) (469) (430) (415) (464)
Indirect Lending--------------------------------------------------------------------------------------------------------------------------------------Finem 31 40 37 16 12 16 18 27 51 60Finame 16 25 33 40 53 66 93 107 170 221Finame Agro 07 13 18 30 28 45 21 14 20 27Finame Leasing 00 000 02 02 03 02 04 06 14 16Export-Import 14 23 20 40 56 54 73 97 67 95BNDESautom 18 17 22 24 27 34 36 35 50 55Sub-Total 89 120 134 154 182 220 249 292 379 484Percent Total (495) (526) (532) (415) (544) (553) (531) (570) (585)(536)
BNDES Total 180 230 252 374 335 398 469 513 648 908----------------------------------------------------------------------------------------------------------------Source BNDES statistics by modality available on wwwbndesgovbr
Review of BNDES finance by program suggests the evolution of credit policies from1995 through 2008 and increasing reliance on indirect lending through other financialintermediaries The three major programs of direct finance Financiamento aEmpreendimentos (Business Finance Finem) Mercado de Capitais (Capital Markets) andExport-Import finance remained between 505 percent and 415 percent of total BNDESlending with the exception of 2002 Indirect lending through six broad programs remained
between 495 percent and 585 pecent of total BNDES lending with the exception of 2002Indirect lending programs include Finem business lending Financiamento de Maquinas(Machine Finance Fineme) with agricultural and leasing modalities Export-Import financingand BNDES automatic lending provisions
These trends suggest the realization of competitive advantages over private andforeign banks in Brazil BNDES long term interest rates remained substantially lower thanSelic benchmark overnight inter-bank interest rates throughout this period while the lowercost of small staff and operations of the BNDES made lending at these rates viable Anothercompetitive advantage of the BNDES over private and foreign banks is the developmentbankacutes mandate as manager of funds from the forced savings fund Fundo de Amparo ao
Trabalhador (Worker Asssistance Fund FAT) Constitutionally mandated investments inproductive activities (not government bonds) increased from R$31 billion in 2000 to R$101
8132019 Government Banking and BRICs in the Recent Financial Crisis
httpslidepdfcomreaderfullgovernment-banking-and-brics-in-the-recent-financial-crisis 2857
983106983122983113983107 983111983151983158983141983154983150983149983141983150983156 983106983137983150983147983155 983137983150983140 983110983145983150983137983150983139983145983137983148 983123983156983137983156983141983139983154983137983142983156
28
billion in 2008 comprising 170 percent of BNDES liabilities This means that 170 percentof BNDES finance and lending is based on long-term deposits that provide no liquidity riskThis provides a competitive advantage over private and foreign banks
A closer look at BNDES lending by sector suggests that the bank still focuses
primarily on industry and infrastructure Despite the adoption of second generation reformsthat seek to free market forces and accelerate innovation and productivity through small andmedium enterprises BNDES lending still focuses on large scale industrial and long-terminfrastructure finance In this respect the BNDES embodies a persistent need in developingeconomy for state-led development banking along the lines emphasized by Lewis Myrdaland development economists 50 years ago This traditional sense of commanding heights thusstill captures the role of the BNDES in Brazilian political economy Despite more than twodecades of privatizations financial liberalization bank reforms and a variety of fiscalfinancial and economic reforms that have substantially modernized the domestic Brazilianeconomy and freed market forces the BNDES remains the single most important source forlong-term finance and credit The capitalization of the Bovespa stock market from 2004-
2008 for the first time in Brazilian history reduced the virtual monopoly of BNDES overlong term finance
BNDES Operations approved and invested by Sector 1998-2007 R$billion
1998 1999 2000 2001 2002 2003 2004 2005 2006 2007Industry ----------------------------------------------------------------------------------------------------------------------------approved 96 79 126 152 171 163 145 290 395 402invested 76 84 104 132 174 161 158 234 272 306
Infrastructure ----------------------------------------------------------------------------------------------------------------------approved 116 69 110 65 161 149 137 186 240 369invested 83 66 86 75 130 100 152 171 170 209
Other--------------------------------------------------------------------------------------------------------------------------------approved 18 47 40 54 79 93 117 69 108 126investedTotal --------------------------------------------------------------------------------------------------------------------------------approved 230 195 276 271 411 404 379 545 743 897invested 190 181 230 252 374 335 398 470 513 617
----------------------------------------------------------------------------------------------------------------Source BNDES Annual Reports 2003-2008 and testimony of BNDES President to Congress March 2009
Long-term investments have produced substantial profits at the BNDES The bank hasrecorded profits each year since 1999 increasing from over R$600 million in 1999 overR$32 billion during 2005 reaching over R$73 billion in 2007 The long-term character of
BNDES finance stands in stark contrast to policies at private banks Contrary to strategy ofprivate and foreign banks to trade and hold government paper described in chapter three theBNDES suspended purchase and trading in government paper because of constitutionalmandates to contribute to development and employment Furthermore the turn to capitalmarkets at the BNDES has provided substantial returns since 2004
However this does not mean that BNDES lending protected unproductive industriesInstead of wasting resources to unnecessarily bail out firms or provide crony credit highreturns and strong profits at the BNDES suggest that lending was sound Standard indicatorsof bank performance asset quality and capital reserves against credit and capital risk provideempirical control for this All these measures suggest that the BNDES weathered the periodof adjustment and sustained counter-cyclical investment policies without placing resources atrisk beyond Central Bank of Brazil regulations and BIS guidelines And returns have
8132019 Government Banking and BRICs in the Recent Financial Crisis
httpslidepdfcomreaderfullgovernment-banking-and-brics-in-the-recent-financial-crisis 2957
983106983122983113983107 983111983151983158983141983154983150983149983141983150983156 983106983137983150983147983155 983137983150983140 983110983145983150983137983150983139983145983137983148 983123983156983137983156983141983139983154983137983142983156
29
increased since recovery in 2004 BNDES participation in the booming Bovespa stock marketsince 2003 has provided record returns
The BNDESpar subsidiary that invests in capital markets has also recorded strongreturns during the period of economic growth and into the 2008 financial crisis BNDESparreturns on liquid assets increased from 75 percent in 2004 to 277 percent in 2007 declining
to 245 percent in 2008 Average returns on assets and stock holdings also remained highbuilding the assets held by the BNDESpar subsidiary from 141 billion in 2005 to 359 billionin 2008
This increased participation of the BNDES in capital markets involves new relationsand networks across government private sector labor unions the private pension funds ofgovernment bank and government enterprise employees and financial markets By 2007BNDES participation in stockholding and mutual funds reached across 261 forms and 25mutual funds totaling over R$910 billion reals The BNDES thereby retains broad portfoliothat represents institutional foundations of comparative advantage Furthermore unlike thepolicy of private and foreign banks to trade and hold high interest rate paying short termgovernment paper during the sudden stop of foreign finance and downturn in the Brazilian
business cycle (2002-3) the BNDES expanded credit operations and reduced financialoperations in secondary markets for indexed government paper This countered the perverseimpact of the liquidity preference among private and other government banks that increasedmarket pressures and led to shorter terms and higher cost of Brazilian government debt
BNDES aversion of government paper is required by constitutional mandate tomanage forced savings funds in ways that generate employment and income As noted alarge part of BNDES resources (liabilities) are from domestic official savings programs Thevalue of FAT resources increased from R$492 billion in 2003 to R$662 billion in 2005while the PIS-Pasep fund remained at approximately R$200 billion Foreign capital has alsobeen channeled to the BNDES through multilateral agencies and foreign bond issues Foreignloans to the BNDES have declined Multilateral agencies provided R$70 billion in 2003increased funding to R$129 billion during 2004 and continued to provide R$107 billion tothe BNDES during 2005
Comparison of BNDES structure and performance with development banks abroadsuggests both the large scale and scope of BNDES operations and controls formismanagement and political abuse of the bank In 2007 BNDES total assets are almostdouble the value reported by the Inter-American Development Bank (IADB) over frac12 thevalue of total assets held by the World Bank and almost ten times the value of assets held bythe French government development bank CAF Furthermore profits and loans from theBNDES far exceeded all three institutions The US$330 billion in loans reported by theBNDES far exceed the US$67 billion from the IADB the US$110 reported by the World
Bank and US$58 billion reported by the CAF BNDES profis returns on assets and return onliquid patrimony also far exceeded those reported by these three development banks thatserve as comparative control over performance and policies at the BNDES Finally lateloans at the BNDES remained at 011 percent of total loans well below levels reported by theWorld Bank comparable to the 010 percent reported by the IADB while considerably abovethe 001 percent reported by CAF
8132019 Government Banking and BRICs in the Recent Financial Crisis
httpslidepdfcomreaderfullgovernment-banking-and-brics-in-the-recent-financial-crisis 3057
983106983122983113983107 983111983151983158983141983154983150983149983141983150983156 983106983137983150983147983155 983137983150983140 983110983145983150983137983150983139983145983137983148 983123983156983137983156983141983139983154983137983142983156
30
Comparison of BNDES and Regional Development Banks 2007 US$ billion
BNDES IADB World Bank CAF----------------------------------------------------------------------------------------------------------------Total Assets 1144 699 2080 125
Liquid Patrimony 140 203 399 41Liquid Profits 38 01 -01 04Desembolsos 339 67 110 58Credit Portfolio 928 479 978 95Capitalization percent 123 291 192 328Return on Assets percent 38 47 na 36Return on PL percent 332 07 na 105Late Loans percent 011 010 086 001----------------------------------------------------------------------------------------------------------------Source BNDES Annual Report 2007
The large scale of BNDES lending and finance make it possible for governmentpolicy to provide counter cyclical credit to avert or ameliorate economic downturns andsubstitute private and foreign credit shortages In March 2009 testimony to Congress ongovernment policies during financial crisis BNDES President Coutinho argued that bankpolicy was to reduce the cost and increase the supply of credit Resources for counter cyclicallending during 2008-2009 came from Treasury loans to BNDES released by provisionaldecrees 439 and 414 summing R$175 billion transfer of R$60 billion in CVS funds sale ofFGTS Investment Fund and bank certificates summing R$170 billion Furthermore the thirdphase of conditional credit facility shared by Inter-American Development Bank and theBNDES provided the last tranch of a total US$60 billion for BNDES operations
Two further means were used by the BNDES to infuse capital during the collapse of
the stock market and shortage of credit during 2007-8 The counter cyclical policies of theBNDES can also be seen in the over two fold increase of BNDES holdings in private equityand investment funds Table 512 reports the value of private equity and investment fundholdings of the BNDES in 2007 and 2008 BNDES funds in private equity and mutual fundsincreased from R$4038 million in 2007 to over R$10 billion in 2008 The capitalization ofmutual funds and private equity firms by the BNDES also played an important countercyclical role during this period
BNDESpar Shareholding 2007-8 R$million
Percent Value ValueShares 2008 2007
----------------------------------------------------------------------------------------------------------------Ameacuterica Latina Logiacutestica 106 6386 -Aracruz 55 1292 1292Banco do Brasil 25 10854 12752Bom Gosto (2) 345 2458 -Brasil Telecom Part 30 1666 1958Braskem 52 2275 2432Brenco 209 1400 -CEG 345 1406 -CESP 57 2347 1397Coteminas 103 1150 1340
CPFL Energia 62 6081 5506Cia Sideruacutergica Nacional 36 1513 2686CVRD 40 15082 7098
8132019 Government Banking and BRICs in the Recent Financial Crisis
httpslidepdfcomreaderfullgovernment-banking-and-brics-in-the-recent-financial-crisis 3157
983106983122983113983107 983111983151983158983141983154983150983149983141983150983156 983106983137983150983147983155 983137983150983140 983110983145983150983137983150983139983145983137983148 983123983156983137983156983141983139983154983137983142983156
31
ELETROBRAacuteS (1) 118 22400 22400EMBRAER 50 1096 1096Gerdau 35 1533 490Independecircncia 139 2500 -JBS 130 14722 11370Klabin 202 5621 -
Light 336 8225 -Marfrig 146 8176 1020MPX Mineraccedilatildeo 26 1791 1791Ouro Fino 200 1057 840Paranapanema 175 1252 08Petrobraacutes 76 10226 10226Rede Energia SA 253 2633 -Tele Norte Leste Participaccedilotildees 16 1645 1645Valepar 97 26254 15585Subtotal 163055 102941Other firms 12223 12606Total 175278 115548----------------------------------------------------------------------------------------------------------------
Source BNDESpar Financial Statements 2008 pp
The BNDES also holds blocks of shares in many major Brazilian corporationsthrough its participation subsidiary BNDESpar Comparing value of investments in 2007 and2008 suggests that large purchases capitalized firms precisely as financial crisis and downturnin Bovespa stock market made it difficult for firms to find working capital Table X reportsthe percent of total company shares held by the BNDES and their respective market values(adjusted for risk of future losses) at year end 2007 and 2008 During this year of extremelyshort and expensive credit in Brazil caused by the international financial and banking crisisthe BNDES increased shareholding by over R$60 billion reals in 28 private Brazilianenterprises Further shareholding classified as X in Five firms (Bertin 269 Brasiliana 538
Copel 239 Rio Poliacutemeros 250 Telemar 313) Once again the BNDES provided access tocapital for firms caught in the sudden credit crunch and stock market collapse unable to meetobligations or raise funds through equity issues or commercial bank credit This countercyclical role of government banks has been critical in Brazil since the 19 th century
BNDESpar Private Equity and Fund Participation 2007-2008 R$million
Fund Manager 2008 2007-------------------------------------------------------------------------------------------------------------------------Brasil 21 Dynamo 46 60PROT Mellon Financial Services 4628 -
Logiacutestica Brasil Bradesco 135 -Fire BrasilPrivate 269 250FIPGG Governanccedila amp Gestatildeo Inv 289 311Opportunity Equity Partners Mellon Financial Services 1046 578Brasil Energia Bradesco 1184 655InfraBrasil ABN-Amro 677 251Rio Bravo Cinema Rio Bravo 116 110Brascan Petro amp Gaacutes Bank Brascan 136 113AG Angra Infra-Estrutura Bradesco 380 301Satildeo Paulo Metro Fund Bradesco 791 831Other Funds 653 572Total 10356 4038---------------------------------------------------------------------------------------------------------------------------
Source BNDESpar Financial Statements 2008
8132019 Government Banking and BRICs in the Recent Financial Crisis
httpslidepdfcomreaderfullgovernment-banking-and-brics-in-the-recent-financial-crisis 3257
983106983122983113983107 983111983151983158983141983154983150983149983141983150983156 983106983137983150983147983155 983137983150983140 983110983145983150983137983150983139983145983137983148 983123983156983137983156983141983139983154983137983142983156
32
Finally Brazilian federal government triennial plans include investment targets by theBNDES If current plans are compared to 2004-7 investments several structural changes inBNDES lending appear First BNDES plans for Oil and Petroleum production reveal aprofound change for Brazilian political economy In 1990 roughly 45 percent of oilconsumed in Brazil was imported In 2007 before oil price increased reversed the balance
Brazil reported domestic production levels sufficient to meet domestic consumptionFurthermore discoveries of substantial deep sea oil reserves have led the BNDES to planmassive investments involving Petrobras and other global petroleum firms For the 2009-2012 period investments in petroleum and gas (R$2697 billion) Petrochemicals (237) andEthanol (197) sum to over R$3130 billion
BNDES Triennial Investment Plans 2004-2012
2004-7 2007-10 2008-11 2009-12----------------------------------------------------------------------------------------------------------------Petroleum amp Gas 1472 1836 2028 2697
Mining 472 527 813 480Petrochemicals 64 174 264 237Steel 198 371 312 245Automotive 150 176 264 235Electronics 143 156 140 240Ethanol 166 205 205 197Paper amp Celulose 104 200 274 90Health 51 46 51 80Industry Total 2816 3802 4437 4501----------------------------------------------------------------------------------------------------------------Source BNDES Annual Reports 2002-2006
It is of note that President Dilma Roussef was instrumental in reducing the targets for2009-12 in petroleum and gas given indications that Petrobras and existing framework foroffshore oil prospecting and production proved unable to increase investments accordingly
The BNDES also retains a presence in government projects by providing managementassistance During 2008 BNDES staff provided management support for implementation of192 projects involving R$710 billion of total R$142 billion PT government growthacceleration projects BNDES staff also participated in the design management andimplementation of President Lularsquos Poliacutetica de Desenvolvimento Produtivo (Policy forProduction Development) involving R$2100 billion targeting production chains designed tomaximize employment and regional development benefits Finally the BNDES was alsocharged to create and co-manage a Fundo Amazonia with the Ministry of Environment toprovide incentives to reduce deforestation of the Amazon region BNDES Plans for 2009include completion of concession for construction of high speed train line and service for Riode Janeiro-Satildeo Paulo corridor two blocks of highway concession sales involving three majorhighways in each block of sales sale of management concessions for regional airports andthe reorganization of INFRAERO federal government airport management company
These policies reflect the goal of BNDES policy to launch firms on the stock marketrather than maintain direct credit and finance Exceptions during 2008 involve Auto andEthanol industies both for strategic and broader policy reasons Given the sharp downturn inauto sales during fourth quarter 2008 the BNDES provided significant lending to avert
further downsizing or failure of auto companies in Brazil Given the current globalredistribution of automobile production BNDES policies are designed to help the Brazilian
8132019 Government Banking and BRICs in the Recent Financial Crisis
httpslidepdfcomreaderfullgovernment-banking-and-brics-in-the-recent-financial-crisis 3357
983106983122983113983107 983111983151983158983141983154983150983149983141983150983156 983106983137983150983147983155 983137983150983140 983110983145983150983137983150983139983145983137983148 983123983156983137983156983141983139983154983137983142983156
33
operations of major auto firms through the period of adjustment and increase theattractiveness of domestic operations in global production strategies of multinational autocompanies Ethanol production also received massive funds to sustain an industry seen ascritical for alternative and sustainable fuel source capable of replacing petroleum Ethanolreached over 50 percent of automotive fuel sales in 2007
Under the Lula government (2003-10 the BNDES also resumed lending to state andmunicipal governments Since the renegotiation of municipal and state government debts inthe late 1990s states and municipalities have been largely prohibited from taking on debtThis was emplematic of the recentralization required to control fiscal excesses during militaryrule and the prolonged period of transition to democracy Policies during the 1990s weredesigned to avert overspending seen as critical to maintain price stability under the Real Plan(1994) In 2000 the Lei de Responsibilidade Fiscal (Fiscal Responsibility Law) largelyprohibited credit and finance to state and municipal governments Since 2000 municipalitiesand states have been required to submit detailed budget statements that in turn have been thebasis for a gradual return to sub-national government finance In August 2006 central bankand Treasury regulations freed municipalities to take on credit up to 12 times liquid receipts
Since then the BNDES has led in terms of credits and finance to subnational governmentsthrough a Programa Especial de Financiamento aos Estados e Distrito Federal
The BNDES also has developed the first system in Brazil for risk analysis ofmunicipal governments and has led in the market for municipal credit freed by August 2006procedures for approval at Treasury the Central Bank and Conselho Monetaacuterio Nacional(National Monetary Council) Prosecution of mayors and firms charged with managingmunicipal credits with the BNDES revealed fraudulent practices These funds for sub-national public finance also became critical mechanisms to counter severe budget shortfallscaused by financial crisis during 2008 Given that municipal and state government tax basesare shallow and that federal government transfers provide the bulk of sub-nationalgovernment resources the Lula administration allocated R$ 40 billion to the Fundo deParticipaccedilatildeo dos Estados (State Participation Fund) through a Programa Emergencial deFinanciamento (Emergency Finance Fund) administered by the BNDES
In sum the BNDES expanded credit and finance operations substantially during fouryears of sustained growth from 2004-2007 And having helped underwrite the stock marketboom and capitalized Brazilian firms directly and indirectly through credit finance mutualfunds and private equity funds the BNDES retained sufficient scale scope and capital baseto provide counter cyclical credit and finance to help firms adjust to financial crisis and creditshortage during 2008 In retrospect the growth of the BNDES since liberalization andprivatizations of state government banks in the 1990s suggest the comparative advantages of
development banking BNDES credit and finance fell to 52 percent of fixed capitalformation in 1995 Since then the turn to neo-developmentalism and a period of sustainedeconomic growth during the Lula administration increased the BNDES share of total fixedcapital formation during 2006 and 2007 to 126 and 141 percent Critics charge thatmonopoly over FGTS and PIS-PASEP official savings funds as liabilities provide theBNDES with unfair competitive advantage over private banks In 2008 forced savings fundssummed to only 17 percent of BNDES liabilities (resources) The BNDES does not relyexclusively on forced savings for competitive advantage Instead market-oriented policies
joint-ventures with private mutual funds investment funds private equity firms large blocksof shareholding in Brazilian firms and massive amounts of credit and investment to theprivate sector at below market but still profitable long term interest rates of 625 percent
suggest that the large scale and scope of BNDES operations provide institutional foundationsof competitive advantage over private and foreign banks
8132019 Government Banking and BRICs in the Recent Financial Crisis
httpslidepdfcomreaderfullgovernment-banking-and-brics-in-the-recent-financial-crisis 3457
983106983122983113983107 983111983151983158983141983154983150983149983141983150983156 983106983137983150983147983155 983137983150983140 983110983145983150983137983150983139983145983137983148 983123983156983137983156983141983139983154983137983142983156
34
Capitalization of the BNDES by Treasury of over R$2300 billion 2009-11hascaptured attention of many observers of Brazilian development Critics and advocates agreethat the BNDES has realized significant competitive advantages over private and foreignbanks and continues to serve as significant alternative to capital markets for large scaledevelopment projects However like the downturn in planned investments by Petrobras for
oil and gas exploration and production BNDES decreased planned investments fromR$1684 billion in 2010 to R$1397 billion in 2011 We believe this indicates the limits ofmanagement and passing of period of crisis both favoring finance from capital marketsbanks and public-private partnerships
India
Analysis of Brazilian federal banks suggests that these institutions provided policy alternativewhile realizing competitive advantage over private and foreign banks The modernization ofthese institutions helps explain why these large institutions were able to stay the effects ofcredit crunch and financial market downturn in Brazil This section explores data from the
Reserve Bank of India to compare market shares of types of banks from 1972-2008 and bankperformance from 2006-10 Further analysis will be required However the data appears tosupport our core argument that government banks have modernized and realized competitiveadvantages over private and foreign banks
First the number of branch offices which serves as a measure of institutionalcoverage across India of special concern for financial inclusion and the theory thatliberalization and privatizations would lead private banks to expand branch offices andincrease the supply of services From this perspective the trajectory of branch officessuggests that nationalized banks the State Bank of India and regional rural bankssustain much larger networks of branch offices that predominate while otherscheduled commercial (private and foreign) banks retain less than 8000 branch offices
Data from the Reserve Bank of India on the number of current accounts retainedby type of bank provide further evidence that the State Bank of India and its associates
8132019 Government Banking and BRICs in the Recent Financial Crisis
httpslidepdfcomreaderfullgovernment-banking-and-brics-in-the-recent-financial-crisis 3557
983106983122983113983107 983111983151983158983141983154983150983149983141983150983156 983106983137983150983147983155 983137983150983140 983110983145983150983137983150983139983145983137983148 983123983156983137983156983141983139983154983137983142983156
35
national banks and regional rural banks provide the bulk of banking accounts to theIndian population while private and foreign banks cherry pick upscale urban marketsreproducing capital drain and inequalities
Number of Current Accounts by Type of Bank 1972-1995
Since 1999 the pattern of predominance by alternative banking institutions and the minorrole of other scheduled commercial banks and foreign banks continues
The following figures report the value held in current accounts by type of banks first fromthe 1972-1995 period then from the 1999-2008 period For both time periods the trendconfirms that private and foreign banks remain at a competitive disadvantage in terms of thebroader market while the State Bank of India and its associates nationalized banks andregional rural banks tend to predominate
8132019 Government Banking and BRICs in the Recent Financial Crisis
httpslidepdfcomreaderfullgovernment-banking-and-brics-in-the-recent-financial-crisis 3657
983106983122983113983107 983111983151983158983141983154983150983149983141983150983156 983106983137983150983147983155 983137983150983140 983110983145983150983137983150983139983145983137983148 983123983156983137983156983141983139983154983137983142983156
36
Current Account Value by Type of Bank 1972-1995 R
Number of Deposit Accounts by type of bank 1999-2008
A similar pattern appears for the trajectory of savings accounts both the number of
accounts and the value held in savings accounts both for the 1972-1995 period We wereunable to organize data from the more recent period
8132019 Government Banking and BRICs in the Recent Financial Crisis
httpslidepdfcomreaderfullgovernment-banking-and-brics-in-the-recent-financial-crisis 3757
983106983122983113983107 983111983151983158983141983154983150983149983141983150983156 983106983137983150983147983155 983137983150983140 983110983145983150983137983150983139983145983137983148 983123983156983137983156983141983139983154983137983142983156
37
Number of Savings Accounts by Type of Bank 1972-1995
Value in Savings Accounts by Type of Bank 1972-1995
Number of Term Savings Accounts by Type of Bank 1972-1995
8132019 Government Banking and BRICs in the Recent Financial Crisis
httpslidepdfcomreaderfullgovernment-banking-and-brics-in-the-recent-financial-crisis 3857
983106983122983113983107 983111983151983158983141983154983150983149983141983150983156 983106983137983150983147983155 983137983150983140 983110983145983150983137983150983139983145983137983148 983123983156983137983156983141983139983154983137983142983156
38
Value in Term Savings Accounts by Type of Bank 1972-1995
The number and value of credits extended by banks from 1999-2008 appears mostpromising in terms of comparative analysis of bank performance and behavior Thesignificant spread at the end of the time series between the State Bank of India and itsassociates and foreign banks suggests the impact of foreign financial crisis and differentdomestic policies by these types of banks in India similar to that noted in the Brazilianexperience
Number of credits by type of bank 1999-2008
Value of credit by type of bank 1996-2008
8132019 Government Banking and BRICs in the Recent Financial Crisis
httpslidepdfcomreaderfullgovernment-banking-and-brics-in-the-recent-financial-crisis 3957
983106983122983113983107 983111983151983158983141983154983150983149983141983150983156 983106983137983150983147983155 983137983150983140 983110983145983150983137983150983139983145983137983148 983123983156983137983156983141983139983154983137983142983156
39
Further data from the Reserve Bank of India from 2008-10 permit closercomparison of government private and foreign banks in the recent financial crisis Interms of deposits investments total assets and net profits the dominant and expandingrole of government banking in India is apparent Further control variables (not reported)
include gross and net NPA types of income expenses and expenditures provisions andcontingencies and credit- and investment-deposit ratios provide control for bad bankingand confirm the counter cyclical policies during 2008-10 in India
THE FOLLOWING TABLES REQUIRE INTERPRETATION
Number of Banks 2006-7 2007-8 2008-9 2009-10 2010-11
State Bank of India amp Associates 8 8 7 7 6Nationalized Banks 20 20 20 20 20Old Private Sector Banks 17 15 15 15 14
New Private Sector Banks 8 8 7 7 7Foreign Banks 29 28 31 32 33Source RBI A Profile of Banks 2010-11
Number of Branch Offices 2006-7 2007-8 2008-9 2009-10 2010-11
State Bank of India amp Associates 14673 15848 16894 18178 18772Nationalized Banks 37435 39255 40956 43452 45640Old Private Sector Banks 4723 4690 4908 5220 5011New Private Sector Banks 2599 3635 4333 5232 6957
Foreign Banks 272 277 295 308 316Source RBI A Profile of Banks 2010-11
Number of Employees 2006-7 2007-8 2008-9 2009-10 2010-11
State Bank of India amp Associates 255699 249008 268598 266605 282453Nationalized Banks 473179 466400 462926 473041 475082Old Private Sector Banks 47994 48700 51341 55052 55075New Private Sector Banks 91060 110123 124998 127468 163604Foreign Banks 28426 31301 29582 28012 27968
Source RBI - India BanksAssociation
Business per employee (in lakh) 2006-7 2007-8 2008-9 2009-10 2010-11
State Bank of India amp Associates 43635 54922 65022 73743 79306Nationalized Banks 49001 61828 78316 93586 114477Old Private Sector Banks 48159 56932 63843 69749 8149New Private Sector Banks 80782 83196 78715 84041 82607Foreign Banks 97477 11255 128274 141139 155974Note Business = Deposits + Advances
8132019 Government Banking and BRICs in the Recent Financial Crisis
httpslidepdfcomreaderfullgovernment-banking-and-brics-in-the-recent-financial-crisis 4057
983106983122983113983107 983111983151983158983141983154983150983149983141983150983156 983106983137983150983147983155 983137983150983140 983110983145983150983137983150983139983145983137983148 983123983156983137983156983141983139983154983137983142983156
40
Profit per employee (in lakh) 2006-7 2007-8 2008-9 2009-10 2010-11
State Bank of India amp Associates 257 362 443 466 42Nationalized Banks 287 377 486 567 695Old Private Sector Banks 234 406 469 42 563New Private Sector Banks 587 685 677 847 893Foreign Banks 1613 2112 2539 1692 2759
Capital amp Reserves amp Surplus(Ycrore) 2006-7 2007-8 2008-9 2009-10 2010-11
State Bank of India amp Associates 42941 61706 72422 83726 84394Nationalized Banks 92689 113079 135920 157276 205857Old Private Sector Banks 10736 15315 17477 20171 23821New Private Sector Banks 39736 76056 82192 99813 114768Foreign Banks 33075 49332 59937 69176 80972
Deposits Ycrore 2006-7 2007-8 2008-9 2009-10 2010-11
State Bank of India amp Associates 633476 773875 1007041 1108086 1245862Nationalized Banks 1360724 1679993 2105706 2583934 3127122Old Private Sector Banks 138249 165589 199274 229897 264157New Private Sector Banks 413738 509444 537104 592904 738602Foreign Banks 150750 191161 214076 232099 240689
Investments Ycrore 2006-7 2007-8 2008-9 2009-10 2010-11
State Bank of India amp Associates 211875 263823 357624 387473 385697Nationalized Banks 452981 536018 655042 828125 942837Old Private Sector Banks 43647 54080 72393 83499 92617New Private Sector Banks 171008 224498 234139 270618 329403Foreign Banks 71471 98910 130354 159291 165499
Advances Ycrore 2006-7 2007-8 2008-9 2009-10 2010-11
State Bank of India amp Associates 482270 593722 739450 857937 994154Nationalized Banks 957877 1203678 1519762 1843082 2311478
Old Private Sector Banks 92887 111670 128504 154085 184647New Private Sector Banks 321865 406733 446824 478356 612886Foreign Banks 126339 161133 165385 163260 195539
Interest Income Ycrore 2006-7 2007-8 2008-9 2009-10 2010-11
State Bank of India amp Associates 53465 70428 89196 97954 109828Nationalized Banks 110720 142647 183892 208029 256490Old Private Sector Banks 11474 14614 18790 20497 23299New Private Sector Banks 38092 56377 66282 62309 73528
Foreign Banks 17924 24417 30322 26390 28520
8132019 Government Banking and BRICs in the Recent Financial Crisis
httpslidepdfcomreaderfullgovernment-banking-and-brics-in-the-recent-financial-crisis 4157
983106983122983113983107 983111983151983158983141983154983150983149983141983150983156 983106983137983150983147983155 983137983150983140 983110983145983150983137983150983139983145983137983148 983123983156983137983156983141983139983154983137983142983156
41
Other Income Ycrore 2006-7 2007-8 2008-9 2009-10 2010-11
State Bank of India amp Associates 9420 11818 16073 18394 19240Nationalized Banks 14264 20979 26394 30500 28625Old Private Sector Banks 1568 2184 2782 3152 3029
New Private Sector Banks 10745 14822 15078 17271 17697Foreign Banks 7044 10588 14894 9951 10972
Interest Expended Ycrore 2006-7 2007-8 2008-9 2009-10 2010-11
State Bank of India amp Associates 32607 47809 61770 66229 67018Nationalized Banks 69353 101093 131676 145712 164135Old Private Sector Banks 7055 9960 12834 14076 14768New Private Sector Banks 25802 38535 44123 37130 42347Foreign Banks 7603 10604 12819 8938 10622
Operating Expenses Ycrore 2006-7 2007-8 2008-9 2009-10 2010-11
State Bank of India amp Associates 15987 16993 20088 25283 29146Nationalized Banks 27268 29670 35416 40792 53819Old Private Sector Banks 2967 3235 3939 4715 5600New Private Sector Banks 12353 17032 17840 18136 22006Foreign Banks 7745 10353 12298 11102 12557
Cost of Funds 2006-7 2007-8 2008-9 2009-10 2010-11
State Bank of India amp Associates 475 59 594 532 48Nationalized Banks 48 582 609 537 493Old Private Sector Banks 498 62 667 613 55New Private Sector Banks 524 611 604 442 427Foreign Banks 403 433 446 283 311Cost of Funds = Ratio () of interest paid on deposits and borrowings to averageof opening and closing balances of deposits and borrowings
Return on advances adjusted toCoF 2006-7 2007-8 2008-9 2009-10 2010-11
State Bank of India amp Associates 372 365 395 36 405Nationalized Banks 399 369 409 382 427Old Private Sector Banks 406 426 515 482 492New Private Sector Banks 447 505 526 514 516Foreign Banks 574 66 815 716 564
2006-7 2007-8 2008-9 2009-10 2010-11
8132019 Government Banking and BRICs in the Recent Financial Crisis
httpslidepdfcomreaderfullgovernment-banking-and-brics-in-the-recent-financial-crisis 4257
983106983122983113983107 983111983151983158983141983154983150983149983141983150983156 983106983137983150983147983155 983137983150983140 983110983145983150983137983150983139983145983137983148 983123983156983137983156983141983139983154983137983142983156
42
Wages as of Total Expenses
State Bank of India amp Associates 2155 1589 1506 171 1921Nationalized Banks 1794 1405 1331 1365 1641Old Private Sector Banks 1689 1367 1326 1457 1675
New Private Sector Banks 936 956 1017 121 1383Foreign Banks 2008 1995 1944 2348 2331
Returns on Assets 2006-7 2007-8 2008-9 2009-10 2010-11
State Bank of India amp Associates 086 097 102 091 079Nationalized Banks 094 101 103 100 103Old Private Sector Banks 078 114 115 095 112New Private Sector Banks 109 113 112 138 151Foreign Banks 228 209 199 126 174
Capital Adequacy Ratio 2006-7 2007-8 2008-9 2009-10 2010-11
State Bank of India amp Associates 1232 1321 1396 1346 1225Nationalized Banks 1237 1213 1324 1318 1347Old Private Sector Banks 1208 1408 1476 1485 1456New Private Sector Banks 1199 1439 1533 1803 1687Foreign Banks 1239 1305 1432 1726 1672Note To 2007-8 = Basel I From 2008-09 = Basel-II
Net NPA Ratio 2006-7 2007-8 2008-9 2009-10 2010-11
State Bank of India amp Associates 132 143 147 150 149Nationalized Banks 094 077 068 091 092Old Private Sector Banks 096 066 09 082 053New Private Sector Banks 097 109 129 103 056Foreign Banks 073 077 181 182 067Net NPA Ratio = Net non-performing assets as net advances
In sum descriptive data from the Reserve Bank of India confirm the anomaly
and argument drawn from the Brazilian experience An important dimension of BRICcountry recovery from the global financial crisis and downturn is the counter cyclicallending policies and realization of competitive advantages of government banks Thisposes a series of new questions for business schools and scholars of public policyInstead of liberalization and privatization leading to transitions in BRIC countriestoward capital market centered financial systems and liberal market economies publicbanks have realized competitive advantages over private and foreign banks whileproviding policy alternatives to BRIC governments in the face of financial crisis andglobal economic slowdown We return to these implications in the conclusion
One development of note at the Reserve Bank of India is a policy focus onfinancial inclusion The 2008 report of the Committee on Financial Inclusion has beenfollowed by sections of the Reserve Bank of India Annual Report reserved fordiscussion of financial inclusion And instead of focusing on liberalization and
8132019 Government Banking and BRICs in the Recent Financial Crisis
httpslidepdfcomreaderfullgovernment-banking-and-brics-in-the-recent-financial-crisis 4357
983106983122983113983107 983111983151983158983141983154983150983149983141983150983156 983106983137983150983147983155 983137983150983140 983110983145983150983137983150983139983145983137983148 983123983156983137983156983141983139983154983137983142983156
43
privatization to ensure the spread of banking products and services alternative policieshave been explored One is of special note The Committee on Financial Inclusionrecommended issue of identity cards as bank cards This would profoundly change thelandscape of banking in India and has attracted attention from analysts at the CentralBank of Brazil charged with financial inclusion as well as the President of Indonesia
and apparently Uganda officials Given the revolution in information and card paymenttechnologies this policy proposal and pilot studies deserve close attention asalternatives to dramatically increase the pace of social inclusion of the bankless
8132019 Government Banking and BRICs in the Recent Financial Crisis
httpslidepdfcomreaderfullgovernment-banking-and-brics-in-the-recent-financial-crisis 4457
983106983122983113983107 983111983151983158983141983154983150983149983141983150983156 983106983137983150983147983155 983137983150983140 983110983145983150983137983150983139983145983137983148 983123983156983137983156983141983139983154983137983142983156
44
China
This section turns to a brief review of the Chinese banking sector to further explore therole of government banks in terms of their modernization competitive advantages
policy roles and capacity for counter cyclical credit that help explain why BRICcountries were able to avert the severe consequences of the global financial crisis
First figure A11 reports the basic structure of the banking system in China
Although we have been unable to compare the evolution of types of banks acrosstime in similar ways to the above data on India taken from the Reserve Bank of Indiaour research assistants have gathered the following comparative macroeconomicfinancial and balance sheet data on banking in China The data appear to be consistentwith the core argument presented in this paper ndash that government banks havemodernized since liberalization and provided policy makers with alternative means tocounter the effects of financial crisis abroad
8132019 Government Banking and BRICs in the Recent Financial Crisis
httpslidepdfcomreaderfullgovernment-banking-and-brics-in-the-recent-financial-crisis 4557
983106983122983113983107 983111983151983158983141983154983150983149983141983150983156 983106983137983150983147983155 983137983150983140 983110983145983150983137983150983139983145983137983148 983123983156983137983156983141983139983154983137983142983156
45
We lack more current information and were unable to collect data directly fromofficial sources in China to compare the trajectory of state owned private and foreignbanks As a substitute Figure 1 reports data from 2000-4 that permits initial observationof trends for this earlier period
Those present may not need reminding of the formidable record of economicgrowth in China during this 200-4 period that continues until today However data fromthe National Bureau of Statistics suggests that the Chinese banking system expanded atan even greater pace than the remarkable levels of GDP growth recorded for the 2000-4period Furthermore credit expansion was ldquoorganicrdquo in the sense that deposits
outpaced credit growth from 2000-4
Expansion of Loans in China 1999-2004
Loan Growth Total LoansYear on Year
Growth Total Depositssup1Year on Year
GrowthYear CNY billion CNY () CNY billion CNY()1999 9373 83 10878 1372000 9937 60 1238 1382001 11231 130 14362 1602002 13129 169 17092 1902003 159 211 20806 217
2004 18857 186 25319 217
sup1Based on preliminary estimates by the National Bureau of Statistics of the Peoplersquos Republic of ChinaSource National Bureau of Statistics of the PRC
Although we lack data comparable to that from the Reserve Bank of India ableto compare the trajectory of state private and foreign banks in China the sectoralbreakdown of loans and other banking and national account data confirms the profoundcapitalization of the Chinese banking system and GDP growth during from 1995-2004
8132019 Government Banking and BRICs in the Recent Financial Crisis
httpslidepdfcomreaderfullgovernment-banking-and-brics-in-the-recent-financial-crisis 4657
983106983122983113983107 983111983151983158983141983154983150983149983141983150983156 983106983137983150983147983155 983137983150983140 983110983145983150983137983150983139983145983137983148 983123983156983137983156983141983139983154983137983142983156
46
China Banking Sector Market Dimensions (1995 - 2004)
YearTotal
LoansCorp
LoansConsuLoans
HomeLoans
TotalDeposits Excess
GovBonds
CorpBonds GDP
GDPGrowth
()1995 52310 mdash mdash mdash 5376 145 330 65 5848 2511996 63100 mdash mdash mdash 6847 538 436 60 6788 1611997 73585 7341 17 130 8212 853 551 52 7446 971998 85002 8447 53 430 9529 102 9 777 68 7835 521999 95587 9394 164 1360 10831 1273 1054 78 8207 482000 108763 10453 424 3320 13486 261 1302 86 894 892001 118990 112 699 5600 15472 3573 1562 101 9593 732002 139800 12913 1067 8258 18339 4359 mdash mdash 10479 922003 169770 15401 1576 13302 22036 5059 mdash mdash 11669 1142004 194220 16848 1988 15800 25319 5897 mdash mdash 13657 170Figures = CNYB
This data reported in terms of percent GDP provides further clarity on the rapid
capitalization of loans It is of note that the bulk of loans during this period were to thecorporate sector with consumer and home loans lagging significantly
China Banking Sector Percent GDP
YEARTotal
LoansCorporate
LoansConsumer
LoansHomeLoans Deposits
ExcessDeposits
GovBonds
CorpBonds
1995 895 00 00 00 919 25 56 111996 929 00 00 00 1009 79 64 091997 988 986 02 02 1103 115 74 071998 1085 1078 07 05 1216 131 99 091999 1165 1145 20 17 1320 155 128 092000 1217 1169 47 37 1508 292 146 102001 1240 1167 73 58 1613 372 163 112002 1334 1232 102 79 1750 4162003 1455 1320 135 114 1888 4342004 1422 1234 146 116 1854 432
Sources China Banking Regulatory Commission Peoplersquos Bank of China and GoldmanSachs research estimates
Compilation of financial data from a select number of banks in China suggeststhat the pattern of bank change encountered in Brazil and India also describes theexperience of China The liberalization of the Chinese economy and the modernization
of state banks appear to describe the process of bank change instead of a process oftransition toward private banking and capital market centered financial systemAlthough we have been unable to draw data from Chinese monetary authorities thebalance sheet data suggests the clear predominance of large state banks in the politicaleconomy of banking and finance in China How these institutions were used to counterthe effects of financial crisis abroad and redirect domestic investment production andconsumption must remain a subject for further research
8132019 Government Banking and BRICs in the Recent Financial Crisis
httpslidepdfcomreaderfullgovernment-banking-and-brics-in-the-recent-financial-crisis 4757
983106983122983113983107 983111983151983158983141983154983150983149983141983150983156 983106983137983150983147983155 983137983150983140 983110983145983150983137983150983139983145983137983148 983123983156983137983156983141983139983154983137983142983156
47
Select Financial Data from Chinese Banks 2004()
CNY (billion)Total
AssetsGrossLoans
CustomerDeposits Equity
NPLRatio
()
Pre-prov
ProfitsNet
Profits
State Banks
ICBC 5671 3705 5105 163 190 653 23CCB 3905 2226 3489 195 39 605 484ABC (NA) mdashBOC 427 2146 3342 205 51 578 209Quasi-State
BoCom 1145 639 1023 54 30 131 16CMB 587 376 513 22 29 82 32CITIC Industrial 515 306 429 20 60 52 03SPDB 456 311 397 14 24 62 20China Everbright mdashGuangdong Development 345 216 301 mdash mdash mdash 32
Industrial Bank 341 203 283 10 25 37 11Quase-Private
Bank of Shanghai 216 106 179 83 51 32 26Hua Xia 304 181 270 92 40 29 10Shenzhen Development 198 126 166 43 114 28 03Bank of Beijing 209 85 174 71 mdash 26 07
Sector total 19422 25319 129Three state-banks 2692 3979 188Second tier banks 2549 3733 148
ABC = Agriculture Bank of China BOC = Bank of China
BOCOM = Bank of Communications CCB = China Construction BankCMB = China Merchantrsquos Bank CNY = yuanICBC = Industrial and Commercial Bank of ChinaNPL = nonperforming loanROA = return on assets ROE = return on equityprov = provisioningPRC = Peoplersquos Republic of ChinaSPDB = Shanghai Pudong Development BankNote Loan and deposit market share for BOC and ICBC are for their domestic operations onlySources Company data Goldman Sachs research estimates
Returns on Assets Equity and Domestic Market Shares of Major China Banks 2004()
CNY (billion) ROA () ROE ()Deposit Mkt
Share ()Loan MktShare ()
Mortgage MktShare()
State Banks
ICBC 004 14 199 187 253CCB 130 254 138 115 217ABC (NA)BOC 051 102 101 89 152Quasi-State
BoCom 015 45 37 29 34CMB 060 161 20 19 29
CITIC Industrial 007 17 17 16 18SPDB 048 153 16 16 26
8132019 Government Banking and BRICs in the Recent Financial Crisis
httpslidepdfcomreaderfullgovernment-banking-and-brics-in-the-recent-financial-crisis 4857
983106983122983113983107 983111983151983158983141983154983150983149983141983150983156 983106983137983150983147983155 983137983150983140 983110983145983150983137983150983139983145983137983148 983123983156983137983156983141983139983154983137983142983156
48
China EverbrightGuangdong Development mdash mdash 12 11 mdashIndustrial Bank 037 126 11 10 10Quase-Private
Bank of Shanghai 129 360 07 05 14Hua Xia 038 116 11 09 07Shenzhen Development 017 75 07 06 08Bank of Beijing 037 108 07 04 07
Sector totalThree state-banks 438 391 622Second tier banks 144 127 154
ABC = Agriculture Bank of China BOC = Bank of China BOCOM = Bank of Communications CCB =China Construction Bank CMB = China Merchantrsquos Bank CNY = yuanICBC = Industrial and Commercial Bank of China mkt = market NPL = nonperforming loan ROA =return on asset ROE = return on equity prov = provisioning PRC =Peoplersquos Republic of China SPDB = Shanghai Pudong Development BankNote Loan and deposit market share for BOC and ICBC are for their domestic operations onlySources Company data Goldman Sachs research estimates
Further data from 2006-10 from the Peoples Bank of China suggests that the big5 state banks continue to outperform the next 12 largest joint stock commercial banksThe big five have launched sales of shares to capitalize while listing on capital marketsand adopting reporting of financial data along lines of international standards Thisappears to be similar to Banco do Brasil policies that retain majority of shares in federalgovernment control while capitalizing the bank through issues of stock
Comparing the Performance of Big 5 State Banks and Next 12 Joint Stock CommercialBanks in China
2006 2007 2008 2009 2010
Profit Margin Big 5 State Banks 3116 3143 2586 3026 3269
Next 12 JS Commercial Banks 2050 2791 1796 2159 2365
Returns Big 5 State Banks 507 606 860 691 675(risk adj) Next 12 JS Commercial Banks 459 570 1016 714 723
Op Risk Big 5 State Banks 5548 5539 5215 5319 5322Next 12 JS Commercial Banks 5886 5721 5725 5831 5947
Leverage Big 5 State Banks 1626 1482 1724 173 1734Next 12 JS Commercial Banks 2826 2251 2064 2048 1936
ROE Big 5 State Banks 1424 1557 1999 1925 2037Next 12 JS Commercial Banks 1564 2049 2156 1840 1967
Big 4 and 11 JSCBsSource Peoples Bank of China China Financial Stability Reports 2007-11
Performance indicators reported by the Peoples Bank of China for the big 5 statebanks and 12 next largest joint stock commercial banks also suggest that the largestgovernment banks in China retain significant competitive advantages ndash and may providepolicy alternatives Given the current shift of economic policy in China away fromindustry and export led growth to more sustainable domestic oriented growth and socialinclusion the role of state banks clearly comes to the fore
8132019 Government Banking and BRICs in the Recent Financial Crisis
httpslidepdfcomreaderfullgovernment-banking-and-brics-in-the-recent-financial-crisis 4957
983106983122983113983107 983111983151983158983141983154983150983149983141983150983156 983106983137983150983147983155 983137983150983140 983110983145983150983137983150983139983145983137983148 983123983156983137983156983141983139983154983137983142983156
49
Net Operating Income of Big 5 State Banks and Next 12 CommercialBanks 100 million RMB YuanBig 5 State Banks 2006 2007 2008 2009 2010
Balance Net interest income 349703 500456 556790 532206 720152Net fee amp commission inc 48524 103817 138464 175469 232491
Investment income 216089 283725 338865 324037 340440
Other business income (1807) (17054) 47548 33791 2186
Net operating income 612509 870944 1081667 1065503 1314943
Percent Net interest income 5709 5746 5148 4995 5477
Net fee amp commission inc 792 1192 1280 1646 1768
Investment income 3528 3258 3133 3041 2589
Other business income (030) (196) 440 318 166
Net operating income 10000 10000 10000 100 100
Next 12 Joint Stock CommercialBanks 2006 2007 2008 2009 2010
Net interest income 87253 132945 198965 191276 281588
Net fee amp commission inc 7850 16247 27319 30115 42023
Investment income 20959 32172 44864 50767 50500
Other business income 2306 4498 16359 10384 7400
Net operating income 118468 185861 287507 282542 381511
Percent Net interest income 7365 7153 6920 6769 7381
Net fee amp commission inc 671 874 950 1066 1101
Investment income 1769 1731 1560 1797 1324
Other business income 195 242 569 368 194Net operating income 10000 10000 10000 10000 10000
Source Peoples Bank of China China Financial Stability Reports 2007-11
Big 4 and 11 JSCBsBig 5 = ICBC ABC BOC CCB BOCOMNext 12 Joint Stock Commercial Banks = China CITIC Bank Everbright Bank Huaxia BankGuangdong Development Bank Shenzhen Development Bank China Merchants Bank Shanghai PudongDevelopment Bank Industrial Bank China Minsheng Banking Corporation Evergrowing Bank ChinaZheshang Bank Bohai Bank
In conclusion bank change in China also appears to confirm our findings from
Brazil ndash that state banks have realized competitive advantages and increased marketshares since liberalization while providing counter cyclical credit to ameliorateadjustment to crisis The modernization of the China Postal Savings Bank is ofparticular interest given its social mission downmarket focus and 40000 branchOffices throughout the country Expansion of card payment services through the postalbank system confirms the importance of the Brazilian federal savings bank (CaixaEconocircmica Federal Caixa) as agent for federal government social policy and agentresponsible for management of citizenship cards (12 million) and payment of familygrants This back to the future modernization of savings banks has proved essential forovercoming notorious levels of social exclusion and inequality in Brazil Althoughenglish language materials are unavailable on the China Postal Savings Bank thisinstitution clearly presents profound opportunities for comparable policies in China
8132019 Government Banking and BRICs in the Recent Financial Crisis
httpslidepdfcomreaderfullgovernment-banking-and-brics-in-the-recent-financial-crisis 5057
983106983122983113983107 983111983151983158983141983154983150983149983141983150983156 983106983137983150983147983155 983137983150983140 983110983145983150983137983150983139983145983137983148 983123983156983137983156983141983139983154983137983142983156
50
Reported offer of microfinance services for poverty reduction as part of nationaleconomic stimulous plan may point to developments in this direction
Given that state planning capacity has long been at the center of attention intheories of financial statecraft the role of Chinese state banks in redirecting policiesaccording to the 12th 5 Year plan for 2011-15 seems critical From 2000-5 the 10th 5
Year plan emphasized infrastructure and the attraction of investment and labor skillsThe 11th 5 Year plan (2006-10) raised concerns about sustainability rather than growthlevels while also seeking to spread improvements to balance development better servepeople and improve the quality of life continue to support Center and West provincesand revitalize Northeast provinces In comparison the 12th 5 Year plan calls for morebalanced lsquoinclusiversquo growth and structural adjustemts more than 4 trillion RMB($US600 billion) for targeted industries and interior regions a focus on new energynew materials and information and high technologies biology and new medicineenergy converstaion and environmental protection aerospace marine and advancedmanufacturing This implies fundamental shifts away from industry to services that hasbeen reported in macroeconomic data for 2010 If past studies emphasized directed
credit and industrial change the role of Chinese state banks in realizing transformationscertainly warrants study
Although the domestic flow of funds process of liberalization (or the lackthereof) and insertion of banking into Chinese political economy is beyond the scope ofthis paper our findings from Brazil appear to provide valuable hypotheses about ChinaThat is to say the big state banks and other government banks in China remaincommanding heights not in the Marxist sense of providing means to reach socialismbut immense institutions with profound presence throughout politics and markets in thecountry In this sense our findings from Brazil appear to approximate patterns ofchange in China more than Washington Consensus expectations about liberalization andprivatizations to free private and foreign banks Financial statecraft draws attention tothe capitalization of Chinese state banks through stock Sales and listings on capitalmarkets However like the Banco do Brasil (that reformers in the 1990s sought to shiftcontrol to the private sector only to increase federal government shareholding) theChinese experience surely involves unexpected consequences and patterns of changedifferent than a linear transition to the Berle amp Means paradigm of corporategovernance
Russia The New State Duopoly
ldquoThe rush of 2003-8 increased the market share of foreign banks to 285 from
52 However the state-owned banks received enormous help from the federal budget in the days of the crisis thereby strengthening their dominant
position on the Russian financial market says Sergey Aleksashenko the formerDeputy chairman of Russias Central Bank quotes Russia Profile Today one
must not harbor any illusion of a fair competition with them all the main cash
flows in Russia are controlled by state-owned banks httpwwwbarentsnovacomnode1031
Description of banking policy in Russia during the global financial crisis can beobtained from Bank of Russia annual reports and related publications The figure on the
following page summarizes the financial flows to and from the Bank of RussiaAlthough central bank policy is beyond the scope of this study the role of state banks in
8132019 Government Banking and BRICs in the Recent Financial Crisis
httpslidepdfcomreaderfullgovernment-banking-and-brics-in-the-recent-financial-crisis 5157
983106983122983113983107 983111983151983158983141983154983150983149983141983150983156 983106983137983150983147983155 983137983150983140 983110983145983150983137983150983139983145983137983148 983123983156983137983156983141983139983154983137983142983156
51
channeling counter-cyclical credits released by the Bank of Russia appear to confirm thecore argument that emerges from our studies of the Brazilian banking system Furtherdata on the following pages also suggest that state banks in Russia performed wellduring 2008-10 confirming on the basis of sparse data taken from Bank of Russiareports and documents that public banks have modernized provided counter-cyclical
credit to reverse credit crunch and economic downturn while realizing competitiveadvantages over private and foreign banks
8132019 Government Banking and BRICs in the Recent Financial Crisis
httpslidepdfcomreaderfullgovernment-banking-and-brics-in-the-recent-financial-crisis 5257
983106983122983113983107 983111983151983158983141983154983150983149983141983150983156 983106983137983150983147983155 983137983150983140 983110983145983150983137983150983139983145983137983148 983123983156983137983156983141983139983154983137983142983156
52
The following aggregate figures reported by the Bank of Russia suggest severaltrends of significance First Chart 32 suggests that household deposits shifted fromRuble deposits to foreign currency pegged (or indexed) during 2008 Second Chart 33illustrates the substantial increase of non-bank overdue debt during second semester
2008
Consequently the financial results and profitability of banks declinedsignificantly during 2008 The greater confidence in deposits with government banksfound abroad suggests that this may have been critical in Russia
Performance data deom 2008-10 provides a clearer picture one that is consistentwith our findings in Brazil State banks appear to have outperformed all other types of
banks except medium and small regional banks The following table reports the averagereturns on assets and returns on equity reported by the Bank of Russia 2008-10
Returns on Assets and Equity by Type of Bank in Russia 2008-9
Return on assets Return on equity 2008 2009 2010 2008 2009 2010
-------------------------------------------------------------------------------------------------------------------State Banks 22 08 24 157 46 148Foreign Banks 18 11 21 146 83 145Large private banks 13 03 11 106 28 84Medium-Small Banks Moscow 15 12 14 68 52 67
Medium-Small Regional Banks 21 12 15 131 65 98--------------------------------------------------------------------------------------------------------------------Source Bank of Russia Bank Supervision Reports 2009 and 2010
8132019 Government Banking and BRICs in the Recent Financial Crisis
httpslidepdfcomreaderfullgovernment-banking-and-brics-in-the-recent-financial-crisis 5357
983106983122983113983107 983111983151983158983141983154983150983149983141983150983156 983106983137983150983147983155 983137983150983140 983110983145983150983137983150983139983145983137983148 983123983156983137983156983141983139983154983137983142983156
53
Further data from the Bank of Russia on the capital adequacy of Banks during2009-10 suggest that foreign banks and large private banks remain less capitalizedagainst risks according to Basel II guidelines albeit at levels almost double thatrecommended by the Bank for International Settlements (80 risk weighted) Although
further analysis is needed this data is consistent from that reported in Brazil thatgovernment banks tend to more cautious and more prudent in terms of placing asidehigher levels of reserves and patrimony against possible losses
Capital Adequacy of Banks by Type of Bank in Russia 2009-10
2009 2010 2011---------------------------------------------------------------------------------------------------------State Banks 184 227 186Foreign Banks 155 196 195Large Private Banks 140 181 155
Medium-Small Banks Moscow 316 312 268Medium-Small Regional Banks 219 241 207Non-Bank Credit Institutions 372 1038 678---------------------------------------------------------------------------------------------------------Source Bank of Russia Bank Supervision Report (Moscow) 2009 p 43
Finally Bank of Russia bank supervision reports also suggest that state banksexpanded their market shares of assets and capital during the years following the globalfinancial crisis While large private banks and foreign banks lost market share of bankassets and bank capital in Russia state banks increased their significant market sharefrom 405 ndash 426 percent and 471-476 percent of assets and capital respectivelyUnfortunately data from previous years and for specific banking groups was notobtained However this data does appear to indicate that our findings of competitiveadvantages and policy alternatives
Number and Market Share by Type of Bank
N Banks Assets Capital---------------------------- ---------------------------- ----------------------------
Type of Bank 2009 2010 2011 2009 2010 2011 2009 2010 2011-------------------------------------------------------------------------------------------------------------------------------State 17 22 27 405 439 458 471 489 473
Foreign 101 106 108 187 183 180 172 169 191Large Private 136 139 131 346 333 305 276 287 269Med-Small Moscow 361 335 317 27 26 26 43 34 35Medi-Small Regional 443 412 372 28 28 27 36 31 29Other Credit Institutions 50 51 57 07 04 04 01 02 03Total 1108 1058 100 100 100 100 100 100-------------------------------------------------------------------------------------------------------------------------------Source Bank of Russia Bank Supervision Report 2009 amp 2010
In sum politics and financial statecraft have led to the realization of significantcompetitive advantage by Russian state banks Sperbank and Vneshtorgbank increasedtheir share of bank assets from 32 percent in 2005 to over 50 percent by 2011 through
mergers and acquisitions and aggressive displacement of foreign banks Whatever thepolitics data from the Bank of Russia suggests that monetary authorities released a
8132019 Government Banking and BRICs in the Recent Financial Crisis
httpslidepdfcomreaderfullgovernment-banking-and-brics-in-the-recent-financial-crisis 5457
983106983122983113983107 983111983151983158983141983154983150983149983141983150983156 983106983137983150983147983155 983137983150983140 983110983145983150983137983150983139983145983137983148 983123983156983137983156983141983139983154983137983142983156
54
series of counter cyclical credit injections during 2008-9 to domestic bankinginstitutions Moreover data suggests that state banks continue to perform at or ahead oflevels reported by regional private and foreign banks The large market share andimproved performance of state banks reported in recent data suggests although the datais sparse that government banks in Russia have also modernized realized competitive
advantages and provided policy alternatives against the impact of financial crisisabroadWe were unable to find evidence of policy making toward social inclusion at the
Bank of Russia or Russian state banks despite the historical trajectory of the Sberbankas a savings bank under communism The context also appears to differ considerably Asurvey of the Zircon Research Group reportedly found that only 15 percent of Russiansretain bank accounts because of mistrust in banks and government This combination ofrealist politics and the realization of competitive advantages by Russian state bankssuggests that theories of economic statecraft in the realist tradition may indeed explainthe domestic developments under study
Conclusion
This paper reports evidence about government bank modernization and financialstatecraft in BRIC countries designed to counter the effects of crisis and shape domesticgrowth Government banks in BRIC countries have contributed to the widely notedadjustment of these economies to global financial crisis and economic downturnContrary to the Washington Consensus that prevailed during much of the 1980s and1990s (that privatization and liberalization especially of banking would free marketforces and deepen domestic financial systems) a quite different process of bank changeappears to have ensued after financial liberalization in the BRICs
Instead of replacement of state banks with private banks government banksremain central agents of domestic credit and growth and have modernized ldquojust intimerdquo The capitalization and realization of competitive advantages by large governmentbanks during the 2000s meant that once the US financial panic spread across capitalmarkets broke highly leveraged private and produced runs on private bank depositspolicy makers in BRIC countries nonetheless retained counter cyclical policyalternatives through their more solid large state banks
These findings counter traditional foci on the private sector individualentrepreneurship and ideals of free markets linked to the political and social advancesrecorded around the world in the last decades We report an anomaly for theories offinancial repression and the Washington Consensus about the virtues of privatization
and liberalization Although largely blamed for reproducing underdevelopment in thepast BRIC government banks averted excesses of private banking that drove creditbubbles such as home mortgages and derivatives in the US And since liberalization ofbanking (we have not adequately discussed how much liberalization occurred in eachcountry) government banks have modernized to compete with private and foreignbanks Government banks have realized competitive advantages and provided policyalternatives These two arguments help explain why BRIC countries have farecomparatively well in the face of financial crisis in core countries
Financial statecraft is therefore at the center of BRIC counter cyclical capacitiesand state planning Brazil Russia India and China fared significantly better thanadvanced and many developing countries in terms of adjusting to credit crunches and
export shocks This is because government banks proved critical interbank credit toretain confidence in domestic banking systems These institutions also presented other
8132019 Government Banking and BRICs in the Recent Financial Crisis
httpslidepdfcomreaderfullgovernment-banking-and-brics-in-the-recent-financial-crisis 5557
983106983122983113983107 983111983151983158983141983154983150983149983141983150983156 983106983137983150983147983155 983137983150983140 983110983145983150983137983150983139983145983137983148 983123983156983137983156983141983139983154983137983142983156
55
policy alternatives for political and social forces Politics shaped adjustment andrecovery through state banks differently in BRIC countries Given the realities of statecentered political realism in Russia the redirection of state banks toward goals ofChinese Five Year Plans and the modernization of the State Bank of India amidst anamorphous federalism the experience of Brazil with democratization and public bank
modernization may stand out (Armijo 2009)Further analysis of savings banks and cooperative banks also will be requiredAs members of the World Savings Bank Institute (a global association of savingsbanks) the Caixa in Brazil SNI and NABARD in India and China Postal Savings Bankappear to have provided access to very large numbers of previously unbanked citizensThis returns to traditional ideas of social banking and the history of savings banks thatwere founded throughout Europe since the late 18 th century The upmarket strategy andexpansion into investment banking and international banking of the Russian Sberbankconstrasts with downmarket strategies of savings banks in Brazil India and China
The financial press has recently reported doubts about bad loans in Chinese statebanks and cast doubt on the financial results posted and reported in this paper
However current estimates of 2-5 percent bad loans in Chinese state banks pale incomparison to the US$1240 billion in bad loans shifted to asset managementcompanies in the mid 2000s before capitalization of these institutions through sale ofshares Critics of state banking in Brazil also point to past levels of bad loans (reaching30-40 percent) because of their capture during military government delayed transitionBut the cost of capitalization and transfer of bad loans from Brazilian state banks alsoremained below US$400 billion and is still contingent on liquidation of assetmanagement companies created in 2001 In any case these numbers are very smallcompared to GAO estimates of US$120 trillion in emergency infusions by USmonetary authorities to banks and financial institutions from 2007-11
These are anomalies for recent market-based banking theory and neo-liberalpolicy designs However they do not run counter to orthodoxy in economics andbanking theory Over the last decades economic reforms (fiscal financial monetaryand banking) have improved transparency and brought public policy and marketexpectations closer However expectations about deregulation and free marketequilibria in banking and finance have succumbed in the face of panic and the stillsobering consequences of crisis The materials presented herein are descriptive and willrequire more careful analysis However given the urgency of searching for alternativedevelopment models and different approaches to financial statecraft in BRIC countriesand beyond we have taken the liberty to present research in initial stages and toprovoke thought along the lines suggested by our kind conveners
8132019 Government Banking and BRICs in the Recent Financial Crisis
httpslidepdfcomreaderfullgovernment-banking-and-brics-in-the-recent-financial-crisis 5657
983106983122983113983107 983111983151983158983141983154983150983149983141983150983156 983106983137983150983147983155 983137983150983140 983110983145983150983137983150983139983145983137983148 983123983156983137983156983141983139983154983137983142983156
56
Appendix on Alternative Banking and Social Inclusion
This appendix describes how ideas about government banking led to further work onalternative banking and social inclusion with help from the Rockefeller FoundationBellagio Center In July 2011 we were able to convene a conference designed to gather
scholars alternative banking executives and representatives from savings andcooperative bank associations to rethink strategies for social inclusion in the globalsouth and attempt to launch a new policy agenda Given the search for alternativestrategies to counter crisis and the advances of stabilization transparency and bankingsupervision in developing and emerging economies we call for alternative bankingcommunities in the global north and south to work together and help shape a new policyagenda for social inclusion Because savings banks credit cooperatives and otheralternative banking and finance institutions have realized competitive advantages andemerged from crisis we can now think beyond We believe that new policies may helpdeveloping and emerging nations redirect large domestic institutions such as postal andsavings banks toward meeting the UN millennium goals to eliminate poverty by 2015
Plans include writing a green paper on Core Principles for Alternative Bankingand Social Inclusion convening events to promote these principles through institutionalsupporters and networks and seeking adoption of these principles at policy venues suchas the World Savings Bank Institute the International Association of CooperativeBanks the Bank for International Settlements the International Financial ReportingStandards foundation the ISO International Standards Organization the Charter forResponsible Business regional development banks and the World Bank We also planto submit an edited volume of scholarly contributions on alternative banking and socialinclusion by year-end 2012 Interested parties are welcome to participate
Institutional supporters and networks include
Institutional SupportersColumbia University School of International and Public Affairs New YorkInstitute for Money Technology and Financial Inclusion University of CaliforniaIrvineKingacutes College Department of Management LondonSatildeo Paulo Business School Getulio Vargas FoundationSecond University of Naples
Networks
Association of Emerging Market Business Schools Satildeo Paulo BrazilCommunity of European Management Schools BrusselsCritical Political Economy NetworkEuropean Association of Co-operative Banks BrusselsGlobal Public Policy Network LondonInternational Cooperative Banking Association BrusselsSocial Science Finance Network AmsterdamSociety for Advancement of Social Economics PhiladelphiaWorld Savings Bank Institute Brussels
8132019 Government Banking and BRICs in the Recent Financial Crisis
httpslidepdfcomreaderfullgovernment-banking-and-brics-in-the-recent-financial-crisis 5757
983106983122983113983107 983111983151983158983141983154983150983149983141983150983156 983106983137983150983147983155 983137983150983140 983110983145983150983137983150983139983145983137983148 983123983156983137983156983141983139983154983137983142983156
Core Principles for Alternative Banking and Social Inclusion
Commitment to End Capital StarvationPromote access to and use of banking and financial services by all through newtechnologies and distribution channels to capitalize assets among the poor
Commitment to Universalize Income Savings Credit and FinanceProvide basic income via ATM cards and mobile banking to reach the poor and opennew channels of access to income savings credit finance insurance and opportunities
Prudent Banking and Regulatory ComplianceAlternative banking seeks to work within regulations guidelines and best practicesrecommended by domestic monetary authorities and international regulatory institutionssuch as the Bank for International Settlement Basel II Capital Risk Guidelines
Corporate Social Responsibility Leadership
Integrate corporate social responsibility into down-market business strategies andinstitutions of representation and democratization
Transparency and AccountabilityPublish annual reports and balance sheets in accord with international best practices offinancial social and sustainability reporting
Leadership in Provision of New Banking Services and Products to the PoorUse competitive advantages in banking and institutional networks to channel moreeffectively capital income and finance to the poor
Generate Sustainable Income and Household Asset AccumulationUse branch offices and new banking technologies to accelerate progress toward UNmillennium goals to eliminate poverty
Universalize Financial EducationPromote financial education to encourage responsible banking and finance and avertpredatory lending and unethical practices
Adopt Cutting Edge Technology and Management Practices to Provide
Competitive Alternative to Private Commercial and Investment Banks
Incorporate electronic card and mobile banking services to better serve the poorContribute to Realization of Bellagio Principles for SustainabilityPromote alternative banking and business practices that contribute to environmentallysustainable income consumption and production as stated in Bellagio Principles forSustainability
Respect and Build on National and Regional DifferencesI d f i l d l l i b ki i i i d i i l
8132019 Government Banking and BRICs in the Recent Financial Crisis
httpslidepdfcomreaderfullgovernment-banking-and-brics-in-the-recent-financial-crisis 957
983106983122983113983107 983111983151983158983141983154983150983149983141983150983156 983106983137983150983147983155 983137983150983140 983110983145983150983137983150983139983145983137983148 983123983156983137983156983141983139983154983137983142983156
9
but should not conceal the counter intuitive modernization of government banksalongside (and often ahead) of private and foreign banks
A third explanation draws from the institutional complementarity hypothesis toargue that different policies in BRICS captured particular complementarities in bankingand finance to avert more severe impacts on economic activity This is a promising
approach but one that exceeds our ability to retrace the domestic policies amidst crisisacross four major countriesA fourth explanation is taken from the World Capitalist System approach and
focuses on the profound structural changes implied by recent growth and betteradjustment in BRIC countries This perspective also provides significant opportunitiesfor reflection and interpretation that must remain beyond the scope of this paper Theemergence of BRIC nations as driving force in the global economy is a fundamentallynew situation for theories of center-periphery north-south dependent development andtheories that focus on the specific trajectories of nations in what used to be called latelate development
A final explanation of why BRIC countries have fared comparatively better in
the face of global financial crisis is scale The very large size of these economiesprovided policy options unavailable to smaller countries From this perspective closedeconomies are less subject to the impacts of sudden stops in foreign finance during andafter the financial crisis and less exposed to export declines during global downturnsMoreover large closed BRIC economies retain options of turning away from exportstoward domestic investment and consumption a characteristic especially importantgiven atrocious income distribution and social exclusion This dimension also remainsbeyond the scope of this paper on public banking and domestic financial statecraft
Unless we are mistaken these explanations are complementary to our core claimsthat government banks made a difference in terms of avoiding the creation of asset bubblesrealizing competitive advantages over private and foreign banks since liberalization andproviding counter cyclical policy alternatives to ameliorate downturn Case studies of theBRICs follow
Brazil
We begin with Brazil Our research on Brazil suggests that since price stability the return todemocracy and liberalization of the banking system in 1995 federal banks have realizedcompetitive advantage over private and foreign banks while providing policy alternatives topolitical and social forces This article extends this argument to suggest that these institutionshave modernized amidst liberalization and globalization across BRIC countries ldquojust in timerdquo
to retain client confidence and provide counter-cyclical credit to avert domestic downturns inthe face of global crisis
8132019 Government Banking and BRICs in the Recent Financial Crisis
httpslidepdfcomreaderfullgovernment-banking-and-brics-in-the-recent-financial-crisis 1057
983106983122983113983107 983111983151983158983141983154983150983149983141983150983156 983106983137983150983147983155 983137983150983140 983110983145983150983137983150983139983145983137983148 983123983156983137983156983141983139983154983137983142983156
10
The market shares of government banks private banks and foreign banks in domesticBrazilian credit from 1988-2009 are reported in Figure 1 First the trajectories of credit fromgovernment private and foreign banks suggests that state presence in banking declined during the 1990s through privatization of state government banks However sincecapitalization and reform in 2001 government banks increased market share substantiallyconsistent with our argument that they have modernized to compete alongside private andforeign banks Further comparison of government private and foreign bank policies suggestthat government banks 1) provide more loans per capita 2) provide more counter-cyclicalcredit to help firms and households through economic downturns and 3) hold treasury bonds
for the term rather than trading or unloading a difference that helps reduce market pressuresto shorten the term and increase the cost of government debt
Bank Returns in Brazil and Select Latin American and Reference Countries 2003-20072003 2004 2005 2006 2007
------------------------------------------------------------------------------------------Brazil Government 235 215 265 337
Private 160 262 259 273Foreign 101 61 166 106Bank System 158 176 212 206 224
Argentina -227 -42 70 143 97Chile 167 167 179 186 162
Mexico 161 172 244 262 202Australia 242 228 253 270 281Canada 147 167 149 209 125Spain 132 141 169 199South Africa 116 162 152 183 184---------------------------------------------------------------------------------------------Excludes credits under guarantee Source Bankscope cited in Central Bank of Brazil Financial Stability
Report November 2008 p 56 and Central Bank of Brazil Financial Stability Reports 2004-7
The above table also suggests that government banks have also systematicallyoutperformed private and foreign banks operating in Brazil since capitalization of theseinstitutions to meet Basel II Capital Risk guidelines of the Bank for International Settlements
in 2001 This is an anomaly for theories of private bank efficiency and expectations of liberalreforms in the 1990s Moreover counter-cylical lending exposes government banks to late
983088
983093
983089983088
983089983093
983090983088
983090983093
983091983088
983089 983097 983096 983096
983089 983097 983096 983097
983089 983097 983097 983088
983089 983097 983097 983089
983089 983097 983097 983090
983089 983097 983097 983091
983089 983097 983097 983092
983089 983097 983097 983093
983089 983097 983097 983094
983089 983097 983097 983095
983089 983097 983097 983096
983089 983097 983097 983097
983090 983088 983088 983088
983090 983088 983088 983089
983090 983088 983088 983090
983090 983088 983088 983091
983090 983088 983088 983092
983090 983088 983088 983093
983090 983088 983088 983094
983090 983088 983088 983095
983090 983088 983088 983096
983090 983088 983088 983097
983077
983129983141983137983154
Figure 1 Government Private and Foreign Bank Lending as percent
of Brazilian GDP 1988-2009
983120983154983145983158983137983156983141
983111983151983158983141983154983150983149983141983150983156
983110983151983154983141983145983143983150
8132019 Government Banking and BRICs in the Recent Financial Crisis
httpslidepdfcomreaderfullgovernment-banking-and-brics-in-the-recent-financial-crisis 1157
983106983122983113983107 983111983151983158983141983154983150983149983141983150983156 983106983137983150983147983155 983137983150983140 983110983145983150983137983150983139983145983137983148 983123983156983137983156983141983139983154983137983142983156
11
and non-payment of loans This reduces profits Strategies to ldquoholdrdquo government securitiesalso reduce profits Nonetheless government banks have reported stronger returns thanforeign and domestic banks on average since capitalization in 2001
The above data may conceal bad banking practices such as crony credit bad loans andcosts that in the end must be passed on to others through fiscal accounts or the money supply
Data from the Central Bank of Brazil help control for these possibilities and provide furthercomparison of bank performance This section compares government private and foreignbanks in terms of the Basel Index bad credit late loans and stress tests that estimate theimpact of hypothetical shocks to bank portfolios from foreign exchange devaluation andorcredit problems
First the Basel Index for government domestic and foreign banks from 2002-2006suggests that government banks remain capitalized well above levels set in Central Bank ofBrazil guidelines (110 set in 1999) The Bank for International Settlements suggests an 80level of capital in reserve against possible losses in lending and finance The average BaselIndex for government banks increased from 167 percent in 2002 to 197 percent in 2006 Incomparison the average Basel Index for private domestic banks increased from 151 pecent
to 170 percent during this period while foreign banks on average reported Basel Indexes of152 in 2002 remaining at 154 in 2006 This suggests that government banks in Brazil retainsufficient capital in reserve against risks arising from bad credit or losses in financialmarkets
Bank System Basel Index in Brazil Select Latin American and Reference Countries
2002 2003 2004 2005 2006---------------------------------------------------------------------------------------------Brazil Government 167 148 165 174 197
Private 151 171 183 177 170Foreign 152 167 187 164 154
Chile 141 136 130 125 120Mexico 144 141 145 163 159Australia 100 104 104 104 103Canada 134 133 129 125 121Spain 126 123 122 119South Africa 124 140 127 123 122
---------------------------------------------------------------------------------------------Source Central Bank of Brazil Financial Stability Report 2002-2006Note Basel Index = recommended minimum eleven percent relation between required net worth and risk-
weighted total assets
A closer look at changing Basel indexes reveal the consequences of counter-cyclicallending from federal government banks Because private domestic and foreign banks adoptedmore cautious strategies and provided less credit during the downturn of 2002 theseinstitutions maintained levels of capital reserves above levels found in government banksThe average Basel index for the domestic financial system thus remained roughly the same atyear-end 2002 (06 percent increase to 162 over June 2002) However this average concealsan increase of 21 percent in the Basel Index for private banks (largely meaning they chose tohold low risk rated government paper) and a decline of 23 percent of the Basel Index forgovernment banks (meaning they incurred risks to lend during downturn and adjustment)Before assuming the worst readers should note two matters First the Central Bank of Brazilrequires banks to maintain a Basel Index of 110 This is three points greater than the 80
8132019 Government Banking and BRICs in the Recent Financial Crisis
httpslidepdfcomreaderfullgovernment-banking-and-brics-in-the-recent-financial-crisis 1257
983106983122983113983107 983111983151983158983141983154983150983149983141983150983156 983106983137983150983147983155 983137983150983140 983110983145983150983137983150983139983145983137983148 983123983156983137983156983141983139983154983137983142983156
12
suggested in the 1988 Basel Accord and subsequent revisions for capital guidelines In otherwords Brazilian banks set aside almost half again more in additional capital reserves thanlevels recommended by the Bank for International Settlements Second the different BaselIndex ratings of government and private banks also reflects the greater weight of credit andtherefore credit risk in these institutions And data on bad and late loans since 2001 suggest
that the slight and temporarily higher levels of average Basel Indexes reported by governmentbanks do not reflect broader deterioration of portfoliosFurthermore Banks in Brazil and especially government banks tend to be more
conservative setting aside not only frac12 of deposits as compulsory reserves at the Central Bankof Brazil but also retaining additional reserves against bad loans and losses Firstcomparative data suggests that Brazilian banks tend to set considerably larger sums aside inreserve against bad loans and other losses Of the four large Latin American countries andfour further economies reported by the IMF and Central Bank of Brazil Brazil retainedsubstantially larger reserves against bad loans than any country except Spain during 2007This confirms the particular characteristics of banking in Brazil that of a higher cost andlower operating efficiency combined with larger reserves and provisions against losses
Bank Reserves as Percent of Overdue amp Late Loans in Brazil Select Latin American andReference Countries
2003 2004 2005 2006 2007 2008---------------------------------------------------------------------------------------------Brazil 3200 3719 2874 2800 2862 2709Argentina 792 1029 1251 1303 1303Chile 1309 1655 1776 1985 2107Mexico 1671 2018 2321 2074 1947Australia 1318 1829 2030 2052 1889Canada 435 477 493 553 449Spain 2454 2196 2518 2733South Africa 542 613 643---------------------------------------------------------------------------------------------Source IMF Global Financial Stability Report 2008 cited in Central Bank of Brazil Financial Stability
Report November 2008 p 56
The level of bad and late loans in bank portfolios is another measure of bank solidityThe convergence of bad credit levels in government private and foreign banks from 1988-2008 introduced this study Further comparison suggests that although government banksretain higher levels of bad and late loans in specific sectors (especially home loans) the value
of late loans as a percent of total loans in government banks fell below levels in private andforeign banks during 2008 (See table on following page) The value of bad credit (loans over12 months past due) in government banks decreased from R$372 billion in 2001 to R$149billion in June 2006 This places the value of bad credit in government banks below the valuefound in private and foreign banks Bad credit in private banks increased from R$173 billionin 2001 to peak at R$255 billion during 2003 declining to R$180 billion in 2006 Foreignbanks also reported increased values of bad credit from R$123 billion in 2001 peaking atR$141 billion in 2003 and declining to R$130 billion in 2006 While late loans remained 85percent of total loans in government banks in 2001 (above 75 percent in private and 65percent in foreign banks) by 2008 the relation reverses In 2008 late loans declined to 32percent of total loans at government banks while remaining at 37 percent in private banksand 45 percent in foreign banks
8132019 Government Banking and BRICs in the Recent Financial Crisis
httpslidepdfcomreaderfullgovernment-banking-and-brics-in-the-recent-financial-crisis 1357
983106983122983113983107 983111983151983158983141983154983150983149983141983150983156 983106983137983150983147983155 983137983150983140 983110983145983150983137983150983139983145983137983148 983123983156983137983156983141983139983154983137983142983156
13
Moreover government banks in Brazil continue to set aside greater provisions againstbad and late loans than private or foreign banks In 2004 government banks retained 86percent of the value of total loans in provision against losses from non-paying loans whileprivate banks retained 60 percent and foreign banks 51 percent In 2008 the level ofprovisions at government banks had declined on average to 68 percent but still remained
well above the levels of 52 and 51 percent recorded at private and foreign banks
Late Loans and Provisions in Government Private and Foreign Banks 2001-2008
Government Banks Private Banks Foreign Banks--------------------------- ----------------------------- -----------------------------R$bi R$bi R$bigt12m Late Provision gt12m Late Provision gt12m Late Provision
----------------------------------------------------------------------------------------------------------------2001 372 85 173 75 123 652002 394 55 202 73 141 60
2003 326 70 255 74 159 662004 133 35 86 160 31 60 102 32 512005 134 39 81 163 35 59 107 35 482006 149 42 68 180 44 66 130 45 532007 35 75 37 55 43 502008 32 68 37 52 45 512009 30 56 612010 20 47 40 66 41 532011 20 43 46 71 50 58----------------------------------------------------------------------------------------------------------------Note Bad credit = loans past due over 12 months Late = percent of total loans gt120 days overdue
Provision = percent of total loan value set aside as reserves against losses Empty cells reflect lack of databecause of changing reporting standards at Central BankSource Central Bank of Brazil Financial Stability Report November 2008 p 56 and 2002-2006
Again in comparative perspective the levels of late loans in Brazilian bankingremains significantly higher than other countries Table 213 reports the value of late loans asa percent of bank portfolios in Brazil select Latin American and further countries forreference This suggests that differences found in Brazilian government banks have to dowith differences in the banking system such as judicial preference for debtors over creditorsrather than the inferior performance of government banks
Late Loans as percent of Total Loans in Brazil Select Latin American and ReferenceCountries
2003 2004 2005 2006 2007----------------------------------------------------------------------------------------------------------------Brazil 39 30 35 37 32Chile 16 12 09 08 08Mexico 28 22 18 21 25Australia 03 02 02 02 02Canada 12 07 05 04 04Spain 17 17 16 14 11South Africa 24 18 15 11 12
---------------------------------------------------------------------------------------------------------------- Does not include credits covered by guaranteeSource Bankscope cited in Central Bank of Brazil Financial Stability Report November 2008 p 56
8132019 Government Banking and BRICs in the Recent Financial Crisis
httpslidepdfcomreaderfullgovernment-banking-and-brics-in-the-recent-financial-crisis 1457
983106983122983113983107 983111983151983158983141983154983150983149983141983150983156 983106983137983150983147983155 983137983150983140 983110983145983150983137983150983139983145983137983148 983123983156983137983156983141983139983154983137983142983156
14
Further comparative data confirms that the Brazilian banking system tends to run onmore expensive credit higher returns and profits and higher levels of late and bad loansBanks operating in Brazil also retain higher levels of administrative and personnel costsHowever Brazilian banks also tend to set aside more generous reserves and provisions
against losses These structural characteristics can be seen in the comparative data in the tablebelow The data on government private and foreign banks in Brazil and comparisons suggestthat the Brazilian banking system incurs higher operating costs maintains higher reservesprovisions and capital against losses and risk but nonetheless produces strong returns
Indicators of Bank Efficiency Performance and Provisions in Brazil Select Latin Americanand Reference Countries
Cost Op Exps NPL Provisions EquityIncome Assets Loans NPL Assets
----------------------------------------------------------------------------------------------------------------
Brazil 62 65 41 153 9Argentina 84 41 66 116 12Chile 53 28 10 166 7Colombia 52 59 32 144 11Mexico 58 47 20 232 12US 54 33 07 163 8Spain 56 16 07 313 12----------------------------------------------------------------------------------------------------------------Source World Bank ldquoBrazil The Industry Structure of Banking Servicesrdquo Brasiacutelia June 2007 pp
Comparison of administrative costs in Brazilian banking with levels in other large
Latin American and emerging and reference economies suggest that Brazilian banks retainhigher costs From 2001 through 2005 the value of administrative costs as a percent of bankassets in Brazil declined from 69 percent to 58 percent but remained significantly abovelevels reported from Chile (30 to 27 percent) Mexico (47 to 46 percent) and well abovereference countries such as Australia Canada and Spain (16 36 and 11 percentrespectively) Although time series lacks comparison after 2005 administrative costs inBrazilian banks decline significantly from 58 in 2005 to 42 in 2008
Bank Administrative Costs in Brazil Select Latin American and Reference Countries (Assets)
2001 2002 2003 2004 2005 2006 2007 2008-------------------------------------------------------------------------------------------------Brazil 69 61 60 61 58 55 51 42Chile 30 30 27 27 27Mexico 47 48 46 43 46Australia 17 17 16 16 16Canada 27 27 27 27 26Spain 17 17 16 14 11-------------------------------------------------------------------------------------------------- Adjusted average of total assetsSource Bankscope cited in Central Bank of Brazil Financial Stability Report November 2008 p 56
A final comparison of government private and foreign bank solidity is based onCentral Bank of Brazil estimates of the impact of hypothetical shocks to the Brazilian
8132019 Government Banking and BRICs in the Recent Financial Crisis
httpslidepdfcomreaderfullgovernment-banking-and-brics-in-the-recent-financial-crisis 1557
983106983122983113983107 983111983151983158983141983154983150983149983141983150983156 983106983137983150983147983155 983137983150983140 983110983145983150983137983150983139983145983137983148 983123983156983137983156983141983139983154983137983142983156
15
economy on domestic banks These estimates are based on the revisions of the widely usedValue-at-Risk estimates proposed by Boudoukh Richardson and Whitelaw that adapts theoriginal VaR method developed and commercialised by JP Morgan19
Stress Tests for Impact of Credit Interest Rate and Foreign Exchange Shock on Basel Index
Comparison of Government Domestic and Foreign Banks 2001-2006
2002 2003 2004 2005 2006-------------------------------------------------------------------------------------------------------------
Government 112 104 114 113 109Domestic 112 132 126 121 103Private 103 131 135 108 84-------------------------------------------------------------------------------------------------------------Source Central Bank of Brazil Financial Stability Reports 2002-2006Note Basel Index = Capital risk guideline measure defined by Bank for International Settlements BaselCommittee that recommends 8 percent relation between PR and total assets weighted by risk level Since 2002Central Bank of Brazil minimum requirements of Basel Index remains 11 percent For methods of calculationsee Central Bank of Brazil Financial Stability Report Brasilia 2006 p 76
Central Bank of Brazil tests estimate that in the face of foreign currency valuationand interest rate shock government banks would nonetheless remain at or slightly below thecapital requirements against credit risk recommended by the central bank Again it should benoted that Basel Index levels recommended in the BIS Capital Requirements guidelines forthe Basel Index of banks are 80 while the Central Bank of Brazil has set minimum BaselIndex levels of 110 Given that federal government bank portfolios include more credit thanprivate banks and especially foreign banks the estimate of a shift to 109 in the averageBasle index for federal government banks in the face of a credit shock provides furtherevidence that these financial institutions are solid and their capital reserves sufficient Insum comparison of results for government private and foreign banks in the estimatesreported by the Central Bank of Brazil of the likely impact of a shock to the Brazilianeconomy in terms of interest rates and foreign exchange rates also suggests that governmentbanks appear solid The average Basel Index reported for government banks in this stress testwas 135 above the 110 Central Bank of Brazil guideline and well above the 80 levelsuggested by the BIS
Understanding the capacity of Brazilian banks to cope with shocks and risk is not justa theoretical exercise Since the currency crisis in Mexico during 1994-1995 the newlystabilized currency was tested by shocks from home and abroad Policies first dramaticallyincreased interest rates under a fixed exchange rate regime then freed the real to devalue
under a flexible foreign exchange rate regime in January 1999 The Asian currency crisesduring second semester 1997 led the Central Bank of Brazil to increase benchmark Selicinterest rates to 434 percent in November In August 1998 the declaration of moratorium onforeign debt payments by Russia the central bank to once again increase Selic interest ratesfrom 20 to 40 percent under the fixed exchange rate regime by November of that year Theseshocks from abroad coincided with preparations for national elections during 1998 leadingthe IMF and other official creditors to provide strong support for the Brazilan governmentNonetheless by January 1999 (after the election) market pressure led to the abandonment ofthe fixed foreign exchange rate regime that had served as nominal anchor for economic
19 Calculation first published in Resenha BMampF Vol 122 1998 (described in Central Bank of Brazil
Financial Stability Report 2002 amp 2003 then as Boudoukh Jacob Matthew Richardson RichardStanton amp Robert Whitelaw ldquoMaxVaR Long Horizon Value at Risk in a Mark-to-Market Environmentrdquo Journal of Investment Management 2004Vol 2 No 3 pp 14-19
8132019 Government Banking and BRICs in the Recent Financial Crisis
httpslidepdfcomreaderfullgovernment-banking-and-brics-in-the-recent-financial-crisis 1657
983106983122983113983107 983111983151983158983141983154983150983149983141983150983156 983106983137983150983147983155 983137983150983140 983110983145983150983137983150983139983145983137983148 983123983156983137983156983141983139983154983137983142983156
16
policy since 1994 The real quickly devalued from 121 to 20 against the US dollar by theend of January and led to considerable changes in policy (a flexible foreign exhange rateregime inflation targeting and the implementation of further fiscal reforms) Once the realrevalued from R$22 against the dollar in March to R$166 in April 1999 the governmentmoved to consolidate this new triad of economic policies Since 1999 flexible foreign
exchange markets inflation targeting and fiscal reform have remained in place This suggeststhat Brazilian banks have weathered volatile parameters and large risks during a markedpolitical business cycle One involving the transition from reformist President Cardoso to PTPresident Lula Since recovery of the economy during 2004 the coalition government underPT President Lula has sought to expand the contribution of government banks to accelerategrowth and social inclusion These policies have not undermined economic fundamentals oreroded the institutional foundations of comparative advantage retained by Brazilian federalgovernment banks
In sum the advances of Brazilian banking toward Basel Accord regulations during the1990s and 2000s the adoption of more transparent and timely reporting standards and themodernization of government banks under pressures from liberalization placed federal banks
in a new situation in the face of crisis once it hit the country in 2008 A closer look at the bigthree federal government banks is in order to better understand these changes
The Banco do Brasil
Upon taking office in 2003 President Lula retained the central economic policies of theCardoso administration such as inflation targeting tight fiscal and monetary policy andthe operational independence of the Banco do Brasil However the recovery of investorconfidence during 2003 and the return of stronger growth levels during 2004 led to aperiod of what the Central Bank of Brazil describes as organic growth at the Banco doBrasil From 2004-2008 the Banco do Brasil contributed to the deepning of domesticcredit markets and emerged as leading investment bank at the Bovespa stock marketFurthermore once the Bovespa collapsed credit became short and a sharp downturnensued during 2008 the Banco do Brasil provided emergency loans infusions of capitalthrough stock purchases and the acquisition of small and mid-sized firms and banksunable to weather the sharp decline and lack of credit Although the merger of Itauacute andUnibanco in 2008 displaced the Banco do Brasil as the largest financial institution inLatin America the bank retains powerful institutional foundations of comparativeadvantage and networks that cross Brazilian society politics and markets
The Banco do Brasil also remains at the center of Brazilian politics and policydisputes Indeed leaders of the PT party faction articulaccedilatildeo (articulation) includes
career employees of the Banco do Brasil and presidents of the Brazilian bank workersunion such as Luiz Gushiken and Ricardo Berzioni Both were nominated to ministerialposts by President Silva in January 2003 By August 2003 21 of 33 top positions at theBanco do Brasil had been filled by new representatives of the PT most Banco do Brasilemployees and members of the Brazilian bank workers union Critics decriedpoliticization However the resistance of bank representatives described above topresidential appeals to increase credit during 2003 was followed by more neutralappointments during 2004 When Banco do Brasil President Cassio Casseb Limaresigned in November 2004 (under charges of irregularities in consulting contracts atthe bank) President Lula nominated Rossano Maranhatildeo Pinto a career employee andBanco do Brasil vice president to head the bank Further appointments of PMDB
political leaders to cement support for the PT coalition government were also criticizedas politicization of the bank However Banco do Brasil officials responded that these
8132019 Government Banking and BRICs in the Recent Financial Crisis
httpslidepdfcomreaderfullgovernment-banking-and-brics-in-the-recent-financial-crisis 1757
983106983122983113983107 983111983151983158983141983154983150983149983141983150983156 983106983137983150983147983155 983137983150983140 983110983145983150983137983150983139983145983137983148 983123983156983137983156983141983139983154983137983142983156
17
experienced political leaders of the PMDB brought competitive advantages to the bankbased on their networks that cross the public and private sector These networks andrelations during the second PT coalition government of President Lula also appearsdifferent than the first given the departure from core offices of the presency bylongtime advisors to Lula that came from the Banco do Brasil and bank workers union
By late 2006 only one of seven vice presidents of the Banco do Brasil was a member ofPresident Lulaacutes Workersacute Party (PT)Again Banco do Brasil policies and growth since recovery of the economy in
2004 involved first a period of expansion during four years of growth followed by aturn to counter cyclical lending and finance once financial crisis abroad produced first asevere contraction in credit supply then a sharp economic downturn in fourth quarter2008 Institutional foundations of comparative advantage are behind Banco do Brasilpolicies during both periods First the capitalization of Brazilian firms on the Bovespastock market is closely related to the groups that cross politics government banks thepowerful bank worker labor union the Banco do Brasil employee private pension fundand bank consortia often led by the Banco do Brasil investment banking division (often
joined by the BNDESpar and Caixa investment banking division) Recent developmentsare complex and will require further research However rather than convergence towardprivate banking and a market-centered financial system examination of Banco do Brasilpolicies and market shares during the 2000s suggests that federal government banks notonly remain at the center of politics policy and development strategies but that theseinstitutions have modernized to compete against private and foreign banks
The large scale and scope of the Banco do Brasil has permitted use of the bankfor counter-cyclical lending and leadership in capital markets without deteriorating bankbalance sheets Since 2003 the Banco do Brasil has remained well within domesticbank regulations and Basel Accord guidelines During 2002 and 2003 reforms at theBanco do Brasil sought to reduce costs and increase efficiency ratings Indeed therelation between the Banco do Brasil and President Lula reversed past patterns In the1950s conflicts were between national developmentalist groups at the Banco do Brasiland more orthodox Ministers of Finance In 2003 and once again during the 2008financial crisis differences between President Lula and the Banco do Brasil were thereverse Banco do Brasil management refused to dramatically increase loans in 2003and resisted requests to reduce the price of credit in 2008 In 2003 the caution imposedby political risk perceptions led President Lula to respect the operational autonomy ofthe Banco do Brasil In April 2009 Banco do Brasil President Antonio Francisco deLima Neto was fired after refusing to reduce interest rates on loans This reversal ofpolicy positions from the 1950s suggests in a broader sense a transition from the
macroeconomics of populism to the microeconomics of government banking in the 21
st
century Government banks do not provide easy or all solutions Instead credit andfinance policies are subject to market discipline credit risk analysis and the realities ofbusiness cycles
Review of the Banco do Brasilrsquos balance sheet from 2002-2008 suggests that the bankdeveloped organically from 2002-2007 with gradual increases reflecting the competitiveadvantages at the top of Brazilian banking and finance Policies changed during 2007 and2008 as the credit shortage caused by international financial crisis led to the Banco do Brasilassuming once again lending of last resort functions by extending interbank investments andloans to small and medium sized banks to avert further declines in domestic liquidity TheBanco do Brasil also acquired a 51 percent stake in the Votarantim bank to avert a run on
deposits and possible failure while acquiring Satildeo Paulo state government savings bankNossa Caixa for R$76 billion in 2008 These acquisitions reflect concern about the
8132019 Government Banking and BRICs in the Recent Financial Crisis
httpslidepdfcomreaderfullgovernment-banking-and-brics-in-the-recent-financial-crisis 1857
983106983122983113983107 983111983151983158983141983154983150983149983141983150983156 983106983137983150983147983155 983137983150983140 983110983145983150983137983150983139983145983137983148 983123983156983137983156983141983139983154983137983142983156
18
replacement of the Banco do Brasil as the largest financial conglomerate in Brazil after themerger of Itauacute and Unibanco
Banco do Brasil Balance Sheet Summary 2002-2008 R$ billion
2002 2003 2004 2005 2006 2007 2008 2009 2010 2011Assets --------------------------------------------------------------------------------------------------------Interbank Investments 101 50 27 80 175 434 951Interbank Deposits 76 283 137 209 116 77 242Securities 709 696 734 664 731 752 732Central Bank Deposits 81 186 221 244 281 334 212Loans to Private Sector 89 652 757 885 1178 1463 1810Loans to Public Sector 56 43 41 37 43 24 230Receivables 297 273 312 351 404 548 808Other AssetsTotal Assets 2046 2301 2390 2529 2963 3672 5073Liabilities ---------------------------------------------------------------------------------------------------Deposits 972 1100 1155 1376 1588 1882 2711
M MKT Borrowing 483 400 445 305 492 722 914Treasury amp BNDES 59 74 106 133 143 175 224Shareholder Equity 92 121 141 168 207 242 299Other LiabilitiesTotal Liabilities 2046 2301 2390 2529 2963 3672 5073---------------------------------------------------------------------------------------------------------------- Compulsory deposits for commercial banks according to Central Bank regulationsSource Banco do Brasil Annual Reports Historical Series 2002-2008
From 2002 through 2006 the balance sheet of the Banco do Brasil suggests a periodof growth based on loans to the private sector with deposits and shareholder equityincreasing largely apace After 2006 the balance sheet changes fundamentally with capitalinjections from money market borrowing increasing from R$492 billion in 2006 to R$914billion in 2008 while Banco do Brasil liabilities with Treasury and BNDES increased fromR$143 billion in 2006 to R$224 billion in 2008 The asset side of the balance sheet alsosuggests fundamental change Private sector lending increased from R$1178 billion in 2006to R$1810 billion in 2008 reflecting acquisition of portfolios from Nossa Caixa Interbankinvestments increased from R$175 billion in 2006 to R$951 billion in 2008 while interbankdeposits also increased from R$116 billion in 2006 to R$242 billion in 2008 The counter-cyclical lending strategies of the Banco do Brasil during 2008 also included an increase oflending to the public sector from R$24 billion in 2007 to R$230 billion Banco do Brasilreponses to government credit policy can also be seen in the release of 40 percent of
compulsory deposits retained at the central bank Banco do Brasil deposits at the central bankdeclined from R$334 billion in 2007 to R$212 billion in 2008 ndash freeing this value for loansand investments
Networks and relations during the second government of President Lula appeardifferent than the first given the departure from core offices of the presency by longtimeadvisors to Lula that came from the Banco do Brasil and bank workers union By late 2006only one of seven vice presidents of the Banco do Brasil was a member of President LulaacutesWorkersacute Party (PT) The corporate profile of the Banco do Brasil suggests once again thehybrid character of this government bank one listed on the Bovespa Novo Mercado but withover 65 percent of shares owned by the Brazilian federal government Treasury
8132019 Government Banking and BRICs in the Recent Financial Crisis
httpslidepdfcomreaderfullgovernment-banking-and-brics-in-the-recent-financial-crisis 1957
8132019 Government Banking and BRICs in the Recent Financial Crisis
httpslidepdfcomreaderfullgovernment-banking-and-brics-in-the-recent-financial-crisis 2057
983106983122983113983107 983111983151983158983141983154983150983149983141983150983156 983106983137983150983147983155 983137983150983140 983110983145983150983137983150983139983145983137983148 983123983156983137983156983141983139983154983137983142983156
20
customers in 2008 reached 479 million with the bank retaining 39700 AMTs and 766million bank cards (239 million credit cards and 527 million debit cards) Like the CaixaEconocircmica Federal the Banco do Brasil also processes government payments withretirement and social security payments numbering 745 million transactions during 2008Although this implies administrative costs (and receipts) this also brings customers and
prospective customers into Banco do Brasil branch officesDuring 2008 the Banco do Brasil continued to expand operations form jointventures acquire private and government banks and modernize operations A secondaryoffering of stock in January 2008 granting of shares by VISA to the Banco do Brasil andupgrading of the bank to investment grade BB- by Standard amp Poors in April 2008 suggestthat market orientation of the bank continues during the Lula administration despite counter-cyclical credit policies A Lower Income Segment Department was also created to assumeBanco Popular do Brasil operations along with correspondent banking relations and regionalsustainable development programs The Banco do Brasil also received permission to usesavings accounts for home loans enabling the bank to compete on level ground with CaixaEconocircmica Federal During 2008 the Banco do Brasil also acquired the state government
banks Banco do Piaui Banco de Santa Catarina (33rd largest bank in Brazil with US$30billion assets at year end 2007) and Satildeo Paulo government savings bank Nossa Caixa (12thlargest Bank in Brazil with US$267 billion in assets at year end 2007) In sum the diversecorporate divisions and financial operations of the Banco do Brasil provided policy optionsduring 2008 to counter the credit shortage and help firms and domestic banks to adjust
Banco do Brasil and Private Bank Returns and Capital Adequacy 2002-2009
Basel Index Return on Assets Return on Liquid Assets----------------------------- ----------------------------- -----------------------------BB Itauacute Bradesco BB Itauacute Bradesco BB Itauacute Bradesco
--------------------------------------------------------------------------------------------------------------2002 122 184 179 12 26 20 302 288 2832003 137 198 199 11 28 16 231 297 2282004 152 206 188 13 30 23 240 292 3092005 171 170 173 12 37 26 187 353 2842006 173 171 188 28 31 25 267 288 2632007 156 179 156 14 32 22 222 321 2442008 152 161 169 25 19 16 304 221 2112009 150 165 166 12 13 14 238 182 195-------------------------------------------------------------------------------------------------------------- Annualized first quarter 2009 resultsSource Banco do Brasil Itauacute and Bradesco Annual Reports 2002-2009
Comparison of Banco do Brasil returns and capital adequacy with the two majorprivate Brazilian banks Itauacute and Bradesco suggests that the performance and solidity of theBanco do Brasil remains equal or superior to private banks During 2002 and 2003 thecapital adequacy of the Banco do Brasil and return on assets remained below levels reportedby the two largest Brazilian private banks suggesting the impact of counter-cyclical lendingHowever after 2004 the Basel index of the Banco do Brasil reached 171 far above BISstandards of 80 and Central Bank of Brazil requirements of 110 Furthermore from 2006through first quarter 2009 returns on assets returns on liquid assets and the Basel index ofthe Banco do Brasil exceed levels reported by Itauacute and Bradesco In sum despite providingcounter cyclical credit and despite having been replaced by the Itau-Unibanco merger as the
8132019 Government Banking and BRICs in the Recent Financial Crisis
httpslidepdfcomreaderfullgovernment-banking-and-brics-in-the-recent-financial-crisis 2157
983106983122983113983107 983111983151983158983141983154983150983149983141983150983156 983106983137983150983147983155 983137983150983140 983110983145983150983137983150983139983145983137983148 983123983156983137983156983141983139983154983137983142983156
21
largest Brazilian bank the performance and capital adequacy of the Banco do Brasil remainsat or above levels reported by the two largest private banks
In sum since liberalization of banking and finance and privatization of stategovernment banks during the 1990s the Banco do Brasil has been transformed from directstate owned bank into one of two very large financial conglomerates that dominate domestic
banking in Brazil Instead of retaining easy access to funds at Treasury to cover losses theBanco do Brasil has adopted international corporate governance standards to become listedon the Bovespa Novo Mercado and retains an important role in virtually every aspect ofBrazilian banking and finance Although sale of shares in the 1990s were designed to transfercorporate governance and control of the national bank to the private sector the federalgovernment retains 65 percent of stocks after two sale of stocks capitalized the bank duringthe 2000s The massive size and wide scope of Banco do Brasil networks across bankingfinancial markets political and social forces and business have led the bank to realize recordprofits during the period of growth from 2004-2008 and provide counter-cyclical credit toavert a further decline in industrial activity and the economy as the US and global financialcrisis hit Brazil first with a 50 percent decline in the Bovespa stock market and credit
shortage followed by a steep but short decline in industrial production in late 2008 Thetransparency of Banco do Brasil quarterly reports and advances in Central Bank of Brazilsupervision of domestic banking clarify the new tensions that have emerged during the PTgovernment of President Lula These tensions reflect the modernization and competitiveadvantages of the Banco do Brasil
Caixa Econocircmica Federal (Federal Savings Bank Caixa)
The third largest domestic bank the wholly government owned Federal Savings Bank Caixawas also called on by President Lula during the recent financial crisis to increase the pace ofgrowth provide counter cyclical credit during downturns and to reduce consumer andcorporate interest rates and bank spreads Review of balance sheets and policies since 2001suggest that the Caixa retains its core business in urban development home loans real estatetransfer of funds for government programs and services and lottery administration Howeverinvestment banking management of third party funds and the creation of of new products andservices have both increased profits and increased popular access to banking and socialservices The bank has recorded record profits since R$108 billion (2002) R$16 billion(2003) and R$14 billion (2004) The Caixa became the fourth largest Brazilian investmentbank by 2003 while gaining dealer status from the Central Bank of Brazil in primary andsecondary markets for government securities At year-end 2003 the bank retained anestimated R$767 billion of government paper (over ten percent of government paper) in its
portfolio assets earning over R$135 billion that year Since recovery of the Brazilianeconomy in 2004 the Caixa has reported strong profits and continued to improve thestructure of its balance sheet and converge toward international bank reporting standards
In terms of assets deposit base and the number of employees and branches the datasuggest that the Caixa has emerged from a process of rationalization and downsizing duringthe late 1990s and expanded ldquoorganicallyrdquo since capitalization in 2001 Assets declined fromover US$999 billion in 1997 to US$363 billion in 2002 after reorganization andcapitalization Deposits also declined from US$541 billion in 1997 to US$216 billion in2002 The number of employees and branches declined from 104253 and 2316 to 98971 and1803 respectively but returned to 104934 and 2428 by 2006 After reorganization andcapitalization in June 2001 Basel indexes and the ratio of fixed assets over equity indicate
substantial reform and transition toward international banking standards The Basel Index thatmeasures the adequacy of capital reserves against possible losses and risks increased from
8132019 Government Banking and BRICs in the Recent Financial Crisis
httpslidepdfcomreaderfullgovernment-banking-and-brics-in-the-recent-financial-crisis 2257
983106983122983113983107 983111983151983158983141983154983150983149983141983150983156 983106983137983150983147983155 983137983150983140 983110983145983150983137983150983139983145983137983148 983123983156983137983156983141983139983154983137983142983156
22
135 (49 in March 2001 before capitalization) to reach 278 and remain twice above theCentral Bank minimum of 110 at 252 in 2006 The ratio of fixed assets as a proportion ofequity also declines substantially from 638 at year end 2001 to 197 in 2007
Summary of Caixa Structure and Performance 1995-2007
Assets Profits Deposits Employees Branches Basel FAEquity1995 826 672 503 99866 23161996 907 2351 515 99343 21051997 999 875 541 96300 18031998 948 1693 499 94859 18191999 684 1571 344 94194 19192000 644 1362 322 104253 19212001 436 -1265 298 98971 2013 135 6382002 363 1462 216 106548 2147 146 5372003 521 2617 281 100498 2046 192 413
2004 556 2999 345 100164 2135 202 3612005 806 4852 456 106729 2321 278 2012006 981 4874 567 104934 2428 252 1972007 1409 4485 800 106770 2052 288 1282008 1266 5735 708 103895 2069 206 119
Note Assets amp Deposits = US$billion Profits = US$million Basel = BIS Basel Accord index of capital reserveadequacy FAEquity = Fixed Assets Equity a summary indicator of bank modernizationSource Central Bank of Brazil Top 50 Banks in Brazil available at wwwbcbgovbr
Caixa Annual Reports and transition toward Central Bank and international bankaccounting standards introduce breaks in the time series of financial performance after 2001
However international bank reporting standards have been used by the Caixa since 2005 andthe data provide further view of the policies and performance of the bank Table X reportsreturns on stockholder equity assets Basel solvency index immobilization index provisionsas a percent of credit operations bank efficiency index and coverage of personnel costs Thedata are consistent with the broader comparisons reported in chapter two that suggest highprofits and returns alongside higher levels of provisions and reserves against capital riskReturns on stockholder equity have remained above 20 percent per year reaching 306percent in 2008 Returns on liquid assets remained between 09 percent and 13 percentbelow the average levels recorded by private and foreign banks The Basel Index of the Caixaremained well above the 11 percent level required by the Central Bank declining from 279in 2005 to 206 in 2008
Caixa Performance Indicators 2005-2008
Indicator 2005 2006 2007 2008 2009 2010 2011--------------------------------------------------------------------------------------------------------------------------Return on Shareholder Equity 261 260 226 306Return on Liquid Assets 11 11 09 13Basel Solvency Index 279 253 289 206Immobilization Index 201 197 129 120Provisions as Credit Operations 101 98 91 86Efficiency Index 645 642 755 718Coverage of Personnel Costs 925 896 943 868
---------------------------------------------------------------------------------------------------------------------------Source Caixa Econocircmica Federal Relatoacuterios de Administraccedilatildeo 2005-2011
8132019 Government Banking and BRICs in the Recent Financial Crisis
httpslidepdfcomreaderfullgovernment-banking-and-brics-in-the-recent-financial-crisis 2357
983106983122983113983107 983111983151983158983141983154983150983149983141983150983156 983106983137983150983147983155 983137983150983140 983110983145983150983137983150983139983145983137983148 983123983156983137983156983141983139983154983137983142983156
23
The immobilization index of the Caixa also declined from 201 percent in 2005 to120 percent in 2008 suggesting transition toward standard levels of international bankingHowever the value of provisions as a percent of credit operations remains much higher thaninternational bank practices albeit declining from 101 percent in 2005 to 86 percent in2008 Finally both the substantial increase in efficiency index from 645 to 718 percent
suggests that the Caixa has distanced further from international private bank levels that tendto approach 500 percent This has resulted in the declining level of coverage of personnelcosts and indicates the comparatively larger organizational structure and less use ofoutsourced labor at the Caixa
Caixa Deposits and Sources of Funds 2005-2008 R$million
2005 2006 2007 2008 2009 2010 2011----------------------------------------------------------------------------------------------------------------Bank Deposits 692 863 1155 1320Savings Deposits 5328 6006 7560 9255Mid-Term Savings Deposits 3873 4219 4136 4862
Certificates (1270) (1412) (1244) (1831)Escrow (2602) (2806) (2891) (3031)
Funds and Programs 794 1034 1307 1100Other 009 015 019 013Caixa Total 10690 2139 14179 6552Bank System Total 68268 78148 92672 27482Caixa Deposits as Total (156) (155) (1531) (129)----------------------------------------------------------------------------------------------------------------Source Caixa Econocircmica Federal Relatoacuterios de Administraccedilatildeo 2005-2008
The liability side of Caixa balance sheets from 2005-8 suggests that the bank hasdistanced itself from reliance on official savings programs and funding toward consumerbank and savings deposits Bank deposits increased from R$69 billion in 2005 to overR$132 billion in 2008 Savings deposits increased from R$532 billion in 2005 to overR$925 billion in 2008 Furthermore the increase of mid-term savings deposits originatedfrom sale of savings certificates instead of escrow held by the Caixa the latter subject to
judicial review and removed from balance sheets in 2008 The value of funds deposited at theCaixa from government funds and programs increased from R$79 billion in 2005 to R$110billion in 2008 although it remains less than ten percent of total deposits In terms of totalvalue of deposits and savings the Caixa increased total value of deposits from 107 billion toover 165 billion from 2005-8
Caixa Loans 2005-8 R$ million2005 2006 2007 2008 2009 2020 2011
----------------------------------------------------------------------------------------------------------------Commercial 14652 16329 19134 28854
Consumer 8925 9474 11063 13747Business 5727 6854 8071 15107
Home 20208 26113 32475 45075Sewage and Infrastructure 1646 2556 3585 5445Other 690 691 694 689Risk Provision -3773 -4469 -5090 -6900Total Caixa Loans 37195 45689 55888 80062----------------------------------------------------------------------------------------------------------------Source Caixa Econocircmica Federal Relatoacuterios de Administraccedilatildeo 2005-8
8132019 Government Banking and BRICs in the Recent Financial Crisis
httpslidepdfcomreaderfullgovernment-banking-and-brics-in-the-recent-financial-crisis 2457
983106983122983113983107 983111983151983158983141983154983150983149983141983150983156 983106983137983150983147983155 983137983150983140 983110983145983150983137983150983139983145983137983148 983123983156983137983156983141983139983154983137983142983156
24
In terms of lending the data suggests that the primary focus of the Caixa on homeloans continued during the late 2000s although substantial increases in commercial lendingfor consumer credit and businesses suggest the diversification of the Caixa across creditmarkets Since 2005 Caixa lending to consumers and business increased from R$89 billionto R$137 billion and from R$57 billion to R$151 billion respectively in 2008
And unlike the high levels of bad and late credit reported during the adjustment to theend of high inflation in 1994-6 and financial crises (1994-5 1997 1998 1999 2001 2003)the level level of late loans at the Caixa fell substantially during the years of economicgrowth and credit expansion from 2006-2008 The percent of late over total loans at the Caixafell from 68 percent in 2006 to 40 percent in 2008 for commercial loans generally and from62 percent to 59 percent for consumer loans and 75 percent to 22 percent for loans tobusiness The value of late home loans as a percent of total home loans also fell from 31 to17 percent in 2008
Caixa AA-H Credit Classification 2001-8
Days Prov-Late ision 2001 2002 2003 2004 2005 2006 2007 2008 2009 2010 2011
---------------------------------------------------------------------------------------------------------------------------------------AA lt15 0 59 56 66 63 54 50 63 94A lt15 05 243 264 313 288 393 435 401 333---------------------------------------------------------------------------------------------------------------------------------------B 15-30 1 127 126 137 139 143 158 206 271C 31-60 3 203 166 145 169 167 192 194 192D 61-90 10 178 261 207 217 133 60 45 33---------------------------------------------------------------------------------------------------------------------------------------E 91-120 30 18 19 20 20 22 13 09 07F 121-50 50 49 15 15 14 10 07 07 07G 151-80 70 15 08 09 10 08 10 10 09
H gt180 100 104 87 85 77 68 72 61 51R$billion 2094 2353 2614 3016 3855 4736 5739 818---------------------------------------------------------------------------------------------------------------------------------------Source Caixa Annual Reports 2002-2008
The credit risk matrix of Caixa loans from 2001 to 2008 confirms this trend ofimprovement (See above table) The data also provide evidence of greater transparency andthe improvement of bank reporting and accounting standards as well as Central Banksupervision of banks Instead of two categories of credit (good = all loans up to 90 daysoverdue bad = loans over 90 days overdue) the Central Bank of Brazil has adoptedinternational standards of credit classification (from AA to H) and imposed regulations that
banks increase or decrease provisions according to the distribution of loans in thesecategories The scale of provisions required by the Central Bank vary from zero percentagainst loans classified as AA to provision of 100 percent of loan values for credits classifiedas H that is to say over 180 days late
The percent of loans over 180 days late has decreased from 104 percent of total in2001 to 51 percent in 2008 Furthermore all categories of late payment except for loansbetween 15-30 days late decreased significantly from 2001 through 2008 In comparisonloans classified as AA (paid and guaranteed) and A (paid on time) increased from 59 percentto 94 percent and 243 percent to 333 percent of total loans The only category of late loansthat increased over the period is that of loans 15-30 days overdue from 127 percent to 271percent of total
The central argument of this study is that Brazilian federal government banks retaininstitutional foundations of competitive advantage over private and foreign banks Further
8132019 Government Banking and BRICs in the Recent Financial Crisis
httpslidepdfcomreaderfullgovernment-banking-and-brics-in-the-recent-financial-crisis 2557
983106983122983113983107 983111983151983158983141983154983150983149983141983150983156 983106983137983150983147983155 983137983150983140 983110983145983150983137983150983139983145983137983148 983123983156983137983156983141983139983154983137983142983156
25
data that suggests this advantage can be seen in the increasing volume and market share ofthe Caixa in debit and credit cards The number of Caixa debit cards increased from 224million in 2002 to over 482 million in 2008 with Caixa market share of debit cards increasedfrom 196 percent ot total card market in 2002 to peak at 230 percent in 2005 and remainingat 219 percent of the total number of debit cards in Brazil in 2005
Two examples illustrate the institutional foundations of comparative advantage of theCaixa in the card payment industry First like other banks in Brazil the Caixa shares anagreement with Visa for payment processing However unlike other banks in Brazil theCaixa was contracted by the federal government to distribute ATM citizenship cards torecepients of federal government family grants and other transfer programs Apparentlywithout seeking approval the Caixa stamped its brandname on the federal government ATMcitizenship card and has continued to do so despite charges of unfair competition fromprivate domestic banks Furthermore a Caixa request to transform its 110 million ATMcitizenship cards into bank cards currently pending at the Central Bank would dramaticallyincrease the number of bank card holders in Brazil (1824 million at year end 2007)
Caixa Debit and Credit Card Market Shares 2002-2008
Million Debit Cards Million Credit Cards MillionCaixa Total Mkt Caixa Total Mkt Interbank Checks
----------------------------------------------------------------------------------------------------------------2002 224 1142 (196) 16 407 (39) 229502003 280 1254 (223) 18 440 (40) 213602004 320 1491 (213) 20 535 (37) 196702005 377 1639 (230) 25 675 (37) 183902006 384 1744 (220) 31 952 (32) 162202007 400 1824 (219) 39 1177 (33) 144902008 482 42----------------------------------------------------------------------------------------------------------------Source Central Bank of Brazil Diagnoacutestico do Sistema de Pagamentos de Varejo do Brasil Adendo Estatiacutesticondash 2007 p 9 and Caixa annual reports 2003-2008
Having reviewed the Banco do Brasil and Caixa a brief look at the counter-cyclicalpolicies and performance of the third Brazilian federal government bank ndash the BNDES ndash is inorder
Banco Nacional de Desenvolvimento Econocircmico e Social (National Bank for Economic
and Social Development BNDES)
The BNDES is a paradigmatic development bank The trajectory of the BNDES involves asequence of policies and financial practices that have shaped Brazilian development Duringthe 1950s the BNDE supplied direct credits for transportation electric energy infrastructureand steel production During the 1960s the bank diversified under financial reforms Duringthe 1970s the BNDE acted to complete state-led import substitution industrialization bychanneling foreign finance and forced savings into capital goods project lending and regionaldevelopment programs During the 1980s the bank shifted away from public investmentunder pressure of fiscal crisis and foreign debt During the 1990s the BNDES became agentfor the privatization of state owned enterprises The BNDES remained virtually the onlysource of long-term finance during a decade of financial crises in emerging markets (1994-2003) Since 2000 the bank has shifted toward ldquosecond generationrdquo reforms designed tofinance the private sector and free market forces deepen domestic capital and equity markets
8132019 Government Banking and BRICs in the Recent Financial Crisis
httpslidepdfcomreaderfullgovernment-banking-and-brics-in-the-recent-financial-crisis 2657
983106983122983113983107 983111983151983158983141983154983150983149983141983150983156 983106983137983150983147983155 983137983150983140 983110983145983150983137983150983139983145983137983148 983123983156983137983156983141983139983154983137983142983156
26
and lend to small medium and micro-enterprises Since 2004 capital inflows and a boomingdomestic stock market have reinforced the capacity of the BNDES to underwrite long-terminvestments and transform large Brazilian firms into multinational corporations Since 2007BNDES President Coutinho has pursued a full service approach attempting to help star-upsmall and medium firms provide funds to expand successful firms and participate in venture
capital funds to help enterprises transit toward corporate governance standards and initial orsecondary offerings of stock on the Bovespa exchange In 2008 as financial crisis led to ashortage of credit collapse of share prices and sharp decline in industrial production byfourth quarter 2008 the BNDES also provided lending of last resort to major Braziliancorporations while retaining long term goals for massive investments in deep sea petroleumproduction
BNDES Market Share of Interbank and Non-Bank Loans 1995-2008 US$ Billion
Interbank Loans Non-Bank Loans------------------------------------------ ------------------------------------------
BNDES Mkt Total BNDES Mkt Total-----------------------------------------------------------------------------------------------------------1995 156 (324) 481 80 (38) 20711996 181 (354) 511 109 (49) 21981997 197 (278) 707 145 (68) 21031998 216 (355) 608 230 (113) 20201999 204 (410) 497 150 (35) 14282000 243 (439) 553 152 (96) 15772001 259 (504) 515 145 (104) 13912002 233 (443) 525 137 (130) 10512003 261 (419) 622 200 (141) 14152004 306 (408) 749 218 (122) 17862005 343 (373) 918 277 (113) 24312006 388 (350) 1106 329 (102) 32312007 524 (335) 1563 432 (88) 48852008 530 (493) 1073 456 (96) 4743200920102011-----------------------------------------------------------------------------------------------------------Source Central Bank of Brazil Top 50 Banks 1995-2008
Revew of BNDES lending since 1995 suggests the realization of competitiveadvantages typical of a large centralized development bank Contrary to the extensive branchoffice networks retained by the Banco do Brasil and Caixa the BNDES retains under 1900employees (compared to 105000 at Caixa) in the Rio de Janeiro and four regional officesSince 1995 the BNDES increased its market share of non-bank loans from R$80 billion (38percent) to R$200 billion (141 percent) during the economic downturn risk aversion andcredit shortage in 2003 After 2003 the BNDES market share of loans to non-financialentities decreased to 88 percent of total loans albeit increasing during 2008 to 96 percentThis suggests that the BNDES has increased its market share of lending to non-financialsector since liberalization of the industry and privatization of state government banks
8132019 Government Banking and BRICs in the Recent Financial Crisis
httpslidepdfcomreaderfullgovernment-banking-and-brics-in-the-recent-financial-crisis 2757
983106983122983113983107 983111983151983158983141983154983150983149983141983150983156 983106983137983150983147983155 983137983150983140 983110983145983150983137983150983139983145983137983148 983123983156983137983156983141983139983154983137983142983156
27
BNDES inter-bank lending also increases substantially Since the Real Plan endedinertial inflation in 1994 the BNDES has expanded its market share of interbank lendingfrom 156 billion (324 percent) in 1995 to 530 billion (493 percent) in 2008 during creditshortage and stock market collapse During previous years of financial crisis and economicreversals the BNDES also increased interbank lending significantly For example during the
1999 and 2001 crises BNDES interbank lending increased to 410 percent and 504 percentof total This marked presence in interbank loan market reflects the role of the BNDES inproviding indirect lending to targeted sectors through private foreign and other governmentbanks in Brazil
BNDES Loan Approvals by Program 1995-2007 R$ Billion
Direct Lending 1999 2000 2001 2002 2003 2004 2005 2006 2007 2008 2009--------------------------------------------------------------------------------------------------------------------------------------Finem 51 55 68 133 79 114 132 145 220 285Capital Markets 16 19 09 08 09 06 20 34 35 104Export-Import 23 34 39 77 63 56 67 40 13 32
Sub-Total 91 109 118 219 153 177 220 221 269 424Percent Total (505) (474) (468) (585) (456) (447) (469) (430) (415) (464)
Indirect Lending--------------------------------------------------------------------------------------------------------------------------------------Finem 31 40 37 16 12 16 18 27 51 60Finame 16 25 33 40 53 66 93 107 170 221Finame Agro 07 13 18 30 28 45 21 14 20 27Finame Leasing 00 000 02 02 03 02 04 06 14 16Export-Import 14 23 20 40 56 54 73 97 67 95BNDESautom 18 17 22 24 27 34 36 35 50 55Sub-Total 89 120 134 154 182 220 249 292 379 484Percent Total (495) (526) (532) (415) (544) (553) (531) (570) (585)(536)
BNDES Total 180 230 252 374 335 398 469 513 648 908----------------------------------------------------------------------------------------------------------------Source BNDES statistics by modality available on wwwbndesgovbr
Review of BNDES finance by program suggests the evolution of credit policies from1995 through 2008 and increasing reliance on indirect lending through other financialintermediaries The three major programs of direct finance Financiamento aEmpreendimentos (Business Finance Finem) Mercado de Capitais (Capital Markets) andExport-Import finance remained between 505 percent and 415 percent of total BNDESlending with the exception of 2002 Indirect lending through six broad programs remained
between 495 percent and 585 pecent of total BNDES lending with the exception of 2002Indirect lending programs include Finem business lending Financiamento de Maquinas(Machine Finance Fineme) with agricultural and leasing modalities Export-Import financingand BNDES automatic lending provisions
These trends suggest the realization of competitive advantages over private andforeign banks in Brazil BNDES long term interest rates remained substantially lower thanSelic benchmark overnight inter-bank interest rates throughout this period while the lowercost of small staff and operations of the BNDES made lending at these rates viable Anothercompetitive advantage of the BNDES over private and foreign banks is the developmentbankacutes mandate as manager of funds from the forced savings fund Fundo de Amparo ao
Trabalhador (Worker Asssistance Fund FAT) Constitutionally mandated investments inproductive activities (not government bonds) increased from R$31 billion in 2000 to R$101
8132019 Government Banking and BRICs in the Recent Financial Crisis
httpslidepdfcomreaderfullgovernment-banking-and-brics-in-the-recent-financial-crisis 2857
983106983122983113983107 983111983151983158983141983154983150983149983141983150983156 983106983137983150983147983155 983137983150983140 983110983145983150983137983150983139983145983137983148 983123983156983137983156983141983139983154983137983142983156
28
billion in 2008 comprising 170 percent of BNDES liabilities This means that 170 percentof BNDES finance and lending is based on long-term deposits that provide no liquidity riskThis provides a competitive advantage over private and foreign banks
A closer look at BNDES lending by sector suggests that the bank still focuses
primarily on industry and infrastructure Despite the adoption of second generation reformsthat seek to free market forces and accelerate innovation and productivity through small andmedium enterprises BNDES lending still focuses on large scale industrial and long-terminfrastructure finance In this respect the BNDES embodies a persistent need in developingeconomy for state-led development banking along the lines emphasized by Lewis Myrdaland development economists 50 years ago This traditional sense of commanding heights thusstill captures the role of the BNDES in Brazilian political economy Despite more than twodecades of privatizations financial liberalization bank reforms and a variety of fiscalfinancial and economic reforms that have substantially modernized the domestic Brazilianeconomy and freed market forces the BNDES remains the single most important source forlong-term finance and credit The capitalization of the Bovespa stock market from 2004-
2008 for the first time in Brazilian history reduced the virtual monopoly of BNDES overlong term finance
BNDES Operations approved and invested by Sector 1998-2007 R$billion
1998 1999 2000 2001 2002 2003 2004 2005 2006 2007Industry ----------------------------------------------------------------------------------------------------------------------------approved 96 79 126 152 171 163 145 290 395 402invested 76 84 104 132 174 161 158 234 272 306
Infrastructure ----------------------------------------------------------------------------------------------------------------------approved 116 69 110 65 161 149 137 186 240 369invested 83 66 86 75 130 100 152 171 170 209
Other--------------------------------------------------------------------------------------------------------------------------------approved 18 47 40 54 79 93 117 69 108 126investedTotal --------------------------------------------------------------------------------------------------------------------------------approved 230 195 276 271 411 404 379 545 743 897invested 190 181 230 252 374 335 398 470 513 617
----------------------------------------------------------------------------------------------------------------Source BNDES Annual Reports 2003-2008 and testimony of BNDES President to Congress March 2009
Long-term investments have produced substantial profits at the BNDES The bank hasrecorded profits each year since 1999 increasing from over R$600 million in 1999 overR$32 billion during 2005 reaching over R$73 billion in 2007 The long-term character of
BNDES finance stands in stark contrast to policies at private banks Contrary to strategy ofprivate and foreign banks to trade and hold government paper described in chapter three theBNDES suspended purchase and trading in government paper because of constitutionalmandates to contribute to development and employment Furthermore the turn to capitalmarkets at the BNDES has provided substantial returns since 2004
However this does not mean that BNDES lending protected unproductive industriesInstead of wasting resources to unnecessarily bail out firms or provide crony credit highreturns and strong profits at the BNDES suggest that lending was sound Standard indicatorsof bank performance asset quality and capital reserves against credit and capital risk provideempirical control for this All these measures suggest that the BNDES weathered the periodof adjustment and sustained counter-cyclical investment policies without placing resources atrisk beyond Central Bank of Brazil regulations and BIS guidelines And returns have
8132019 Government Banking and BRICs in the Recent Financial Crisis
httpslidepdfcomreaderfullgovernment-banking-and-brics-in-the-recent-financial-crisis 2957
983106983122983113983107 983111983151983158983141983154983150983149983141983150983156 983106983137983150983147983155 983137983150983140 983110983145983150983137983150983139983145983137983148 983123983156983137983156983141983139983154983137983142983156
29
increased since recovery in 2004 BNDES participation in the booming Bovespa stock marketsince 2003 has provided record returns
The BNDESpar subsidiary that invests in capital markets has also recorded strongreturns during the period of economic growth and into the 2008 financial crisis BNDESparreturns on liquid assets increased from 75 percent in 2004 to 277 percent in 2007 declining
to 245 percent in 2008 Average returns on assets and stock holdings also remained highbuilding the assets held by the BNDESpar subsidiary from 141 billion in 2005 to 359 billionin 2008
This increased participation of the BNDES in capital markets involves new relationsand networks across government private sector labor unions the private pension funds ofgovernment bank and government enterprise employees and financial markets By 2007BNDES participation in stockholding and mutual funds reached across 261 forms and 25mutual funds totaling over R$910 billion reals The BNDES thereby retains broad portfoliothat represents institutional foundations of comparative advantage Furthermore unlike thepolicy of private and foreign banks to trade and hold high interest rate paying short termgovernment paper during the sudden stop of foreign finance and downturn in the Brazilian
business cycle (2002-3) the BNDES expanded credit operations and reduced financialoperations in secondary markets for indexed government paper This countered the perverseimpact of the liquidity preference among private and other government banks that increasedmarket pressures and led to shorter terms and higher cost of Brazilian government debt
BNDES aversion of government paper is required by constitutional mandate tomanage forced savings funds in ways that generate employment and income As noted alarge part of BNDES resources (liabilities) are from domestic official savings programs Thevalue of FAT resources increased from R$492 billion in 2003 to R$662 billion in 2005while the PIS-Pasep fund remained at approximately R$200 billion Foreign capital has alsobeen channeled to the BNDES through multilateral agencies and foreign bond issues Foreignloans to the BNDES have declined Multilateral agencies provided R$70 billion in 2003increased funding to R$129 billion during 2004 and continued to provide R$107 billion tothe BNDES during 2005
Comparison of BNDES structure and performance with development banks abroadsuggests both the large scale and scope of BNDES operations and controls formismanagement and political abuse of the bank In 2007 BNDES total assets are almostdouble the value reported by the Inter-American Development Bank (IADB) over frac12 thevalue of total assets held by the World Bank and almost ten times the value of assets held bythe French government development bank CAF Furthermore profits and loans from theBNDES far exceeded all three institutions The US$330 billion in loans reported by theBNDES far exceed the US$67 billion from the IADB the US$110 reported by the World
Bank and US$58 billion reported by the CAF BNDES profis returns on assets and return onliquid patrimony also far exceeded those reported by these three development banks thatserve as comparative control over performance and policies at the BNDES Finally lateloans at the BNDES remained at 011 percent of total loans well below levels reported by theWorld Bank comparable to the 010 percent reported by the IADB while considerably abovethe 001 percent reported by CAF
8132019 Government Banking and BRICs in the Recent Financial Crisis
httpslidepdfcomreaderfullgovernment-banking-and-brics-in-the-recent-financial-crisis 3057
983106983122983113983107 983111983151983158983141983154983150983149983141983150983156 983106983137983150983147983155 983137983150983140 983110983145983150983137983150983139983145983137983148 983123983156983137983156983141983139983154983137983142983156
30
Comparison of BNDES and Regional Development Banks 2007 US$ billion
BNDES IADB World Bank CAF----------------------------------------------------------------------------------------------------------------Total Assets 1144 699 2080 125
Liquid Patrimony 140 203 399 41Liquid Profits 38 01 -01 04Desembolsos 339 67 110 58Credit Portfolio 928 479 978 95Capitalization percent 123 291 192 328Return on Assets percent 38 47 na 36Return on PL percent 332 07 na 105Late Loans percent 011 010 086 001----------------------------------------------------------------------------------------------------------------Source BNDES Annual Report 2007
The large scale of BNDES lending and finance make it possible for governmentpolicy to provide counter cyclical credit to avert or ameliorate economic downturns andsubstitute private and foreign credit shortages In March 2009 testimony to Congress ongovernment policies during financial crisis BNDES President Coutinho argued that bankpolicy was to reduce the cost and increase the supply of credit Resources for counter cyclicallending during 2008-2009 came from Treasury loans to BNDES released by provisionaldecrees 439 and 414 summing R$175 billion transfer of R$60 billion in CVS funds sale ofFGTS Investment Fund and bank certificates summing R$170 billion Furthermore the thirdphase of conditional credit facility shared by Inter-American Development Bank and theBNDES provided the last tranch of a total US$60 billion for BNDES operations
Two further means were used by the BNDES to infuse capital during the collapse of
the stock market and shortage of credit during 2007-8 The counter cyclical policies of theBNDES can also be seen in the over two fold increase of BNDES holdings in private equityand investment funds Table 512 reports the value of private equity and investment fundholdings of the BNDES in 2007 and 2008 BNDES funds in private equity and mutual fundsincreased from R$4038 million in 2007 to over R$10 billion in 2008 The capitalization ofmutual funds and private equity firms by the BNDES also played an important countercyclical role during this period
BNDESpar Shareholding 2007-8 R$million
Percent Value ValueShares 2008 2007
----------------------------------------------------------------------------------------------------------------Ameacuterica Latina Logiacutestica 106 6386 -Aracruz 55 1292 1292Banco do Brasil 25 10854 12752Bom Gosto (2) 345 2458 -Brasil Telecom Part 30 1666 1958Braskem 52 2275 2432Brenco 209 1400 -CEG 345 1406 -CESP 57 2347 1397Coteminas 103 1150 1340
CPFL Energia 62 6081 5506Cia Sideruacutergica Nacional 36 1513 2686CVRD 40 15082 7098
8132019 Government Banking and BRICs in the Recent Financial Crisis
httpslidepdfcomreaderfullgovernment-banking-and-brics-in-the-recent-financial-crisis 3157
983106983122983113983107 983111983151983158983141983154983150983149983141983150983156 983106983137983150983147983155 983137983150983140 983110983145983150983137983150983139983145983137983148 983123983156983137983156983141983139983154983137983142983156
31
ELETROBRAacuteS (1) 118 22400 22400EMBRAER 50 1096 1096Gerdau 35 1533 490Independecircncia 139 2500 -JBS 130 14722 11370Klabin 202 5621 -
Light 336 8225 -Marfrig 146 8176 1020MPX Mineraccedilatildeo 26 1791 1791Ouro Fino 200 1057 840Paranapanema 175 1252 08Petrobraacutes 76 10226 10226Rede Energia SA 253 2633 -Tele Norte Leste Participaccedilotildees 16 1645 1645Valepar 97 26254 15585Subtotal 163055 102941Other firms 12223 12606Total 175278 115548----------------------------------------------------------------------------------------------------------------
Source BNDESpar Financial Statements 2008 pp
The BNDES also holds blocks of shares in many major Brazilian corporationsthrough its participation subsidiary BNDESpar Comparing value of investments in 2007 and2008 suggests that large purchases capitalized firms precisely as financial crisis and downturnin Bovespa stock market made it difficult for firms to find working capital Table X reportsthe percent of total company shares held by the BNDES and their respective market values(adjusted for risk of future losses) at year end 2007 and 2008 During this year of extremelyshort and expensive credit in Brazil caused by the international financial and banking crisisthe BNDES increased shareholding by over R$60 billion reals in 28 private Brazilianenterprises Further shareholding classified as X in Five firms (Bertin 269 Brasiliana 538
Copel 239 Rio Poliacutemeros 250 Telemar 313) Once again the BNDES provided access tocapital for firms caught in the sudden credit crunch and stock market collapse unable to meetobligations or raise funds through equity issues or commercial bank credit This countercyclical role of government banks has been critical in Brazil since the 19 th century
BNDESpar Private Equity and Fund Participation 2007-2008 R$million
Fund Manager 2008 2007-------------------------------------------------------------------------------------------------------------------------Brasil 21 Dynamo 46 60PROT Mellon Financial Services 4628 -
Logiacutestica Brasil Bradesco 135 -Fire BrasilPrivate 269 250FIPGG Governanccedila amp Gestatildeo Inv 289 311Opportunity Equity Partners Mellon Financial Services 1046 578Brasil Energia Bradesco 1184 655InfraBrasil ABN-Amro 677 251Rio Bravo Cinema Rio Bravo 116 110Brascan Petro amp Gaacutes Bank Brascan 136 113AG Angra Infra-Estrutura Bradesco 380 301Satildeo Paulo Metro Fund Bradesco 791 831Other Funds 653 572Total 10356 4038---------------------------------------------------------------------------------------------------------------------------
Source BNDESpar Financial Statements 2008
8132019 Government Banking and BRICs in the Recent Financial Crisis
httpslidepdfcomreaderfullgovernment-banking-and-brics-in-the-recent-financial-crisis 3257
983106983122983113983107 983111983151983158983141983154983150983149983141983150983156 983106983137983150983147983155 983137983150983140 983110983145983150983137983150983139983145983137983148 983123983156983137983156983141983139983154983137983142983156
32
Finally Brazilian federal government triennial plans include investment targets by theBNDES If current plans are compared to 2004-7 investments several structural changes inBNDES lending appear First BNDES plans for Oil and Petroleum production reveal aprofound change for Brazilian political economy In 1990 roughly 45 percent of oilconsumed in Brazil was imported In 2007 before oil price increased reversed the balance
Brazil reported domestic production levels sufficient to meet domestic consumptionFurthermore discoveries of substantial deep sea oil reserves have led the BNDES to planmassive investments involving Petrobras and other global petroleum firms For the 2009-2012 period investments in petroleum and gas (R$2697 billion) Petrochemicals (237) andEthanol (197) sum to over R$3130 billion
BNDES Triennial Investment Plans 2004-2012
2004-7 2007-10 2008-11 2009-12----------------------------------------------------------------------------------------------------------------Petroleum amp Gas 1472 1836 2028 2697
Mining 472 527 813 480Petrochemicals 64 174 264 237Steel 198 371 312 245Automotive 150 176 264 235Electronics 143 156 140 240Ethanol 166 205 205 197Paper amp Celulose 104 200 274 90Health 51 46 51 80Industry Total 2816 3802 4437 4501----------------------------------------------------------------------------------------------------------------Source BNDES Annual Reports 2002-2006
It is of note that President Dilma Roussef was instrumental in reducing the targets for2009-12 in petroleum and gas given indications that Petrobras and existing framework foroffshore oil prospecting and production proved unable to increase investments accordingly
The BNDES also retains a presence in government projects by providing managementassistance During 2008 BNDES staff provided management support for implementation of192 projects involving R$710 billion of total R$142 billion PT government growthacceleration projects BNDES staff also participated in the design management andimplementation of President Lularsquos Poliacutetica de Desenvolvimento Produtivo (Policy forProduction Development) involving R$2100 billion targeting production chains designed tomaximize employment and regional development benefits Finally the BNDES was alsocharged to create and co-manage a Fundo Amazonia with the Ministry of Environment toprovide incentives to reduce deforestation of the Amazon region BNDES Plans for 2009include completion of concession for construction of high speed train line and service for Riode Janeiro-Satildeo Paulo corridor two blocks of highway concession sales involving three majorhighways in each block of sales sale of management concessions for regional airports andthe reorganization of INFRAERO federal government airport management company
These policies reflect the goal of BNDES policy to launch firms on the stock marketrather than maintain direct credit and finance Exceptions during 2008 involve Auto andEthanol industies both for strategic and broader policy reasons Given the sharp downturn inauto sales during fourth quarter 2008 the BNDES provided significant lending to avert
further downsizing or failure of auto companies in Brazil Given the current globalredistribution of automobile production BNDES policies are designed to help the Brazilian
8132019 Government Banking and BRICs in the Recent Financial Crisis
httpslidepdfcomreaderfullgovernment-banking-and-brics-in-the-recent-financial-crisis 3357
983106983122983113983107 983111983151983158983141983154983150983149983141983150983156 983106983137983150983147983155 983137983150983140 983110983145983150983137983150983139983145983137983148 983123983156983137983156983141983139983154983137983142983156
33
operations of major auto firms through the period of adjustment and increase theattractiveness of domestic operations in global production strategies of multinational autocompanies Ethanol production also received massive funds to sustain an industry seen ascritical for alternative and sustainable fuel source capable of replacing petroleum Ethanolreached over 50 percent of automotive fuel sales in 2007
Under the Lula government (2003-10 the BNDES also resumed lending to state andmunicipal governments Since the renegotiation of municipal and state government debts inthe late 1990s states and municipalities have been largely prohibited from taking on debtThis was emplematic of the recentralization required to control fiscal excesses during militaryrule and the prolonged period of transition to democracy Policies during the 1990s weredesigned to avert overspending seen as critical to maintain price stability under the Real Plan(1994) In 2000 the Lei de Responsibilidade Fiscal (Fiscal Responsibility Law) largelyprohibited credit and finance to state and municipal governments Since 2000 municipalitiesand states have been required to submit detailed budget statements that in turn have been thebasis for a gradual return to sub-national government finance In August 2006 central bankand Treasury regulations freed municipalities to take on credit up to 12 times liquid receipts
Since then the BNDES has led in terms of credits and finance to subnational governmentsthrough a Programa Especial de Financiamento aos Estados e Distrito Federal
The BNDES also has developed the first system in Brazil for risk analysis ofmunicipal governments and has led in the market for municipal credit freed by August 2006procedures for approval at Treasury the Central Bank and Conselho Monetaacuterio Nacional(National Monetary Council) Prosecution of mayors and firms charged with managingmunicipal credits with the BNDES revealed fraudulent practices These funds for sub-national public finance also became critical mechanisms to counter severe budget shortfallscaused by financial crisis during 2008 Given that municipal and state government tax basesare shallow and that federal government transfers provide the bulk of sub-nationalgovernment resources the Lula administration allocated R$ 40 billion to the Fundo deParticipaccedilatildeo dos Estados (State Participation Fund) through a Programa Emergencial deFinanciamento (Emergency Finance Fund) administered by the BNDES
In sum the BNDES expanded credit and finance operations substantially during fouryears of sustained growth from 2004-2007 And having helped underwrite the stock marketboom and capitalized Brazilian firms directly and indirectly through credit finance mutualfunds and private equity funds the BNDES retained sufficient scale scope and capital baseto provide counter cyclical credit and finance to help firms adjust to financial crisis and creditshortage during 2008 In retrospect the growth of the BNDES since liberalization andprivatizations of state government banks in the 1990s suggest the comparative advantages of
development banking BNDES credit and finance fell to 52 percent of fixed capitalformation in 1995 Since then the turn to neo-developmentalism and a period of sustainedeconomic growth during the Lula administration increased the BNDES share of total fixedcapital formation during 2006 and 2007 to 126 and 141 percent Critics charge thatmonopoly over FGTS and PIS-PASEP official savings funds as liabilities provide theBNDES with unfair competitive advantage over private banks In 2008 forced savings fundssummed to only 17 percent of BNDES liabilities (resources) The BNDES does not relyexclusively on forced savings for competitive advantage Instead market-oriented policies
joint-ventures with private mutual funds investment funds private equity firms large blocksof shareholding in Brazilian firms and massive amounts of credit and investment to theprivate sector at below market but still profitable long term interest rates of 625 percent
suggest that the large scale and scope of BNDES operations provide institutional foundationsof competitive advantage over private and foreign banks
8132019 Government Banking and BRICs in the Recent Financial Crisis
httpslidepdfcomreaderfullgovernment-banking-and-brics-in-the-recent-financial-crisis 3457
983106983122983113983107 983111983151983158983141983154983150983149983141983150983156 983106983137983150983147983155 983137983150983140 983110983145983150983137983150983139983145983137983148 983123983156983137983156983141983139983154983137983142983156
34
Capitalization of the BNDES by Treasury of over R$2300 billion 2009-11hascaptured attention of many observers of Brazilian development Critics and advocates agreethat the BNDES has realized significant competitive advantages over private and foreignbanks and continues to serve as significant alternative to capital markets for large scaledevelopment projects However like the downturn in planned investments by Petrobras for
oil and gas exploration and production BNDES decreased planned investments fromR$1684 billion in 2010 to R$1397 billion in 2011 We believe this indicates the limits ofmanagement and passing of period of crisis both favoring finance from capital marketsbanks and public-private partnerships
India
Analysis of Brazilian federal banks suggests that these institutions provided policy alternativewhile realizing competitive advantage over private and foreign banks The modernization ofthese institutions helps explain why these large institutions were able to stay the effects ofcredit crunch and financial market downturn in Brazil This section explores data from the
Reserve Bank of India to compare market shares of types of banks from 1972-2008 and bankperformance from 2006-10 Further analysis will be required However the data appears tosupport our core argument that government banks have modernized and realized competitiveadvantages over private and foreign banks
First the number of branch offices which serves as a measure of institutionalcoverage across India of special concern for financial inclusion and the theory thatliberalization and privatizations would lead private banks to expand branch offices andincrease the supply of services From this perspective the trajectory of branch officessuggests that nationalized banks the State Bank of India and regional rural bankssustain much larger networks of branch offices that predominate while otherscheduled commercial (private and foreign) banks retain less than 8000 branch offices
Data from the Reserve Bank of India on the number of current accounts retainedby type of bank provide further evidence that the State Bank of India and its associates
8132019 Government Banking and BRICs in the Recent Financial Crisis
httpslidepdfcomreaderfullgovernment-banking-and-brics-in-the-recent-financial-crisis 3557
983106983122983113983107 983111983151983158983141983154983150983149983141983150983156 983106983137983150983147983155 983137983150983140 983110983145983150983137983150983139983145983137983148 983123983156983137983156983141983139983154983137983142983156
35
national banks and regional rural banks provide the bulk of banking accounts to theIndian population while private and foreign banks cherry pick upscale urban marketsreproducing capital drain and inequalities
Number of Current Accounts by Type of Bank 1972-1995
Since 1999 the pattern of predominance by alternative banking institutions and the minorrole of other scheduled commercial banks and foreign banks continues
The following figures report the value held in current accounts by type of banks first fromthe 1972-1995 period then from the 1999-2008 period For both time periods the trendconfirms that private and foreign banks remain at a competitive disadvantage in terms of thebroader market while the State Bank of India and its associates nationalized banks andregional rural banks tend to predominate
8132019 Government Banking and BRICs in the Recent Financial Crisis
httpslidepdfcomreaderfullgovernment-banking-and-brics-in-the-recent-financial-crisis 3657
983106983122983113983107 983111983151983158983141983154983150983149983141983150983156 983106983137983150983147983155 983137983150983140 983110983145983150983137983150983139983145983137983148 983123983156983137983156983141983139983154983137983142983156
36
Current Account Value by Type of Bank 1972-1995 R
Number of Deposit Accounts by type of bank 1999-2008
A similar pattern appears for the trajectory of savings accounts both the number of
accounts and the value held in savings accounts both for the 1972-1995 period We wereunable to organize data from the more recent period
8132019 Government Banking and BRICs in the Recent Financial Crisis
httpslidepdfcomreaderfullgovernment-banking-and-brics-in-the-recent-financial-crisis 3757
983106983122983113983107 983111983151983158983141983154983150983149983141983150983156 983106983137983150983147983155 983137983150983140 983110983145983150983137983150983139983145983137983148 983123983156983137983156983141983139983154983137983142983156
37
Number of Savings Accounts by Type of Bank 1972-1995
Value in Savings Accounts by Type of Bank 1972-1995
Number of Term Savings Accounts by Type of Bank 1972-1995
8132019 Government Banking and BRICs in the Recent Financial Crisis
httpslidepdfcomreaderfullgovernment-banking-and-brics-in-the-recent-financial-crisis 3857
983106983122983113983107 983111983151983158983141983154983150983149983141983150983156 983106983137983150983147983155 983137983150983140 983110983145983150983137983150983139983145983137983148 983123983156983137983156983141983139983154983137983142983156
38
Value in Term Savings Accounts by Type of Bank 1972-1995
The number and value of credits extended by banks from 1999-2008 appears mostpromising in terms of comparative analysis of bank performance and behavior Thesignificant spread at the end of the time series between the State Bank of India and itsassociates and foreign banks suggests the impact of foreign financial crisis and differentdomestic policies by these types of banks in India similar to that noted in the Brazilianexperience
Number of credits by type of bank 1999-2008
Value of credit by type of bank 1996-2008
8132019 Government Banking and BRICs in the Recent Financial Crisis
httpslidepdfcomreaderfullgovernment-banking-and-brics-in-the-recent-financial-crisis 3957
983106983122983113983107 983111983151983158983141983154983150983149983141983150983156 983106983137983150983147983155 983137983150983140 983110983145983150983137983150983139983145983137983148 983123983156983137983156983141983139983154983137983142983156
39
Further data from the Reserve Bank of India from 2008-10 permit closercomparison of government private and foreign banks in the recent financial crisis Interms of deposits investments total assets and net profits the dominant and expandingrole of government banking in India is apparent Further control variables (not reported)
include gross and net NPA types of income expenses and expenditures provisions andcontingencies and credit- and investment-deposit ratios provide control for bad bankingand confirm the counter cyclical policies during 2008-10 in India
THE FOLLOWING TABLES REQUIRE INTERPRETATION
Number of Banks 2006-7 2007-8 2008-9 2009-10 2010-11
State Bank of India amp Associates 8 8 7 7 6Nationalized Banks 20 20 20 20 20Old Private Sector Banks 17 15 15 15 14
New Private Sector Banks 8 8 7 7 7Foreign Banks 29 28 31 32 33Source RBI A Profile of Banks 2010-11
Number of Branch Offices 2006-7 2007-8 2008-9 2009-10 2010-11
State Bank of India amp Associates 14673 15848 16894 18178 18772Nationalized Banks 37435 39255 40956 43452 45640Old Private Sector Banks 4723 4690 4908 5220 5011New Private Sector Banks 2599 3635 4333 5232 6957
Foreign Banks 272 277 295 308 316Source RBI A Profile of Banks 2010-11
Number of Employees 2006-7 2007-8 2008-9 2009-10 2010-11
State Bank of India amp Associates 255699 249008 268598 266605 282453Nationalized Banks 473179 466400 462926 473041 475082Old Private Sector Banks 47994 48700 51341 55052 55075New Private Sector Banks 91060 110123 124998 127468 163604Foreign Banks 28426 31301 29582 28012 27968
Source RBI - India BanksAssociation
Business per employee (in lakh) 2006-7 2007-8 2008-9 2009-10 2010-11
State Bank of India amp Associates 43635 54922 65022 73743 79306Nationalized Banks 49001 61828 78316 93586 114477Old Private Sector Banks 48159 56932 63843 69749 8149New Private Sector Banks 80782 83196 78715 84041 82607Foreign Banks 97477 11255 128274 141139 155974Note Business = Deposits + Advances
8132019 Government Banking and BRICs in the Recent Financial Crisis
httpslidepdfcomreaderfullgovernment-banking-and-brics-in-the-recent-financial-crisis 4057
983106983122983113983107 983111983151983158983141983154983150983149983141983150983156 983106983137983150983147983155 983137983150983140 983110983145983150983137983150983139983145983137983148 983123983156983137983156983141983139983154983137983142983156
40
Profit per employee (in lakh) 2006-7 2007-8 2008-9 2009-10 2010-11
State Bank of India amp Associates 257 362 443 466 42Nationalized Banks 287 377 486 567 695Old Private Sector Banks 234 406 469 42 563New Private Sector Banks 587 685 677 847 893Foreign Banks 1613 2112 2539 1692 2759
Capital amp Reserves amp Surplus(Ycrore) 2006-7 2007-8 2008-9 2009-10 2010-11
State Bank of India amp Associates 42941 61706 72422 83726 84394Nationalized Banks 92689 113079 135920 157276 205857Old Private Sector Banks 10736 15315 17477 20171 23821New Private Sector Banks 39736 76056 82192 99813 114768Foreign Banks 33075 49332 59937 69176 80972
Deposits Ycrore 2006-7 2007-8 2008-9 2009-10 2010-11
State Bank of India amp Associates 633476 773875 1007041 1108086 1245862Nationalized Banks 1360724 1679993 2105706 2583934 3127122Old Private Sector Banks 138249 165589 199274 229897 264157New Private Sector Banks 413738 509444 537104 592904 738602Foreign Banks 150750 191161 214076 232099 240689
Investments Ycrore 2006-7 2007-8 2008-9 2009-10 2010-11
State Bank of India amp Associates 211875 263823 357624 387473 385697Nationalized Banks 452981 536018 655042 828125 942837Old Private Sector Banks 43647 54080 72393 83499 92617New Private Sector Banks 171008 224498 234139 270618 329403Foreign Banks 71471 98910 130354 159291 165499
Advances Ycrore 2006-7 2007-8 2008-9 2009-10 2010-11
State Bank of India amp Associates 482270 593722 739450 857937 994154Nationalized Banks 957877 1203678 1519762 1843082 2311478
Old Private Sector Banks 92887 111670 128504 154085 184647New Private Sector Banks 321865 406733 446824 478356 612886Foreign Banks 126339 161133 165385 163260 195539
Interest Income Ycrore 2006-7 2007-8 2008-9 2009-10 2010-11
State Bank of India amp Associates 53465 70428 89196 97954 109828Nationalized Banks 110720 142647 183892 208029 256490Old Private Sector Banks 11474 14614 18790 20497 23299New Private Sector Banks 38092 56377 66282 62309 73528
Foreign Banks 17924 24417 30322 26390 28520
8132019 Government Banking and BRICs in the Recent Financial Crisis
httpslidepdfcomreaderfullgovernment-banking-and-brics-in-the-recent-financial-crisis 4157
983106983122983113983107 983111983151983158983141983154983150983149983141983150983156 983106983137983150983147983155 983137983150983140 983110983145983150983137983150983139983145983137983148 983123983156983137983156983141983139983154983137983142983156
41
Other Income Ycrore 2006-7 2007-8 2008-9 2009-10 2010-11
State Bank of India amp Associates 9420 11818 16073 18394 19240Nationalized Banks 14264 20979 26394 30500 28625Old Private Sector Banks 1568 2184 2782 3152 3029
New Private Sector Banks 10745 14822 15078 17271 17697Foreign Banks 7044 10588 14894 9951 10972
Interest Expended Ycrore 2006-7 2007-8 2008-9 2009-10 2010-11
State Bank of India amp Associates 32607 47809 61770 66229 67018Nationalized Banks 69353 101093 131676 145712 164135Old Private Sector Banks 7055 9960 12834 14076 14768New Private Sector Banks 25802 38535 44123 37130 42347Foreign Banks 7603 10604 12819 8938 10622
Operating Expenses Ycrore 2006-7 2007-8 2008-9 2009-10 2010-11
State Bank of India amp Associates 15987 16993 20088 25283 29146Nationalized Banks 27268 29670 35416 40792 53819Old Private Sector Banks 2967 3235 3939 4715 5600New Private Sector Banks 12353 17032 17840 18136 22006Foreign Banks 7745 10353 12298 11102 12557
Cost of Funds 2006-7 2007-8 2008-9 2009-10 2010-11
State Bank of India amp Associates 475 59 594 532 48Nationalized Banks 48 582 609 537 493Old Private Sector Banks 498 62 667 613 55New Private Sector Banks 524 611 604 442 427Foreign Banks 403 433 446 283 311Cost of Funds = Ratio () of interest paid on deposits and borrowings to averageof opening and closing balances of deposits and borrowings
Return on advances adjusted toCoF 2006-7 2007-8 2008-9 2009-10 2010-11
State Bank of India amp Associates 372 365 395 36 405Nationalized Banks 399 369 409 382 427Old Private Sector Banks 406 426 515 482 492New Private Sector Banks 447 505 526 514 516Foreign Banks 574 66 815 716 564
2006-7 2007-8 2008-9 2009-10 2010-11
8132019 Government Banking and BRICs in the Recent Financial Crisis
httpslidepdfcomreaderfullgovernment-banking-and-brics-in-the-recent-financial-crisis 4257
983106983122983113983107 983111983151983158983141983154983150983149983141983150983156 983106983137983150983147983155 983137983150983140 983110983145983150983137983150983139983145983137983148 983123983156983137983156983141983139983154983137983142983156
42
Wages as of Total Expenses
State Bank of India amp Associates 2155 1589 1506 171 1921Nationalized Banks 1794 1405 1331 1365 1641Old Private Sector Banks 1689 1367 1326 1457 1675
New Private Sector Banks 936 956 1017 121 1383Foreign Banks 2008 1995 1944 2348 2331
Returns on Assets 2006-7 2007-8 2008-9 2009-10 2010-11
State Bank of India amp Associates 086 097 102 091 079Nationalized Banks 094 101 103 100 103Old Private Sector Banks 078 114 115 095 112New Private Sector Banks 109 113 112 138 151Foreign Banks 228 209 199 126 174
Capital Adequacy Ratio 2006-7 2007-8 2008-9 2009-10 2010-11
State Bank of India amp Associates 1232 1321 1396 1346 1225Nationalized Banks 1237 1213 1324 1318 1347Old Private Sector Banks 1208 1408 1476 1485 1456New Private Sector Banks 1199 1439 1533 1803 1687Foreign Banks 1239 1305 1432 1726 1672Note To 2007-8 = Basel I From 2008-09 = Basel-II
Net NPA Ratio 2006-7 2007-8 2008-9 2009-10 2010-11
State Bank of India amp Associates 132 143 147 150 149Nationalized Banks 094 077 068 091 092Old Private Sector Banks 096 066 09 082 053New Private Sector Banks 097 109 129 103 056Foreign Banks 073 077 181 182 067Net NPA Ratio = Net non-performing assets as net advances
In sum descriptive data from the Reserve Bank of India confirm the anomaly
and argument drawn from the Brazilian experience An important dimension of BRICcountry recovery from the global financial crisis and downturn is the counter cyclicallending policies and realization of competitive advantages of government banks Thisposes a series of new questions for business schools and scholars of public policyInstead of liberalization and privatization leading to transitions in BRIC countriestoward capital market centered financial systems and liberal market economies publicbanks have realized competitive advantages over private and foreign banks whileproviding policy alternatives to BRIC governments in the face of financial crisis andglobal economic slowdown We return to these implications in the conclusion
One development of note at the Reserve Bank of India is a policy focus onfinancial inclusion The 2008 report of the Committee on Financial Inclusion has beenfollowed by sections of the Reserve Bank of India Annual Report reserved fordiscussion of financial inclusion And instead of focusing on liberalization and
8132019 Government Banking and BRICs in the Recent Financial Crisis
httpslidepdfcomreaderfullgovernment-banking-and-brics-in-the-recent-financial-crisis 4357
983106983122983113983107 983111983151983158983141983154983150983149983141983150983156 983106983137983150983147983155 983137983150983140 983110983145983150983137983150983139983145983137983148 983123983156983137983156983141983139983154983137983142983156
43
privatization to ensure the spread of banking products and services alternative policieshave been explored One is of special note The Committee on Financial Inclusionrecommended issue of identity cards as bank cards This would profoundly change thelandscape of banking in India and has attracted attention from analysts at the CentralBank of Brazil charged with financial inclusion as well as the President of Indonesia
and apparently Uganda officials Given the revolution in information and card paymenttechnologies this policy proposal and pilot studies deserve close attention asalternatives to dramatically increase the pace of social inclusion of the bankless
8132019 Government Banking and BRICs in the Recent Financial Crisis
httpslidepdfcomreaderfullgovernment-banking-and-brics-in-the-recent-financial-crisis 4457
983106983122983113983107 983111983151983158983141983154983150983149983141983150983156 983106983137983150983147983155 983137983150983140 983110983145983150983137983150983139983145983137983148 983123983156983137983156983141983139983154983137983142983156
44
China
This section turns to a brief review of the Chinese banking sector to further explore therole of government banks in terms of their modernization competitive advantages
policy roles and capacity for counter cyclical credit that help explain why BRICcountries were able to avert the severe consequences of the global financial crisis
First figure A11 reports the basic structure of the banking system in China
Although we have been unable to compare the evolution of types of banks acrosstime in similar ways to the above data on India taken from the Reserve Bank of Indiaour research assistants have gathered the following comparative macroeconomicfinancial and balance sheet data on banking in China The data appear to be consistentwith the core argument presented in this paper ndash that government banks havemodernized since liberalization and provided policy makers with alternative means tocounter the effects of financial crisis abroad
8132019 Government Banking and BRICs in the Recent Financial Crisis
httpslidepdfcomreaderfullgovernment-banking-and-brics-in-the-recent-financial-crisis 4557
983106983122983113983107 983111983151983158983141983154983150983149983141983150983156 983106983137983150983147983155 983137983150983140 983110983145983150983137983150983139983145983137983148 983123983156983137983156983141983139983154983137983142983156
45
We lack more current information and were unable to collect data directly fromofficial sources in China to compare the trajectory of state owned private and foreignbanks As a substitute Figure 1 reports data from 2000-4 that permits initial observationof trends for this earlier period
Those present may not need reminding of the formidable record of economicgrowth in China during this 200-4 period that continues until today However data fromthe National Bureau of Statistics suggests that the Chinese banking system expanded atan even greater pace than the remarkable levels of GDP growth recorded for the 2000-4period Furthermore credit expansion was ldquoorganicrdquo in the sense that deposits
outpaced credit growth from 2000-4
Expansion of Loans in China 1999-2004
Loan Growth Total LoansYear on Year
Growth Total Depositssup1Year on Year
GrowthYear CNY billion CNY () CNY billion CNY()1999 9373 83 10878 1372000 9937 60 1238 1382001 11231 130 14362 1602002 13129 169 17092 1902003 159 211 20806 217
2004 18857 186 25319 217
sup1Based on preliminary estimates by the National Bureau of Statistics of the Peoplersquos Republic of ChinaSource National Bureau of Statistics of the PRC
Although we lack data comparable to that from the Reserve Bank of India ableto compare the trajectory of state private and foreign banks in China the sectoralbreakdown of loans and other banking and national account data confirms the profoundcapitalization of the Chinese banking system and GDP growth during from 1995-2004
8132019 Government Banking and BRICs in the Recent Financial Crisis
httpslidepdfcomreaderfullgovernment-banking-and-brics-in-the-recent-financial-crisis 4657
983106983122983113983107 983111983151983158983141983154983150983149983141983150983156 983106983137983150983147983155 983137983150983140 983110983145983150983137983150983139983145983137983148 983123983156983137983156983141983139983154983137983142983156
46
China Banking Sector Market Dimensions (1995 - 2004)
YearTotal
LoansCorp
LoansConsuLoans
HomeLoans
TotalDeposits Excess
GovBonds
CorpBonds GDP
GDPGrowth
()1995 52310 mdash mdash mdash 5376 145 330 65 5848 2511996 63100 mdash mdash mdash 6847 538 436 60 6788 1611997 73585 7341 17 130 8212 853 551 52 7446 971998 85002 8447 53 430 9529 102 9 777 68 7835 521999 95587 9394 164 1360 10831 1273 1054 78 8207 482000 108763 10453 424 3320 13486 261 1302 86 894 892001 118990 112 699 5600 15472 3573 1562 101 9593 732002 139800 12913 1067 8258 18339 4359 mdash mdash 10479 922003 169770 15401 1576 13302 22036 5059 mdash mdash 11669 1142004 194220 16848 1988 15800 25319 5897 mdash mdash 13657 170Figures = CNYB
This data reported in terms of percent GDP provides further clarity on the rapid
capitalization of loans It is of note that the bulk of loans during this period were to thecorporate sector with consumer and home loans lagging significantly
China Banking Sector Percent GDP
YEARTotal
LoansCorporate
LoansConsumer
LoansHomeLoans Deposits
ExcessDeposits
GovBonds
CorpBonds
1995 895 00 00 00 919 25 56 111996 929 00 00 00 1009 79 64 091997 988 986 02 02 1103 115 74 071998 1085 1078 07 05 1216 131 99 091999 1165 1145 20 17 1320 155 128 092000 1217 1169 47 37 1508 292 146 102001 1240 1167 73 58 1613 372 163 112002 1334 1232 102 79 1750 4162003 1455 1320 135 114 1888 4342004 1422 1234 146 116 1854 432
Sources China Banking Regulatory Commission Peoplersquos Bank of China and GoldmanSachs research estimates
Compilation of financial data from a select number of banks in China suggeststhat the pattern of bank change encountered in Brazil and India also describes theexperience of China The liberalization of the Chinese economy and the modernization
of state banks appear to describe the process of bank change instead of a process oftransition toward private banking and capital market centered financial systemAlthough we have been unable to draw data from Chinese monetary authorities thebalance sheet data suggests the clear predominance of large state banks in the politicaleconomy of banking and finance in China How these institutions were used to counterthe effects of financial crisis abroad and redirect domestic investment production andconsumption must remain a subject for further research
8132019 Government Banking and BRICs in the Recent Financial Crisis
httpslidepdfcomreaderfullgovernment-banking-and-brics-in-the-recent-financial-crisis 4757
983106983122983113983107 983111983151983158983141983154983150983149983141983150983156 983106983137983150983147983155 983137983150983140 983110983145983150983137983150983139983145983137983148 983123983156983137983156983141983139983154983137983142983156
47
Select Financial Data from Chinese Banks 2004()
CNY (billion)Total
AssetsGrossLoans
CustomerDeposits Equity
NPLRatio
()
Pre-prov
ProfitsNet
Profits
State Banks
ICBC 5671 3705 5105 163 190 653 23CCB 3905 2226 3489 195 39 605 484ABC (NA) mdashBOC 427 2146 3342 205 51 578 209Quasi-State
BoCom 1145 639 1023 54 30 131 16CMB 587 376 513 22 29 82 32CITIC Industrial 515 306 429 20 60 52 03SPDB 456 311 397 14 24 62 20China Everbright mdashGuangdong Development 345 216 301 mdash mdash mdash 32
Industrial Bank 341 203 283 10 25 37 11Quase-Private
Bank of Shanghai 216 106 179 83 51 32 26Hua Xia 304 181 270 92 40 29 10Shenzhen Development 198 126 166 43 114 28 03Bank of Beijing 209 85 174 71 mdash 26 07
Sector total 19422 25319 129Three state-banks 2692 3979 188Second tier banks 2549 3733 148
ABC = Agriculture Bank of China BOC = Bank of China
BOCOM = Bank of Communications CCB = China Construction BankCMB = China Merchantrsquos Bank CNY = yuanICBC = Industrial and Commercial Bank of ChinaNPL = nonperforming loanROA = return on assets ROE = return on equityprov = provisioningPRC = Peoplersquos Republic of ChinaSPDB = Shanghai Pudong Development BankNote Loan and deposit market share for BOC and ICBC are for their domestic operations onlySources Company data Goldman Sachs research estimates
Returns on Assets Equity and Domestic Market Shares of Major China Banks 2004()
CNY (billion) ROA () ROE ()Deposit Mkt
Share ()Loan MktShare ()
Mortgage MktShare()
State Banks
ICBC 004 14 199 187 253CCB 130 254 138 115 217ABC (NA)BOC 051 102 101 89 152Quasi-State
BoCom 015 45 37 29 34CMB 060 161 20 19 29
CITIC Industrial 007 17 17 16 18SPDB 048 153 16 16 26
8132019 Government Banking and BRICs in the Recent Financial Crisis
httpslidepdfcomreaderfullgovernment-banking-and-brics-in-the-recent-financial-crisis 4857
983106983122983113983107 983111983151983158983141983154983150983149983141983150983156 983106983137983150983147983155 983137983150983140 983110983145983150983137983150983139983145983137983148 983123983156983137983156983141983139983154983137983142983156
48
China EverbrightGuangdong Development mdash mdash 12 11 mdashIndustrial Bank 037 126 11 10 10Quase-Private
Bank of Shanghai 129 360 07 05 14Hua Xia 038 116 11 09 07Shenzhen Development 017 75 07 06 08Bank of Beijing 037 108 07 04 07
Sector totalThree state-banks 438 391 622Second tier banks 144 127 154
ABC = Agriculture Bank of China BOC = Bank of China BOCOM = Bank of Communications CCB =China Construction Bank CMB = China Merchantrsquos Bank CNY = yuanICBC = Industrial and Commercial Bank of China mkt = market NPL = nonperforming loan ROA =return on asset ROE = return on equity prov = provisioning PRC =Peoplersquos Republic of China SPDB = Shanghai Pudong Development BankNote Loan and deposit market share for BOC and ICBC are for their domestic operations onlySources Company data Goldman Sachs research estimates
Further data from 2006-10 from the Peoples Bank of China suggests that the big5 state banks continue to outperform the next 12 largest joint stock commercial banksThe big five have launched sales of shares to capitalize while listing on capital marketsand adopting reporting of financial data along lines of international standards Thisappears to be similar to Banco do Brasil policies that retain majority of shares in federalgovernment control while capitalizing the bank through issues of stock
Comparing the Performance of Big 5 State Banks and Next 12 Joint Stock CommercialBanks in China
2006 2007 2008 2009 2010
Profit Margin Big 5 State Banks 3116 3143 2586 3026 3269
Next 12 JS Commercial Banks 2050 2791 1796 2159 2365
Returns Big 5 State Banks 507 606 860 691 675(risk adj) Next 12 JS Commercial Banks 459 570 1016 714 723
Op Risk Big 5 State Banks 5548 5539 5215 5319 5322Next 12 JS Commercial Banks 5886 5721 5725 5831 5947
Leverage Big 5 State Banks 1626 1482 1724 173 1734Next 12 JS Commercial Banks 2826 2251 2064 2048 1936
ROE Big 5 State Banks 1424 1557 1999 1925 2037Next 12 JS Commercial Banks 1564 2049 2156 1840 1967
Big 4 and 11 JSCBsSource Peoples Bank of China China Financial Stability Reports 2007-11
Performance indicators reported by the Peoples Bank of China for the big 5 statebanks and 12 next largest joint stock commercial banks also suggest that the largestgovernment banks in China retain significant competitive advantages ndash and may providepolicy alternatives Given the current shift of economic policy in China away fromindustry and export led growth to more sustainable domestic oriented growth and socialinclusion the role of state banks clearly comes to the fore
8132019 Government Banking and BRICs in the Recent Financial Crisis
httpslidepdfcomreaderfullgovernment-banking-and-brics-in-the-recent-financial-crisis 4957
983106983122983113983107 983111983151983158983141983154983150983149983141983150983156 983106983137983150983147983155 983137983150983140 983110983145983150983137983150983139983145983137983148 983123983156983137983156983141983139983154983137983142983156
49
Net Operating Income of Big 5 State Banks and Next 12 CommercialBanks 100 million RMB YuanBig 5 State Banks 2006 2007 2008 2009 2010
Balance Net interest income 349703 500456 556790 532206 720152Net fee amp commission inc 48524 103817 138464 175469 232491
Investment income 216089 283725 338865 324037 340440
Other business income (1807) (17054) 47548 33791 2186
Net operating income 612509 870944 1081667 1065503 1314943
Percent Net interest income 5709 5746 5148 4995 5477
Net fee amp commission inc 792 1192 1280 1646 1768
Investment income 3528 3258 3133 3041 2589
Other business income (030) (196) 440 318 166
Net operating income 10000 10000 10000 100 100
Next 12 Joint Stock CommercialBanks 2006 2007 2008 2009 2010
Net interest income 87253 132945 198965 191276 281588
Net fee amp commission inc 7850 16247 27319 30115 42023
Investment income 20959 32172 44864 50767 50500
Other business income 2306 4498 16359 10384 7400
Net operating income 118468 185861 287507 282542 381511
Percent Net interest income 7365 7153 6920 6769 7381
Net fee amp commission inc 671 874 950 1066 1101
Investment income 1769 1731 1560 1797 1324
Other business income 195 242 569 368 194Net operating income 10000 10000 10000 10000 10000
Source Peoples Bank of China China Financial Stability Reports 2007-11
Big 4 and 11 JSCBsBig 5 = ICBC ABC BOC CCB BOCOMNext 12 Joint Stock Commercial Banks = China CITIC Bank Everbright Bank Huaxia BankGuangdong Development Bank Shenzhen Development Bank China Merchants Bank Shanghai PudongDevelopment Bank Industrial Bank China Minsheng Banking Corporation Evergrowing Bank ChinaZheshang Bank Bohai Bank
In conclusion bank change in China also appears to confirm our findings from
Brazil ndash that state banks have realized competitive advantages and increased marketshares since liberalization while providing counter cyclical credit to ameliorateadjustment to crisis The modernization of the China Postal Savings Bank is ofparticular interest given its social mission downmarket focus and 40000 branchOffices throughout the country Expansion of card payment services through the postalbank system confirms the importance of the Brazilian federal savings bank (CaixaEconocircmica Federal Caixa) as agent for federal government social policy and agentresponsible for management of citizenship cards (12 million) and payment of familygrants This back to the future modernization of savings banks has proved essential forovercoming notorious levels of social exclusion and inequality in Brazil Althoughenglish language materials are unavailable on the China Postal Savings Bank thisinstitution clearly presents profound opportunities for comparable policies in China
8132019 Government Banking and BRICs in the Recent Financial Crisis
httpslidepdfcomreaderfullgovernment-banking-and-brics-in-the-recent-financial-crisis 5057
983106983122983113983107 983111983151983158983141983154983150983149983141983150983156 983106983137983150983147983155 983137983150983140 983110983145983150983137983150983139983145983137983148 983123983156983137983156983141983139983154983137983142983156
50
Reported offer of microfinance services for poverty reduction as part of nationaleconomic stimulous plan may point to developments in this direction
Given that state planning capacity has long been at the center of attention intheories of financial statecraft the role of Chinese state banks in redirecting policiesaccording to the 12th 5 Year plan for 2011-15 seems critical From 2000-5 the 10th 5
Year plan emphasized infrastructure and the attraction of investment and labor skillsThe 11th 5 Year plan (2006-10) raised concerns about sustainability rather than growthlevels while also seeking to spread improvements to balance development better servepeople and improve the quality of life continue to support Center and West provincesand revitalize Northeast provinces In comparison the 12th 5 Year plan calls for morebalanced lsquoinclusiversquo growth and structural adjustemts more than 4 trillion RMB($US600 billion) for targeted industries and interior regions a focus on new energynew materials and information and high technologies biology and new medicineenergy converstaion and environmental protection aerospace marine and advancedmanufacturing This implies fundamental shifts away from industry to services that hasbeen reported in macroeconomic data for 2010 If past studies emphasized directed
credit and industrial change the role of Chinese state banks in realizing transformationscertainly warrants study
Although the domestic flow of funds process of liberalization (or the lackthereof) and insertion of banking into Chinese political economy is beyond the scope ofthis paper our findings from Brazil appear to provide valuable hypotheses about ChinaThat is to say the big state banks and other government banks in China remaincommanding heights not in the Marxist sense of providing means to reach socialismbut immense institutions with profound presence throughout politics and markets in thecountry In this sense our findings from Brazil appear to approximate patterns ofchange in China more than Washington Consensus expectations about liberalization andprivatizations to free private and foreign banks Financial statecraft draws attention tothe capitalization of Chinese state banks through stock Sales and listings on capitalmarkets However like the Banco do Brasil (that reformers in the 1990s sought to shiftcontrol to the private sector only to increase federal government shareholding) theChinese experience surely involves unexpected consequences and patterns of changedifferent than a linear transition to the Berle amp Means paradigm of corporategovernance
Russia The New State Duopoly
ldquoThe rush of 2003-8 increased the market share of foreign banks to 285 from
52 However the state-owned banks received enormous help from the federal budget in the days of the crisis thereby strengthening their dominant
position on the Russian financial market says Sergey Aleksashenko the formerDeputy chairman of Russias Central Bank quotes Russia Profile Today one
must not harbor any illusion of a fair competition with them all the main cash
flows in Russia are controlled by state-owned banks httpwwwbarentsnovacomnode1031
Description of banking policy in Russia during the global financial crisis can beobtained from Bank of Russia annual reports and related publications The figure on the
following page summarizes the financial flows to and from the Bank of RussiaAlthough central bank policy is beyond the scope of this study the role of state banks in
8132019 Government Banking and BRICs in the Recent Financial Crisis
httpslidepdfcomreaderfullgovernment-banking-and-brics-in-the-recent-financial-crisis 5157
983106983122983113983107 983111983151983158983141983154983150983149983141983150983156 983106983137983150983147983155 983137983150983140 983110983145983150983137983150983139983145983137983148 983123983156983137983156983141983139983154983137983142983156
51
channeling counter-cyclical credits released by the Bank of Russia appear to confirm thecore argument that emerges from our studies of the Brazilian banking system Furtherdata on the following pages also suggest that state banks in Russia performed wellduring 2008-10 confirming on the basis of sparse data taken from Bank of Russiareports and documents that public banks have modernized provided counter-cyclical
credit to reverse credit crunch and economic downturn while realizing competitiveadvantages over private and foreign banks
8132019 Government Banking and BRICs in the Recent Financial Crisis
httpslidepdfcomreaderfullgovernment-banking-and-brics-in-the-recent-financial-crisis 5257
983106983122983113983107 983111983151983158983141983154983150983149983141983150983156 983106983137983150983147983155 983137983150983140 983110983145983150983137983150983139983145983137983148 983123983156983137983156983141983139983154983137983142983156
52
The following aggregate figures reported by the Bank of Russia suggest severaltrends of significance First Chart 32 suggests that household deposits shifted fromRuble deposits to foreign currency pegged (or indexed) during 2008 Second Chart 33illustrates the substantial increase of non-bank overdue debt during second semester
2008
Consequently the financial results and profitability of banks declinedsignificantly during 2008 The greater confidence in deposits with government banksfound abroad suggests that this may have been critical in Russia
Performance data deom 2008-10 provides a clearer picture one that is consistentwith our findings in Brazil State banks appear to have outperformed all other types of
banks except medium and small regional banks The following table reports the averagereturns on assets and returns on equity reported by the Bank of Russia 2008-10
Returns on Assets and Equity by Type of Bank in Russia 2008-9
Return on assets Return on equity 2008 2009 2010 2008 2009 2010
-------------------------------------------------------------------------------------------------------------------State Banks 22 08 24 157 46 148Foreign Banks 18 11 21 146 83 145Large private banks 13 03 11 106 28 84Medium-Small Banks Moscow 15 12 14 68 52 67
Medium-Small Regional Banks 21 12 15 131 65 98--------------------------------------------------------------------------------------------------------------------Source Bank of Russia Bank Supervision Reports 2009 and 2010
8132019 Government Banking and BRICs in the Recent Financial Crisis
httpslidepdfcomreaderfullgovernment-banking-and-brics-in-the-recent-financial-crisis 5357
983106983122983113983107 983111983151983158983141983154983150983149983141983150983156 983106983137983150983147983155 983137983150983140 983110983145983150983137983150983139983145983137983148 983123983156983137983156983141983139983154983137983142983156
53
Further data from the Bank of Russia on the capital adequacy of Banks during2009-10 suggest that foreign banks and large private banks remain less capitalizedagainst risks according to Basel II guidelines albeit at levels almost double thatrecommended by the Bank for International Settlements (80 risk weighted) Although
further analysis is needed this data is consistent from that reported in Brazil thatgovernment banks tend to more cautious and more prudent in terms of placing asidehigher levels of reserves and patrimony against possible losses
Capital Adequacy of Banks by Type of Bank in Russia 2009-10
2009 2010 2011---------------------------------------------------------------------------------------------------------State Banks 184 227 186Foreign Banks 155 196 195Large Private Banks 140 181 155
Medium-Small Banks Moscow 316 312 268Medium-Small Regional Banks 219 241 207Non-Bank Credit Institutions 372 1038 678---------------------------------------------------------------------------------------------------------Source Bank of Russia Bank Supervision Report (Moscow) 2009 p 43
Finally Bank of Russia bank supervision reports also suggest that state banksexpanded their market shares of assets and capital during the years following the globalfinancial crisis While large private banks and foreign banks lost market share of bankassets and bank capital in Russia state banks increased their significant market sharefrom 405 ndash 426 percent and 471-476 percent of assets and capital respectivelyUnfortunately data from previous years and for specific banking groups was notobtained However this data does appear to indicate that our findings of competitiveadvantages and policy alternatives
Number and Market Share by Type of Bank
N Banks Assets Capital---------------------------- ---------------------------- ----------------------------
Type of Bank 2009 2010 2011 2009 2010 2011 2009 2010 2011-------------------------------------------------------------------------------------------------------------------------------State 17 22 27 405 439 458 471 489 473
Foreign 101 106 108 187 183 180 172 169 191Large Private 136 139 131 346 333 305 276 287 269Med-Small Moscow 361 335 317 27 26 26 43 34 35Medi-Small Regional 443 412 372 28 28 27 36 31 29Other Credit Institutions 50 51 57 07 04 04 01 02 03Total 1108 1058 100 100 100 100 100 100-------------------------------------------------------------------------------------------------------------------------------Source Bank of Russia Bank Supervision Report 2009 amp 2010
In sum politics and financial statecraft have led to the realization of significantcompetitive advantage by Russian state banks Sperbank and Vneshtorgbank increasedtheir share of bank assets from 32 percent in 2005 to over 50 percent by 2011 through
mergers and acquisitions and aggressive displacement of foreign banks Whatever thepolitics data from the Bank of Russia suggests that monetary authorities released a
8132019 Government Banking and BRICs in the Recent Financial Crisis
httpslidepdfcomreaderfullgovernment-banking-and-brics-in-the-recent-financial-crisis 5457
983106983122983113983107 983111983151983158983141983154983150983149983141983150983156 983106983137983150983147983155 983137983150983140 983110983145983150983137983150983139983145983137983148 983123983156983137983156983141983139983154983137983142983156
54
series of counter cyclical credit injections during 2008-9 to domestic bankinginstitutions Moreover data suggests that state banks continue to perform at or ahead oflevels reported by regional private and foreign banks The large market share andimproved performance of state banks reported in recent data suggests although the datais sparse that government banks in Russia have also modernized realized competitive
advantages and provided policy alternatives against the impact of financial crisisabroadWe were unable to find evidence of policy making toward social inclusion at the
Bank of Russia or Russian state banks despite the historical trajectory of the Sberbankas a savings bank under communism The context also appears to differ considerably Asurvey of the Zircon Research Group reportedly found that only 15 percent of Russiansretain bank accounts because of mistrust in banks and government This combination ofrealist politics and the realization of competitive advantages by Russian state bankssuggests that theories of economic statecraft in the realist tradition may indeed explainthe domestic developments under study
Conclusion
This paper reports evidence about government bank modernization and financialstatecraft in BRIC countries designed to counter the effects of crisis and shape domesticgrowth Government banks in BRIC countries have contributed to the widely notedadjustment of these economies to global financial crisis and economic downturnContrary to the Washington Consensus that prevailed during much of the 1980s and1990s (that privatization and liberalization especially of banking would free marketforces and deepen domestic financial systems) a quite different process of bank changeappears to have ensued after financial liberalization in the BRICs
Instead of replacement of state banks with private banks government banksremain central agents of domestic credit and growth and have modernized ldquojust intimerdquo The capitalization and realization of competitive advantages by large governmentbanks during the 2000s meant that once the US financial panic spread across capitalmarkets broke highly leveraged private and produced runs on private bank depositspolicy makers in BRIC countries nonetheless retained counter cyclical policyalternatives through their more solid large state banks
These findings counter traditional foci on the private sector individualentrepreneurship and ideals of free markets linked to the political and social advancesrecorded around the world in the last decades We report an anomaly for theories offinancial repression and the Washington Consensus about the virtues of privatization
and liberalization Although largely blamed for reproducing underdevelopment in thepast BRIC government banks averted excesses of private banking that drove creditbubbles such as home mortgages and derivatives in the US And since liberalization ofbanking (we have not adequately discussed how much liberalization occurred in eachcountry) government banks have modernized to compete with private and foreignbanks Government banks have realized competitive advantages and provided policyalternatives These two arguments help explain why BRIC countries have farecomparatively well in the face of financial crisis in core countries
Financial statecraft is therefore at the center of BRIC counter cyclical capacitiesand state planning Brazil Russia India and China fared significantly better thanadvanced and many developing countries in terms of adjusting to credit crunches and
export shocks This is because government banks proved critical interbank credit toretain confidence in domestic banking systems These institutions also presented other
8132019 Government Banking and BRICs in the Recent Financial Crisis
httpslidepdfcomreaderfullgovernment-banking-and-brics-in-the-recent-financial-crisis 5557
983106983122983113983107 983111983151983158983141983154983150983149983141983150983156 983106983137983150983147983155 983137983150983140 983110983145983150983137983150983139983145983137983148 983123983156983137983156983141983139983154983137983142983156
55
policy alternatives for political and social forces Politics shaped adjustment andrecovery through state banks differently in BRIC countries Given the realities of statecentered political realism in Russia the redirection of state banks toward goals ofChinese Five Year Plans and the modernization of the State Bank of India amidst anamorphous federalism the experience of Brazil with democratization and public bank
modernization may stand out (Armijo 2009)Further analysis of savings banks and cooperative banks also will be requiredAs members of the World Savings Bank Institute (a global association of savingsbanks) the Caixa in Brazil SNI and NABARD in India and China Postal Savings Bankappear to have provided access to very large numbers of previously unbanked citizensThis returns to traditional ideas of social banking and the history of savings banks thatwere founded throughout Europe since the late 18 th century The upmarket strategy andexpansion into investment banking and international banking of the Russian Sberbankconstrasts with downmarket strategies of savings banks in Brazil India and China
The financial press has recently reported doubts about bad loans in Chinese statebanks and cast doubt on the financial results posted and reported in this paper
However current estimates of 2-5 percent bad loans in Chinese state banks pale incomparison to the US$1240 billion in bad loans shifted to asset managementcompanies in the mid 2000s before capitalization of these institutions through sale ofshares Critics of state banking in Brazil also point to past levels of bad loans (reaching30-40 percent) because of their capture during military government delayed transitionBut the cost of capitalization and transfer of bad loans from Brazilian state banks alsoremained below US$400 billion and is still contingent on liquidation of assetmanagement companies created in 2001 In any case these numbers are very smallcompared to GAO estimates of US$120 trillion in emergency infusions by USmonetary authorities to banks and financial institutions from 2007-11
These are anomalies for recent market-based banking theory and neo-liberalpolicy designs However they do not run counter to orthodoxy in economics andbanking theory Over the last decades economic reforms (fiscal financial monetaryand banking) have improved transparency and brought public policy and marketexpectations closer However expectations about deregulation and free marketequilibria in banking and finance have succumbed in the face of panic and the stillsobering consequences of crisis The materials presented herein are descriptive and willrequire more careful analysis However given the urgency of searching for alternativedevelopment models and different approaches to financial statecraft in BRIC countriesand beyond we have taken the liberty to present research in initial stages and toprovoke thought along the lines suggested by our kind conveners
8132019 Government Banking and BRICs in the Recent Financial Crisis
httpslidepdfcomreaderfullgovernment-banking-and-brics-in-the-recent-financial-crisis 5657
983106983122983113983107 983111983151983158983141983154983150983149983141983150983156 983106983137983150983147983155 983137983150983140 983110983145983150983137983150983139983145983137983148 983123983156983137983156983141983139983154983137983142983156
56
Appendix on Alternative Banking and Social Inclusion
This appendix describes how ideas about government banking led to further work onalternative banking and social inclusion with help from the Rockefeller FoundationBellagio Center In July 2011 we were able to convene a conference designed to gather
scholars alternative banking executives and representatives from savings andcooperative bank associations to rethink strategies for social inclusion in the globalsouth and attempt to launch a new policy agenda Given the search for alternativestrategies to counter crisis and the advances of stabilization transparency and bankingsupervision in developing and emerging economies we call for alternative bankingcommunities in the global north and south to work together and help shape a new policyagenda for social inclusion Because savings banks credit cooperatives and otheralternative banking and finance institutions have realized competitive advantages andemerged from crisis we can now think beyond We believe that new policies may helpdeveloping and emerging nations redirect large domestic institutions such as postal andsavings banks toward meeting the UN millennium goals to eliminate poverty by 2015
Plans include writing a green paper on Core Principles for Alternative Bankingand Social Inclusion convening events to promote these principles through institutionalsupporters and networks and seeking adoption of these principles at policy venues suchas the World Savings Bank Institute the International Association of CooperativeBanks the Bank for International Settlements the International Financial ReportingStandards foundation the ISO International Standards Organization the Charter forResponsible Business regional development banks and the World Bank We also planto submit an edited volume of scholarly contributions on alternative banking and socialinclusion by year-end 2012 Interested parties are welcome to participate
Institutional supporters and networks include
Institutional SupportersColumbia University School of International and Public Affairs New YorkInstitute for Money Technology and Financial Inclusion University of CaliforniaIrvineKingacutes College Department of Management LondonSatildeo Paulo Business School Getulio Vargas FoundationSecond University of Naples
Networks
Association of Emerging Market Business Schools Satildeo Paulo BrazilCommunity of European Management Schools BrusselsCritical Political Economy NetworkEuropean Association of Co-operative Banks BrusselsGlobal Public Policy Network LondonInternational Cooperative Banking Association BrusselsSocial Science Finance Network AmsterdamSociety for Advancement of Social Economics PhiladelphiaWorld Savings Bank Institute Brussels
8132019 Government Banking and BRICs in the Recent Financial Crisis
httpslidepdfcomreaderfullgovernment-banking-and-brics-in-the-recent-financial-crisis 5757
983106983122983113983107 983111983151983158983141983154983150983149983141983150983156 983106983137983150983147983155 983137983150983140 983110983145983150983137983150983139983145983137983148 983123983156983137983156983141983139983154983137983142983156
Core Principles for Alternative Banking and Social Inclusion
Commitment to End Capital StarvationPromote access to and use of banking and financial services by all through newtechnologies and distribution channels to capitalize assets among the poor
Commitment to Universalize Income Savings Credit and FinanceProvide basic income via ATM cards and mobile banking to reach the poor and opennew channels of access to income savings credit finance insurance and opportunities
Prudent Banking and Regulatory ComplianceAlternative banking seeks to work within regulations guidelines and best practicesrecommended by domestic monetary authorities and international regulatory institutionssuch as the Bank for International Settlement Basel II Capital Risk Guidelines
Corporate Social Responsibility Leadership
Integrate corporate social responsibility into down-market business strategies andinstitutions of representation and democratization
Transparency and AccountabilityPublish annual reports and balance sheets in accord with international best practices offinancial social and sustainability reporting
Leadership in Provision of New Banking Services and Products to the PoorUse competitive advantages in banking and institutional networks to channel moreeffectively capital income and finance to the poor
Generate Sustainable Income and Household Asset AccumulationUse branch offices and new banking technologies to accelerate progress toward UNmillennium goals to eliminate poverty
Universalize Financial EducationPromote financial education to encourage responsible banking and finance and avertpredatory lending and unethical practices
Adopt Cutting Edge Technology and Management Practices to Provide
Competitive Alternative to Private Commercial and Investment Banks
Incorporate electronic card and mobile banking services to better serve the poorContribute to Realization of Bellagio Principles for SustainabilityPromote alternative banking and business practices that contribute to environmentallysustainable income consumption and production as stated in Bellagio Principles forSustainability
Respect and Build on National and Regional DifferencesI d f i l d l l i b ki i i i d i i l
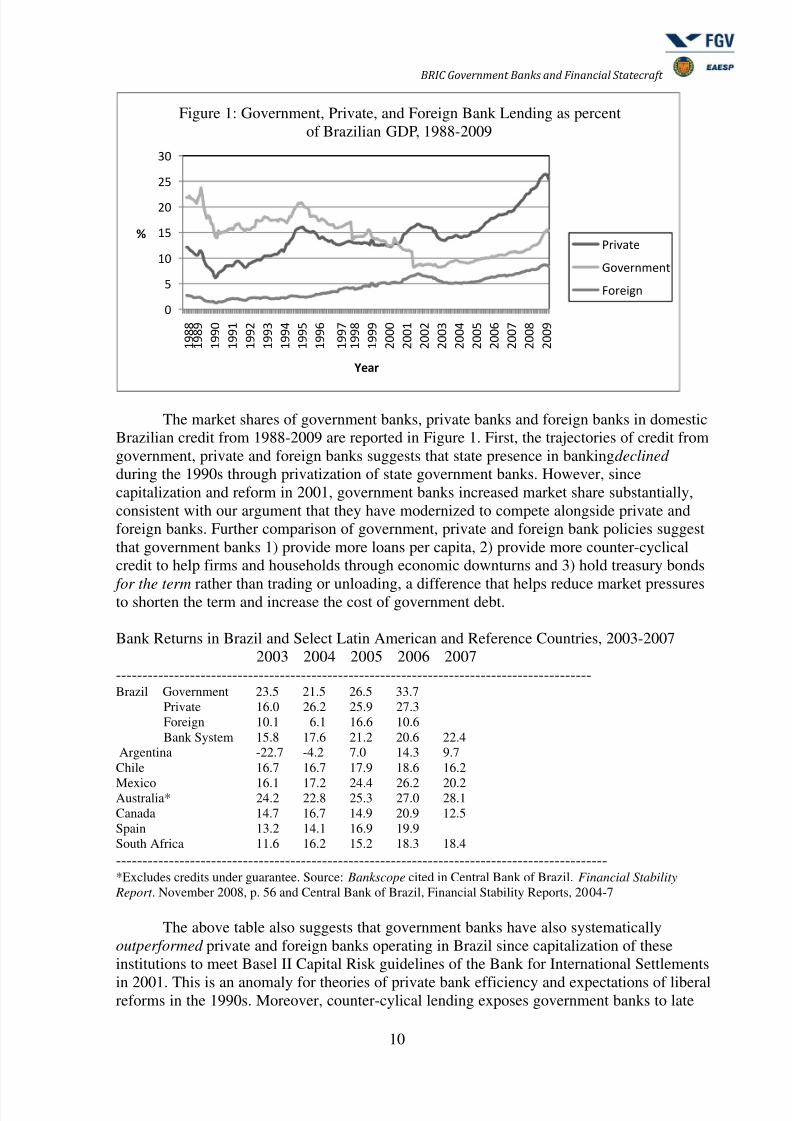
8132019 Government Banking and BRICs in the Recent Financial Crisis
httpslidepdfcomreaderfullgovernment-banking-and-brics-in-the-recent-financial-crisis 1057
983106983122983113983107 983111983151983158983141983154983150983149983141983150983156 983106983137983150983147983155 983137983150983140 983110983145983150983137983150983139983145983137983148 983123983156983137983156983141983139983154983137983142983156
10
The market shares of government banks private banks and foreign banks in domesticBrazilian credit from 1988-2009 are reported in Figure 1 First the trajectories of credit fromgovernment private and foreign banks suggests that state presence in banking declined during the 1990s through privatization of state government banks However sincecapitalization and reform in 2001 government banks increased market share substantiallyconsistent with our argument that they have modernized to compete alongside private andforeign banks Further comparison of government private and foreign bank policies suggestthat government banks 1) provide more loans per capita 2) provide more counter-cyclicalcredit to help firms and households through economic downturns and 3) hold treasury bonds
for the term rather than trading or unloading a difference that helps reduce market pressuresto shorten the term and increase the cost of government debt
Bank Returns in Brazil and Select Latin American and Reference Countries 2003-20072003 2004 2005 2006 2007
------------------------------------------------------------------------------------------Brazil Government 235 215 265 337
Private 160 262 259 273Foreign 101 61 166 106Bank System 158 176 212 206 224
Argentina -227 -42 70 143 97Chile 167 167 179 186 162
Mexico 161 172 244 262 202Australia 242 228 253 270 281Canada 147 167 149 209 125Spain 132 141 169 199South Africa 116 162 152 183 184---------------------------------------------------------------------------------------------Excludes credits under guarantee Source Bankscope cited in Central Bank of Brazil Financial Stability
Report November 2008 p 56 and Central Bank of Brazil Financial Stability Reports 2004-7
The above table also suggests that government banks have also systematicallyoutperformed private and foreign banks operating in Brazil since capitalization of theseinstitutions to meet Basel II Capital Risk guidelines of the Bank for International Settlements
in 2001 This is an anomaly for theories of private bank efficiency and expectations of liberalreforms in the 1990s Moreover counter-cylical lending exposes government banks to late
983088
983093
983089983088
983089983093
983090983088
983090983093
983091983088
983089 983097 983096 983096
983089 983097 983096 983097
983089 983097 983097 983088
983089 983097 983097 983089
983089 983097 983097 983090
983089 983097 983097 983091
983089 983097 983097 983092
983089 983097 983097 983093
983089 983097 983097 983094
983089 983097 983097 983095
983089 983097 983097 983096
983089 983097 983097 983097
983090 983088 983088 983088
983090 983088 983088 983089
983090 983088 983088 983090
983090 983088 983088 983091
983090 983088 983088 983092
983090 983088 983088 983093
983090 983088 983088 983094
983090 983088 983088 983095
983090 983088 983088 983096
983090 983088 983088 983097
983077
983129983141983137983154
Figure 1 Government Private and Foreign Bank Lending as percent
of Brazilian GDP 1988-2009
983120983154983145983158983137983156983141
983111983151983158983141983154983150983149983141983150983156
983110983151983154983141983145983143983150
8132019 Government Banking and BRICs in the Recent Financial Crisis
httpslidepdfcomreaderfullgovernment-banking-and-brics-in-the-recent-financial-crisis 1157
983106983122983113983107 983111983151983158983141983154983150983149983141983150983156 983106983137983150983147983155 983137983150983140 983110983145983150983137983150983139983145983137983148 983123983156983137983156983141983139983154983137983142983156
11
and non-payment of loans This reduces profits Strategies to ldquoholdrdquo government securitiesalso reduce profits Nonetheless government banks have reported stronger returns thanforeign and domestic banks on average since capitalization in 2001
The above data may conceal bad banking practices such as crony credit bad loans andcosts that in the end must be passed on to others through fiscal accounts or the money supply
Data from the Central Bank of Brazil help control for these possibilities and provide furthercomparison of bank performance This section compares government private and foreignbanks in terms of the Basel Index bad credit late loans and stress tests that estimate theimpact of hypothetical shocks to bank portfolios from foreign exchange devaluation andorcredit problems
First the Basel Index for government domestic and foreign banks from 2002-2006suggests that government banks remain capitalized well above levels set in Central Bank ofBrazil guidelines (110 set in 1999) The Bank for International Settlements suggests an 80level of capital in reserve against possible losses in lending and finance The average BaselIndex for government banks increased from 167 percent in 2002 to 197 percent in 2006 Incomparison the average Basel Index for private domestic banks increased from 151 pecent
to 170 percent during this period while foreign banks on average reported Basel Indexes of152 in 2002 remaining at 154 in 2006 This suggests that government banks in Brazil retainsufficient capital in reserve against risks arising from bad credit or losses in financialmarkets
Bank System Basel Index in Brazil Select Latin American and Reference Countries
2002 2003 2004 2005 2006---------------------------------------------------------------------------------------------Brazil Government 167 148 165 174 197
Private 151 171 183 177 170Foreign 152 167 187 164 154
Chile 141 136 130 125 120Mexico 144 141 145 163 159Australia 100 104 104 104 103Canada 134 133 129 125 121Spain 126 123 122 119South Africa 124 140 127 123 122
---------------------------------------------------------------------------------------------Source Central Bank of Brazil Financial Stability Report 2002-2006Note Basel Index = recommended minimum eleven percent relation between required net worth and risk-
weighted total assets
A closer look at changing Basel indexes reveal the consequences of counter-cyclicallending from federal government banks Because private domestic and foreign banks adoptedmore cautious strategies and provided less credit during the downturn of 2002 theseinstitutions maintained levels of capital reserves above levels found in government banksThe average Basel index for the domestic financial system thus remained roughly the same atyear-end 2002 (06 percent increase to 162 over June 2002) However this average concealsan increase of 21 percent in the Basel Index for private banks (largely meaning they chose tohold low risk rated government paper) and a decline of 23 percent of the Basel Index forgovernment banks (meaning they incurred risks to lend during downturn and adjustment)Before assuming the worst readers should note two matters First the Central Bank of Brazilrequires banks to maintain a Basel Index of 110 This is three points greater than the 80
8132019 Government Banking and BRICs in the Recent Financial Crisis
httpslidepdfcomreaderfullgovernment-banking-and-brics-in-the-recent-financial-crisis 1257
983106983122983113983107 983111983151983158983141983154983150983149983141983150983156 983106983137983150983147983155 983137983150983140 983110983145983150983137983150983139983145983137983148 983123983156983137983156983141983139983154983137983142983156
12
suggested in the 1988 Basel Accord and subsequent revisions for capital guidelines In otherwords Brazilian banks set aside almost half again more in additional capital reserves thanlevels recommended by the Bank for International Settlements Second the different BaselIndex ratings of government and private banks also reflects the greater weight of credit andtherefore credit risk in these institutions And data on bad and late loans since 2001 suggest
that the slight and temporarily higher levels of average Basel Indexes reported by governmentbanks do not reflect broader deterioration of portfoliosFurthermore Banks in Brazil and especially government banks tend to be more
conservative setting aside not only frac12 of deposits as compulsory reserves at the Central Bankof Brazil but also retaining additional reserves against bad loans and losses Firstcomparative data suggests that Brazilian banks tend to set considerably larger sums aside inreserve against bad loans and other losses Of the four large Latin American countries andfour further economies reported by the IMF and Central Bank of Brazil Brazil retainedsubstantially larger reserves against bad loans than any country except Spain during 2007This confirms the particular characteristics of banking in Brazil that of a higher cost andlower operating efficiency combined with larger reserves and provisions against losses
Bank Reserves as Percent of Overdue amp Late Loans in Brazil Select Latin American andReference Countries
2003 2004 2005 2006 2007 2008---------------------------------------------------------------------------------------------Brazil 3200 3719 2874 2800 2862 2709Argentina 792 1029 1251 1303 1303Chile 1309 1655 1776 1985 2107Mexico 1671 2018 2321 2074 1947Australia 1318 1829 2030 2052 1889Canada 435 477 493 553 449Spain 2454 2196 2518 2733South Africa 542 613 643---------------------------------------------------------------------------------------------Source IMF Global Financial Stability Report 2008 cited in Central Bank of Brazil Financial Stability
Report November 2008 p 56
The level of bad and late loans in bank portfolios is another measure of bank solidityThe convergence of bad credit levels in government private and foreign banks from 1988-2008 introduced this study Further comparison suggests that although government banksretain higher levels of bad and late loans in specific sectors (especially home loans) the value
of late loans as a percent of total loans in government banks fell below levels in private andforeign banks during 2008 (See table on following page) The value of bad credit (loans over12 months past due) in government banks decreased from R$372 billion in 2001 to R$149billion in June 2006 This places the value of bad credit in government banks below the valuefound in private and foreign banks Bad credit in private banks increased from R$173 billionin 2001 to peak at R$255 billion during 2003 declining to R$180 billion in 2006 Foreignbanks also reported increased values of bad credit from R$123 billion in 2001 peaking atR$141 billion in 2003 and declining to R$130 billion in 2006 While late loans remained 85percent of total loans in government banks in 2001 (above 75 percent in private and 65percent in foreign banks) by 2008 the relation reverses In 2008 late loans declined to 32percent of total loans at government banks while remaining at 37 percent in private banksand 45 percent in foreign banks
8132019 Government Banking and BRICs in the Recent Financial Crisis
httpslidepdfcomreaderfullgovernment-banking-and-brics-in-the-recent-financial-crisis 1357
983106983122983113983107 983111983151983158983141983154983150983149983141983150983156 983106983137983150983147983155 983137983150983140 983110983145983150983137983150983139983145983137983148 983123983156983137983156983141983139983154983137983142983156
13
Moreover government banks in Brazil continue to set aside greater provisions againstbad and late loans than private or foreign banks In 2004 government banks retained 86percent of the value of total loans in provision against losses from non-paying loans whileprivate banks retained 60 percent and foreign banks 51 percent In 2008 the level ofprovisions at government banks had declined on average to 68 percent but still remained
well above the levels of 52 and 51 percent recorded at private and foreign banks
Late Loans and Provisions in Government Private and Foreign Banks 2001-2008
Government Banks Private Banks Foreign Banks--------------------------- ----------------------------- -----------------------------R$bi R$bi R$bigt12m Late Provision gt12m Late Provision gt12m Late Provision
----------------------------------------------------------------------------------------------------------------2001 372 85 173 75 123 652002 394 55 202 73 141 60
2003 326 70 255 74 159 662004 133 35 86 160 31 60 102 32 512005 134 39 81 163 35 59 107 35 482006 149 42 68 180 44 66 130 45 532007 35 75 37 55 43 502008 32 68 37 52 45 512009 30 56 612010 20 47 40 66 41 532011 20 43 46 71 50 58----------------------------------------------------------------------------------------------------------------Note Bad credit = loans past due over 12 months Late = percent of total loans gt120 days overdue
Provision = percent of total loan value set aside as reserves against losses Empty cells reflect lack of databecause of changing reporting standards at Central BankSource Central Bank of Brazil Financial Stability Report November 2008 p 56 and 2002-2006
Again in comparative perspective the levels of late loans in Brazilian bankingremains significantly higher than other countries Table 213 reports the value of late loans asa percent of bank portfolios in Brazil select Latin American and further countries forreference This suggests that differences found in Brazilian government banks have to dowith differences in the banking system such as judicial preference for debtors over creditorsrather than the inferior performance of government banks
Late Loans as percent of Total Loans in Brazil Select Latin American and ReferenceCountries
2003 2004 2005 2006 2007----------------------------------------------------------------------------------------------------------------Brazil 39 30 35 37 32Chile 16 12 09 08 08Mexico 28 22 18 21 25Australia 03 02 02 02 02Canada 12 07 05 04 04Spain 17 17 16 14 11South Africa 24 18 15 11 12
---------------------------------------------------------------------------------------------------------------- Does not include credits covered by guaranteeSource Bankscope cited in Central Bank of Brazil Financial Stability Report November 2008 p 56
8132019 Government Banking and BRICs in the Recent Financial Crisis
httpslidepdfcomreaderfullgovernment-banking-and-brics-in-the-recent-financial-crisis 1457
983106983122983113983107 983111983151983158983141983154983150983149983141983150983156 983106983137983150983147983155 983137983150983140 983110983145983150983137983150983139983145983137983148 983123983156983137983156983141983139983154983137983142983156
14
Further comparative data confirms that the Brazilian banking system tends to run onmore expensive credit higher returns and profits and higher levels of late and bad loansBanks operating in Brazil also retain higher levels of administrative and personnel costsHowever Brazilian banks also tend to set aside more generous reserves and provisions
against losses These structural characteristics can be seen in the comparative data in the tablebelow The data on government private and foreign banks in Brazil and comparisons suggestthat the Brazilian banking system incurs higher operating costs maintains higher reservesprovisions and capital against losses and risk but nonetheless produces strong returns
Indicators of Bank Efficiency Performance and Provisions in Brazil Select Latin Americanand Reference Countries
Cost Op Exps NPL Provisions EquityIncome Assets Loans NPL Assets
----------------------------------------------------------------------------------------------------------------
Brazil 62 65 41 153 9Argentina 84 41 66 116 12Chile 53 28 10 166 7Colombia 52 59 32 144 11Mexico 58 47 20 232 12US 54 33 07 163 8Spain 56 16 07 313 12----------------------------------------------------------------------------------------------------------------Source World Bank ldquoBrazil The Industry Structure of Banking Servicesrdquo Brasiacutelia June 2007 pp
Comparison of administrative costs in Brazilian banking with levels in other large
Latin American and emerging and reference economies suggest that Brazilian banks retainhigher costs From 2001 through 2005 the value of administrative costs as a percent of bankassets in Brazil declined from 69 percent to 58 percent but remained significantly abovelevels reported from Chile (30 to 27 percent) Mexico (47 to 46 percent) and well abovereference countries such as Australia Canada and Spain (16 36 and 11 percentrespectively) Although time series lacks comparison after 2005 administrative costs inBrazilian banks decline significantly from 58 in 2005 to 42 in 2008
Bank Administrative Costs in Brazil Select Latin American and Reference Countries (Assets)
2001 2002 2003 2004 2005 2006 2007 2008-------------------------------------------------------------------------------------------------Brazil 69 61 60 61 58 55 51 42Chile 30 30 27 27 27Mexico 47 48 46 43 46Australia 17 17 16 16 16Canada 27 27 27 27 26Spain 17 17 16 14 11-------------------------------------------------------------------------------------------------- Adjusted average of total assetsSource Bankscope cited in Central Bank of Brazil Financial Stability Report November 2008 p 56
A final comparison of government private and foreign bank solidity is based onCentral Bank of Brazil estimates of the impact of hypothetical shocks to the Brazilian
8132019 Government Banking and BRICs in the Recent Financial Crisis
httpslidepdfcomreaderfullgovernment-banking-and-brics-in-the-recent-financial-crisis 1557
983106983122983113983107 983111983151983158983141983154983150983149983141983150983156 983106983137983150983147983155 983137983150983140 983110983145983150983137983150983139983145983137983148 983123983156983137983156983141983139983154983137983142983156
15
economy on domestic banks These estimates are based on the revisions of the widely usedValue-at-Risk estimates proposed by Boudoukh Richardson and Whitelaw that adapts theoriginal VaR method developed and commercialised by JP Morgan19
Stress Tests for Impact of Credit Interest Rate and Foreign Exchange Shock on Basel Index
Comparison of Government Domestic and Foreign Banks 2001-2006
2002 2003 2004 2005 2006-------------------------------------------------------------------------------------------------------------
Government 112 104 114 113 109Domestic 112 132 126 121 103Private 103 131 135 108 84-------------------------------------------------------------------------------------------------------------Source Central Bank of Brazil Financial Stability Reports 2002-2006Note Basel Index = Capital risk guideline measure defined by Bank for International Settlements BaselCommittee that recommends 8 percent relation between PR and total assets weighted by risk level Since 2002Central Bank of Brazil minimum requirements of Basel Index remains 11 percent For methods of calculationsee Central Bank of Brazil Financial Stability Report Brasilia 2006 p 76
Central Bank of Brazil tests estimate that in the face of foreign currency valuationand interest rate shock government banks would nonetheless remain at or slightly below thecapital requirements against credit risk recommended by the central bank Again it should benoted that Basel Index levels recommended in the BIS Capital Requirements guidelines forthe Basel Index of banks are 80 while the Central Bank of Brazil has set minimum BaselIndex levels of 110 Given that federal government bank portfolios include more credit thanprivate banks and especially foreign banks the estimate of a shift to 109 in the averageBasle index for federal government banks in the face of a credit shock provides furtherevidence that these financial institutions are solid and their capital reserves sufficient Insum comparison of results for government private and foreign banks in the estimatesreported by the Central Bank of Brazil of the likely impact of a shock to the Brazilianeconomy in terms of interest rates and foreign exchange rates also suggests that governmentbanks appear solid The average Basel Index reported for government banks in this stress testwas 135 above the 110 Central Bank of Brazil guideline and well above the 80 levelsuggested by the BIS
Understanding the capacity of Brazilian banks to cope with shocks and risk is not justa theoretical exercise Since the currency crisis in Mexico during 1994-1995 the newlystabilized currency was tested by shocks from home and abroad Policies first dramaticallyincreased interest rates under a fixed exchange rate regime then freed the real to devalue
under a flexible foreign exchange rate regime in January 1999 The Asian currency crisesduring second semester 1997 led the Central Bank of Brazil to increase benchmark Selicinterest rates to 434 percent in November In August 1998 the declaration of moratorium onforeign debt payments by Russia the central bank to once again increase Selic interest ratesfrom 20 to 40 percent under the fixed exchange rate regime by November of that year Theseshocks from abroad coincided with preparations for national elections during 1998 leadingthe IMF and other official creditors to provide strong support for the Brazilan governmentNonetheless by January 1999 (after the election) market pressure led to the abandonment ofthe fixed foreign exchange rate regime that had served as nominal anchor for economic
19 Calculation first published in Resenha BMampF Vol 122 1998 (described in Central Bank of Brazil
Financial Stability Report 2002 amp 2003 then as Boudoukh Jacob Matthew Richardson RichardStanton amp Robert Whitelaw ldquoMaxVaR Long Horizon Value at Risk in a Mark-to-Market Environmentrdquo Journal of Investment Management 2004Vol 2 No 3 pp 14-19
8132019 Government Banking and BRICs in the Recent Financial Crisis
httpslidepdfcomreaderfullgovernment-banking-and-brics-in-the-recent-financial-crisis 1657
983106983122983113983107 983111983151983158983141983154983150983149983141983150983156 983106983137983150983147983155 983137983150983140 983110983145983150983137983150983139983145983137983148 983123983156983137983156983141983139983154983137983142983156
16
policy since 1994 The real quickly devalued from 121 to 20 against the US dollar by theend of January and led to considerable changes in policy (a flexible foreign exhange rateregime inflation targeting and the implementation of further fiscal reforms) Once the realrevalued from R$22 against the dollar in March to R$166 in April 1999 the governmentmoved to consolidate this new triad of economic policies Since 1999 flexible foreign
exchange markets inflation targeting and fiscal reform have remained in place This suggeststhat Brazilian banks have weathered volatile parameters and large risks during a markedpolitical business cycle One involving the transition from reformist President Cardoso to PTPresident Lula Since recovery of the economy during 2004 the coalition government underPT President Lula has sought to expand the contribution of government banks to accelerategrowth and social inclusion These policies have not undermined economic fundamentals oreroded the institutional foundations of comparative advantage retained by Brazilian federalgovernment banks
In sum the advances of Brazilian banking toward Basel Accord regulations during the1990s and 2000s the adoption of more transparent and timely reporting standards and themodernization of government banks under pressures from liberalization placed federal banks
in a new situation in the face of crisis once it hit the country in 2008 A closer look at the bigthree federal government banks is in order to better understand these changes
The Banco do Brasil
Upon taking office in 2003 President Lula retained the central economic policies of theCardoso administration such as inflation targeting tight fiscal and monetary policy andthe operational independence of the Banco do Brasil However the recovery of investorconfidence during 2003 and the return of stronger growth levels during 2004 led to aperiod of what the Central Bank of Brazil describes as organic growth at the Banco doBrasil From 2004-2008 the Banco do Brasil contributed to the deepning of domesticcredit markets and emerged as leading investment bank at the Bovespa stock marketFurthermore once the Bovespa collapsed credit became short and a sharp downturnensued during 2008 the Banco do Brasil provided emergency loans infusions of capitalthrough stock purchases and the acquisition of small and mid-sized firms and banksunable to weather the sharp decline and lack of credit Although the merger of Itauacute andUnibanco in 2008 displaced the Banco do Brasil as the largest financial institution inLatin America the bank retains powerful institutional foundations of comparativeadvantage and networks that cross Brazilian society politics and markets
The Banco do Brasil also remains at the center of Brazilian politics and policydisputes Indeed leaders of the PT party faction articulaccedilatildeo (articulation) includes
career employees of the Banco do Brasil and presidents of the Brazilian bank workersunion such as Luiz Gushiken and Ricardo Berzioni Both were nominated to ministerialposts by President Silva in January 2003 By August 2003 21 of 33 top positions at theBanco do Brasil had been filled by new representatives of the PT most Banco do Brasilemployees and members of the Brazilian bank workers union Critics decriedpoliticization However the resistance of bank representatives described above topresidential appeals to increase credit during 2003 was followed by more neutralappointments during 2004 When Banco do Brasil President Cassio Casseb Limaresigned in November 2004 (under charges of irregularities in consulting contracts atthe bank) President Lula nominated Rossano Maranhatildeo Pinto a career employee andBanco do Brasil vice president to head the bank Further appointments of PMDB
political leaders to cement support for the PT coalition government were also criticizedas politicization of the bank However Banco do Brasil officials responded that these
8132019 Government Banking and BRICs in the Recent Financial Crisis
httpslidepdfcomreaderfullgovernment-banking-and-brics-in-the-recent-financial-crisis 1757
983106983122983113983107 983111983151983158983141983154983150983149983141983150983156 983106983137983150983147983155 983137983150983140 983110983145983150983137983150983139983145983137983148 983123983156983137983156983141983139983154983137983142983156
17
experienced political leaders of the PMDB brought competitive advantages to the bankbased on their networks that cross the public and private sector These networks andrelations during the second PT coalition government of President Lula also appearsdifferent than the first given the departure from core offices of the presency bylongtime advisors to Lula that came from the Banco do Brasil and bank workers union
By late 2006 only one of seven vice presidents of the Banco do Brasil was a member ofPresident Lulaacutes Workersacute Party (PT)Again Banco do Brasil policies and growth since recovery of the economy in
2004 involved first a period of expansion during four years of growth followed by aturn to counter cyclical lending and finance once financial crisis abroad produced first asevere contraction in credit supply then a sharp economic downturn in fourth quarter2008 Institutional foundations of comparative advantage are behind Banco do Brasilpolicies during both periods First the capitalization of Brazilian firms on the Bovespastock market is closely related to the groups that cross politics government banks thepowerful bank worker labor union the Banco do Brasil employee private pension fundand bank consortia often led by the Banco do Brasil investment banking division (often
joined by the BNDESpar and Caixa investment banking division) Recent developmentsare complex and will require further research However rather than convergence towardprivate banking and a market-centered financial system examination of Banco do Brasilpolicies and market shares during the 2000s suggests that federal government banks notonly remain at the center of politics policy and development strategies but that theseinstitutions have modernized to compete against private and foreign banks
The large scale and scope of the Banco do Brasil has permitted use of the bankfor counter-cyclical lending and leadership in capital markets without deteriorating bankbalance sheets Since 2003 the Banco do Brasil has remained well within domesticbank regulations and Basel Accord guidelines During 2002 and 2003 reforms at theBanco do Brasil sought to reduce costs and increase efficiency ratings Indeed therelation between the Banco do Brasil and President Lula reversed past patterns In the1950s conflicts were between national developmentalist groups at the Banco do Brasiland more orthodox Ministers of Finance In 2003 and once again during the 2008financial crisis differences between President Lula and the Banco do Brasil were thereverse Banco do Brasil management refused to dramatically increase loans in 2003and resisted requests to reduce the price of credit in 2008 In 2003 the caution imposedby political risk perceptions led President Lula to respect the operational autonomy ofthe Banco do Brasil In April 2009 Banco do Brasil President Antonio Francisco deLima Neto was fired after refusing to reduce interest rates on loans This reversal ofpolicy positions from the 1950s suggests in a broader sense a transition from the
macroeconomics of populism to the microeconomics of government banking in the 21
st
century Government banks do not provide easy or all solutions Instead credit andfinance policies are subject to market discipline credit risk analysis and the realities ofbusiness cycles
Review of the Banco do Brasilrsquos balance sheet from 2002-2008 suggests that the bankdeveloped organically from 2002-2007 with gradual increases reflecting the competitiveadvantages at the top of Brazilian banking and finance Policies changed during 2007 and2008 as the credit shortage caused by international financial crisis led to the Banco do Brasilassuming once again lending of last resort functions by extending interbank investments andloans to small and medium sized banks to avert further declines in domestic liquidity TheBanco do Brasil also acquired a 51 percent stake in the Votarantim bank to avert a run on
deposits and possible failure while acquiring Satildeo Paulo state government savings bankNossa Caixa for R$76 billion in 2008 These acquisitions reflect concern about the
8132019 Government Banking and BRICs in the Recent Financial Crisis
httpslidepdfcomreaderfullgovernment-banking-and-brics-in-the-recent-financial-crisis 1857
983106983122983113983107 983111983151983158983141983154983150983149983141983150983156 983106983137983150983147983155 983137983150983140 983110983145983150983137983150983139983145983137983148 983123983156983137983156983141983139983154983137983142983156
18
replacement of the Banco do Brasil as the largest financial conglomerate in Brazil after themerger of Itauacute and Unibanco
Banco do Brasil Balance Sheet Summary 2002-2008 R$ billion
2002 2003 2004 2005 2006 2007 2008 2009 2010 2011Assets --------------------------------------------------------------------------------------------------------Interbank Investments 101 50 27 80 175 434 951Interbank Deposits 76 283 137 209 116 77 242Securities 709 696 734 664 731 752 732Central Bank Deposits 81 186 221 244 281 334 212Loans to Private Sector 89 652 757 885 1178 1463 1810Loans to Public Sector 56 43 41 37 43 24 230Receivables 297 273 312 351 404 548 808Other AssetsTotal Assets 2046 2301 2390 2529 2963 3672 5073Liabilities ---------------------------------------------------------------------------------------------------Deposits 972 1100 1155 1376 1588 1882 2711
M MKT Borrowing 483 400 445 305 492 722 914Treasury amp BNDES 59 74 106 133 143 175 224Shareholder Equity 92 121 141 168 207 242 299Other LiabilitiesTotal Liabilities 2046 2301 2390 2529 2963 3672 5073---------------------------------------------------------------------------------------------------------------- Compulsory deposits for commercial banks according to Central Bank regulationsSource Banco do Brasil Annual Reports Historical Series 2002-2008
From 2002 through 2006 the balance sheet of the Banco do Brasil suggests a periodof growth based on loans to the private sector with deposits and shareholder equityincreasing largely apace After 2006 the balance sheet changes fundamentally with capitalinjections from money market borrowing increasing from R$492 billion in 2006 to R$914billion in 2008 while Banco do Brasil liabilities with Treasury and BNDES increased fromR$143 billion in 2006 to R$224 billion in 2008 The asset side of the balance sheet alsosuggests fundamental change Private sector lending increased from R$1178 billion in 2006to R$1810 billion in 2008 reflecting acquisition of portfolios from Nossa Caixa Interbankinvestments increased from R$175 billion in 2006 to R$951 billion in 2008 while interbankdeposits also increased from R$116 billion in 2006 to R$242 billion in 2008 The counter-cyclical lending strategies of the Banco do Brasil during 2008 also included an increase oflending to the public sector from R$24 billion in 2007 to R$230 billion Banco do Brasilreponses to government credit policy can also be seen in the release of 40 percent of
compulsory deposits retained at the central bank Banco do Brasil deposits at the central bankdeclined from R$334 billion in 2007 to R$212 billion in 2008 ndash freeing this value for loansand investments
Networks and relations during the second government of President Lula appeardifferent than the first given the departure from core offices of the presency by longtimeadvisors to Lula that came from the Banco do Brasil and bank workers union By late 2006only one of seven vice presidents of the Banco do Brasil was a member of President LulaacutesWorkersacute Party (PT) The corporate profile of the Banco do Brasil suggests once again thehybrid character of this government bank one listed on the Bovespa Novo Mercado but withover 65 percent of shares owned by the Brazilian federal government Treasury
8132019 Government Banking and BRICs in the Recent Financial Crisis
httpslidepdfcomreaderfullgovernment-banking-and-brics-in-the-recent-financial-crisis 1957
8132019 Government Banking and BRICs in the Recent Financial Crisis
httpslidepdfcomreaderfullgovernment-banking-and-brics-in-the-recent-financial-crisis 2057
983106983122983113983107 983111983151983158983141983154983150983149983141983150983156 983106983137983150983147983155 983137983150983140 983110983145983150983137983150983139983145983137983148 983123983156983137983156983141983139983154983137983142983156
20
customers in 2008 reached 479 million with the bank retaining 39700 AMTs and 766million bank cards (239 million credit cards and 527 million debit cards) Like the CaixaEconocircmica Federal the Banco do Brasil also processes government payments withretirement and social security payments numbering 745 million transactions during 2008Although this implies administrative costs (and receipts) this also brings customers and
prospective customers into Banco do Brasil branch officesDuring 2008 the Banco do Brasil continued to expand operations form jointventures acquire private and government banks and modernize operations A secondaryoffering of stock in January 2008 granting of shares by VISA to the Banco do Brasil andupgrading of the bank to investment grade BB- by Standard amp Poors in April 2008 suggestthat market orientation of the bank continues during the Lula administration despite counter-cyclical credit policies A Lower Income Segment Department was also created to assumeBanco Popular do Brasil operations along with correspondent banking relations and regionalsustainable development programs The Banco do Brasil also received permission to usesavings accounts for home loans enabling the bank to compete on level ground with CaixaEconocircmica Federal During 2008 the Banco do Brasil also acquired the state government
banks Banco do Piaui Banco de Santa Catarina (33rd largest bank in Brazil with US$30billion assets at year end 2007) and Satildeo Paulo government savings bank Nossa Caixa (12thlargest Bank in Brazil with US$267 billion in assets at year end 2007) In sum the diversecorporate divisions and financial operations of the Banco do Brasil provided policy optionsduring 2008 to counter the credit shortage and help firms and domestic banks to adjust
Banco do Brasil and Private Bank Returns and Capital Adequacy 2002-2009
Basel Index Return on Assets Return on Liquid Assets----------------------------- ----------------------------- -----------------------------BB Itauacute Bradesco BB Itauacute Bradesco BB Itauacute Bradesco
--------------------------------------------------------------------------------------------------------------2002 122 184 179 12 26 20 302 288 2832003 137 198 199 11 28 16 231 297 2282004 152 206 188 13 30 23 240 292 3092005 171 170 173 12 37 26 187 353 2842006 173 171 188 28 31 25 267 288 2632007 156 179 156 14 32 22 222 321 2442008 152 161 169 25 19 16 304 221 2112009 150 165 166 12 13 14 238 182 195-------------------------------------------------------------------------------------------------------------- Annualized first quarter 2009 resultsSource Banco do Brasil Itauacute and Bradesco Annual Reports 2002-2009
Comparison of Banco do Brasil returns and capital adequacy with the two majorprivate Brazilian banks Itauacute and Bradesco suggests that the performance and solidity of theBanco do Brasil remains equal or superior to private banks During 2002 and 2003 thecapital adequacy of the Banco do Brasil and return on assets remained below levels reportedby the two largest Brazilian private banks suggesting the impact of counter-cyclical lendingHowever after 2004 the Basel index of the Banco do Brasil reached 171 far above BISstandards of 80 and Central Bank of Brazil requirements of 110 Furthermore from 2006through first quarter 2009 returns on assets returns on liquid assets and the Basel index ofthe Banco do Brasil exceed levels reported by Itauacute and Bradesco In sum despite providingcounter cyclical credit and despite having been replaced by the Itau-Unibanco merger as the
8132019 Government Banking and BRICs in the Recent Financial Crisis
httpslidepdfcomreaderfullgovernment-banking-and-brics-in-the-recent-financial-crisis 2157
983106983122983113983107 983111983151983158983141983154983150983149983141983150983156 983106983137983150983147983155 983137983150983140 983110983145983150983137983150983139983145983137983148 983123983156983137983156983141983139983154983137983142983156
21
largest Brazilian bank the performance and capital adequacy of the Banco do Brasil remainsat or above levels reported by the two largest private banks
In sum since liberalization of banking and finance and privatization of stategovernment banks during the 1990s the Banco do Brasil has been transformed from directstate owned bank into one of two very large financial conglomerates that dominate domestic
banking in Brazil Instead of retaining easy access to funds at Treasury to cover losses theBanco do Brasil has adopted international corporate governance standards to become listedon the Bovespa Novo Mercado and retains an important role in virtually every aspect ofBrazilian banking and finance Although sale of shares in the 1990s were designed to transfercorporate governance and control of the national bank to the private sector the federalgovernment retains 65 percent of stocks after two sale of stocks capitalized the bank duringthe 2000s The massive size and wide scope of Banco do Brasil networks across bankingfinancial markets political and social forces and business have led the bank to realize recordprofits during the period of growth from 2004-2008 and provide counter-cyclical credit toavert a further decline in industrial activity and the economy as the US and global financialcrisis hit Brazil first with a 50 percent decline in the Bovespa stock market and credit
shortage followed by a steep but short decline in industrial production in late 2008 Thetransparency of Banco do Brasil quarterly reports and advances in Central Bank of Brazilsupervision of domestic banking clarify the new tensions that have emerged during the PTgovernment of President Lula These tensions reflect the modernization and competitiveadvantages of the Banco do Brasil
Caixa Econocircmica Federal (Federal Savings Bank Caixa)
The third largest domestic bank the wholly government owned Federal Savings Bank Caixawas also called on by President Lula during the recent financial crisis to increase the pace ofgrowth provide counter cyclical credit during downturns and to reduce consumer andcorporate interest rates and bank spreads Review of balance sheets and policies since 2001suggest that the Caixa retains its core business in urban development home loans real estatetransfer of funds for government programs and services and lottery administration Howeverinvestment banking management of third party funds and the creation of of new products andservices have both increased profits and increased popular access to banking and socialservices The bank has recorded record profits since R$108 billion (2002) R$16 billion(2003) and R$14 billion (2004) The Caixa became the fourth largest Brazilian investmentbank by 2003 while gaining dealer status from the Central Bank of Brazil in primary andsecondary markets for government securities At year-end 2003 the bank retained anestimated R$767 billion of government paper (over ten percent of government paper) in its
portfolio assets earning over R$135 billion that year Since recovery of the Brazilianeconomy in 2004 the Caixa has reported strong profits and continued to improve thestructure of its balance sheet and converge toward international bank reporting standards
In terms of assets deposit base and the number of employees and branches the datasuggest that the Caixa has emerged from a process of rationalization and downsizing duringthe late 1990s and expanded ldquoorganicallyrdquo since capitalization in 2001 Assets declined fromover US$999 billion in 1997 to US$363 billion in 2002 after reorganization andcapitalization Deposits also declined from US$541 billion in 1997 to US$216 billion in2002 The number of employees and branches declined from 104253 and 2316 to 98971 and1803 respectively but returned to 104934 and 2428 by 2006 After reorganization andcapitalization in June 2001 Basel indexes and the ratio of fixed assets over equity indicate
substantial reform and transition toward international banking standards The Basel Index thatmeasures the adequacy of capital reserves against possible losses and risks increased from
8132019 Government Banking and BRICs in the Recent Financial Crisis
httpslidepdfcomreaderfullgovernment-banking-and-brics-in-the-recent-financial-crisis 2257
983106983122983113983107 983111983151983158983141983154983150983149983141983150983156 983106983137983150983147983155 983137983150983140 983110983145983150983137983150983139983145983137983148 983123983156983137983156983141983139983154983137983142983156
22
135 (49 in March 2001 before capitalization) to reach 278 and remain twice above theCentral Bank minimum of 110 at 252 in 2006 The ratio of fixed assets as a proportion ofequity also declines substantially from 638 at year end 2001 to 197 in 2007
Summary of Caixa Structure and Performance 1995-2007
Assets Profits Deposits Employees Branches Basel FAEquity1995 826 672 503 99866 23161996 907 2351 515 99343 21051997 999 875 541 96300 18031998 948 1693 499 94859 18191999 684 1571 344 94194 19192000 644 1362 322 104253 19212001 436 -1265 298 98971 2013 135 6382002 363 1462 216 106548 2147 146 5372003 521 2617 281 100498 2046 192 413
2004 556 2999 345 100164 2135 202 3612005 806 4852 456 106729 2321 278 2012006 981 4874 567 104934 2428 252 1972007 1409 4485 800 106770 2052 288 1282008 1266 5735 708 103895 2069 206 119
Note Assets amp Deposits = US$billion Profits = US$million Basel = BIS Basel Accord index of capital reserveadequacy FAEquity = Fixed Assets Equity a summary indicator of bank modernizationSource Central Bank of Brazil Top 50 Banks in Brazil available at wwwbcbgovbr
Caixa Annual Reports and transition toward Central Bank and international bankaccounting standards introduce breaks in the time series of financial performance after 2001
However international bank reporting standards have been used by the Caixa since 2005 andthe data provide further view of the policies and performance of the bank Table X reportsreturns on stockholder equity assets Basel solvency index immobilization index provisionsas a percent of credit operations bank efficiency index and coverage of personnel costs Thedata are consistent with the broader comparisons reported in chapter two that suggest highprofits and returns alongside higher levels of provisions and reserves against capital riskReturns on stockholder equity have remained above 20 percent per year reaching 306percent in 2008 Returns on liquid assets remained between 09 percent and 13 percentbelow the average levels recorded by private and foreign banks The Basel Index of the Caixaremained well above the 11 percent level required by the Central Bank declining from 279in 2005 to 206 in 2008
Caixa Performance Indicators 2005-2008
Indicator 2005 2006 2007 2008 2009 2010 2011--------------------------------------------------------------------------------------------------------------------------Return on Shareholder Equity 261 260 226 306Return on Liquid Assets 11 11 09 13Basel Solvency Index 279 253 289 206Immobilization Index 201 197 129 120Provisions as Credit Operations 101 98 91 86Efficiency Index 645 642 755 718Coverage of Personnel Costs 925 896 943 868
---------------------------------------------------------------------------------------------------------------------------Source Caixa Econocircmica Federal Relatoacuterios de Administraccedilatildeo 2005-2011
8132019 Government Banking and BRICs in the Recent Financial Crisis
httpslidepdfcomreaderfullgovernment-banking-and-brics-in-the-recent-financial-crisis 2357
983106983122983113983107 983111983151983158983141983154983150983149983141983150983156 983106983137983150983147983155 983137983150983140 983110983145983150983137983150983139983145983137983148 983123983156983137983156983141983139983154983137983142983156
23
The immobilization index of the Caixa also declined from 201 percent in 2005 to120 percent in 2008 suggesting transition toward standard levels of international bankingHowever the value of provisions as a percent of credit operations remains much higher thaninternational bank practices albeit declining from 101 percent in 2005 to 86 percent in2008 Finally both the substantial increase in efficiency index from 645 to 718 percent
suggests that the Caixa has distanced further from international private bank levels that tendto approach 500 percent This has resulted in the declining level of coverage of personnelcosts and indicates the comparatively larger organizational structure and less use ofoutsourced labor at the Caixa
Caixa Deposits and Sources of Funds 2005-2008 R$million
2005 2006 2007 2008 2009 2010 2011----------------------------------------------------------------------------------------------------------------Bank Deposits 692 863 1155 1320Savings Deposits 5328 6006 7560 9255Mid-Term Savings Deposits 3873 4219 4136 4862
Certificates (1270) (1412) (1244) (1831)Escrow (2602) (2806) (2891) (3031)
Funds and Programs 794 1034 1307 1100Other 009 015 019 013Caixa Total 10690 2139 14179 6552Bank System Total 68268 78148 92672 27482Caixa Deposits as Total (156) (155) (1531) (129)----------------------------------------------------------------------------------------------------------------Source Caixa Econocircmica Federal Relatoacuterios de Administraccedilatildeo 2005-2008
The liability side of Caixa balance sheets from 2005-8 suggests that the bank hasdistanced itself from reliance on official savings programs and funding toward consumerbank and savings deposits Bank deposits increased from R$69 billion in 2005 to overR$132 billion in 2008 Savings deposits increased from R$532 billion in 2005 to overR$925 billion in 2008 Furthermore the increase of mid-term savings deposits originatedfrom sale of savings certificates instead of escrow held by the Caixa the latter subject to
judicial review and removed from balance sheets in 2008 The value of funds deposited at theCaixa from government funds and programs increased from R$79 billion in 2005 to R$110billion in 2008 although it remains less than ten percent of total deposits In terms of totalvalue of deposits and savings the Caixa increased total value of deposits from 107 billion toover 165 billion from 2005-8
Caixa Loans 2005-8 R$ million2005 2006 2007 2008 2009 2020 2011
----------------------------------------------------------------------------------------------------------------Commercial 14652 16329 19134 28854
Consumer 8925 9474 11063 13747Business 5727 6854 8071 15107
Home 20208 26113 32475 45075Sewage and Infrastructure 1646 2556 3585 5445Other 690 691 694 689Risk Provision -3773 -4469 -5090 -6900Total Caixa Loans 37195 45689 55888 80062----------------------------------------------------------------------------------------------------------------Source Caixa Econocircmica Federal Relatoacuterios de Administraccedilatildeo 2005-8
8132019 Government Banking and BRICs in the Recent Financial Crisis
httpslidepdfcomreaderfullgovernment-banking-and-brics-in-the-recent-financial-crisis 2457
983106983122983113983107 983111983151983158983141983154983150983149983141983150983156 983106983137983150983147983155 983137983150983140 983110983145983150983137983150983139983145983137983148 983123983156983137983156983141983139983154983137983142983156
24
In terms of lending the data suggests that the primary focus of the Caixa on homeloans continued during the late 2000s although substantial increases in commercial lendingfor consumer credit and businesses suggest the diversification of the Caixa across creditmarkets Since 2005 Caixa lending to consumers and business increased from R$89 billionto R$137 billion and from R$57 billion to R$151 billion respectively in 2008
And unlike the high levels of bad and late credit reported during the adjustment to theend of high inflation in 1994-6 and financial crises (1994-5 1997 1998 1999 2001 2003)the level level of late loans at the Caixa fell substantially during the years of economicgrowth and credit expansion from 2006-2008 The percent of late over total loans at the Caixafell from 68 percent in 2006 to 40 percent in 2008 for commercial loans generally and from62 percent to 59 percent for consumer loans and 75 percent to 22 percent for loans tobusiness The value of late home loans as a percent of total home loans also fell from 31 to17 percent in 2008
Caixa AA-H Credit Classification 2001-8
Days Prov-Late ision 2001 2002 2003 2004 2005 2006 2007 2008 2009 2010 2011
---------------------------------------------------------------------------------------------------------------------------------------AA lt15 0 59 56 66 63 54 50 63 94A lt15 05 243 264 313 288 393 435 401 333---------------------------------------------------------------------------------------------------------------------------------------B 15-30 1 127 126 137 139 143 158 206 271C 31-60 3 203 166 145 169 167 192 194 192D 61-90 10 178 261 207 217 133 60 45 33---------------------------------------------------------------------------------------------------------------------------------------E 91-120 30 18 19 20 20 22 13 09 07F 121-50 50 49 15 15 14 10 07 07 07G 151-80 70 15 08 09 10 08 10 10 09
H gt180 100 104 87 85 77 68 72 61 51R$billion 2094 2353 2614 3016 3855 4736 5739 818---------------------------------------------------------------------------------------------------------------------------------------Source Caixa Annual Reports 2002-2008
The credit risk matrix of Caixa loans from 2001 to 2008 confirms this trend ofimprovement (See above table) The data also provide evidence of greater transparency andthe improvement of bank reporting and accounting standards as well as Central Banksupervision of banks Instead of two categories of credit (good = all loans up to 90 daysoverdue bad = loans over 90 days overdue) the Central Bank of Brazil has adoptedinternational standards of credit classification (from AA to H) and imposed regulations that
banks increase or decrease provisions according to the distribution of loans in thesecategories The scale of provisions required by the Central Bank vary from zero percentagainst loans classified as AA to provision of 100 percent of loan values for credits classifiedas H that is to say over 180 days late
The percent of loans over 180 days late has decreased from 104 percent of total in2001 to 51 percent in 2008 Furthermore all categories of late payment except for loansbetween 15-30 days late decreased significantly from 2001 through 2008 In comparisonloans classified as AA (paid and guaranteed) and A (paid on time) increased from 59 percentto 94 percent and 243 percent to 333 percent of total loans The only category of late loansthat increased over the period is that of loans 15-30 days overdue from 127 percent to 271percent of total
The central argument of this study is that Brazilian federal government banks retaininstitutional foundations of competitive advantage over private and foreign banks Further
8132019 Government Banking and BRICs in the Recent Financial Crisis
httpslidepdfcomreaderfullgovernment-banking-and-brics-in-the-recent-financial-crisis 2557
983106983122983113983107 983111983151983158983141983154983150983149983141983150983156 983106983137983150983147983155 983137983150983140 983110983145983150983137983150983139983145983137983148 983123983156983137983156983141983139983154983137983142983156
25
data that suggests this advantage can be seen in the increasing volume and market share ofthe Caixa in debit and credit cards The number of Caixa debit cards increased from 224million in 2002 to over 482 million in 2008 with Caixa market share of debit cards increasedfrom 196 percent ot total card market in 2002 to peak at 230 percent in 2005 and remainingat 219 percent of the total number of debit cards in Brazil in 2005
Two examples illustrate the institutional foundations of comparative advantage of theCaixa in the card payment industry First like other banks in Brazil the Caixa shares anagreement with Visa for payment processing However unlike other banks in Brazil theCaixa was contracted by the federal government to distribute ATM citizenship cards torecepients of federal government family grants and other transfer programs Apparentlywithout seeking approval the Caixa stamped its brandname on the federal government ATMcitizenship card and has continued to do so despite charges of unfair competition fromprivate domestic banks Furthermore a Caixa request to transform its 110 million ATMcitizenship cards into bank cards currently pending at the Central Bank would dramaticallyincrease the number of bank card holders in Brazil (1824 million at year end 2007)
Caixa Debit and Credit Card Market Shares 2002-2008
Million Debit Cards Million Credit Cards MillionCaixa Total Mkt Caixa Total Mkt Interbank Checks
----------------------------------------------------------------------------------------------------------------2002 224 1142 (196) 16 407 (39) 229502003 280 1254 (223) 18 440 (40) 213602004 320 1491 (213) 20 535 (37) 196702005 377 1639 (230) 25 675 (37) 183902006 384 1744 (220) 31 952 (32) 162202007 400 1824 (219) 39 1177 (33) 144902008 482 42----------------------------------------------------------------------------------------------------------------Source Central Bank of Brazil Diagnoacutestico do Sistema de Pagamentos de Varejo do Brasil Adendo Estatiacutesticondash 2007 p 9 and Caixa annual reports 2003-2008
Having reviewed the Banco do Brasil and Caixa a brief look at the counter-cyclicalpolicies and performance of the third Brazilian federal government bank ndash the BNDES ndash is inorder
Banco Nacional de Desenvolvimento Econocircmico e Social (National Bank for Economic
and Social Development BNDES)
The BNDES is a paradigmatic development bank The trajectory of the BNDES involves asequence of policies and financial practices that have shaped Brazilian development Duringthe 1950s the BNDE supplied direct credits for transportation electric energy infrastructureand steel production During the 1960s the bank diversified under financial reforms Duringthe 1970s the BNDE acted to complete state-led import substitution industrialization bychanneling foreign finance and forced savings into capital goods project lending and regionaldevelopment programs During the 1980s the bank shifted away from public investmentunder pressure of fiscal crisis and foreign debt During the 1990s the BNDES became agentfor the privatization of state owned enterprises The BNDES remained virtually the onlysource of long-term finance during a decade of financial crises in emerging markets (1994-2003) Since 2000 the bank has shifted toward ldquosecond generationrdquo reforms designed tofinance the private sector and free market forces deepen domestic capital and equity markets
8132019 Government Banking and BRICs in the Recent Financial Crisis
httpslidepdfcomreaderfullgovernment-banking-and-brics-in-the-recent-financial-crisis 2657
983106983122983113983107 983111983151983158983141983154983150983149983141983150983156 983106983137983150983147983155 983137983150983140 983110983145983150983137983150983139983145983137983148 983123983156983137983156983141983139983154983137983142983156
26
and lend to small medium and micro-enterprises Since 2004 capital inflows and a boomingdomestic stock market have reinforced the capacity of the BNDES to underwrite long-terminvestments and transform large Brazilian firms into multinational corporations Since 2007BNDES President Coutinho has pursued a full service approach attempting to help star-upsmall and medium firms provide funds to expand successful firms and participate in venture
capital funds to help enterprises transit toward corporate governance standards and initial orsecondary offerings of stock on the Bovespa exchange In 2008 as financial crisis led to ashortage of credit collapse of share prices and sharp decline in industrial production byfourth quarter 2008 the BNDES also provided lending of last resort to major Braziliancorporations while retaining long term goals for massive investments in deep sea petroleumproduction
BNDES Market Share of Interbank and Non-Bank Loans 1995-2008 US$ Billion
Interbank Loans Non-Bank Loans------------------------------------------ ------------------------------------------
BNDES Mkt Total BNDES Mkt Total-----------------------------------------------------------------------------------------------------------1995 156 (324) 481 80 (38) 20711996 181 (354) 511 109 (49) 21981997 197 (278) 707 145 (68) 21031998 216 (355) 608 230 (113) 20201999 204 (410) 497 150 (35) 14282000 243 (439) 553 152 (96) 15772001 259 (504) 515 145 (104) 13912002 233 (443) 525 137 (130) 10512003 261 (419) 622 200 (141) 14152004 306 (408) 749 218 (122) 17862005 343 (373) 918 277 (113) 24312006 388 (350) 1106 329 (102) 32312007 524 (335) 1563 432 (88) 48852008 530 (493) 1073 456 (96) 4743200920102011-----------------------------------------------------------------------------------------------------------Source Central Bank of Brazil Top 50 Banks 1995-2008
Revew of BNDES lending since 1995 suggests the realization of competitiveadvantages typical of a large centralized development bank Contrary to the extensive branchoffice networks retained by the Banco do Brasil and Caixa the BNDES retains under 1900employees (compared to 105000 at Caixa) in the Rio de Janeiro and four regional officesSince 1995 the BNDES increased its market share of non-bank loans from R$80 billion (38percent) to R$200 billion (141 percent) during the economic downturn risk aversion andcredit shortage in 2003 After 2003 the BNDES market share of loans to non-financialentities decreased to 88 percent of total loans albeit increasing during 2008 to 96 percentThis suggests that the BNDES has increased its market share of lending to non-financialsector since liberalization of the industry and privatization of state government banks
8132019 Government Banking and BRICs in the Recent Financial Crisis
httpslidepdfcomreaderfullgovernment-banking-and-brics-in-the-recent-financial-crisis 2757
983106983122983113983107 983111983151983158983141983154983150983149983141983150983156 983106983137983150983147983155 983137983150983140 983110983145983150983137983150983139983145983137983148 983123983156983137983156983141983139983154983137983142983156
27
BNDES inter-bank lending also increases substantially Since the Real Plan endedinertial inflation in 1994 the BNDES has expanded its market share of interbank lendingfrom 156 billion (324 percent) in 1995 to 530 billion (493 percent) in 2008 during creditshortage and stock market collapse During previous years of financial crisis and economicreversals the BNDES also increased interbank lending significantly For example during the
1999 and 2001 crises BNDES interbank lending increased to 410 percent and 504 percentof total This marked presence in interbank loan market reflects the role of the BNDES inproviding indirect lending to targeted sectors through private foreign and other governmentbanks in Brazil
BNDES Loan Approvals by Program 1995-2007 R$ Billion
Direct Lending 1999 2000 2001 2002 2003 2004 2005 2006 2007 2008 2009--------------------------------------------------------------------------------------------------------------------------------------Finem 51 55 68 133 79 114 132 145 220 285Capital Markets 16 19 09 08 09 06 20 34 35 104Export-Import 23 34 39 77 63 56 67 40 13 32
Sub-Total 91 109 118 219 153 177 220 221 269 424Percent Total (505) (474) (468) (585) (456) (447) (469) (430) (415) (464)
Indirect Lending--------------------------------------------------------------------------------------------------------------------------------------Finem 31 40 37 16 12 16 18 27 51 60Finame 16 25 33 40 53 66 93 107 170 221Finame Agro 07 13 18 30 28 45 21 14 20 27Finame Leasing 00 000 02 02 03 02 04 06 14 16Export-Import 14 23 20 40 56 54 73 97 67 95BNDESautom 18 17 22 24 27 34 36 35 50 55Sub-Total 89 120 134 154 182 220 249 292 379 484Percent Total (495) (526) (532) (415) (544) (553) (531) (570) (585)(536)
BNDES Total 180 230 252 374 335 398 469 513 648 908----------------------------------------------------------------------------------------------------------------Source BNDES statistics by modality available on wwwbndesgovbr
Review of BNDES finance by program suggests the evolution of credit policies from1995 through 2008 and increasing reliance on indirect lending through other financialintermediaries The three major programs of direct finance Financiamento aEmpreendimentos (Business Finance Finem) Mercado de Capitais (Capital Markets) andExport-Import finance remained between 505 percent and 415 percent of total BNDESlending with the exception of 2002 Indirect lending through six broad programs remained
between 495 percent and 585 pecent of total BNDES lending with the exception of 2002Indirect lending programs include Finem business lending Financiamento de Maquinas(Machine Finance Fineme) with agricultural and leasing modalities Export-Import financingand BNDES automatic lending provisions
These trends suggest the realization of competitive advantages over private andforeign banks in Brazil BNDES long term interest rates remained substantially lower thanSelic benchmark overnight inter-bank interest rates throughout this period while the lowercost of small staff and operations of the BNDES made lending at these rates viable Anothercompetitive advantage of the BNDES over private and foreign banks is the developmentbankacutes mandate as manager of funds from the forced savings fund Fundo de Amparo ao
Trabalhador (Worker Asssistance Fund FAT) Constitutionally mandated investments inproductive activities (not government bonds) increased from R$31 billion in 2000 to R$101
8132019 Government Banking and BRICs in the Recent Financial Crisis
httpslidepdfcomreaderfullgovernment-banking-and-brics-in-the-recent-financial-crisis 2857
983106983122983113983107 983111983151983158983141983154983150983149983141983150983156 983106983137983150983147983155 983137983150983140 983110983145983150983137983150983139983145983137983148 983123983156983137983156983141983139983154983137983142983156
28
billion in 2008 comprising 170 percent of BNDES liabilities This means that 170 percentof BNDES finance and lending is based on long-term deposits that provide no liquidity riskThis provides a competitive advantage over private and foreign banks
A closer look at BNDES lending by sector suggests that the bank still focuses
primarily on industry and infrastructure Despite the adoption of second generation reformsthat seek to free market forces and accelerate innovation and productivity through small andmedium enterprises BNDES lending still focuses on large scale industrial and long-terminfrastructure finance In this respect the BNDES embodies a persistent need in developingeconomy for state-led development banking along the lines emphasized by Lewis Myrdaland development economists 50 years ago This traditional sense of commanding heights thusstill captures the role of the BNDES in Brazilian political economy Despite more than twodecades of privatizations financial liberalization bank reforms and a variety of fiscalfinancial and economic reforms that have substantially modernized the domestic Brazilianeconomy and freed market forces the BNDES remains the single most important source forlong-term finance and credit The capitalization of the Bovespa stock market from 2004-
2008 for the first time in Brazilian history reduced the virtual monopoly of BNDES overlong term finance
BNDES Operations approved and invested by Sector 1998-2007 R$billion
1998 1999 2000 2001 2002 2003 2004 2005 2006 2007Industry ----------------------------------------------------------------------------------------------------------------------------approved 96 79 126 152 171 163 145 290 395 402invested 76 84 104 132 174 161 158 234 272 306
Infrastructure ----------------------------------------------------------------------------------------------------------------------approved 116 69 110 65 161 149 137 186 240 369invested 83 66 86 75 130 100 152 171 170 209
Other--------------------------------------------------------------------------------------------------------------------------------approved 18 47 40 54 79 93 117 69 108 126investedTotal --------------------------------------------------------------------------------------------------------------------------------approved 230 195 276 271 411 404 379 545 743 897invested 190 181 230 252 374 335 398 470 513 617
----------------------------------------------------------------------------------------------------------------Source BNDES Annual Reports 2003-2008 and testimony of BNDES President to Congress March 2009
Long-term investments have produced substantial profits at the BNDES The bank hasrecorded profits each year since 1999 increasing from over R$600 million in 1999 overR$32 billion during 2005 reaching over R$73 billion in 2007 The long-term character of
BNDES finance stands in stark contrast to policies at private banks Contrary to strategy ofprivate and foreign banks to trade and hold government paper described in chapter three theBNDES suspended purchase and trading in government paper because of constitutionalmandates to contribute to development and employment Furthermore the turn to capitalmarkets at the BNDES has provided substantial returns since 2004
However this does not mean that BNDES lending protected unproductive industriesInstead of wasting resources to unnecessarily bail out firms or provide crony credit highreturns and strong profits at the BNDES suggest that lending was sound Standard indicatorsof bank performance asset quality and capital reserves against credit and capital risk provideempirical control for this All these measures suggest that the BNDES weathered the periodof adjustment and sustained counter-cyclical investment policies without placing resources atrisk beyond Central Bank of Brazil regulations and BIS guidelines And returns have
8132019 Government Banking and BRICs in the Recent Financial Crisis
httpslidepdfcomreaderfullgovernment-banking-and-brics-in-the-recent-financial-crisis 2957
983106983122983113983107 983111983151983158983141983154983150983149983141983150983156 983106983137983150983147983155 983137983150983140 983110983145983150983137983150983139983145983137983148 983123983156983137983156983141983139983154983137983142983156
29
increased since recovery in 2004 BNDES participation in the booming Bovespa stock marketsince 2003 has provided record returns
The BNDESpar subsidiary that invests in capital markets has also recorded strongreturns during the period of economic growth and into the 2008 financial crisis BNDESparreturns on liquid assets increased from 75 percent in 2004 to 277 percent in 2007 declining
to 245 percent in 2008 Average returns on assets and stock holdings also remained highbuilding the assets held by the BNDESpar subsidiary from 141 billion in 2005 to 359 billionin 2008
This increased participation of the BNDES in capital markets involves new relationsand networks across government private sector labor unions the private pension funds ofgovernment bank and government enterprise employees and financial markets By 2007BNDES participation in stockholding and mutual funds reached across 261 forms and 25mutual funds totaling over R$910 billion reals The BNDES thereby retains broad portfoliothat represents institutional foundations of comparative advantage Furthermore unlike thepolicy of private and foreign banks to trade and hold high interest rate paying short termgovernment paper during the sudden stop of foreign finance and downturn in the Brazilian
business cycle (2002-3) the BNDES expanded credit operations and reduced financialoperations in secondary markets for indexed government paper This countered the perverseimpact of the liquidity preference among private and other government banks that increasedmarket pressures and led to shorter terms and higher cost of Brazilian government debt
BNDES aversion of government paper is required by constitutional mandate tomanage forced savings funds in ways that generate employment and income As noted alarge part of BNDES resources (liabilities) are from domestic official savings programs Thevalue of FAT resources increased from R$492 billion in 2003 to R$662 billion in 2005while the PIS-Pasep fund remained at approximately R$200 billion Foreign capital has alsobeen channeled to the BNDES through multilateral agencies and foreign bond issues Foreignloans to the BNDES have declined Multilateral agencies provided R$70 billion in 2003increased funding to R$129 billion during 2004 and continued to provide R$107 billion tothe BNDES during 2005
Comparison of BNDES structure and performance with development banks abroadsuggests both the large scale and scope of BNDES operations and controls formismanagement and political abuse of the bank In 2007 BNDES total assets are almostdouble the value reported by the Inter-American Development Bank (IADB) over frac12 thevalue of total assets held by the World Bank and almost ten times the value of assets held bythe French government development bank CAF Furthermore profits and loans from theBNDES far exceeded all three institutions The US$330 billion in loans reported by theBNDES far exceed the US$67 billion from the IADB the US$110 reported by the World
Bank and US$58 billion reported by the CAF BNDES profis returns on assets and return onliquid patrimony also far exceeded those reported by these three development banks thatserve as comparative control over performance and policies at the BNDES Finally lateloans at the BNDES remained at 011 percent of total loans well below levels reported by theWorld Bank comparable to the 010 percent reported by the IADB while considerably abovethe 001 percent reported by CAF
8132019 Government Banking and BRICs in the Recent Financial Crisis
httpslidepdfcomreaderfullgovernment-banking-and-brics-in-the-recent-financial-crisis 3057
983106983122983113983107 983111983151983158983141983154983150983149983141983150983156 983106983137983150983147983155 983137983150983140 983110983145983150983137983150983139983145983137983148 983123983156983137983156983141983139983154983137983142983156
30
Comparison of BNDES and Regional Development Banks 2007 US$ billion
BNDES IADB World Bank CAF----------------------------------------------------------------------------------------------------------------Total Assets 1144 699 2080 125
Liquid Patrimony 140 203 399 41Liquid Profits 38 01 -01 04Desembolsos 339 67 110 58Credit Portfolio 928 479 978 95Capitalization percent 123 291 192 328Return on Assets percent 38 47 na 36Return on PL percent 332 07 na 105Late Loans percent 011 010 086 001----------------------------------------------------------------------------------------------------------------Source BNDES Annual Report 2007
The large scale of BNDES lending and finance make it possible for governmentpolicy to provide counter cyclical credit to avert or ameliorate economic downturns andsubstitute private and foreign credit shortages In March 2009 testimony to Congress ongovernment policies during financial crisis BNDES President Coutinho argued that bankpolicy was to reduce the cost and increase the supply of credit Resources for counter cyclicallending during 2008-2009 came from Treasury loans to BNDES released by provisionaldecrees 439 and 414 summing R$175 billion transfer of R$60 billion in CVS funds sale ofFGTS Investment Fund and bank certificates summing R$170 billion Furthermore the thirdphase of conditional credit facility shared by Inter-American Development Bank and theBNDES provided the last tranch of a total US$60 billion for BNDES operations
Two further means were used by the BNDES to infuse capital during the collapse of
the stock market and shortage of credit during 2007-8 The counter cyclical policies of theBNDES can also be seen in the over two fold increase of BNDES holdings in private equityand investment funds Table 512 reports the value of private equity and investment fundholdings of the BNDES in 2007 and 2008 BNDES funds in private equity and mutual fundsincreased from R$4038 million in 2007 to over R$10 billion in 2008 The capitalization ofmutual funds and private equity firms by the BNDES also played an important countercyclical role during this period
BNDESpar Shareholding 2007-8 R$million
Percent Value ValueShares 2008 2007
----------------------------------------------------------------------------------------------------------------Ameacuterica Latina Logiacutestica 106 6386 -Aracruz 55 1292 1292Banco do Brasil 25 10854 12752Bom Gosto (2) 345 2458 -Brasil Telecom Part 30 1666 1958Braskem 52 2275 2432Brenco 209 1400 -CEG 345 1406 -CESP 57 2347 1397Coteminas 103 1150 1340
CPFL Energia 62 6081 5506Cia Sideruacutergica Nacional 36 1513 2686CVRD 40 15082 7098
8132019 Government Banking and BRICs in the Recent Financial Crisis
httpslidepdfcomreaderfullgovernment-banking-and-brics-in-the-recent-financial-crisis 3157
983106983122983113983107 983111983151983158983141983154983150983149983141983150983156 983106983137983150983147983155 983137983150983140 983110983145983150983137983150983139983145983137983148 983123983156983137983156983141983139983154983137983142983156
31
ELETROBRAacuteS (1) 118 22400 22400EMBRAER 50 1096 1096Gerdau 35 1533 490Independecircncia 139 2500 -JBS 130 14722 11370Klabin 202 5621 -
Light 336 8225 -Marfrig 146 8176 1020MPX Mineraccedilatildeo 26 1791 1791Ouro Fino 200 1057 840Paranapanema 175 1252 08Petrobraacutes 76 10226 10226Rede Energia SA 253 2633 -Tele Norte Leste Participaccedilotildees 16 1645 1645Valepar 97 26254 15585Subtotal 163055 102941Other firms 12223 12606Total 175278 115548----------------------------------------------------------------------------------------------------------------
Source BNDESpar Financial Statements 2008 pp
The BNDES also holds blocks of shares in many major Brazilian corporationsthrough its participation subsidiary BNDESpar Comparing value of investments in 2007 and2008 suggests that large purchases capitalized firms precisely as financial crisis and downturnin Bovespa stock market made it difficult for firms to find working capital Table X reportsthe percent of total company shares held by the BNDES and their respective market values(adjusted for risk of future losses) at year end 2007 and 2008 During this year of extremelyshort and expensive credit in Brazil caused by the international financial and banking crisisthe BNDES increased shareholding by over R$60 billion reals in 28 private Brazilianenterprises Further shareholding classified as X in Five firms (Bertin 269 Brasiliana 538
Copel 239 Rio Poliacutemeros 250 Telemar 313) Once again the BNDES provided access tocapital for firms caught in the sudden credit crunch and stock market collapse unable to meetobligations or raise funds through equity issues or commercial bank credit This countercyclical role of government banks has been critical in Brazil since the 19 th century
BNDESpar Private Equity and Fund Participation 2007-2008 R$million
Fund Manager 2008 2007-------------------------------------------------------------------------------------------------------------------------Brasil 21 Dynamo 46 60PROT Mellon Financial Services 4628 -
Logiacutestica Brasil Bradesco 135 -Fire BrasilPrivate 269 250FIPGG Governanccedila amp Gestatildeo Inv 289 311Opportunity Equity Partners Mellon Financial Services 1046 578Brasil Energia Bradesco 1184 655InfraBrasil ABN-Amro 677 251Rio Bravo Cinema Rio Bravo 116 110Brascan Petro amp Gaacutes Bank Brascan 136 113AG Angra Infra-Estrutura Bradesco 380 301Satildeo Paulo Metro Fund Bradesco 791 831Other Funds 653 572Total 10356 4038---------------------------------------------------------------------------------------------------------------------------
Source BNDESpar Financial Statements 2008
8132019 Government Banking and BRICs in the Recent Financial Crisis
httpslidepdfcomreaderfullgovernment-banking-and-brics-in-the-recent-financial-crisis 3257
983106983122983113983107 983111983151983158983141983154983150983149983141983150983156 983106983137983150983147983155 983137983150983140 983110983145983150983137983150983139983145983137983148 983123983156983137983156983141983139983154983137983142983156
32
Finally Brazilian federal government triennial plans include investment targets by theBNDES If current plans are compared to 2004-7 investments several structural changes inBNDES lending appear First BNDES plans for Oil and Petroleum production reveal aprofound change for Brazilian political economy In 1990 roughly 45 percent of oilconsumed in Brazil was imported In 2007 before oil price increased reversed the balance
Brazil reported domestic production levels sufficient to meet domestic consumptionFurthermore discoveries of substantial deep sea oil reserves have led the BNDES to planmassive investments involving Petrobras and other global petroleum firms For the 2009-2012 period investments in petroleum and gas (R$2697 billion) Petrochemicals (237) andEthanol (197) sum to over R$3130 billion
BNDES Triennial Investment Plans 2004-2012
2004-7 2007-10 2008-11 2009-12----------------------------------------------------------------------------------------------------------------Petroleum amp Gas 1472 1836 2028 2697
Mining 472 527 813 480Petrochemicals 64 174 264 237Steel 198 371 312 245Automotive 150 176 264 235Electronics 143 156 140 240Ethanol 166 205 205 197Paper amp Celulose 104 200 274 90Health 51 46 51 80Industry Total 2816 3802 4437 4501----------------------------------------------------------------------------------------------------------------Source BNDES Annual Reports 2002-2006
It is of note that President Dilma Roussef was instrumental in reducing the targets for2009-12 in petroleum and gas given indications that Petrobras and existing framework foroffshore oil prospecting and production proved unable to increase investments accordingly
The BNDES also retains a presence in government projects by providing managementassistance During 2008 BNDES staff provided management support for implementation of192 projects involving R$710 billion of total R$142 billion PT government growthacceleration projects BNDES staff also participated in the design management andimplementation of President Lularsquos Poliacutetica de Desenvolvimento Produtivo (Policy forProduction Development) involving R$2100 billion targeting production chains designed tomaximize employment and regional development benefits Finally the BNDES was alsocharged to create and co-manage a Fundo Amazonia with the Ministry of Environment toprovide incentives to reduce deforestation of the Amazon region BNDES Plans for 2009include completion of concession for construction of high speed train line and service for Riode Janeiro-Satildeo Paulo corridor two blocks of highway concession sales involving three majorhighways in each block of sales sale of management concessions for regional airports andthe reorganization of INFRAERO federal government airport management company
These policies reflect the goal of BNDES policy to launch firms on the stock marketrather than maintain direct credit and finance Exceptions during 2008 involve Auto andEthanol industies both for strategic and broader policy reasons Given the sharp downturn inauto sales during fourth quarter 2008 the BNDES provided significant lending to avert
further downsizing or failure of auto companies in Brazil Given the current globalredistribution of automobile production BNDES policies are designed to help the Brazilian
8132019 Government Banking and BRICs in the Recent Financial Crisis
httpslidepdfcomreaderfullgovernment-banking-and-brics-in-the-recent-financial-crisis 3357
983106983122983113983107 983111983151983158983141983154983150983149983141983150983156 983106983137983150983147983155 983137983150983140 983110983145983150983137983150983139983145983137983148 983123983156983137983156983141983139983154983137983142983156
33
operations of major auto firms through the period of adjustment and increase theattractiveness of domestic operations in global production strategies of multinational autocompanies Ethanol production also received massive funds to sustain an industry seen ascritical for alternative and sustainable fuel source capable of replacing petroleum Ethanolreached over 50 percent of automotive fuel sales in 2007
Under the Lula government (2003-10 the BNDES also resumed lending to state andmunicipal governments Since the renegotiation of municipal and state government debts inthe late 1990s states and municipalities have been largely prohibited from taking on debtThis was emplematic of the recentralization required to control fiscal excesses during militaryrule and the prolonged period of transition to democracy Policies during the 1990s weredesigned to avert overspending seen as critical to maintain price stability under the Real Plan(1994) In 2000 the Lei de Responsibilidade Fiscal (Fiscal Responsibility Law) largelyprohibited credit and finance to state and municipal governments Since 2000 municipalitiesand states have been required to submit detailed budget statements that in turn have been thebasis for a gradual return to sub-national government finance In August 2006 central bankand Treasury regulations freed municipalities to take on credit up to 12 times liquid receipts
Since then the BNDES has led in terms of credits and finance to subnational governmentsthrough a Programa Especial de Financiamento aos Estados e Distrito Federal
The BNDES also has developed the first system in Brazil for risk analysis ofmunicipal governments and has led in the market for municipal credit freed by August 2006procedures for approval at Treasury the Central Bank and Conselho Monetaacuterio Nacional(National Monetary Council) Prosecution of mayors and firms charged with managingmunicipal credits with the BNDES revealed fraudulent practices These funds for sub-national public finance also became critical mechanisms to counter severe budget shortfallscaused by financial crisis during 2008 Given that municipal and state government tax basesare shallow and that federal government transfers provide the bulk of sub-nationalgovernment resources the Lula administration allocated R$ 40 billion to the Fundo deParticipaccedilatildeo dos Estados (State Participation Fund) through a Programa Emergencial deFinanciamento (Emergency Finance Fund) administered by the BNDES
In sum the BNDES expanded credit and finance operations substantially during fouryears of sustained growth from 2004-2007 And having helped underwrite the stock marketboom and capitalized Brazilian firms directly and indirectly through credit finance mutualfunds and private equity funds the BNDES retained sufficient scale scope and capital baseto provide counter cyclical credit and finance to help firms adjust to financial crisis and creditshortage during 2008 In retrospect the growth of the BNDES since liberalization andprivatizations of state government banks in the 1990s suggest the comparative advantages of
development banking BNDES credit and finance fell to 52 percent of fixed capitalformation in 1995 Since then the turn to neo-developmentalism and a period of sustainedeconomic growth during the Lula administration increased the BNDES share of total fixedcapital formation during 2006 and 2007 to 126 and 141 percent Critics charge thatmonopoly over FGTS and PIS-PASEP official savings funds as liabilities provide theBNDES with unfair competitive advantage over private banks In 2008 forced savings fundssummed to only 17 percent of BNDES liabilities (resources) The BNDES does not relyexclusively on forced savings for competitive advantage Instead market-oriented policies
joint-ventures with private mutual funds investment funds private equity firms large blocksof shareholding in Brazilian firms and massive amounts of credit and investment to theprivate sector at below market but still profitable long term interest rates of 625 percent
suggest that the large scale and scope of BNDES operations provide institutional foundationsof competitive advantage over private and foreign banks
8132019 Government Banking and BRICs in the Recent Financial Crisis
httpslidepdfcomreaderfullgovernment-banking-and-brics-in-the-recent-financial-crisis 3457
983106983122983113983107 983111983151983158983141983154983150983149983141983150983156 983106983137983150983147983155 983137983150983140 983110983145983150983137983150983139983145983137983148 983123983156983137983156983141983139983154983137983142983156
34
Capitalization of the BNDES by Treasury of over R$2300 billion 2009-11hascaptured attention of many observers of Brazilian development Critics and advocates agreethat the BNDES has realized significant competitive advantages over private and foreignbanks and continues to serve as significant alternative to capital markets for large scaledevelopment projects However like the downturn in planned investments by Petrobras for
oil and gas exploration and production BNDES decreased planned investments fromR$1684 billion in 2010 to R$1397 billion in 2011 We believe this indicates the limits ofmanagement and passing of period of crisis both favoring finance from capital marketsbanks and public-private partnerships
India
Analysis of Brazilian federal banks suggests that these institutions provided policy alternativewhile realizing competitive advantage over private and foreign banks The modernization ofthese institutions helps explain why these large institutions were able to stay the effects ofcredit crunch and financial market downturn in Brazil This section explores data from the
Reserve Bank of India to compare market shares of types of banks from 1972-2008 and bankperformance from 2006-10 Further analysis will be required However the data appears tosupport our core argument that government banks have modernized and realized competitiveadvantages over private and foreign banks
First the number of branch offices which serves as a measure of institutionalcoverage across India of special concern for financial inclusion and the theory thatliberalization and privatizations would lead private banks to expand branch offices andincrease the supply of services From this perspective the trajectory of branch officessuggests that nationalized banks the State Bank of India and regional rural bankssustain much larger networks of branch offices that predominate while otherscheduled commercial (private and foreign) banks retain less than 8000 branch offices
Data from the Reserve Bank of India on the number of current accounts retainedby type of bank provide further evidence that the State Bank of India and its associates
8132019 Government Banking and BRICs in the Recent Financial Crisis
httpslidepdfcomreaderfullgovernment-banking-and-brics-in-the-recent-financial-crisis 3557
983106983122983113983107 983111983151983158983141983154983150983149983141983150983156 983106983137983150983147983155 983137983150983140 983110983145983150983137983150983139983145983137983148 983123983156983137983156983141983139983154983137983142983156
35
national banks and regional rural banks provide the bulk of banking accounts to theIndian population while private and foreign banks cherry pick upscale urban marketsreproducing capital drain and inequalities
Number of Current Accounts by Type of Bank 1972-1995
Since 1999 the pattern of predominance by alternative banking institutions and the minorrole of other scheduled commercial banks and foreign banks continues
The following figures report the value held in current accounts by type of banks first fromthe 1972-1995 period then from the 1999-2008 period For both time periods the trendconfirms that private and foreign banks remain at a competitive disadvantage in terms of thebroader market while the State Bank of India and its associates nationalized banks andregional rural banks tend to predominate
8132019 Government Banking and BRICs in the Recent Financial Crisis
httpslidepdfcomreaderfullgovernment-banking-and-brics-in-the-recent-financial-crisis 3657
983106983122983113983107 983111983151983158983141983154983150983149983141983150983156 983106983137983150983147983155 983137983150983140 983110983145983150983137983150983139983145983137983148 983123983156983137983156983141983139983154983137983142983156
36
Current Account Value by Type of Bank 1972-1995 R
Number of Deposit Accounts by type of bank 1999-2008
A similar pattern appears for the trajectory of savings accounts both the number of
accounts and the value held in savings accounts both for the 1972-1995 period We wereunable to organize data from the more recent period
8132019 Government Banking and BRICs in the Recent Financial Crisis
httpslidepdfcomreaderfullgovernment-banking-and-brics-in-the-recent-financial-crisis 3757
983106983122983113983107 983111983151983158983141983154983150983149983141983150983156 983106983137983150983147983155 983137983150983140 983110983145983150983137983150983139983145983137983148 983123983156983137983156983141983139983154983137983142983156
37
Number of Savings Accounts by Type of Bank 1972-1995
Value in Savings Accounts by Type of Bank 1972-1995
Number of Term Savings Accounts by Type of Bank 1972-1995
8132019 Government Banking and BRICs in the Recent Financial Crisis
httpslidepdfcomreaderfullgovernment-banking-and-brics-in-the-recent-financial-crisis 3857
983106983122983113983107 983111983151983158983141983154983150983149983141983150983156 983106983137983150983147983155 983137983150983140 983110983145983150983137983150983139983145983137983148 983123983156983137983156983141983139983154983137983142983156
38
Value in Term Savings Accounts by Type of Bank 1972-1995
The number and value of credits extended by banks from 1999-2008 appears mostpromising in terms of comparative analysis of bank performance and behavior Thesignificant spread at the end of the time series between the State Bank of India and itsassociates and foreign banks suggests the impact of foreign financial crisis and differentdomestic policies by these types of banks in India similar to that noted in the Brazilianexperience
Number of credits by type of bank 1999-2008
Value of credit by type of bank 1996-2008
8132019 Government Banking and BRICs in the Recent Financial Crisis
httpslidepdfcomreaderfullgovernment-banking-and-brics-in-the-recent-financial-crisis 3957
983106983122983113983107 983111983151983158983141983154983150983149983141983150983156 983106983137983150983147983155 983137983150983140 983110983145983150983137983150983139983145983137983148 983123983156983137983156983141983139983154983137983142983156
39
Further data from the Reserve Bank of India from 2008-10 permit closercomparison of government private and foreign banks in the recent financial crisis Interms of deposits investments total assets and net profits the dominant and expandingrole of government banking in India is apparent Further control variables (not reported)
include gross and net NPA types of income expenses and expenditures provisions andcontingencies and credit- and investment-deposit ratios provide control for bad bankingand confirm the counter cyclical policies during 2008-10 in India
THE FOLLOWING TABLES REQUIRE INTERPRETATION
Number of Banks 2006-7 2007-8 2008-9 2009-10 2010-11
State Bank of India amp Associates 8 8 7 7 6Nationalized Banks 20 20 20 20 20Old Private Sector Banks 17 15 15 15 14
New Private Sector Banks 8 8 7 7 7Foreign Banks 29 28 31 32 33Source RBI A Profile of Banks 2010-11
Number of Branch Offices 2006-7 2007-8 2008-9 2009-10 2010-11
State Bank of India amp Associates 14673 15848 16894 18178 18772Nationalized Banks 37435 39255 40956 43452 45640Old Private Sector Banks 4723 4690 4908 5220 5011New Private Sector Banks 2599 3635 4333 5232 6957
Foreign Banks 272 277 295 308 316Source RBI A Profile of Banks 2010-11
Number of Employees 2006-7 2007-8 2008-9 2009-10 2010-11
State Bank of India amp Associates 255699 249008 268598 266605 282453Nationalized Banks 473179 466400 462926 473041 475082Old Private Sector Banks 47994 48700 51341 55052 55075New Private Sector Banks 91060 110123 124998 127468 163604Foreign Banks 28426 31301 29582 28012 27968
Source RBI - India BanksAssociation
Business per employee (in lakh) 2006-7 2007-8 2008-9 2009-10 2010-11
State Bank of India amp Associates 43635 54922 65022 73743 79306Nationalized Banks 49001 61828 78316 93586 114477Old Private Sector Banks 48159 56932 63843 69749 8149New Private Sector Banks 80782 83196 78715 84041 82607Foreign Banks 97477 11255 128274 141139 155974Note Business = Deposits + Advances
8132019 Government Banking and BRICs in the Recent Financial Crisis
httpslidepdfcomreaderfullgovernment-banking-and-brics-in-the-recent-financial-crisis 4057
983106983122983113983107 983111983151983158983141983154983150983149983141983150983156 983106983137983150983147983155 983137983150983140 983110983145983150983137983150983139983145983137983148 983123983156983137983156983141983139983154983137983142983156
40
Profit per employee (in lakh) 2006-7 2007-8 2008-9 2009-10 2010-11
State Bank of India amp Associates 257 362 443 466 42Nationalized Banks 287 377 486 567 695Old Private Sector Banks 234 406 469 42 563New Private Sector Banks 587 685 677 847 893Foreign Banks 1613 2112 2539 1692 2759
Capital amp Reserves amp Surplus(Ycrore) 2006-7 2007-8 2008-9 2009-10 2010-11
State Bank of India amp Associates 42941 61706 72422 83726 84394Nationalized Banks 92689 113079 135920 157276 205857Old Private Sector Banks 10736 15315 17477 20171 23821New Private Sector Banks 39736 76056 82192 99813 114768Foreign Banks 33075 49332 59937 69176 80972
Deposits Ycrore 2006-7 2007-8 2008-9 2009-10 2010-11
State Bank of India amp Associates 633476 773875 1007041 1108086 1245862Nationalized Banks 1360724 1679993 2105706 2583934 3127122Old Private Sector Banks 138249 165589 199274 229897 264157New Private Sector Banks 413738 509444 537104 592904 738602Foreign Banks 150750 191161 214076 232099 240689
Investments Ycrore 2006-7 2007-8 2008-9 2009-10 2010-11
State Bank of India amp Associates 211875 263823 357624 387473 385697Nationalized Banks 452981 536018 655042 828125 942837Old Private Sector Banks 43647 54080 72393 83499 92617New Private Sector Banks 171008 224498 234139 270618 329403Foreign Banks 71471 98910 130354 159291 165499
Advances Ycrore 2006-7 2007-8 2008-9 2009-10 2010-11
State Bank of India amp Associates 482270 593722 739450 857937 994154Nationalized Banks 957877 1203678 1519762 1843082 2311478
Old Private Sector Banks 92887 111670 128504 154085 184647New Private Sector Banks 321865 406733 446824 478356 612886Foreign Banks 126339 161133 165385 163260 195539
Interest Income Ycrore 2006-7 2007-8 2008-9 2009-10 2010-11
State Bank of India amp Associates 53465 70428 89196 97954 109828Nationalized Banks 110720 142647 183892 208029 256490Old Private Sector Banks 11474 14614 18790 20497 23299New Private Sector Banks 38092 56377 66282 62309 73528
Foreign Banks 17924 24417 30322 26390 28520
8132019 Government Banking and BRICs in the Recent Financial Crisis
httpslidepdfcomreaderfullgovernment-banking-and-brics-in-the-recent-financial-crisis 4157
983106983122983113983107 983111983151983158983141983154983150983149983141983150983156 983106983137983150983147983155 983137983150983140 983110983145983150983137983150983139983145983137983148 983123983156983137983156983141983139983154983137983142983156
41
Other Income Ycrore 2006-7 2007-8 2008-9 2009-10 2010-11
State Bank of India amp Associates 9420 11818 16073 18394 19240Nationalized Banks 14264 20979 26394 30500 28625Old Private Sector Banks 1568 2184 2782 3152 3029
New Private Sector Banks 10745 14822 15078 17271 17697Foreign Banks 7044 10588 14894 9951 10972
Interest Expended Ycrore 2006-7 2007-8 2008-9 2009-10 2010-11
State Bank of India amp Associates 32607 47809 61770 66229 67018Nationalized Banks 69353 101093 131676 145712 164135Old Private Sector Banks 7055 9960 12834 14076 14768New Private Sector Banks 25802 38535 44123 37130 42347Foreign Banks 7603 10604 12819 8938 10622
Operating Expenses Ycrore 2006-7 2007-8 2008-9 2009-10 2010-11
State Bank of India amp Associates 15987 16993 20088 25283 29146Nationalized Banks 27268 29670 35416 40792 53819Old Private Sector Banks 2967 3235 3939 4715 5600New Private Sector Banks 12353 17032 17840 18136 22006Foreign Banks 7745 10353 12298 11102 12557
Cost of Funds 2006-7 2007-8 2008-9 2009-10 2010-11
State Bank of India amp Associates 475 59 594 532 48Nationalized Banks 48 582 609 537 493Old Private Sector Banks 498 62 667 613 55New Private Sector Banks 524 611 604 442 427Foreign Banks 403 433 446 283 311Cost of Funds = Ratio () of interest paid on deposits and borrowings to averageof opening and closing balances of deposits and borrowings
Return on advances adjusted toCoF 2006-7 2007-8 2008-9 2009-10 2010-11
State Bank of India amp Associates 372 365 395 36 405Nationalized Banks 399 369 409 382 427Old Private Sector Banks 406 426 515 482 492New Private Sector Banks 447 505 526 514 516Foreign Banks 574 66 815 716 564
2006-7 2007-8 2008-9 2009-10 2010-11
8132019 Government Banking and BRICs in the Recent Financial Crisis
httpslidepdfcomreaderfullgovernment-banking-and-brics-in-the-recent-financial-crisis 4257
983106983122983113983107 983111983151983158983141983154983150983149983141983150983156 983106983137983150983147983155 983137983150983140 983110983145983150983137983150983139983145983137983148 983123983156983137983156983141983139983154983137983142983156
42
Wages as of Total Expenses
State Bank of India amp Associates 2155 1589 1506 171 1921Nationalized Banks 1794 1405 1331 1365 1641Old Private Sector Banks 1689 1367 1326 1457 1675
New Private Sector Banks 936 956 1017 121 1383Foreign Banks 2008 1995 1944 2348 2331
Returns on Assets 2006-7 2007-8 2008-9 2009-10 2010-11
State Bank of India amp Associates 086 097 102 091 079Nationalized Banks 094 101 103 100 103Old Private Sector Banks 078 114 115 095 112New Private Sector Banks 109 113 112 138 151Foreign Banks 228 209 199 126 174
Capital Adequacy Ratio 2006-7 2007-8 2008-9 2009-10 2010-11
State Bank of India amp Associates 1232 1321 1396 1346 1225Nationalized Banks 1237 1213 1324 1318 1347Old Private Sector Banks 1208 1408 1476 1485 1456New Private Sector Banks 1199 1439 1533 1803 1687Foreign Banks 1239 1305 1432 1726 1672Note To 2007-8 = Basel I From 2008-09 = Basel-II
Net NPA Ratio 2006-7 2007-8 2008-9 2009-10 2010-11
State Bank of India amp Associates 132 143 147 150 149Nationalized Banks 094 077 068 091 092Old Private Sector Banks 096 066 09 082 053New Private Sector Banks 097 109 129 103 056Foreign Banks 073 077 181 182 067Net NPA Ratio = Net non-performing assets as net advances
In sum descriptive data from the Reserve Bank of India confirm the anomaly
and argument drawn from the Brazilian experience An important dimension of BRICcountry recovery from the global financial crisis and downturn is the counter cyclicallending policies and realization of competitive advantages of government banks Thisposes a series of new questions for business schools and scholars of public policyInstead of liberalization and privatization leading to transitions in BRIC countriestoward capital market centered financial systems and liberal market economies publicbanks have realized competitive advantages over private and foreign banks whileproviding policy alternatives to BRIC governments in the face of financial crisis andglobal economic slowdown We return to these implications in the conclusion
One development of note at the Reserve Bank of India is a policy focus onfinancial inclusion The 2008 report of the Committee on Financial Inclusion has beenfollowed by sections of the Reserve Bank of India Annual Report reserved fordiscussion of financial inclusion And instead of focusing on liberalization and
8132019 Government Banking and BRICs in the Recent Financial Crisis
httpslidepdfcomreaderfullgovernment-banking-and-brics-in-the-recent-financial-crisis 4357
983106983122983113983107 983111983151983158983141983154983150983149983141983150983156 983106983137983150983147983155 983137983150983140 983110983145983150983137983150983139983145983137983148 983123983156983137983156983141983139983154983137983142983156
43
privatization to ensure the spread of banking products and services alternative policieshave been explored One is of special note The Committee on Financial Inclusionrecommended issue of identity cards as bank cards This would profoundly change thelandscape of banking in India and has attracted attention from analysts at the CentralBank of Brazil charged with financial inclusion as well as the President of Indonesia
and apparently Uganda officials Given the revolution in information and card paymenttechnologies this policy proposal and pilot studies deserve close attention asalternatives to dramatically increase the pace of social inclusion of the bankless
8132019 Government Banking and BRICs in the Recent Financial Crisis
httpslidepdfcomreaderfullgovernment-banking-and-brics-in-the-recent-financial-crisis 4457
983106983122983113983107 983111983151983158983141983154983150983149983141983150983156 983106983137983150983147983155 983137983150983140 983110983145983150983137983150983139983145983137983148 983123983156983137983156983141983139983154983137983142983156
44
China
This section turns to a brief review of the Chinese banking sector to further explore therole of government banks in terms of their modernization competitive advantages
policy roles and capacity for counter cyclical credit that help explain why BRICcountries were able to avert the severe consequences of the global financial crisis
First figure A11 reports the basic structure of the banking system in China
Although we have been unable to compare the evolution of types of banks acrosstime in similar ways to the above data on India taken from the Reserve Bank of Indiaour research assistants have gathered the following comparative macroeconomicfinancial and balance sheet data on banking in China The data appear to be consistentwith the core argument presented in this paper ndash that government banks havemodernized since liberalization and provided policy makers with alternative means tocounter the effects of financial crisis abroad
8132019 Government Banking and BRICs in the Recent Financial Crisis
httpslidepdfcomreaderfullgovernment-banking-and-brics-in-the-recent-financial-crisis 4557
983106983122983113983107 983111983151983158983141983154983150983149983141983150983156 983106983137983150983147983155 983137983150983140 983110983145983150983137983150983139983145983137983148 983123983156983137983156983141983139983154983137983142983156
45
We lack more current information and were unable to collect data directly fromofficial sources in China to compare the trajectory of state owned private and foreignbanks As a substitute Figure 1 reports data from 2000-4 that permits initial observationof trends for this earlier period
Those present may not need reminding of the formidable record of economicgrowth in China during this 200-4 period that continues until today However data fromthe National Bureau of Statistics suggests that the Chinese banking system expanded atan even greater pace than the remarkable levels of GDP growth recorded for the 2000-4period Furthermore credit expansion was ldquoorganicrdquo in the sense that deposits
outpaced credit growth from 2000-4
Expansion of Loans in China 1999-2004
Loan Growth Total LoansYear on Year
Growth Total Depositssup1Year on Year
GrowthYear CNY billion CNY () CNY billion CNY()1999 9373 83 10878 1372000 9937 60 1238 1382001 11231 130 14362 1602002 13129 169 17092 1902003 159 211 20806 217
2004 18857 186 25319 217
sup1Based on preliminary estimates by the National Bureau of Statistics of the Peoplersquos Republic of ChinaSource National Bureau of Statistics of the PRC
Although we lack data comparable to that from the Reserve Bank of India ableto compare the trajectory of state private and foreign banks in China the sectoralbreakdown of loans and other banking and national account data confirms the profoundcapitalization of the Chinese banking system and GDP growth during from 1995-2004
8132019 Government Banking and BRICs in the Recent Financial Crisis
httpslidepdfcomreaderfullgovernment-banking-and-brics-in-the-recent-financial-crisis 4657
983106983122983113983107 983111983151983158983141983154983150983149983141983150983156 983106983137983150983147983155 983137983150983140 983110983145983150983137983150983139983145983137983148 983123983156983137983156983141983139983154983137983142983156
46
China Banking Sector Market Dimensions (1995 - 2004)
YearTotal
LoansCorp
LoansConsuLoans
HomeLoans
TotalDeposits Excess
GovBonds
CorpBonds GDP
GDPGrowth
()1995 52310 mdash mdash mdash 5376 145 330 65 5848 2511996 63100 mdash mdash mdash 6847 538 436 60 6788 1611997 73585 7341 17 130 8212 853 551 52 7446 971998 85002 8447 53 430 9529 102 9 777 68 7835 521999 95587 9394 164 1360 10831 1273 1054 78 8207 482000 108763 10453 424 3320 13486 261 1302 86 894 892001 118990 112 699 5600 15472 3573 1562 101 9593 732002 139800 12913 1067 8258 18339 4359 mdash mdash 10479 922003 169770 15401 1576 13302 22036 5059 mdash mdash 11669 1142004 194220 16848 1988 15800 25319 5897 mdash mdash 13657 170Figures = CNYB
This data reported in terms of percent GDP provides further clarity on the rapid
capitalization of loans It is of note that the bulk of loans during this period were to thecorporate sector with consumer and home loans lagging significantly
China Banking Sector Percent GDP
YEARTotal
LoansCorporate
LoansConsumer
LoansHomeLoans Deposits
ExcessDeposits
GovBonds
CorpBonds
1995 895 00 00 00 919 25 56 111996 929 00 00 00 1009 79 64 091997 988 986 02 02 1103 115 74 071998 1085 1078 07 05 1216 131 99 091999 1165 1145 20 17 1320 155 128 092000 1217 1169 47 37 1508 292 146 102001 1240 1167 73 58 1613 372 163 112002 1334 1232 102 79 1750 4162003 1455 1320 135 114 1888 4342004 1422 1234 146 116 1854 432
Sources China Banking Regulatory Commission Peoplersquos Bank of China and GoldmanSachs research estimates
Compilation of financial data from a select number of banks in China suggeststhat the pattern of bank change encountered in Brazil and India also describes theexperience of China The liberalization of the Chinese economy and the modernization
of state banks appear to describe the process of bank change instead of a process oftransition toward private banking and capital market centered financial systemAlthough we have been unable to draw data from Chinese monetary authorities thebalance sheet data suggests the clear predominance of large state banks in the politicaleconomy of banking and finance in China How these institutions were used to counterthe effects of financial crisis abroad and redirect domestic investment production andconsumption must remain a subject for further research
8132019 Government Banking and BRICs in the Recent Financial Crisis
httpslidepdfcomreaderfullgovernment-banking-and-brics-in-the-recent-financial-crisis 4757
983106983122983113983107 983111983151983158983141983154983150983149983141983150983156 983106983137983150983147983155 983137983150983140 983110983145983150983137983150983139983145983137983148 983123983156983137983156983141983139983154983137983142983156
47
Select Financial Data from Chinese Banks 2004()
CNY (billion)Total
AssetsGrossLoans
CustomerDeposits Equity
NPLRatio
()
Pre-prov
ProfitsNet
Profits
State Banks
ICBC 5671 3705 5105 163 190 653 23CCB 3905 2226 3489 195 39 605 484ABC (NA) mdashBOC 427 2146 3342 205 51 578 209Quasi-State
BoCom 1145 639 1023 54 30 131 16CMB 587 376 513 22 29 82 32CITIC Industrial 515 306 429 20 60 52 03SPDB 456 311 397 14 24 62 20China Everbright mdashGuangdong Development 345 216 301 mdash mdash mdash 32
Industrial Bank 341 203 283 10 25 37 11Quase-Private
Bank of Shanghai 216 106 179 83 51 32 26Hua Xia 304 181 270 92 40 29 10Shenzhen Development 198 126 166 43 114 28 03Bank of Beijing 209 85 174 71 mdash 26 07
Sector total 19422 25319 129Three state-banks 2692 3979 188Second tier banks 2549 3733 148
ABC = Agriculture Bank of China BOC = Bank of China
BOCOM = Bank of Communications CCB = China Construction BankCMB = China Merchantrsquos Bank CNY = yuanICBC = Industrial and Commercial Bank of ChinaNPL = nonperforming loanROA = return on assets ROE = return on equityprov = provisioningPRC = Peoplersquos Republic of ChinaSPDB = Shanghai Pudong Development BankNote Loan and deposit market share for BOC and ICBC are for their domestic operations onlySources Company data Goldman Sachs research estimates
Returns on Assets Equity and Domestic Market Shares of Major China Banks 2004()
CNY (billion) ROA () ROE ()Deposit Mkt
Share ()Loan MktShare ()
Mortgage MktShare()
State Banks
ICBC 004 14 199 187 253CCB 130 254 138 115 217ABC (NA)BOC 051 102 101 89 152Quasi-State
BoCom 015 45 37 29 34CMB 060 161 20 19 29
CITIC Industrial 007 17 17 16 18SPDB 048 153 16 16 26
8132019 Government Banking and BRICs in the Recent Financial Crisis
httpslidepdfcomreaderfullgovernment-banking-and-brics-in-the-recent-financial-crisis 4857
983106983122983113983107 983111983151983158983141983154983150983149983141983150983156 983106983137983150983147983155 983137983150983140 983110983145983150983137983150983139983145983137983148 983123983156983137983156983141983139983154983137983142983156
48
China EverbrightGuangdong Development mdash mdash 12 11 mdashIndustrial Bank 037 126 11 10 10Quase-Private
Bank of Shanghai 129 360 07 05 14Hua Xia 038 116 11 09 07Shenzhen Development 017 75 07 06 08Bank of Beijing 037 108 07 04 07
Sector totalThree state-banks 438 391 622Second tier banks 144 127 154
ABC = Agriculture Bank of China BOC = Bank of China BOCOM = Bank of Communications CCB =China Construction Bank CMB = China Merchantrsquos Bank CNY = yuanICBC = Industrial and Commercial Bank of China mkt = market NPL = nonperforming loan ROA =return on asset ROE = return on equity prov = provisioning PRC =Peoplersquos Republic of China SPDB = Shanghai Pudong Development BankNote Loan and deposit market share for BOC and ICBC are for their domestic operations onlySources Company data Goldman Sachs research estimates
Further data from 2006-10 from the Peoples Bank of China suggests that the big5 state banks continue to outperform the next 12 largest joint stock commercial banksThe big five have launched sales of shares to capitalize while listing on capital marketsand adopting reporting of financial data along lines of international standards Thisappears to be similar to Banco do Brasil policies that retain majority of shares in federalgovernment control while capitalizing the bank through issues of stock
Comparing the Performance of Big 5 State Banks and Next 12 Joint Stock CommercialBanks in China
2006 2007 2008 2009 2010
Profit Margin Big 5 State Banks 3116 3143 2586 3026 3269
Next 12 JS Commercial Banks 2050 2791 1796 2159 2365
Returns Big 5 State Banks 507 606 860 691 675(risk adj) Next 12 JS Commercial Banks 459 570 1016 714 723
Op Risk Big 5 State Banks 5548 5539 5215 5319 5322Next 12 JS Commercial Banks 5886 5721 5725 5831 5947
Leverage Big 5 State Banks 1626 1482 1724 173 1734Next 12 JS Commercial Banks 2826 2251 2064 2048 1936
ROE Big 5 State Banks 1424 1557 1999 1925 2037Next 12 JS Commercial Banks 1564 2049 2156 1840 1967
Big 4 and 11 JSCBsSource Peoples Bank of China China Financial Stability Reports 2007-11
Performance indicators reported by the Peoples Bank of China for the big 5 statebanks and 12 next largest joint stock commercial banks also suggest that the largestgovernment banks in China retain significant competitive advantages ndash and may providepolicy alternatives Given the current shift of economic policy in China away fromindustry and export led growth to more sustainable domestic oriented growth and socialinclusion the role of state banks clearly comes to the fore
8132019 Government Banking and BRICs in the Recent Financial Crisis
httpslidepdfcomreaderfullgovernment-banking-and-brics-in-the-recent-financial-crisis 4957
983106983122983113983107 983111983151983158983141983154983150983149983141983150983156 983106983137983150983147983155 983137983150983140 983110983145983150983137983150983139983145983137983148 983123983156983137983156983141983139983154983137983142983156
49
Net Operating Income of Big 5 State Banks and Next 12 CommercialBanks 100 million RMB YuanBig 5 State Banks 2006 2007 2008 2009 2010
Balance Net interest income 349703 500456 556790 532206 720152Net fee amp commission inc 48524 103817 138464 175469 232491
Investment income 216089 283725 338865 324037 340440
Other business income (1807) (17054) 47548 33791 2186
Net operating income 612509 870944 1081667 1065503 1314943
Percent Net interest income 5709 5746 5148 4995 5477
Net fee amp commission inc 792 1192 1280 1646 1768
Investment income 3528 3258 3133 3041 2589
Other business income (030) (196) 440 318 166
Net operating income 10000 10000 10000 100 100
Next 12 Joint Stock CommercialBanks 2006 2007 2008 2009 2010
Net interest income 87253 132945 198965 191276 281588
Net fee amp commission inc 7850 16247 27319 30115 42023
Investment income 20959 32172 44864 50767 50500
Other business income 2306 4498 16359 10384 7400
Net operating income 118468 185861 287507 282542 381511
Percent Net interest income 7365 7153 6920 6769 7381
Net fee amp commission inc 671 874 950 1066 1101
Investment income 1769 1731 1560 1797 1324
Other business income 195 242 569 368 194Net operating income 10000 10000 10000 10000 10000
Source Peoples Bank of China China Financial Stability Reports 2007-11
Big 4 and 11 JSCBsBig 5 = ICBC ABC BOC CCB BOCOMNext 12 Joint Stock Commercial Banks = China CITIC Bank Everbright Bank Huaxia BankGuangdong Development Bank Shenzhen Development Bank China Merchants Bank Shanghai PudongDevelopment Bank Industrial Bank China Minsheng Banking Corporation Evergrowing Bank ChinaZheshang Bank Bohai Bank
In conclusion bank change in China also appears to confirm our findings from
Brazil ndash that state banks have realized competitive advantages and increased marketshares since liberalization while providing counter cyclical credit to ameliorateadjustment to crisis The modernization of the China Postal Savings Bank is ofparticular interest given its social mission downmarket focus and 40000 branchOffices throughout the country Expansion of card payment services through the postalbank system confirms the importance of the Brazilian federal savings bank (CaixaEconocircmica Federal Caixa) as agent for federal government social policy and agentresponsible for management of citizenship cards (12 million) and payment of familygrants This back to the future modernization of savings banks has proved essential forovercoming notorious levels of social exclusion and inequality in Brazil Althoughenglish language materials are unavailable on the China Postal Savings Bank thisinstitution clearly presents profound opportunities for comparable policies in China
8132019 Government Banking and BRICs in the Recent Financial Crisis
httpslidepdfcomreaderfullgovernment-banking-and-brics-in-the-recent-financial-crisis 5057
983106983122983113983107 983111983151983158983141983154983150983149983141983150983156 983106983137983150983147983155 983137983150983140 983110983145983150983137983150983139983145983137983148 983123983156983137983156983141983139983154983137983142983156
50
Reported offer of microfinance services for poverty reduction as part of nationaleconomic stimulous plan may point to developments in this direction
Given that state planning capacity has long been at the center of attention intheories of financial statecraft the role of Chinese state banks in redirecting policiesaccording to the 12th 5 Year plan for 2011-15 seems critical From 2000-5 the 10th 5
Year plan emphasized infrastructure and the attraction of investment and labor skillsThe 11th 5 Year plan (2006-10) raised concerns about sustainability rather than growthlevels while also seeking to spread improvements to balance development better servepeople and improve the quality of life continue to support Center and West provincesand revitalize Northeast provinces In comparison the 12th 5 Year plan calls for morebalanced lsquoinclusiversquo growth and structural adjustemts more than 4 trillion RMB($US600 billion) for targeted industries and interior regions a focus on new energynew materials and information and high technologies biology and new medicineenergy converstaion and environmental protection aerospace marine and advancedmanufacturing This implies fundamental shifts away from industry to services that hasbeen reported in macroeconomic data for 2010 If past studies emphasized directed
credit and industrial change the role of Chinese state banks in realizing transformationscertainly warrants study
Although the domestic flow of funds process of liberalization (or the lackthereof) and insertion of banking into Chinese political economy is beyond the scope ofthis paper our findings from Brazil appear to provide valuable hypotheses about ChinaThat is to say the big state banks and other government banks in China remaincommanding heights not in the Marxist sense of providing means to reach socialismbut immense institutions with profound presence throughout politics and markets in thecountry In this sense our findings from Brazil appear to approximate patterns ofchange in China more than Washington Consensus expectations about liberalization andprivatizations to free private and foreign banks Financial statecraft draws attention tothe capitalization of Chinese state banks through stock Sales and listings on capitalmarkets However like the Banco do Brasil (that reformers in the 1990s sought to shiftcontrol to the private sector only to increase federal government shareholding) theChinese experience surely involves unexpected consequences and patterns of changedifferent than a linear transition to the Berle amp Means paradigm of corporategovernance
Russia The New State Duopoly
ldquoThe rush of 2003-8 increased the market share of foreign banks to 285 from
52 However the state-owned banks received enormous help from the federal budget in the days of the crisis thereby strengthening their dominant
position on the Russian financial market says Sergey Aleksashenko the formerDeputy chairman of Russias Central Bank quotes Russia Profile Today one
must not harbor any illusion of a fair competition with them all the main cash
flows in Russia are controlled by state-owned banks httpwwwbarentsnovacomnode1031
Description of banking policy in Russia during the global financial crisis can beobtained from Bank of Russia annual reports and related publications The figure on the
following page summarizes the financial flows to and from the Bank of RussiaAlthough central bank policy is beyond the scope of this study the role of state banks in
8132019 Government Banking and BRICs in the Recent Financial Crisis
httpslidepdfcomreaderfullgovernment-banking-and-brics-in-the-recent-financial-crisis 5157
983106983122983113983107 983111983151983158983141983154983150983149983141983150983156 983106983137983150983147983155 983137983150983140 983110983145983150983137983150983139983145983137983148 983123983156983137983156983141983139983154983137983142983156
51
channeling counter-cyclical credits released by the Bank of Russia appear to confirm thecore argument that emerges from our studies of the Brazilian banking system Furtherdata on the following pages also suggest that state banks in Russia performed wellduring 2008-10 confirming on the basis of sparse data taken from Bank of Russiareports and documents that public banks have modernized provided counter-cyclical
credit to reverse credit crunch and economic downturn while realizing competitiveadvantages over private and foreign banks
8132019 Government Banking and BRICs in the Recent Financial Crisis
httpslidepdfcomreaderfullgovernment-banking-and-brics-in-the-recent-financial-crisis 5257
983106983122983113983107 983111983151983158983141983154983150983149983141983150983156 983106983137983150983147983155 983137983150983140 983110983145983150983137983150983139983145983137983148 983123983156983137983156983141983139983154983137983142983156
52
The following aggregate figures reported by the Bank of Russia suggest severaltrends of significance First Chart 32 suggests that household deposits shifted fromRuble deposits to foreign currency pegged (or indexed) during 2008 Second Chart 33illustrates the substantial increase of non-bank overdue debt during second semester
2008
Consequently the financial results and profitability of banks declinedsignificantly during 2008 The greater confidence in deposits with government banksfound abroad suggests that this may have been critical in Russia
Performance data deom 2008-10 provides a clearer picture one that is consistentwith our findings in Brazil State banks appear to have outperformed all other types of
banks except medium and small regional banks The following table reports the averagereturns on assets and returns on equity reported by the Bank of Russia 2008-10
Returns on Assets and Equity by Type of Bank in Russia 2008-9
Return on assets Return on equity 2008 2009 2010 2008 2009 2010
-------------------------------------------------------------------------------------------------------------------State Banks 22 08 24 157 46 148Foreign Banks 18 11 21 146 83 145Large private banks 13 03 11 106 28 84Medium-Small Banks Moscow 15 12 14 68 52 67
Medium-Small Regional Banks 21 12 15 131 65 98--------------------------------------------------------------------------------------------------------------------Source Bank of Russia Bank Supervision Reports 2009 and 2010
8132019 Government Banking and BRICs in the Recent Financial Crisis
httpslidepdfcomreaderfullgovernment-banking-and-brics-in-the-recent-financial-crisis 5357
983106983122983113983107 983111983151983158983141983154983150983149983141983150983156 983106983137983150983147983155 983137983150983140 983110983145983150983137983150983139983145983137983148 983123983156983137983156983141983139983154983137983142983156
53
Further data from the Bank of Russia on the capital adequacy of Banks during2009-10 suggest that foreign banks and large private banks remain less capitalizedagainst risks according to Basel II guidelines albeit at levels almost double thatrecommended by the Bank for International Settlements (80 risk weighted) Although
further analysis is needed this data is consistent from that reported in Brazil thatgovernment banks tend to more cautious and more prudent in terms of placing asidehigher levels of reserves and patrimony against possible losses
Capital Adequacy of Banks by Type of Bank in Russia 2009-10
2009 2010 2011---------------------------------------------------------------------------------------------------------State Banks 184 227 186Foreign Banks 155 196 195Large Private Banks 140 181 155
Medium-Small Banks Moscow 316 312 268Medium-Small Regional Banks 219 241 207Non-Bank Credit Institutions 372 1038 678---------------------------------------------------------------------------------------------------------Source Bank of Russia Bank Supervision Report (Moscow) 2009 p 43
Finally Bank of Russia bank supervision reports also suggest that state banksexpanded their market shares of assets and capital during the years following the globalfinancial crisis While large private banks and foreign banks lost market share of bankassets and bank capital in Russia state banks increased their significant market sharefrom 405 ndash 426 percent and 471-476 percent of assets and capital respectivelyUnfortunately data from previous years and for specific banking groups was notobtained However this data does appear to indicate that our findings of competitiveadvantages and policy alternatives
Number and Market Share by Type of Bank
N Banks Assets Capital---------------------------- ---------------------------- ----------------------------
Type of Bank 2009 2010 2011 2009 2010 2011 2009 2010 2011-------------------------------------------------------------------------------------------------------------------------------State 17 22 27 405 439 458 471 489 473
Foreign 101 106 108 187 183 180 172 169 191Large Private 136 139 131 346 333 305 276 287 269Med-Small Moscow 361 335 317 27 26 26 43 34 35Medi-Small Regional 443 412 372 28 28 27 36 31 29Other Credit Institutions 50 51 57 07 04 04 01 02 03Total 1108 1058 100 100 100 100 100 100-------------------------------------------------------------------------------------------------------------------------------Source Bank of Russia Bank Supervision Report 2009 amp 2010
In sum politics and financial statecraft have led to the realization of significantcompetitive advantage by Russian state banks Sperbank and Vneshtorgbank increasedtheir share of bank assets from 32 percent in 2005 to over 50 percent by 2011 through
mergers and acquisitions and aggressive displacement of foreign banks Whatever thepolitics data from the Bank of Russia suggests that monetary authorities released a
8132019 Government Banking and BRICs in the Recent Financial Crisis
httpslidepdfcomreaderfullgovernment-banking-and-brics-in-the-recent-financial-crisis 5457
983106983122983113983107 983111983151983158983141983154983150983149983141983150983156 983106983137983150983147983155 983137983150983140 983110983145983150983137983150983139983145983137983148 983123983156983137983156983141983139983154983137983142983156
54
series of counter cyclical credit injections during 2008-9 to domestic bankinginstitutions Moreover data suggests that state banks continue to perform at or ahead oflevels reported by regional private and foreign banks The large market share andimproved performance of state banks reported in recent data suggests although the datais sparse that government banks in Russia have also modernized realized competitive
advantages and provided policy alternatives against the impact of financial crisisabroadWe were unable to find evidence of policy making toward social inclusion at the
Bank of Russia or Russian state banks despite the historical trajectory of the Sberbankas a savings bank under communism The context also appears to differ considerably Asurvey of the Zircon Research Group reportedly found that only 15 percent of Russiansretain bank accounts because of mistrust in banks and government This combination ofrealist politics and the realization of competitive advantages by Russian state bankssuggests that theories of economic statecraft in the realist tradition may indeed explainthe domestic developments under study
Conclusion
This paper reports evidence about government bank modernization and financialstatecraft in BRIC countries designed to counter the effects of crisis and shape domesticgrowth Government banks in BRIC countries have contributed to the widely notedadjustment of these economies to global financial crisis and economic downturnContrary to the Washington Consensus that prevailed during much of the 1980s and1990s (that privatization and liberalization especially of banking would free marketforces and deepen domestic financial systems) a quite different process of bank changeappears to have ensued after financial liberalization in the BRICs
Instead of replacement of state banks with private banks government banksremain central agents of domestic credit and growth and have modernized ldquojust intimerdquo The capitalization and realization of competitive advantages by large governmentbanks during the 2000s meant that once the US financial panic spread across capitalmarkets broke highly leveraged private and produced runs on private bank depositspolicy makers in BRIC countries nonetheless retained counter cyclical policyalternatives through their more solid large state banks
These findings counter traditional foci on the private sector individualentrepreneurship and ideals of free markets linked to the political and social advancesrecorded around the world in the last decades We report an anomaly for theories offinancial repression and the Washington Consensus about the virtues of privatization
and liberalization Although largely blamed for reproducing underdevelopment in thepast BRIC government banks averted excesses of private banking that drove creditbubbles such as home mortgages and derivatives in the US And since liberalization ofbanking (we have not adequately discussed how much liberalization occurred in eachcountry) government banks have modernized to compete with private and foreignbanks Government banks have realized competitive advantages and provided policyalternatives These two arguments help explain why BRIC countries have farecomparatively well in the face of financial crisis in core countries
Financial statecraft is therefore at the center of BRIC counter cyclical capacitiesand state planning Brazil Russia India and China fared significantly better thanadvanced and many developing countries in terms of adjusting to credit crunches and
export shocks This is because government banks proved critical interbank credit toretain confidence in domestic banking systems These institutions also presented other
8132019 Government Banking and BRICs in the Recent Financial Crisis
httpslidepdfcomreaderfullgovernment-banking-and-brics-in-the-recent-financial-crisis 5557
983106983122983113983107 983111983151983158983141983154983150983149983141983150983156 983106983137983150983147983155 983137983150983140 983110983145983150983137983150983139983145983137983148 983123983156983137983156983141983139983154983137983142983156
55
policy alternatives for political and social forces Politics shaped adjustment andrecovery through state banks differently in BRIC countries Given the realities of statecentered political realism in Russia the redirection of state banks toward goals ofChinese Five Year Plans and the modernization of the State Bank of India amidst anamorphous federalism the experience of Brazil with democratization and public bank
modernization may stand out (Armijo 2009)Further analysis of savings banks and cooperative banks also will be requiredAs members of the World Savings Bank Institute (a global association of savingsbanks) the Caixa in Brazil SNI and NABARD in India and China Postal Savings Bankappear to have provided access to very large numbers of previously unbanked citizensThis returns to traditional ideas of social banking and the history of savings banks thatwere founded throughout Europe since the late 18 th century The upmarket strategy andexpansion into investment banking and international banking of the Russian Sberbankconstrasts with downmarket strategies of savings banks in Brazil India and China
The financial press has recently reported doubts about bad loans in Chinese statebanks and cast doubt on the financial results posted and reported in this paper
However current estimates of 2-5 percent bad loans in Chinese state banks pale incomparison to the US$1240 billion in bad loans shifted to asset managementcompanies in the mid 2000s before capitalization of these institutions through sale ofshares Critics of state banking in Brazil also point to past levels of bad loans (reaching30-40 percent) because of their capture during military government delayed transitionBut the cost of capitalization and transfer of bad loans from Brazilian state banks alsoremained below US$400 billion and is still contingent on liquidation of assetmanagement companies created in 2001 In any case these numbers are very smallcompared to GAO estimates of US$120 trillion in emergency infusions by USmonetary authorities to banks and financial institutions from 2007-11
These are anomalies for recent market-based banking theory and neo-liberalpolicy designs However they do not run counter to orthodoxy in economics andbanking theory Over the last decades economic reforms (fiscal financial monetaryand banking) have improved transparency and brought public policy and marketexpectations closer However expectations about deregulation and free marketequilibria in banking and finance have succumbed in the face of panic and the stillsobering consequences of crisis The materials presented herein are descriptive and willrequire more careful analysis However given the urgency of searching for alternativedevelopment models and different approaches to financial statecraft in BRIC countriesand beyond we have taken the liberty to present research in initial stages and toprovoke thought along the lines suggested by our kind conveners
8132019 Government Banking and BRICs in the Recent Financial Crisis
httpslidepdfcomreaderfullgovernment-banking-and-brics-in-the-recent-financial-crisis 5657
983106983122983113983107 983111983151983158983141983154983150983149983141983150983156 983106983137983150983147983155 983137983150983140 983110983145983150983137983150983139983145983137983148 983123983156983137983156983141983139983154983137983142983156
56
Appendix on Alternative Banking and Social Inclusion
This appendix describes how ideas about government banking led to further work onalternative banking and social inclusion with help from the Rockefeller FoundationBellagio Center In July 2011 we were able to convene a conference designed to gather
scholars alternative banking executives and representatives from savings andcooperative bank associations to rethink strategies for social inclusion in the globalsouth and attempt to launch a new policy agenda Given the search for alternativestrategies to counter crisis and the advances of stabilization transparency and bankingsupervision in developing and emerging economies we call for alternative bankingcommunities in the global north and south to work together and help shape a new policyagenda for social inclusion Because savings banks credit cooperatives and otheralternative banking and finance institutions have realized competitive advantages andemerged from crisis we can now think beyond We believe that new policies may helpdeveloping and emerging nations redirect large domestic institutions such as postal andsavings banks toward meeting the UN millennium goals to eliminate poverty by 2015
Plans include writing a green paper on Core Principles for Alternative Bankingand Social Inclusion convening events to promote these principles through institutionalsupporters and networks and seeking adoption of these principles at policy venues suchas the World Savings Bank Institute the International Association of CooperativeBanks the Bank for International Settlements the International Financial ReportingStandards foundation the ISO International Standards Organization the Charter forResponsible Business regional development banks and the World Bank We also planto submit an edited volume of scholarly contributions on alternative banking and socialinclusion by year-end 2012 Interested parties are welcome to participate
Institutional supporters and networks include
Institutional SupportersColumbia University School of International and Public Affairs New YorkInstitute for Money Technology and Financial Inclusion University of CaliforniaIrvineKingacutes College Department of Management LondonSatildeo Paulo Business School Getulio Vargas FoundationSecond University of Naples
Networks
Association of Emerging Market Business Schools Satildeo Paulo BrazilCommunity of European Management Schools BrusselsCritical Political Economy NetworkEuropean Association of Co-operative Banks BrusselsGlobal Public Policy Network LondonInternational Cooperative Banking Association BrusselsSocial Science Finance Network AmsterdamSociety for Advancement of Social Economics PhiladelphiaWorld Savings Bank Institute Brussels
8132019 Government Banking and BRICs in the Recent Financial Crisis
httpslidepdfcomreaderfullgovernment-banking-and-brics-in-the-recent-financial-crisis 5757
983106983122983113983107 983111983151983158983141983154983150983149983141983150983156 983106983137983150983147983155 983137983150983140 983110983145983150983137983150983139983145983137983148 983123983156983137983156983141983139983154983137983142983156
Core Principles for Alternative Banking and Social Inclusion
Commitment to End Capital StarvationPromote access to and use of banking and financial services by all through newtechnologies and distribution channels to capitalize assets among the poor
Commitment to Universalize Income Savings Credit and FinanceProvide basic income via ATM cards and mobile banking to reach the poor and opennew channels of access to income savings credit finance insurance and opportunities
Prudent Banking and Regulatory ComplianceAlternative banking seeks to work within regulations guidelines and best practicesrecommended by domestic monetary authorities and international regulatory institutionssuch as the Bank for International Settlement Basel II Capital Risk Guidelines
Corporate Social Responsibility Leadership
Integrate corporate social responsibility into down-market business strategies andinstitutions of representation and democratization
Transparency and AccountabilityPublish annual reports and balance sheets in accord with international best practices offinancial social and sustainability reporting
Leadership in Provision of New Banking Services and Products to the PoorUse competitive advantages in banking and institutional networks to channel moreeffectively capital income and finance to the poor
Generate Sustainable Income and Household Asset AccumulationUse branch offices and new banking technologies to accelerate progress toward UNmillennium goals to eliminate poverty
Universalize Financial EducationPromote financial education to encourage responsible banking and finance and avertpredatory lending and unethical practices
Adopt Cutting Edge Technology and Management Practices to Provide
Competitive Alternative to Private Commercial and Investment Banks
Incorporate electronic card and mobile banking services to better serve the poorContribute to Realization of Bellagio Principles for SustainabilityPromote alternative banking and business practices that contribute to environmentallysustainable income consumption and production as stated in Bellagio Principles forSustainability
Respect and Build on National and Regional DifferencesI d f i l d l l i b ki i i i d i i l
8132019 Government Banking and BRICs in the Recent Financial Crisis
httpslidepdfcomreaderfullgovernment-banking-and-brics-in-the-recent-financial-crisis 1157
983106983122983113983107 983111983151983158983141983154983150983149983141983150983156 983106983137983150983147983155 983137983150983140 983110983145983150983137983150983139983145983137983148 983123983156983137983156983141983139983154983137983142983156
11
and non-payment of loans This reduces profits Strategies to ldquoholdrdquo government securitiesalso reduce profits Nonetheless government banks have reported stronger returns thanforeign and domestic banks on average since capitalization in 2001
The above data may conceal bad banking practices such as crony credit bad loans andcosts that in the end must be passed on to others through fiscal accounts or the money supply
Data from the Central Bank of Brazil help control for these possibilities and provide furthercomparison of bank performance This section compares government private and foreignbanks in terms of the Basel Index bad credit late loans and stress tests that estimate theimpact of hypothetical shocks to bank portfolios from foreign exchange devaluation andorcredit problems
First the Basel Index for government domestic and foreign banks from 2002-2006suggests that government banks remain capitalized well above levels set in Central Bank ofBrazil guidelines (110 set in 1999) The Bank for International Settlements suggests an 80level of capital in reserve against possible losses in lending and finance The average BaselIndex for government banks increased from 167 percent in 2002 to 197 percent in 2006 Incomparison the average Basel Index for private domestic banks increased from 151 pecent
to 170 percent during this period while foreign banks on average reported Basel Indexes of152 in 2002 remaining at 154 in 2006 This suggests that government banks in Brazil retainsufficient capital in reserve against risks arising from bad credit or losses in financialmarkets
Bank System Basel Index in Brazil Select Latin American and Reference Countries
2002 2003 2004 2005 2006---------------------------------------------------------------------------------------------Brazil Government 167 148 165 174 197
Private 151 171 183 177 170Foreign 152 167 187 164 154
Chile 141 136 130 125 120Mexico 144 141 145 163 159Australia 100 104 104 104 103Canada 134 133 129 125 121Spain 126 123 122 119South Africa 124 140 127 123 122
---------------------------------------------------------------------------------------------Source Central Bank of Brazil Financial Stability Report 2002-2006Note Basel Index = recommended minimum eleven percent relation between required net worth and risk-
weighted total assets
A closer look at changing Basel indexes reveal the consequences of counter-cyclicallending from federal government banks Because private domestic and foreign banks adoptedmore cautious strategies and provided less credit during the downturn of 2002 theseinstitutions maintained levels of capital reserves above levels found in government banksThe average Basel index for the domestic financial system thus remained roughly the same atyear-end 2002 (06 percent increase to 162 over June 2002) However this average concealsan increase of 21 percent in the Basel Index for private banks (largely meaning they chose tohold low risk rated government paper) and a decline of 23 percent of the Basel Index forgovernment banks (meaning they incurred risks to lend during downturn and adjustment)Before assuming the worst readers should note two matters First the Central Bank of Brazilrequires banks to maintain a Basel Index of 110 This is three points greater than the 80
8132019 Government Banking and BRICs in the Recent Financial Crisis
httpslidepdfcomreaderfullgovernment-banking-and-brics-in-the-recent-financial-crisis 1257
983106983122983113983107 983111983151983158983141983154983150983149983141983150983156 983106983137983150983147983155 983137983150983140 983110983145983150983137983150983139983145983137983148 983123983156983137983156983141983139983154983137983142983156
12
suggested in the 1988 Basel Accord and subsequent revisions for capital guidelines In otherwords Brazilian banks set aside almost half again more in additional capital reserves thanlevels recommended by the Bank for International Settlements Second the different BaselIndex ratings of government and private banks also reflects the greater weight of credit andtherefore credit risk in these institutions And data on bad and late loans since 2001 suggest
that the slight and temporarily higher levels of average Basel Indexes reported by governmentbanks do not reflect broader deterioration of portfoliosFurthermore Banks in Brazil and especially government banks tend to be more
conservative setting aside not only frac12 of deposits as compulsory reserves at the Central Bankof Brazil but also retaining additional reserves against bad loans and losses Firstcomparative data suggests that Brazilian banks tend to set considerably larger sums aside inreserve against bad loans and other losses Of the four large Latin American countries andfour further economies reported by the IMF and Central Bank of Brazil Brazil retainedsubstantially larger reserves against bad loans than any country except Spain during 2007This confirms the particular characteristics of banking in Brazil that of a higher cost andlower operating efficiency combined with larger reserves and provisions against losses
Bank Reserves as Percent of Overdue amp Late Loans in Brazil Select Latin American andReference Countries
2003 2004 2005 2006 2007 2008---------------------------------------------------------------------------------------------Brazil 3200 3719 2874 2800 2862 2709Argentina 792 1029 1251 1303 1303Chile 1309 1655 1776 1985 2107Mexico 1671 2018 2321 2074 1947Australia 1318 1829 2030 2052 1889Canada 435 477 493 553 449Spain 2454 2196 2518 2733South Africa 542 613 643---------------------------------------------------------------------------------------------Source IMF Global Financial Stability Report 2008 cited in Central Bank of Brazil Financial Stability
Report November 2008 p 56
The level of bad and late loans in bank portfolios is another measure of bank solidityThe convergence of bad credit levels in government private and foreign banks from 1988-2008 introduced this study Further comparison suggests that although government banksretain higher levels of bad and late loans in specific sectors (especially home loans) the value
of late loans as a percent of total loans in government banks fell below levels in private andforeign banks during 2008 (See table on following page) The value of bad credit (loans over12 months past due) in government banks decreased from R$372 billion in 2001 to R$149billion in June 2006 This places the value of bad credit in government banks below the valuefound in private and foreign banks Bad credit in private banks increased from R$173 billionin 2001 to peak at R$255 billion during 2003 declining to R$180 billion in 2006 Foreignbanks also reported increased values of bad credit from R$123 billion in 2001 peaking atR$141 billion in 2003 and declining to R$130 billion in 2006 While late loans remained 85percent of total loans in government banks in 2001 (above 75 percent in private and 65percent in foreign banks) by 2008 the relation reverses In 2008 late loans declined to 32percent of total loans at government banks while remaining at 37 percent in private banksand 45 percent in foreign banks
8132019 Government Banking and BRICs in the Recent Financial Crisis
httpslidepdfcomreaderfullgovernment-banking-and-brics-in-the-recent-financial-crisis 1357
983106983122983113983107 983111983151983158983141983154983150983149983141983150983156 983106983137983150983147983155 983137983150983140 983110983145983150983137983150983139983145983137983148 983123983156983137983156983141983139983154983137983142983156
13
Moreover government banks in Brazil continue to set aside greater provisions againstbad and late loans than private or foreign banks In 2004 government banks retained 86percent of the value of total loans in provision against losses from non-paying loans whileprivate banks retained 60 percent and foreign banks 51 percent In 2008 the level ofprovisions at government banks had declined on average to 68 percent but still remained
well above the levels of 52 and 51 percent recorded at private and foreign banks
Late Loans and Provisions in Government Private and Foreign Banks 2001-2008
Government Banks Private Banks Foreign Banks--------------------------- ----------------------------- -----------------------------R$bi R$bi R$bigt12m Late Provision gt12m Late Provision gt12m Late Provision
----------------------------------------------------------------------------------------------------------------2001 372 85 173 75 123 652002 394 55 202 73 141 60
2003 326 70 255 74 159 662004 133 35 86 160 31 60 102 32 512005 134 39 81 163 35 59 107 35 482006 149 42 68 180 44 66 130 45 532007 35 75 37 55 43 502008 32 68 37 52 45 512009 30 56 612010 20 47 40 66 41 532011 20 43 46 71 50 58----------------------------------------------------------------------------------------------------------------Note Bad credit = loans past due over 12 months Late = percent of total loans gt120 days overdue
Provision = percent of total loan value set aside as reserves against losses Empty cells reflect lack of databecause of changing reporting standards at Central BankSource Central Bank of Brazil Financial Stability Report November 2008 p 56 and 2002-2006
Again in comparative perspective the levels of late loans in Brazilian bankingremains significantly higher than other countries Table 213 reports the value of late loans asa percent of bank portfolios in Brazil select Latin American and further countries forreference This suggests that differences found in Brazilian government banks have to dowith differences in the banking system such as judicial preference for debtors over creditorsrather than the inferior performance of government banks
Late Loans as percent of Total Loans in Brazil Select Latin American and ReferenceCountries
2003 2004 2005 2006 2007----------------------------------------------------------------------------------------------------------------Brazil 39 30 35 37 32Chile 16 12 09 08 08Mexico 28 22 18 21 25Australia 03 02 02 02 02Canada 12 07 05 04 04Spain 17 17 16 14 11South Africa 24 18 15 11 12
---------------------------------------------------------------------------------------------------------------- Does not include credits covered by guaranteeSource Bankscope cited in Central Bank of Brazil Financial Stability Report November 2008 p 56
8132019 Government Banking and BRICs in the Recent Financial Crisis
httpslidepdfcomreaderfullgovernment-banking-and-brics-in-the-recent-financial-crisis 1457
983106983122983113983107 983111983151983158983141983154983150983149983141983150983156 983106983137983150983147983155 983137983150983140 983110983145983150983137983150983139983145983137983148 983123983156983137983156983141983139983154983137983142983156
14
Further comparative data confirms that the Brazilian banking system tends to run onmore expensive credit higher returns and profits and higher levels of late and bad loansBanks operating in Brazil also retain higher levels of administrative and personnel costsHowever Brazilian banks also tend to set aside more generous reserves and provisions
against losses These structural characteristics can be seen in the comparative data in the tablebelow The data on government private and foreign banks in Brazil and comparisons suggestthat the Brazilian banking system incurs higher operating costs maintains higher reservesprovisions and capital against losses and risk but nonetheless produces strong returns
Indicators of Bank Efficiency Performance and Provisions in Brazil Select Latin Americanand Reference Countries
Cost Op Exps NPL Provisions EquityIncome Assets Loans NPL Assets
----------------------------------------------------------------------------------------------------------------
Brazil 62 65 41 153 9Argentina 84 41 66 116 12Chile 53 28 10 166 7Colombia 52 59 32 144 11Mexico 58 47 20 232 12US 54 33 07 163 8Spain 56 16 07 313 12----------------------------------------------------------------------------------------------------------------Source World Bank ldquoBrazil The Industry Structure of Banking Servicesrdquo Brasiacutelia June 2007 pp
Comparison of administrative costs in Brazilian banking with levels in other large
Latin American and emerging and reference economies suggest that Brazilian banks retainhigher costs From 2001 through 2005 the value of administrative costs as a percent of bankassets in Brazil declined from 69 percent to 58 percent but remained significantly abovelevels reported from Chile (30 to 27 percent) Mexico (47 to 46 percent) and well abovereference countries such as Australia Canada and Spain (16 36 and 11 percentrespectively) Although time series lacks comparison after 2005 administrative costs inBrazilian banks decline significantly from 58 in 2005 to 42 in 2008
Bank Administrative Costs in Brazil Select Latin American and Reference Countries (Assets)
2001 2002 2003 2004 2005 2006 2007 2008-------------------------------------------------------------------------------------------------Brazil 69 61 60 61 58 55 51 42Chile 30 30 27 27 27Mexico 47 48 46 43 46Australia 17 17 16 16 16Canada 27 27 27 27 26Spain 17 17 16 14 11-------------------------------------------------------------------------------------------------- Adjusted average of total assetsSource Bankscope cited in Central Bank of Brazil Financial Stability Report November 2008 p 56
A final comparison of government private and foreign bank solidity is based onCentral Bank of Brazil estimates of the impact of hypothetical shocks to the Brazilian
8132019 Government Banking and BRICs in the Recent Financial Crisis
httpslidepdfcomreaderfullgovernment-banking-and-brics-in-the-recent-financial-crisis 1557
983106983122983113983107 983111983151983158983141983154983150983149983141983150983156 983106983137983150983147983155 983137983150983140 983110983145983150983137983150983139983145983137983148 983123983156983137983156983141983139983154983137983142983156
15
economy on domestic banks These estimates are based on the revisions of the widely usedValue-at-Risk estimates proposed by Boudoukh Richardson and Whitelaw that adapts theoriginal VaR method developed and commercialised by JP Morgan19
Stress Tests for Impact of Credit Interest Rate and Foreign Exchange Shock on Basel Index
Comparison of Government Domestic and Foreign Banks 2001-2006
2002 2003 2004 2005 2006-------------------------------------------------------------------------------------------------------------
Government 112 104 114 113 109Domestic 112 132 126 121 103Private 103 131 135 108 84-------------------------------------------------------------------------------------------------------------Source Central Bank of Brazil Financial Stability Reports 2002-2006Note Basel Index = Capital risk guideline measure defined by Bank for International Settlements BaselCommittee that recommends 8 percent relation between PR and total assets weighted by risk level Since 2002Central Bank of Brazil minimum requirements of Basel Index remains 11 percent For methods of calculationsee Central Bank of Brazil Financial Stability Report Brasilia 2006 p 76
Central Bank of Brazil tests estimate that in the face of foreign currency valuationand interest rate shock government banks would nonetheless remain at or slightly below thecapital requirements against credit risk recommended by the central bank Again it should benoted that Basel Index levels recommended in the BIS Capital Requirements guidelines forthe Basel Index of banks are 80 while the Central Bank of Brazil has set minimum BaselIndex levels of 110 Given that federal government bank portfolios include more credit thanprivate banks and especially foreign banks the estimate of a shift to 109 in the averageBasle index for federal government banks in the face of a credit shock provides furtherevidence that these financial institutions are solid and their capital reserves sufficient Insum comparison of results for government private and foreign banks in the estimatesreported by the Central Bank of Brazil of the likely impact of a shock to the Brazilianeconomy in terms of interest rates and foreign exchange rates also suggests that governmentbanks appear solid The average Basel Index reported for government banks in this stress testwas 135 above the 110 Central Bank of Brazil guideline and well above the 80 levelsuggested by the BIS
Understanding the capacity of Brazilian banks to cope with shocks and risk is not justa theoretical exercise Since the currency crisis in Mexico during 1994-1995 the newlystabilized currency was tested by shocks from home and abroad Policies first dramaticallyincreased interest rates under a fixed exchange rate regime then freed the real to devalue
under a flexible foreign exchange rate regime in January 1999 The Asian currency crisesduring second semester 1997 led the Central Bank of Brazil to increase benchmark Selicinterest rates to 434 percent in November In August 1998 the declaration of moratorium onforeign debt payments by Russia the central bank to once again increase Selic interest ratesfrom 20 to 40 percent under the fixed exchange rate regime by November of that year Theseshocks from abroad coincided with preparations for national elections during 1998 leadingthe IMF and other official creditors to provide strong support for the Brazilan governmentNonetheless by January 1999 (after the election) market pressure led to the abandonment ofthe fixed foreign exchange rate regime that had served as nominal anchor for economic
19 Calculation first published in Resenha BMampF Vol 122 1998 (described in Central Bank of Brazil
Financial Stability Report 2002 amp 2003 then as Boudoukh Jacob Matthew Richardson RichardStanton amp Robert Whitelaw ldquoMaxVaR Long Horizon Value at Risk in a Mark-to-Market Environmentrdquo Journal of Investment Management 2004Vol 2 No 3 pp 14-19
8132019 Government Banking and BRICs in the Recent Financial Crisis
httpslidepdfcomreaderfullgovernment-banking-and-brics-in-the-recent-financial-crisis 1657
983106983122983113983107 983111983151983158983141983154983150983149983141983150983156 983106983137983150983147983155 983137983150983140 983110983145983150983137983150983139983145983137983148 983123983156983137983156983141983139983154983137983142983156
16
policy since 1994 The real quickly devalued from 121 to 20 against the US dollar by theend of January and led to considerable changes in policy (a flexible foreign exhange rateregime inflation targeting and the implementation of further fiscal reforms) Once the realrevalued from R$22 against the dollar in March to R$166 in April 1999 the governmentmoved to consolidate this new triad of economic policies Since 1999 flexible foreign
exchange markets inflation targeting and fiscal reform have remained in place This suggeststhat Brazilian banks have weathered volatile parameters and large risks during a markedpolitical business cycle One involving the transition from reformist President Cardoso to PTPresident Lula Since recovery of the economy during 2004 the coalition government underPT President Lula has sought to expand the contribution of government banks to accelerategrowth and social inclusion These policies have not undermined economic fundamentals oreroded the institutional foundations of comparative advantage retained by Brazilian federalgovernment banks
In sum the advances of Brazilian banking toward Basel Accord regulations during the1990s and 2000s the adoption of more transparent and timely reporting standards and themodernization of government banks under pressures from liberalization placed federal banks
in a new situation in the face of crisis once it hit the country in 2008 A closer look at the bigthree federal government banks is in order to better understand these changes
The Banco do Brasil
Upon taking office in 2003 President Lula retained the central economic policies of theCardoso administration such as inflation targeting tight fiscal and monetary policy andthe operational independence of the Banco do Brasil However the recovery of investorconfidence during 2003 and the return of stronger growth levels during 2004 led to aperiod of what the Central Bank of Brazil describes as organic growth at the Banco doBrasil From 2004-2008 the Banco do Brasil contributed to the deepning of domesticcredit markets and emerged as leading investment bank at the Bovespa stock marketFurthermore once the Bovespa collapsed credit became short and a sharp downturnensued during 2008 the Banco do Brasil provided emergency loans infusions of capitalthrough stock purchases and the acquisition of small and mid-sized firms and banksunable to weather the sharp decline and lack of credit Although the merger of Itauacute andUnibanco in 2008 displaced the Banco do Brasil as the largest financial institution inLatin America the bank retains powerful institutional foundations of comparativeadvantage and networks that cross Brazilian society politics and markets
The Banco do Brasil also remains at the center of Brazilian politics and policydisputes Indeed leaders of the PT party faction articulaccedilatildeo (articulation) includes
career employees of the Banco do Brasil and presidents of the Brazilian bank workersunion such as Luiz Gushiken and Ricardo Berzioni Both were nominated to ministerialposts by President Silva in January 2003 By August 2003 21 of 33 top positions at theBanco do Brasil had been filled by new representatives of the PT most Banco do Brasilemployees and members of the Brazilian bank workers union Critics decriedpoliticization However the resistance of bank representatives described above topresidential appeals to increase credit during 2003 was followed by more neutralappointments during 2004 When Banco do Brasil President Cassio Casseb Limaresigned in November 2004 (under charges of irregularities in consulting contracts atthe bank) President Lula nominated Rossano Maranhatildeo Pinto a career employee andBanco do Brasil vice president to head the bank Further appointments of PMDB
political leaders to cement support for the PT coalition government were also criticizedas politicization of the bank However Banco do Brasil officials responded that these
8132019 Government Banking and BRICs in the Recent Financial Crisis
httpslidepdfcomreaderfullgovernment-banking-and-brics-in-the-recent-financial-crisis 1757
983106983122983113983107 983111983151983158983141983154983150983149983141983150983156 983106983137983150983147983155 983137983150983140 983110983145983150983137983150983139983145983137983148 983123983156983137983156983141983139983154983137983142983156
17
experienced political leaders of the PMDB brought competitive advantages to the bankbased on their networks that cross the public and private sector These networks andrelations during the second PT coalition government of President Lula also appearsdifferent than the first given the departure from core offices of the presency bylongtime advisors to Lula that came from the Banco do Brasil and bank workers union
By late 2006 only one of seven vice presidents of the Banco do Brasil was a member ofPresident Lulaacutes Workersacute Party (PT)Again Banco do Brasil policies and growth since recovery of the economy in
2004 involved first a period of expansion during four years of growth followed by aturn to counter cyclical lending and finance once financial crisis abroad produced first asevere contraction in credit supply then a sharp economic downturn in fourth quarter2008 Institutional foundations of comparative advantage are behind Banco do Brasilpolicies during both periods First the capitalization of Brazilian firms on the Bovespastock market is closely related to the groups that cross politics government banks thepowerful bank worker labor union the Banco do Brasil employee private pension fundand bank consortia often led by the Banco do Brasil investment banking division (often
joined by the BNDESpar and Caixa investment banking division) Recent developmentsare complex and will require further research However rather than convergence towardprivate banking and a market-centered financial system examination of Banco do Brasilpolicies and market shares during the 2000s suggests that federal government banks notonly remain at the center of politics policy and development strategies but that theseinstitutions have modernized to compete against private and foreign banks
The large scale and scope of the Banco do Brasil has permitted use of the bankfor counter-cyclical lending and leadership in capital markets without deteriorating bankbalance sheets Since 2003 the Banco do Brasil has remained well within domesticbank regulations and Basel Accord guidelines During 2002 and 2003 reforms at theBanco do Brasil sought to reduce costs and increase efficiency ratings Indeed therelation between the Banco do Brasil and President Lula reversed past patterns In the1950s conflicts were between national developmentalist groups at the Banco do Brasiland more orthodox Ministers of Finance In 2003 and once again during the 2008financial crisis differences between President Lula and the Banco do Brasil were thereverse Banco do Brasil management refused to dramatically increase loans in 2003and resisted requests to reduce the price of credit in 2008 In 2003 the caution imposedby political risk perceptions led President Lula to respect the operational autonomy ofthe Banco do Brasil In April 2009 Banco do Brasil President Antonio Francisco deLima Neto was fired after refusing to reduce interest rates on loans This reversal ofpolicy positions from the 1950s suggests in a broader sense a transition from the
macroeconomics of populism to the microeconomics of government banking in the 21
st
century Government banks do not provide easy or all solutions Instead credit andfinance policies are subject to market discipline credit risk analysis and the realities ofbusiness cycles
Review of the Banco do Brasilrsquos balance sheet from 2002-2008 suggests that the bankdeveloped organically from 2002-2007 with gradual increases reflecting the competitiveadvantages at the top of Brazilian banking and finance Policies changed during 2007 and2008 as the credit shortage caused by international financial crisis led to the Banco do Brasilassuming once again lending of last resort functions by extending interbank investments andloans to small and medium sized banks to avert further declines in domestic liquidity TheBanco do Brasil also acquired a 51 percent stake in the Votarantim bank to avert a run on
deposits and possible failure while acquiring Satildeo Paulo state government savings bankNossa Caixa for R$76 billion in 2008 These acquisitions reflect concern about the
8132019 Government Banking and BRICs in the Recent Financial Crisis
httpslidepdfcomreaderfullgovernment-banking-and-brics-in-the-recent-financial-crisis 1857
983106983122983113983107 983111983151983158983141983154983150983149983141983150983156 983106983137983150983147983155 983137983150983140 983110983145983150983137983150983139983145983137983148 983123983156983137983156983141983139983154983137983142983156
18
replacement of the Banco do Brasil as the largest financial conglomerate in Brazil after themerger of Itauacute and Unibanco
Banco do Brasil Balance Sheet Summary 2002-2008 R$ billion
2002 2003 2004 2005 2006 2007 2008 2009 2010 2011Assets --------------------------------------------------------------------------------------------------------Interbank Investments 101 50 27 80 175 434 951Interbank Deposits 76 283 137 209 116 77 242Securities 709 696 734 664 731 752 732Central Bank Deposits 81 186 221 244 281 334 212Loans to Private Sector 89 652 757 885 1178 1463 1810Loans to Public Sector 56 43 41 37 43 24 230Receivables 297 273 312 351 404 548 808Other AssetsTotal Assets 2046 2301 2390 2529 2963 3672 5073Liabilities ---------------------------------------------------------------------------------------------------Deposits 972 1100 1155 1376 1588 1882 2711
M MKT Borrowing 483 400 445 305 492 722 914Treasury amp BNDES 59 74 106 133 143 175 224Shareholder Equity 92 121 141 168 207 242 299Other LiabilitiesTotal Liabilities 2046 2301 2390 2529 2963 3672 5073---------------------------------------------------------------------------------------------------------------- Compulsory deposits for commercial banks according to Central Bank regulationsSource Banco do Brasil Annual Reports Historical Series 2002-2008
From 2002 through 2006 the balance sheet of the Banco do Brasil suggests a periodof growth based on loans to the private sector with deposits and shareholder equityincreasing largely apace After 2006 the balance sheet changes fundamentally with capitalinjections from money market borrowing increasing from R$492 billion in 2006 to R$914billion in 2008 while Banco do Brasil liabilities with Treasury and BNDES increased fromR$143 billion in 2006 to R$224 billion in 2008 The asset side of the balance sheet alsosuggests fundamental change Private sector lending increased from R$1178 billion in 2006to R$1810 billion in 2008 reflecting acquisition of portfolios from Nossa Caixa Interbankinvestments increased from R$175 billion in 2006 to R$951 billion in 2008 while interbankdeposits also increased from R$116 billion in 2006 to R$242 billion in 2008 The counter-cyclical lending strategies of the Banco do Brasil during 2008 also included an increase oflending to the public sector from R$24 billion in 2007 to R$230 billion Banco do Brasilreponses to government credit policy can also be seen in the release of 40 percent of
compulsory deposits retained at the central bank Banco do Brasil deposits at the central bankdeclined from R$334 billion in 2007 to R$212 billion in 2008 ndash freeing this value for loansand investments
Networks and relations during the second government of President Lula appeardifferent than the first given the departure from core offices of the presency by longtimeadvisors to Lula that came from the Banco do Brasil and bank workers union By late 2006only one of seven vice presidents of the Banco do Brasil was a member of President LulaacutesWorkersacute Party (PT) The corporate profile of the Banco do Brasil suggests once again thehybrid character of this government bank one listed on the Bovespa Novo Mercado but withover 65 percent of shares owned by the Brazilian federal government Treasury
8132019 Government Banking and BRICs in the Recent Financial Crisis
httpslidepdfcomreaderfullgovernment-banking-and-brics-in-the-recent-financial-crisis 1957
8132019 Government Banking and BRICs in the Recent Financial Crisis
httpslidepdfcomreaderfullgovernment-banking-and-brics-in-the-recent-financial-crisis 2057
983106983122983113983107 983111983151983158983141983154983150983149983141983150983156 983106983137983150983147983155 983137983150983140 983110983145983150983137983150983139983145983137983148 983123983156983137983156983141983139983154983137983142983156
20
customers in 2008 reached 479 million with the bank retaining 39700 AMTs and 766million bank cards (239 million credit cards and 527 million debit cards) Like the CaixaEconocircmica Federal the Banco do Brasil also processes government payments withretirement and social security payments numbering 745 million transactions during 2008Although this implies administrative costs (and receipts) this also brings customers and
prospective customers into Banco do Brasil branch officesDuring 2008 the Banco do Brasil continued to expand operations form jointventures acquire private and government banks and modernize operations A secondaryoffering of stock in January 2008 granting of shares by VISA to the Banco do Brasil andupgrading of the bank to investment grade BB- by Standard amp Poors in April 2008 suggestthat market orientation of the bank continues during the Lula administration despite counter-cyclical credit policies A Lower Income Segment Department was also created to assumeBanco Popular do Brasil operations along with correspondent banking relations and regionalsustainable development programs The Banco do Brasil also received permission to usesavings accounts for home loans enabling the bank to compete on level ground with CaixaEconocircmica Federal During 2008 the Banco do Brasil also acquired the state government
banks Banco do Piaui Banco de Santa Catarina (33rd largest bank in Brazil with US$30billion assets at year end 2007) and Satildeo Paulo government savings bank Nossa Caixa (12thlargest Bank in Brazil with US$267 billion in assets at year end 2007) In sum the diversecorporate divisions and financial operations of the Banco do Brasil provided policy optionsduring 2008 to counter the credit shortage and help firms and domestic banks to adjust
Banco do Brasil and Private Bank Returns and Capital Adequacy 2002-2009
Basel Index Return on Assets Return on Liquid Assets----------------------------- ----------------------------- -----------------------------BB Itauacute Bradesco BB Itauacute Bradesco BB Itauacute Bradesco
--------------------------------------------------------------------------------------------------------------2002 122 184 179 12 26 20 302 288 2832003 137 198 199 11 28 16 231 297 2282004 152 206 188 13 30 23 240 292 3092005 171 170 173 12 37 26 187 353 2842006 173 171 188 28 31 25 267 288 2632007 156 179 156 14 32 22 222 321 2442008 152 161 169 25 19 16 304 221 2112009 150 165 166 12 13 14 238 182 195-------------------------------------------------------------------------------------------------------------- Annualized first quarter 2009 resultsSource Banco do Brasil Itauacute and Bradesco Annual Reports 2002-2009
Comparison of Banco do Brasil returns and capital adequacy with the two majorprivate Brazilian banks Itauacute and Bradesco suggests that the performance and solidity of theBanco do Brasil remains equal or superior to private banks During 2002 and 2003 thecapital adequacy of the Banco do Brasil and return on assets remained below levels reportedby the two largest Brazilian private banks suggesting the impact of counter-cyclical lendingHowever after 2004 the Basel index of the Banco do Brasil reached 171 far above BISstandards of 80 and Central Bank of Brazil requirements of 110 Furthermore from 2006through first quarter 2009 returns on assets returns on liquid assets and the Basel index ofthe Banco do Brasil exceed levels reported by Itauacute and Bradesco In sum despite providingcounter cyclical credit and despite having been replaced by the Itau-Unibanco merger as the
8132019 Government Banking and BRICs in the Recent Financial Crisis
httpslidepdfcomreaderfullgovernment-banking-and-brics-in-the-recent-financial-crisis 2157
983106983122983113983107 983111983151983158983141983154983150983149983141983150983156 983106983137983150983147983155 983137983150983140 983110983145983150983137983150983139983145983137983148 983123983156983137983156983141983139983154983137983142983156
21
largest Brazilian bank the performance and capital adequacy of the Banco do Brasil remainsat or above levels reported by the two largest private banks
In sum since liberalization of banking and finance and privatization of stategovernment banks during the 1990s the Banco do Brasil has been transformed from directstate owned bank into one of two very large financial conglomerates that dominate domestic
banking in Brazil Instead of retaining easy access to funds at Treasury to cover losses theBanco do Brasil has adopted international corporate governance standards to become listedon the Bovespa Novo Mercado and retains an important role in virtually every aspect ofBrazilian banking and finance Although sale of shares in the 1990s were designed to transfercorporate governance and control of the national bank to the private sector the federalgovernment retains 65 percent of stocks after two sale of stocks capitalized the bank duringthe 2000s The massive size and wide scope of Banco do Brasil networks across bankingfinancial markets political and social forces and business have led the bank to realize recordprofits during the period of growth from 2004-2008 and provide counter-cyclical credit toavert a further decline in industrial activity and the economy as the US and global financialcrisis hit Brazil first with a 50 percent decline in the Bovespa stock market and credit
shortage followed by a steep but short decline in industrial production in late 2008 Thetransparency of Banco do Brasil quarterly reports and advances in Central Bank of Brazilsupervision of domestic banking clarify the new tensions that have emerged during the PTgovernment of President Lula These tensions reflect the modernization and competitiveadvantages of the Banco do Brasil
Caixa Econocircmica Federal (Federal Savings Bank Caixa)
The third largest domestic bank the wholly government owned Federal Savings Bank Caixawas also called on by President Lula during the recent financial crisis to increase the pace ofgrowth provide counter cyclical credit during downturns and to reduce consumer andcorporate interest rates and bank spreads Review of balance sheets and policies since 2001suggest that the Caixa retains its core business in urban development home loans real estatetransfer of funds for government programs and services and lottery administration Howeverinvestment banking management of third party funds and the creation of of new products andservices have both increased profits and increased popular access to banking and socialservices The bank has recorded record profits since R$108 billion (2002) R$16 billion(2003) and R$14 billion (2004) The Caixa became the fourth largest Brazilian investmentbank by 2003 while gaining dealer status from the Central Bank of Brazil in primary andsecondary markets for government securities At year-end 2003 the bank retained anestimated R$767 billion of government paper (over ten percent of government paper) in its
portfolio assets earning over R$135 billion that year Since recovery of the Brazilianeconomy in 2004 the Caixa has reported strong profits and continued to improve thestructure of its balance sheet and converge toward international bank reporting standards
In terms of assets deposit base and the number of employees and branches the datasuggest that the Caixa has emerged from a process of rationalization and downsizing duringthe late 1990s and expanded ldquoorganicallyrdquo since capitalization in 2001 Assets declined fromover US$999 billion in 1997 to US$363 billion in 2002 after reorganization andcapitalization Deposits also declined from US$541 billion in 1997 to US$216 billion in2002 The number of employees and branches declined from 104253 and 2316 to 98971 and1803 respectively but returned to 104934 and 2428 by 2006 After reorganization andcapitalization in June 2001 Basel indexes and the ratio of fixed assets over equity indicate
substantial reform and transition toward international banking standards The Basel Index thatmeasures the adequacy of capital reserves against possible losses and risks increased from
8132019 Government Banking and BRICs in the Recent Financial Crisis
httpslidepdfcomreaderfullgovernment-banking-and-brics-in-the-recent-financial-crisis 2257
983106983122983113983107 983111983151983158983141983154983150983149983141983150983156 983106983137983150983147983155 983137983150983140 983110983145983150983137983150983139983145983137983148 983123983156983137983156983141983139983154983137983142983156
22
135 (49 in March 2001 before capitalization) to reach 278 and remain twice above theCentral Bank minimum of 110 at 252 in 2006 The ratio of fixed assets as a proportion ofequity also declines substantially from 638 at year end 2001 to 197 in 2007
Summary of Caixa Structure and Performance 1995-2007
Assets Profits Deposits Employees Branches Basel FAEquity1995 826 672 503 99866 23161996 907 2351 515 99343 21051997 999 875 541 96300 18031998 948 1693 499 94859 18191999 684 1571 344 94194 19192000 644 1362 322 104253 19212001 436 -1265 298 98971 2013 135 6382002 363 1462 216 106548 2147 146 5372003 521 2617 281 100498 2046 192 413
2004 556 2999 345 100164 2135 202 3612005 806 4852 456 106729 2321 278 2012006 981 4874 567 104934 2428 252 1972007 1409 4485 800 106770 2052 288 1282008 1266 5735 708 103895 2069 206 119
Note Assets amp Deposits = US$billion Profits = US$million Basel = BIS Basel Accord index of capital reserveadequacy FAEquity = Fixed Assets Equity a summary indicator of bank modernizationSource Central Bank of Brazil Top 50 Banks in Brazil available at wwwbcbgovbr
Caixa Annual Reports and transition toward Central Bank and international bankaccounting standards introduce breaks in the time series of financial performance after 2001
However international bank reporting standards have been used by the Caixa since 2005 andthe data provide further view of the policies and performance of the bank Table X reportsreturns on stockholder equity assets Basel solvency index immobilization index provisionsas a percent of credit operations bank efficiency index and coverage of personnel costs Thedata are consistent with the broader comparisons reported in chapter two that suggest highprofits and returns alongside higher levels of provisions and reserves against capital riskReturns on stockholder equity have remained above 20 percent per year reaching 306percent in 2008 Returns on liquid assets remained between 09 percent and 13 percentbelow the average levels recorded by private and foreign banks The Basel Index of the Caixaremained well above the 11 percent level required by the Central Bank declining from 279in 2005 to 206 in 2008
Caixa Performance Indicators 2005-2008
Indicator 2005 2006 2007 2008 2009 2010 2011--------------------------------------------------------------------------------------------------------------------------Return on Shareholder Equity 261 260 226 306Return on Liquid Assets 11 11 09 13Basel Solvency Index 279 253 289 206Immobilization Index 201 197 129 120Provisions as Credit Operations 101 98 91 86Efficiency Index 645 642 755 718Coverage of Personnel Costs 925 896 943 868
---------------------------------------------------------------------------------------------------------------------------Source Caixa Econocircmica Federal Relatoacuterios de Administraccedilatildeo 2005-2011
8132019 Government Banking and BRICs in the Recent Financial Crisis
httpslidepdfcomreaderfullgovernment-banking-and-brics-in-the-recent-financial-crisis 2357
983106983122983113983107 983111983151983158983141983154983150983149983141983150983156 983106983137983150983147983155 983137983150983140 983110983145983150983137983150983139983145983137983148 983123983156983137983156983141983139983154983137983142983156
23
The immobilization index of the Caixa also declined from 201 percent in 2005 to120 percent in 2008 suggesting transition toward standard levels of international bankingHowever the value of provisions as a percent of credit operations remains much higher thaninternational bank practices albeit declining from 101 percent in 2005 to 86 percent in2008 Finally both the substantial increase in efficiency index from 645 to 718 percent
suggests that the Caixa has distanced further from international private bank levels that tendto approach 500 percent This has resulted in the declining level of coverage of personnelcosts and indicates the comparatively larger organizational structure and less use ofoutsourced labor at the Caixa
Caixa Deposits and Sources of Funds 2005-2008 R$million
2005 2006 2007 2008 2009 2010 2011----------------------------------------------------------------------------------------------------------------Bank Deposits 692 863 1155 1320Savings Deposits 5328 6006 7560 9255Mid-Term Savings Deposits 3873 4219 4136 4862
Certificates (1270) (1412) (1244) (1831)Escrow (2602) (2806) (2891) (3031)
Funds and Programs 794 1034 1307 1100Other 009 015 019 013Caixa Total 10690 2139 14179 6552Bank System Total 68268 78148 92672 27482Caixa Deposits as Total (156) (155) (1531) (129)----------------------------------------------------------------------------------------------------------------Source Caixa Econocircmica Federal Relatoacuterios de Administraccedilatildeo 2005-2008
The liability side of Caixa balance sheets from 2005-8 suggests that the bank hasdistanced itself from reliance on official savings programs and funding toward consumerbank and savings deposits Bank deposits increased from R$69 billion in 2005 to overR$132 billion in 2008 Savings deposits increased from R$532 billion in 2005 to overR$925 billion in 2008 Furthermore the increase of mid-term savings deposits originatedfrom sale of savings certificates instead of escrow held by the Caixa the latter subject to
judicial review and removed from balance sheets in 2008 The value of funds deposited at theCaixa from government funds and programs increased from R$79 billion in 2005 to R$110billion in 2008 although it remains less than ten percent of total deposits In terms of totalvalue of deposits and savings the Caixa increased total value of deposits from 107 billion toover 165 billion from 2005-8
Caixa Loans 2005-8 R$ million2005 2006 2007 2008 2009 2020 2011
----------------------------------------------------------------------------------------------------------------Commercial 14652 16329 19134 28854
Consumer 8925 9474 11063 13747Business 5727 6854 8071 15107
Home 20208 26113 32475 45075Sewage and Infrastructure 1646 2556 3585 5445Other 690 691 694 689Risk Provision -3773 -4469 -5090 -6900Total Caixa Loans 37195 45689 55888 80062----------------------------------------------------------------------------------------------------------------Source Caixa Econocircmica Federal Relatoacuterios de Administraccedilatildeo 2005-8
8132019 Government Banking and BRICs in the Recent Financial Crisis
httpslidepdfcomreaderfullgovernment-banking-and-brics-in-the-recent-financial-crisis 2457
983106983122983113983107 983111983151983158983141983154983150983149983141983150983156 983106983137983150983147983155 983137983150983140 983110983145983150983137983150983139983145983137983148 983123983156983137983156983141983139983154983137983142983156
24
In terms of lending the data suggests that the primary focus of the Caixa on homeloans continued during the late 2000s although substantial increases in commercial lendingfor consumer credit and businesses suggest the diversification of the Caixa across creditmarkets Since 2005 Caixa lending to consumers and business increased from R$89 billionto R$137 billion and from R$57 billion to R$151 billion respectively in 2008
And unlike the high levels of bad and late credit reported during the adjustment to theend of high inflation in 1994-6 and financial crises (1994-5 1997 1998 1999 2001 2003)the level level of late loans at the Caixa fell substantially during the years of economicgrowth and credit expansion from 2006-2008 The percent of late over total loans at the Caixafell from 68 percent in 2006 to 40 percent in 2008 for commercial loans generally and from62 percent to 59 percent for consumer loans and 75 percent to 22 percent for loans tobusiness The value of late home loans as a percent of total home loans also fell from 31 to17 percent in 2008
Caixa AA-H Credit Classification 2001-8
Days Prov-Late ision 2001 2002 2003 2004 2005 2006 2007 2008 2009 2010 2011
---------------------------------------------------------------------------------------------------------------------------------------AA lt15 0 59 56 66 63 54 50 63 94A lt15 05 243 264 313 288 393 435 401 333---------------------------------------------------------------------------------------------------------------------------------------B 15-30 1 127 126 137 139 143 158 206 271C 31-60 3 203 166 145 169 167 192 194 192D 61-90 10 178 261 207 217 133 60 45 33---------------------------------------------------------------------------------------------------------------------------------------E 91-120 30 18 19 20 20 22 13 09 07F 121-50 50 49 15 15 14 10 07 07 07G 151-80 70 15 08 09 10 08 10 10 09
H gt180 100 104 87 85 77 68 72 61 51R$billion 2094 2353 2614 3016 3855 4736 5739 818---------------------------------------------------------------------------------------------------------------------------------------Source Caixa Annual Reports 2002-2008
The credit risk matrix of Caixa loans from 2001 to 2008 confirms this trend ofimprovement (See above table) The data also provide evidence of greater transparency andthe improvement of bank reporting and accounting standards as well as Central Banksupervision of banks Instead of two categories of credit (good = all loans up to 90 daysoverdue bad = loans over 90 days overdue) the Central Bank of Brazil has adoptedinternational standards of credit classification (from AA to H) and imposed regulations that
banks increase or decrease provisions according to the distribution of loans in thesecategories The scale of provisions required by the Central Bank vary from zero percentagainst loans classified as AA to provision of 100 percent of loan values for credits classifiedas H that is to say over 180 days late
The percent of loans over 180 days late has decreased from 104 percent of total in2001 to 51 percent in 2008 Furthermore all categories of late payment except for loansbetween 15-30 days late decreased significantly from 2001 through 2008 In comparisonloans classified as AA (paid and guaranteed) and A (paid on time) increased from 59 percentto 94 percent and 243 percent to 333 percent of total loans The only category of late loansthat increased over the period is that of loans 15-30 days overdue from 127 percent to 271percent of total
The central argument of this study is that Brazilian federal government banks retaininstitutional foundations of competitive advantage over private and foreign banks Further
8132019 Government Banking and BRICs in the Recent Financial Crisis
httpslidepdfcomreaderfullgovernment-banking-and-brics-in-the-recent-financial-crisis 2557
983106983122983113983107 983111983151983158983141983154983150983149983141983150983156 983106983137983150983147983155 983137983150983140 983110983145983150983137983150983139983145983137983148 983123983156983137983156983141983139983154983137983142983156
25
data that suggests this advantage can be seen in the increasing volume and market share ofthe Caixa in debit and credit cards The number of Caixa debit cards increased from 224million in 2002 to over 482 million in 2008 with Caixa market share of debit cards increasedfrom 196 percent ot total card market in 2002 to peak at 230 percent in 2005 and remainingat 219 percent of the total number of debit cards in Brazil in 2005
Two examples illustrate the institutional foundations of comparative advantage of theCaixa in the card payment industry First like other banks in Brazil the Caixa shares anagreement with Visa for payment processing However unlike other banks in Brazil theCaixa was contracted by the federal government to distribute ATM citizenship cards torecepients of federal government family grants and other transfer programs Apparentlywithout seeking approval the Caixa stamped its brandname on the federal government ATMcitizenship card and has continued to do so despite charges of unfair competition fromprivate domestic banks Furthermore a Caixa request to transform its 110 million ATMcitizenship cards into bank cards currently pending at the Central Bank would dramaticallyincrease the number of bank card holders in Brazil (1824 million at year end 2007)
Caixa Debit and Credit Card Market Shares 2002-2008
Million Debit Cards Million Credit Cards MillionCaixa Total Mkt Caixa Total Mkt Interbank Checks
----------------------------------------------------------------------------------------------------------------2002 224 1142 (196) 16 407 (39) 229502003 280 1254 (223) 18 440 (40) 213602004 320 1491 (213) 20 535 (37) 196702005 377 1639 (230) 25 675 (37) 183902006 384 1744 (220) 31 952 (32) 162202007 400 1824 (219) 39 1177 (33) 144902008 482 42----------------------------------------------------------------------------------------------------------------Source Central Bank of Brazil Diagnoacutestico do Sistema de Pagamentos de Varejo do Brasil Adendo Estatiacutesticondash 2007 p 9 and Caixa annual reports 2003-2008
Having reviewed the Banco do Brasil and Caixa a brief look at the counter-cyclicalpolicies and performance of the third Brazilian federal government bank ndash the BNDES ndash is inorder
Banco Nacional de Desenvolvimento Econocircmico e Social (National Bank for Economic
and Social Development BNDES)
The BNDES is a paradigmatic development bank The trajectory of the BNDES involves asequence of policies and financial practices that have shaped Brazilian development Duringthe 1950s the BNDE supplied direct credits for transportation electric energy infrastructureand steel production During the 1960s the bank diversified under financial reforms Duringthe 1970s the BNDE acted to complete state-led import substitution industrialization bychanneling foreign finance and forced savings into capital goods project lending and regionaldevelopment programs During the 1980s the bank shifted away from public investmentunder pressure of fiscal crisis and foreign debt During the 1990s the BNDES became agentfor the privatization of state owned enterprises The BNDES remained virtually the onlysource of long-term finance during a decade of financial crises in emerging markets (1994-2003) Since 2000 the bank has shifted toward ldquosecond generationrdquo reforms designed tofinance the private sector and free market forces deepen domestic capital and equity markets
8132019 Government Banking and BRICs in the Recent Financial Crisis
httpslidepdfcomreaderfullgovernment-banking-and-brics-in-the-recent-financial-crisis 2657
983106983122983113983107 983111983151983158983141983154983150983149983141983150983156 983106983137983150983147983155 983137983150983140 983110983145983150983137983150983139983145983137983148 983123983156983137983156983141983139983154983137983142983156
26
and lend to small medium and micro-enterprises Since 2004 capital inflows and a boomingdomestic stock market have reinforced the capacity of the BNDES to underwrite long-terminvestments and transform large Brazilian firms into multinational corporations Since 2007BNDES President Coutinho has pursued a full service approach attempting to help star-upsmall and medium firms provide funds to expand successful firms and participate in venture
capital funds to help enterprises transit toward corporate governance standards and initial orsecondary offerings of stock on the Bovespa exchange In 2008 as financial crisis led to ashortage of credit collapse of share prices and sharp decline in industrial production byfourth quarter 2008 the BNDES also provided lending of last resort to major Braziliancorporations while retaining long term goals for massive investments in deep sea petroleumproduction
BNDES Market Share of Interbank and Non-Bank Loans 1995-2008 US$ Billion
Interbank Loans Non-Bank Loans------------------------------------------ ------------------------------------------
BNDES Mkt Total BNDES Mkt Total-----------------------------------------------------------------------------------------------------------1995 156 (324) 481 80 (38) 20711996 181 (354) 511 109 (49) 21981997 197 (278) 707 145 (68) 21031998 216 (355) 608 230 (113) 20201999 204 (410) 497 150 (35) 14282000 243 (439) 553 152 (96) 15772001 259 (504) 515 145 (104) 13912002 233 (443) 525 137 (130) 10512003 261 (419) 622 200 (141) 14152004 306 (408) 749 218 (122) 17862005 343 (373) 918 277 (113) 24312006 388 (350) 1106 329 (102) 32312007 524 (335) 1563 432 (88) 48852008 530 (493) 1073 456 (96) 4743200920102011-----------------------------------------------------------------------------------------------------------Source Central Bank of Brazil Top 50 Banks 1995-2008
Revew of BNDES lending since 1995 suggests the realization of competitiveadvantages typical of a large centralized development bank Contrary to the extensive branchoffice networks retained by the Banco do Brasil and Caixa the BNDES retains under 1900employees (compared to 105000 at Caixa) in the Rio de Janeiro and four regional officesSince 1995 the BNDES increased its market share of non-bank loans from R$80 billion (38percent) to R$200 billion (141 percent) during the economic downturn risk aversion andcredit shortage in 2003 After 2003 the BNDES market share of loans to non-financialentities decreased to 88 percent of total loans albeit increasing during 2008 to 96 percentThis suggests that the BNDES has increased its market share of lending to non-financialsector since liberalization of the industry and privatization of state government banks
8132019 Government Banking and BRICs in the Recent Financial Crisis
httpslidepdfcomreaderfullgovernment-banking-and-brics-in-the-recent-financial-crisis 2757
983106983122983113983107 983111983151983158983141983154983150983149983141983150983156 983106983137983150983147983155 983137983150983140 983110983145983150983137983150983139983145983137983148 983123983156983137983156983141983139983154983137983142983156
27
BNDES inter-bank lending also increases substantially Since the Real Plan endedinertial inflation in 1994 the BNDES has expanded its market share of interbank lendingfrom 156 billion (324 percent) in 1995 to 530 billion (493 percent) in 2008 during creditshortage and stock market collapse During previous years of financial crisis and economicreversals the BNDES also increased interbank lending significantly For example during the
1999 and 2001 crises BNDES interbank lending increased to 410 percent and 504 percentof total This marked presence in interbank loan market reflects the role of the BNDES inproviding indirect lending to targeted sectors through private foreign and other governmentbanks in Brazil
BNDES Loan Approvals by Program 1995-2007 R$ Billion
Direct Lending 1999 2000 2001 2002 2003 2004 2005 2006 2007 2008 2009--------------------------------------------------------------------------------------------------------------------------------------Finem 51 55 68 133 79 114 132 145 220 285Capital Markets 16 19 09 08 09 06 20 34 35 104Export-Import 23 34 39 77 63 56 67 40 13 32
Sub-Total 91 109 118 219 153 177 220 221 269 424Percent Total (505) (474) (468) (585) (456) (447) (469) (430) (415) (464)
Indirect Lending--------------------------------------------------------------------------------------------------------------------------------------Finem 31 40 37 16 12 16 18 27 51 60Finame 16 25 33 40 53 66 93 107 170 221Finame Agro 07 13 18 30 28 45 21 14 20 27Finame Leasing 00 000 02 02 03 02 04 06 14 16Export-Import 14 23 20 40 56 54 73 97 67 95BNDESautom 18 17 22 24 27 34 36 35 50 55Sub-Total 89 120 134 154 182 220 249 292 379 484Percent Total (495) (526) (532) (415) (544) (553) (531) (570) (585)(536)
BNDES Total 180 230 252 374 335 398 469 513 648 908----------------------------------------------------------------------------------------------------------------Source BNDES statistics by modality available on wwwbndesgovbr
Review of BNDES finance by program suggests the evolution of credit policies from1995 through 2008 and increasing reliance on indirect lending through other financialintermediaries The three major programs of direct finance Financiamento aEmpreendimentos (Business Finance Finem) Mercado de Capitais (Capital Markets) andExport-Import finance remained between 505 percent and 415 percent of total BNDESlending with the exception of 2002 Indirect lending through six broad programs remained
between 495 percent and 585 pecent of total BNDES lending with the exception of 2002Indirect lending programs include Finem business lending Financiamento de Maquinas(Machine Finance Fineme) with agricultural and leasing modalities Export-Import financingand BNDES automatic lending provisions
These trends suggest the realization of competitive advantages over private andforeign banks in Brazil BNDES long term interest rates remained substantially lower thanSelic benchmark overnight inter-bank interest rates throughout this period while the lowercost of small staff and operations of the BNDES made lending at these rates viable Anothercompetitive advantage of the BNDES over private and foreign banks is the developmentbankacutes mandate as manager of funds from the forced savings fund Fundo de Amparo ao
Trabalhador (Worker Asssistance Fund FAT) Constitutionally mandated investments inproductive activities (not government bonds) increased from R$31 billion in 2000 to R$101
8132019 Government Banking and BRICs in the Recent Financial Crisis
httpslidepdfcomreaderfullgovernment-banking-and-brics-in-the-recent-financial-crisis 2857
983106983122983113983107 983111983151983158983141983154983150983149983141983150983156 983106983137983150983147983155 983137983150983140 983110983145983150983137983150983139983145983137983148 983123983156983137983156983141983139983154983137983142983156
28
billion in 2008 comprising 170 percent of BNDES liabilities This means that 170 percentof BNDES finance and lending is based on long-term deposits that provide no liquidity riskThis provides a competitive advantage over private and foreign banks
A closer look at BNDES lending by sector suggests that the bank still focuses
primarily on industry and infrastructure Despite the adoption of second generation reformsthat seek to free market forces and accelerate innovation and productivity through small andmedium enterprises BNDES lending still focuses on large scale industrial and long-terminfrastructure finance In this respect the BNDES embodies a persistent need in developingeconomy for state-led development banking along the lines emphasized by Lewis Myrdaland development economists 50 years ago This traditional sense of commanding heights thusstill captures the role of the BNDES in Brazilian political economy Despite more than twodecades of privatizations financial liberalization bank reforms and a variety of fiscalfinancial and economic reforms that have substantially modernized the domestic Brazilianeconomy and freed market forces the BNDES remains the single most important source forlong-term finance and credit The capitalization of the Bovespa stock market from 2004-
2008 for the first time in Brazilian history reduced the virtual monopoly of BNDES overlong term finance
BNDES Operations approved and invested by Sector 1998-2007 R$billion
1998 1999 2000 2001 2002 2003 2004 2005 2006 2007Industry ----------------------------------------------------------------------------------------------------------------------------approved 96 79 126 152 171 163 145 290 395 402invested 76 84 104 132 174 161 158 234 272 306
Infrastructure ----------------------------------------------------------------------------------------------------------------------approved 116 69 110 65 161 149 137 186 240 369invested 83 66 86 75 130 100 152 171 170 209
Other--------------------------------------------------------------------------------------------------------------------------------approved 18 47 40 54 79 93 117 69 108 126investedTotal --------------------------------------------------------------------------------------------------------------------------------approved 230 195 276 271 411 404 379 545 743 897invested 190 181 230 252 374 335 398 470 513 617
----------------------------------------------------------------------------------------------------------------Source BNDES Annual Reports 2003-2008 and testimony of BNDES President to Congress March 2009
Long-term investments have produced substantial profits at the BNDES The bank hasrecorded profits each year since 1999 increasing from over R$600 million in 1999 overR$32 billion during 2005 reaching over R$73 billion in 2007 The long-term character of
BNDES finance stands in stark contrast to policies at private banks Contrary to strategy ofprivate and foreign banks to trade and hold government paper described in chapter three theBNDES suspended purchase and trading in government paper because of constitutionalmandates to contribute to development and employment Furthermore the turn to capitalmarkets at the BNDES has provided substantial returns since 2004
However this does not mean that BNDES lending protected unproductive industriesInstead of wasting resources to unnecessarily bail out firms or provide crony credit highreturns and strong profits at the BNDES suggest that lending was sound Standard indicatorsof bank performance asset quality and capital reserves against credit and capital risk provideempirical control for this All these measures suggest that the BNDES weathered the periodof adjustment and sustained counter-cyclical investment policies without placing resources atrisk beyond Central Bank of Brazil regulations and BIS guidelines And returns have
8132019 Government Banking and BRICs in the Recent Financial Crisis
httpslidepdfcomreaderfullgovernment-banking-and-brics-in-the-recent-financial-crisis 2957
983106983122983113983107 983111983151983158983141983154983150983149983141983150983156 983106983137983150983147983155 983137983150983140 983110983145983150983137983150983139983145983137983148 983123983156983137983156983141983139983154983137983142983156
29
increased since recovery in 2004 BNDES participation in the booming Bovespa stock marketsince 2003 has provided record returns
The BNDESpar subsidiary that invests in capital markets has also recorded strongreturns during the period of economic growth and into the 2008 financial crisis BNDESparreturns on liquid assets increased from 75 percent in 2004 to 277 percent in 2007 declining
to 245 percent in 2008 Average returns on assets and stock holdings also remained highbuilding the assets held by the BNDESpar subsidiary from 141 billion in 2005 to 359 billionin 2008
This increased participation of the BNDES in capital markets involves new relationsand networks across government private sector labor unions the private pension funds ofgovernment bank and government enterprise employees and financial markets By 2007BNDES participation in stockholding and mutual funds reached across 261 forms and 25mutual funds totaling over R$910 billion reals The BNDES thereby retains broad portfoliothat represents institutional foundations of comparative advantage Furthermore unlike thepolicy of private and foreign banks to trade and hold high interest rate paying short termgovernment paper during the sudden stop of foreign finance and downturn in the Brazilian
business cycle (2002-3) the BNDES expanded credit operations and reduced financialoperations in secondary markets for indexed government paper This countered the perverseimpact of the liquidity preference among private and other government banks that increasedmarket pressures and led to shorter terms and higher cost of Brazilian government debt
BNDES aversion of government paper is required by constitutional mandate tomanage forced savings funds in ways that generate employment and income As noted alarge part of BNDES resources (liabilities) are from domestic official savings programs Thevalue of FAT resources increased from R$492 billion in 2003 to R$662 billion in 2005while the PIS-Pasep fund remained at approximately R$200 billion Foreign capital has alsobeen channeled to the BNDES through multilateral agencies and foreign bond issues Foreignloans to the BNDES have declined Multilateral agencies provided R$70 billion in 2003increased funding to R$129 billion during 2004 and continued to provide R$107 billion tothe BNDES during 2005
Comparison of BNDES structure and performance with development banks abroadsuggests both the large scale and scope of BNDES operations and controls formismanagement and political abuse of the bank In 2007 BNDES total assets are almostdouble the value reported by the Inter-American Development Bank (IADB) over frac12 thevalue of total assets held by the World Bank and almost ten times the value of assets held bythe French government development bank CAF Furthermore profits and loans from theBNDES far exceeded all three institutions The US$330 billion in loans reported by theBNDES far exceed the US$67 billion from the IADB the US$110 reported by the World
Bank and US$58 billion reported by the CAF BNDES profis returns on assets and return onliquid patrimony also far exceeded those reported by these three development banks thatserve as comparative control over performance and policies at the BNDES Finally lateloans at the BNDES remained at 011 percent of total loans well below levels reported by theWorld Bank comparable to the 010 percent reported by the IADB while considerably abovethe 001 percent reported by CAF
8132019 Government Banking and BRICs in the Recent Financial Crisis
httpslidepdfcomreaderfullgovernment-banking-and-brics-in-the-recent-financial-crisis 3057
983106983122983113983107 983111983151983158983141983154983150983149983141983150983156 983106983137983150983147983155 983137983150983140 983110983145983150983137983150983139983145983137983148 983123983156983137983156983141983139983154983137983142983156
30
Comparison of BNDES and Regional Development Banks 2007 US$ billion
BNDES IADB World Bank CAF----------------------------------------------------------------------------------------------------------------Total Assets 1144 699 2080 125
Liquid Patrimony 140 203 399 41Liquid Profits 38 01 -01 04Desembolsos 339 67 110 58Credit Portfolio 928 479 978 95Capitalization percent 123 291 192 328Return on Assets percent 38 47 na 36Return on PL percent 332 07 na 105Late Loans percent 011 010 086 001----------------------------------------------------------------------------------------------------------------Source BNDES Annual Report 2007
The large scale of BNDES lending and finance make it possible for governmentpolicy to provide counter cyclical credit to avert or ameliorate economic downturns andsubstitute private and foreign credit shortages In March 2009 testimony to Congress ongovernment policies during financial crisis BNDES President Coutinho argued that bankpolicy was to reduce the cost and increase the supply of credit Resources for counter cyclicallending during 2008-2009 came from Treasury loans to BNDES released by provisionaldecrees 439 and 414 summing R$175 billion transfer of R$60 billion in CVS funds sale ofFGTS Investment Fund and bank certificates summing R$170 billion Furthermore the thirdphase of conditional credit facility shared by Inter-American Development Bank and theBNDES provided the last tranch of a total US$60 billion for BNDES operations
Two further means were used by the BNDES to infuse capital during the collapse of
the stock market and shortage of credit during 2007-8 The counter cyclical policies of theBNDES can also be seen in the over two fold increase of BNDES holdings in private equityand investment funds Table 512 reports the value of private equity and investment fundholdings of the BNDES in 2007 and 2008 BNDES funds in private equity and mutual fundsincreased from R$4038 million in 2007 to over R$10 billion in 2008 The capitalization ofmutual funds and private equity firms by the BNDES also played an important countercyclical role during this period
BNDESpar Shareholding 2007-8 R$million
Percent Value ValueShares 2008 2007
----------------------------------------------------------------------------------------------------------------Ameacuterica Latina Logiacutestica 106 6386 -Aracruz 55 1292 1292Banco do Brasil 25 10854 12752Bom Gosto (2) 345 2458 -Brasil Telecom Part 30 1666 1958Braskem 52 2275 2432Brenco 209 1400 -CEG 345 1406 -CESP 57 2347 1397Coteminas 103 1150 1340
CPFL Energia 62 6081 5506Cia Sideruacutergica Nacional 36 1513 2686CVRD 40 15082 7098
8132019 Government Banking and BRICs in the Recent Financial Crisis
httpslidepdfcomreaderfullgovernment-banking-and-brics-in-the-recent-financial-crisis 3157
983106983122983113983107 983111983151983158983141983154983150983149983141983150983156 983106983137983150983147983155 983137983150983140 983110983145983150983137983150983139983145983137983148 983123983156983137983156983141983139983154983137983142983156
31
ELETROBRAacuteS (1) 118 22400 22400EMBRAER 50 1096 1096Gerdau 35 1533 490Independecircncia 139 2500 -JBS 130 14722 11370Klabin 202 5621 -
Light 336 8225 -Marfrig 146 8176 1020MPX Mineraccedilatildeo 26 1791 1791Ouro Fino 200 1057 840Paranapanema 175 1252 08Petrobraacutes 76 10226 10226Rede Energia SA 253 2633 -Tele Norte Leste Participaccedilotildees 16 1645 1645Valepar 97 26254 15585Subtotal 163055 102941Other firms 12223 12606Total 175278 115548----------------------------------------------------------------------------------------------------------------
Source BNDESpar Financial Statements 2008 pp
The BNDES also holds blocks of shares in many major Brazilian corporationsthrough its participation subsidiary BNDESpar Comparing value of investments in 2007 and2008 suggests that large purchases capitalized firms precisely as financial crisis and downturnin Bovespa stock market made it difficult for firms to find working capital Table X reportsthe percent of total company shares held by the BNDES and their respective market values(adjusted for risk of future losses) at year end 2007 and 2008 During this year of extremelyshort and expensive credit in Brazil caused by the international financial and banking crisisthe BNDES increased shareholding by over R$60 billion reals in 28 private Brazilianenterprises Further shareholding classified as X in Five firms (Bertin 269 Brasiliana 538
Copel 239 Rio Poliacutemeros 250 Telemar 313) Once again the BNDES provided access tocapital for firms caught in the sudden credit crunch and stock market collapse unable to meetobligations or raise funds through equity issues or commercial bank credit This countercyclical role of government banks has been critical in Brazil since the 19 th century
BNDESpar Private Equity and Fund Participation 2007-2008 R$million
Fund Manager 2008 2007-------------------------------------------------------------------------------------------------------------------------Brasil 21 Dynamo 46 60PROT Mellon Financial Services 4628 -
Logiacutestica Brasil Bradesco 135 -Fire BrasilPrivate 269 250FIPGG Governanccedila amp Gestatildeo Inv 289 311Opportunity Equity Partners Mellon Financial Services 1046 578Brasil Energia Bradesco 1184 655InfraBrasil ABN-Amro 677 251Rio Bravo Cinema Rio Bravo 116 110Brascan Petro amp Gaacutes Bank Brascan 136 113AG Angra Infra-Estrutura Bradesco 380 301Satildeo Paulo Metro Fund Bradesco 791 831Other Funds 653 572Total 10356 4038---------------------------------------------------------------------------------------------------------------------------
Source BNDESpar Financial Statements 2008
8132019 Government Banking and BRICs in the Recent Financial Crisis
httpslidepdfcomreaderfullgovernment-banking-and-brics-in-the-recent-financial-crisis 3257
983106983122983113983107 983111983151983158983141983154983150983149983141983150983156 983106983137983150983147983155 983137983150983140 983110983145983150983137983150983139983145983137983148 983123983156983137983156983141983139983154983137983142983156
32
Finally Brazilian federal government triennial plans include investment targets by theBNDES If current plans are compared to 2004-7 investments several structural changes inBNDES lending appear First BNDES plans for Oil and Petroleum production reveal aprofound change for Brazilian political economy In 1990 roughly 45 percent of oilconsumed in Brazil was imported In 2007 before oil price increased reversed the balance
Brazil reported domestic production levels sufficient to meet domestic consumptionFurthermore discoveries of substantial deep sea oil reserves have led the BNDES to planmassive investments involving Petrobras and other global petroleum firms For the 2009-2012 period investments in petroleum and gas (R$2697 billion) Petrochemicals (237) andEthanol (197) sum to over R$3130 billion
BNDES Triennial Investment Plans 2004-2012
2004-7 2007-10 2008-11 2009-12----------------------------------------------------------------------------------------------------------------Petroleum amp Gas 1472 1836 2028 2697
Mining 472 527 813 480Petrochemicals 64 174 264 237Steel 198 371 312 245Automotive 150 176 264 235Electronics 143 156 140 240Ethanol 166 205 205 197Paper amp Celulose 104 200 274 90Health 51 46 51 80Industry Total 2816 3802 4437 4501----------------------------------------------------------------------------------------------------------------Source BNDES Annual Reports 2002-2006
It is of note that President Dilma Roussef was instrumental in reducing the targets for2009-12 in petroleum and gas given indications that Petrobras and existing framework foroffshore oil prospecting and production proved unable to increase investments accordingly
The BNDES also retains a presence in government projects by providing managementassistance During 2008 BNDES staff provided management support for implementation of192 projects involving R$710 billion of total R$142 billion PT government growthacceleration projects BNDES staff also participated in the design management andimplementation of President Lularsquos Poliacutetica de Desenvolvimento Produtivo (Policy forProduction Development) involving R$2100 billion targeting production chains designed tomaximize employment and regional development benefits Finally the BNDES was alsocharged to create and co-manage a Fundo Amazonia with the Ministry of Environment toprovide incentives to reduce deforestation of the Amazon region BNDES Plans for 2009include completion of concession for construction of high speed train line and service for Riode Janeiro-Satildeo Paulo corridor two blocks of highway concession sales involving three majorhighways in each block of sales sale of management concessions for regional airports andthe reorganization of INFRAERO federal government airport management company
These policies reflect the goal of BNDES policy to launch firms on the stock marketrather than maintain direct credit and finance Exceptions during 2008 involve Auto andEthanol industies both for strategic and broader policy reasons Given the sharp downturn inauto sales during fourth quarter 2008 the BNDES provided significant lending to avert
further downsizing or failure of auto companies in Brazil Given the current globalredistribution of automobile production BNDES policies are designed to help the Brazilian
8132019 Government Banking and BRICs in the Recent Financial Crisis
httpslidepdfcomreaderfullgovernment-banking-and-brics-in-the-recent-financial-crisis 3357
983106983122983113983107 983111983151983158983141983154983150983149983141983150983156 983106983137983150983147983155 983137983150983140 983110983145983150983137983150983139983145983137983148 983123983156983137983156983141983139983154983137983142983156
33
operations of major auto firms through the period of adjustment and increase theattractiveness of domestic operations in global production strategies of multinational autocompanies Ethanol production also received massive funds to sustain an industry seen ascritical for alternative and sustainable fuel source capable of replacing petroleum Ethanolreached over 50 percent of automotive fuel sales in 2007
Under the Lula government (2003-10 the BNDES also resumed lending to state andmunicipal governments Since the renegotiation of municipal and state government debts inthe late 1990s states and municipalities have been largely prohibited from taking on debtThis was emplematic of the recentralization required to control fiscal excesses during militaryrule and the prolonged period of transition to democracy Policies during the 1990s weredesigned to avert overspending seen as critical to maintain price stability under the Real Plan(1994) In 2000 the Lei de Responsibilidade Fiscal (Fiscal Responsibility Law) largelyprohibited credit and finance to state and municipal governments Since 2000 municipalitiesand states have been required to submit detailed budget statements that in turn have been thebasis for a gradual return to sub-national government finance In August 2006 central bankand Treasury regulations freed municipalities to take on credit up to 12 times liquid receipts
Since then the BNDES has led in terms of credits and finance to subnational governmentsthrough a Programa Especial de Financiamento aos Estados e Distrito Federal
The BNDES also has developed the first system in Brazil for risk analysis ofmunicipal governments and has led in the market for municipal credit freed by August 2006procedures for approval at Treasury the Central Bank and Conselho Monetaacuterio Nacional(National Monetary Council) Prosecution of mayors and firms charged with managingmunicipal credits with the BNDES revealed fraudulent practices These funds for sub-national public finance also became critical mechanisms to counter severe budget shortfallscaused by financial crisis during 2008 Given that municipal and state government tax basesare shallow and that federal government transfers provide the bulk of sub-nationalgovernment resources the Lula administration allocated R$ 40 billion to the Fundo deParticipaccedilatildeo dos Estados (State Participation Fund) through a Programa Emergencial deFinanciamento (Emergency Finance Fund) administered by the BNDES
In sum the BNDES expanded credit and finance operations substantially during fouryears of sustained growth from 2004-2007 And having helped underwrite the stock marketboom and capitalized Brazilian firms directly and indirectly through credit finance mutualfunds and private equity funds the BNDES retained sufficient scale scope and capital baseto provide counter cyclical credit and finance to help firms adjust to financial crisis and creditshortage during 2008 In retrospect the growth of the BNDES since liberalization andprivatizations of state government banks in the 1990s suggest the comparative advantages of
development banking BNDES credit and finance fell to 52 percent of fixed capitalformation in 1995 Since then the turn to neo-developmentalism and a period of sustainedeconomic growth during the Lula administration increased the BNDES share of total fixedcapital formation during 2006 and 2007 to 126 and 141 percent Critics charge thatmonopoly over FGTS and PIS-PASEP official savings funds as liabilities provide theBNDES with unfair competitive advantage over private banks In 2008 forced savings fundssummed to only 17 percent of BNDES liabilities (resources) The BNDES does not relyexclusively on forced savings for competitive advantage Instead market-oriented policies
joint-ventures with private mutual funds investment funds private equity firms large blocksof shareholding in Brazilian firms and massive amounts of credit and investment to theprivate sector at below market but still profitable long term interest rates of 625 percent
suggest that the large scale and scope of BNDES operations provide institutional foundationsof competitive advantage over private and foreign banks
8132019 Government Banking and BRICs in the Recent Financial Crisis
httpslidepdfcomreaderfullgovernment-banking-and-brics-in-the-recent-financial-crisis 3457
983106983122983113983107 983111983151983158983141983154983150983149983141983150983156 983106983137983150983147983155 983137983150983140 983110983145983150983137983150983139983145983137983148 983123983156983137983156983141983139983154983137983142983156
34
Capitalization of the BNDES by Treasury of over R$2300 billion 2009-11hascaptured attention of many observers of Brazilian development Critics and advocates agreethat the BNDES has realized significant competitive advantages over private and foreignbanks and continues to serve as significant alternative to capital markets for large scaledevelopment projects However like the downturn in planned investments by Petrobras for
oil and gas exploration and production BNDES decreased planned investments fromR$1684 billion in 2010 to R$1397 billion in 2011 We believe this indicates the limits ofmanagement and passing of period of crisis both favoring finance from capital marketsbanks and public-private partnerships
India
Analysis of Brazilian federal banks suggests that these institutions provided policy alternativewhile realizing competitive advantage over private and foreign banks The modernization ofthese institutions helps explain why these large institutions were able to stay the effects ofcredit crunch and financial market downturn in Brazil This section explores data from the
Reserve Bank of India to compare market shares of types of banks from 1972-2008 and bankperformance from 2006-10 Further analysis will be required However the data appears tosupport our core argument that government banks have modernized and realized competitiveadvantages over private and foreign banks
First the number of branch offices which serves as a measure of institutionalcoverage across India of special concern for financial inclusion and the theory thatliberalization and privatizations would lead private banks to expand branch offices andincrease the supply of services From this perspective the trajectory of branch officessuggests that nationalized banks the State Bank of India and regional rural bankssustain much larger networks of branch offices that predominate while otherscheduled commercial (private and foreign) banks retain less than 8000 branch offices
Data from the Reserve Bank of India on the number of current accounts retainedby type of bank provide further evidence that the State Bank of India and its associates
8132019 Government Banking and BRICs in the Recent Financial Crisis
httpslidepdfcomreaderfullgovernment-banking-and-brics-in-the-recent-financial-crisis 3557
983106983122983113983107 983111983151983158983141983154983150983149983141983150983156 983106983137983150983147983155 983137983150983140 983110983145983150983137983150983139983145983137983148 983123983156983137983156983141983139983154983137983142983156
35
national banks and regional rural banks provide the bulk of banking accounts to theIndian population while private and foreign banks cherry pick upscale urban marketsreproducing capital drain and inequalities
Number of Current Accounts by Type of Bank 1972-1995
Since 1999 the pattern of predominance by alternative banking institutions and the minorrole of other scheduled commercial banks and foreign banks continues
The following figures report the value held in current accounts by type of banks first fromthe 1972-1995 period then from the 1999-2008 period For both time periods the trendconfirms that private and foreign banks remain at a competitive disadvantage in terms of thebroader market while the State Bank of India and its associates nationalized banks andregional rural banks tend to predominate
8132019 Government Banking and BRICs in the Recent Financial Crisis
httpslidepdfcomreaderfullgovernment-banking-and-brics-in-the-recent-financial-crisis 3657
983106983122983113983107 983111983151983158983141983154983150983149983141983150983156 983106983137983150983147983155 983137983150983140 983110983145983150983137983150983139983145983137983148 983123983156983137983156983141983139983154983137983142983156
36
Current Account Value by Type of Bank 1972-1995 R
Number of Deposit Accounts by type of bank 1999-2008
A similar pattern appears for the trajectory of savings accounts both the number of
accounts and the value held in savings accounts both for the 1972-1995 period We wereunable to organize data from the more recent period
8132019 Government Banking and BRICs in the Recent Financial Crisis
httpslidepdfcomreaderfullgovernment-banking-and-brics-in-the-recent-financial-crisis 3757
983106983122983113983107 983111983151983158983141983154983150983149983141983150983156 983106983137983150983147983155 983137983150983140 983110983145983150983137983150983139983145983137983148 983123983156983137983156983141983139983154983137983142983156
37
Number of Savings Accounts by Type of Bank 1972-1995
Value in Savings Accounts by Type of Bank 1972-1995
Number of Term Savings Accounts by Type of Bank 1972-1995
8132019 Government Banking and BRICs in the Recent Financial Crisis
httpslidepdfcomreaderfullgovernment-banking-and-brics-in-the-recent-financial-crisis 3857
983106983122983113983107 983111983151983158983141983154983150983149983141983150983156 983106983137983150983147983155 983137983150983140 983110983145983150983137983150983139983145983137983148 983123983156983137983156983141983139983154983137983142983156
38
Value in Term Savings Accounts by Type of Bank 1972-1995
The number and value of credits extended by banks from 1999-2008 appears mostpromising in terms of comparative analysis of bank performance and behavior Thesignificant spread at the end of the time series between the State Bank of India and itsassociates and foreign banks suggests the impact of foreign financial crisis and differentdomestic policies by these types of banks in India similar to that noted in the Brazilianexperience
Number of credits by type of bank 1999-2008
Value of credit by type of bank 1996-2008
8132019 Government Banking and BRICs in the Recent Financial Crisis
httpslidepdfcomreaderfullgovernment-banking-and-brics-in-the-recent-financial-crisis 3957
983106983122983113983107 983111983151983158983141983154983150983149983141983150983156 983106983137983150983147983155 983137983150983140 983110983145983150983137983150983139983145983137983148 983123983156983137983156983141983139983154983137983142983156
39
Further data from the Reserve Bank of India from 2008-10 permit closercomparison of government private and foreign banks in the recent financial crisis Interms of deposits investments total assets and net profits the dominant and expandingrole of government banking in India is apparent Further control variables (not reported)
include gross and net NPA types of income expenses and expenditures provisions andcontingencies and credit- and investment-deposit ratios provide control for bad bankingand confirm the counter cyclical policies during 2008-10 in India
THE FOLLOWING TABLES REQUIRE INTERPRETATION
Number of Banks 2006-7 2007-8 2008-9 2009-10 2010-11
State Bank of India amp Associates 8 8 7 7 6Nationalized Banks 20 20 20 20 20Old Private Sector Banks 17 15 15 15 14
New Private Sector Banks 8 8 7 7 7Foreign Banks 29 28 31 32 33Source RBI A Profile of Banks 2010-11
Number of Branch Offices 2006-7 2007-8 2008-9 2009-10 2010-11
State Bank of India amp Associates 14673 15848 16894 18178 18772Nationalized Banks 37435 39255 40956 43452 45640Old Private Sector Banks 4723 4690 4908 5220 5011New Private Sector Banks 2599 3635 4333 5232 6957
Foreign Banks 272 277 295 308 316Source RBI A Profile of Banks 2010-11
Number of Employees 2006-7 2007-8 2008-9 2009-10 2010-11
State Bank of India amp Associates 255699 249008 268598 266605 282453Nationalized Banks 473179 466400 462926 473041 475082Old Private Sector Banks 47994 48700 51341 55052 55075New Private Sector Banks 91060 110123 124998 127468 163604Foreign Banks 28426 31301 29582 28012 27968
Source RBI - India BanksAssociation
Business per employee (in lakh) 2006-7 2007-8 2008-9 2009-10 2010-11
State Bank of India amp Associates 43635 54922 65022 73743 79306Nationalized Banks 49001 61828 78316 93586 114477Old Private Sector Banks 48159 56932 63843 69749 8149New Private Sector Banks 80782 83196 78715 84041 82607Foreign Banks 97477 11255 128274 141139 155974Note Business = Deposits + Advances
8132019 Government Banking and BRICs in the Recent Financial Crisis
httpslidepdfcomreaderfullgovernment-banking-and-brics-in-the-recent-financial-crisis 4057
983106983122983113983107 983111983151983158983141983154983150983149983141983150983156 983106983137983150983147983155 983137983150983140 983110983145983150983137983150983139983145983137983148 983123983156983137983156983141983139983154983137983142983156
40
Profit per employee (in lakh) 2006-7 2007-8 2008-9 2009-10 2010-11
State Bank of India amp Associates 257 362 443 466 42Nationalized Banks 287 377 486 567 695Old Private Sector Banks 234 406 469 42 563New Private Sector Banks 587 685 677 847 893Foreign Banks 1613 2112 2539 1692 2759
Capital amp Reserves amp Surplus(Ycrore) 2006-7 2007-8 2008-9 2009-10 2010-11
State Bank of India amp Associates 42941 61706 72422 83726 84394Nationalized Banks 92689 113079 135920 157276 205857Old Private Sector Banks 10736 15315 17477 20171 23821New Private Sector Banks 39736 76056 82192 99813 114768Foreign Banks 33075 49332 59937 69176 80972
Deposits Ycrore 2006-7 2007-8 2008-9 2009-10 2010-11
State Bank of India amp Associates 633476 773875 1007041 1108086 1245862Nationalized Banks 1360724 1679993 2105706 2583934 3127122Old Private Sector Banks 138249 165589 199274 229897 264157New Private Sector Banks 413738 509444 537104 592904 738602Foreign Banks 150750 191161 214076 232099 240689
Investments Ycrore 2006-7 2007-8 2008-9 2009-10 2010-11
State Bank of India amp Associates 211875 263823 357624 387473 385697Nationalized Banks 452981 536018 655042 828125 942837Old Private Sector Banks 43647 54080 72393 83499 92617New Private Sector Banks 171008 224498 234139 270618 329403Foreign Banks 71471 98910 130354 159291 165499
Advances Ycrore 2006-7 2007-8 2008-9 2009-10 2010-11
State Bank of India amp Associates 482270 593722 739450 857937 994154Nationalized Banks 957877 1203678 1519762 1843082 2311478
Old Private Sector Banks 92887 111670 128504 154085 184647New Private Sector Banks 321865 406733 446824 478356 612886Foreign Banks 126339 161133 165385 163260 195539
Interest Income Ycrore 2006-7 2007-8 2008-9 2009-10 2010-11
State Bank of India amp Associates 53465 70428 89196 97954 109828Nationalized Banks 110720 142647 183892 208029 256490Old Private Sector Banks 11474 14614 18790 20497 23299New Private Sector Banks 38092 56377 66282 62309 73528
Foreign Banks 17924 24417 30322 26390 28520
8132019 Government Banking and BRICs in the Recent Financial Crisis
httpslidepdfcomreaderfullgovernment-banking-and-brics-in-the-recent-financial-crisis 4157
983106983122983113983107 983111983151983158983141983154983150983149983141983150983156 983106983137983150983147983155 983137983150983140 983110983145983150983137983150983139983145983137983148 983123983156983137983156983141983139983154983137983142983156
41
Other Income Ycrore 2006-7 2007-8 2008-9 2009-10 2010-11
State Bank of India amp Associates 9420 11818 16073 18394 19240Nationalized Banks 14264 20979 26394 30500 28625Old Private Sector Banks 1568 2184 2782 3152 3029
New Private Sector Banks 10745 14822 15078 17271 17697Foreign Banks 7044 10588 14894 9951 10972
Interest Expended Ycrore 2006-7 2007-8 2008-9 2009-10 2010-11
State Bank of India amp Associates 32607 47809 61770 66229 67018Nationalized Banks 69353 101093 131676 145712 164135Old Private Sector Banks 7055 9960 12834 14076 14768New Private Sector Banks 25802 38535 44123 37130 42347Foreign Banks 7603 10604 12819 8938 10622
Operating Expenses Ycrore 2006-7 2007-8 2008-9 2009-10 2010-11
State Bank of India amp Associates 15987 16993 20088 25283 29146Nationalized Banks 27268 29670 35416 40792 53819Old Private Sector Banks 2967 3235 3939 4715 5600New Private Sector Banks 12353 17032 17840 18136 22006Foreign Banks 7745 10353 12298 11102 12557
Cost of Funds 2006-7 2007-8 2008-9 2009-10 2010-11
State Bank of India amp Associates 475 59 594 532 48Nationalized Banks 48 582 609 537 493Old Private Sector Banks 498 62 667 613 55New Private Sector Banks 524 611 604 442 427Foreign Banks 403 433 446 283 311Cost of Funds = Ratio () of interest paid on deposits and borrowings to averageof opening and closing balances of deposits and borrowings
Return on advances adjusted toCoF 2006-7 2007-8 2008-9 2009-10 2010-11
State Bank of India amp Associates 372 365 395 36 405Nationalized Banks 399 369 409 382 427Old Private Sector Banks 406 426 515 482 492New Private Sector Banks 447 505 526 514 516Foreign Banks 574 66 815 716 564
2006-7 2007-8 2008-9 2009-10 2010-11
8132019 Government Banking and BRICs in the Recent Financial Crisis
httpslidepdfcomreaderfullgovernment-banking-and-brics-in-the-recent-financial-crisis 4257
983106983122983113983107 983111983151983158983141983154983150983149983141983150983156 983106983137983150983147983155 983137983150983140 983110983145983150983137983150983139983145983137983148 983123983156983137983156983141983139983154983137983142983156
42
Wages as of Total Expenses
State Bank of India amp Associates 2155 1589 1506 171 1921Nationalized Banks 1794 1405 1331 1365 1641Old Private Sector Banks 1689 1367 1326 1457 1675
New Private Sector Banks 936 956 1017 121 1383Foreign Banks 2008 1995 1944 2348 2331
Returns on Assets 2006-7 2007-8 2008-9 2009-10 2010-11
State Bank of India amp Associates 086 097 102 091 079Nationalized Banks 094 101 103 100 103Old Private Sector Banks 078 114 115 095 112New Private Sector Banks 109 113 112 138 151Foreign Banks 228 209 199 126 174
Capital Adequacy Ratio 2006-7 2007-8 2008-9 2009-10 2010-11
State Bank of India amp Associates 1232 1321 1396 1346 1225Nationalized Banks 1237 1213 1324 1318 1347Old Private Sector Banks 1208 1408 1476 1485 1456New Private Sector Banks 1199 1439 1533 1803 1687Foreign Banks 1239 1305 1432 1726 1672Note To 2007-8 = Basel I From 2008-09 = Basel-II
Net NPA Ratio 2006-7 2007-8 2008-9 2009-10 2010-11
State Bank of India amp Associates 132 143 147 150 149Nationalized Banks 094 077 068 091 092Old Private Sector Banks 096 066 09 082 053New Private Sector Banks 097 109 129 103 056Foreign Banks 073 077 181 182 067Net NPA Ratio = Net non-performing assets as net advances
In sum descriptive data from the Reserve Bank of India confirm the anomaly
and argument drawn from the Brazilian experience An important dimension of BRICcountry recovery from the global financial crisis and downturn is the counter cyclicallending policies and realization of competitive advantages of government banks Thisposes a series of new questions for business schools and scholars of public policyInstead of liberalization and privatization leading to transitions in BRIC countriestoward capital market centered financial systems and liberal market economies publicbanks have realized competitive advantages over private and foreign banks whileproviding policy alternatives to BRIC governments in the face of financial crisis andglobal economic slowdown We return to these implications in the conclusion
One development of note at the Reserve Bank of India is a policy focus onfinancial inclusion The 2008 report of the Committee on Financial Inclusion has beenfollowed by sections of the Reserve Bank of India Annual Report reserved fordiscussion of financial inclusion And instead of focusing on liberalization and
8132019 Government Banking and BRICs in the Recent Financial Crisis
httpslidepdfcomreaderfullgovernment-banking-and-brics-in-the-recent-financial-crisis 4357
983106983122983113983107 983111983151983158983141983154983150983149983141983150983156 983106983137983150983147983155 983137983150983140 983110983145983150983137983150983139983145983137983148 983123983156983137983156983141983139983154983137983142983156
43
privatization to ensure the spread of banking products and services alternative policieshave been explored One is of special note The Committee on Financial Inclusionrecommended issue of identity cards as bank cards This would profoundly change thelandscape of banking in India and has attracted attention from analysts at the CentralBank of Brazil charged with financial inclusion as well as the President of Indonesia
and apparently Uganda officials Given the revolution in information and card paymenttechnologies this policy proposal and pilot studies deserve close attention asalternatives to dramatically increase the pace of social inclusion of the bankless
8132019 Government Banking and BRICs in the Recent Financial Crisis
httpslidepdfcomreaderfullgovernment-banking-and-brics-in-the-recent-financial-crisis 4457
983106983122983113983107 983111983151983158983141983154983150983149983141983150983156 983106983137983150983147983155 983137983150983140 983110983145983150983137983150983139983145983137983148 983123983156983137983156983141983139983154983137983142983156
44
China
This section turns to a brief review of the Chinese banking sector to further explore therole of government banks in terms of their modernization competitive advantages
policy roles and capacity for counter cyclical credit that help explain why BRICcountries were able to avert the severe consequences of the global financial crisis
First figure A11 reports the basic structure of the banking system in China
Although we have been unable to compare the evolution of types of banks acrosstime in similar ways to the above data on India taken from the Reserve Bank of Indiaour research assistants have gathered the following comparative macroeconomicfinancial and balance sheet data on banking in China The data appear to be consistentwith the core argument presented in this paper ndash that government banks havemodernized since liberalization and provided policy makers with alternative means tocounter the effects of financial crisis abroad
8132019 Government Banking and BRICs in the Recent Financial Crisis
httpslidepdfcomreaderfullgovernment-banking-and-brics-in-the-recent-financial-crisis 4557
983106983122983113983107 983111983151983158983141983154983150983149983141983150983156 983106983137983150983147983155 983137983150983140 983110983145983150983137983150983139983145983137983148 983123983156983137983156983141983139983154983137983142983156
45
We lack more current information and were unable to collect data directly fromofficial sources in China to compare the trajectory of state owned private and foreignbanks As a substitute Figure 1 reports data from 2000-4 that permits initial observationof trends for this earlier period
Those present may not need reminding of the formidable record of economicgrowth in China during this 200-4 period that continues until today However data fromthe National Bureau of Statistics suggests that the Chinese banking system expanded atan even greater pace than the remarkable levels of GDP growth recorded for the 2000-4period Furthermore credit expansion was ldquoorganicrdquo in the sense that deposits
outpaced credit growth from 2000-4
Expansion of Loans in China 1999-2004
Loan Growth Total LoansYear on Year
Growth Total Depositssup1Year on Year
GrowthYear CNY billion CNY () CNY billion CNY()1999 9373 83 10878 1372000 9937 60 1238 1382001 11231 130 14362 1602002 13129 169 17092 1902003 159 211 20806 217
2004 18857 186 25319 217
sup1Based on preliminary estimates by the National Bureau of Statistics of the Peoplersquos Republic of ChinaSource National Bureau of Statistics of the PRC
Although we lack data comparable to that from the Reserve Bank of India ableto compare the trajectory of state private and foreign banks in China the sectoralbreakdown of loans and other banking and national account data confirms the profoundcapitalization of the Chinese banking system and GDP growth during from 1995-2004
8132019 Government Banking and BRICs in the Recent Financial Crisis
httpslidepdfcomreaderfullgovernment-banking-and-brics-in-the-recent-financial-crisis 4657
983106983122983113983107 983111983151983158983141983154983150983149983141983150983156 983106983137983150983147983155 983137983150983140 983110983145983150983137983150983139983145983137983148 983123983156983137983156983141983139983154983137983142983156
46
China Banking Sector Market Dimensions (1995 - 2004)
YearTotal
LoansCorp
LoansConsuLoans
HomeLoans
TotalDeposits Excess
GovBonds
CorpBonds GDP
GDPGrowth
()1995 52310 mdash mdash mdash 5376 145 330 65 5848 2511996 63100 mdash mdash mdash 6847 538 436 60 6788 1611997 73585 7341 17 130 8212 853 551 52 7446 971998 85002 8447 53 430 9529 102 9 777 68 7835 521999 95587 9394 164 1360 10831 1273 1054 78 8207 482000 108763 10453 424 3320 13486 261 1302 86 894 892001 118990 112 699 5600 15472 3573 1562 101 9593 732002 139800 12913 1067 8258 18339 4359 mdash mdash 10479 922003 169770 15401 1576 13302 22036 5059 mdash mdash 11669 1142004 194220 16848 1988 15800 25319 5897 mdash mdash 13657 170Figures = CNYB
This data reported in terms of percent GDP provides further clarity on the rapid
capitalization of loans It is of note that the bulk of loans during this period were to thecorporate sector with consumer and home loans lagging significantly
China Banking Sector Percent GDP
YEARTotal
LoansCorporate
LoansConsumer
LoansHomeLoans Deposits
ExcessDeposits
GovBonds
CorpBonds
1995 895 00 00 00 919 25 56 111996 929 00 00 00 1009 79 64 091997 988 986 02 02 1103 115 74 071998 1085 1078 07 05 1216 131 99 091999 1165 1145 20 17 1320 155 128 092000 1217 1169 47 37 1508 292 146 102001 1240 1167 73 58 1613 372 163 112002 1334 1232 102 79 1750 4162003 1455 1320 135 114 1888 4342004 1422 1234 146 116 1854 432
Sources China Banking Regulatory Commission Peoplersquos Bank of China and GoldmanSachs research estimates
Compilation of financial data from a select number of banks in China suggeststhat the pattern of bank change encountered in Brazil and India also describes theexperience of China The liberalization of the Chinese economy and the modernization
of state banks appear to describe the process of bank change instead of a process oftransition toward private banking and capital market centered financial systemAlthough we have been unable to draw data from Chinese monetary authorities thebalance sheet data suggests the clear predominance of large state banks in the politicaleconomy of banking and finance in China How these institutions were used to counterthe effects of financial crisis abroad and redirect domestic investment production andconsumption must remain a subject for further research
8132019 Government Banking and BRICs in the Recent Financial Crisis
httpslidepdfcomreaderfullgovernment-banking-and-brics-in-the-recent-financial-crisis 4757
983106983122983113983107 983111983151983158983141983154983150983149983141983150983156 983106983137983150983147983155 983137983150983140 983110983145983150983137983150983139983145983137983148 983123983156983137983156983141983139983154983137983142983156
47
Select Financial Data from Chinese Banks 2004()
CNY (billion)Total
AssetsGrossLoans
CustomerDeposits Equity
NPLRatio
()
Pre-prov
ProfitsNet
Profits
State Banks
ICBC 5671 3705 5105 163 190 653 23CCB 3905 2226 3489 195 39 605 484ABC (NA) mdashBOC 427 2146 3342 205 51 578 209Quasi-State
BoCom 1145 639 1023 54 30 131 16CMB 587 376 513 22 29 82 32CITIC Industrial 515 306 429 20 60 52 03SPDB 456 311 397 14 24 62 20China Everbright mdashGuangdong Development 345 216 301 mdash mdash mdash 32
Industrial Bank 341 203 283 10 25 37 11Quase-Private
Bank of Shanghai 216 106 179 83 51 32 26Hua Xia 304 181 270 92 40 29 10Shenzhen Development 198 126 166 43 114 28 03Bank of Beijing 209 85 174 71 mdash 26 07
Sector total 19422 25319 129Three state-banks 2692 3979 188Second tier banks 2549 3733 148
ABC = Agriculture Bank of China BOC = Bank of China
BOCOM = Bank of Communications CCB = China Construction BankCMB = China Merchantrsquos Bank CNY = yuanICBC = Industrial and Commercial Bank of ChinaNPL = nonperforming loanROA = return on assets ROE = return on equityprov = provisioningPRC = Peoplersquos Republic of ChinaSPDB = Shanghai Pudong Development BankNote Loan and deposit market share for BOC and ICBC are for their domestic operations onlySources Company data Goldman Sachs research estimates
Returns on Assets Equity and Domestic Market Shares of Major China Banks 2004()
CNY (billion) ROA () ROE ()Deposit Mkt
Share ()Loan MktShare ()
Mortgage MktShare()
State Banks
ICBC 004 14 199 187 253CCB 130 254 138 115 217ABC (NA)BOC 051 102 101 89 152Quasi-State
BoCom 015 45 37 29 34CMB 060 161 20 19 29
CITIC Industrial 007 17 17 16 18SPDB 048 153 16 16 26
8132019 Government Banking and BRICs in the Recent Financial Crisis
httpslidepdfcomreaderfullgovernment-banking-and-brics-in-the-recent-financial-crisis 4857
983106983122983113983107 983111983151983158983141983154983150983149983141983150983156 983106983137983150983147983155 983137983150983140 983110983145983150983137983150983139983145983137983148 983123983156983137983156983141983139983154983137983142983156
48
China EverbrightGuangdong Development mdash mdash 12 11 mdashIndustrial Bank 037 126 11 10 10Quase-Private
Bank of Shanghai 129 360 07 05 14Hua Xia 038 116 11 09 07Shenzhen Development 017 75 07 06 08Bank of Beijing 037 108 07 04 07
Sector totalThree state-banks 438 391 622Second tier banks 144 127 154
ABC = Agriculture Bank of China BOC = Bank of China BOCOM = Bank of Communications CCB =China Construction Bank CMB = China Merchantrsquos Bank CNY = yuanICBC = Industrial and Commercial Bank of China mkt = market NPL = nonperforming loan ROA =return on asset ROE = return on equity prov = provisioning PRC =Peoplersquos Republic of China SPDB = Shanghai Pudong Development BankNote Loan and deposit market share for BOC and ICBC are for their domestic operations onlySources Company data Goldman Sachs research estimates
Further data from 2006-10 from the Peoples Bank of China suggests that the big5 state banks continue to outperform the next 12 largest joint stock commercial banksThe big five have launched sales of shares to capitalize while listing on capital marketsand adopting reporting of financial data along lines of international standards Thisappears to be similar to Banco do Brasil policies that retain majority of shares in federalgovernment control while capitalizing the bank through issues of stock
Comparing the Performance of Big 5 State Banks and Next 12 Joint Stock CommercialBanks in China
2006 2007 2008 2009 2010
Profit Margin Big 5 State Banks 3116 3143 2586 3026 3269
Next 12 JS Commercial Banks 2050 2791 1796 2159 2365
Returns Big 5 State Banks 507 606 860 691 675(risk adj) Next 12 JS Commercial Banks 459 570 1016 714 723
Op Risk Big 5 State Banks 5548 5539 5215 5319 5322Next 12 JS Commercial Banks 5886 5721 5725 5831 5947
Leverage Big 5 State Banks 1626 1482 1724 173 1734Next 12 JS Commercial Banks 2826 2251 2064 2048 1936
ROE Big 5 State Banks 1424 1557 1999 1925 2037Next 12 JS Commercial Banks 1564 2049 2156 1840 1967
Big 4 and 11 JSCBsSource Peoples Bank of China China Financial Stability Reports 2007-11
Performance indicators reported by the Peoples Bank of China for the big 5 statebanks and 12 next largest joint stock commercial banks also suggest that the largestgovernment banks in China retain significant competitive advantages ndash and may providepolicy alternatives Given the current shift of economic policy in China away fromindustry and export led growth to more sustainable domestic oriented growth and socialinclusion the role of state banks clearly comes to the fore
8132019 Government Banking and BRICs in the Recent Financial Crisis
httpslidepdfcomreaderfullgovernment-banking-and-brics-in-the-recent-financial-crisis 4957
983106983122983113983107 983111983151983158983141983154983150983149983141983150983156 983106983137983150983147983155 983137983150983140 983110983145983150983137983150983139983145983137983148 983123983156983137983156983141983139983154983137983142983156
49
Net Operating Income of Big 5 State Banks and Next 12 CommercialBanks 100 million RMB YuanBig 5 State Banks 2006 2007 2008 2009 2010
Balance Net interest income 349703 500456 556790 532206 720152Net fee amp commission inc 48524 103817 138464 175469 232491
Investment income 216089 283725 338865 324037 340440
Other business income (1807) (17054) 47548 33791 2186
Net operating income 612509 870944 1081667 1065503 1314943
Percent Net interest income 5709 5746 5148 4995 5477
Net fee amp commission inc 792 1192 1280 1646 1768
Investment income 3528 3258 3133 3041 2589
Other business income (030) (196) 440 318 166
Net operating income 10000 10000 10000 100 100
Next 12 Joint Stock CommercialBanks 2006 2007 2008 2009 2010
Net interest income 87253 132945 198965 191276 281588
Net fee amp commission inc 7850 16247 27319 30115 42023
Investment income 20959 32172 44864 50767 50500
Other business income 2306 4498 16359 10384 7400
Net operating income 118468 185861 287507 282542 381511
Percent Net interest income 7365 7153 6920 6769 7381
Net fee amp commission inc 671 874 950 1066 1101
Investment income 1769 1731 1560 1797 1324
Other business income 195 242 569 368 194Net operating income 10000 10000 10000 10000 10000
Source Peoples Bank of China China Financial Stability Reports 2007-11
Big 4 and 11 JSCBsBig 5 = ICBC ABC BOC CCB BOCOMNext 12 Joint Stock Commercial Banks = China CITIC Bank Everbright Bank Huaxia BankGuangdong Development Bank Shenzhen Development Bank China Merchants Bank Shanghai PudongDevelopment Bank Industrial Bank China Minsheng Banking Corporation Evergrowing Bank ChinaZheshang Bank Bohai Bank
In conclusion bank change in China also appears to confirm our findings from
Brazil ndash that state banks have realized competitive advantages and increased marketshares since liberalization while providing counter cyclical credit to ameliorateadjustment to crisis The modernization of the China Postal Savings Bank is ofparticular interest given its social mission downmarket focus and 40000 branchOffices throughout the country Expansion of card payment services through the postalbank system confirms the importance of the Brazilian federal savings bank (CaixaEconocircmica Federal Caixa) as agent for federal government social policy and agentresponsible for management of citizenship cards (12 million) and payment of familygrants This back to the future modernization of savings banks has proved essential forovercoming notorious levels of social exclusion and inequality in Brazil Althoughenglish language materials are unavailable on the China Postal Savings Bank thisinstitution clearly presents profound opportunities for comparable policies in China
8132019 Government Banking and BRICs in the Recent Financial Crisis
httpslidepdfcomreaderfullgovernment-banking-and-brics-in-the-recent-financial-crisis 5057
983106983122983113983107 983111983151983158983141983154983150983149983141983150983156 983106983137983150983147983155 983137983150983140 983110983145983150983137983150983139983145983137983148 983123983156983137983156983141983139983154983137983142983156
50
Reported offer of microfinance services for poverty reduction as part of nationaleconomic stimulous plan may point to developments in this direction
Given that state planning capacity has long been at the center of attention intheories of financial statecraft the role of Chinese state banks in redirecting policiesaccording to the 12th 5 Year plan for 2011-15 seems critical From 2000-5 the 10th 5
Year plan emphasized infrastructure and the attraction of investment and labor skillsThe 11th 5 Year plan (2006-10) raised concerns about sustainability rather than growthlevels while also seeking to spread improvements to balance development better servepeople and improve the quality of life continue to support Center and West provincesand revitalize Northeast provinces In comparison the 12th 5 Year plan calls for morebalanced lsquoinclusiversquo growth and structural adjustemts more than 4 trillion RMB($US600 billion) for targeted industries and interior regions a focus on new energynew materials and information and high technologies biology and new medicineenergy converstaion and environmental protection aerospace marine and advancedmanufacturing This implies fundamental shifts away from industry to services that hasbeen reported in macroeconomic data for 2010 If past studies emphasized directed
credit and industrial change the role of Chinese state banks in realizing transformationscertainly warrants study
Although the domestic flow of funds process of liberalization (or the lackthereof) and insertion of banking into Chinese political economy is beyond the scope ofthis paper our findings from Brazil appear to provide valuable hypotheses about ChinaThat is to say the big state banks and other government banks in China remaincommanding heights not in the Marxist sense of providing means to reach socialismbut immense institutions with profound presence throughout politics and markets in thecountry In this sense our findings from Brazil appear to approximate patterns ofchange in China more than Washington Consensus expectations about liberalization andprivatizations to free private and foreign banks Financial statecraft draws attention tothe capitalization of Chinese state banks through stock Sales and listings on capitalmarkets However like the Banco do Brasil (that reformers in the 1990s sought to shiftcontrol to the private sector only to increase federal government shareholding) theChinese experience surely involves unexpected consequences and patterns of changedifferent than a linear transition to the Berle amp Means paradigm of corporategovernance
Russia The New State Duopoly
ldquoThe rush of 2003-8 increased the market share of foreign banks to 285 from
52 However the state-owned banks received enormous help from the federal budget in the days of the crisis thereby strengthening their dominant
position on the Russian financial market says Sergey Aleksashenko the formerDeputy chairman of Russias Central Bank quotes Russia Profile Today one
must not harbor any illusion of a fair competition with them all the main cash
flows in Russia are controlled by state-owned banks httpwwwbarentsnovacomnode1031
Description of banking policy in Russia during the global financial crisis can beobtained from Bank of Russia annual reports and related publications The figure on the
following page summarizes the financial flows to and from the Bank of RussiaAlthough central bank policy is beyond the scope of this study the role of state banks in
8132019 Government Banking and BRICs in the Recent Financial Crisis
httpslidepdfcomreaderfullgovernment-banking-and-brics-in-the-recent-financial-crisis 5157
983106983122983113983107 983111983151983158983141983154983150983149983141983150983156 983106983137983150983147983155 983137983150983140 983110983145983150983137983150983139983145983137983148 983123983156983137983156983141983139983154983137983142983156
51
channeling counter-cyclical credits released by the Bank of Russia appear to confirm thecore argument that emerges from our studies of the Brazilian banking system Furtherdata on the following pages also suggest that state banks in Russia performed wellduring 2008-10 confirming on the basis of sparse data taken from Bank of Russiareports and documents that public banks have modernized provided counter-cyclical
credit to reverse credit crunch and economic downturn while realizing competitiveadvantages over private and foreign banks
8132019 Government Banking and BRICs in the Recent Financial Crisis
httpslidepdfcomreaderfullgovernment-banking-and-brics-in-the-recent-financial-crisis 5257
983106983122983113983107 983111983151983158983141983154983150983149983141983150983156 983106983137983150983147983155 983137983150983140 983110983145983150983137983150983139983145983137983148 983123983156983137983156983141983139983154983137983142983156
52
The following aggregate figures reported by the Bank of Russia suggest severaltrends of significance First Chart 32 suggests that household deposits shifted fromRuble deposits to foreign currency pegged (or indexed) during 2008 Second Chart 33illustrates the substantial increase of non-bank overdue debt during second semester
2008
Consequently the financial results and profitability of banks declinedsignificantly during 2008 The greater confidence in deposits with government banksfound abroad suggests that this may have been critical in Russia
Performance data deom 2008-10 provides a clearer picture one that is consistentwith our findings in Brazil State banks appear to have outperformed all other types of
banks except medium and small regional banks The following table reports the averagereturns on assets and returns on equity reported by the Bank of Russia 2008-10
Returns on Assets and Equity by Type of Bank in Russia 2008-9
Return on assets Return on equity 2008 2009 2010 2008 2009 2010
-------------------------------------------------------------------------------------------------------------------State Banks 22 08 24 157 46 148Foreign Banks 18 11 21 146 83 145Large private banks 13 03 11 106 28 84Medium-Small Banks Moscow 15 12 14 68 52 67
Medium-Small Regional Banks 21 12 15 131 65 98--------------------------------------------------------------------------------------------------------------------Source Bank of Russia Bank Supervision Reports 2009 and 2010
8132019 Government Banking and BRICs in the Recent Financial Crisis
httpslidepdfcomreaderfullgovernment-banking-and-brics-in-the-recent-financial-crisis 5357
983106983122983113983107 983111983151983158983141983154983150983149983141983150983156 983106983137983150983147983155 983137983150983140 983110983145983150983137983150983139983145983137983148 983123983156983137983156983141983139983154983137983142983156
53
Further data from the Bank of Russia on the capital adequacy of Banks during2009-10 suggest that foreign banks and large private banks remain less capitalizedagainst risks according to Basel II guidelines albeit at levels almost double thatrecommended by the Bank for International Settlements (80 risk weighted) Although
further analysis is needed this data is consistent from that reported in Brazil thatgovernment banks tend to more cautious and more prudent in terms of placing asidehigher levels of reserves and patrimony against possible losses
Capital Adequacy of Banks by Type of Bank in Russia 2009-10
2009 2010 2011---------------------------------------------------------------------------------------------------------State Banks 184 227 186Foreign Banks 155 196 195Large Private Banks 140 181 155
Medium-Small Banks Moscow 316 312 268Medium-Small Regional Banks 219 241 207Non-Bank Credit Institutions 372 1038 678---------------------------------------------------------------------------------------------------------Source Bank of Russia Bank Supervision Report (Moscow) 2009 p 43
Finally Bank of Russia bank supervision reports also suggest that state banksexpanded their market shares of assets and capital during the years following the globalfinancial crisis While large private banks and foreign banks lost market share of bankassets and bank capital in Russia state banks increased their significant market sharefrom 405 ndash 426 percent and 471-476 percent of assets and capital respectivelyUnfortunately data from previous years and for specific banking groups was notobtained However this data does appear to indicate that our findings of competitiveadvantages and policy alternatives
Number and Market Share by Type of Bank
N Banks Assets Capital---------------------------- ---------------------------- ----------------------------
Type of Bank 2009 2010 2011 2009 2010 2011 2009 2010 2011-------------------------------------------------------------------------------------------------------------------------------State 17 22 27 405 439 458 471 489 473
Foreign 101 106 108 187 183 180 172 169 191Large Private 136 139 131 346 333 305 276 287 269Med-Small Moscow 361 335 317 27 26 26 43 34 35Medi-Small Regional 443 412 372 28 28 27 36 31 29Other Credit Institutions 50 51 57 07 04 04 01 02 03Total 1108 1058 100 100 100 100 100 100-------------------------------------------------------------------------------------------------------------------------------Source Bank of Russia Bank Supervision Report 2009 amp 2010
In sum politics and financial statecraft have led to the realization of significantcompetitive advantage by Russian state banks Sperbank and Vneshtorgbank increasedtheir share of bank assets from 32 percent in 2005 to over 50 percent by 2011 through
mergers and acquisitions and aggressive displacement of foreign banks Whatever thepolitics data from the Bank of Russia suggests that monetary authorities released a
8132019 Government Banking and BRICs in the Recent Financial Crisis
httpslidepdfcomreaderfullgovernment-banking-and-brics-in-the-recent-financial-crisis 5457
983106983122983113983107 983111983151983158983141983154983150983149983141983150983156 983106983137983150983147983155 983137983150983140 983110983145983150983137983150983139983145983137983148 983123983156983137983156983141983139983154983137983142983156
54
series of counter cyclical credit injections during 2008-9 to domestic bankinginstitutions Moreover data suggests that state banks continue to perform at or ahead oflevels reported by regional private and foreign banks The large market share andimproved performance of state banks reported in recent data suggests although the datais sparse that government banks in Russia have also modernized realized competitive
advantages and provided policy alternatives against the impact of financial crisisabroadWe were unable to find evidence of policy making toward social inclusion at the
Bank of Russia or Russian state banks despite the historical trajectory of the Sberbankas a savings bank under communism The context also appears to differ considerably Asurvey of the Zircon Research Group reportedly found that only 15 percent of Russiansretain bank accounts because of mistrust in banks and government This combination ofrealist politics and the realization of competitive advantages by Russian state bankssuggests that theories of economic statecraft in the realist tradition may indeed explainthe domestic developments under study
Conclusion
This paper reports evidence about government bank modernization and financialstatecraft in BRIC countries designed to counter the effects of crisis and shape domesticgrowth Government banks in BRIC countries have contributed to the widely notedadjustment of these economies to global financial crisis and economic downturnContrary to the Washington Consensus that prevailed during much of the 1980s and1990s (that privatization and liberalization especially of banking would free marketforces and deepen domestic financial systems) a quite different process of bank changeappears to have ensued after financial liberalization in the BRICs
Instead of replacement of state banks with private banks government banksremain central agents of domestic credit and growth and have modernized ldquojust intimerdquo The capitalization and realization of competitive advantages by large governmentbanks during the 2000s meant that once the US financial panic spread across capitalmarkets broke highly leveraged private and produced runs on private bank depositspolicy makers in BRIC countries nonetheless retained counter cyclical policyalternatives through their more solid large state banks
These findings counter traditional foci on the private sector individualentrepreneurship and ideals of free markets linked to the political and social advancesrecorded around the world in the last decades We report an anomaly for theories offinancial repression and the Washington Consensus about the virtues of privatization
and liberalization Although largely blamed for reproducing underdevelopment in thepast BRIC government banks averted excesses of private banking that drove creditbubbles such as home mortgages and derivatives in the US And since liberalization ofbanking (we have not adequately discussed how much liberalization occurred in eachcountry) government banks have modernized to compete with private and foreignbanks Government banks have realized competitive advantages and provided policyalternatives These two arguments help explain why BRIC countries have farecomparatively well in the face of financial crisis in core countries
Financial statecraft is therefore at the center of BRIC counter cyclical capacitiesand state planning Brazil Russia India and China fared significantly better thanadvanced and many developing countries in terms of adjusting to credit crunches and
export shocks This is because government banks proved critical interbank credit toretain confidence in domestic banking systems These institutions also presented other
8132019 Government Banking and BRICs in the Recent Financial Crisis
httpslidepdfcomreaderfullgovernment-banking-and-brics-in-the-recent-financial-crisis 5557
983106983122983113983107 983111983151983158983141983154983150983149983141983150983156 983106983137983150983147983155 983137983150983140 983110983145983150983137983150983139983145983137983148 983123983156983137983156983141983139983154983137983142983156
55
policy alternatives for political and social forces Politics shaped adjustment andrecovery through state banks differently in BRIC countries Given the realities of statecentered political realism in Russia the redirection of state banks toward goals ofChinese Five Year Plans and the modernization of the State Bank of India amidst anamorphous federalism the experience of Brazil with democratization and public bank
modernization may stand out (Armijo 2009)Further analysis of savings banks and cooperative banks also will be requiredAs members of the World Savings Bank Institute (a global association of savingsbanks) the Caixa in Brazil SNI and NABARD in India and China Postal Savings Bankappear to have provided access to very large numbers of previously unbanked citizensThis returns to traditional ideas of social banking and the history of savings banks thatwere founded throughout Europe since the late 18 th century The upmarket strategy andexpansion into investment banking and international banking of the Russian Sberbankconstrasts with downmarket strategies of savings banks in Brazil India and China
The financial press has recently reported doubts about bad loans in Chinese statebanks and cast doubt on the financial results posted and reported in this paper
However current estimates of 2-5 percent bad loans in Chinese state banks pale incomparison to the US$1240 billion in bad loans shifted to asset managementcompanies in the mid 2000s before capitalization of these institutions through sale ofshares Critics of state banking in Brazil also point to past levels of bad loans (reaching30-40 percent) because of their capture during military government delayed transitionBut the cost of capitalization and transfer of bad loans from Brazilian state banks alsoremained below US$400 billion and is still contingent on liquidation of assetmanagement companies created in 2001 In any case these numbers are very smallcompared to GAO estimates of US$120 trillion in emergency infusions by USmonetary authorities to banks and financial institutions from 2007-11
These are anomalies for recent market-based banking theory and neo-liberalpolicy designs However they do not run counter to orthodoxy in economics andbanking theory Over the last decades economic reforms (fiscal financial monetaryand banking) have improved transparency and brought public policy and marketexpectations closer However expectations about deregulation and free marketequilibria in banking and finance have succumbed in the face of panic and the stillsobering consequences of crisis The materials presented herein are descriptive and willrequire more careful analysis However given the urgency of searching for alternativedevelopment models and different approaches to financial statecraft in BRIC countriesand beyond we have taken the liberty to present research in initial stages and toprovoke thought along the lines suggested by our kind conveners
8132019 Government Banking and BRICs in the Recent Financial Crisis
httpslidepdfcomreaderfullgovernment-banking-and-brics-in-the-recent-financial-crisis 5657
983106983122983113983107 983111983151983158983141983154983150983149983141983150983156 983106983137983150983147983155 983137983150983140 983110983145983150983137983150983139983145983137983148 983123983156983137983156983141983139983154983137983142983156
56
Appendix on Alternative Banking and Social Inclusion
This appendix describes how ideas about government banking led to further work onalternative banking and social inclusion with help from the Rockefeller FoundationBellagio Center In July 2011 we were able to convene a conference designed to gather
scholars alternative banking executives and representatives from savings andcooperative bank associations to rethink strategies for social inclusion in the globalsouth and attempt to launch a new policy agenda Given the search for alternativestrategies to counter crisis and the advances of stabilization transparency and bankingsupervision in developing and emerging economies we call for alternative bankingcommunities in the global north and south to work together and help shape a new policyagenda for social inclusion Because savings banks credit cooperatives and otheralternative banking and finance institutions have realized competitive advantages andemerged from crisis we can now think beyond We believe that new policies may helpdeveloping and emerging nations redirect large domestic institutions such as postal andsavings banks toward meeting the UN millennium goals to eliminate poverty by 2015
Plans include writing a green paper on Core Principles for Alternative Bankingand Social Inclusion convening events to promote these principles through institutionalsupporters and networks and seeking adoption of these principles at policy venues suchas the World Savings Bank Institute the International Association of CooperativeBanks the Bank for International Settlements the International Financial ReportingStandards foundation the ISO International Standards Organization the Charter forResponsible Business regional development banks and the World Bank We also planto submit an edited volume of scholarly contributions on alternative banking and socialinclusion by year-end 2012 Interested parties are welcome to participate
Institutional supporters and networks include
Institutional SupportersColumbia University School of International and Public Affairs New YorkInstitute for Money Technology and Financial Inclusion University of CaliforniaIrvineKingacutes College Department of Management LondonSatildeo Paulo Business School Getulio Vargas FoundationSecond University of Naples
Networks
Association of Emerging Market Business Schools Satildeo Paulo BrazilCommunity of European Management Schools BrusselsCritical Political Economy NetworkEuropean Association of Co-operative Banks BrusselsGlobal Public Policy Network LondonInternational Cooperative Banking Association BrusselsSocial Science Finance Network AmsterdamSociety for Advancement of Social Economics PhiladelphiaWorld Savings Bank Institute Brussels
8132019 Government Banking and BRICs in the Recent Financial Crisis
httpslidepdfcomreaderfullgovernment-banking-and-brics-in-the-recent-financial-crisis 5757
983106983122983113983107 983111983151983158983141983154983150983149983141983150983156 983106983137983150983147983155 983137983150983140 983110983145983150983137983150983139983145983137983148 983123983156983137983156983141983139983154983137983142983156
Core Principles for Alternative Banking and Social Inclusion
Commitment to End Capital StarvationPromote access to and use of banking and financial services by all through newtechnologies and distribution channels to capitalize assets among the poor
Commitment to Universalize Income Savings Credit and FinanceProvide basic income via ATM cards and mobile banking to reach the poor and opennew channels of access to income savings credit finance insurance and opportunities
Prudent Banking and Regulatory ComplianceAlternative banking seeks to work within regulations guidelines and best practicesrecommended by domestic monetary authorities and international regulatory institutionssuch as the Bank for International Settlement Basel II Capital Risk Guidelines
Corporate Social Responsibility Leadership
Integrate corporate social responsibility into down-market business strategies andinstitutions of representation and democratization
Transparency and AccountabilityPublish annual reports and balance sheets in accord with international best practices offinancial social and sustainability reporting
Leadership in Provision of New Banking Services and Products to the PoorUse competitive advantages in banking and institutional networks to channel moreeffectively capital income and finance to the poor
Generate Sustainable Income and Household Asset AccumulationUse branch offices and new banking technologies to accelerate progress toward UNmillennium goals to eliminate poverty
Universalize Financial EducationPromote financial education to encourage responsible banking and finance and avertpredatory lending and unethical practices
Adopt Cutting Edge Technology and Management Practices to Provide
Competitive Alternative to Private Commercial and Investment Banks
Incorporate electronic card and mobile banking services to better serve the poorContribute to Realization of Bellagio Principles for SustainabilityPromote alternative banking and business practices that contribute to environmentallysustainable income consumption and production as stated in Bellagio Principles forSustainability
Respect and Build on National and Regional DifferencesI d f i l d l l i b ki i i i d i i l

8132019 Government Banking and BRICs in the Recent Financial Crisis
httpslidepdfcomreaderfullgovernment-banking-and-brics-in-the-recent-financial-crisis 1257
983106983122983113983107 983111983151983158983141983154983150983149983141983150983156 983106983137983150983147983155 983137983150983140 983110983145983150983137983150983139983145983137983148 983123983156983137983156983141983139983154983137983142983156
12
suggested in the 1988 Basel Accord and subsequent revisions for capital guidelines In otherwords Brazilian banks set aside almost half again more in additional capital reserves thanlevels recommended by the Bank for International Settlements Second the different BaselIndex ratings of government and private banks also reflects the greater weight of credit andtherefore credit risk in these institutions And data on bad and late loans since 2001 suggest
that the slight and temporarily higher levels of average Basel Indexes reported by governmentbanks do not reflect broader deterioration of portfoliosFurthermore Banks in Brazil and especially government banks tend to be more
conservative setting aside not only frac12 of deposits as compulsory reserves at the Central Bankof Brazil but also retaining additional reserves against bad loans and losses Firstcomparative data suggests that Brazilian banks tend to set considerably larger sums aside inreserve against bad loans and other losses Of the four large Latin American countries andfour further economies reported by the IMF and Central Bank of Brazil Brazil retainedsubstantially larger reserves against bad loans than any country except Spain during 2007This confirms the particular characteristics of banking in Brazil that of a higher cost andlower operating efficiency combined with larger reserves and provisions against losses
Bank Reserves as Percent of Overdue amp Late Loans in Brazil Select Latin American andReference Countries
2003 2004 2005 2006 2007 2008---------------------------------------------------------------------------------------------Brazil 3200 3719 2874 2800 2862 2709Argentina 792 1029 1251 1303 1303Chile 1309 1655 1776 1985 2107Mexico 1671 2018 2321 2074 1947Australia 1318 1829 2030 2052 1889Canada 435 477 493 553 449Spain 2454 2196 2518 2733South Africa 542 613 643---------------------------------------------------------------------------------------------Source IMF Global Financial Stability Report 2008 cited in Central Bank of Brazil Financial Stability
Report November 2008 p 56
The level of bad and late loans in bank portfolios is another measure of bank solidityThe convergence of bad credit levels in government private and foreign banks from 1988-2008 introduced this study Further comparison suggests that although government banksretain higher levels of bad and late loans in specific sectors (especially home loans) the value
of late loans as a percent of total loans in government banks fell below levels in private andforeign banks during 2008 (See table on following page) The value of bad credit (loans over12 months past due) in government banks decreased from R$372 billion in 2001 to R$149billion in June 2006 This places the value of bad credit in government banks below the valuefound in private and foreign banks Bad credit in private banks increased from R$173 billionin 2001 to peak at R$255 billion during 2003 declining to R$180 billion in 2006 Foreignbanks also reported increased values of bad credit from R$123 billion in 2001 peaking atR$141 billion in 2003 and declining to R$130 billion in 2006 While late loans remained 85percent of total loans in government banks in 2001 (above 75 percent in private and 65percent in foreign banks) by 2008 the relation reverses In 2008 late loans declined to 32percent of total loans at government banks while remaining at 37 percent in private banksand 45 percent in foreign banks
8132019 Government Banking and BRICs in the Recent Financial Crisis
httpslidepdfcomreaderfullgovernment-banking-and-brics-in-the-recent-financial-crisis 1357
983106983122983113983107 983111983151983158983141983154983150983149983141983150983156 983106983137983150983147983155 983137983150983140 983110983145983150983137983150983139983145983137983148 983123983156983137983156983141983139983154983137983142983156
13
Moreover government banks in Brazil continue to set aside greater provisions againstbad and late loans than private or foreign banks In 2004 government banks retained 86percent of the value of total loans in provision against losses from non-paying loans whileprivate banks retained 60 percent and foreign banks 51 percent In 2008 the level ofprovisions at government banks had declined on average to 68 percent but still remained
well above the levels of 52 and 51 percent recorded at private and foreign banks
Late Loans and Provisions in Government Private and Foreign Banks 2001-2008
Government Banks Private Banks Foreign Banks--------------------------- ----------------------------- -----------------------------R$bi R$bi R$bigt12m Late Provision gt12m Late Provision gt12m Late Provision
----------------------------------------------------------------------------------------------------------------2001 372 85 173 75 123 652002 394 55 202 73 141 60
2003 326 70 255 74 159 662004 133 35 86 160 31 60 102 32 512005 134 39 81 163 35 59 107 35 482006 149 42 68 180 44 66 130 45 532007 35 75 37 55 43 502008 32 68 37 52 45 512009 30 56 612010 20 47 40 66 41 532011 20 43 46 71 50 58----------------------------------------------------------------------------------------------------------------Note Bad credit = loans past due over 12 months Late = percent of total loans gt120 days overdue
Provision = percent of total loan value set aside as reserves against losses Empty cells reflect lack of databecause of changing reporting standards at Central BankSource Central Bank of Brazil Financial Stability Report November 2008 p 56 and 2002-2006
Again in comparative perspective the levels of late loans in Brazilian bankingremains significantly higher than other countries Table 213 reports the value of late loans asa percent of bank portfolios in Brazil select Latin American and further countries forreference This suggests that differences found in Brazilian government banks have to dowith differences in the banking system such as judicial preference for debtors over creditorsrather than the inferior performance of government banks
Late Loans as percent of Total Loans in Brazil Select Latin American and ReferenceCountries
2003 2004 2005 2006 2007----------------------------------------------------------------------------------------------------------------Brazil 39 30 35 37 32Chile 16 12 09 08 08Mexico 28 22 18 21 25Australia 03 02 02 02 02Canada 12 07 05 04 04Spain 17 17 16 14 11South Africa 24 18 15 11 12
---------------------------------------------------------------------------------------------------------------- Does not include credits covered by guaranteeSource Bankscope cited in Central Bank of Brazil Financial Stability Report November 2008 p 56
8132019 Government Banking and BRICs in the Recent Financial Crisis
httpslidepdfcomreaderfullgovernment-banking-and-brics-in-the-recent-financial-crisis 1457
983106983122983113983107 983111983151983158983141983154983150983149983141983150983156 983106983137983150983147983155 983137983150983140 983110983145983150983137983150983139983145983137983148 983123983156983137983156983141983139983154983137983142983156
14
Further comparative data confirms that the Brazilian banking system tends to run onmore expensive credit higher returns and profits and higher levels of late and bad loansBanks operating in Brazil also retain higher levels of administrative and personnel costsHowever Brazilian banks also tend to set aside more generous reserves and provisions
against losses These structural characteristics can be seen in the comparative data in the tablebelow The data on government private and foreign banks in Brazil and comparisons suggestthat the Brazilian banking system incurs higher operating costs maintains higher reservesprovisions and capital against losses and risk but nonetheless produces strong returns
Indicators of Bank Efficiency Performance and Provisions in Brazil Select Latin Americanand Reference Countries
Cost Op Exps NPL Provisions EquityIncome Assets Loans NPL Assets
----------------------------------------------------------------------------------------------------------------
Brazil 62 65 41 153 9Argentina 84 41 66 116 12Chile 53 28 10 166 7Colombia 52 59 32 144 11Mexico 58 47 20 232 12US 54 33 07 163 8Spain 56 16 07 313 12----------------------------------------------------------------------------------------------------------------Source World Bank ldquoBrazil The Industry Structure of Banking Servicesrdquo Brasiacutelia June 2007 pp
Comparison of administrative costs in Brazilian banking with levels in other large
Latin American and emerging and reference economies suggest that Brazilian banks retainhigher costs From 2001 through 2005 the value of administrative costs as a percent of bankassets in Brazil declined from 69 percent to 58 percent but remained significantly abovelevels reported from Chile (30 to 27 percent) Mexico (47 to 46 percent) and well abovereference countries such as Australia Canada and Spain (16 36 and 11 percentrespectively) Although time series lacks comparison after 2005 administrative costs inBrazilian banks decline significantly from 58 in 2005 to 42 in 2008
Bank Administrative Costs in Brazil Select Latin American and Reference Countries (Assets)
2001 2002 2003 2004 2005 2006 2007 2008-------------------------------------------------------------------------------------------------Brazil 69 61 60 61 58 55 51 42Chile 30 30 27 27 27Mexico 47 48 46 43 46Australia 17 17 16 16 16Canada 27 27 27 27 26Spain 17 17 16 14 11-------------------------------------------------------------------------------------------------- Adjusted average of total assetsSource Bankscope cited in Central Bank of Brazil Financial Stability Report November 2008 p 56
A final comparison of government private and foreign bank solidity is based onCentral Bank of Brazil estimates of the impact of hypothetical shocks to the Brazilian
8132019 Government Banking and BRICs in the Recent Financial Crisis
httpslidepdfcomreaderfullgovernment-banking-and-brics-in-the-recent-financial-crisis 1557
983106983122983113983107 983111983151983158983141983154983150983149983141983150983156 983106983137983150983147983155 983137983150983140 983110983145983150983137983150983139983145983137983148 983123983156983137983156983141983139983154983137983142983156
15
economy on domestic banks These estimates are based on the revisions of the widely usedValue-at-Risk estimates proposed by Boudoukh Richardson and Whitelaw that adapts theoriginal VaR method developed and commercialised by JP Morgan19
Stress Tests for Impact of Credit Interest Rate and Foreign Exchange Shock on Basel Index
Comparison of Government Domestic and Foreign Banks 2001-2006
2002 2003 2004 2005 2006-------------------------------------------------------------------------------------------------------------
Government 112 104 114 113 109Domestic 112 132 126 121 103Private 103 131 135 108 84-------------------------------------------------------------------------------------------------------------Source Central Bank of Brazil Financial Stability Reports 2002-2006Note Basel Index = Capital risk guideline measure defined by Bank for International Settlements BaselCommittee that recommends 8 percent relation between PR and total assets weighted by risk level Since 2002Central Bank of Brazil minimum requirements of Basel Index remains 11 percent For methods of calculationsee Central Bank of Brazil Financial Stability Report Brasilia 2006 p 76
Central Bank of Brazil tests estimate that in the face of foreign currency valuationand interest rate shock government banks would nonetheless remain at or slightly below thecapital requirements against credit risk recommended by the central bank Again it should benoted that Basel Index levels recommended in the BIS Capital Requirements guidelines forthe Basel Index of banks are 80 while the Central Bank of Brazil has set minimum BaselIndex levels of 110 Given that federal government bank portfolios include more credit thanprivate banks and especially foreign banks the estimate of a shift to 109 in the averageBasle index for federal government banks in the face of a credit shock provides furtherevidence that these financial institutions are solid and their capital reserves sufficient Insum comparison of results for government private and foreign banks in the estimatesreported by the Central Bank of Brazil of the likely impact of a shock to the Brazilianeconomy in terms of interest rates and foreign exchange rates also suggests that governmentbanks appear solid The average Basel Index reported for government banks in this stress testwas 135 above the 110 Central Bank of Brazil guideline and well above the 80 levelsuggested by the BIS
Understanding the capacity of Brazilian banks to cope with shocks and risk is not justa theoretical exercise Since the currency crisis in Mexico during 1994-1995 the newlystabilized currency was tested by shocks from home and abroad Policies first dramaticallyincreased interest rates under a fixed exchange rate regime then freed the real to devalue
under a flexible foreign exchange rate regime in January 1999 The Asian currency crisesduring second semester 1997 led the Central Bank of Brazil to increase benchmark Selicinterest rates to 434 percent in November In August 1998 the declaration of moratorium onforeign debt payments by Russia the central bank to once again increase Selic interest ratesfrom 20 to 40 percent under the fixed exchange rate regime by November of that year Theseshocks from abroad coincided with preparations for national elections during 1998 leadingthe IMF and other official creditors to provide strong support for the Brazilan governmentNonetheless by January 1999 (after the election) market pressure led to the abandonment ofthe fixed foreign exchange rate regime that had served as nominal anchor for economic
19 Calculation first published in Resenha BMampF Vol 122 1998 (described in Central Bank of Brazil
Financial Stability Report 2002 amp 2003 then as Boudoukh Jacob Matthew Richardson RichardStanton amp Robert Whitelaw ldquoMaxVaR Long Horizon Value at Risk in a Mark-to-Market Environmentrdquo Journal of Investment Management 2004Vol 2 No 3 pp 14-19
8132019 Government Banking and BRICs in the Recent Financial Crisis
httpslidepdfcomreaderfullgovernment-banking-and-brics-in-the-recent-financial-crisis 1657
983106983122983113983107 983111983151983158983141983154983150983149983141983150983156 983106983137983150983147983155 983137983150983140 983110983145983150983137983150983139983145983137983148 983123983156983137983156983141983139983154983137983142983156
16
policy since 1994 The real quickly devalued from 121 to 20 against the US dollar by theend of January and led to considerable changes in policy (a flexible foreign exhange rateregime inflation targeting and the implementation of further fiscal reforms) Once the realrevalued from R$22 against the dollar in March to R$166 in April 1999 the governmentmoved to consolidate this new triad of economic policies Since 1999 flexible foreign
exchange markets inflation targeting and fiscal reform have remained in place This suggeststhat Brazilian banks have weathered volatile parameters and large risks during a markedpolitical business cycle One involving the transition from reformist President Cardoso to PTPresident Lula Since recovery of the economy during 2004 the coalition government underPT President Lula has sought to expand the contribution of government banks to accelerategrowth and social inclusion These policies have not undermined economic fundamentals oreroded the institutional foundations of comparative advantage retained by Brazilian federalgovernment banks
In sum the advances of Brazilian banking toward Basel Accord regulations during the1990s and 2000s the adoption of more transparent and timely reporting standards and themodernization of government banks under pressures from liberalization placed federal banks
in a new situation in the face of crisis once it hit the country in 2008 A closer look at the bigthree federal government banks is in order to better understand these changes
The Banco do Brasil
Upon taking office in 2003 President Lula retained the central economic policies of theCardoso administration such as inflation targeting tight fiscal and monetary policy andthe operational independence of the Banco do Brasil However the recovery of investorconfidence during 2003 and the return of stronger growth levels during 2004 led to aperiod of what the Central Bank of Brazil describes as organic growth at the Banco doBrasil From 2004-2008 the Banco do Brasil contributed to the deepning of domesticcredit markets and emerged as leading investment bank at the Bovespa stock marketFurthermore once the Bovespa collapsed credit became short and a sharp downturnensued during 2008 the Banco do Brasil provided emergency loans infusions of capitalthrough stock purchases and the acquisition of small and mid-sized firms and banksunable to weather the sharp decline and lack of credit Although the merger of Itauacute andUnibanco in 2008 displaced the Banco do Brasil as the largest financial institution inLatin America the bank retains powerful institutional foundations of comparativeadvantage and networks that cross Brazilian society politics and markets
The Banco do Brasil also remains at the center of Brazilian politics and policydisputes Indeed leaders of the PT party faction articulaccedilatildeo (articulation) includes
career employees of the Banco do Brasil and presidents of the Brazilian bank workersunion such as Luiz Gushiken and Ricardo Berzioni Both were nominated to ministerialposts by President Silva in January 2003 By August 2003 21 of 33 top positions at theBanco do Brasil had been filled by new representatives of the PT most Banco do Brasilemployees and members of the Brazilian bank workers union Critics decriedpoliticization However the resistance of bank representatives described above topresidential appeals to increase credit during 2003 was followed by more neutralappointments during 2004 When Banco do Brasil President Cassio Casseb Limaresigned in November 2004 (under charges of irregularities in consulting contracts atthe bank) President Lula nominated Rossano Maranhatildeo Pinto a career employee andBanco do Brasil vice president to head the bank Further appointments of PMDB
political leaders to cement support for the PT coalition government were also criticizedas politicization of the bank However Banco do Brasil officials responded that these
8132019 Government Banking and BRICs in the Recent Financial Crisis
httpslidepdfcomreaderfullgovernment-banking-and-brics-in-the-recent-financial-crisis 1757
983106983122983113983107 983111983151983158983141983154983150983149983141983150983156 983106983137983150983147983155 983137983150983140 983110983145983150983137983150983139983145983137983148 983123983156983137983156983141983139983154983137983142983156
17
experienced political leaders of the PMDB brought competitive advantages to the bankbased on their networks that cross the public and private sector These networks andrelations during the second PT coalition government of President Lula also appearsdifferent than the first given the departure from core offices of the presency bylongtime advisors to Lula that came from the Banco do Brasil and bank workers union
By late 2006 only one of seven vice presidents of the Banco do Brasil was a member ofPresident Lulaacutes Workersacute Party (PT)Again Banco do Brasil policies and growth since recovery of the economy in
2004 involved first a period of expansion during four years of growth followed by aturn to counter cyclical lending and finance once financial crisis abroad produced first asevere contraction in credit supply then a sharp economic downturn in fourth quarter2008 Institutional foundations of comparative advantage are behind Banco do Brasilpolicies during both periods First the capitalization of Brazilian firms on the Bovespastock market is closely related to the groups that cross politics government banks thepowerful bank worker labor union the Banco do Brasil employee private pension fundand bank consortia often led by the Banco do Brasil investment banking division (often
joined by the BNDESpar and Caixa investment banking division) Recent developmentsare complex and will require further research However rather than convergence towardprivate banking and a market-centered financial system examination of Banco do Brasilpolicies and market shares during the 2000s suggests that federal government banks notonly remain at the center of politics policy and development strategies but that theseinstitutions have modernized to compete against private and foreign banks
The large scale and scope of the Banco do Brasil has permitted use of the bankfor counter-cyclical lending and leadership in capital markets without deteriorating bankbalance sheets Since 2003 the Banco do Brasil has remained well within domesticbank regulations and Basel Accord guidelines During 2002 and 2003 reforms at theBanco do Brasil sought to reduce costs and increase efficiency ratings Indeed therelation between the Banco do Brasil and President Lula reversed past patterns In the1950s conflicts were between national developmentalist groups at the Banco do Brasiland more orthodox Ministers of Finance In 2003 and once again during the 2008financial crisis differences between President Lula and the Banco do Brasil were thereverse Banco do Brasil management refused to dramatically increase loans in 2003and resisted requests to reduce the price of credit in 2008 In 2003 the caution imposedby political risk perceptions led President Lula to respect the operational autonomy ofthe Banco do Brasil In April 2009 Banco do Brasil President Antonio Francisco deLima Neto was fired after refusing to reduce interest rates on loans This reversal ofpolicy positions from the 1950s suggests in a broader sense a transition from the
macroeconomics of populism to the microeconomics of government banking in the 21
st
century Government banks do not provide easy or all solutions Instead credit andfinance policies are subject to market discipline credit risk analysis and the realities ofbusiness cycles
Review of the Banco do Brasilrsquos balance sheet from 2002-2008 suggests that the bankdeveloped organically from 2002-2007 with gradual increases reflecting the competitiveadvantages at the top of Brazilian banking and finance Policies changed during 2007 and2008 as the credit shortage caused by international financial crisis led to the Banco do Brasilassuming once again lending of last resort functions by extending interbank investments andloans to small and medium sized banks to avert further declines in domestic liquidity TheBanco do Brasil also acquired a 51 percent stake in the Votarantim bank to avert a run on
deposits and possible failure while acquiring Satildeo Paulo state government savings bankNossa Caixa for R$76 billion in 2008 These acquisitions reflect concern about the
8132019 Government Banking and BRICs in the Recent Financial Crisis
httpslidepdfcomreaderfullgovernment-banking-and-brics-in-the-recent-financial-crisis 1857
983106983122983113983107 983111983151983158983141983154983150983149983141983150983156 983106983137983150983147983155 983137983150983140 983110983145983150983137983150983139983145983137983148 983123983156983137983156983141983139983154983137983142983156
18
replacement of the Banco do Brasil as the largest financial conglomerate in Brazil after themerger of Itauacute and Unibanco
Banco do Brasil Balance Sheet Summary 2002-2008 R$ billion
2002 2003 2004 2005 2006 2007 2008 2009 2010 2011Assets --------------------------------------------------------------------------------------------------------Interbank Investments 101 50 27 80 175 434 951Interbank Deposits 76 283 137 209 116 77 242Securities 709 696 734 664 731 752 732Central Bank Deposits 81 186 221 244 281 334 212Loans to Private Sector 89 652 757 885 1178 1463 1810Loans to Public Sector 56 43 41 37 43 24 230Receivables 297 273 312 351 404 548 808Other AssetsTotal Assets 2046 2301 2390 2529 2963 3672 5073Liabilities ---------------------------------------------------------------------------------------------------Deposits 972 1100 1155 1376 1588 1882 2711
M MKT Borrowing 483 400 445 305 492 722 914Treasury amp BNDES 59 74 106 133 143 175 224Shareholder Equity 92 121 141 168 207 242 299Other LiabilitiesTotal Liabilities 2046 2301 2390 2529 2963 3672 5073---------------------------------------------------------------------------------------------------------------- Compulsory deposits for commercial banks according to Central Bank regulationsSource Banco do Brasil Annual Reports Historical Series 2002-2008
From 2002 through 2006 the balance sheet of the Banco do Brasil suggests a periodof growth based on loans to the private sector with deposits and shareholder equityincreasing largely apace After 2006 the balance sheet changes fundamentally with capitalinjections from money market borrowing increasing from R$492 billion in 2006 to R$914billion in 2008 while Banco do Brasil liabilities with Treasury and BNDES increased fromR$143 billion in 2006 to R$224 billion in 2008 The asset side of the balance sheet alsosuggests fundamental change Private sector lending increased from R$1178 billion in 2006to R$1810 billion in 2008 reflecting acquisition of portfolios from Nossa Caixa Interbankinvestments increased from R$175 billion in 2006 to R$951 billion in 2008 while interbankdeposits also increased from R$116 billion in 2006 to R$242 billion in 2008 The counter-cyclical lending strategies of the Banco do Brasil during 2008 also included an increase oflending to the public sector from R$24 billion in 2007 to R$230 billion Banco do Brasilreponses to government credit policy can also be seen in the release of 40 percent of
compulsory deposits retained at the central bank Banco do Brasil deposits at the central bankdeclined from R$334 billion in 2007 to R$212 billion in 2008 ndash freeing this value for loansand investments
Networks and relations during the second government of President Lula appeardifferent than the first given the departure from core offices of the presency by longtimeadvisors to Lula that came from the Banco do Brasil and bank workers union By late 2006only one of seven vice presidents of the Banco do Brasil was a member of President LulaacutesWorkersacute Party (PT) The corporate profile of the Banco do Brasil suggests once again thehybrid character of this government bank one listed on the Bovespa Novo Mercado but withover 65 percent of shares owned by the Brazilian federal government Treasury
8132019 Government Banking and BRICs in the Recent Financial Crisis
httpslidepdfcomreaderfullgovernment-banking-and-brics-in-the-recent-financial-crisis 1957
8132019 Government Banking and BRICs in the Recent Financial Crisis
httpslidepdfcomreaderfullgovernment-banking-and-brics-in-the-recent-financial-crisis 2057
983106983122983113983107 983111983151983158983141983154983150983149983141983150983156 983106983137983150983147983155 983137983150983140 983110983145983150983137983150983139983145983137983148 983123983156983137983156983141983139983154983137983142983156
20
customers in 2008 reached 479 million with the bank retaining 39700 AMTs and 766million bank cards (239 million credit cards and 527 million debit cards) Like the CaixaEconocircmica Federal the Banco do Brasil also processes government payments withretirement and social security payments numbering 745 million transactions during 2008Although this implies administrative costs (and receipts) this also brings customers and
prospective customers into Banco do Brasil branch officesDuring 2008 the Banco do Brasil continued to expand operations form jointventures acquire private and government banks and modernize operations A secondaryoffering of stock in January 2008 granting of shares by VISA to the Banco do Brasil andupgrading of the bank to investment grade BB- by Standard amp Poors in April 2008 suggestthat market orientation of the bank continues during the Lula administration despite counter-cyclical credit policies A Lower Income Segment Department was also created to assumeBanco Popular do Brasil operations along with correspondent banking relations and regionalsustainable development programs The Banco do Brasil also received permission to usesavings accounts for home loans enabling the bank to compete on level ground with CaixaEconocircmica Federal During 2008 the Banco do Brasil also acquired the state government
banks Banco do Piaui Banco de Santa Catarina (33rd largest bank in Brazil with US$30billion assets at year end 2007) and Satildeo Paulo government savings bank Nossa Caixa (12thlargest Bank in Brazil with US$267 billion in assets at year end 2007) In sum the diversecorporate divisions and financial operations of the Banco do Brasil provided policy optionsduring 2008 to counter the credit shortage and help firms and domestic banks to adjust
Banco do Brasil and Private Bank Returns and Capital Adequacy 2002-2009
Basel Index Return on Assets Return on Liquid Assets----------------------------- ----------------------------- -----------------------------BB Itauacute Bradesco BB Itauacute Bradesco BB Itauacute Bradesco
--------------------------------------------------------------------------------------------------------------2002 122 184 179 12 26 20 302 288 2832003 137 198 199 11 28 16 231 297 2282004 152 206 188 13 30 23 240 292 3092005 171 170 173 12 37 26 187 353 2842006 173 171 188 28 31 25 267 288 2632007 156 179 156 14 32 22 222 321 2442008 152 161 169 25 19 16 304 221 2112009 150 165 166 12 13 14 238 182 195-------------------------------------------------------------------------------------------------------------- Annualized first quarter 2009 resultsSource Banco do Brasil Itauacute and Bradesco Annual Reports 2002-2009
Comparison of Banco do Brasil returns and capital adequacy with the two majorprivate Brazilian banks Itauacute and Bradesco suggests that the performance and solidity of theBanco do Brasil remains equal or superior to private banks During 2002 and 2003 thecapital adequacy of the Banco do Brasil and return on assets remained below levels reportedby the two largest Brazilian private banks suggesting the impact of counter-cyclical lendingHowever after 2004 the Basel index of the Banco do Brasil reached 171 far above BISstandards of 80 and Central Bank of Brazil requirements of 110 Furthermore from 2006through first quarter 2009 returns on assets returns on liquid assets and the Basel index ofthe Banco do Brasil exceed levels reported by Itauacute and Bradesco In sum despite providingcounter cyclical credit and despite having been replaced by the Itau-Unibanco merger as the
8132019 Government Banking and BRICs in the Recent Financial Crisis
httpslidepdfcomreaderfullgovernment-banking-and-brics-in-the-recent-financial-crisis 2157
983106983122983113983107 983111983151983158983141983154983150983149983141983150983156 983106983137983150983147983155 983137983150983140 983110983145983150983137983150983139983145983137983148 983123983156983137983156983141983139983154983137983142983156
21
largest Brazilian bank the performance and capital adequacy of the Banco do Brasil remainsat or above levels reported by the two largest private banks
In sum since liberalization of banking and finance and privatization of stategovernment banks during the 1990s the Banco do Brasil has been transformed from directstate owned bank into one of two very large financial conglomerates that dominate domestic
banking in Brazil Instead of retaining easy access to funds at Treasury to cover losses theBanco do Brasil has adopted international corporate governance standards to become listedon the Bovespa Novo Mercado and retains an important role in virtually every aspect ofBrazilian banking and finance Although sale of shares in the 1990s were designed to transfercorporate governance and control of the national bank to the private sector the federalgovernment retains 65 percent of stocks after two sale of stocks capitalized the bank duringthe 2000s The massive size and wide scope of Banco do Brasil networks across bankingfinancial markets political and social forces and business have led the bank to realize recordprofits during the period of growth from 2004-2008 and provide counter-cyclical credit toavert a further decline in industrial activity and the economy as the US and global financialcrisis hit Brazil first with a 50 percent decline in the Bovespa stock market and credit
shortage followed by a steep but short decline in industrial production in late 2008 Thetransparency of Banco do Brasil quarterly reports and advances in Central Bank of Brazilsupervision of domestic banking clarify the new tensions that have emerged during the PTgovernment of President Lula These tensions reflect the modernization and competitiveadvantages of the Banco do Brasil
Caixa Econocircmica Federal (Federal Savings Bank Caixa)
The third largest domestic bank the wholly government owned Federal Savings Bank Caixawas also called on by President Lula during the recent financial crisis to increase the pace ofgrowth provide counter cyclical credit during downturns and to reduce consumer andcorporate interest rates and bank spreads Review of balance sheets and policies since 2001suggest that the Caixa retains its core business in urban development home loans real estatetransfer of funds for government programs and services and lottery administration Howeverinvestment banking management of third party funds and the creation of of new products andservices have both increased profits and increased popular access to banking and socialservices The bank has recorded record profits since R$108 billion (2002) R$16 billion(2003) and R$14 billion (2004) The Caixa became the fourth largest Brazilian investmentbank by 2003 while gaining dealer status from the Central Bank of Brazil in primary andsecondary markets for government securities At year-end 2003 the bank retained anestimated R$767 billion of government paper (over ten percent of government paper) in its
portfolio assets earning over R$135 billion that year Since recovery of the Brazilianeconomy in 2004 the Caixa has reported strong profits and continued to improve thestructure of its balance sheet and converge toward international bank reporting standards
In terms of assets deposit base and the number of employees and branches the datasuggest that the Caixa has emerged from a process of rationalization and downsizing duringthe late 1990s and expanded ldquoorganicallyrdquo since capitalization in 2001 Assets declined fromover US$999 billion in 1997 to US$363 billion in 2002 after reorganization andcapitalization Deposits also declined from US$541 billion in 1997 to US$216 billion in2002 The number of employees and branches declined from 104253 and 2316 to 98971 and1803 respectively but returned to 104934 and 2428 by 2006 After reorganization andcapitalization in June 2001 Basel indexes and the ratio of fixed assets over equity indicate
substantial reform and transition toward international banking standards The Basel Index thatmeasures the adequacy of capital reserves against possible losses and risks increased from
8132019 Government Banking and BRICs in the Recent Financial Crisis
httpslidepdfcomreaderfullgovernment-banking-and-brics-in-the-recent-financial-crisis 2257
983106983122983113983107 983111983151983158983141983154983150983149983141983150983156 983106983137983150983147983155 983137983150983140 983110983145983150983137983150983139983145983137983148 983123983156983137983156983141983139983154983137983142983156
22
135 (49 in March 2001 before capitalization) to reach 278 and remain twice above theCentral Bank minimum of 110 at 252 in 2006 The ratio of fixed assets as a proportion ofequity also declines substantially from 638 at year end 2001 to 197 in 2007
Summary of Caixa Structure and Performance 1995-2007
Assets Profits Deposits Employees Branches Basel FAEquity1995 826 672 503 99866 23161996 907 2351 515 99343 21051997 999 875 541 96300 18031998 948 1693 499 94859 18191999 684 1571 344 94194 19192000 644 1362 322 104253 19212001 436 -1265 298 98971 2013 135 6382002 363 1462 216 106548 2147 146 5372003 521 2617 281 100498 2046 192 413
2004 556 2999 345 100164 2135 202 3612005 806 4852 456 106729 2321 278 2012006 981 4874 567 104934 2428 252 1972007 1409 4485 800 106770 2052 288 1282008 1266 5735 708 103895 2069 206 119
Note Assets amp Deposits = US$billion Profits = US$million Basel = BIS Basel Accord index of capital reserveadequacy FAEquity = Fixed Assets Equity a summary indicator of bank modernizationSource Central Bank of Brazil Top 50 Banks in Brazil available at wwwbcbgovbr
Caixa Annual Reports and transition toward Central Bank and international bankaccounting standards introduce breaks in the time series of financial performance after 2001
However international bank reporting standards have been used by the Caixa since 2005 andthe data provide further view of the policies and performance of the bank Table X reportsreturns on stockholder equity assets Basel solvency index immobilization index provisionsas a percent of credit operations bank efficiency index and coverage of personnel costs Thedata are consistent with the broader comparisons reported in chapter two that suggest highprofits and returns alongside higher levels of provisions and reserves against capital riskReturns on stockholder equity have remained above 20 percent per year reaching 306percent in 2008 Returns on liquid assets remained between 09 percent and 13 percentbelow the average levels recorded by private and foreign banks The Basel Index of the Caixaremained well above the 11 percent level required by the Central Bank declining from 279in 2005 to 206 in 2008
Caixa Performance Indicators 2005-2008
Indicator 2005 2006 2007 2008 2009 2010 2011--------------------------------------------------------------------------------------------------------------------------Return on Shareholder Equity 261 260 226 306Return on Liquid Assets 11 11 09 13Basel Solvency Index 279 253 289 206Immobilization Index 201 197 129 120Provisions as Credit Operations 101 98 91 86Efficiency Index 645 642 755 718Coverage of Personnel Costs 925 896 943 868
---------------------------------------------------------------------------------------------------------------------------Source Caixa Econocircmica Federal Relatoacuterios de Administraccedilatildeo 2005-2011
8132019 Government Banking and BRICs in the Recent Financial Crisis
httpslidepdfcomreaderfullgovernment-banking-and-brics-in-the-recent-financial-crisis 2357
983106983122983113983107 983111983151983158983141983154983150983149983141983150983156 983106983137983150983147983155 983137983150983140 983110983145983150983137983150983139983145983137983148 983123983156983137983156983141983139983154983137983142983156
23
The immobilization index of the Caixa also declined from 201 percent in 2005 to120 percent in 2008 suggesting transition toward standard levels of international bankingHowever the value of provisions as a percent of credit operations remains much higher thaninternational bank practices albeit declining from 101 percent in 2005 to 86 percent in2008 Finally both the substantial increase in efficiency index from 645 to 718 percent
suggests that the Caixa has distanced further from international private bank levels that tendto approach 500 percent This has resulted in the declining level of coverage of personnelcosts and indicates the comparatively larger organizational structure and less use ofoutsourced labor at the Caixa
Caixa Deposits and Sources of Funds 2005-2008 R$million
2005 2006 2007 2008 2009 2010 2011----------------------------------------------------------------------------------------------------------------Bank Deposits 692 863 1155 1320Savings Deposits 5328 6006 7560 9255Mid-Term Savings Deposits 3873 4219 4136 4862
Certificates (1270) (1412) (1244) (1831)Escrow (2602) (2806) (2891) (3031)
Funds and Programs 794 1034 1307 1100Other 009 015 019 013Caixa Total 10690 2139 14179 6552Bank System Total 68268 78148 92672 27482Caixa Deposits as Total (156) (155) (1531) (129)----------------------------------------------------------------------------------------------------------------Source Caixa Econocircmica Federal Relatoacuterios de Administraccedilatildeo 2005-2008
The liability side of Caixa balance sheets from 2005-8 suggests that the bank hasdistanced itself from reliance on official savings programs and funding toward consumerbank and savings deposits Bank deposits increased from R$69 billion in 2005 to overR$132 billion in 2008 Savings deposits increased from R$532 billion in 2005 to overR$925 billion in 2008 Furthermore the increase of mid-term savings deposits originatedfrom sale of savings certificates instead of escrow held by the Caixa the latter subject to
judicial review and removed from balance sheets in 2008 The value of funds deposited at theCaixa from government funds and programs increased from R$79 billion in 2005 to R$110billion in 2008 although it remains less than ten percent of total deposits In terms of totalvalue of deposits and savings the Caixa increased total value of deposits from 107 billion toover 165 billion from 2005-8
Caixa Loans 2005-8 R$ million2005 2006 2007 2008 2009 2020 2011
----------------------------------------------------------------------------------------------------------------Commercial 14652 16329 19134 28854
Consumer 8925 9474 11063 13747Business 5727 6854 8071 15107
Home 20208 26113 32475 45075Sewage and Infrastructure 1646 2556 3585 5445Other 690 691 694 689Risk Provision -3773 -4469 -5090 -6900Total Caixa Loans 37195 45689 55888 80062----------------------------------------------------------------------------------------------------------------Source Caixa Econocircmica Federal Relatoacuterios de Administraccedilatildeo 2005-8
8132019 Government Banking and BRICs in the Recent Financial Crisis
httpslidepdfcomreaderfullgovernment-banking-and-brics-in-the-recent-financial-crisis 2457
983106983122983113983107 983111983151983158983141983154983150983149983141983150983156 983106983137983150983147983155 983137983150983140 983110983145983150983137983150983139983145983137983148 983123983156983137983156983141983139983154983137983142983156
24
In terms of lending the data suggests that the primary focus of the Caixa on homeloans continued during the late 2000s although substantial increases in commercial lendingfor consumer credit and businesses suggest the diversification of the Caixa across creditmarkets Since 2005 Caixa lending to consumers and business increased from R$89 billionto R$137 billion and from R$57 billion to R$151 billion respectively in 2008
And unlike the high levels of bad and late credit reported during the adjustment to theend of high inflation in 1994-6 and financial crises (1994-5 1997 1998 1999 2001 2003)the level level of late loans at the Caixa fell substantially during the years of economicgrowth and credit expansion from 2006-2008 The percent of late over total loans at the Caixafell from 68 percent in 2006 to 40 percent in 2008 for commercial loans generally and from62 percent to 59 percent for consumer loans and 75 percent to 22 percent for loans tobusiness The value of late home loans as a percent of total home loans also fell from 31 to17 percent in 2008
Caixa AA-H Credit Classification 2001-8
Days Prov-Late ision 2001 2002 2003 2004 2005 2006 2007 2008 2009 2010 2011
---------------------------------------------------------------------------------------------------------------------------------------AA lt15 0 59 56 66 63 54 50 63 94A lt15 05 243 264 313 288 393 435 401 333---------------------------------------------------------------------------------------------------------------------------------------B 15-30 1 127 126 137 139 143 158 206 271C 31-60 3 203 166 145 169 167 192 194 192D 61-90 10 178 261 207 217 133 60 45 33---------------------------------------------------------------------------------------------------------------------------------------E 91-120 30 18 19 20 20 22 13 09 07F 121-50 50 49 15 15 14 10 07 07 07G 151-80 70 15 08 09 10 08 10 10 09
H gt180 100 104 87 85 77 68 72 61 51R$billion 2094 2353 2614 3016 3855 4736 5739 818---------------------------------------------------------------------------------------------------------------------------------------Source Caixa Annual Reports 2002-2008
The credit risk matrix of Caixa loans from 2001 to 2008 confirms this trend ofimprovement (See above table) The data also provide evidence of greater transparency andthe improvement of bank reporting and accounting standards as well as Central Banksupervision of banks Instead of two categories of credit (good = all loans up to 90 daysoverdue bad = loans over 90 days overdue) the Central Bank of Brazil has adoptedinternational standards of credit classification (from AA to H) and imposed regulations that
banks increase or decrease provisions according to the distribution of loans in thesecategories The scale of provisions required by the Central Bank vary from zero percentagainst loans classified as AA to provision of 100 percent of loan values for credits classifiedas H that is to say over 180 days late
The percent of loans over 180 days late has decreased from 104 percent of total in2001 to 51 percent in 2008 Furthermore all categories of late payment except for loansbetween 15-30 days late decreased significantly from 2001 through 2008 In comparisonloans classified as AA (paid and guaranteed) and A (paid on time) increased from 59 percentto 94 percent and 243 percent to 333 percent of total loans The only category of late loansthat increased over the period is that of loans 15-30 days overdue from 127 percent to 271percent of total
The central argument of this study is that Brazilian federal government banks retaininstitutional foundations of competitive advantage over private and foreign banks Further
8132019 Government Banking and BRICs in the Recent Financial Crisis
httpslidepdfcomreaderfullgovernment-banking-and-brics-in-the-recent-financial-crisis 2557
983106983122983113983107 983111983151983158983141983154983150983149983141983150983156 983106983137983150983147983155 983137983150983140 983110983145983150983137983150983139983145983137983148 983123983156983137983156983141983139983154983137983142983156
25
data that suggests this advantage can be seen in the increasing volume and market share ofthe Caixa in debit and credit cards The number of Caixa debit cards increased from 224million in 2002 to over 482 million in 2008 with Caixa market share of debit cards increasedfrom 196 percent ot total card market in 2002 to peak at 230 percent in 2005 and remainingat 219 percent of the total number of debit cards in Brazil in 2005
Two examples illustrate the institutional foundations of comparative advantage of theCaixa in the card payment industry First like other banks in Brazil the Caixa shares anagreement with Visa for payment processing However unlike other banks in Brazil theCaixa was contracted by the federal government to distribute ATM citizenship cards torecepients of federal government family grants and other transfer programs Apparentlywithout seeking approval the Caixa stamped its brandname on the federal government ATMcitizenship card and has continued to do so despite charges of unfair competition fromprivate domestic banks Furthermore a Caixa request to transform its 110 million ATMcitizenship cards into bank cards currently pending at the Central Bank would dramaticallyincrease the number of bank card holders in Brazil (1824 million at year end 2007)
Caixa Debit and Credit Card Market Shares 2002-2008
Million Debit Cards Million Credit Cards MillionCaixa Total Mkt Caixa Total Mkt Interbank Checks
----------------------------------------------------------------------------------------------------------------2002 224 1142 (196) 16 407 (39) 229502003 280 1254 (223) 18 440 (40) 213602004 320 1491 (213) 20 535 (37) 196702005 377 1639 (230) 25 675 (37) 183902006 384 1744 (220) 31 952 (32) 162202007 400 1824 (219) 39 1177 (33) 144902008 482 42----------------------------------------------------------------------------------------------------------------Source Central Bank of Brazil Diagnoacutestico do Sistema de Pagamentos de Varejo do Brasil Adendo Estatiacutesticondash 2007 p 9 and Caixa annual reports 2003-2008
Having reviewed the Banco do Brasil and Caixa a brief look at the counter-cyclicalpolicies and performance of the third Brazilian federal government bank ndash the BNDES ndash is inorder
Banco Nacional de Desenvolvimento Econocircmico e Social (National Bank for Economic
and Social Development BNDES)
The BNDES is a paradigmatic development bank The trajectory of the BNDES involves asequence of policies and financial practices that have shaped Brazilian development Duringthe 1950s the BNDE supplied direct credits for transportation electric energy infrastructureand steel production During the 1960s the bank diversified under financial reforms Duringthe 1970s the BNDE acted to complete state-led import substitution industrialization bychanneling foreign finance and forced savings into capital goods project lending and regionaldevelopment programs During the 1980s the bank shifted away from public investmentunder pressure of fiscal crisis and foreign debt During the 1990s the BNDES became agentfor the privatization of state owned enterprises The BNDES remained virtually the onlysource of long-term finance during a decade of financial crises in emerging markets (1994-2003) Since 2000 the bank has shifted toward ldquosecond generationrdquo reforms designed tofinance the private sector and free market forces deepen domestic capital and equity markets
8132019 Government Banking and BRICs in the Recent Financial Crisis
httpslidepdfcomreaderfullgovernment-banking-and-brics-in-the-recent-financial-crisis 2657
983106983122983113983107 983111983151983158983141983154983150983149983141983150983156 983106983137983150983147983155 983137983150983140 983110983145983150983137983150983139983145983137983148 983123983156983137983156983141983139983154983137983142983156
26
and lend to small medium and micro-enterprises Since 2004 capital inflows and a boomingdomestic stock market have reinforced the capacity of the BNDES to underwrite long-terminvestments and transform large Brazilian firms into multinational corporations Since 2007BNDES President Coutinho has pursued a full service approach attempting to help star-upsmall and medium firms provide funds to expand successful firms and participate in venture
capital funds to help enterprises transit toward corporate governance standards and initial orsecondary offerings of stock on the Bovespa exchange In 2008 as financial crisis led to ashortage of credit collapse of share prices and sharp decline in industrial production byfourth quarter 2008 the BNDES also provided lending of last resort to major Braziliancorporations while retaining long term goals for massive investments in deep sea petroleumproduction
BNDES Market Share of Interbank and Non-Bank Loans 1995-2008 US$ Billion
Interbank Loans Non-Bank Loans------------------------------------------ ------------------------------------------
BNDES Mkt Total BNDES Mkt Total-----------------------------------------------------------------------------------------------------------1995 156 (324) 481 80 (38) 20711996 181 (354) 511 109 (49) 21981997 197 (278) 707 145 (68) 21031998 216 (355) 608 230 (113) 20201999 204 (410) 497 150 (35) 14282000 243 (439) 553 152 (96) 15772001 259 (504) 515 145 (104) 13912002 233 (443) 525 137 (130) 10512003 261 (419) 622 200 (141) 14152004 306 (408) 749 218 (122) 17862005 343 (373) 918 277 (113) 24312006 388 (350) 1106 329 (102) 32312007 524 (335) 1563 432 (88) 48852008 530 (493) 1073 456 (96) 4743200920102011-----------------------------------------------------------------------------------------------------------Source Central Bank of Brazil Top 50 Banks 1995-2008
Revew of BNDES lending since 1995 suggests the realization of competitiveadvantages typical of a large centralized development bank Contrary to the extensive branchoffice networks retained by the Banco do Brasil and Caixa the BNDES retains under 1900employees (compared to 105000 at Caixa) in the Rio de Janeiro and four regional officesSince 1995 the BNDES increased its market share of non-bank loans from R$80 billion (38percent) to R$200 billion (141 percent) during the economic downturn risk aversion andcredit shortage in 2003 After 2003 the BNDES market share of loans to non-financialentities decreased to 88 percent of total loans albeit increasing during 2008 to 96 percentThis suggests that the BNDES has increased its market share of lending to non-financialsector since liberalization of the industry and privatization of state government banks
8132019 Government Banking and BRICs in the Recent Financial Crisis
httpslidepdfcomreaderfullgovernment-banking-and-brics-in-the-recent-financial-crisis 2757
983106983122983113983107 983111983151983158983141983154983150983149983141983150983156 983106983137983150983147983155 983137983150983140 983110983145983150983137983150983139983145983137983148 983123983156983137983156983141983139983154983137983142983156
27
BNDES inter-bank lending also increases substantially Since the Real Plan endedinertial inflation in 1994 the BNDES has expanded its market share of interbank lendingfrom 156 billion (324 percent) in 1995 to 530 billion (493 percent) in 2008 during creditshortage and stock market collapse During previous years of financial crisis and economicreversals the BNDES also increased interbank lending significantly For example during the
1999 and 2001 crises BNDES interbank lending increased to 410 percent and 504 percentof total This marked presence in interbank loan market reflects the role of the BNDES inproviding indirect lending to targeted sectors through private foreign and other governmentbanks in Brazil
BNDES Loan Approvals by Program 1995-2007 R$ Billion
Direct Lending 1999 2000 2001 2002 2003 2004 2005 2006 2007 2008 2009--------------------------------------------------------------------------------------------------------------------------------------Finem 51 55 68 133 79 114 132 145 220 285Capital Markets 16 19 09 08 09 06 20 34 35 104Export-Import 23 34 39 77 63 56 67 40 13 32
Sub-Total 91 109 118 219 153 177 220 221 269 424Percent Total (505) (474) (468) (585) (456) (447) (469) (430) (415) (464)
Indirect Lending--------------------------------------------------------------------------------------------------------------------------------------Finem 31 40 37 16 12 16 18 27 51 60Finame 16 25 33 40 53 66 93 107 170 221Finame Agro 07 13 18 30 28 45 21 14 20 27Finame Leasing 00 000 02 02 03 02 04 06 14 16Export-Import 14 23 20 40 56 54 73 97 67 95BNDESautom 18 17 22 24 27 34 36 35 50 55Sub-Total 89 120 134 154 182 220 249 292 379 484Percent Total (495) (526) (532) (415) (544) (553) (531) (570) (585)(536)
BNDES Total 180 230 252 374 335 398 469 513 648 908----------------------------------------------------------------------------------------------------------------Source BNDES statistics by modality available on wwwbndesgovbr
Review of BNDES finance by program suggests the evolution of credit policies from1995 through 2008 and increasing reliance on indirect lending through other financialintermediaries The three major programs of direct finance Financiamento aEmpreendimentos (Business Finance Finem) Mercado de Capitais (Capital Markets) andExport-Import finance remained between 505 percent and 415 percent of total BNDESlending with the exception of 2002 Indirect lending through six broad programs remained
between 495 percent and 585 pecent of total BNDES lending with the exception of 2002Indirect lending programs include Finem business lending Financiamento de Maquinas(Machine Finance Fineme) with agricultural and leasing modalities Export-Import financingand BNDES automatic lending provisions
These trends suggest the realization of competitive advantages over private andforeign banks in Brazil BNDES long term interest rates remained substantially lower thanSelic benchmark overnight inter-bank interest rates throughout this period while the lowercost of small staff and operations of the BNDES made lending at these rates viable Anothercompetitive advantage of the BNDES over private and foreign banks is the developmentbankacutes mandate as manager of funds from the forced savings fund Fundo de Amparo ao
Trabalhador (Worker Asssistance Fund FAT) Constitutionally mandated investments inproductive activities (not government bonds) increased from R$31 billion in 2000 to R$101
8132019 Government Banking and BRICs in the Recent Financial Crisis
httpslidepdfcomreaderfullgovernment-banking-and-brics-in-the-recent-financial-crisis 2857
983106983122983113983107 983111983151983158983141983154983150983149983141983150983156 983106983137983150983147983155 983137983150983140 983110983145983150983137983150983139983145983137983148 983123983156983137983156983141983139983154983137983142983156
28
billion in 2008 comprising 170 percent of BNDES liabilities This means that 170 percentof BNDES finance and lending is based on long-term deposits that provide no liquidity riskThis provides a competitive advantage over private and foreign banks
A closer look at BNDES lending by sector suggests that the bank still focuses
primarily on industry and infrastructure Despite the adoption of second generation reformsthat seek to free market forces and accelerate innovation and productivity through small andmedium enterprises BNDES lending still focuses on large scale industrial and long-terminfrastructure finance In this respect the BNDES embodies a persistent need in developingeconomy for state-led development banking along the lines emphasized by Lewis Myrdaland development economists 50 years ago This traditional sense of commanding heights thusstill captures the role of the BNDES in Brazilian political economy Despite more than twodecades of privatizations financial liberalization bank reforms and a variety of fiscalfinancial and economic reforms that have substantially modernized the domestic Brazilianeconomy and freed market forces the BNDES remains the single most important source forlong-term finance and credit The capitalization of the Bovespa stock market from 2004-
2008 for the first time in Brazilian history reduced the virtual monopoly of BNDES overlong term finance
BNDES Operations approved and invested by Sector 1998-2007 R$billion
1998 1999 2000 2001 2002 2003 2004 2005 2006 2007Industry ----------------------------------------------------------------------------------------------------------------------------approved 96 79 126 152 171 163 145 290 395 402invested 76 84 104 132 174 161 158 234 272 306
Infrastructure ----------------------------------------------------------------------------------------------------------------------approved 116 69 110 65 161 149 137 186 240 369invested 83 66 86 75 130 100 152 171 170 209
Other--------------------------------------------------------------------------------------------------------------------------------approved 18 47 40 54 79 93 117 69 108 126investedTotal --------------------------------------------------------------------------------------------------------------------------------approved 230 195 276 271 411 404 379 545 743 897invested 190 181 230 252 374 335 398 470 513 617
----------------------------------------------------------------------------------------------------------------Source BNDES Annual Reports 2003-2008 and testimony of BNDES President to Congress March 2009
Long-term investments have produced substantial profits at the BNDES The bank hasrecorded profits each year since 1999 increasing from over R$600 million in 1999 overR$32 billion during 2005 reaching over R$73 billion in 2007 The long-term character of
BNDES finance stands in stark contrast to policies at private banks Contrary to strategy ofprivate and foreign banks to trade and hold government paper described in chapter three theBNDES suspended purchase and trading in government paper because of constitutionalmandates to contribute to development and employment Furthermore the turn to capitalmarkets at the BNDES has provided substantial returns since 2004
However this does not mean that BNDES lending protected unproductive industriesInstead of wasting resources to unnecessarily bail out firms or provide crony credit highreturns and strong profits at the BNDES suggest that lending was sound Standard indicatorsof bank performance asset quality and capital reserves against credit and capital risk provideempirical control for this All these measures suggest that the BNDES weathered the periodof adjustment and sustained counter-cyclical investment policies without placing resources atrisk beyond Central Bank of Brazil regulations and BIS guidelines And returns have
8132019 Government Banking and BRICs in the Recent Financial Crisis
httpslidepdfcomreaderfullgovernment-banking-and-brics-in-the-recent-financial-crisis 2957
983106983122983113983107 983111983151983158983141983154983150983149983141983150983156 983106983137983150983147983155 983137983150983140 983110983145983150983137983150983139983145983137983148 983123983156983137983156983141983139983154983137983142983156
29
increased since recovery in 2004 BNDES participation in the booming Bovespa stock marketsince 2003 has provided record returns
The BNDESpar subsidiary that invests in capital markets has also recorded strongreturns during the period of economic growth and into the 2008 financial crisis BNDESparreturns on liquid assets increased from 75 percent in 2004 to 277 percent in 2007 declining
to 245 percent in 2008 Average returns on assets and stock holdings also remained highbuilding the assets held by the BNDESpar subsidiary from 141 billion in 2005 to 359 billionin 2008
This increased participation of the BNDES in capital markets involves new relationsand networks across government private sector labor unions the private pension funds ofgovernment bank and government enterprise employees and financial markets By 2007BNDES participation in stockholding and mutual funds reached across 261 forms and 25mutual funds totaling over R$910 billion reals The BNDES thereby retains broad portfoliothat represents institutional foundations of comparative advantage Furthermore unlike thepolicy of private and foreign banks to trade and hold high interest rate paying short termgovernment paper during the sudden stop of foreign finance and downturn in the Brazilian
business cycle (2002-3) the BNDES expanded credit operations and reduced financialoperations in secondary markets for indexed government paper This countered the perverseimpact of the liquidity preference among private and other government banks that increasedmarket pressures and led to shorter terms and higher cost of Brazilian government debt
BNDES aversion of government paper is required by constitutional mandate tomanage forced savings funds in ways that generate employment and income As noted alarge part of BNDES resources (liabilities) are from domestic official savings programs Thevalue of FAT resources increased from R$492 billion in 2003 to R$662 billion in 2005while the PIS-Pasep fund remained at approximately R$200 billion Foreign capital has alsobeen channeled to the BNDES through multilateral agencies and foreign bond issues Foreignloans to the BNDES have declined Multilateral agencies provided R$70 billion in 2003increased funding to R$129 billion during 2004 and continued to provide R$107 billion tothe BNDES during 2005
Comparison of BNDES structure and performance with development banks abroadsuggests both the large scale and scope of BNDES operations and controls formismanagement and political abuse of the bank In 2007 BNDES total assets are almostdouble the value reported by the Inter-American Development Bank (IADB) over frac12 thevalue of total assets held by the World Bank and almost ten times the value of assets held bythe French government development bank CAF Furthermore profits and loans from theBNDES far exceeded all three institutions The US$330 billion in loans reported by theBNDES far exceed the US$67 billion from the IADB the US$110 reported by the World
Bank and US$58 billion reported by the CAF BNDES profis returns on assets and return onliquid patrimony also far exceeded those reported by these three development banks thatserve as comparative control over performance and policies at the BNDES Finally lateloans at the BNDES remained at 011 percent of total loans well below levels reported by theWorld Bank comparable to the 010 percent reported by the IADB while considerably abovethe 001 percent reported by CAF
8132019 Government Banking and BRICs in the Recent Financial Crisis
httpslidepdfcomreaderfullgovernment-banking-and-brics-in-the-recent-financial-crisis 3057
983106983122983113983107 983111983151983158983141983154983150983149983141983150983156 983106983137983150983147983155 983137983150983140 983110983145983150983137983150983139983145983137983148 983123983156983137983156983141983139983154983137983142983156
30
Comparison of BNDES and Regional Development Banks 2007 US$ billion
BNDES IADB World Bank CAF----------------------------------------------------------------------------------------------------------------Total Assets 1144 699 2080 125
Liquid Patrimony 140 203 399 41Liquid Profits 38 01 -01 04Desembolsos 339 67 110 58Credit Portfolio 928 479 978 95Capitalization percent 123 291 192 328Return on Assets percent 38 47 na 36Return on PL percent 332 07 na 105Late Loans percent 011 010 086 001----------------------------------------------------------------------------------------------------------------Source BNDES Annual Report 2007
The large scale of BNDES lending and finance make it possible for governmentpolicy to provide counter cyclical credit to avert or ameliorate economic downturns andsubstitute private and foreign credit shortages In March 2009 testimony to Congress ongovernment policies during financial crisis BNDES President Coutinho argued that bankpolicy was to reduce the cost and increase the supply of credit Resources for counter cyclicallending during 2008-2009 came from Treasury loans to BNDES released by provisionaldecrees 439 and 414 summing R$175 billion transfer of R$60 billion in CVS funds sale ofFGTS Investment Fund and bank certificates summing R$170 billion Furthermore the thirdphase of conditional credit facility shared by Inter-American Development Bank and theBNDES provided the last tranch of a total US$60 billion for BNDES operations
Two further means were used by the BNDES to infuse capital during the collapse of
the stock market and shortage of credit during 2007-8 The counter cyclical policies of theBNDES can also be seen in the over two fold increase of BNDES holdings in private equityand investment funds Table 512 reports the value of private equity and investment fundholdings of the BNDES in 2007 and 2008 BNDES funds in private equity and mutual fundsincreased from R$4038 million in 2007 to over R$10 billion in 2008 The capitalization ofmutual funds and private equity firms by the BNDES also played an important countercyclical role during this period
BNDESpar Shareholding 2007-8 R$million
Percent Value ValueShares 2008 2007
----------------------------------------------------------------------------------------------------------------Ameacuterica Latina Logiacutestica 106 6386 -Aracruz 55 1292 1292Banco do Brasil 25 10854 12752Bom Gosto (2) 345 2458 -Brasil Telecom Part 30 1666 1958Braskem 52 2275 2432Brenco 209 1400 -CEG 345 1406 -CESP 57 2347 1397Coteminas 103 1150 1340
CPFL Energia 62 6081 5506Cia Sideruacutergica Nacional 36 1513 2686CVRD 40 15082 7098
8132019 Government Banking and BRICs in the Recent Financial Crisis
httpslidepdfcomreaderfullgovernment-banking-and-brics-in-the-recent-financial-crisis 3157
983106983122983113983107 983111983151983158983141983154983150983149983141983150983156 983106983137983150983147983155 983137983150983140 983110983145983150983137983150983139983145983137983148 983123983156983137983156983141983139983154983137983142983156
31
ELETROBRAacuteS (1) 118 22400 22400EMBRAER 50 1096 1096Gerdau 35 1533 490Independecircncia 139 2500 -JBS 130 14722 11370Klabin 202 5621 -
Light 336 8225 -Marfrig 146 8176 1020MPX Mineraccedilatildeo 26 1791 1791Ouro Fino 200 1057 840Paranapanema 175 1252 08Petrobraacutes 76 10226 10226Rede Energia SA 253 2633 -Tele Norte Leste Participaccedilotildees 16 1645 1645Valepar 97 26254 15585Subtotal 163055 102941Other firms 12223 12606Total 175278 115548----------------------------------------------------------------------------------------------------------------
Source BNDESpar Financial Statements 2008 pp
The BNDES also holds blocks of shares in many major Brazilian corporationsthrough its participation subsidiary BNDESpar Comparing value of investments in 2007 and2008 suggests that large purchases capitalized firms precisely as financial crisis and downturnin Bovespa stock market made it difficult for firms to find working capital Table X reportsthe percent of total company shares held by the BNDES and their respective market values(adjusted for risk of future losses) at year end 2007 and 2008 During this year of extremelyshort and expensive credit in Brazil caused by the international financial and banking crisisthe BNDES increased shareholding by over R$60 billion reals in 28 private Brazilianenterprises Further shareholding classified as X in Five firms (Bertin 269 Brasiliana 538
Copel 239 Rio Poliacutemeros 250 Telemar 313) Once again the BNDES provided access tocapital for firms caught in the sudden credit crunch and stock market collapse unable to meetobligations or raise funds through equity issues or commercial bank credit This countercyclical role of government banks has been critical in Brazil since the 19 th century
BNDESpar Private Equity and Fund Participation 2007-2008 R$million
Fund Manager 2008 2007-------------------------------------------------------------------------------------------------------------------------Brasil 21 Dynamo 46 60PROT Mellon Financial Services 4628 -
Logiacutestica Brasil Bradesco 135 -Fire BrasilPrivate 269 250FIPGG Governanccedila amp Gestatildeo Inv 289 311Opportunity Equity Partners Mellon Financial Services 1046 578Brasil Energia Bradesco 1184 655InfraBrasil ABN-Amro 677 251Rio Bravo Cinema Rio Bravo 116 110Brascan Petro amp Gaacutes Bank Brascan 136 113AG Angra Infra-Estrutura Bradesco 380 301Satildeo Paulo Metro Fund Bradesco 791 831Other Funds 653 572Total 10356 4038---------------------------------------------------------------------------------------------------------------------------
Source BNDESpar Financial Statements 2008
8132019 Government Banking and BRICs in the Recent Financial Crisis
httpslidepdfcomreaderfullgovernment-banking-and-brics-in-the-recent-financial-crisis 3257
983106983122983113983107 983111983151983158983141983154983150983149983141983150983156 983106983137983150983147983155 983137983150983140 983110983145983150983137983150983139983145983137983148 983123983156983137983156983141983139983154983137983142983156
32
Finally Brazilian federal government triennial plans include investment targets by theBNDES If current plans are compared to 2004-7 investments several structural changes inBNDES lending appear First BNDES plans for Oil and Petroleum production reveal aprofound change for Brazilian political economy In 1990 roughly 45 percent of oilconsumed in Brazil was imported In 2007 before oil price increased reversed the balance
Brazil reported domestic production levels sufficient to meet domestic consumptionFurthermore discoveries of substantial deep sea oil reserves have led the BNDES to planmassive investments involving Petrobras and other global petroleum firms For the 2009-2012 period investments in petroleum and gas (R$2697 billion) Petrochemicals (237) andEthanol (197) sum to over R$3130 billion
BNDES Triennial Investment Plans 2004-2012
2004-7 2007-10 2008-11 2009-12----------------------------------------------------------------------------------------------------------------Petroleum amp Gas 1472 1836 2028 2697
Mining 472 527 813 480Petrochemicals 64 174 264 237Steel 198 371 312 245Automotive 150 176 264 235Electronics 143 156 140 240Ethanol 166 205 205 197Paper amp Celulose 104 200 274 90Health 51 46 51 80Industry Total 2816 3802 4437 4501----------------------------------------------------------------------------------------------------------------Source BNDES Annual Reports 2002-2006
It is of note that President Dilma Roussef was instrumental in reducing the targets for2009-12 in petroleum and gas given indications that Petrobras and existing framework foroffshore oil prospecting and production proved unable to increase investments accordingly
The BNDES also retains a presence in government projects by providing managementassistance During 2008 BNDES staff provided management support for implementation of192 projects involving R$710 billion of total R$142 billion PT government growthacceleration projects BNDES staff also participated in the design management andimplementation of President Lularsquos Poliacutetica de Desenvolvimento Produtivo (Policy forProduction Development) involving R$2100 billion targeting production chains designed tomaximize employment and regional development benefits Finally the BNDES was alsocharged to create and co-manage a Fundo Amazonia with the Ministry of Environment toprovide incentives to reduce deforestation of the Amazon region BNDES Plans for 2009include completion of concession for construction of high speed train line and service for Riode Janeiro-Satildeo Paulo corridor two blocks of highway concession sales involving three majorhighways in each block of sales sale of management concessions for regional airports andthe reorganization of INFRAERO federal government airport management company
These policies reflect the goal of BNDES policy to launch firms on the stock marketrather than maintain direct credit and finance Exceptions during 2008 involve Auto andEthanol industies both for strategic and broader policy reasons Given the sharp downturn inauto sales during fourth quarter 2008 the BNDES provided significant lending to avert
further downsizing or failure of auto companies in Brazil Given the current globalredistribution of automobile production BNDES policies are designed to help the Brazilian
8132019 Government Banking and BRICs in the Recent Financial Crisis
httpslidepdfcomreaderfullgovernment-banking-and-brics-in-the-recent-financial-crisis 3357
983106983122983113983107 983111983151983158983141983154983150983149983141983150983156 983106983137983150983147983155 983137983150983140 983110983145983150983137983150983139983145983137983148 983123983156983137983156983141983139983154983137983142983156
33
operations of major auto firms through the period of adjustment and increase theattractiveness of domestic operations in global production strategies of multinational autocompanies Ethanol production also received massive funds to sustain an industry seen ascritical for alternative and sustainable fuel source capable of replacing petroleum Ethanolreached over 50 percent of automotive fuel sales in 2007
Under the Lula government (2003-10 the BNDES also resumed lending to state andmunicipal governments Since the renegotiation of municipal and state government debts inthe late 1990s states and municipalities have been largely prohibited from taking on debtThis was emplematic of the recentralization required to control fiscal excesses during militaryrule and the prolonged period of transition to democracy Policies during the 1990s weredesigned to avert overspending seen as critical to maintain price stability under the Real Plan(1994) In 2000 the Lei de Responsibilidade Fiscal (Fiscal Responsibility Law) largelyprohibited credit and finance to state and municipal governments Since 2000 municipalitiesand states have been required to submit detailed budget statements that in turn have been thebasis for a gradual return to sub-national government finance In August 2006 central bankand Treasury regulations freed municipalities to take on credit up to 12 times liquid receipts
Since then the BNDES has led in terms of credits and finance to subnational governmentsthrough a Programa Especial de Financiamento aos Estados e Distrito Federal
The BNDES also has developed the first system in Brazil for risk analysis ofmunicipal governments and has led in the market for municipal credit freed by August 2006procedures for approval at Treasury the Central Bank and Conselho Monetaacuterio Nacional(National Monetary Council) Prosecution of mayors and firms charged with managingmunicipal credits with the BNDES revealed fraudulent practices These funds for sub-national public finance also became critical mechanisms to counter severe budget shortfallscaused by financial crisis during 2008 Given that municipal and state government tax basesare shallow and that federal government transfers provide the bulk of sub-nationalgovernment resources the Lula administration allocated R$ 40 billion to the Fundo deParticipaccedilatildeo dos Estados (State Participation Fund) through a Programa Emergencial deFinanciamento (Emergency Finance Fund) administered by the BNDES
In sum the BNDES expanded credit and finance operations substantially during fouryears of sustained growth from 2004-2007 And having helped underwrite the stock marketboom and capitalized Brazilian firms directly and indirectly through credit finance mutualfunds and private equity funds the BNDES retained sufficient scale scope and capital baseto provide counter cyclical credit and finance to help firms adjust to financial crisis and creditshortage during 2008 In retrospect the growth of the BNDES since liberalization andprivatizations of state government banks in the 1990s suggest the comparative advantages of
development banking BNDES credit and finance fell to 52 percent of fixed capitalformation in 1995 Since then the turn to neo-developmentalism and a period of sustainedeconomic growth during the Lula administration increased the BNDES share of total fixedcapital formation during 2006 and 2007 to 126 and 141 percent Critics charge thatmonopoly over FGTS and PIS-PASEP official savings funds as liabilities provide theBNDES with unfair competitive advantage over private banks In 2008 forced savings fundssummed to only 17 percent of BNDES liabilities (resources) The BNDES does not relyexclusively on forced savings for competitive advantage Instead market-oriented policies
joint-ventures with private mutual funds investment funds private equity firms large blocksof shareholding in Brazilian firms and massive amounts of credit and investment to theprivate sector at below market but still profitable long term interest rates of 625 percent
suggest that the large scale and scope of BNDES operations provide institutional foundationsof competitive advantage over private and foreign banks
8132019 Government Banking and BRICs in the Recent Financial Crisis
httpslidepdfcomreaderfullgovernment-banking-and-brics-in-the-recent-financial-crisis 3457
983106983122983113983107 983111983151983158983141983154983150983149983141983150983156 983106983137983150983147983155 983137983150983140 983110983145983150983137983150983139983145983137983148 983123983156983137983156983141983139983154983137983142983156
34
Capitalization of the BNDES by Treasury of over R$2300 billion 2009-11hascaptured attention of many observers of Brazilian development Critics and advocates agreethat the BNDES has realized significant competitive advantages over private and foreignbanks and continues to serve as significant alternative to capital markets for large scaledevelopment projects However like the downturn in planned investments by Petrobras for
oil and gas exploration and production BNDES decreased planned investments fromR$1684 billion in 2010 to R$1397 billion in 2011 We believe this indicates the limits ofmanagement and passing of period of crisis both favoring finance from capital marketsbanks and public-private partnerships
India
Analysis of Brazilian federal banks suggests that these institutions provided policy alternativewhile realizing competitive advantage over private and foreign banks The modernization ofthese institutions helps explain why these large institutions were able to stay the effects ofcredit crunch and financial market downturn in Brazil This section explores data from the
Reserve Bank of India to compare market shares of types of banks from 1972-2008 and bankperformance from 2006-10 Further analysis will be required However the data appears tosupport our core argument that government banks have modernized and realized competitiveadvantages over private and foreign banks
First the number of branch offices which serves as a measure of institutionalcoverage across India of special concern for financial inclusion and the theory thatliberalization and privatizations would lead private banks to expand branch offices andincrease the supply of services From this perspective the trajectory of branch officessuggests that nationalized banks the State Bank of India and regional rural bankssustain much larger networks of branch offices that predominate while otherscheduled commercial (private and foreign) banks retain less than 8000 branch offices
Data from the Reserve Bank of India on the number of current accounts retainedby type of bank provide further evidence that the State Bank of India and its associates
8132019 Government Banking and BRICs in the Recent Financial Crisis
httpslidepdfcomreaderfullgovernment-banking-and-brics-in-the-recent-financial-crisis 3557
983106983122983113983107 983111983151983158983141983154983150983149983141983150983156 983106983137983150983147983155 983137983150983140 983110983145983150983137983150983139983145983137983148 983123983156983137983156983141983139983154983137983142983156
35
national banks and regional rural banks provide the bulk of banking accounts to theIndian population while private and foreign banks cherry pick upscale urban marketsreproducing capital drain and inequalities
Number of Current Accounts by Type of Bank 1972-1995
Since 1999 the pattern of predominance by alternative banking institutions and the minorrole of other scheduled commercial banks and foreign banks continues
The following figures report the value held in current accounts by type of banks first fromthe 1972-1995 period then from the 1999-2008 period For both time periods the trendconfirms that private and foreign banks remain at a competitive disadvantage in terms of thebroader market while the State Bank of India and its associates nationalized banks andregional rural banks tend to predominate
8132019 Government Banking and BRICs in the Recent Financial Crisis
httpslidepdfcomreaderfullgovernment-banking-and-brics-in-the-recent-financial-crisis 3657
983106983122983113983107 983111983151983158983141983154983150983149983141983150983156 983106983137983150983147983155 983137983150983140 983110983145983150983137983150983139983145983137983148 983123983156983137983156983141983139983154983137983142983156
36
Current Account Value by Type of Bank 1972-1995 R
Number of Deposit Accounts by type of bank 1999-2008
A similar pattern appears for the trajectory of savings accounts both the number of
accounts and the value held in savings accounts both for the 1972-1995 period We wereunable to organize data from the more recent period
8132019 Government Banking and BRICs in the Recent Financial Crisis
httpslidepdfcomreaderfullgovernment-banking-and-brics-in-the-recent-financial-crisis 3757
983106983122983113983107 983111983151983158983141983154983150983149983141983150983156 983106983137983150983147983155 983137983150983140 983110983145983150983137983150983139983145983137983148 983123983156983137983156983141983139983154983137983142983156
37
Number of Savings Accounts by Type of Bank 1972-1995
Value in Savings Accounts by Type of Bank 1972-1995
Number of Term Savings Accounts by Type of Bank 1972-1995
8132019 Government Banking and BRICs in the Recent Financial Crisis
httpslidepdfcomreaderfullgovernment-banking-and-brics-in-the-recent-financial-crisis 3857
983106983122983113983107 983111983151983158983141983154983150983149983141983150983156 983106983137983150983147983155 983137983150983140 983110983145983150983137983150983139983145983137983148 983123983156983137983156983141983139983154983137983142983156
38
Value in Term Savings Accounts by Type of Bank 1972-1995
The number and value of credits extended by banks from 1999-2008 appears mostpromising in terms of comparative analysis of bank performance and behavior Thesignificant spread at the end of the time series between the State Bank of India and itsassociates and foreign banks suggests the impact of foreign financial crisis and differentdomestic policies by these types of banks in India similar to that noted in the Brazilianexperience
Number of credits by type of bank 1999-2008
Value of credit by type of bank 1996-2008
8132019 Government Banking and BRICs in the Recent Financial Crisis
httpslidepdfcomreaderfullgovernment-banking-and-brics-in-the-recent-financial-crisis 3957
983106983122983113983107 983111983151983158983141983154983150983149983141983150983156 983106983137983150983147983155 983137983150983140 983110983145983150983137983150983139983145983137983148 983123983156983137983156983141983139983154983137983142983156
39
Further data from the Reserve Bank of India from 2008-10 permit closercomparison of government private and foreign banks in the recent financial crisis Interms of deposits investments total assets and net profits the dominant and expandingrole of government banking in India is apparent Further control variables (not reported)
include gross and net NPA types of income expenses and expenditures provisions andcontingencies and credit- and investment-deposit ratios provide control for bad bankingand confirm the counter cyclical policies during 2008-10 in India
THE FOLLOWING TABLES REQUIRE INTERPRETATION
Number of Banks 2006-7 2007-8 2008-9 2009-10 2010-11
State Bank of India amp Associates 8 8 7 7 6Nationalized Banks 20 20 20 20 20Old Private Sector Banks 17 15 15 15 14
New Private Sector Banks 8 8 7 7 7Foreign Banks 29 28 31 32 33Source RBI A Profile of Banks 2010-11
Number of Branch Offices 2006-7 2007-8 2008-9 2009-10 2010-11
State Bank of India amp Associates 14673 15848 16894 18178 18772Nationalized Banks 37435 39255 40956 43452 45640Old Private Sector Banks 4723 4690 4908 5220 5011New Private Sector Banks 2599 3635 4333 5232 6957
Foreign Banks 272 277 295 308 316Source RBI A Profile of Banks 2010-11
Number of Employees 2006-7 2007-8 2008-9 2009-10 2010-11
State Bank of India amp Associates 255699 249008 268598 266605 282453Nationalized Banks 473179 466400 462926 473041 475082Old Private Sector Banks 47994 48700 51341 55052 55075New Private Sector Banks 91060 110123 124998 127468 163604Foreign Banks 28426 31301 29582 28012 27968
Source RBI - India BanksAssociation
Business per employee (in lakh) 2006-7 2007-8 2008-9 2009-10 2010-11
State Bank of India amp Associates 43635 54922 65022 73743 79306Nationalized Banks 49001 61828 78316 93586 114477Old Private Sector Banks 48159 56932 63843 69749 8149New Private Sector Banks 80782 83196 78715 84041 82607Foreign Banks 97477 11255 128274 141139 155974Note Business = Deposits + Advances
8132019 Government Banking and BRICs in the Recent Financial Crisis
httpslidepdfcomreaderfullgovernment-banking-and-brics-in-the-recent-financial-crisis 4057
983106983122983113983107 983111983151983158983141983154983150983149983141983150983156 983106983137983150983147983155 983137983150983140 983110983145983150983137983150983139983145983137983148 983123983156983137983156983141983139983154983137983142983156
40
Profit per employee (in lakh) 2006-7 2007-8 2008-9 2009-10 2010-11
State Bank of India amp Associates 257 362 443 466 42Nationalized Banks 287 377 486 567 695Old Private Sector Banks 234 406 469 42 563New Private Sector Banks 587 685 677 847 893Foreign Banks 1613 2112 2539 1692 2759
Capital amp Reserves amp Surplus(Ycrore) 2006-7 2007-8 2008-9 2009-10 2010-11
State Bank of India amp Associates 42941 61706 72422 83726 84394Nationalized Banks 92689 113079 135920 157276 205857Old Private Sector Banks 10736 15315 17477 20171 23821New Private Sector Banks 39736 76056 82192 99813 114768Foreign Banks 33075 49332 59937 69176 80972
Deposits Ycrore 2006-7 2007-8 2008-9 2009-10 2010-11
State Bank of India amp Associates 633476 773875 1007041 1108086 1245862Nationalized Banks 1360724 1679993 2105706 2583934 3127122Old Private Sector Banks 138249 165589 199274 229897 264157New Private Sector Banks 413738 509444 537104 592904 738602Foreign Banks 150750 191161 214076 232099 240689
Investments Ycrore 2006-7 2007-8 2008-9 2009-10 2010-11
State Bank of India amp Associates 211875 263823 357624 387473 385697Nationalized Banks 452981 536018 655042 828125 942837Old Private Sector Banks 43647 54080 72393 83499 92617New Private Sector Banks 171008 224498 234139 270618 329403Foreign Banks 71471 98910 130354 159291 165499
Advances Ycrore 2006-7 2007-8 2008-9 2009-10 2010-11
State Bank of India amp Associates 482270 593722 739450 857937 994154Nationalized Banks 957877 1203678 1519762 1843082 2311478
Old Private Sector Banks 92887 111670 128504 154085 184647New Private Sector Banks 321865 406733 446824 478356 612886Foreign Banks 126339 161133 165385 163260 195539
Interest Income Ycrore 2006-7 2007-8 2008-9 2009-10 2010-11
State Bank of India amp Associates 53465 70428 89196 97954 109828Nationalized Banks 110720 142647 183892 208029 256490Old Private Sector Banks 11474 14614 18790 20497 23299New Private Sector Banks 38092 56377 66282 62309 73528
Foreign Banks 17924 24417 30322 26390 28520
8132019 Government Banking and BRICs in the Recent Financial Crisis
httpslidepdfcomreaderfullgovernment-banking-and-brics-in-the-recent-financial-crisis 4157
983106983122983113983107 983111983151983158983141983154983150983149983141983150983156 983106983137983150983147983155 983137983150983140 983110983145983150983137983150983139983145983137983148 983123983156983137983156983141983139983154983137983142983156
41
Other Income Ycrore 2006-7 2007-8 2008-9 2009-10 2010-11
State Bank of India amp Associates 9420 11818 16073 18394 19240Nationalized Banks 14264 20979 26394 30500 28625Old Private Sector Banks 1568 2184 2782 3152 3029
New Private Sector Banks 10745 14822 15078 17271 17697Foreign Banks 7044 10588 14894 9951 10972
Interest Expended Ycrore 2006-7 2007-8 2008-9 2009-10 2010-11
State Bank of India amp Associates 32607 47809 61770 66229 67018Nationalized Banks 69353 101093 131676 145712 164135Old Private Sector Banks 7055 9960 12834 14076 14768New Private Sector Banks 25802 38535 44123 37130 42347Foreign Banks 7603 10604 12819 8938 10622
Operating Expenses Ycrore 2006-7 2007-8 2008-9 2009-10 2010-11
State Bank of India amp Associates 15987 16993 20088 25283 29146Nationalized Banks 27268 29670 35416 40792 53819Old Private Sector Banks 2967 3235 3939 4715 5600New Private Sector Banks 12353 17032 17840 18136 22006Foreign Banks 7745 10353 12298 11102 12557
Cost of Funds 2006-7 2007-8 2008-9 2009-10 2010-11
State Bank of India amp Associates 475 59 594 532 48Nationalized Banks 48 582 609 537 493Old Private Sector Banks 498 62 667 613 55New Private Sector Banks 524 611 604 442 427Foreign Banks 403 433 446 283 311Cost of Funds = Ratio () of interest paid on deposits and borrowings to averageof opening and closing balances of deposits and borrowings
Return on advances adjusted toCoF 2006-7 2007-8 2008-9 2009-10 2010-11
State Bank of India amp Associates 372 365 395 36 405Nationalized Banks 399 369 409 382 427Old Private Sector Banks 406 426 515 482 492New Private Sector Banks 447 505 526 514 516Foreign Banks 574 66 815 716 564
2006-7 2007-8 2008-9 2009-10 2010-11
8132019 Government Banking and BRICs in the Recent Financial Crisis
httpslidepdfcomreaderfullgovernment-banking-and-brics-in-the-recent-financial-crisis 4257
983106983122983113983107 983111983151983158983141983154983150983149983141983150983156 983106983137983150983147983155 983137983150983140 983110983145983150983137983150983139983145983137983148 983123983156983137983156983141983139983154983137983142983156
42
Wages as of Total Expenses
State Bank of India amp Associates 2155 1589 1506 171 1921Nationalized Banks 1794 1405 1331 1365 1641Old Private Sector Banks 1689 1367 1326 1457 1675
New Private Sector Banks 936 956 1017 121 1383Foreign Banks 2008 1995 1944 2348 2331
Returns on Assets 2006-7 2007-8 2008-9 2009-10 2010-11
State Bank of India amp Associates 086 097 102 091 079Nationalized Banks 094 101 103 100 103Old Private Sector Banks 078 114 115 095 112New Private Sector Banks 109 113 112 138 151Foreign Banks 228 209 199 126 174
Capital Adequacy Ratio 2006-7 2007-8 2008-9 2009-10 2010-11
State Bank of India amp Associates 1232 1321 1396 1346 1225Nationalized Banks 1237 1213 1324 1318 1347Old Private Sector Banks 1208 1408 1476 1485 1456New Private Sector Banks 1199 1439 1533 1803 1687Foreign Banks 1239 1305 1432 1726 1672Note To 2007-8 = Basel I From 2008-09 = Basel-II
Net NPA Ratio 2006-7 2007-8 2008-9 2009-10 2010-11
State Bank of India amp Associates 132 143 147 150 149Nationalized Banks 094 077 068 091 092Old Private Sector Banks 096 066 09 082 053New Private Sector Banks 097 109 129 103 056Foreign Banks 073 077 181 182 067Net NPA Ratio = Net non-performing assets as net advances
In sum descriptive data from the Reserve Bank of India confirm the anomaly
and argument drawn from the Brazilian experience An important dimension of BRICcountry recovery from the global financial crisis and downturn is the counter cyclicallending policies and realization of competitive advantages of government banks Thisposes a series of new questions for business schools and scholars of public policyInstead of liberalization and privatization leading to transitions in BRIC countriestoward capital market centered financial systems and liberal market economies publicbanks have realized competitive advantages over private and foreign banks whileproviding policy alternatives to BRIC governments in the face of financial crisis andglobal economic slowdown We return to these implications in the conclusion
One development of note at the Reserve Bank of India is a policy focus onfinancial inclusion The 2008 report of the Committee on Financial Inclusion has beenfollowed by sections of the Reserve Bank of India Annual Report reserved fordiscussion of financial inclusion And instead of focusing on liberalization and
8132019 Government Banking and BRICs in the Recent Financial Crisis
httpslidepdfcomreaderfullgovernment-banking-and-brics-in-the-recent-financial-crisis 4357
983106983122983113983107 983111983151983158983141983154983150983149983141983150983156 983106983137983150983147983155 983137983150983140 983110983145983150983137983150983139983145983137983148 983123983156983137983156983141983139983154983137983142983156
43
privatization to ensure the spread of banking products and services alternative policieshave been explored One is of special note The Committee on Financial Inclusionrecommended issue of identity cards as bank cards This would profoundly change thelandscape of banking in India and has attracted attention from analysts at the CentralBank of Brazil charged with financial inclusion as well as the President of Indonesia
and apparently Uganda officials Given the revolution in information and card paymenttechnologies this policy proposal and pilot studies deserve close attention asalternatives to dramatically increase the pace of social inclusion of the bankless
8132019 Government Banking and BRICs in the Recent Financial Crisis
httpslidepdfcomreaderfullgovernment-banking-and-brics-in-the-recent-financial-crisis 4457
983106983122983113983107 983111983151983158983141983154983150983149983141983150983156 983106983137983150983147983155 983137983150983140 983110983145983150983137983150983139983145983137983148 983123983156983137983156983141983139983154983137983142983156
44
China
This section turns to a brief review of the Chinese banking sector to further explore therole of government banks in terms of their modernization competitive advantages
policy roles and capacity for counter cyclical credit that help explain why BRICcountries were able to avert the severe consequences of the global financial crisis
First figure A11 reports the basic structure of the banking system in China
Although we have been unable to compare the evolution of types of banks acrosstime in similar ways to the above data on India taken from the Reserve Bank of Indiaour research assistants have gathered the following comparative macroeconomicfinancial and balance sheet data on banking in China The data appear to be consistentwith the core argument presented in this paper ndash that government banks havemodernized since liberalization and provided policy makers with alternative means tocounter the effects of financial crisis abroad
8132019 Government Banking and BRICs in the Recent Financial Crisis
httpslidepdfcomreaderfullgovernment-banking-and-brics-in-the-recent-financial-crisis 4557
983106983122983113983107 983111983151983158983141983154983150983149983141983150983156 983106983137983150983147983155 983137983150983140 983110983145983150983137983150983139983145983137983148 983123983156983137983156983141983139983154983137983142983156
45
We lack more current information and were unable to collect data directly fromofficial sources in China to compare the trajectory of state owned private and foreignbanks As a substitute Figure 1 reports data from 2000-4 that permits initial observationof trends for this earlier period
Those present may not need reminding of the formidable record of economicgrowth in China during this 200-4 period that continues until today However data fromthe National Bureau of Statistics suggests that the Chinese banking system expanded atan even greater pace than the remarkable levels of GDP growth recorded for the 2000-4period Furthermore credit expansion was ldquoorganicrdquo in the sense that deposits
outpaced credit growth from 2000-4
Expansion of Loans in China 1999-2004
Loan Growth Total LoansYear on Year
Growth Total Depositssup1Year on Year
GrowthYear CNY billion CNY () CNY billion CNY()1999 9373 83 10878 1372000 9937 60 1238 1382001 11231 130 14362 1602002 13129 169 17092 1902003 159 211 20806 217
2004 18857 186 25319 217
sup1Based on preliminary estimates by the National Bureau of Statistics of the Peoplersquos Republic of ChinaSource National Bureau of Statistics of the PRC
Although we lack data comparable to that from the Reserve Bank of India ableto compare the trajectory of state private and foreign banks in China the sectoralbreakdown of loans and other banking and national account data confirms the profoundcapitalization of the Chinese banking system and GDP growth during from 1995-2004
8132019 Government Banking and BRICs in the Recent Financial Crisis
httpslidepdfcomreaderfullgovernment-banking-and-brics-in-the-recent-financial-crisis 4657
983106983122983113983107 983111983151983158983141983154983150983149983141983150983156 983106983137983150983147983155 983137983150983140 983110983145983150983137983150983139983145983137983148 983123983156983137983156983141983139983154983137983142983156
46
China Banking Sector Market Dimensions (1995 - 2004)
YearTotal
LoansCorp
LoansConsuLoans
HomeLoans
TotalDeposits Excess
GovBonds
CorpBonds GDP
GDPGrowth
()1995 52310 mdash mdash mdash 5376 145 330 65 5848 2511996 63100 mdash mdash mdash 6847 538 436 60 6788 1611997 73585 7341 17 130 8212 853 551 52 7446 971998 85002 8447 53 430 9529 102 9 777 68 7835 521999 95587 9394 164 1360 10831 1273 1054 78 8207 482000 108763 10453 424 3320 13486 261 1302 86 894 892001 118990 112 699 5600 15472 3573 1562 101 9593 732002 139800 12913 1067 8258 18339 4359 mdash mdash 10479 922003 169770 15401 1576 13302 22036 5059 mdash mdash 11669 1142004 194220 16848 1988 15800 25319 5897 mdash mdash 13657 170Figures = CNYB
This data reported in terms of percent GDP provides further clarity on the rapid
capitalization of loans It is of note that the bulk of loans during this period were to thecorporate sector with consumer and home loans lagging significantly
China Banking Sector Percent GDP
YEARTotal
LoansCorporate
LoansConsumer
LoansHomeLoans Deposits
ExcessDeposits
GovBonds
CorpBonds
1995 895 00 00 00 919 25 56 111996 929 00 00 00 1009 79 64 091997 988 986 02 02 1103 115 74 071998 1085 1078 07 05 1216 131 99 091999 1165 1145 20 17 1320 155 128 092000 1217 1169 47 37 1508 292 146 102001 1240 1167 73 58 1613 372 163 112002 1334 1232 102 79 1750 4162003 1455 1320 135 114 1888 4342004 1422 1234 146 116 1854 432
Sources China Banking Regulatory Commission Peoplersquos Bank of China and GoldmanSachs research estimates
Compilation of financial data from a select number of banks in China suggeststhat the pattern of bank change encountered in Brazil and India also describes theexperience of China The liberalization of the Chinese economy and the modernization
of state banks appear to describe the process of bank change instead of a process oftransition toward private banking and capital market centered financial systemAlthough we have been unable to draw data from Chinese monetary authorities thebalance sheet data suggests the clear predominance of large state banks in the politicaleconomy of banking and finance in China How these institutions were used to counterthe effects of financial crisis abroad and redirect domestic investment production andconsumption must remain a subject for further research
8132019 Government Banking and BRICs in the Recent Financial Crisis
httpslidepdfcomreaderfullgovernment-banking-and-brics-in-the-recent-financial-crisis 4757
983106983122983113983107 983111983151983158983141983154983150983149983141983150983156 983106983137983150983147983155 983137983150983140 983110983145983150983137983150983139983145983137983148 983123983156983137983156983141983139983154983137983142983156
47
Select Financial Data from Chinese Banks 2004()
CNY (billion)Total
AssetsGrossLoans
CustomerDeposits Equity
NPLRatio
()
Pre-prov
ProfitsNet
Profits
State Banks
ICBC 5671 3705 5105 163 190 653 23CCB 3905 2226 3489 195 39 605 484ABC (NA) mdashBOC 427 2146 3342 205 51 578 209Quasi-State
BoCom 1145 639 1023 54 30 131 16CMB 587 376 513 22 29 82 32CITIC Industrial 515 306 429 20 60 52 03SPDB 456 311 397 14 24 62 20China Everbright mdashGuangdong Development 345 216 301 mdash mdash mdash 32
Industrial Bank 341 203 283 10 25 37 11Quase-Private
Bank of Shanghai 216 106 179 83 51 32 26Hua Xia 304 181 270 92 40 29 10Shenzhen Development 198 126 166 43 114 28 03Bank of Beijing 209 85 174 71 mdash 26 07
Sector total 19422 25319 129Three state-banks 2692 3979 188Second tier banks 2549 3733 148
ABC = Agriculture Bank of China BOC = Bank of China
BOCOM = Bank of Communications CCB = China Construction BankCMB = China Merchantrsquos Bank CNY = yuanICBC = Industrial and Commercial Bank of ChinaNPL = nonperforming loanROA = return on assets ROE = return on equityprov = provisioningPRC = Peoplersquos Republic of ChinaSPDB = Shanghai Pudong Development BankNote Loan and deposit market share for BOC and ICBC are for their domestic operations onlySources Company data Goldman Sachs research estimates
Returns on Assets Equity and Domestic Market Shares of Major China Banks 2004()
CNY (billion) ROA () ROE ()Deposit Mkt
Share ()Loan MktShare ()
Mortgage MktShare()
State Banks
ICBC 004 14 199 187 253CCB 130 254 138 115 217ABC (NA)BOC 051 102 101 89 152Quasi-State
BoCom 015 45 37 29 34CMB 060 161 20 19 29
CITIC Industrial 007 17 17 16 18SPDB 048 153 16 16 26
8132019 Government Banking and BRICs in the Recent Financial Crisis
httpslidepdfcomreaderfullgovernment-banking-and-brics-in-the-recent-financial-crisis 4857
983106983122983113983107 983111983151983158983141983154983150983149983141983150983156 983106983137983150983147983155 983137983150983140 983110983145983150983137983150983139983145983137983148 983123983156983137983156983141983139983154983137983142983156
48
China EverbrightGuangdong Development mdash mdash 12 11 mdashIndustrial Bank 037 126 11 10 10Quase-Private
Bank of Shanghai 129 360 07 05 14Hua Xia 038 116 11 09 07Shenzhen Development 017 75 07 06 08Bank of Beijing 037 108 07 04 07
Sector totalThree state-banks 438 391 622Second tier banks 144 127 154
ABC = Agriculture Bank of China BOC = Bank of China BOCOM = Bank of Communications CCB =China Construction Bank CMB = China Merchantrsquos Bank CNY = yuanICBC = Industrial and Commercial Bank of China mkt = market NPL = nonperforming loan ROA =return on asset ROE = return on equity prov = provisioning PRC =Peoplersquos Republic of China SPDB = Shanghai Pudong Development BankNote Loan and deposit market share for BOC and ICBC are for their domestic operations onlySources Company data Goldman Sachs research estimates
Further data from 2006-10 from the Peoples Bank of China suggests that the big5 state banks continue to outperform the next 12 largest joint stock commercial banksThe big five have launched sales of shares to capitalize while listing on capital marketsand adopting reporting of financial data along lines of international standards Thisappears to be similar to Banco do Brasil policies that retain majority of shares in federalgovernment control while capitalizing the bank through issues of stock
Comparing the Performance of Big 5 State Banks and Next 12 Joint Stock CommercialBanks in China
2006 2007 2008 2009 2010
Profit Margin Big 5 State Banks 3116 3143 2586 3026 3269
Next 12 JS Commercial Banks 2050 2791 1796 2159 2365
Returns Big 5 State Banks 507 606 860 691 675(risk adj) Next 12 JS Commercial Banks 459 570 1016 714 723
Op Risk Big 5 State Banks 5548 5539 5215 5319 5322Next 12 JS Commercial Banks 5886 5721 5725 5831 5947
Leverage Big 5 State Banks 1626 1482 1724 173 1734Next 12 JS Commercial Banks 2826 2251 2064 2048 1936
ROE Big 5 State Banks 1424 1557 1999 1925 2037Next 12 JS Commercial Banks 1564 2049 2156 1840 1967
Big 4 and 11 JSCBsSource Peoples Bank of China China Financial Stability Reports 2007-11
Performance indicators reported by the Peoples Bank of China for the big 5 statebanks and 12 next largest joint stock commercial banks also suggest that the largestgovernment banks in China retain significant competitive advantages ndash and may providepolicy alternatives Given the current shift of economic policy in China away fromindustry and export led growth to more sustainable domestic oriented growth and socialinclusion the role of state banks clearly comes to the fore
8132019 Government Banking and BRICs in the Recent Financial Crisis
httpslidepdfcomreaderfullgovernment-banking-and-brics-in-the-recent-financial-crisis 4957
983106983122983113983107 983111983151983158983141983154983150983149983141983150983156 983106983137983150983147983155 983137983150983140 983110983145983150983137983150983139983145983137983148 983123983156983137983156983141983139983154983137983142983156
49
Net Operating Income of Big 5 State Banks and Next 12 CommercialBanks 100 million RMB YuanBig 5 State Banks 2006 2007 2008 2009 2010
Balance Net interest income 349703 500456 556790 532206 720152Net fee amp commission inc 48524 103817 138464 175469 232491
Investment income 216089 283725 338865 324037 340440
Other business income (1807) (17054) 47548 33791 2186
Net operating income 612509 870944 1081667 1065503 1314943
Percent Net interest income 5709 5746 5148 4995 5477
Net fee amp commission inc 792 1192 1280 1646 1768
Investment income 3528 3258 3133 3041 2589
Other business income (030) (196) 440 318 166
Net operating income 10000 10000 10000 100 100
Next 12 Joint Stock CommercialBanks 2006 2007 2008 2009 2010
Net interest income 87253 132945 198965 191276 281588
Net fee amp commission inc 7850 16247 27319 30115 42023
Investment income 20959 32172 44864 50767 50500
Other business income 2306 4498 16359 10384 7400
Net operating income 118468 185861 287507 282542 381511
Percent Net interest income 7365 7153 6920 6769 7381
Net fee amp commission inc 671 874 950 1066 1101
Investment income 1769 1731 1560 1797 1324
Other business income 195 242 569 368 194Net operating income 10000 10000 10000 10000 10000
Source Peoples Bank of China China Financial Stability Reports 2007-11
Big 4 and 11 JSCBsBig 5 = ICBC ABC BOC CCB BOCOMNext 12 Joint Stock Commercial Banks = China CITIC Bank Everbright Bank Huaxia BankGuangdong Development Bank Shenzhen Development Bank China Merchants Bank Shanghai PudongDevelopment Bank Industrial Bank China Minsheng Banking Corporation Evergrowing Bank ChinaZheshang Bank Bohai Bank
In conclusion bank change in China also appears to confirm our findings from
Brazil ndash that state banks have realized competitive advantages and increased marketshares since liberalization while providing counter cyclical credit to ameliorateadjustment to crisis The modernization of the China Postal Savings Bank is ofparticular interest given its social mission downmarket focus and 40000 branchOffices throughout the country Expansion of card payment services through the postalbank system confirms the importance of the Brazilian federal savings bank (CaixaEconocircmica Federal Caixa) as agent for federal government social policy and agentresponsible for management of citizenship cards (12 million) and payment of familygrants This back to the future modernization of savings banks has proved essential forovercoming notorious levels of social exclusion and inequality in Brazil Althoughenglish language materials are unavailable on the China Postal Savings Bank thisinstitution clearly presents profound opportunities for comparable policies in China
8132019 Government Banking and BRICs in the Recent Financial Crisis
httpslidepdfcomreaderfullgovernment-banking-and-brics-in-the-recent-financial-crisis 5057
983106983122983113983107 983111983151983158983141983154983150983149983141983150983156 983106983137983150983147983155 983137983150983140 983110983145983150983137983150983139983145983137983148 983123983156983137983156983141983139983154983137983142983156
50
Reported offer of microfinance services for poverty reduction as part of nationaleconomic stimulous plan may point to developments in this direction
Given that state planning capacity has long been at the center of attention intheories of financial statecraft the role of Chinese state banks in redirecting policiesaccording to the 12th 5 Year plan for 2011-15 seems critical From 2000-5 the 10th 5
Year plan emphasized infrastructure and the attraction of investment and labor skillsThe 11th 5 Year plan (2006-10) raised concerns about sustainability rather than growthlevels while also seeking to spread improvements to balance development better servepeople and improve the quality of life continue to support Center and West provincesand revitalize Northeast provinces In comparison the 12th 5 Year plan calls for morebalanced lsquoinclusiversquo growth and structural adjustemts more than 4 trillion RMB($US600 billion) for targeted industries and interior regions a focus on new energynew materials and information and high technologies biology and new medicineenergy converstaion and environmental protection aerospace marine and advancedmanufacturing This implies fundamental shifts away from industry to services that hasbeen reported in macroeconomic data for 2010 If past studies emphasized directed
credit and industrial change the role of Chinese state banks in realizing transformationscertainly warrants study
Although the domestic flow of funds process of liberalization (or the lackthereof) and insertion of banking into Chinese political economy is beyond the scope ofthis paper our findings from Brazil appear to provide valuable hypotheses about ChinaThat is to say the big state banks and other government banks in China remaincommanding heights not in the Marxist sense of providing means to reach socialismbut immense institutions with profound presence throughout politics and markets in thecountry In this sense our findings from Brazil appear to approximate patterns ofchange in China more than Washington Consensus expectations about liberalization andprivatizations to free private and foreign banks Financial statecraft draws attention tothe capitalization of Chinese state banks through stock Sales and listings on capitalmarkets However like the Banco do Brasil (that reformers in the 1990s sought to shiftcontrol to the private sector only to increase federal government shareholding) theChinese experience surely involves unexpected consequences and patterns of changedifferent than a linear transition to the Berle amp Means paradigm of corporategovernance
Russia The New State Duopoly
ldquoThe rush of 2003-8 increased the market share of foreign banks to 285 from
52 However the state-owned banks received enormous help from the federal budget in the days of the crisis thereby strengthening their dominant
position on the Russian financial market says Sergey Aleksashenko the formerDeputy chairman of Russias Central Bank quotes Russia Profile Today one
must not harbor any illusion of a fair competition with them all the main cash
flows in Russia are controlled by state-owned banks httpwwwbarentsnovacomnode1031
Description of banking policy in Russia during the global financial crisis can beobtained from Bank of Russia annual reports and related publications The figure on the
following page summarizes the financial flows to and from the Bank of RussiaAlthough central bank policy is beyond the scope of this study the role of state banks in
8132019 Government Banking and BRICs in the Recent Financial Crisis
httpslidepdfcomreaderfullgovernment-banking-and-brics-in-the-recent-financial-crisis 5157
983106983122983113983107 983111983151983158983141983154983150983149983141983150983156 983106983137983150983147983155 983137983150983140 983110983145983150983137983150983139983145983137983148 983123983156983137983156983141983139983154983137983142983156
51
channeling counter-cyclical credits released by the Bank of Russia appear to confirm thecore argument that emerges from our studies of the Brazilian banking system Furtherdata on the following pages also suggest that state banks in Russia performed wellduring 2008-10 confirming on the basis of sparse data taken from Bank of Russiareports and documents that public banks have modernized provided counter-cyclical
credit to reverse credit crunch and economic downturn while realizing competitiveadvantages over private and foreign banks
8132019 Government Banking and BRICs in the Recent Financial Crisis
httpslidepdfcomreaderfullgovernment-banking-and-brics-in-the-recent-financial-crisis 5257
983106983122983113983107 983111983151983158983141983154983150983149983141983150983156 983106983137983150983147983155 983137983150983140 983110983145983150983137983150983139983145983137983148 983123983156983137983156983141983139983154983137983142983156
52
The following aggregate figures reported by the Bank of Russia suggest severaltrends of significance First Chart 32 suggests that household deposits shifted fromRuble deposits to foreign currency pegged (or indexed) during 2008 Second Chart 33illustrates the substantial increase of non-bank overdue debt during second semester
2008
Consequently the financial results and profitability of banks declinedsignificantly during 2008 The greater confidence in deposits with government banksfound abroad suggests that this may have been critical in Russia
Performance data deom 2008-10 provides a clearer picture one that is consistentwith our findings in Brazil State banks appear to have outperformed all other types of
banks except medium and small regional banks The following table reports the averagereturns on assets and returns on equity reported by the Bank of Russia 2008-10
Returns on Assets and Equity by Type of Bank in Russia 2008-9
Return on assets Return on equity 2008 2009 2010 2008 2009 2010
-------------------------------------------------------------------------------------------------------------------State Banks 22 08 24 157 46 148Foreign Banks 18 11 21 146 83 145Large private banks 13 03 11 106 28 84Medium-Small Banks Moscow 15 12 14 68 52 67
Medium-Small Regional Banks 21 12 15 131 65 98--------------------------------------------------------------------------------------------------------------------Source Bank of Russia Bank Supervision Reports 2009 and 2010
8132019 Government Banking and BRICs in the Recent Financial Crisis
httpslidepdfcomreaderfullgovernment-banking-and-brics-in-the-recent-financial-crisis 5357
983106983122983113983107 983111983151983158983141983154983150983149983141983150983156 983106983137983150983147983155 983137983150983140 983110983145983150983137983150983139983145983137983148 983123983156983137983156983141983139983154983137983142983156
53
Further data from the Bank of Russia on the capital adequacy of Banks during2009-10 suggest that foreign banks and large private banks remain less capitalizedagainst risks according to Basel II guidelines albeit at levels almost double thatrecommended by the Bank for International Settlements (80 risk weighted) Although
further analysis is needed this data is consistent from that reported in Brazil thatgovernment banks tend to more cautious and more prudent in terms of placing asidehigher levels of reserves and patrimony against possible losses
Capital Adequacy of Banks by Type of Bank in Russia 2009-10
2009 2010 2011---------------------------------------------------------------------------------------------------------State Banks 184 227 186Foreign Banks 155 196 195Large Private Banks 140 181 155
Medium-Small Banks Moscow 316 312 268Medium-Small Regional Banks 219 241 207Non-Bank Credit Institutions 372 1038 678---------------------------------------------------------------------------------------------------------Source Bank of Russia Bank Supervision Report (Moscow) 2009 p 43
Finally Bank of Russia bank supervision reports also suggest that state banksexpanded their market shares of assets and capital during the years following the globalfinancial crisis While large private banks and foreign banks lost market share of bankassets and bank capital in Russia state banks increased their significant market sharefrom 405 ndash 426 percent and 471-476 percent of assets and capital respectivelyUnfortunately data from previous years and for specific banking groups was notobtained However this data does appear to indicate that our findings of competitiveadvantages and policy alternatives
Number and Market Share by Type of Bank
N Banks Assets Capital---------------------------- ---------------------------- ----------------------------
Type of Bank 2009 2010 2011 2009 2010 2011 2009 2010 2011-------------------------------------------------------------------------------------------------------------------------------State 17 22 27 405 439 458 471 489 473
Foreign 101 106 108 187 183 180 172 169 191Large Private 136 139 131 346 333 305 276 287 269Med-Small Moscow 361 335 317 27 26 26 43 34 35Medi-Small Regional 443 412 372 28 28 27 36 31 29Other Credit Institutions 50 51 57 07 04 04 01 02 03Total 1108 1058 100 100 100 100 100 100-------------------------------------------------------------------------------------------------------------------------------Source Bank of Russia Bank Supervision Report 2009 amp 2010
In sum politics and financial statecraft have led to the realization of significantcompetitive advantage by Russian state banks Sperbank and Vneshtorgbank increasedtheir share of bank assets from 32 percent in 2005 to over 50 percent by 2011 through
mergers and acquisitions and aggressive displacement of foreign banks Whatever thepolitics data from the Bank of Russia suggests that monetary authorities released a
8132019 Government Banking and BRICs in the Recent Financial Crisis
httpslidepdfcomreaderfullgovernment-banking-and-brics-in-the-recent-financial-crisis 5457
983106983122983113983107 983111983151983158983141983154983150983149983141983150983156 983106983137983150983147983155 983137983150983140 983110983145983150983137983150983139983145983137983148 983123983156983137983156983141983139983154983137983142983156
54
series of counter cyclical credit injections during 2008-9 to domestic bankinginstitutions Moreover data suggests that state banks continue to perform at or ahead oflevels reported by regional private and foreign banks The large market share andimproved performance of state banks reported in recent data suggests although the datais sparse that government banks in Russia have also modernized realized competitive
advantages and provided policy alternatives against the impact of financial crisisabroadWe were unable to find evidence of policy making toward social inclusion at the
Bank of Russia or Russian state banks despite the historical trajectory of the Sberbankas a savings bank under communism The context also appears to differ considerably Asurvey of the Zircon Research Group reportedly found that only 15 percent of Russiansretain bank accounts because of mistrust in banks and government This combination ofrealist politics and the realization of competitive advantages by Russian state bankssuggests that theories of economic statecraft in the realist tradition may indeed explainthe domestic developments under study
Conclusion
This paper reports evidence about government bank modernization and financialstatecraft in BRIC countries designed to counter the effects of crisis and shape domesticgrowth Government banks in BRIC countries have contributed to the widely notedadjustment of these economies to global financial crisis and economic downturnContrary to the Washington Consensus that prevailed during much of the 1980s and1990s (that privatization and liberalization especially of banking would free marketforces and deepen domestic financial systems) a quite different process of bank changeappears to have ensued after financial liberalization in the BRICs
Instead of replacement of state banks with private banks government banksremain central agents of domestic credit and growth and have modernized ldquojust intimerdquo The capitalization and realization of competitive advantages by large governmentbanks during the 2000s meant that once the US financial panic spread across capitalmarkets broke highly leveraged private and produced runs on private bank depositspolicy makers in BRIC countries nonetheless retained counter cyclical policyalternatives through their more solid large state banks
These findings counter traditional foci on the private sector individualentrepreneurship and ideals of free markets linked to the political and social advancesrecorded around the world in the last decades We report an anomaly for theories offinancial repression and the Washington Consensus about the virtues of privatization
and liberalization Although largely blamed for reproducing underdevelopment in thepast BRIC government banks averted excesses of private banking that drove creditbubbles such as home mortgages and derivatives in the US And since liberalization ofbanking (we have not adequately discussed how much liberalization occurred in eachcountry) government banks have modernized to compete with private and foreignbanks Government banks have realized competitive advantages and provided policyalternatives These two arguments help explain why BRIC countries have farecomparatively well in the face of financial crisis in core countries
Financial statecraft is therefore at the center of BRIC counter cyclical capacitiesand state planning Brazil Russia India and China fared significantly better thanadvanced and many developing countries in terms of adjusting to credit crunches and
export shocks This is because government banks proved critical interbank credit toretain confidence in domestic banking systems These institutions also presented other
8132019 Government Banking and BRICs in the Recent Financial Crisis
httpslidepdfcomreaderfullgovernment-banking-and-brics-in-the-recent-financial-crisis 5557
983106983122983113983107 983111983151983158983141983154983150983149983141983150983156 983106983137983150983147983155 983137983150983140 983110983145983150983137983150983139983145983137983148 983123983156983137983156983141983139983154983137983142983156
55
policy alternatives for political and social forces Politics shaped adjustment andrecovery through state banks differently in BRIC countries Given the realities of statecentered political realism in Russia the redirection of state banks toward goals ofChinese Five Year Plans and the modernization of the State Bank of India amidst anamorphous federalism the experience of Brazil with democratization and public bank
modernization may stand out (Armijo 2009)Further analysis of savings banks and cooperative banks also will be requiredAs members of the World Savings Bank Institute (a global association of savingsbanks) the Caixa in Brazil SNI and NABARD in India and China Postal Savings Bankappear to have provided access to very large numbers of previously unbanked citizensThis returns to traditional ideas of social banking and the history of savings banks thatwere founded throughout Europe since the late 18 th century The upmarket strategy andexpansion into investment banking and international banking of the Russian Sberbankconstrasts with downmarket strategies of savings banks in Brazil India and China
The financial press has recently reported doubts about bad loans in Chinese statebanks and cast doubt on the financial results posted and reported in this paper
However current estimates of 2-5 percent bad loans in Chinese state banks pale incomparison to the US$1240 billion in bad loans shifted to asset managementcompanies in the mid 2000s before capitalization of these institutions through sale ofshares Critics of state banking in Brazil also point to past levels of bad loans (reaching30-40 percent) because of their capture during military government delayed transitionBut the cost of capitalization and transfer of bad loans from Brazilian state banks alsoremained below US$400 billion and is still contingent on liquidation of assetmanagement companies created in 2001 In any case these numbers are very smallcompared to GAO estimates of US$120 trillion in emergency infusions by USmonetary authorities to banks and financial institutions from 2007-11
These are anomalies for recent market-based banking theory and neo-liberalpolicy designs However they do not run counter to orthodoxy in economics andbanking theory Over the last decades economic reforms (fiscal financial monetaryand banking) have improved transparency and brought public policy and marketexpectations closer However expectations about deregulation and free marketequilibria in banking and finance have succumbed in the face of panic and the stillsobering consequences of crisis The materials presented herein are descriptive and willrequire more careful analysis However given the urgency of searching for alternativedevelopment models and different approaches to financial statecraft in BRIC countriesand beyond we have taken the liberty to present research in initial stages and toprovoke thought along the lines suggested by our kind conveners
8132019 Government Banking and BRICs in the Recent Financial Crisis
httpslidepdfcomreaderfullgovernment-banking-and-brics-in-the-recent-financial-crisis 5657
983106983122983113983107 983111983151983158983141983154983150983149983141983150983156 983106983137983150983147983155 983137983150983140 983110983145983150983137983150983139983145983137983148 983123983156983137983156983141983139983154983137983142983156
56
Appendix on Alternative Banking and Social Inclusion
This appendix describes how ideas about government banking led to further work onalternative banking and social inclusion with help from the Rockefeller FoundationBellagio Center In July 2011 we were able to convene a conference designed to gather
scholars alternative banking executives and representatives from savings andcooperative bank associations to rethink strategies for social inclusion in the globalsouth and attempt to launch a new policy agenda Given the search for alternativestrategies to counter crisis and the advances of stabilization transparency and bankingsupervision in developing and emerging economies we call for alternative bankingcommunities in the global north and south to work together and help shape a new policyagenda for social inclusion Because savings banks credit cooperatives and otheralternative banking and finance institutions have realized competitive advantages andemerged from crisis we can now think beyond We believe that new policies may helpdeveloping and emerging nations redirect large domestic institutions such as postal andsavings banks toward meeting the UN millennium goals to eliminate poverty by 2015
Plans include writing a green paper on Core Principles for Alternative Bankingand Social Inclusion convening events to promote these principles through institutionalsupporters and networks and seeking adoption of these principles at policy venues suchas the World Savings Bank Institute the International Association of CooperativeBanks the Bank for International Settlements the International Financial ReportingStandards foundation the ISO International Standards Organization the Charter forResponsible Business regional development banks and the World Bank We also planto submit an edited volume of scholarly contributions on alternative banking and socialinclusion by year-end 2012 Interested parties are welcome to participate
Institutional supporters and networks include
Institutional SupportersColumbia University School of International and Public Affairs New YorkInstitute for Money Technology and Financial Inclusion University of CaliforniaIrvineKingacutes College Department of Management LondonSatildeo Paulo Business School Getulio Vargas FoundationSecond University of Naples
Networks
Association of Emerging Market Business Schools Satildeo Paulo BrazilCommunity of European Management Schools BrusselsCritical Political Economy NetworkEuropean Association of Co-operative Banks BrusselsGlobal Public Policy Network LondonInternational Cooperative Banking Association BrusselsSocial Science Finance Network AmsterdamSociety for Advancement of Social Economics PhiladelphiaWorld Savings Bank Institute Brussels
8132019 Government Banking and BRICs in the Recent Financial Crisis
httpslidepdfcomreaderfullgovernment-banking-and-brics-in-the-recent-financial-crisis 5757
983106983122983113983107 983111983151983158983141983154983150983149983141983150983156 983106983137983150983147983155 983137983150983140 983110983145983150983137983150983139983145983137983148 983123983156983137983156983141983139983154983137983142983156
Core Principles for Alternative Banking and Social Inclusion
Commitment to End Capital StarvationPromote access to and use of banking and financial services by all through newtechnologies and distribution channels to capitalize assets among the poor
Commitment to Universalize Income Savings Credit and FinanceProvide basic income via ATM cards and mobile banking to reach the poor and opennew channels of access to income savings credit finance insurance and opportunities
Prudent Banking and Regulatory ComplianceAlternative banking seeks to work within regulations guidelines and best practicesrecommended by domestic monetary authorities and international regulatory institutionssuch as the Bank for International Settlement Basel II Capital Risk Guidelines
Corporate Social Responsibility Leadership
Integrate corporate social responsibility into down-market business strategies andinstitutions of representation and democratization
Transparency and AccountabilityPublish annual reports and balance sheets in accord with international best practices offinancial social and sustainability reporting
Leadership in Provision of New Banking Services and Products to the PoorUse competitive advantages in banking and institutional networks to channel moreeffectively capital income and finance to the poor
Generate Sustainable Income and Household Asset AccumulationUse branch offices and new banking technologies to accelerate progress toward UNmillennium goals to eliminate poverty
Universalize Financial EducationPromote financial education to encourage responsible banking and finance and avertpredatory lending and unethical practices
Adopt Cutting Edge Technology and Management Practices to Provide
Competitive Alternative to Private Commercial and Investment Banks
Incorporate electronic card and mobile banking services to better serve the poorContribute to Realization of Bellagio Principles for SustainabilityPromote alternative banking and business practices that contribute to environmentallysustainable income consumption and production as stated in Bellagio Principles forSustainability
Respect and Build on National and Regional DifferencesI d f i l d l l i b ki i i i d i i l
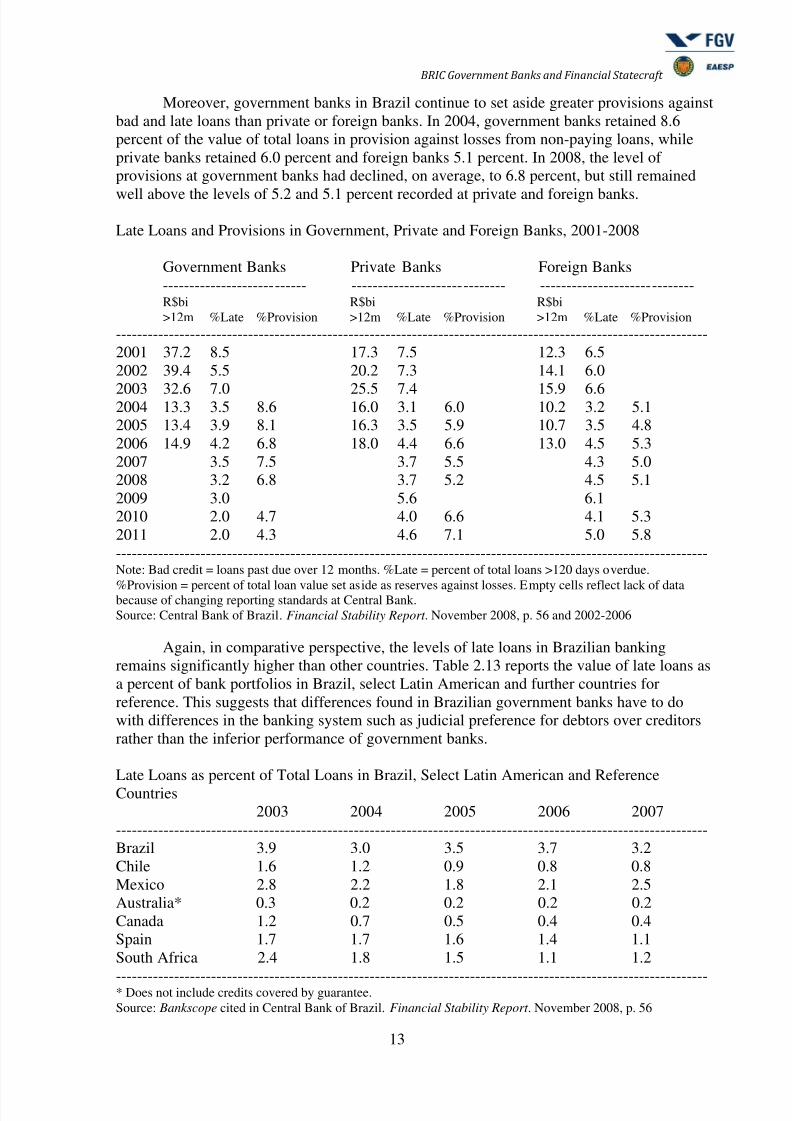
8132019 Government Banking and BRICs in the Recent Financial Crisis
httpslidepdfcomreaderfullgovernment-banking-and-brics-in-the-recent-financial-crisis 1357
983106983122983113983107 983111983151983158983141983154983150983149983141983150983156 983106983137983150983147983155 983137983150983140 983110983145983150983137983150983139983145983137983148 983123983156983137983156983141983139983154983137983142983156
13
Moreover government banks in Brazil continue to set aside greater provisions againstbad and late loans than private or foreign banks In 2004 government banks retained 86percent of the value of total loans in provision against losses from non-paying loans whileprivate banks retained 60 percent and foreign banks 51 percent In 2008 the level ofprovisions at government banks had declined on average to 68 percent but still remained
well above the levels of 52 and 51 percent recorded at private and foreign banks
Late Loans and Provisions in Government Private and Foreign Banks 2001-2008
Government Banks Private Banks Foreign Banks--------------------------- ----------------------------- -----------------------------R$bi R$bi R$bigt12m Late Provision gt12m Late Provision gt12m Late Provision
----------------------------------------------------------------------------------------------------------------2001 372 85 173 75 123 652002 394 55 202 73 141 60
2003 326 70 255 74 159 662004 133 35 86 160 31 60 102 32 512005 134 39 81 163 35 59 107 35 482006 149 42 68 180 44 66 130 45 532007 35 75 37 55 43 502008 32 68 37 52 45 512009 30 56 612010 20 47 40 66 41 532011 20 43 46 71 50 58----------------------------------------------------------------------------------------------------------------Note Bad credit = loans past due over 12 months Late = percent of total loans gt120 days overdue
Provision = percent of total loan value set aside as reserves against losses Empty cells reflect lack of databecause of changing reporting standards at Central BankSource Central Bank of Brazil Financial Stability Report November 2008 p 56 and 2002-2006
Again in comparative perspective the levels of late loans in Brazilian bankingremains significantly higher than other countries Table 213 reports the value of late loans asa percent of bank portfolios in Brazil select Latin American and further countries forreference This suggests that differences found in Brazilian government banks have to dowith differences in the banking system such as judicial preference for debtors over creditorsrather than the inferior performance of government banks
Late Loans as percent of Total Loans in Brazil Select Latin American and ReferenceCountries
2003 2004 2005 2006 2007----------------------------------------------------------------------------------------------------------------Brazil 39 30 35 37 32Chile 16 12 09 08 08Mexico 28 22 18 21 25Australia 03 02 02 02 02Canada 12 07 05 04 04Spain 17 17 16 14 11South Africa 24 18 15 11 12
---------------------------------------------------------------------------------------------------------------- Does not include credits covered by guaranteeSource Bankscope cited in Central Bank of Brazil Financial Stability Report November 2008 p 56
8132019 Government Banking and BRICs in the Recent Financial Crisis
httpslidepdfcomreaderfullgovernment-banking-and-brics-in-the-recent-financial-crisis 1457
983106983122983113983107 983111983151983158983141983154983150983149983141983150983156 983106983137983150983147983155 983137983150983140 983110983145983150983137983150983139983145983137983148 983123983156983137983156983141983139983154983137983142983156
14
Further comparative data confirms that the Brazilian banking system tends to run onmore expensive credit higher returns and profits and higher levels of late and bad loansBanks operating in Brazil also retain higher levels of administrative and personnel costsHowever Brazilian banks also tend to set aside more generous reserves and provisions
against losses These structural characteristics can be seen in the comparative data in the tablebelow The data on government private and foreign banks in Brazil and comparisons suggestthat the Brazilian banking system incurs higher operating costs maintains higher reservesprovisions and capital against losses and risk but nonetheless produces strong returns
Indicators of Bank Efficiency Performance and Provisions in Brazil Select Latin Americanand Reference Countries
Cost Op Exps NPL Provisions EquityIncome Assets Loans NPL Assets
----------------------------------------------------------------------------------------------------------------
Brazil 62 65 41 153 9Argentina 84 41 66 116 12Chile 53 28 10 166 7Colombia 52 59 32 144 11Mexico 58 47 20 232 12US 54 33 07 163 8Spain 56 16 07 313 12----------------------------------------------------------------------------------------------------------------Source World Bank ldquoBrazil The Industry Structure of Banking Servicesrdquo Brasiacutelia June 2007 pp
Comparison of administrative costs in Brazilian banking with levels in other large
Latin American and emerging and reference economies suggest that Brazilian banks retainhigher costs From 2001 through 2005 the value of administrative costs as a percent of bankassets in Brazil declined from 69 percent to 58 percent but remained significantly abovelevels reported from Chile (30 to 27 percent) Mexico (47 to 46 percent) and well abovereference countries such as Australia Canada and Spain (16 36 and 11 percentrespectively) Although time series lacks comparison after 2005 administrative costs inBrazilian banks decline significantly from 58 in 2005 to 42 in 2008
Bank Administrative Costs in Brazil Select Latin American and Reference Countries (Assets)
2001 2002 2003 2004 2005 2006 2007 2008-------------------------------------------------------------------------------------------------Brazil 69 61 60 61 58 55 51 42Chile 30 30 27 27 27Mexico 47 48 46 43 46Australia 17 17 16 16 16Canada 27 27 27 27 26Spain 17 17 16 14 11-------------------------------------------------------------------------------------------------- Adjusted average of total assetsSource Bankscope cited in Central Bank of Brazil Financial Stability Report November 2008 p 56
A final comparison of government private and foreign bank solidity is based onCentral Bank of Brazil estimates of the impact of hypothetical shocks to the Brazilian
8132019 Government Banking and BRICs in the Recent Financial Crisis
httpslidepdfcomreaderfullgovernment-banking-and-brics-in-the-recent-financial-crisis 1557
983106983122983113983107 983111983151983158983141983154983150983149983141983150983156 983106983137983150983147983155 983137983150983140 983110983145983150983137983150983139983145983137983148 983123983156983137983156983141983139983154983137983142983156
15
economy on domestic banks These estimates are based on the revisions of the widely usedValue-at-Risk estimates proposed by Boudoukh Richardson and Whitelaw that adapts theoriginal VaR method developed and commercialised by JP Morgan19
Stress Tests for Impact of Credit Interest Rate and Foreign Exchange Shock on Basel Index
Comparison of Government Domestic and Foreign Banks 2001-2006
2002 2003 2004 2005 2006-------------------------------------------------------------------------------------------------------------
Government 112 104 114 113 109Domestic 112 132 126 121 103Private 103 131 135 108 84-------------------------------------------------------------------------------------------------------------Source Central Bank of Brazil Financial Stability Reports 2002-2006Note Basel Index = Capital risk guideline measure defined by Bank for International Settlements BaselCommittee that recommends 8 percent relation between PR and total assets weighted by risk level Since 2002Central Bank of Brazil minimum requirements of Basel Index remains 11 percent For methods of calculationsee Central Bank of Brazil Financial Stability Report Brasilia 2006 p 76
Central Bank of Brazil tests estimate that in the face of foreign currency valuationand interest rate shock government banks would nonetheless remain at or slightly below thecapital requirements against credit risk recommended by the central bank Again it should benoted that Basel Index levels recommended in the BIS Capital Requirements guidelines forthe Basel Index of banks are 80 while the Central Bank of Brazil has set minimum BaselIndex levels of 110 Given that federal government bank portfolios include more credit thanprivate banks and especially foreign banks the estimate of a shift to 109 in the averageBasle index for federal government banks in the face of a credit shock provides furtherevidence that these financial institutions are solid and their capital reserves sufficient Insum comparison of results for government private and foreign banks in the estimatesreported by the Central Bank of Brazil of the likely impact of a shock to the Brazilianeconomy in terms of interest rates and foreign exchange rates also suggests that governmentbanks appear solid The average Basel Index reported for government banks in this stress testwas 135 above the 110 Central Bank of Brazil guideline and well above the 80 levelsuggested by the BIS
Understanding the capacity of Brazilian banks to cope with shocks and risk is not justa theoretical exercise Since the currency crisis in Mexico during 1994-1995 the newlystabilized currency was tested by shocks from home and abroad Policies first dramaticallyincreased interest rates under a fixed exchange rate regime then freed the real to devalue
under a flexible foreign exchange rate regime in January 1999 The Asian currency crisesduring second semester 1997 led the Central Bank of Brazil to increase benchmark Selicinterest rates to 434 percent in November In August 1998 the declaration of moratorium onforeign debt payments by Russia the central bank to once again increase Selic interest ratesfrom 20 to 40 percent under the fixed exchange rate regime by November of that year Theseshocks from abroad coincided with preparations for national elections during 1998 leadingthe IMF and other official creditors to provide strong support for the Brazilan governmentNonetheless by January 1999 (after the election) market pressure led to the abandonment ofthe fixed foreign exchange rate regime that had served as nominal anchor for economic
19 Calculation first published in Resenha BMampF Vol 122 1998 (described in Central Bank of Brazil
Financial Stability Report 2002 amp 2003 then as Boudoukh Jacob Matthew Richardson RichardStanton amp Robert Whitelaw ldquoMaxVaR Long Horizon Value at Risk in a Mark-to-Market Environmentrdquo Journal of Investment Management 2004Vol 2 No 3 pp 14-19
8132019 Government Banking and BRICs in the Recent Financial Crisis
httpslidepdfcomreaderfullgovernment-banking-and-brics-in-the-recent-financial-crisis 1657
983106983122983113983107 983111983151983158983141983154983150983149983141983150983156 983106983137983150983147983155 983137983150983140 983110983145983150983137983150983139983145983137983148 983123983156983137983156983141983139983154983137983142983156
16
policy since 1994 The real quickly devalued from 121 to 20 against the US dollar by theend of January and led to considerable changes in policy (a flexible foreign exhange rateregime inflation targeting and the implementation of further fiscal reforms) Once the realrevalued from R$22 against the dollar in March to R$166 in April 1999 the governmentmoved to consolidate this new triad of economic policies Since 1999 flexible foreign
exchange markets inflation targeting and fiscal reform have remained in place This suggeststhat Brazilian banks have weathered volatile parameters and large risks during a markedpolitical business cycle One involving the transition from reformist President Cardoso to PTPresident Lula Since recovery of the economy during 2004 the coalition government underPT President Lula has sought to expand the contribution of government banks to accelerategrowth and social inclusion These policies have not undermined economic fundamentals oreroded the institutional foundations of comparative advantage retained by Brazilian federalgovernment banks
In sum the advances of Brazilian banking toward Basel Accord regulations during the1990s and 2000s the adoption of more transparent and timely reporting standards and themodernization of government banks under pressures from liberalization placed federal banks
in a new situation in the face of crisis once it hit the country in 2008 A closer look at the bigthree federal government banks is in order to better understand these changes
The Banco do Brasil
Upon taking office in 2003 President Lula retained the central economic policies of theCardoso administration such as inflation targeting tight fiscal and monetary policy andthe operational independence of the Banco do Brasil However the recovery of investorconfidence during 2003 and the return of stronger growth levels during 2004 led to aperiod of what the Central Bank of Brazil describes as organic growth at the Banco doBrasil From 2004-2008 the Banco do Brasil contributed to the deepning of domesticcredit markets and emerged as leading investment bank at the Bovespa stock marketFurthermore once the Bovespa collapsed credit became short and a sharp downturnensued during 2008 the Banco do Brasil provided emergency loans infusions of capitalthrough stock purchases and the acquisition of small and mid-sized firms and banksunable to weather the sharp decline and lack of credit Although the merger of Itauacute andUnibanco in 2008 displaced the Banco do Brasil as the largest financial institution inLatin America the bank retains powerful institutional foundations of comparativeadvantage and networks that cross Brazilian society politics and markets
The Banco do Brasil also remains at the center of Brazilian politics and policydisputes Indeed leaders of the PT party faction articulaccedilatildeo (articulation) includes
career employees of the Banco do Brasil and presidents of the Brazilian bank workersunion such as Luiz Gushiken and Ricardo Berzioni Both were nominated to ministerialposts by President Silva in January 2003 By August 2003 21 of 33 top positions at theBanco do Brasil had been filled by new representatives of the PT most Banco do Brasilemployees and members of the Brazilian bank workers union Critics decriedpoliticization However the resistance of bank representatives described above topresidential appeals to increase credit during 2003 was followed by more neutralappointments during 2004 When Banco do Brasil President Cassio Casseb Limaresigned in November 2004 (under charges of irregularities in consulting contracts atthe bank) President Lula nominated Rossano Maranhatildeo Pinto a career employee andBanco do Brasil vice president to head the bank Further appointments of PMDB
political leaders to cement support for the PT coalition government were also criticizedas politicization of the bank However Banco do Brasil officials responded that these
8132019 Government Banking and BRICs in the Recent Financial Crisis
httpslidepdfcomreaderfullgovernment-banking-and-brics-in-the-recent-financial-crisis 1757
983106983122983113983107 983111983151983158983141983154983150983149983141983150983156 983106983137983150983147983155 983137983150983140 983110983145983150983137983150983139983145983137983148 983123983156983137983156983141983139983154983137983142983156
17
experienced political leaders of the PMDB brought competitive advantages to the bankbased on their networks that cross the public and private sector These networks andrelations during the second PT coalition government of President Lula also appearsdifferent than the first given the departure from core offices of the presency bylongtime advisors to Lula that came from the Banco do Brasil and bank workers union
By late 2006 only one of seven vice presidents of the Banco do Brasil was a member ofPresident Lulaacutes Workersacute Party (PT)Again Banco do Brasil policies and growth since recovery of the economy in
2004 involved first a period of expansion during four years of growth followed by aturn to counter cyclical lending and finance once financial crisis abroad produced first asevere contraction in credit supply then a sharp economic downturn in fourth quarter2008 Institutional foundations of comparative advantage are behind Banco do Brasilpolicies during both periods First the capitalization of Brazilian firms on the Bovespastock market is closely related to the groups that cross politics government banks thepowerful bank worker labor union the Banco do Brasil employee private pension fundand bank consortia often led by the Banco do Brasil investment banking division (often
joined by the BNDESpar and Caixa investment banking division) Recent developmentsare complex and will require further research However rather than convergence towardprivate banking and a market-centered financial system examination of Banco do Brasilpolicies and market shares during the 2000s suggests that federal government banks notonly remain at the center of politics policy and development strategies but that theseinstitutions have modernized to compete against private and foreign banks
The large scale and scope of the Banco do Brasil has permitted use of the bankfor counter-cyclical lending and leadership in capital markets without deteriorating bankbalance sheets Since 2003 the Banco do Brasil has remained well within domesticbank regulations and Basel Accord guidelines During 2002 and 2003 reforms at theBanco do Brasil sought to reduce costs and increase efficiency ratings Indeed therelation between the Banco do Brasil and President Lula reversed past patterns In the1950s conflicts were between national developmentalist groups at the Banco do Brasiland more orthodox Ministers of Finance In 2003 and once again during the 2008financial crisis differences between President Lula and the Banco do Brasil were thereverse Banco do Brasil management refused to dramatically increase loans in 2003and resisted requests to reduce the price of credit in 2008 In 2003 the caution imposedby political risk perceptions led President Lula to respect the operational autonomy ofthe Banco do Brasil In April 2009 Banco do Brasil President Antonio Francisco deLima Neto was fired after refusing to reduce interest rates on loans This reversal ofpolicy positions from the 1950s suggests in a broader sense a transition from the
macroeconomics of populism to the microeconomics of government banking in the 21
st
century Government banks do not provide easy or all solutions Instead credit andfinance policies are subject to market discipline credit risk analysis and the realities ofbusiness cycles
Review of the Banco do Brasilrsquos balance sheet from 2002-2008 suggests that the bankdeveloped organically from 2002-2007 with gradual increases reflecting the competitiveadvantages at the top of Brazilian banking and finance Policies changed during 2007 and2008 as the credit shortage caused by international financial crisis led to the Banco do Brasilassuming once again lending of last resort functions by extending interbank investments andloans to small and medium sized banks to avert further declines in domestic liquidity TheBanco do Brasil also acquired a 51 percent stake in the Votarantim bank to avert a run on
deposits and possible failure while acquiring Satildeo Paulo state government savings bankNossa Caixa for R$76 billion in 2008 These acquisitions reflect concern about the
8132019 Government Banking and BRICs in the Recent Financial Crisis
httpslidepdfcomreaderfullgovernment-banking-and-brics-in-the-recent-financial-crisis 1857
983106983122983113983107 983111983151983158983141983154983150983149983141983150983156 983106983137983150983147983155 983137983150983140 983110983145983150983137983150983139983145983137983148 983123983156983137983156983141983139983154983137983142983156
18
replacement of the Banco do Brasil as the largest financial conglomerate in Brazil after themerger of Itauacute and Unibanco
Banco do Brasil Balance Sheet Summary 2002-2008 R$ billion
2002 2003 2004 2005 2006 2007 2008 2009 2010 2011Assets --------------------------------------------------------------------------------------------------------Interbank Investments 101 50 27 80 175 434 951Interbank Deposits 76 283 137 209 116 77 242Securities 709 696 734 664 731 752 732Central Bank Deposits 81 186 221 244 281 334 212Loans to Private Sector 89 652 757 885 1178 1463 1810Loans to Public Sector 56 43 41 37 43 24 230Receivables 297 273 312 351 404 548 808Other AssetsTotal Assets 2046 2301 2390 2529 2963 3672 5073Liabilities ---------------------------------------------------------------------------------------------------Deposits 972 1100 1155 1376 1588 1882 2711
M MKT Borrowing 483 400 445 305 492 722 914Treasury amp BNDES 59 74 106 133 143 175 224Shareholder Equity 92 121 141 168 207 242 299Other LiabilitiesTotal Liabilities 2046 2301 2390 2529 2963 3672 5073---------------------------------------------------------------------------------------------------------------- Compulsory deposits for commercial banks according to Central Bank regulationsSource Banco do Brasil Annual Reports Historical Series 2002-2008
From 2002 through 2006 the balance sheet of the Banco do Brasil suggests a periodof growth based on loans to the private sector with deposits and shareholder equityincreasing largely apace After 2006 the balance sheet changes fundamentally with capitalinjections from money market borrowing increasing from R$492 billion in 2006 to R$914billion in 2008 while Banco do Brasil liabilities with Treasury and BNDES increased fromR$143 billion in 2006 to R$224 billion in 2008 The asset side of the balance sheet alsosuggests fundamental change Private sector lending increased from R$1178 billion in 2006to R$1810 billion in 2008 reflecting acquisition of portfolios from Nossa Caixa Interbankinvestments increased from R$175 billion in 2006 to R$951 billion in 2008 while interbankdeposits also increased from R$116 billion in 2006 to R$242 billion in 2008 The counter-cyclical lending strategies of the Banco do Brasil during 2008 also included an increase oflending to the public sector from R$24 billion in 2007 to R$230 billion Banco do Brasilreponses to government credit policy can also be seen in the release of 40 percent of
compulsory deposits retained at the central bank Banco do Brasil deposits at the central bankdeclined from R$334 billion in 2007 to R$212 billion in 2008 ndash freeing this value for loansand investments
Networks and relations during the second government of President Lula appeardifferent than the first given the departure from core offices of the presency by longtimeadvisors to Lula that came from the Banco do Brasil and bank workers union By late 2006only one of seven vice presidents of the Banco do Brasil was a member of President LulaacutesWorkersacute Party (PT) The corporate profile of the Banco do Brasil suggests once again thehybrid character of this government bank one listed on the Bovespa Novo Mercado but withover 65 percent of shares owned by the Brazilian federal government Treasury
8132019 Government Banking and BRICs in the Recent Financial Crisis
httpslidepdfcomreaderfullgovernment-banking-and-brics-in-the-recent-financial-crisis 1957
8132019 Government Banking and BRICs in the Recent Financial Crisis
httpslidepdfcomreaderfullgovernment-banking-and-brics-in-the-recent-financial-crisis 2057
983106983122983113983107 983111983151983158983141983154983150983149983141983150983156 983106983137983150983147983155 983137983150983140 983110983145983150983137983150983139983145983137983148 983123983156983137983156983141983139983154983137983142983156
20
customers in 2008 reached 479 million with the bank retaining 39700 AMTs and 766million bank cards (239 million credit cards and 527 million debit cards) Like the CaixaEconocircmica Federal the Banco do Brasil also processes government payments withretirement and social security payments numbering 745 million transactions during 2008Although this implies administrative costs (and receipts) this also brings customers and
prospective customers into Banco do Brasil branch officesDuring 2008 the Banco do Brasil continued to expand operations form jointventures acquire private and government banks and modernize operations A secondaryoffering of stock in January 2008 granting of shares by VISA to the Banco do Brasil andupgrading of the bank to investment grade BB- by Standard amp Poors in April 2008 suggestthat market orientation of the bank continues during the Lula administration despite counter-cyclical credit policies A Lower Income Segment Department was also created to assumeBanco Popular do Brasil operations along with correspondent banking relations and regionalsustainable development programs The Banco do Brasil also received permission to usesavings accounts for home loans enabling the bank to compete on level ground with CaixaEconocircmica Federal During 2008 the Banco do Brasil also acquired the state government
banks Banco do Piaui Banco de Santa Catarina (33rd largest bank in Brazil with US$30billion assets at year end 2007) and Satildeo Paulo government savings bank Nossa Caixa (12thlargest Bank in Brazil with US$267 billion in assets at year end 2007) In sum the diversecorporate divisions and financial operations of the Banco do Brasil provided policy optionsduring 2008 to counter the credit shortage and help firms and domestic banks to adjust
Banco do Brasil and Private Bank Returns and Capital Adequacy 2002-2009
Basel Index Return on Assets Return on Liquid Assets----------------------------- ----------------------------- -----------------------------BB Itauacute Bradesco BB Itauacute Bradesco BB Itauacute Bradesco
--------------------------------------------------------------------------------------------------------------2002 122 184 179 12 26 20 302 288 2832003 137 198 199 11 28 16 231 297 2282004 152 206 188 13 30 23 240 292 3092005 171 170 173 12 37 26 187 353 2842006 173 171 188 28 31 25 267 288 2632007 156 179 156 14 32 22 222 321 2442008 152 161 169 25 19 16 304 221 2112009 150 165 166 12 13 14 238 182 195-------------------------------------------------------------------------------------------------------------- Annualized first quarter 2009 resultsSource Banco do Brasil Itauacute and Bradesco Annual Reports 2002-2009
Comparison of Banco do Brasil returns and capital adequacy with the two majorprivate Brazilian banks Itauacute and Bradesco suggests that the performance and solidity of theBanco do Brasil remains equal or superior to private banks During 2002 and 2003 thecapital adequacy of the Banco do Brasil and return on assets remained below levels reportedby the two largest Brazilian private banks suggesting the impact of counter-cyclical lendingHowever after 2004 the Basel index of the Banco do Brasil reached 171 far above BISstandards of 80 and Central Bank of Brazil requirements of 110 Furthermore from 2006through first quarter 2009 returns on assets returns on liquid assets and the Basel index ofthe Banco do Brasil exceed levels reported by Itauacute and Bradesco In sum despite providingcounter cyclical credit and despite having been replaced by the Itau-Unibanco merger as the
8132019 Government Banking and BRICs in the Recent Financial Crisis
httpslidepdfcomreaderfullgovernment-banking-and-brics-in-the-recent-financial-crisis 2157
983106983122983113983107 983111983151983158983141983154983150983149983141983150983156 983106983137983150983147983155 983137983150983140 983110983145983150983137983150983139983145983137983148 983123983156983137983156983141983139983154983137983142983156
21
largest Brazilian bank the performance and capital adequacy of the Banco do Brasil remainsat or above levels reported by the two largest private banks
In sum since liberalization of banking and finance and privatization of stategovernment banks during the 1990s the Banco do Brasil has been transformed from directstate owned bank into one of two very large financial conglomerates that dominate domestic
banking in Brazil Instead of retaining easy access to funds at Treasury to cover losses theBanco do Brasil has adopted international corporate governance standards to become listedon the Bovespa Novo Mercado and retains an important role in virtually every aspect ofBrazilian banking and finance Although sale of shares in the 1990s were designed to transfercorporate governance and control of the national bank to the private sector the federalgovernment retains 65 percent of stocks after two sale of stocks capitalized the bank duringthe 2000s The massive size and wide scope of Banco do Brasil networks across bankingfinancial markets political and social forces and business have led the bank to realize recordprofits during the period of growth from 2004-2008 and provide counter-cyclical credit toavert a further decline in industrial activity and the economy as the US and global financialcrisis hit Brazil first with a 50 percent decline in the Bovespa stock market and credit
shortage followed by a steep but short decline in industrial production in late 2008 Thetransparency of Banco do Brasil quarterly reports and advances in Central Bank of Brazilsupervision of domestic banking clarify the new tensions that have emerged during the PTgovernment of President Lula These tensions reflect the modernization and competitiveadvantages of the Banco do Brasil
Caixa Econocircmica Federal (Federal Savings Bank Caixa)
The third largest domestic bank the wholly government owned Federal Savings Bank Caixawas also called on by President Lula during the recent financial crisis to increase the pace ofgrowth provide counter cyclical credit during downturns and to reduce consumer andcorporate interest rates and bank spreads Review of balance sheets and policies since 2001suggest that the Caixa retains its core business in urban development home loans real estatetransfer of funds for government programs and services and lottery administration Howeverinvestment banking management of third party funds and the creation of of new products andservices have both increased profits and increased popular access to banking and socialservices The bank has recorded record profits since R$108 billion (2002) R$16 billion(2003) and R$14 billion (2004) The Caixa became the fourth largest Brazilian investmentbank by 2003 while gaining dealer status from the Central Bank of Brazil in primary andsecondary markets for government securities At year-end 2003 the bank retained anestimated R$767 billion of government paper (over ten percent of government paper) in its
portfolio assets earning over R$135 billion that year Since recovery of the Brazilianeconomy in 2004 the Caixa has reported strong profits and continued to improve thestructure of its balance sheet and converge toward international bank reporting standards
In terms of assets deposit base and the number of employees and branches the datasuggest that the Caixa has emerged from a process of rationalization and downsizing duringthe late 1990s and expanded ldquoorganicallyrdquo since capitalization in 2001 Assets declined fromover US$999 billion in 1997 to US$363 billion in 2002 after reorganization andcapitalization Deposits also declined from US$541 billion in 1997 to US$216 billion in2002 The number of employees and branches declined from 104253 and 2316 to 98971 and1803 respectively but returned to 104934 and 2428 by 2006 After reorganization andcapitalization in June 2001 Basel indexes and the ratio of fixed assets over equity indicate
substantial reform and transition toward international banking standards The Basel Index thatmeasures the adequacy of capital reserves against possible losses and risks increased from
8132019 Government Banking and BRICs in the Recent Financial Crisis
httpslidepdfcomreaderfullgovernment-banking-and-brics-in-the-recent-financial-crisis 2257
983106983122983113983107 983111983151983158983141983154983150983149983141983150983156 983106983137983150983147983155 983137983150983140 983110983145983150983137983150983139983145983137983148 983123983156983137983156983141983139983154983137983142983156
22
135 (49 in March 2001 before capitalization) to reach 278 and remain twice above theCentral Bank minimum of 110 at 252 in 2006 The ratio of fixed assets as a proportion ofequity also declines substantially from 638 at year end 2001 to 197 in 2007
Summary of Caixa Structure and Performance 1995-2007
Assets Profits Deposits Employees Branches Basel FAEquity1995 826 672 503 99866 23161996 907 2351 515 99343 21051997 999 875 541 96300 18031998 948 1693 499 94859 18191999 684 1571 344 94194 19192000 644 1362 322 104253 19212001 436 -1265 298 98971 2013 135 6382002 363 1462 216 106548 2147 146 5372003 521 2617 281 100498 2046 192 413
2004 556 2999 345 100164 2135 202 3612005 806 4852 456 106729 2321 278 2012006 981 4874 567 104934 2428 252 1972007 1409 4485 800 106770 2052 288 1282008 1266 5735 708 103895 2069 206 119
Note Assets amp Deposits = US$billion Profits = US$million Basel = BIS Basel Accord index of capital reserveadequacy FAEquity = Fixed Assets Equity a summary indicator of bank modernizationSource Central Bank of Brazil Top 50 Banks in Brazil available at wwwbcbgovbr
Caixa Annual Reports and transition toward Central Bank and international bankaccounting standards introduce breaks in the time series of financial performance after 2001
However international bank reporting standards have been used by the Caixa since 2005 andthe data provide further view of the policies and performance of the bank Table X reportsreturns on stockholder equity assets Basel solvency index immobilization index provisionsas a percent of credit operations bank efficiency index and coverage of personnel costs Thedata are consistent with the broader comparisons reported in chapter two that suggest highprofits and returns alongside higher levels of provisions and reserves against capital riskReturns on stockholder equity have remained above 20 percent per year reaching 306percent in 2008 Returns on liquid assets remained between 09 percent and 13 percentbelow the average levels recorded by private and foreign banks The Basel Index of the Caixaremained well above the 11 percent level required by the Central Bank declining from 279in 2005 to 206 in 2008
Caixa Performance Indicators 2005-2008
Indicator 2005 2006 2007 2008 2009 2010 2011--------------------------------------------------------------------------------------------------------------------------Return on Shareholder Equity 261 260 226 306Return on Liquid Assets 11 11 09 13Basel Solvency Index 279 253 289 206Immobilization Index 201 197 129 120Provisions as Credit Operations 101 98 91 86Efficiency Index 645 642 755 718Coverage of Personnel Costs 925 896 943 868
---------------------------------------------------------------------------------------------------------------------------Source Caixa Econocircmica Federal Relatoacuterios de Administraccedilatildeo 2005-2011
8132019 Government Banking and BRICs in the Recent Financial Crisis
httpslidepdfcomreaderfullgovernment-banking-and-brics-in-the-recent-financial-crisis 2357
983106983122983113983107 983111983151983158983141983154983150983149983141983150983156 983106983137983150983147983155 983137983150983140 983110983145983150983137983150983139983145983137983148 983123983156983137983156983141983139983154983137983142983156
23
The immobilization index of the Caixa also declined from 201 percent in 2005 to120 percent in 2008 suggesting transition toward standard levels of international bankingHowever the value of provisions as a percent of credit operations remains much higher thaninternational bank practices albeit declining from 101 percent in 2005 to 86 percent in2008 Finally both the substantial increase in efficiency index from 645 to 718 percent
suggests that the Caixa has distanced further from international private bank levels that tendto approach 500 percent This has resulted in the declining level of coverage of personnelcosts and indicates the comparatively larger organizational structure and less use ofoutsourced labor at the Caixa
Caixa Deposits and Sources of Funds 2005-2008 R$million
2005 2006 2007 2008 2009 2010 2011----------------------------------------------------------------------------------------------------------------Bank Deposits 692 863 1155 1320Savings Deposits 5328 6006 7560 9255Mid-Term Savings Deposits 3873 4219 4136 4862
Certificates (1270) (1412) (1244) (1831)Escrow (2602) (2806) (2891) (3031)
Funds and Programs 794 1034 1307 1100Other 009 015 019 013Caixa Total 10690 2139 14179 6552Bank System Total 68268 78148 92672 27482Caixa Deposits as Total (156) (155) (1531) (129)----------------------------------------------------------------------------------------------------------------Source Caixa Econocircmica Federal Relatoacuterios de Administraccedilatildeo 2005-2008
The liability side of Caixa balance sheets from 2005-8 suggests that the bank hasdistanced itself from reliance on official savings programs and funding toward consumerbank and savings deposits Bank deposits increased from R$69 billion in 2005 to overR$132 billion in 2008 Savings deposits increased from R$532 billion in 2005 to overR$925 billion in 2008 Furthermore the increase of mid-term savings deposits originatedfrom sale of savings certificates instead of escrow held by the Caixa the latter subject to
judicial review and removed from balance sheets in 2008 The value of funds deposited at theCaixa from government funds and programs increased from R$79 billion in 2005 to R$110billion in 2008 although it remains less than ten percent of total deposits In terms of totalvalue of deposits and savings the Caixa increased total value of deposits from 107 billion toover 165 billion from 2005-8
Caixa Loans 2005-8 R$ million2005 2006 2007 2008 2009 2020 2011
----------------------------------------------------------------------------------------------------------------Commercial 14652 16329 19134 28854
Consumer 8925 9474 11063 13747Business 5727 6854 8071 15107
Home 20208 26113 32475 45075Sewage and Infrastructure 1646 2556 3585 5445Other 690 691 694 689Risk Provision -3773 -4469 -5090 -6900Total Caixa Loans 37195 45689 55888 80062----------------------------------------------------------------------------------------------------------------Source Caixa Econocircmica Federal Relatoacuterios de Administraccedilatildeo 2005-8
8132019 Government Banking and BRICs in the Recent Financial Crisis
httpslidepdfcomreaderfullgovernment-banking-and-brics-in-the-recent-financial-crisis 2457
983106983122983113983107 983111983151983158983141983154983150983149983141983150983156 983106983137983150983147983155 983137983150983140 983110983145983150983137983150983139983145983137983148 983123983156983137983156983141983139983154983137983142983156
24
In terms of lending the data suggests that the primary focus of the Caixa on homeloans continued during the late 2000s although substantial increases in commercial lendingfor consumer credit and businesses suggest the diversification of the Caixa across creditmarkets Since 2005 Caixa lending to consumers and business increased from R$89 billionto R$137 billion and from R$57 billion to R$151 billion respectively in 2008
And unlike the high levels of bad and late credit reported during the adjustment to theend of high inflation in 1994-6 and financial crises (1994-5 1997 1998 1999 2001 2003)the level level of late loans at the Caixa fell substantially during the years of economicgrowth and credit expansion from 2006-2008 The percent of late over total loans at the Caixafell from 68 percent in 2006 to 40 percent in 2008 for commercial loans generally and from62 percent to 59 percent for consumer loans and 75 percent to 22 percent for loans tobusiness The value of late home loans as a percent of total home loans also fell from 31 to17 percent in 2008
Caixa AA-H Credit Classification 2001-8
Days Prov-Late ision 2001 2002 2003 2004 2005 2006 2007 2008 2009 2010 2011
---------------------------------------------------------------------------------------------------------------------------------------AA lt15 0 59 56 66 63 54 50 63 94A lt15 05 243 264 313 288 393 435 401 333---------------------------------------------------------------------------------------------------------------------------------------B 15-30 1 127 126 137 139 143 158 206 271C 31-60 3 203 166 145 169 167 192 194 192D 61-90 10 178 261 207 217 133 60 45 33---------------------------------------------------------------------------------------------------------------------------------------E 91-120 30 18 19 20 20 22 13 09 07F 121-50 50 49 15 15 14 10 07 07 07G 151-80 70 15 08 09 10 08 10 10 09
H gt180 100 104 87 85 77 68 72 61 51R$billion 2094 2353 2614 3016 3855 4736 5739 818---------------------------------------------------------------------------------------------------------------------------------------Source Caixa Annual Reports 2002-2008
The credit risk matrix of Caixa loans from 2001 to 2008 confirms this trend ofimprovement (See above table) The data also provide evidence of greater transparency andthe improvement of bank reporting and accounting standards as well as Central Banksupervision of banks Instead of two categories of credit (good = all loans up to 90 daysoverdue bad = loans over 90 days overdue) the Central Bank of Brazil has adoptedinternational standards of credit classification (from AA to H) and imposed regulations that
banks increase or decrease provisions according to the distribution of loans in thesecategories The scale of provisions required by the Central Bank vary from zero percentagainst loans classified as AA to provision of 100 percent of loan values for credits classifiedas H that is to say over 180 days late
The percent of loans over 180 days late has decreased from 104 percent of total in2001 to 51 percent in 2008 Furthermore all categories of late payment except for loansbetween 15-30 days late decreased significantly from 2001 through 2008 In comparisonloans classified as AA (paid and guaranteed) and A (paid on time) increased from 59 percentto 94 percent and 243 percent to 333 percent of total loans The only category of late loansthat increased over the period is that of loans 15-30 days overdue from 127 percent to 271percent of total
The central argument of this study is that Brazilian federal government banks retaininstitutional foundations of competitive advantage over private and foreign banks Further
8132019 Government Banking and BRICs in the Recent Financial Crisis
httpslidepdfcomreaderfullgovernment-banking-and-brics-in-the-recent-financial-crisis 2557
983106983122983113983107 983111983151983158983141983154983150983149983141983150983156 983106983137983150983147983155 983137983150983140 983110983145983150983137983150983139983145983137983148 983123983156983137983156983141983139983154983137983142983156
25
data that suggests this advantage can be seen in the increasing volume and market share ofthe Caixa in debit and credit cards The number of Caixa debit cards increased from 224million in 2002 to over 482 million in 2008 with Caixa market share of debit cards increasedfrom 196 percent ot total card market in 2002 to peak at 230 percent in 2005 and remainingat 219 percent of the total number of debit cards in Brazil in 2005
Two examples illustrate the institutional foundations of comparative advantage of theCaixa in the card payment industry First like other banks in Brazil the Caixa shares anagreement with Visa for payment processing However unlike other banks in Brazil theCaixa was contracted by the federal government to distribute ATM citizenship cards torecepients of federal government family grants and other transfer programs Apparentlywithout seeking approval the Caixa stamped its brandname on the federal government ATMcitizenship card and has continued to do so despite charges of unfair competition fromprivate domestic banks Furthermore a Caixa request to transform its 110 million ATMcitizenship cards into bank cards currently pending at the Central Bank would dramaticallyincrease the number of bank card holders in Brazil (1824 million at year end 2007)
Caixa Debit and Credit Card Market Shares 2002-2008
Million Debit Cards Million Credit Cards MillionCaixa Total Mkt Caixa Total Mkt Interbank Checks
----------------------------------------------------------------------------------------------------------------2002 224 1142 (196) 16 407 (39) 229502003 280 1254 (223) 18 440 (40) 213602004 320 1491 (213) 20 535 (37) 196702005 377 1639 (230) 25 675 (37) 183902006 384 1744 (220) 31 952 (32) 162202007 400 1824 (219) 39 1177 (33) 144902008 482 42----------------------------------------------------------------------------------------------------------------Source Central Bank of Brazil Diagnoacutestico do Sistema de Pagamentos de Varejo do Brasil Adendo Estatiacutesticondash 2007 p 9 and Caixa annual reports 2003-2008
Having reviewed the Banco do Brasil and Caixa a brief look at the counter-cyclicalpolicies and performance of the third Brazilian federal government bank ndash the BNDES ndash is inorder
Banco Nacional de Desenvolvimento Econocircmico e Social (National Bank for Economic
and Social Development BNDES)
The BNDES is a paradigmatic development bank The trajectory of the BNDES involves asequence of policies and financial practices that have shaped Brazilian development Duringthe 1950s the BNDE supplied direct credits for transportation electric energy infrastructureand steel production During the 1960s the bank diversified under financial reforms Duringthe 1970s the BNDE acted to complete state-led import substitution industrialization bychanneling foreign finance and forced savings into capital goods project lending and regionaldevelopment programs During the 1980s the bank shifted away from public investmentunder pressure of fiscal crisis and foreign debt During the 1990s the BNDES became agentfor the privatization of state owned enterprises The BNDES remained virtually the onlysource of long-term finance during a decade of financial crises in emerging markets (1994-2003) Since 2000 the bank has shifted toward ldquosecond generationrdquo reforms designed tofinance the private sector and free market forces deepen domestic capital and equity markets
8132019 Government Banking and BRICs in the Recent Financial Crisis
httpslidepdfcomreaderfullgovernment-banking-and-brics-in-the-recent-financial-crisis 2657
983106983122983113983107 983111983151983158983141983154983150983149983141983150983156 983106983137983150983147983155 983137983150983140 983110983145983150983137983150983139983145983137983148 983123983156983137983156983141983139983154983137983142983156
26
and lend to small medium and micro-enterprises Since 2004 capital inflows and a boomingdomestic stock market have reinforced the capacity of the BNDES to underwrite long-terminvestments and transform large Brazilian firms into multinational corporations Since 2007BNDES President Coutinho has pursued a full service approach attempting to help star-upsmall and medium firms provide funds to expand successful firms and participate in venture
capital funds to help enterprises transit toward corporate governance standards and initial orsecondary offerings of stock on the Bovespa exchange In 2008 as financial crisis led to ashortage of credit collapse of share prices and sharp decline in industrial production byfourth quarter 2008 the BNDES also provided lending of last resort to major Braziliancorporations while retaining long term goals for massive investments in deep sea petroleumproduction
BNDES Market Share of Interbank and Non-Bank Loans 1995-2008 US$ Billion
Interbank Loans Non-Bank Loans------------------------------------------ ------------------------------------------
BNDES Mkt Total BNDES Mkt Total-----------------------------------------------------------------------------------------------------------1995 156 (324) 481 80 (38) 20711996 181 (354) 511 109 (49) 21981997 197 (278) 707 145 (68) 21031998 216 (355) 608 230 (113) 20201999 204 (410) 497 150 (35) 14282000 243 (439) 553 152 (96) 15772001 259 (504) 515 145 (104) 13912002 233 (443) 525 137 (130) 10512003 261 (419) 622 200 (141) 14152004 306 (408) 749 218 (122) 17862005 343 (373) 918 277 (113) 24312006 388 (350) 1106 329 (102) 32312007 524 (335) 1563 432 (88) 48852008 530 (493) 1073 456 (96) 4743200920102011-----------------------------------------------------------------------------------------------------------Source Central Bank of Brazil Top 50 Banks 1995-2008
Revew of BNDES lending since 1995 suggests the realization of competitiveadvantages typical of a large centralized development bank Contrary to the extensive branchoffice networks retained by the Banco do Brasil and Caixa the BNDES retains under 1900employees (compared to 105000 at Caixa) in the Rio de Janeiro and four regional officesSince 1995 the BNDES increased its market share of non-bank loans from R$80 billion (38percent) to R$200 billion (141 percent) during the economic downturn risk aversion andcredit shortage in 2003 After 2003 the BNDES market share of loans to non-financialentities decreased to 88 percent of total loans albeit increasing during 2008 to 96 percentThis suggests that the BNDES has increased its market share of lending to non-financialsector since liberalization of the industry and privatization of state government banks
8132019 Government Banking and BRICs in the Recent Financial Crisis
httpslidepdfcomreaderfullgovernment-banking-and-brics-in-the-recent-financial-crisis 2757
983106983122983113983107 983111983151983158983141983154983150983149983141983150983156 983106983137983150983147983155 983137983150983140 983110983145983150983137983150983139983145983137983148 983123983156983137983156983141983139983154983137983142983156
27
BNDES inter-bank lending also increases substantially Since the Real Plan endedinertial inflation in 1994 the BNDES has expanded its market share of interbank lendingfrom 156 billion (324 percent) in 1995 to 530 billion (493 percent) in 2008 during creditshortage and stock market collapse During previous years of financial crisis and economicreversals the BNDES also increased interbank lending significantly For example during the
1999 and 2001 crises BNDES interbank lending increased to 410 percent and 504 percentof total This marked presence in interbank loan market reflects the role of the BNDES inproviding indirect lending to targeted sectors through private foreign and other governmentbanks in Brazil
BNDES Loan Approvals by Program 1995-2007 R$ Billion
Direct Lending 1999 2000 2001 2002 2003 2004 2005 2006 2007 2008 2009--------------------------------------------------------------------------------------------------------------------------------------Finem 51 55 68 133 79 114 132 145 220 285Capital Markets 16 19 09 08 09 06 20 34 35 104Export-Import 23 34 39 77 63 56 67 40 13 32
Sub-Total 91 109 118 219 153 177 220 221 269 424Percent Total (505) (474) (468) (585) (456) (447) (469) (430) (415) (464)
Indirect Lending--------------------------------------------------------------------------------------------------------------------------------------Finem 31 40 37 16 12 16 18 27 51 60Finame 16 25 33 40 53 66 93 107 170 221Finame Agro 07 13 18 30 28 45 21 14 20 27Finame Leasing 00 000 02 02 03 02 04 06 14 16Export-Import 14 23 20 40 56 54 73 97 67 95BNDESautom 18 17 22 24 27 34 36 35 50 55Sub-Total 89 120 134 154 182 220 249 292 379 484Percent Total (495) (526) (532) (415) (544) (553) (531) (570) (585)(536)
BNDES Total 180 230 252 374 335 398 469 513 648 908----------------------------------------------------------------------------------------------------------------Source BNDES statistics by modality available on wwwbndesgovbr
Review of BNDES finance by program suggests the evolution of credit policies from1995 through 2008 and increasing reliance on indirect lending through other financialintermediaries The three major programs of direct finance Financiamento aEmpreendimentos (Business Finance Finem) Mercado de Capitais (Capital Markets) andExport-Import finance remained between 505 percent and 415 percent of total BNDESlending with the exception of 2002 Indirect lending through six broad programs remained
between 495 percent and 585 pecent of total BNDES lending with the exception of 2002Indirect lending programs include Finem business lending Financiamento de Maquinas(Machine Finance Fineme) with agricultural and leasing modalities Export-Import financingand BNDES automatic lending provisions
These trends suggest the realization of competitive advantages over private andforeign banks in Brazil BNDES long term interest rates remained substantially lower thanSelic benchmark overnight inter-bank interest rates throughout this period while the lowercost of small staff and operations of the BNDES made lending at these rates viable Anothercompetitive advantage of the BNDES over private and foreign banks is the developmentbankacutes mandate as manager of funds from the forced savings fund Fundo de Amparo ao
Trabalhador (Worker Asssistance Fund FAT) Constitutionally mandated investments inproductive activities (not government bonds) increased from R$31 billion in 2000 to R$101
8132019 Government Banking and BRICs in the Recent Financial Crisis
httpslidepdfcomreaderfullgovernment-banking-and-brics-in-the-recent-financial-crisis 2857
983106983122983113983107 983111983151983158983141983154983150983149983141983150983156 983106983137983150983147983155 983137983150983140 983110983145983150983137983150983139983145983137983148 983123983156983137983156983141983139983154983137983142983156
28
billion in 2008 comprising 170 percent of BNDES liabilities This means that 170 percentof BNDES finance and lending is based on long-term deposits that provide no liquidity riskThis provides a competitive advantage over private and foreign banks
A closer look at BNDES lending by sector suggests that the bank still focuses
primarily on industry and infrastructure Despite the adoption of second generation reformsthat seek to free market forces and accelerate innovation and productivity through small andmedium enterprises BNDES lending still focuses on large scale industrial and long-terminfrastructure finance In this respect the BNDES embodies a persistent need in developingeconomy for state-led development banking along the lines emphasized by Lewis Myrdaland development economists 50 years ago This traditional sense of commanding heights thusstill captures the role of the BNDES in Brazilian political economy Despite more than twodecades of privatizations financial liberalization bank reforms and a variety of fiscalfinancial and economic reforms that have substantially modernized the domestic Brazilianeconomy and freed market forces the BNDES remains the single most important source forlong-term finance and credit The capitalization of the Bovespa stock market from 2004-
2008 for the first time in Brazilian history reduced the virtual monopoly of BNDES overlong term finance
BNDES Operations approved and invested by Sector 1998-2007 R$billion
1998 1999 2000 2001 2002 2003 2004 2005 2006 2007Industry ----------------------------------------------------------------------------------------------------------------------------approved 96 79 126 152 171 163 145 290 395 402invested 76 84 104 132 174 161 158 234 272 306
Infrastructure ----------------------------------------------------------------------------------------------------------------------approved 116 69 110 65 161 149 137 186 240 369invested 83 66 86 75 130 100 152 171 170 209
Other--------------------------------------------------------------------------------------------------------------------------------approved 18 47 40 54 79 93 117 69 108 126investedTotal --------------------------------------------------------------------------------------------------------------------------------approved 230 195 276 271 411 404 379 545 743 897invested 190 181 230 252 374 335 398 470 513 617
----------------------------------------------------------------------------------------------------------------Source BNDES Annual Reports 2003-2008 and testimony of BNDES President to Congress March 2009
Long-term investments have produced substantial profits at the BNDES The bank hasrecorded profits each year since 1999 increasing from over R$600 million in 1999 overR$32 billion during 2005 reaching over R$73 billion in 2007 The long-term character of
BNDES finance stands in stark contrast to policies at private banks Contrary to strategy ofprivate and foreign banks to trade and hold government paper described in chapter three theBNDES suspended purchase and trading in government paper because of constitutionalmandates to contribute to development and employment Furthermore the turn to capitalmarkets at the BNDES has provided substantial returns since 2004
However this does not mean that BNDES lending protected unproductive industriesInstead of wasting resources to unnecessarily bail out firms or provide crony credit highreturns and strong profits at the BNDES suggest that lending was sound Standard indicatorsof bank performance asset quality and capital reserves against credit and capital risk provideempirical control for this All these measures suggest that the BNDES weathered the periodof adjustment and sustained counter-cyclical investment policies without placing resources atrisk beyond Central Bank of Brazil regulations and BIS guidelines And returns have
8132019 Government Banking and BRICs in the Recent Financial Crisis
httpslidepdfcomreaderfullgovernment-banking-and-brics-in-the-recent-financial-crisis 2957
983106983122983113983107 983111983151983158983141983154983150983149983141983150983156 983106983137983150983147983155 983137983150983140 983110983145983150983137983150983139983145983137983148 983123983156983137983156983141983139983154983137983142983156
29
increased since recovery in 2004 BNDES participation in the booming Bovespa stock marketsince 2003 has provided record returns
The BNDESpar subsidiary that invests in capital markets has also recorded strongreturns during the period of economic growth and into the 2008 financial crisis BNDESparreturns on liquid assets increased from 75 percent in 2004 to 277 percent in 2007 declining
to 245 percent in 2008 Average returns on assets and stock holdings also remained highbuilding the assets held by the BNDESpar subsidiary from 141 billion in 2005 to 359 billionin 2008
This increased participation of the BNDES in capital markets involves new relationsand networks across government private sector labor unions the private pension funds ofgovernment bank and government enterprise employees and financial markets By 2007BNDES participation in stockholding and mutual funds reached across 261 forms and 25mutual funds totaling over R$910 billion reals The BNDES thereby retains broad portfoliothat represents institutional foundations of comparative advantage Furthermore unlike thepolicy of private and foreign banks to trade and hold high interest rate paying short termgovernment paper during the sudden stop of foreign finance and downturn in the Brazilian
business cycle (2002-3) the BNDES expanded credit operations and reduced financialoperations in secondary markets for indexed government paper This countered the perverseimpact of the liquidity preference among private and other government banks that increasedmarket pressures and led to shorter terms and higher cost of Brazilian government debt
BNDES aversion of government paper is required by constitutional mandate tomanage forced savings funds in ways that generate employment and income As noted alarge part of BNDES resources (liabilities) are from domestic official savings programs Thevalue of FAT resources increased from R$492 billion in 2003 to R$662 billion in 2005while the PIS-Pasep fund remained at approximately R$200 billion Foreign capital has alsobeen channeled to the BNDES through multilateral agencies and foreign bond issues Foreignloans to the BNDES have declined Multilateral agencies provided R$70 billion in 2003increased funding to R$129 billion during 2004 and continued to provide R$107 billion tothe BNDES during 2005
Comparison of BNDES structure and performance with development banks abroadsuggests both the large scale and scope of BNDES operations and controls formismanagement and political abuse of the bank In 2007 BNDES total assets are almostdouble the value reported by the Inter-American Development Bank (IADB) over frac12 thevalue of total assets held by the World Bank and almost ten times the value of assets held bythe French government development bank CAF Furthermore profits and loans from theBNDES far exceeded all three institutions The US$330 billion in loans reported by theBNDES far exceed the US$67 billion from the IADB the US$110 reported by the World
Bank and US$58 billion reported by the CAF BNDES profis returns on assets and return onliquid patrimony also far exceeded those reported by these three development banks thatserve as comparative control over performance and policies at the BNDES Finally lateloans at the BNDES remained at 011 percent of total loans well below levels reported by theWorld Bank comparable to the 010 percent reported by the IADB while considerably abovethe 001 percent reported by CAF
8132019 Government Banking and BRICs in the Recent Financial Crisis
httpslidepdfcomreaderfullgovernment-banking-and-brics-in-the-recent-financial-crisis 3057
983106983122983113983107 983111983151983158983141983154983150983149983141983150983156 983106983137983150983147983155 983137983150983140 983110983145983150983137983150983139983145983137983148 983123983156983137983156983141983139983154983137983142983156
30
Comparison of BNDES and Regional Development Banks 2007 US$ billion
BNDES IADB World Bank CAF----------------------------------------------------------------------------------------------------------------Total Assets 1144 699 2080 125
Liquid Patrimony 140 203 399 41Liquid Profits 38 01 -01 04Desembolsos 339 67 110 58Credit Portfolio 928 479 978 95Capitalization percent 123 291 192 328Return on Assets percent 38 47 na 36Return on PL percent 332 07 na 105Late Loans percent 011 010 086 001----------------------------------------------------------------------------------------------------------------Source BNDES Annual Report 2007
The large scale of BNDES lending and finance make it possible for governmentpolicy to provide counter cyclical credit to avert or ameliorate economic downturns andsubstitute private and foreign credit shortages In March 2009 testimony to Congress ongovernment policies during financial crisis BNDES President Coutinho argued that bankpolicy was to reduce the cost and increase the supply of credit Resources for counter cyclicallending during 2008-2009 came from Treasury loans to BNDES released by provisionaldecrees 439 and 414 summing R$175 billion transfer of R$60 billion in CVS funds sale ofFGTS Investment Fund and bank certificates summing R$170 billion Furthermore the thirdphase of conditional credit facility shared by Inter-American Development Bank and theBNDES provided the last tranch of a total US$60 billion for BNDES operations
Two further means were used by the BNDES to infuse capital during the collapse of
the stock market and shortage of credit during 2007-8 The counter cyclical policies of theBNDES can also be seen in the over two fold increase of BNDES holdings in private equityand investment funds Table 512 reports the value of private equity and investment fundholdings of the BNDES in 2007 and 2008 BNDES funds in private equity and mutual fundsincreased from R$4038 million in 2007 to over R$10 billion in 2008 The capitalization ofmutual funds and private equity firms by the BNDES also played an important countercyclical role during this period
BNDESpar Shareholding 2007-8 R$million
Percent Value ValueShares 2008 2007
----------------------------------------------------------------------------------------------------------------Ameacuterica Latina Logiacutestica 106 6386 -Aracruz 55 1292 1292Banco do Brasil 25 10854 12752Bom Gosto (2) 345 2458 -Brasil Telecom Part 30 1666 1958Braskem 52 2275 2432Brenco 209 1400 -CEG 345 1406 -CESP 57 2347 1397Coteminas 103 1150 1340
CPFL Energia 62 6081 5506Cia Sideruacutergica Nacional 36 1513 2686CVRD 40 15082 7098
8132019 Government Banking and BRICs in the Recent Financial Crisis
httpslidepdfcomreaderfullgovernment-banking-and-brics-in-the-recent-financial-crisis 3157
983106983122983113983107 983111983151983158983141983154983150983149983141983150983156 983106983137983150983147983155 983137983150983140 983110983145983150983137983150983139983145983137983148 983123983156983137983156983141983139983154983137983142983156
31
ELETROBRAacuteS (1) 118 22400 22400EMBRAER 50 1096 1096Gerdau 35 1533 490Independecircncia 139 2500 -JBS 130 14722 11370Klabin 202 5621 -
Light 336 8225 -Marfrig 146 8176 1020MPX Mineraccedilatildeo 26 1791 1791Ouro Fino 200 1057 840Paranapanema 175 1252 08Petrobraacutes 76 10226 10226Rede Energia SA 253 2633 -Tele Norte Leste Participaccedilotildees 16 1645 1645Valepar 97 26254 15585Subtotal 163055 102941Other firms 12223 12606Total 175278 115548----------------------------------------------------------------------------------------------------------------
Source BNDESpar Financial Statements 2008 pp
The BNDES also holds blocks of shares in many major Brazilian corporationsthrough its participation subsidiary BNDESpar Comparing value of investments in 2007 and2008 suggests that large purchases capitalized firms precisely as financial crisis and downturnin Bovespa stock market made it difficult for firms to find working capital Table X reportsthe percent of total company shares held by the BNDES and their respective market values(adjusted for risk of future losses) at year end 2007 and 2008 During this year of extremelyshort and expensive credit in Brazil caused by the international financial and banking crisisthe BNDES increased shareholding by over R$60 billion reals in 28 private Brazilianenterprises Further shareholding classified as X in Five firms (Bertin 269 Brasiliana 538
Copel 239 Rio Poliacutemeros 250 Telemar 313) Once again the BNDES provided access tocapital for firms caught in the sudden credit crunch and stock market collapse unable to meetobligations or raise funds through equity issues or commercial bank credit This countercyclical role of government banks has been critical in Brazil since the 19 th century
BNDESpar Private Equity and Fund Participation 2007-2008 R$million
Fund Manager 2008 2007-------------------------------------------------------------------------------------------------------------------------Brasil 21 Dynamo 46 60PROT Mellon Financial Services 4628 -
Logiacutestica Brasil Bradesco 135 -Fire BrasilPrivate 269 250FIPGG Governanccedila amp Gestatildeo Inv 289 311Opportunity Equity Partners Mellon Financial Services 1046 578Brasil Energia Bradesco 1184 655InfraBrasil ABN-Amro 677 251Rio Bravo Cinema Rio Bravo 116 110Brascan Petro amp Gaacutes Bank Brascan 136 113AG Angra Infra-Estrutura Bradesco 380 301Satildeo Paulo Metro Fund Bradesco 791 831Other Funds 653 572Total 10356 4038---------------------------------------------------------------------------------------------------------------------------
Source BNDESpar Financial Statements 2008
8132019 Government Banking and BRICs in the Recent Financial Crisis
httpslidepdfcomreaderfullgovernment-banking-and-brics-in-the-recent-financial-crisis 3257
983106983122983113983107 983111983151983158983141983154983150983149983141983150983156 983106983137983150983147983155 983137983150983140 983110983145983150983137983150983139983145983137983148 983123983156983137983156983141983139983154983137983142983156
32
Finally Brazilian federal government triennial plans include investment targets by theBNDES If current plans are compared to 2004-7 investments several structural changes inBNDES lending appear First BNDES plans for Oil and Petroleum production reveal aprofound change for Brazilian political economy In 1990 roughly 45 percent of oilconsumed in Brazil was imported In 2007 before oil price increased reversed the balance
Brazil reported domestic production levels sufficient to meet domestic consumptionFurthermore discoveries of substantial deep sea oil reserves have led the BNDES to planmassive investments involving Petrobras and other global petroleum firms For the 2009-2012 period investments in petroleum and gas (R$2697 billion) Petrochemicals (237) andEthanol (197) sum to over R$3130 billion
BNDES Triennial Investment Plans 2004-2012
2004-7 2007-10 2008-11 2009-12----------------------------------------------------------------------------------------------------------------Petroleum amp Gas 1472 1836 2028 2697
Mining 472 527 813 480Petrochemicals 64 174 264 237Steel 198 371 312 245Automotive 150 176 264 235Electronics 143 156 140 240Ethanol 166 205 205 197Paper amp Celulose 104 200 274 90Health 51 46 51 80Industry Total 2816 3802 4437 4501----------------------------------------------------------------------------------------------------------------Source BNDES Annual Reports 2002-2006
It is of note that President Dilma Roussef was instrumental in reducing the targets for2009-12 in petroleum and gas given indications that Petrobras and existing framework foroffshore oil prospecting and production proved unable to increase investments accordingly
The BNDES also retains a presence in government projects by providing managementassistance During 2008 BNDES staff provided management support for implementation of192 projects involving R$710 billion of total R$142 billion PT government growthacceleration projects BNDES staff also participated in the design management andimplementation of President Lularsquos Poliacutetica de Desenvolvimento Produtivo (Policy forProduction Development) involving R$2100 billion targeting production chains designed tomaximize employment and regional development benefits Finally the BNDES was alsocharged to create and co-manage a Fundo Amazonia with the Ministry of Environment toprovide incentives to reduce deforestation of the Amazon region BNDES Plans for 2009include completion of concession for construction of high speed train line and service for Riode Janeiro-Satildeo Paulo corridor two blocks of highway concession sales involving three majorhighways in each block of sales sale of management concessions for regional airports andthe reorganization of INFRAERO federal government airport management company
These policies reflect the goal of BNDES policy to launch firms on the stock marketrather than maintain direct credit and finance Exceptions during 2008 involve Auto andEthanol industies both for strategic and broader policy reasons Given the sharp downturn inauto sales during fourth quarter 2008 the BNDES provided significant lending to avert
further downsizing or failure of auto companies in Brazil Given the current globalredistribution of automobile production BNDES policies are designed to help the Brazilian
8132019 Government Banking and BRICs in the Recent Financial Crisis
httpslidepdfcomreaderfullgovernment-banking-and-brics-in-the-recent-financial-crisis 3357
983106983122983113983107 983111983151983158983141983154983150983149983141983150983156 983106983137983150983147983155 983137983150983140 983110983145983150983137983150983139983145983137983148 983123983156983137983156983141983139983154983137983142983156
33
operations of major auto firms through the period of adjustment and increase theattractiveness of domestic operations in global production strategies of multinational autocompanies Ethanol production also received massive funds to sustain an industry seen ascritical for alternative and sustainable fuel source capable of replacing petroleum Ethanolreached over 50 percent of automotive fuel sales in 2007
Under the Lula government (2003-10 the BNDES also resumed lending to state andmunicipal governments Since the renegotiation of municipal and state government debts inthe late 1990s states and municipalities have been largely prohibited from taking on debtThis was emplematic of the recentralization required to control fiscal excesses during militaryrule and the prolonged period of transition to democracy Policies during the 1990s weredesigned to avert overspending seen as critical to maintain price stability under the Real Plan(1994) In 2000 the Lei de Responsibilidade Fiscal (Fiscal Responsibility Law) largelyprohibited credit and finance to state and municipal governments Since 2000 municipalitiesand states have been required to submit detailed budget statements that in turn have been thebasis for a gradual return to sub-national government finance In August 2006 central bankand Treasury regulations freed municipalities to take on credit up to 12 times liquid receipts
Since then the BNDES has led in terms of credits and finance to subnational governmentsthrough a Programa Especial de Financiamento aos Estados e Distrito Federal
The BNDES also has developed the first system in Brazil for risk analysis ofmunicipal governments and has led in the market for municipal credit freed by August 2006procedures for approval at Treasury the Central Bank and Conselho Monetaacuterio Nacional(National Monetary Council) Prosecution of mayors and firms charged with managingmunicipal credits with the BNDES revealed fraudulent practices These funds for sub-national public finance also became critical mechanisms to counter severe budget shortfallscaused by financial crisis during 2008 Given that municipal and state government tax basesare shallow and that federal government transfers provide the bulk of sub-nationalgovernment resources the Lula administration allocated R$ 40 billion to the Fundo deParticipaccedilatildeo dos Estados (State Participation Fund) through a Programa Emergencial deFinanciamento (Emergency Finance Fund) administered by the BNDES
In sum the BNDES expanded credit and finance operations substantially during fouryears of sustained growth from 2004-2007 And having helped underwrite the stock marketboom and capitalized Brazilian firms directly and indirectly through credit finance mutualfunds and private equity funds the BNDES retained sufficient scale scope and capital baseto provide counter cyclical credit and finance to help firms adjust to financial crisis and creditshortage during 2008 In retrospect the growth of the BNDES since liberalization andprivatizations of state government banks in the 1990s suggest the comparative advantages of
development banking BNDES credit and finance fell to 52 percent of fixed capitalformation in 1995 Since then the turn to neo-developmentalism and a period of sustainedeconomic growth during the Lula administration increased the BNDES share of total fixedcapital formation during 2006 and 2007 to 126 and 141 percent Critics charge thatmonopoly over FGTS and PIS-PASEP official savings funds as liabilities provide theBNDES with unfair competitive advantage over private banks In 2008 forced savings fundssummed to only 17 percent of BNDES liabilities (resources) The BNDES does not relyexclusively on forced savings for competitive advantage Instead market-oriented policies
joint-ventures with private mutual funds investment funds private equity firms large blocksof shareholding in Brazilian firms and massive amounts of credit and investment to theprivate sector at below market but still profitable long term interest rates of 625 percent
suggest that the large scale and scope of BNDES operations provide institutional foundationsof competitive advantage over private and foreign banks
8132019 Government Banking and BRICs in the Recent Financial Crisis
httpslidepdfcomreaderfullgovernment-banking-and-brics-in-the-recent-financial-crisis 3457
983106983122983113983107 983111983151983158983141983154983150983149983141983150983156 983106983137983150983147983155 983137983150983140 983110983145983150983137983150983139983145983137983148 983123983156983137983156983141983139983154983137983142983156
34
Capitalization of the BNDES by Treasury of over R$2300 billion 2009-11hascaptured attention of many observers of Brazilian development Critics and advocates agreethat the BNDES has realized significant competitive advantages over private and foreignbanks and continues to serve as significant alternative to capital markets for large scaledevelopment projects However like the downturn in planned investments by Petrobras for
oil and gas exploration and production BNDES decreased planned investments fromR$1684 billion in 2010 to R$1397 billion in 2011 We believe this indicates the limits ofmanagement and passing of period of crisis both favoring finance from capital marketsbanks and public-private partnerships
India
Analysis of Brazilian federal banks suggests that these institutions provided policy alternativewhile realizing competitive advantage over private and foreign banks The modernization ofthese institutions helps explain why these large institutions were able to stay the effects ofcredit crunch and financial market downturn in Brazil This section explores data from the
Reserve Bank of India to compare market shares of types of banks from 1972-2008 and bankperformance from 2006-10 Further analysis will be required However the data appears tosupport our core argument that government banks have modernized and realized competitiveadvantages over private and foreign banks
First the number of branch offices which serves as a measure of institutionalcoverage across India of special concern for financial inclusion and the theory thatliberalization and privatizations would lead private banks to expand branch offices andincrease the supply of services From this perspective the trajectory of branch officessuggests that nationalized banks the State Bank of India and regional rural bankssustain much larger networks of branch offices that predominate while otherscheduled commercial (private and foreign) banks retain less than 8000 branch offices
Data from the Reserve Bank of India on the number of current accounts retainedby type of bank provide further evidence that the State Bank of India and its associates
8132019 Government Banking and BRICs in the Recent Financial Crisis
httpslidepdfcomreaderfullgovernment-banking-and-brics-in-the-recent-financial-crisis 3557
983106983122983113983107 983111983151983158983141983154983150983149983141983150983156 983106983137983150983147983155 983137983150983140 983110983145983150983137983150983139983145983137983148 983123983156983137983156983141983139983154983137983142983156
35
national banks and regional rural banks provide the bulk of banking accounts to theIndian population while private and foreign banks cherry pick upscale urban marketsreproducing capital drain and inequalities
Number of Current Accounts by Type of Bank 1972-1995
Since 1999 the pattern of predominance by alternative banking institutions and the minorrole of other scheduled commercial banks and foreign banks continues
The following figures report the value held in current accounts by type of banks first fromthe 1972-1995 period then from the 1999-2008 period For both time periods the trendconfirms that private and foreign banks remain at a competitive disadvantage in terms of thebroader market while the State Bank of India and its associates nationalized banks andregional rural banks tend to predominate
8132019 Government Banking and BRICs in the Recent Financial Crisis
httpslidepdfcomreaderfullgovernment-banking-and-brics-in-the-recent-financial-crisis 3657
983106983122983113983107 983111983151983158983141983154983150983149983141983150983156 983106983137983150983147983155 983137983150983140 983110983145983150983137983150983139983145983137983148 983123983156983137983156983141983139983154983137983142983156
36
Current Account Value by Type of Bank 1972-1995 R
Number of Deposit Accounts by type of bank 1999-2008
A similar pattern appears for the trajectory of savings accounts both the number of
accounts and the value held in savings accounts both for the 1972-1995 period We wereunable to organize data from the more recent period
8132019 Government Banking and BRICs in the Recent Financial Crisis
httpslidepdfcomreaderfullgovernment-banking-and-brics-in-the-recent-financial-crisis 3757
983106983122983113983107 983111983151983158983141983154983150983149983141983150983156 983106983137983150983147983155 983137983150983140 983110983145983150983137983150983139983145983137983148 983123983156983137983156983141983139983154983137983142983156
37
Number of Savings Accounts by Type of Bank 1972-1995
Value in Savings Accounts by Type of Bank 1972-1995
Number of Term Savings Accounts by Type of Bank 1972-1995
8132019 Government Banking and BRICs in the Recent Financial Crisis
httpslidepdfcomreaderfullgovernment-banking-and-brics-in-the-recent-financial-crisis 3857
983106983122983113983107 983111983151983158983141983154983150983149983141983150983156 983106983137983150983147983155 983137983150983140 983110983145983150983137983150983139983145983137983148 983123983156983137983156983141983139983154983137983142983156
38
Value in Term Savings Accounts by Type of Bank 1972-1995
The number and value of credits extended by banks from 1999-2008 appears mostpromising in terms of comparative analysis of bank performance and behavior Thesignificant spread at the end of the time series between the State Bank of India and itsassociates and foreign banks suggests the impact of foreign financial crisis and differentdomestic policies by these types of banks in India similar to that noted in the Brazilianexperience
Number of credits by type of bank 1999-2008
Value of credit by type of bank 1996-2008
8132019 Government Banking and BRICs in the Recent Financial Crisis
httpslidepdfcomreaderfullgovernment-banking-and-brics-in-the-recent-financial-crisis 3957
983106983122983113983107 983111983151983158983141983154983150983149983141983150983156 983106983137983150983147983155 983137983150983140 983110983145983150983137983150983139983145983137983148 983123983156983137983156983141983139983154983137983142983156
39
Further data from the Reserve Bank of India from 2008-10 permit closercomparison of government private and foreign banks in the recent financial crisis Interms of deposits investments total assets and net profits the dominant and expandingrole of government banking in India is apparent Further control variables (not reported)
include gross and net NPA types of income expenses and expenditures provisions andcontingencies and credit- and investment-deposit ratios provide control for bad bankingand confirm the counter cyclical policies during 2008-10 in India
THE FOLLOWING TABLES REQUIRE INTERPRETATION
Number of Banks 2006-7 2007-8 2008-9 2009-10 2010-11
State Bank of India amp Associates 8 8 7 7 6Nationalized Banks 20 20 20 20 20Old Private Sector Banks 17 15 15 15 14
New Private Sector Banks 8 8 7 7 7Foreign Banks 29 28 31 32 33Source RBI A Profile of Banks 2010-11
Number of Branch Offices 2006-7 2007-8 2008-9 2009-10 2010-11
State Bank of India amp Associates 14673 15848 16894 18178 18772Nationalized Banks 37435 39255 40956 43452 45640Old Private Sector Banks 4723 4690 4908 5220 5011New Private Sector Banks 2599 3635 4333 5232 6957
Foreign Banks 272 277 295 308 316Source RBI A Profile of Banks 2010-11
Number of Employees 2006-7 2007-8 2008-9 2009-10 2010-11
State Bank of India amp Associates 255699 249008 268598 266605 282453Nationalized Banks 473179 466400 462926 473041 475082Old Private Sector Banks 47994 48700 51341 55052 55075New Private Sector Banks 91060 110123 124998 127468 163604Foreign Banks 28426 31301 29582 28012 27968
Source RBI - India BanksAssociation
Business per employee (in lakh) 2006-7 2007-8 2008-9 2009-10 2010-11
State Bank of India amp Associates 43635 54922 65022 73743 79306Nationalized Banks 49001 61828 78316 93586 114477Old Private Sector Banks 48159 56932 63843 69749 8149New Private Sector Banks 80782 83196 78715 84041 82607Foreign Banks 97477 11255 128274 141139 155974Note Business = Deposits + Advances
8132019 Government Banking and BRICs in the Recent Financial Crisis
httpslidepdfcomreaderfullgovernment-banking-and-brics-in-the-recent-financial-crisis 4057
983106983122983113983107 983111983151983158983141983154983150983149983141983150983156 983106983137983150983147983155 983137983150983140 983110983145983150983137983150983139983145983137983148 983123983156983137983156983141983139983154983137983142983156
40
Profit per employee (in lakh) 2006-7 2007-8 2008-9 2009-10 2010-11
State Bank of India amp Associates 257 362 443 466 42Nationalized Banks 287 377 486 567 695Old Private Sector Banks 234 406 469 42 563New Private Sector Banks 587 685 677 847 893Foreign Banks 1613 2112 2539 1692 2759
Capital amp Reserves amp Surplus(Ycrore) 2006-7 2007-8 2008-9 2009-10 2010-11
State Bank of India amp Associates 42941 61706 72422 83726 84394Nationalized Banks 92689 113079 135920 157276 205857Old Private Sector Banks 10736 15315 17477 20171 23821New Private Sector Banks 39736 76056 82192 99813 114768Foreign Banks 33075 49332 59937 69176 80972
Deposits Ycrore 2006-7 2007-8 2008-9 2009-10 2010-11
State Bank of India amp Associates 633476 773875 1007041 1108086 1245862Nationalized Banks 1360724 1679993 2105706 2583934 3127122Old Private Sector Banks 138249 165589 199274 229897 264157New Private Sector Banks 413738 509444 537104 592904 738602Foreign Banks 150750 191161 214076 232099 240689
Investments Ycrore 2006-7 2007-8 2008-9 2009-10 2010-11
State Bank of India amp Associates 211875 263823 357624 387473 385697Nationalized Banks 452981 536018 655042 828125 942837Old Private Sector Banks 43647 54080 72393 83499 92617New Private Sector Banks 171008 224498 234139 270618 329403Foreign Banks 71471 98910 130354 159291 165499
Advances Ycrore 2006-7 2007-8 2008-9 2009-10 2010-11
State Bank of India amp Associates 482270 593722 739450 857937 994154Nationalized Banks 957877 1203678 1519762 1843082 2311478
Old Private Sector Banks 92887 111670 128504 154085 184647New Private Sector Banks 321865 406733 446824 478356 612886Foreign Banks 126339 161133 165385 163260 195539
Interest Income Ycrore 2006-7 2007-8 2008-9 2009-10 2010-11
State Bank of India amp Associates 53465 70428 89196 97954 109828Nationalized Banks 110720 142647 183892 208029 256490Old Private Sector Banks 11474 14614 18790 20497 23299New Private Sector Banks 38092 56377 66282 62309 73528
Foreign Banks 17924 24417 30322 26390 28520
8132019 Government Banking and BRICs in the Recent Financial Crisis
httpslidepdfcomreaderfullgovernment-banking-and-brics-in-the-recent-financial-crisis 4157
983106983122983113983107 983111983151983158983141983154983150983149983141983150983156 983106983137983150983147983155 983137983150983140 983110983145983150983137983150983139983145983137983148 983123983156983137983156983141983139983154983137983142983156
41
Other Income Ycrore 2006-7 2007-8 2008-9 2009-10 2010-11
State Bank of India amp Associates 9420 11818 16073 18394 19240Nationalized Banks 14264 20979 26394 30500 28625Old Private Sector Banks 1568 2184 2782 3152 3029
New Private Sector Banks 10745 14822 15078 17271 17697Foreign Banks 7044 10588 14894 9951 10972
Interest Expended Ycrore 2006-7 2007-8 2008-9 2009-10 2010-11
State Bank of India amp Associates 32607 47809 61770 66229 67018Nationalized Banks 69353 101093 131676 145712 164135Old Private Sector Banks 7055 9960 12834 14076 14768New Private Sector Banks 25802 38535 44123 37130 42347Foreign Banks 7603 10604 12819 8938 10622
Operating Expenses Ycrore 2006-7 2007-8 2008-9 2009-10 2010-11
State Bank of India amp Associates 15987 16993 20088 25283 29146Nationalized Banks 27268 29670 35416 40792 53819Old Private Sector Banks 2967 3235 3939 4715 5600New Private Sector Banks 12353 17032 17840 18136 22006Foreign Banks 7745 10353 12298 11102 12557
Cost of Funds 2006-7 2007-8 2008-9 2009-10 2010-11
State Bank of India amp Associates 475 59 594 532 48Nationalized Banks 48 582 609 537 493Old Private Sector Banks 498 62 667 613 55New Private Sector Banks 524 611 604 442 427Foreign Banks 403 433 446 283 311Cost of Funds = Ratio () of interest paid on deposits and borrowings to averageof opening and closing balances of deposits and borrowings
Return on advances adjusted toCoF 2006-7 2007-8 2008-9 2009-10 2010-11
State Bank of India amp Associates 372 365 395 36 405Nationalized Banks 399 369 409 382 427Old Private Sector Banks 406 426 515 482 492New Private Sector Banks 447 505 526 514 516Foreign Banks 574 66 815 716 564
2006-7 2007-8 2008-9 2009-10 2010-11
8132019 Government Banking and BRICs in the Recent Financial Crisis
httpslidepdfcomreaderfullgovernment-banking-and-brics-in-the-recent-financial-crisis 4257
983106983122983113983107 983111983151983158983141983154983150983149983141983150983156 983106983137983150983147983155 983137983150983140 983110983145983150983137983150983139983145983137983148 983123983156983137983156983141983139983154983137983142983156
42
Wages as of Total Expenses
State Bank of India amp Associates 2155 1589 1506 171 1921Nationalized Banks 1794 1405 1331 1365 1641Old Private Sector Banks 1689 1367 1326 1457 1675
New Private Sector Banks 936 956 1017 121 1383Foreign Banks 2008 1995 1944 2348 2331
Returns on Assets 2006-7 2007-8 2008-9 2009-10 2010-11
State Bank of India amp Associates 086 097 102 091 079Nationalized Banks 094 101 103 100 103Old Private Sector Banks 078 114 115 095 112New Private Sector Banks 109 113 112 138 151Foreign Banks 228 209 199 126 174
Capital Adequacy Ratio 2006-7 2007-8 2008-9 2009-10 2010-11
State Bank of India amp Associates 1232 1321 1396 1346 1225Nationalized Banks 1237 1213 1324 1318 1347Old Private Sector Banks 1208 1408 1476 1485 1456New Private Sector Banks 1199 1439 1533 1803 1687Foreign Banks 1239 1305 1432 1726 1672Note To 2007-8 = Basel I From 2008-09 = Basel-II
Net NPA Ratio 2006-7 2007-8 2008-9 2009-10 2010-11
State Bank of India amp Associates 132 143 147 150 149Nationalized Banks 094 077 068 091 092Old Private Sector Banks 096 066 09 082 053New Private Sector Banks 097 109 129 103 056Foreign Banks 073 077 181 182 067Net NPA Ratio = Net non-performing assets as net advances
In sum descriptive data from the Reserve Bank of India confirm the anomaly
and argument drawn from the Brazilian experience An important dimension of BRICcountry recovery from the global financial crisis and downturn is the counter cyclicallending policies and realization of competitive advantages of government banks Thisposes a series of new questions for business schools and scholars of public policyInstead of liberalization and privatization leading to transitions in BRIC countriestoward capital market centered financial systems and liberal market economies publicbanks have realized competitive advantages over private and foreign banks whileproviding policy alternatives to BRIC governments in the face of financial crisis andglobal economic slowdown We return to these implications in the conclusion
One development of note at the Reserve Bank of India is a policy focus onfinancial inclusion The 2008 report of the Committee on Financial Inclusion has beenfollowed by sections of the Reserve Bank of India Annual Report reserved fordiscussion of financial inclusion And instead of focusing on liberalization and
8132019 Government Banking and BRICs in the Recent Financial Crisis
httpslidepdfcomreaderfullgovernment-banking-and-brics-in-the-recent-financial-crisis 4357
983106983122983113983107 983111983151983158983141983154983150983149983141983150983156 983106983137983150983147983155 983137983150983140 983110983145983150983137983150983139983145983137983148 983123983156983137983156983141983139983154983137983142983156
43
privatization to ensure the spread of banking products and services alternative policieshave been explored One is of special note The Committee on Financial Inclusionrecommended issue of identity cards as bank cards This would profoundly change thelandscape of banking in India and has attracted attention from analysts at the CentralBank of Brazil charged with financial inclusion as well as the President of Indonesia
and apparently Uganda officials Given the revolution in information and card paymenttechnologies this policy proposal and pilot studies deserve close attention asalternatives to dramatically increase the pace of social inclusion of the bankless
8132019 Government Banking and BRICs in the Recent Financial Crisis
httpslidepdfcomreaderfullgovernment-banking-and-brics-in-the-recent-financial-crisis 4457
983106983122983113983107 983111983151983158983141983154983150983149983141983150983156 983106983137983150983147983155 983137983150983140 983110983145983150983137983150983139983145983137983148 983123983156983137983156983141983139983154983137983142983156
44
China
This section turns to a brief review of the Chinese banking sector to further explore therole of government banks in terms of their modernization competitive advantages
policy roles and capacity for counter cyclical credit that help explain why BRICcountries were able to avert the severe consequences of the global financial crisis
First figure A11 reports the basic structure of the banking system in China
Although we have been unable to compare the evolution of types of banks acrosstime in similar ways to the above data on India taken from the Reserve Bank of Indiaour research assistants have gathered the following comparative macroeconomicfinancial and balance sheet data on banking in China The data appear to be consistentwith the core argument presented in this paper ndash that government banks havemodernized since liberalization and provided policy makers with alternative means tocounter the effects of financial crisis abroad
8132019 Government Banking and BRICs in the Recent Financial Crisis
httpslidepdfcomreaderfullgovernment-banking-and-brics-in-the-recent-financial-crisis 4557
983106983122983113983107 983111983151983158983141983154983150983149983141983150983156 983106983137983150983147983155 983137983150983140 983110983145983150983137983150983139983145983137983148 983123983156983137983156983141983139983154983137983142983156
45
We lack more current information and were unable to collect data directly fromofficial sources in China to compare the trajectory of state owned private and foreignbanks As a substitute Figure 1 reports data from 2000-4 that permits initial observationof trends for this earlier period
Those present may not need reminding of the formidable record of economicgrowth in China during this 200-4 period that continues until today However data fromthe National Bureau of Statistics suggests that the Chinese banking system expanded atan even greater pace than the remarkable levels of GDP growth recorded for the 2000-4period Furthermore credit expansion was ldquoorganicrdquo in the sense that deposits
outpaced credit growth from 2000-4
Expansion of Loans in China 1999-2004
Loan Growth Total LoansYear on Year
Growth Total Depositssup1Year on Year
GrowthYear CNY billion CNY () CNY billion CNY()1999 9373 83 10878 1372000 9937 60 1238 1382001 11231 130 14362 1602002 13129 169 17092 1902003 159 211 20806 217
2004 18857 186 25319 217
sup1Based on preliminary estimates by the National Bureau of Statistics of the Peoplersquos Republic of ChinaSource National Bureau of Statistics of the PRC
Although we lack data comparable to that from the Reserve Bank of India ableto compare the trajectory of state private and foreign banks in China the sectoralbreakdown of loans and other banking and national account data confirms the profoundcapitalization of the Chinese banking system and GDP growth during from 1995-2004
8132019 Government Banking and BRICs in the Recent Financial Crisis
httpslidepdfcomreaderfullgovernment-banking-and-brics-in-the-recent-financial-crisis 4657
983106983122983113983107 983111983151983158983141983154983150983149983141983150983156 983106983137983150983147983155 983137983150983140 983110983145983150983137983150983139983145983137983148 983123983156983137983156983141983139983154983137983142983156
46
China Banking Sector Market Dimensions (1995 - 2004)
YearTotal
LoansCorp
LoansConsuLoans
HomeLoans
TotalDeposits Excess
GovBonds
CorpBonds GDP
GDPGrowth
()1995 52310 mdash mdash mdash 5376 145 330 65 5848 2511996 63100 mdash mdash mdash 6847 538 436 60 6788 1611997 73585 7341 17 130 8212 853 551 52 7446 971998 85002 8447 53 430 9529 102 9 777 68 7835 521999 95587 9394 164 1360 10831 1273 1054 78 8207 482000 108763 10453 424 3320 13486 261 1302 86 894 892001 118990 112 699 5600 15472 3573 1562 101 9593 732002 139800 12913 1067 8258 18339 4359 mdash mdash 10479 922003 169770 15401 1576 13302 22036 5059 mdash mdash 11669 1142004 194220 16848 1988 15800 25319 5897 mdash mdash 13657 170Figures = CNYB
This data reported in terms of percent GDP provides further clarity on the rapid
capitalization of loans It is of note that the bulk of loans during this period were to thecorporate sector with consumer and home loans lagging significantly
China Banking Sector Percent GDP
YEARTotal
LoansCorporate
LoansConsumer
LoansHomeLoans Deposits
ExcessDeposits
GovBonds
CorpBonds
1995 895 00 00 00 919 25 56 111996 929 00 00 00 1009 79 64 091997 988 986 02 02 1103 115 74 071998 1085 1078 07 05 1216 131 99 091999 1165 1145 20 17 1320 155 128 092000 1217 1169 47 37 1508 292 146 102001 1240 1167 73 58 1613 372 163 112002 1334 1232 102 79 1750 4162003 1455 1320 135 114 1888 4342004 1422 1234 146 116 1854 432
Sources China Banking Regulatory Commission Peoplersquos Bank of China and GoldmanSachs research estimates
Compilation of financial data from a select number of banks in China suggeststhat the pattern of bank change encountered in Brazil and India also describes theexperience of China The liberalization of the Chinese economy and the modernization
of state banks appear to describe the process of bank change instead of a process oftransition toward private banking and capital market centered financial systemAlthough we have been unable to draw data from Chinese monetary authorities thebalance sheet data suggests the clear predominance of large state banks in the politicaleconomy of banking and finance in China How these institutions were used to counterthe effects of financial crisis abroad and redirect domestic investment production andconsumption must remain a subject for further research
8132019 Government Banking and BRICs in the Recent Financial Crisis
httpslidepdfcomreaderfullgovernment-banking-and-brics-in-the-recent-financial-crisis 4757
983106983122983113983107 983111983151983158983141983154983150983149983141983150983156 983106983137983150983147983155 983137983150983140 983110983145983150983137983150983139983145983137983148 983123983156983137983156983141983139983154983137983142983156
47
Select Financial Data from Chinese Banks 2004()
CNY (billion)Total
AssetsGrossLoans
CustomerDeposits Equity
NPLRatio
()
Pre-prov
ProfitsNet
Profits
State Banks
ICBC 5671 3705 5105 163 190 653 23CCB 3905 2226 3489 195 39 605 484ABC (NA) mdashBOC 427 2146 3342 205 51 578 209Quasi-State
BoCom 1145 639 1023 54 30 131 16CMB 587 376 513 22 29 82 32CITIC Industrial 515 306 429 20 60 52 03SPDB 456 311 397 14 24 62 20China Everbright mdashGuangdong Development 345 216 301 mdash mdash mdash 32
Industrial Bank 341 203 283 10 25 37 11Quase-Private
Bank of Shanghai 216 106 179 83 51 32 26Hua Xia 304 181 270 92 40 29 10Shenzhen Development 198 126 166 43 114 28 03Bank of Beijing 209 85 174 71 mdash 26 07
Sector total 19422 25319 129Three state-banks 2692 3979 188Second tier banks 2549 3733 148
ABC = Agriculture Bank of China BOC = Bank of China
BOCOM = Bank of Communications CCB = China Construction BankCMB = China Merchantrsquos Bank CNY = yuanICBC = Industrial and Commercial Bank of ChinaNPL = nonperforming loanROA = return on assets ROE = return on equityprov = provisioningPRC = Peoplersquos Republic of ChinaSPDB = Shanghai Pudong Development BankNote Loan and deposit market share for BOC and ICBC are for their domestic operations onlySources Company data Goldman Sachs research estimates
Returns on Assets Equity and Domestic Market Shares of Major China Banks 2004()
CNY (billion) ROA () ROE ()Deposit Mkt
Share ()Loan MktShare ()
Mortgage MktShare()
State Banks
ICBC 004 14 199 187 253CCB 130 254 138 115 217ABC (NA)BOC 051 102 101 89 152Quasi-State
BoCom 015 45 37 29 34CMB 060 161 20 19 29
CITIC Industrial 007 17 17 16 18SPDB 048 153 16 16 26
8132019 Government Banking and BRICs in the Recent Financial Crisis
httpslidepdfcomreaderfullgovernment-banking-and-brics-in-the-recent-financial-crisis 4857
983106983122983113983107 983111983151983158983141983154983150983149983141983150983156 983106983137983150983147983155 983137983150983140 983110983145983150983137983150983139983145983137983148 983123983156983137983156983141983139983154983137983142983156
48
China EverbrightGuangdong Development mdash mdash 12 11 mdashIndustrial Bank 037 126 11 10 10Quase-Private
Bank of Shanghai 129 360 07 05 14Hua Xia 038 116 11 09 07Shenzhen Development 017 75 07 06 08Bank of Beijing 037 108 07 04 07
Sector totalThree state-banks 438 391 622Second tier banks 144 127 154
ABC = Agriculture Bank of China BOC = Bank of China BOCOM = Bank of Communications CCB =China Construction Bank CMB = China Merchantrsquos Bank CNY = yuanICBC = Industrial and Commercial Bank of China mkt = market NPL = nonperforming loan ROA =return on asset ROE = return on equity prov = provisioning PRC =Peoplersquos Republic of China SPDB = Shanghai Pudong Development BankNote Loan and deposit market share for BOC and ICBC are for their domestic operations onlySources Company data Goldman Sachs research estimates
Further data from 2006-10 from the Peoples Bank of China suggests that the big5 state banks continue to outperform the next 12 largest joint stock commercial banksThe big five have launched sales of shares to capitalize while listing on capital marketsand adopting reporting of financial data along lines of international standards Thisappears to be similar to Banco do Brasil policies that retain majority of shares in federalgovernment control while capitalizing the bank through issues of stock
Comparing the Performance of Big 5 State Banks and Next 12 Joint Stock CommercialBanks in China
2006 2007 2008 2009 2010
Profit Margin Big 5 State Banks 3116 3143 2586 3026 3269
Next 12 JS Commercial Banks 2050 2791 1796 2159 2365
Returns Big 5 State Banks 507 606 860 691 675(risk adj) Next 12 JS Commercial Banks 459 570 1016 714 723
Op Risk Big 5 State Banks 5548 5539 5215 5319 5322Next 12 JS Commercial Banks 5886 5721 5725 5831 5947
Leverage Big 5 State Banks 1626 1482 1724 173 1734Next 12 JS Commercial Banks 2826 2251 2064 2048 1936
ROE Big 5 State Banks 1424 1557 1999 1925 2037Next 12 JS Commercial Banks 1564 2049 2156 1840 1967
Big 4 and 11 JSCBsSource Peoples Bank of China China Financial Stability Reports 2007-11
Performance indicators reported by the Peoples Bank of China for the big 5 statebanks and 12 next largest joint stock commercial banks also suggest that the largestgovernment banks in China retain significant competitive advantages ndash and may providepolicy alternatives Given the current shift of economic policy in China away fromindustry and export led growth to more sustainable domestic oriented growth and socialinclusion the role of state banks clearly comes to the fore
8132019 Government Banking and BRICs in the Recent Financial Crisis
httpslidepdfcomreaderfullgovernment-banking-and-brics-in-the-recent-financial-crisis 4957
983106983122983113983107 983111983151983158983141983154983150983149983141983150983156 983106983137983150983147983155 983137983150983140 983110983145983150983137983150983139983145983137983148 983123983156983137983156983141983139983154983137983142983156
49
Net Operating Income of Big 5 State Banks and Next 12 CommercialBanks 100 million RMB YuanBig 5 State Banks 2006 2007 2008 2009 2010
Balance Net interest income 349703 500456 556790 532206 720152Net fee amp commission inc 48524 103817 138464 175469 232491
Investment income 216089 283725 338865 324037 340440
Other business income (1807) (17054) 47548 33791 2186
Net operating income 612509 870944 1081667 1065503 1314943
Percent Net interest income 5709 5746 5148 4995 5477
Net fee amp commission inc 792 1192 1280 1646 1768
Investment income 3528 3258 3133 3041 2589
Other business income (030) (196) 440 318 166
Net operating income 10000 10000 10000 100 100
Next 12 Joint Stock CommercialBanks 2006 2007 2008 2009 2010
Net interest income 87253 132945 198965 191276 281588
Net fee amp commission inc 7850 16247 27319 30115 42023
Investment income 20959 32172 44864 50767 50500
Other business income 2306 4498 16359 10384 7400
Net operating income 118468 185861 287507 282542 381511
Percent Net interest income 7365 7153 6920 6769 7381
Net fee amp commission inc 671 874 950 1066 1101
Investment income 1769 1731 1560 1797 1324
Other business income 195 242 569 368 194Net operating income 10000 10000 10000 10000 10000
Source Peoples Bank of China China Financial Stability Reports 2007-11
Big 4 and 11 JSCBsBig 5 = ICBC ABC BOC CCB BOCOMNext 12 Joint Stock Commercial Banks = China CITIC Bank Everbright Bank Huaxia BankGuangdong Development Bank Shenzhen Development Bank China Merchants Bank Shanghai PudongDevelopment Bank Industrial Bank China Minsheng Banking Corporation Evergrowing Bank ChinaZheshang Bank Bohai Bank
In conclusion bank change in China also appears to confirm our findings from
Brazil ndash that state banks have realized competitive advantages and increased marketshares since liberalization while providing counter cyclical credit to ameliorateadjustment to crisis The modernization of the China Postal Savings Bank is ofparticular interest given its social mission downmarket focus and 40000 branchOffices throughout the country Expansion of card payment services through the postalbank system confirms the importance of the Brazilian federal savings bank (CaixaEconocircmica Federal Caixa) as agent for federal government social policy and agentresponsible for management of citizenship cards (12 million) and payment of familygrants This back to the future modernization of savings banks has proved essential forovercoming notorious levels of social exclusion and inequality in Brazil Althoughenglish language materials are unavailable on the China Postal Savings Bank thisinstitution clearly presents profound opportunities for comparable policies in China
8132019 Government Banking and BRICs in the Recent Financial Crisis
httpslidepdfcomreaderfullgovernment-banking-and-brics-in-the-recent-financial-crisis 5057
983106983122983113983107 983111983151983158983141983154983150983149983141983150983156 983106983137983150983147983155 983137983150983140 983110983145983150983137983150983139983145983137983148 983123983156983137983156983141983139983154983137983142983156
50
Reported offer of microfinance services for poverty reduction as part of nationaleconomic stimulous plan may point to developments in this direction
Given that state planning capacity has long been at the center of attention intheories of financial statecraft the role of Chinese state banks in redirecting policiesaccording to the 12th 5 Year plan for 2011-15 seems critical From 2000-5 the 10th 5
Year plan emphasized infrastructure and the attraction of investment and labor skillsThe 11th 5 Year plan (2006-10) raised concerns about sustainability rather than growthlevels while also seeking to spread improvements to balance development better servepeople and improve the quality of life continue to support Center and West provincesand revitalize Northeast provinces In comparison the 12th 5 Year plan calls for morebalanced lsquoinclusiversquo growth and structural adjustemts more than 4 trillion RMB($US600 billion) for targeted industries and interior regions a focus on new energynew materials and information and high technologies biology and new medicineenergy converstaion and environmental protection aerospace marine and advancedmanufacturing This implies fundamental shifts away from industry to services that hasbeen reported in macroeconomic data for 2010 If past studies emphasized directed
credit and industrial change the role of Chinese state banks in realizing transformationscertainly warrants study
Although the domestic flow of funds process of liberalization (or the lackthereof) and insertion of banking into Chinese political economy is beyond the scope ofthis paper our findings from Brazil appear to provide valuable hypotheses about ChinaThat is to say the big state banks and other government banks in China remaincommanding heights not in the Marxist sense of providing means to reach socialismbut immense institutions with profound presence throughout politics and markets in thecountry In this sense our findings from Brazil appear to approximate patterns ofchange in China more than Washington Consensus expectations about liberalization andprivatizations to free private and foreign banks Financial statecraft draws attention tothe capitalization of Chinese state banks through stock Sales and listings on capitalmarkets However like the Banco do Brasil (that reformers in the 1990s sought to shiftcontrol to the private sector only to increase federal government shareholding) theChinese experience surely involves unexpected consequences and patterns of changedifferent than a linear transition to the Berle amp Means paradigm of corporategovernance
Russia The New State Duopoly
ldquoThe rush of 2003-8 increased the market share of foreign banks to 285 from
52 However the state-owned banks received enormous help from the federal budget in the days of the crisis thereby strengthening their dominant
position on the Russian financial market says Sergey Aleksashenko the formerDeputy chairman of Russias Central Bank quotes Russia Profile Today one
must not harbor any illusion of a fair competition with them all the main cash
flows in Russia are controlled by state-owned banks httpwwwbarentsnovacomnode1031
Description of banking policy in Russia during the global financial crisis can beobtained from Bank of Russia annual reports and related publications The figure on the
following page summarizes the financial flows to and from the Bank of RussiaAlthough central bank policy is beyond the scope of this study the role of state banks in
8132019 Government Banking and BRICs in the Recent Financial Crisis
httpslidepdfcomreaderfullgovernment-banking-and-brics-in-the-recent-financial-crisis 5157
983106983122983113983107 983111983151983158983141983154983150983149983141983150983156 983106983137983150983147983155 983137983150983140 983110983145983150983137983150983139983145983137983148 983123983156983137983156983141983139983154983137983142983156
51
channeling counter-cyclical credits released by the Bank of Russia appear to confirm thecore argument that emerges from our studies of the Brazilian banking system Furtherdata on the following pages also suggest that state banks in Russia performed wellduring 2008-10 confirming on the basis of sparse data taken from Bank of Russiareports and documents that public banks have modernized provided counter-cyclical
credit to reverse credit crunch and economic downturn while realizing competitiveadvantages over private and foreign banks
8132019 Government Banking and BRICs in the Recent Financial Crisis
httpslidepdfcomreaderfullgovernment-banking-and-brics-in-the-recent-financial-crisis 5257
983106983122983113983107 983111983151983158983141983154983150983149983141983150983156 983106983137983150983147983155 983137983150983140 983110983145983150983137983150983139983145983137983148 983123983156983137983156983141983139983154983137983142983156
52
The following aggregate figures reported by the Bank of Russia suggest severaltrends of significance First Chart 32 suggests that household deposits shifted fromRuble deposits to foreign currency pegged (or indexed) during 2008 Second Chart 33illustrates the substantial increase of non-bank overdue debt during second semester
2008
Consequently the financial results and profitability of banks declinedsignificantly during 2008 The greater confidence in deposits with government banksfound abroad suggests that this may have been critical in Russia
Performance data deom 2008-10 provides a clearer picture one that is consistentwith our findings in Brazil State banks appear to have outperformed all other types of
banks except medium and small regional banks The following table reports the averagereturns on assets and returns on equity reported by the Bank of Russia 2008-10
Returns on Assets and Equity by Type of Bank in Russia 2008-9
Return on assets Return on equity 2008 2009 2010 2008 2009 2010
-------------------------------------------------------------------------------------------------------------------State Banks 22 08 24 157 46 148Foreign Banks 18 11 21 146 83 145Large private banks 13 03 11 106 28 84Medium-Small Banks Moscow 15 12 14 68 52 67
Medium-Small Regional Banks 21 12 15 131 65 98--------------------------------------------------------------------------------------------------------------------Source Bank of Russia Bank Supervision Reports 2009 and 2010
8132019 Government Banking and BRICs in the Recent Financial Crisis
httpslidepdfcomreaderfullgovernment-banking-and-brics-in-the-recent-financial-crisis 5357
983106983122983113983107 983111983151983158983141983154983150983149983141983150983156 983106983137983150983147983155 983137983150983140 983110983145983150983137983150983139983145983137983148 983123983156983137983156983141983139983154983137983142983156
53
Further data from the Bank of Russia on the capital adequacy of Banks during2009-10 suggest that foreign banks and large private banks remain less capitalizedagainst risks according to Basel II guidelines albeit at levels almost double thatrecommended by the Bank for International Settlements (80 risk weighted) Although
further analysis is needed this data is consistent from that reported in Brazil thatgovernment banks tend to more cautious and more prudent in terms of placing asidehigher levels of reserves and patrimony against possible losses
Capital Adequacy of Banks by Type of Bank in Russia 2009-10
2009 2010 2011---------------------------------------------------------------------------------------------------------State Banks 184 227 186Foreign Banks 155 196 195Large Private Banks 140 181 155
Medium-Small Banks Moscow 316 312 268Medium-Small Regional Banks 219 241 207Non-Bank Credit Institutions 372 1038 678---------------------------------------------------------------------------------------------------------Source Bank of Russia Bank Supervision Report (Moscow) 2009 p 43
Finally Bank of Russia bank supervision reports also suggest that state banksexpanded their market shares of assets and capital during the years following the globalfinancial crisis While large private banks and foreign banks lost market share of bankassets and bank capital in Russia state banks increased their significant market sharefrom 405 ndash 426 percent and 471-476 percent of assets and capital respectivelyUnfortunately data from previous years and for specific banking groups was notobtained However this data does appear to indicate that our findings of competitiveadvantages and policy alternatives
Number and Market Share by Type of Bank
N Banks Assets Capital---------------------------- ---------------------------- ----------------------------
Type of Bank 2009 2010 2011 2009 2010 2011 2009 2010 2011-------------------------------------------------------------------------------------------------------------------------------State 17 22 27 405 439 458 471 489 473
Foreign 101 106 108 187 183 180 172 169 191Large Private 136 139 131 346 333 305 276 287 269Med-Small Moscow 361 335 317 27 26 26 43 34 35Medi-Small Regional 443 412 372 28 28 27 36 31 29Other Credit Institutions 50 51 57 07 04 04 01 02 03Total 1108 1058 100 100 100 100 100 100-------------------------------------------------------------------------------------------------------------------------------Source Bank of Russia Bank Supervision Report 2009 amp 2010
In sum politics and financial statecraft have led to the realization of significantcompetitive advantage by Russian state banks Sperbank and Vneshtorgbank increasedtheir share of bank assets from 32 percent in 2005 to over 50 percent by 2011 through
mergers and acquisitions and aggressive displacement of foreign banks Whatever thepolitics data from the Bank of Russia suggests that monetary authorities released a
8132019 Government Banking and BRICs in the Recent Financial Crisis
httpslidepdfcomreaderfullgovernment-banking-and-brics-in-the-recent-financial-crisis 5457
983106983122983113983107 983111983151983158983141983154983150983149983141983150983156 983106983137983150983147983155 983137983150983140 983110983145983150983137983150983139983145983137983148 983123983156983137983156983141983139983154983137983142983156
54
series of counter cyclical credit injections during 2008-9 to domestic bankinginstitutions Moreover data suggests that state banks continue to perform at or ahead oflevels reported by regional private and foreign banks The large market share andimproved performance of state banks reported in recent data suggests although the datais sparse that government banks in Russia have also modernized realized competitive
advantages and provided policy alternatives against the impact of financial crisisabroadWe were unable to find evidence of policy making toward social inclusion at the
Bank of Russia or Russian state banks despite the historical trajectory of the Sberbankas a savings bank under communism The context also appears to differ considerably Asurvey of the Zircon Research Group reportedly found that only 15 percent of Russiansretain bank accounts because of mistrust in banks and government This combination ofrealist politics and the realization of competitive advantages by Russian state bankssuggests that theories of economic statecraft in the realist tradition may indeed explainthe domestic developments under study
Conclusion
This paper reports evidence about government bank modernization and financialstatecraft in BRIC countries designed to counter the effects of crisis and shape domesticgrowth Government banks in BRIC countries have contributed to the widely notedadjustment of these economies to global financial crisis and economic downturnContrary to the Washington Consensus that prevailed during much of the 1980s and1990s (that privatization and liberalization especially of banking would free marketforces and deepen domestic financial systems) a quite different process of bank changeappears to have ensued after financial liberalization in the BRICs
Instead of replacement of state banks with private banks government banksremain central agents of domestic credit and growth and have modernized ldquojust intimerdquo The capitalization and realization of competitive advantages by large governmentbanks during the 2000s meant that once the US financial panic spread across capitalmarkets broke highly leveraged private and produced runs on private bank depositspolicy makers in BRIC countries nonetheless retained counter cyclical policyalternatives through their more solid large state banks
These findings counter traditional foci on the private sector individualentrepreneurship and ideals of free markets linked to the political and social advancesrecorded around the world in the last decades We report an anomaly for theories offinancial repression and the Washington Consensus about the virtues of privatization
and liberalization Although largely blamed for reproducing underdevelopment in thepast BRIC government banks averted excesses of private banking that drove creditbubbles such as home mortgages and derivatives in the US And since liberalization ofbanking (we have not adequately discussed how much liberalization occurred in eachcountry) government banks have modernized to compete with private and foreignbanks Government banks have realized competitive advantages and provided policyalternatives These two arguments help explain why BRIC countries have farecomparatively well in the face of financial crisis in core countries
Financial statecraft is therefore at the center of BRIC counter cyclical capacitiesand state planning Brazil Russia India and China fared significantly better thanadvanced and many developing countries in terms of adjusting to credit crunches and
export shocks This is because government banks proved critical interbank credit toretain confidence in domestic banking systems These institutions also presented other
8132019 Government Banking and BRICs in the Recent Financial Crisis
httpslidepdfcomreaderfullgovernment-banking-and-brics-in-the-recent-financial-crisis 5557
983106983122983113983107 983111983151983158983141983154983150983149983141983150983156 983106983137983150983147983155 983137983150983140 983110983145983150983137983150983139983145983137983148 983123983156983137983156983141983139983154983137983142983156
55
policy alternatives for political and social forces Politics shaped adjustment andrecovery through state banks differently in BRIC countries Given the realities of statecentered political realism in Russia the redirection of state banks toward goals ofChinese Five Year Plans and the modernization of the State Bank of India amidst anamorphous federalism the experience of Brazil with democratization and public bank
modernization may stand out (Armijo 2009)Further analysis of savings banks and cooperative banks also will be requiredAs members of the World Savings Bank Institute (a global association of savingsbanks) the Caixa in Brazil SNI and NABARD in India and China Postal Savings Bankappear to have provided access to very large numbers of previously unbanked citizensThis returns to traditional ideas of social banking and the history of savings banks thatwere founded throughout Europe since the late 18 th century The upmarket strategy andexpansion into investment banking and international banking of the Russian Sberbankconstrasts with downmarket strategies of savings banks in Brazil India and China
The financial press has recently reported doubts about bad loans in Chinese statebanks and cast doubt on the financial results posted and reported in this paper
However current estimates of 2-5 percent bad loans in Chinese state banks pale incomparison to the US$1240 billion in bad loans shifted to asset managementcompanies in the mid 2000s before capitalization of these institutions through sale ofshares Critics of state banking in Brazil also point to past levels of bad loans (reaching30-40 percent) because of their capture during military government delayed transitionBut the cost of capitalization and transfer of bad loans from Brazilian state banks alsoremained below US$400 billion and is still contingent on liquidation of assetmanagement companies created in 2001 In any case these numbers are very smallcompared to GAO estimates of US$120 trillion in emergency infusions by USmonetary authorities to banks and financial institutions from 2007-11
These are anomalies for recent market-based banking theory and neo-liberalpolicy designs However they do not run counter to orthodoxy in economics andbanking theory Over the last decades economic reforms (fiscal financial monetaryand banking) have improved transparency and brought public policy and marketexpectations closer However expectations about deregulation and free marketequilibria in banking and finance have succumbed in the face of panic and the stillsobering consequences of crisis The materials presented herein are descriptive and willrequire more careful analysis However given the urgency of searching for alternativedevelopment models and different approaches to financial statecraft in BRIC countriesand beyond we have taken the liberty to present research in initial stages and toprovoke thought along the lines suggested by our kind conveners
8132019 Government Banking and BRICs in the Recent Financial Crisis
httpslidepdfcomreaderfullgovernment-banking-and-brics-in-the-recent-financial-crisis 5657
983106983122983113983107 983111983151983158983141983154983150983149983141983150983156 983106983137983150983147983155 983137983150983140 983110983145983150983137983150983139983145983137983148 983123983156983137983156983141983139983154983137983142983156
56
Appendix on Alternative Banking and Social Inclusion
This appendix describes how ideas about government banking led to further work onalternative banking and social inclusion with help from the Rockefeller FoundationBellagio Center In July 2011 we were able to convene a conference designed to gather
scholars alternative banking executives and representatives from savings andcooperative bank associations to rethink strategies for social inclusion in the globalsouth and attempt to launch a new policy agenda Given the search for alternativestrategies to counter crisis and the advances of stabilization transparency and bankingsupervision in developing and emerging economies we call for alternative bankingcommunities in the global north and south to work together and help shape a new policyagenda for social inclusion Because savings banks credit cooperatives and otheralternative banking and finance institutions have realized competitive advantages andemerged from crisis we can now think beyond We believe that new policies may helpdeveloping and emerging nations redirect large domestic institutions such as postal andsavings banks toward meeting the UN millennium goals to eliminate poverty by 2015
Plans include writing a green paper on Core Principles for Alternative Bankingand Social Inclusion convening events to promote these principles through institutionalsupporters and networks and seeking adoption of these principles at policy venues suchas the World Savings Bank Institute the International Association of CooperativeBanks the Bank for International Settlements the International Financial ReportingStandards foundation the ISO International Standards Organization the Charter forResponsible Business regional development banks and the World Bank We also planto submit an edited volume of scholarly contributions on alternative banking and socialinclusion by year-end 2012 Interested parties are welcome to participate
Institutional supporters and networks include
Institutional SupportersColumbia University School of International and Public Affairs New YorkInstitute for Money Technology and Financial Inclusion University of CaliforniaIrvineKingacutes College Department of Management LondonSatildeo Paulo Business School Getulio Vargas FoundationSecond University of Naples
Networks
Association of Emerging Market Business Schools Satildeo Paulo BrazilCommunity of European Management Schools BrusselsCritical Political Economy NetworkEuropean Association of Co-operative Banks BrusselsGlobal Public Policy Network LondonInternational Cooperative Banking Association BrusselsSocial Science Finance Network AmsterdamSociety for Advancement of Social Economics PhiladelphiaWorld Savings Bank Institute Brussels
8132019 Government Banking and BRICs in the Recent Financial Crisis
httpslidepdfcomreaderfullgovernment-banking-and-brics-in-the-recent-financial-crisis 5757
983106983122983113983107 983111983151983158983141983154983150983149983141983150983156 983106983137983150983147983155 983137983150983140 983110983145983150983137983150983139983145983137983148 983123983156983137983156983141983139983154983137983142983156
Core Principles for Alternative Banking and Social Inclusion
Commitment to End Capital StarvationPromote access to and use of banking and financial services by all through newtechnologies and distribution channels to capitalize assets among the poor
Commitment to Universalize Income Savings Credit and FinanceProvide basic income via ATM cards and mobile banking to reach the poor and opennew channels of access to income savings credit finance insurance and opportunities
Prudent Banking and Regulatory ComplianceAlternative banking seeks to work within regulations guidelines and best practicesrecommended by domestic monetary authorities and international regulatory institutionssuch as the Bank for International Settlement Basel II Capital Risk Guidelines
Corporate Social Responsibility Leadership
Integrate corporate social responsibility into down-market business strategies andinstitutions of representation and democratization
Transparency and AccountabilityPublish annual reports and balance sheets in accord with international best practices offinancial social and sustainability reporting
Leadership in Provision of New Banking Services and Products to the PoorUse competitive advantages in banking and institutional networks to channel moreeffectively capital income and finance to the poor
Generate Sustainable Income and Household Asset AccumulationUse branch offices and new banking technologies to accelerate progress toward UNmillennium goals to eliminate poverty
Universalize Financial EducationPromote financial education to encourage responsible banking and finance and avertpredatory lending and unethical practices
Adopt Cutting Edge Technology and Management Practices to Provide
Competitive Alternative to Private Commercial and Investment Banks
Incorporate electronic card and mobile banking services to better serve the poorContribute to Realization of Bellagio Principles for SustainabilityPromote alternative banking and business practices that contribute to environmentallysustainable income consumption and production as stated in Bellagio Principles forSustainability
Respect and Build on National and Regional DifferencesI d f i l d l l i b ki i i i d i i l
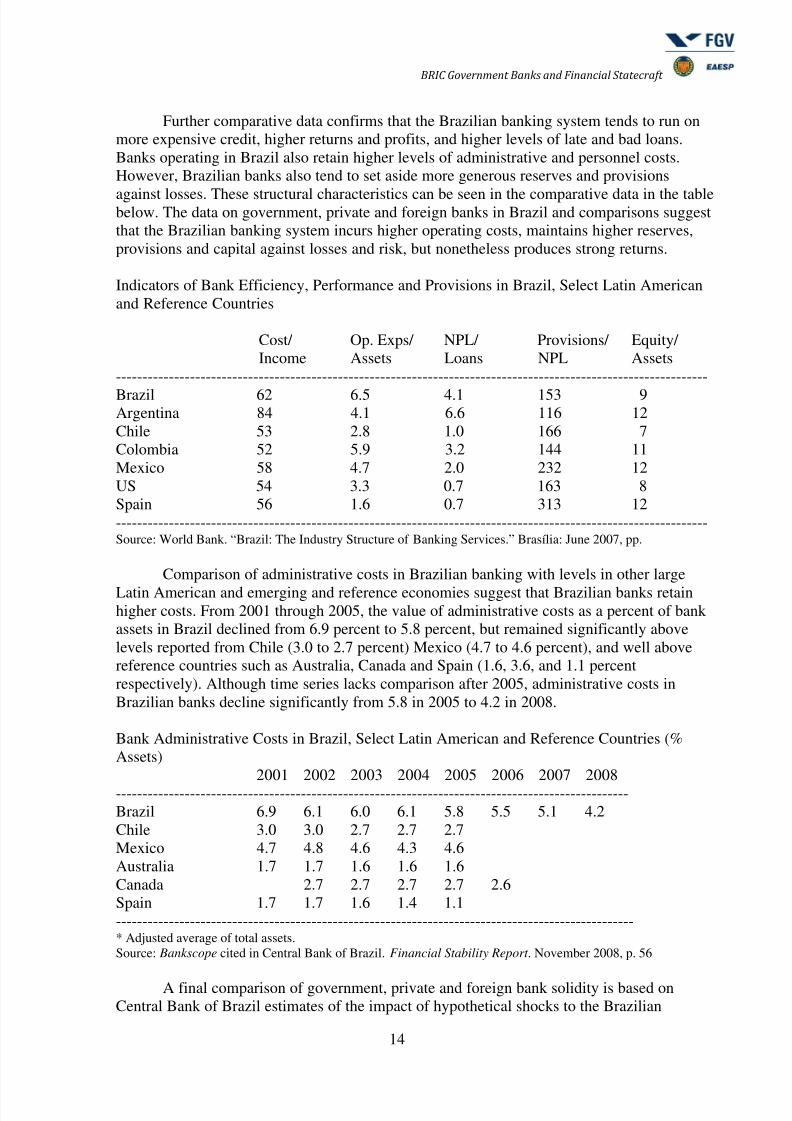
8132019 Government Banking and BRICs in the Recent Financial Crisis
httpslidepdfcomreaderfullgovernment-banking-and-brics-in-the-recent-financial-crisis 1757
983106983122983113983107 983111983151983158983141983154983150983149983141983150983156 983106983137983150983147983155 983137983150983140 983110983145983150983137983150983139983145983137983148 983123983156983137983156983141983139983154983137983142983156
17
experienced political leaders of the PMDB brought competitive advantages to the bankbased on their networks that cross the public and private sector These networks andrelations during the second PT coalition government of President Lula also appearsdifferent than the first given the departure from core offices of the presency bylongtime advisors to Lula that came from the Banco do Brasil and bank workers union
By late 2006 only one of seven vice presidents of the Banco do Brasil was a member ofPresident Lulaacutes Workersacute Party (PT)Again Banco do Brasil policies and growth since recovery of the economy in
2004 involved first a period of expansion during four years of growth followed by aturn to counter cyclical lending and finance once financial crisis abroad produced first asevere contraction in credit supply then a sharp economic downturn in fourth quarter2008 Institutional foundations of comparative advantage are behind Banco do Brasilpolicies during both periods First the capitalization of Brazilian firms on the Bovespastock market is closely related to the groups that cross politics government banks thepowerful bank worker labor union the Banco do Brasil employee private pension fundand bank consortia often led by the Banco do Brasil investment banking division (often
joined by the BNDESpar and Caixa investment banking division) Recent developmentsare complex and will require further research However rather than convergence towardprivate banking and a market-centered financial system examination of Banco do Brasilpolicies and market shares during the 2000s suggests that federal government banks notonly remain at the center of politics policy and development strategies but that theseinstitutions have modernized to compete against private and foreign banks
The large scale and scope of the Banco do Brasil has permitted use of the bankfor counter-cyclical lending and leadership in capital markets without deteriorating bankbalance sheets Since 2003 the Banco do Brasil has remained well within domesticbank regulations and Basel Accord guidelines During 2002 and 2003 reforms at theBanco do Brasil sought to reduce costs and increase efficiency ratings Indeed therelation between the Banco do Brasil and President Lula reversed past patterns In the1950s conflicts were between national developmentalist groups at the Banco do Brasiland more orthodox Ministers of Finance In 2003 and once again during the 2008financial crisis differences between President Lula and the Banco do Brasil were thereverse Banco do Brasil management refused to dramatically increase loans in 2003and resisted requests to reduce the price of credit in 2008 In 2003 the caution imposedby political risk perceptions led President Lula to respect the operational autonomy ofthe Banco do Brasil In April 2009 Banco do Brasil President Antonio Francisco deLima Neto was fired after refusing to reduce interest rates on loans This reversal ofpolicy positions from the 1950s suggests in a broader sense a transition from the
macroeconomics of populism to the microeconomics of government banking in the 21
st
century Government banks do not provide easy or all solutions Instead credit andfinance policies are subject to market discipline credit risk analysis and the realities ofbusiness cycles
Review of the Banco do Brasilrsquos balance sheet from 2002-2008 suggests that the bankdeveloped organically from 2002-2007 with gradual increases reflecting the competitiveadvantages at the top of Brazilian banking and finance Policies changed during 2007 and2008 as the credit shortage caused by international financial crisis led to the Banco do Brasilassuming once again lending of last resort functions by extending interbank investments andloans to small and medium sized banks to avert further declines in domestic liquidity TheBanco do Brasil also acquired a 51 percent stake in the Votarantim bank to avert a run on
deposits and possible failure while acquiring Satildeo Paulo state government savings bankNossa Caixa for R$76 billion in 2008 These acquisitions reflect concern about the
8132019 Government Banking and BRICs in the Recent Financial Crisis
httpslidepdfcomreaderfullgovernment-banking-and-brics-in-the-recent-financial-crisis 1857
983106983122983113983107 983111983151983158983141983154983150983149983141983150983156 983106983137983150983147983155 983137983150983140 983110983145983150983137983150983139983145983137983148 983123983156983137983156983141983139983154983137983142983156
18
replacement of the Banco do Brasil as the largest financial conglomerate in Brazil after themerger of Itauacute and Unibanco
Banco do Brasil Balance Sheet Summary 2002-2008 R$ billion
2002 2003 2004 2005 2006 2007 2008 2009 2010 2011Assets --------------------------------------------------------------------------------------------------------Interbank Investments 101 50 27 80 175 434 951Interbank Deposits 76 283 137 209 116 77 242Securities 709 696 734 664 731 752 732Central Bank Deposits 81 186 221 244 281 334 212Loans to Private Sector 89 652 757 885 1178 1463 1810Loans to Public Sector 56 43 41 37 43 24 230Receivables 297 273 312 351 404 548 808Other AssetsTotal Assets 2046 2301 2390 2529 2963 3672 5073Liabilities ---------------------------------------------------------------------------------------------------Deposits 972 1100 1155 1376 1588 1882 2711
M MKT Borrowing 483 400 445 305 492 722 914Treasury amp BNDES 59 74 106 133 143 175 224Shareholder Equity 92 121 141 168 207 242 299Other LiabilitiesTotal Liabilities 2046 2301 2390 2529 2963 3672 5073---------------------------------------------------------------------------------------------------------------- Compulsory deposits for commercial banks according to Central Bank regulationsSource Banco do Brasil Annual Reports Historical Series 2002-2008
From 2002 through 2006 the balance sheet of the Banco do Brasil suggests a periodof growth based on loans to the private sector with deposits and shareholder equityincreasing largely apace After 2006 the balance sheet changes fundamentally with capitalinjections from money market borrowing increasing from R$492 billion in 2006 to R$914billion in 2008 while Banco do Brasil liabilities with Treasury and BNDES increased fromR$143 billion in 2006 to R$224 billion in 2008 The asset side of the balance sheet alsosuggests fundamental change Private sector lending increased from R$1178 billion in 2006to R$1810 billion in 2008 reflecting acquisition of portfolios from Nossa Caixa Interbankinvestments increased from R$175 billion in 2006 to R$951 billion in 2008 while interbankdeposits also increased from R$116 billion in 2006 to R$242 billion in 2008 The counter-cyclical lending strategies of the Banco do Brasil during 2008 also included an increase oflending to the public sector from R$24 billion in 2007 to R$230 billion Banco do Brasilreponses to government credit policy can also be seen in the release of 40 percent of
compulsory deposits retained at the central bank Banco do Brasil deposits at the central bankdeclined from R$334 billion in 2007 to R$212 billion in 2008 ndash freeing this value for loansand investments
Networks and relations during the second government of President Lula appeardifferent than the first given the departure from core offices of the presency by longtimeadvisors to Lula that came from the Banco do Brasil and bank workers union By late 2006only one of seven vice presidents of the Banco do Brasil was a member of President LulaacutesWorkersacute Party (PT) The corporate profile of the Banco do Brasil suggests once again thehybrid character of this government bank one listed on the Bovespa Novo Mercado but withover 65 percent of shares owned by the Brazilian federal government Treasury
8132019 Government Banking and BRICs in the Recent Financial Crisis
httpslidepdfcomreaderfullgovernment-banking-and-brics-in-the-recent-financial-crisis 1957
8132019 Government Banking and BRICs in the Recent Financial Crisis
httpslidepdfcomreaderfullgovernment-banking-and-brics-in-the-recent-financial-crisis 2057
983106983122983113983107 983111983151983158983141983154983150983149983141983150983156 983106983137983150983147983155 983137983150983140 983110983145983150983137983150983139983145983137983148 983123983156983137983156983141983139983154983137983142983156
20
customers in 2008 reached 479 million with the bank retaining 39700 AMTs and 766million bank cards (239 million credit cards and 527 million debit cards) Like the CaixaEconocircmica Federal the Banco do Brasil also processes government payments withretirement and social security payments numbering 745 million transactions during 2008Although this implies administrative costs (and receipts) this also brings customers and
prospective customers into Banco do Brasil branch officesDuring 2008 the Banco do Brasil continued to expand operations form jointventures acquire private and government banks and modernize operations A secondaryoffering of stock in January 2008 granting of shares by VISA to the Banco do Brasil andupgrading of the bank to investment grade BB- by Standard amp Poors in April 2008 suggestthat market orientation of the bank continues during the Lula administration despite counter-cyclical credit policies A Lower Income Segment Department was also created to assumeBanco Popular do Brasil operations along with correspondent banking relations and regionalsustainable development programs The Banco do Brasil also received permission to usesavings accounts for home loans enabling the bank to compete on level ground with CaixaEconocircmica Federal During 2008 the Banco do Brasil also acquired the state government
banks Banco do Piaui Banco de Santa Catarina (33rd largest bank in Brazil with US$30billion assets at year end 2007) and Satildeo Paulo government savings bank Nossa Caixa (12thlargest Bank in Brazil with US$267 billion in assets at year end 2007) In sum the diversecorporate divisions and financial operations of the Banco do Brasil provided policy optionsduring 2008 to counter the credit shortage and help firms and domestic banks to adjust
Banco do Brasil and Private Bank Returns and Capital Adequacy 2002-2009
Basel Index Return on Assets Return on Liquid Assets----------------------------- ----------------------------- -----------------------------BB Itauacute Bradesco BB Itauacute Bradesco BB Itauacute Bradesco
--------------------------------------------------------------------------------------------------------------2002 122 184 179 12 26 20 302 288 2832003 137 198 199 11 28 16 231 297 2282004 152 206 188 13 30 23 240 292 3092005 171 170 173 12 37 26 187 353 2842006 173 171 188 28 31 25 267 288 2632007 156 179 156 14 32 22 222 321 2442008 152 161 169 25 19 16 304 221 2112009 150 165 166 12 13 14 238 182 195-------------------------------------------------------------------------------------------------------------- Annualized first quarter 2009 resultsSource Banco do Brasil Itauacute and Bradesco Annual Reports 2002-2009
Comparison of Banco do Brasil returns and capital adequacy with the two majorprivate Brazilian banks Itauacute and Bradesco suggests that the performance and solidity of theBanco do Brasil remains equal or superior to private banks During 2002 and 2003 thecapital adequacy of the Banco do Brasil and return on assets remained below levels reportedby the two largest Brazilian private banks suggesting the impact of counter-cyclical lendingHowever after 2004 the Basel index of the Banco do Brasil reached 171 far above BISstandards of 80 and Central Bank of Brazil requirements of 110 Furthermore from 2006through first quarter 2009 returns on assets returns on liquid assets and the Basel index ofthe Banco do Brasil exceed levels reported by Itauacute and Bradesco In sum despite providingcounter cyclical credit and despite having been replaced by the Itau-Unibanco merger as the
8132019 Government Banking and BRICs in the Recent Financial Crisis
httpslidepdfcomreaderfullgovernment-banking-and-brics-in-the-recent-financial-crisis 2157
983106983122983113983107 983111983151983158983141983154983150983149983141983150983156 983106983137983150983147983155 983137983150983140 983110983145983150983137983150983139983145983137983148 983123983156983137983156983141983139983154983137983142983156
21
largest Brazilian bank the performance and capital adequacy of the Banco do Brasil remainsat or above levels reported by the two largest private banks
In sum since liberalization of banking and finance and privatization of stategovernment banks during the 1990s the Banco do Brasil has been transformed from directstate owned bank into one of two very large financial conglomerates that dominate domestic
banking in Brazil Instead of retaining easy access to funds at Treasury to cover losses theBanco do Brasil has adopted international corporate governance standards to become listedon the Bovespa Novo Mercado and retains an important role in virtually every aspect ofBrazilian banking and finance Although sale of shares in the 1990s were designed to transfercorporate governance and control of the national bank to the private sector the federalgovernment retains 65 percent of stocks after two sale of stocks capitalized the bank duringthe 2000s The massive size and wide scope of Banco do Brasil networks across bankingfinancial markets political and social forces and business have led the bank to realize recordprofits during the period of growth from 2004-2008 and provide counter-cyclical credit toavert a further decline in industrial activity and the economy as the US and global financialcrisis hit Brazil first with a 50 percent decline in the Bovespa stock market and credit
shortage followed by a steep but short decline in industrial production in late 2008 Thetransparency of Banco do Brasil quarterly reports and advances in Central Bank of Brazilsupervision of domestic banking clarify the new tensions that have emerged during the PTgovernment of President Lula These tensions reflect the modernization and competitiveadvantages of the Banco do Brasil
Caixa Econocircmica Federal (Federal Savings Bank Caixa)
The third largest domestic bank the wholly government owned Federal Savings Bank Caixawas also called on by President Lula during the recent financial crisis to increase the pace ofgrowth provide counter cyclical credit during downturns and to reduce consumer andcorporate interest rates and bank spreads Review of balance sheets and policies since 2001suggest that the Caixa retains its core business in urban development home loans real estatetransfer of funds for government programs and services and lottery administration Howeverinvestment banking management of third party funds and the creation of of new products andservices have both increased profits and increased popular access to banking and socialservices The bank has recorded record profits since R$108 billion (2002) R$16 billion(2003) and R$14 billion (2004) The Caixa became the fourth largest Brazilian investmentbank by 2003 while gaining dealer status from the Central Bank of Brazil in primary andsecondary markets for government securities At year-end 2003 the bank retained anestimated R$767 billion of government paper (over ten percent of government paper) in its
portfolio assets earning over R$135 billion that year Since recovery of the Brazilianeconomy in 2004 the Caixa has reported strong profits and continued to improve thestructure of its balance sheet and converge toward international bank reporting standards
In terms of assets deposit base and the number of employees and branches the datasuggest that the Caixa has emerged from a process of rationalization and downsizing duringthe late 1990s and expanded ldquoorganicallyrdquo since capitalization in 2001 Assets declined fromover US$999 billion in 1997 to US$363 billion in 2002 after reorganization andcapitalization Deposits also declined from US$541 billion in 1997 to US$216 billion in2002 The number of employees and branches declined from 104253 and 2316 to 98971 and1803 respectively but returned to 104934 and 2428 by 2006 After reorganization andcapitalization in June 2001 Basel indexes and the ratio of fixed assets over equity indicate
substantial reform and transition toward international banking standards The Basel Index thatmeasures the adequacy of capital reserves against possible losses and risks increased from
8132019 Government Banking and BRICs in the Recent Financial Crisis
httpslidepdfcomreaderfullgovernment-banking-and-brics-in-the-recent-financial-crisis 2257
983106983122983113983107 983111983151983158983141983154983150983149983141983150983156 983106983137983150983147983155 983137983150983140 983110983145983150983137983150983139983145983137983148 983123983156983137983156983141983139983154983137983142983156
22
135 (49 in March 2001 before capitalization) to reach 278 and remain twice above theCentral Bank minimum of 110 at 252 in 2006 The ratio of fixed assets as a proportion ofequity also declines substantially from 638 at year end 2001 to 197 in 2007
Summary of Caixa Structure and Performance 1995-2007
Assets Profits Deposits Employees Branches Basel FAEquity1995 826 672 503 99866 23161996 907 2351 515 99343 21051997 999 875 541 96300 18031998 948 1693 499 94859 18191999 684 1571 344 94194 19192000 644 1362 322 104253 19212001 436 -1265 298 98971 2013 135 6382002 363 1462 216 106548 2147 146 5372003 521 2617 281 100498 2046 192 413
2004 556 2999 345 100164 2135 202 3612005 806 4852 456 106729 2321 278 2012006 981 4874 567 104934 2428 252 1972007 1409 4485 800 106770 2052 288 1282008 1266 5735 708 103895 2069 206 119
Note Assets amp Deposits = US$billion Profits = US$million Basel = BIS Basel Accord index of capital reserveadequacy FAEquity = Fixed Assets Equity a summary indicator of bank modernizationSource Central Bank of Brazil Top 50 Banks in Brazil available at wwwbcbgovbr
Caixa Annual Reports and transition toward Central Bank and international bankaccounting standards introduce breaks in the time series of financial performance after 2001
However international bank reporting standards have been used by the Caixa since 2005 andthe data provide further view of the policies and performance of the bank Table X reportsreturns on stockholder equity assets Basel solvency index immobilization index provisionsas a percent of credit operations bank efficiency index and coverage of personnel costs Thedata are consistent with the broader comparisons reported in chapter two that suggest highprofits and returns alongside higher levels of provisions and reserves against capital riskReturns on stockholder equity have remained above 20 percent per year reaching 306percent in 2008 Returns on liquid assets remained between 09 percent and 13 percentbelow the average levels recorded by private and foreign banks The Basel Index of the Caixaremained well above the 11 percent level required by the Central Bank declining from 279in 2005 to 206 in 2008
Caixa Performance Indicators 2005-2008
Indicator 2005 2006 2007 2008 2009 2010 2011--------------------------------------------------------------------------------------------------------------------------Return on Shareholder Equity 261 260 226 306Return on Liquid Assets 11 11 09 13Basel Solvency Index 279 253 289 206Immobilization Index 201 197 129 120Provisions as Credit Operations 101 98 91 86Efficiency Index 645 642 755 718Coverage of Personnel Costs 925 896 943 868
---------------------------------------------------------------------------------------------------------------------------Source Caixa Econocircmica Federal Relatoacuterios de Administraccedilatildeo 2005-2011
8132019 Government Banking and BRICs in the Recent Financial Crisis
httpslidepdfcomreaderfullgovernment-banking-and-brics-in-the-recent-financial-crisis 2357
983106983122983113983107 983111983151983158983141983154983150983149983141983150983156 983106983137983150983147983155 983137983150983140 983110983145983150983137983150983139983145983137983148 983123983156983137983156983141983139983154983137983142983156
23
The immobilization index of the Caixa also declined from 201 percent in 2005 to120 percent in 2008 suggesting transition toward standard levels of international bankingHowever the value of provisions as a percent of credit operations remains much higher thaninternational bank practices albeit declining from 101 percent in 2005 to 86 percent in2008 Finally both the substantial increase in efficiency index from 645 to 718 percent
suggests that the Caixa has distanced further from international private bank levels that tendto approach 500 percent This has resulted in the declining level of coverage of personnelcosts and indicates the comparatively larger organizational structure and less use ofoutsourced labor at the Caixa
Caixa Deposits and Sources of Funds 2005-2008 R$million
2005 2006 2007 2008 2009 2010 2011----------------------------------------------------------------------------------------------------------------Bank Deposits 692 863 1155 1320Savings Deposits 5328 6006 7560 9255Mid-Term Savings Deposits 3873 4219 4136 4862
Certificates (1270) (1412) (1244) (1831)Escrow (2602) (2806) (2891) (3031)
Funds and Programs 794 1034 1307 1100Other 009 015 019 013Caixa Total 10690 2139 14179 6552Bank System Total 68268 78148 92672 27482Caixa Deposits as Total (156) (155) (1531) (129)----------------------------------------------------------------------------------------------------------------Source Caixa Econocircmica Federal Relatoacuterios de Administraccedilatildeo 2005-2008
The liability side of Caixa balance sheets from 2005-8 suggests that the bank hasdistanced itself from reliance on official savings programs and funding toward consumerbank and savings deposits Bank deposits increased from R$69 billion in 2005 to overR$132 billion in 2008 Savings deposits increased from R$532 billion in 2005 to overR$925 billion in 2008 Furthermore the increase of mid-term savings deposits originatedfrom sale of savings certificates instead of escrow held by the Caixa the latter subject to
judicial review and removed from balance sheets in 2008 The value of funds deposited at theCaixa from government funds and programs increased from R$79 billion in 2005 to R$110billion in 2008 although it remains less than ten percent of total deposits In terms of totalvalue of deposits and savings the Caixa increased total value of deposits from 107 billion toover 165 billion from 2005-8
Caixa Loans 2005-8 R$ million2005 2006 2007 2008 2009 2020 2011
----------------------------------------------------------------------------------------------------------------Commercial 14652 16329 19134 28854
Consumer 8925 9474 11063 13747Business 5727 6854 8071 15107
Home 20208 26113 32475 45075Sewage and Infrastructure 1646 2556 3585 5445Other 690 691 694 689Risk Provision -3773 -4469 -5090 -6900Total Caixa Loans 37195 45689 55888 80062----------------------------------------------------------------------------------------------------------------Source Caixa Econocircmica Federal Relatoacuterios de Administraccedilatildeo 2005-8
8132019 Government Banking and BRICs in the Recent Financial Crisis
httpslidepdfcomreaderfullgovernment-banking-and-brics-in-the-recent-financial-crisis 2457
983106983122983113983107 983111983151983158983141983154983150983149983141983150983156 983106983137983150983147983155 983137983150983140 983110983145983150983137983150983139983145983137983148 983123983156983137983156983141983139983154983137983142983156
24
In terms of lending the data suggests that the primary focus of the Caixa on homeloans continued during the late 2000s although substantial increases in commercial lendingfor consumer credit and businesses suggest the diversification of the Caixa across creditmarkets Since 2005 Caixa lending to consumers and business increased from R$89 billionto R$137 billion and from R$57 billion to R$151 billion respectively in 2008
And unlike the high levels of bad and late credit reported during the adjustment to theend of high inflation in 1994-6 and financial crises (1994-5 1997 1998 1999 2001 2003)the level level of late loans at the Caixa fell substantially during the years of economicgrowth and credit expansion from 2006-2008 The percent of late over total loans at the Caixafell from 68 percent in 2006 to 40 percent in 2008 for commercial loans generally and from62 percent to 59 percent for consumer loans and 75 percent to 22 percent for loans tobusiness The value of late home loans as a percent of total home loans also fell from 31 to17 percent in 2008
Caixa AA-H Credit Classification 2001-8
Days Prov-Late ision 2001 2002 2003 2004 2005 2006 2007 2008 2009 2010 2011
---------------------------------------------------------------------------------------------------------------------------------------AA lt15 0 59 56 66 63 54 50 63 94A lt15 05 243 264 313 288 393 435 401 333---------------------------------------------------------------------------------------------------------------------------------------B 15-30 1 127 126 137 139 143 158 206 271C 31-60 3 203 166 145 169 167 192 194 192D 61-90 10 178 261 207 217 133 60 45 33---------------------------------------------------------------------------------------------------------------------------------------E 91-120 30 18 19 20 20 22 13 09 07F 121-50 50 49 15 15 14 10 07 07 07G 151-80 70 15 08 09 10 08 10 10 09
H gt180 100 104 87 85 77 68 72 61 51R$billion 2094 2353 2614 3016 3855 4736 5739 818---------------------------------------------------------------------------------------------------------------------------------------Source Caixa Annual Reports 2002-2008
The credit risk matrix of Caixa loans from 2001 to 2008 confirms this trend ofimprovement (See above table) The data also provide evidence of greater transparency andthe improvement of bank reporting and accounting standards as well as Central Banksupervision of banks Instead of two categories of credit (good = all loans up to 90 daysoverdue bad = loans over 90 days overdue) the Central Bank of Brazil has adoptedinternational standards of credit classification (from AA to H) and imposed regulations that
banks increase or decrease provisions according to the distribution of loans in thesecategories The scale of provisions required by the Central Bank vary from zero percentagainst loans classified as AA to provision of 100 percent of loan values for credits classifiedas H that is to say over 180 days late
The percent of loans over 180 days late has decreased from 104 percent of total in2001 to 51 percent in 2008 Furthermore all categories of late payment except for loansbetween 15-30 days late decreased significantly from 2001 through 2008 In comparisonloans classified as AA (paid and guaranteed) and A (paid on time) increased from 59 percentto 94 percent and 243 percent to 333 percent of total loans The only category of late loansthat increased over the period is that of loans 15-30 days overdue from 127 percent to 271percent of total
The central argument of this study is that Brazilian federal government banks retaininstitutional foundations of competitive advantage over private and foreign banks Further
8132019 Government Banking and BRICs in the Recent Financial Crisis
httpslidepdfcomreaderfullgovernment-banking-and-brics-in-the-recent-financial-crisis 2557
983106983122983113983107 983111983151983158983141983154983150983149983141983150983156 983106983137983150983147983155 983137983150983140 983110983145983150983137983150983139983145983137983148 983123983156983137983156983141983139983154983137983142983156
25
data that suggests this advantage can be seen in the increasing volume and market share ofthe Caixa in debit and credit cards The number of Caixa debit cards increased from 224million in 2002 to over 482 million in 2008 with Caixa market share of debit cards increasedfrom 196 percent ot total card market in 2002 to peak at 230 percent in 2005 and remainingat 219 percent of the total number of debit cards in Brazil in 2005
Two examples illustrate the institutional foundations of comparative advantage of theCaixa in the card payment industry First like other banks in Brazil the Caixa shares anagreement with Visa for payment processing However unlike other banks in Brazil theCaixa was contracted by the federal government to distribute ATM citizenship cards torecepients of federal government family grants and other transfer programs Apparentlywithout seeking approval the Caixa stamped its brandname on the federal government ATMcitizenship card and has continued to do so despite charges of unfair competition fromprivate domestic banks Furthermore a Caixa request to transform its 110 million ATMcitizenship cards into bank cards currently pending at the Central Bank would dramaticallyincrease the number of bank card holders in Brazil (1824 million at year end 2007)
Caixa Debit and Credit Card Market Shares 2002-2008
Million Debit Cards Million Credit Cards MillionCaixa Total Mkt Caixa Total Mkt Interbank Checks
----------------------------------------------------------------------------------------------------------------2002 224 1142 (196) 16 407 (39) 229502003 280 1254 (223) 18 440 (40) 213602004 320 1491 (213) 20 535 (37) 196702005 377 1639 (230) 25 675 (37) 183902006 384 1744 (220) 31 952 (32) 162202007 400 1824 (219) 39 1177 (33) 144902008 482 42----------------------------------------------------------------------------------------------------------------Source Central Bank of Brazil Diagnoacutestico do Sistema de Pagamentos de Varejo do Brasil Adendo Estatiacutesticondash 2007 p 9 and Caixa annual reports 2003-2008
Having reviewed the Banco do Brasil and Caixa a brief look at the counter-cyclicalpolicies and performance of the third Brazilian federal government bank ndash the BNDES ndash is inorder
Banco Nacional de Desenvolvimento Econocircmico e Social (National Bank for Economic
and Social Development BNDES)
The BNDES is a paradigmatic development bank The trajectory of the BNDES involves asequence of policies and financial practices that have shaped Brazilian development Duringthe 1950s the BNDE supplied direct credits for transportation electric energy infrastructureand steel production During the 1960s the bank diversified under financial reforms Duringthe 1970s the BNDE acted to complete state-led import substitution industrialization bychanneling foreign finance and forced savings into capital goods project lending and regionaldevelopment programs During the 1980s the bank shifted away from public investmentunder pressure of fiscal crisis and foreign debt During the 1990s the BNDES became agentfor the privatization of state owned enterprises The BNDES remained virtually the onlysource of long-term finance during a decade of financial crises in emerging markets (1994-2003) Since 2000 the bank has shifted toward ldquosecond generationrdquo reforms designed tofinance the private sector and free market forces deepen domestic capital and equity markets
8132019 Government Banking and BRICs in the Recent Financial Crisis
httpslidepdfcomreaderfullgovernment-banking-and-brics-in-the-recent-financial-crisis 2657
983106983122983113983107 983111983151983158983141983154983150983149983141983150983156 983106983137983150983147983155 983137983150983140 983110983145983150983137983150983139983145983137983148 983123983156983137983156983141983139983154983137983142983156
26
and lend to small medium and micro-enterprises Since 2004 capital inflows and a boomingdomestic stock market have reinforced the capacity of the BNDES to underwrite long-terminvestments and transform large Brazilian firms into multinational corporations Since 2007BNDES President Coutinho has pursued a full service approach attempting to help star-upsmall and medium firms provide funds to expand successful firms and participate in venture
capital funds to help enterprises transit toward corporate governance standards and initial orsecondary offerings of stock on the Bovespa exchange In 2008 as financial crisis led to ashortage of credit collapse of share prices and sharp decline in industrial production byfourth quarter 2008 the BNDES also provided lending of last resort to major Braziliancorporations while retaining long term goals for massive investments in deep sea petroleumproduction
BNDES Market Share of Interbank and Non-Bank Loans 1995-2008 US$ Billion
Interbank Loans Non-Bank Loans------------------------------------------ ------------------------------------------
BNDES Mkt Total BNDES Mkt Total-----------------------------------------------------------------------------------------------------------1995 156 (324) 481 80 (38) 20711996 181 (354) 511 109 (49) 21981997 197 (278) 707 145 (68) 21031998 216 (355) 608 230 (113) 20201999 204 (410) 497 150 (35) 14282000 243 (439) 553 152 (96) 15772001 259 (504) 515 145 (104) 13912002 233 (443) 525 137 (130) 10512003 261 (419) 622 200 (141) 14152004 306 (408) 749 218 (122) 17862005 343 (373) 918 277 (113) 24312006 388 (350) 1106 329 (102) 32312007 524 (335) 1563 432 (88) 48852008 530 (493) 1073 456 (96) 4743200920102011-----------------------------------------------------------------------------------------------------------Source Central Bank of Brazil Top 50 Banks 1995-2008
Revew of BNDES lending since 1995 suggests the realization of competitiveadvantages typical of a large centralized development bank Contrary to the extensive branchoffice networks retained by the Banco do Brasil and Caixa the BNDES retains under 1900employees (compared to 105000 at Caixa) in the Rio de Janeiro and four regional officesSince 1995 the BNDES increased its market share of non-bank loans from R$80 billion (38percent) to R$200 billion (141 percent) during the economic downturn risk aversion andcredit shortage in 2003 After 2003 the BNDES market share of loans to non-financialentities decreased to 88 percent of total loans albeit increasing during 2008 to 96 percentThis suggests that the BNDES has increased its market share of lending to non-financialsector since liberalization of the industry and privatization of state government banks
8132019 Government Banking and BRICs in the Recent Financial Crisis
httpslidepdfcomreaderfullgovernment-banking-and-brics-in-the-recent-financial-crisis 2757
983106983122983113983107 983111983151983158983141983154983150983149983141983150983156 983106983137983150983147983155 983137983150983140 983110983145983150983137983150983139983145983137983148 983123983156983137983156983141983139983154983137983142983156
27
BNDES inter-bank lending also increases substantially Since the Real Plan endedinertial inflation in 1994 the BNDES has expanded its market share of interbank lendingfrom 156 billion (324 percent) in 1995 to 530 billion (493 percent) in 2008 during creditshortage and stock market collapse During previous years of financial crisis and economicreversals the BNDES also increased interbank lending significantly For example during the
1999 and 2001 crises BNDES interbank lending increased to 410 percent and 504 percentof total This marked presence in interbank loan market reflects the role of the BNDES inproviding indirect lending to targeted sectors through private foreign and other governmentbanks in Brazil
BNDES Loan Approvals by Program 1995-2007 R$ Billion
Direct Lending 1999 2000 2001 2002 2003 2004 2005 2006 2007 2008 2009--------------------------------------------------------------------------------------------------------------------------------------Finem 51 55 68 133 79 114 132 145 220 285Capital Markets 16 19 09 08 09 06 20 34 35 104Export-Import 23 34 39 77 63 56 67 40 13 32
Sub-Total 91 109 118 219 153 177 220 221 269 424Percent Total (505) (474) (468) (585) (456) (447) (469) (430) (415) (464)
Indirect Lending--------------------------------------------------------------------------------------------------------------------------------------Finem 31 40 37 16 12 16 18 27 51 60Finame 16 25 33 40 53 66 93 107 170 221Finame Agro 07 13 18 30 28 45 21 14 20 27Finame Leasing 00 000 02 02 03 02 04 06 14 16Export-Import 14 23 20 40 56 54 73 97 67 95BNDESautom 18 17 22 24 27 34 36 35 50 55Sub-Total 89 120 134 154 182 220 249 292 379 484Percent Total (495) (526) (532) (415) (544) (553) (531) (570) (585)(536)
BNDES Total 180 230 252 374 335 398 469 513 648 908----------------------------------------------------------------------------------------------------------------Source BNDES statistics by modality available on wwwbndesgovbr
Review of BNDES finance by program suggests the evolution of credit policies from1995 through 2008 and increasing reliance on indirect lending through other financialintermediaries The three major programs of direct finance Financiamento aEmpreendimentos (Business Finance Finem) Mercado de Capitais (Capital Markets) andExport-Import finance remained between 505 percent and 415 percent of total BNDESlending with the exception of 2002 Indirect lending through six broad programs remained
between 495 percent and 585 pecent of total BNDES lending with the exception of 2002Indirect lending programs include Finem business lending Financiamento de Maquinas(Machine Finance Fineme) with agricultural and leasing modalities Export-Import financingand BNDES automatic lending provisions
These trends suggest the realization of competitive advantages over private andforeign banks in Brazil BNDES long term interest rates remained substantially lower thanSelic benchmark overnight inter-bank interest rates throughout this period while the lowercost of small staff and operations of the BNDES made lending at these rates viable Anothercompetitive advantage of the BNDES over private and foreign banks is the developmentbankacutes mandate as manager of funds from the forced savings fund Fundo de Amparo ao
Trabalhador (Worker Asssistance Fund FAT) Constitutionally mandated investments inproductive activities (not government bonds) increased from R$31 billion in 2000 to R$101
8132019 Government Banking and BRICs in the Recent Financial Crisis
httpslidepdfcomreaderfullgovernment-banking-and-brics-in-the-recent-financial-crisis 2857
983106983122983113983107 983111983151983158983141983154983150983149983141983150983156 983106983137983150983147983155 983137983150983140 983110983145983150983137983150983139983145983137983148 983123983156983137983156983141983139983154983137983142983156
28
billion in 2008 comprising 170 percent of BNDES liabilities This means that 170 percentof BNDES finance and lending is based on long-term deposits that provide no liquidity riskThis provides a competitive advantage over private and foreign banks
A closer look at BNDES lending by sector suggests that the bank still focuses
primarily on industry and infrastructure Despite the adoption of second generation reformsthat seek to free market forces and accelerate innovation and productivity through small andmedium enterprises BNDES lending still focuses on large scale industrial and long-terminfrastructure finance In this respect the BNDES embodies a persistent need in developingeconomy for state-led development banking along the lines emphasized by Lewis Myrdaland development economists 50 years ago This traditional sense of commanding heights thusstill captures the role of the BNDES in Brazilian political economy Despite more than twodecades of privatizations financial liberalization bank reforms and a variety of fiscalfinancial and economic reforms that have substantially modernized the domestic Brazilianeconomy and freed market forces the BNDES remains the single most important source forlong-term finance and credit The capitalization of the Bovespa stock market from 2004-
2008 for the first time in Brazilian history reduced the virtual monopoly of BNDES overlong term finance
BNDES Operations approved and invested by Sector 1998-2007 R$billion
1998 1999 2000 2001 2002 2003 2004 2005 2006 2007Industry ----------------------------------------------------------------------------------------------------------------------------approved 96 79 126 152 171 163 145 290 395 402invested 76 84 104 132 174 161 158 234 272 306
Infrastructure ----------------------------------------------------------------------------------------------------------------------approved 116 69 110 65 161 149 137 186 240 369invested 83 66 86 75 130 100 152 171 170 209
Other--------------------------------------------------------------------------------------------------------------------------------approved 18 47 40 54 79 93 117 69 108 126investedTotal --------------------------------------------------------------------------------------------------------------------------------approved 230 195 276 271 411 404 379 545 743 897invested 190 181 230 252 374 335 398 470 513 617
----------------------------------------------------------------------------------------------------------------Source BNDES Annual Reports 2003-2008 and testimony of BNDES President to Congress March 2009
Long-term investments have produced substantial profits at the BNDES The bank hasrecorded profits each year since 1999 increasing from over R$600 million in 1999 overR$32 billion during 2005 reaching over R$73 billion in 2007 The long-term character of
BNDES finance stands in stark contrast to policies at private banks Contrary to strategy ofprivate and foreign banks to trade and hold government paper described in chapter three theBNDES suspended purchase and trading in government paper because of constitutionalmandates to contribute to development and employment Furthermore the turn to capitalmarkets at the BNDES has provided substantial returns since 2004
However this does not mean that BNDES lending protected unproductive industriesInstead of wasting resources to unnecessarily bail out firms or provide crony credit highreturns and strong profits at the BNDES suggest that lending was sound Standard indicatorsof bank performance asset quality and capital reserves against credit and capital risk provideempirical control for this All these measures suggest that the BNDES weathered the periodof adjustment and sustained counter-cyclical investment policies without placing resources atrisk beyond Central Bank of Brazil regulations and BIS guidelines And returns have
8132019 Government Banking and BRICs in the Recent Financial Crisis
httpslidepdfcomreaderfullgovernment-banking-and-brics-in-the-recent-financial-crisis 2957
983106983122983113983107 983111983151983158983141983154983150983149983141983150983156 983106983137983150983147983155 983137983150983140 983110983145983150983137983150983139983145983137983148 983123983156983137983156983141983139983154983137983142983156
29
increased since recovery in 2004 BNDES participation in the booming Bovespa stock marketsince 2003 has provided record returns
The BNDESpar subsidiary that invests in capital markets has also recorded strongreturns during the period of economic growth and into the 2008 financial crisis BNDESparreturns on liquid assets increased from 75 percent in 2004 to 277 percent in 2007 declining
to 245 percent in 2008 Average returns on assets and stock holdings also remained highbuilding the assets held by the BNDESpar subsidiary from 141 billion in 2005 to 359 billionin 2008
This increased participation of the BNDES in capital markets involves new relationsand networks across government private sector labor unions the private pension funds ofgovernment bank and government enterprise employees and financial markets By 2007BNDES participation in stockholding and mutual funds reached across 261 forms and 25mutual funds totaling over R$910 billion reals The BNDES thereby retains broad portfoliothat represents institutional foundations of comparative advantage Furthermore unlike thepolicy of private and foreign banks to trade and hold high interest rate paying short termgovernment paper during the sudden stop of foreign finance and downturn in the Brazilian
business cycle (2002-3) the BNDES expanded credit operations and reduced financialoperations in secondary markets for indexed government paper This countered the perverseimpact of the liquidity preference among private and other government banks that increasedmarket pressures and led to shorter terms and higher cost of Brazilian government debt
BNDES aversion of government paper is required by constitutional mandate tomanage forced savings funds in ways that generate employment and income As noted alarge part of BNDES resources (liabilities) are from domestic official savings programs Thevalue of FAT resources increased from R$492 billion in 2003 to R$662 billion in 2005while the PIS-Pasep fund remained at approximately R$200 billion Foreign capital has alsobeen channeled to the BNDES through multilateral agencies and foreign bond issues Foreignloans to the BNDES have declined Multilateral agencies provided R$70 billion in 2003increased funding to R$129 billion during 2004 and continued to provide R$107 billion tothe BNDES during 2005
Comparison of BNDES structure and performance with development banks abroadsuggests both the large scale and scope of BNDES operations and controls formismanagement and political abuse of the bank In 2007 BNDES total assets are almostdouble the value reported by the Inter-American Development Bank (IADB) over frac12 thevalue of total assets held by the World Bank and almost ten times the value of assets held bythe French government development bank CAF Furthermore profits and loans from theBNDES far exceeded all three institutions The US$330 billion in loans reported by theBNDES far exceed the US$67 billion from the IADB the US$110 reported by the World
Bank and US$58 billion reported by the CAF BNDES profis returns on assets and return onliquid patrimony also far exceeded those reported by these three development banks thatserve as comparative control over performance and policies at the BNDES Finally lateloans at the BNDES remained at 011 percent of total loans well below levels reported by theWorld Bank comparable to the 010 percent reported by the IADB while considerably abovethe 001 percent reported by CAF
8132019 Government Banking and BRICs in the Recent Financial Crisis
httpslidepdfcomreaderfullgovernment-banking-and-brics-in-the-recent-financial-crisis 3057
983106983122983113983107 983111983151983158983141983154983150983149983141983150983156 983106983137983150983147983155 983137983150983140 983110983145983150983137983150983139983145983137983148 983123983156983137983156983141983139983154983137983142983156
30
Comparison of BNDES and Regional Development Banks 2007 US$ billion
BNDES IADB World Bank CAF----------------------------------------------------------------------------------------------------------------Total Assets 1144 699 2080 125
Liquid Patrimony 140 203 399 41Liquid Profits 38 01 -01 04Desembolsos 339 67 110 58Credit Portfolio 928 479 978 95Capitalization percent 123 291 192 328Return on Assets percent 38 47 na 36Return on PL percent 332 07 na 105Late Loans percent 011 010 086 001----------------------------------------------------------------------------------------------------------------Source BNDES Annual Report 2007
The large scale of BNDES lending and finance make it possible for governmentpolicy to provide counter cyclical credit to avert or ameliorate economic downturns andsubstitute private and foreign credit shortages In March 2009 testimony to Congress ongovernment policies during financial crisis BNDES President Coutinho argued that bankpolicy was to reduce the cost and increase the supply of credit Resources for counter cyclicallending during 2008-2009 came from Treasury loans to BNDES released by provisionaldecrees 439 and 414 summing R$175 billion transfer of R$60 billion in CVS funds sale ofFGTS Investment Fund and bank certificates summing R$170 billion Furthermore the thirdphase of conditional credit facility shared by Inter-American Development Bank and theBNDES provided the last tranch of a total US$60 billion for BNDES operations
Two further means were used by the BNDES to infuse capital during the collapse of
the stock market and shortage of credit during 2007-8 The counter cyclical policies of theBNDES can also be seen in the over two fold increase of BNDES holdings in private equityand investment funds Table 512 reports the value of private equity and investment fundholdings of the BNDES in 2007 and 2008 BNDES funds in private equity and mutual fundsincreased from R$4038 million in 2007 to over R$10 billion in 2008 The capitalization ofmutual funds and private equity firms by the BNDES also played an important countercyclical role during this period
BNDESpar Shareholding 2007-8 R$million
Percent Value ValueShares 2008 2007
----------------------------------------------------------------------------------------------------------------Ameacuterica Latina Logiacutestica 106 6386 -Aracruz 55 1292 1292Banco do Brasil 25 10854 12752Bom Gosto (2) 345 2458 -Brasil Telecom Part 30 1666 1958Braskem 52 2275 2432Brenco 209 1400 -CEG 345 1406 -CESP 57 2347 1397Coteminas 103 1150 1340
CPFL Energia 62 6081 5506Cia Sideruacutergica Nacional 36 1513 2686CVRD 40 15082 7098
8132019 Government Banking and BRICs in the Recent Financial Crisis
httpslidepdfcomreaderfullgovernment-banking-and-brics-in-the-recent-financial-crisis 3157
983106983122983113983107 983111983151983158983141983154983150983149983141983150983156 983106983137983150983147983155 983137983150983140 983110983145983150983137983150983139983145983137983148 983123983156983137983156983141983139983154983137983142983156
31
ELETROBRAacuteS (1) 118 22400 22400EMBRAER 50 1096 1096Gerdau 35 1533 490Independecircncia 139 2500 -JBS 130 14722 11370Klabin 202 5621 -
Light 336 8225 -Marfrig 146 8176 1020MPX Mineraccedilatildeo 26 1791 1791Ouro Fino 200 1057 840Paranapanema 175 1252 08Petrobraacutes 76 10226 10226Rede Energia SA 253 2633 -Tele Norte Leste Participaccedilotildees 16 1645 1645Valepar 97 26254 15585Subtotal 163055 102941Other firms 12223 12606Total 175278 115548----------------------------------------------------------------------------------------------------------------
Source BNDESpar Financial Statements 2008 pp
The BNDES also holds blocks of shares in many major Brazilian corporationsthrough its participation subsidiary BNDESpar Comparing value of investments in 2007 and2008 suggests that large purchases capitalized firms precisely as financial crisis and downturnin Bovespa stock market made it difficult for firms to find working capital Table X reportsthe percent of total company shares held by the BNDES and their respective market values(adjusted for risk of future losses) at year end 2007 and 2008 During this year of extremelyshort and expensive credit in Brazil caused by the international financial and banking crisisthe BNDES increased shareholding by over R$60 billion reals in 28 private Brazilianenterprises Further shareholding classified as X in Five firms (Bertin 269 Brasiliana 538
Copel 239 Rio Poliacutemeros 250 Telemar 313) Once again the BNDES provided access tocapital for firms caught in the sudden credit crunch and stock market collapse unable to meetobligations or raise funds through equity issues or commercial bank credit This countercyclical role of government banks has been critical in Brazil since the 19 th century
BNDESpar Private Equity and Fund Participation 2007-2008 R$million
Fund Manager 2008 2007-------------------------------------------------------------------------------------------------------------------------Brasil 21 Dynamo 46 60PROT Mellon Financial Services 4628 -
Logiacutestica Brasil Bradesco 135 -Fire BrasilPrivate 269 250FIPGG Governanccedila amp Gestatildeo Inv 289 311Opportunity Equity Partners Mellon Financial Services 1046 578Brasil Energia Bradesco 1184 655InfraBrasil ABN-Amro 677 251Rio Bravo Cinema Rio Bravo 116 110Brascan Petro amp Gaacutes Bank Brascan 136 113AG Angra Infra-Estrutura Bradesco 380 301Satildeo Paulo Metro Fund Bradesco 791 831Other Funds 653 572Total 10356 4038---------------------------------------------------------------------------------------------------------------------------
Source BNDESpar Financial Statements 2008
8132019 Government Banking and BRICs in the Recent Financial Crisis
httpslidepdfcomreaderfullgovernment-banking-and-brics-in-the-recent-financial-crisis 3257
983106983122983113983107 983111983151983158983141983154983150983149983141983150983156 983106983137983150983147983155 983137983150983140 983110983145983150983137983150983139983145983137983148 983123983156983137983156983141983139983154983137983142983156
32
Finally Brazilian federal government triennial plans include investment targets by theBNDES If current plans are compared to 2004-7 investments several structural changes inBNDES lending appear First BNDES plans for Oil and Petroleum production reveal aprofound change for Brazilian political economy In 1990 roughly 45 percent of oilconsumed in Brazil was imported In 2007 before oil price increased reversed the balance
Brazil reported domestic production levels sufficient to meet domestic consumptionFurthermore discoveries of substantial deep sea oil reserves have led the BNDES to planmassive investments involving Petrobras and other global petroleum firms For the 2009-2012 period investments in petroleum and gas (R$2697 billion) Petrochemicals (237) andEthanol (197) sum to over R$3130 billion
BNDES Triennial Investment Plans 2004-2012
2004-7 2007-10 2008-11 2009-12----------------------------------------------------------------------------------------------------------------Petroleum amp Gas 1472 1836 2028 2697
Mining 472 527 813 480Petrochemicals 64 174 264 237Steel 198 371 312 245Automotive 150 176 264 235Electronics 143 156 140 240Ethanol 166 205 205 197Paper amp Celulose 104 200 274 90Health 51 46 51 80Industry Total 2816 3802 4437 4501----------------------------------------------------------------------------------------------------------------Source BNDES Annual Reports 2002-2006
It is of note that President Dilma Roussef was instrumental in reducing the targets for2009-12 in petroleum and gas given indications that Petrobras and existing framework foroffshore oil prospecting and production proved unable to increase investments accordingly
The BNDES also retains a presence in government projects by providing managementassistance During 2008 BNDES staff provided management support for implementation of192 projects involving R$710 billion of total R$142 billion PT government growthacceleration projects BNDES staff also participated in the design management andimplementation of President Lularsquos Poliacutetica de Desenvolvimento Produtivo (Policy forProduction Development) involving R$2100 billion targeting production chains designed tomaximize employment and regional development benefits Finally the BNDES was alsocharged to create and co-manage a Fundo Amazonia with the Ministry of Environment toprovide incentives to reduce deforestation of the Amazon region BNDES Plans for 2009include completion of concession for construction of high speed train line and service for Riode Janeiro-Satildeo Paulo corridor two blocks of highway concession sales involving three majorhighways in each block of sales sale of management concessions for regional airports andthe reorganization of INFRAERO federal government airport management company
These policies reflect the goal of BNDES policy to launch firms on the stock marketrather than maintain direct credit and finance Exceptions during 2008 involve Auto andEthanol industies both for strategic and broader policy reasons Given the sharp downturn inauto sales during fourth quarter 2008 the BNDES provided significant lending to avert
further downsizing or failure of auto companies in Brazil Given the current globalredistribution of automobile production BNDES policies are designed to help the Brazilian
8132019 Government Banking and BRICs in the Recent Financial Crisis
httpslidepdfcomreaderfullgovernment-banking-and-brics-in-the-recent-financial-crisis 3357
983106983122983113983107 983111983151983158983141983154983150983149983141983150983156 983106983137983150983147983155 983137983150983140 983110983145983150983137983150983139983145983137983148 983123983156983137983156983141983139983154983137983142983156
33
operations of major auto firms through the period of adjustment and increase theattractiveness of domestic operations in global production strategies of multinational autocompanies Ethanol production also received massive funds to sustain an industry seen ascritical for alternative and sustainable fuel source capable of replacing petroleum Ethanolreached over 50 percent of automotive fuel sales in 2007
Under the Lula government (2003-10 the BNDES also resumed lending to state andmunicipal governments Since the renegotiation of municipal and state government debts inthe late 1990s states and municipalities have been largely prohibited from taking on debtThis was emplematic of the recentralization required to control fiscal excesses during militaryrule and the prolonged period of transition to democracy Policies during the 1990s weredesigned to avert overspending seen as critical to maintain price stability under the Real Plan(1994) In 2000 the Lei de Responsibilidade Fiscal (Fiscal Responsibility Law) largelyprohibited credit and finance to state and municipal governments Since 2000 municipalitiesand states have been required to submit detailed budget statements that in turn have been thebasis for a gradual return to sub-national government finance In August 2006 central bankand Treasury regulations freed municipalities to take on credit up to 12 times liquid receipts
Since then the BNDES has led in terms of credits and finance to subnational governmentsthrough a Programa Especial de Financiamento aos Estados e Distrito Federal
The BNDES also has developed the first system in Brazil for risk analysis ofmunicipal governments and has led in the market for municipal credit freed by August 2006procedures for approval at Treasury the Central Bank and Conselho Monetaacuterio Nacional(National Monetary Council) Prosecution of mayors and firms charged with managingmunicipal credits with the BNDES revealed fraudulent practices These funds for sub-national public finance also became critical mechanisms to counter severe budget shortfallscaused by financial crisis during 2008 Given that municipal and state government tax basesare shallow and that federal government transfers provide the bulk of sub-nationalgovernment resources the Lula administration allocated R$ 40 billion to the Fundo deParticipaccedilatildeo dos Estados (State Participation Fund) through a Programa Emergencial deFinanciamento (Emergency Finance Fund) administered by the BNDES
In sum the BNDES expanded credit and finance operations substantially during fouryears of sustained growth from 2004-2007 And having helped underwrite the stock marketboom and capitalized Brazilian firms directly and indirectly through credit finance mutualfunds and private equity funds the BNDES retained sufficient scale scope and capital baseto provide counter cyclical credit and finance to help firms adjust to financial crisis and creditshortage during 2008 In retrospect the growth of the BNDES since liberalization andprivatizations of state government banks in the 1990s suggest the comparative advantages of
development banking BNDES credit and finance fell to 52 percent of fixed capitalformation in 1995 Since then the turn to neo-developmentalism and a period of sustainedeconomic growth during the Lula administration increased the BNDES share of total fixedcapital formation during 2006 and 2007 to 126 and 141 percent Critics charge thatmonopoly over FGTS and PIS-PASEP official savings funds as liabilities provide theBNDES with unfair competitive advantage over private banks In 2008 forced savings fundssummed to only 17 percent of BNDES liabilities (resources) The BNDES does not relyexclusively on forced savings for competitive advantage Instead market-oriented policies
joint-ventures with private mutual funds investment funds private equity firms large blocksof shareholding in Brazilian firms and massive amounts of credit and investment to theprivate sector at below market but still profitable long term interest rates of 625 percent
suggest that the large scale and scope of BNDES operations provide institutional foundationsof competitive advantage over private and foreign banks
8132019 Government Banking and BRICs in the Recent Financial Crisis
httpslidepdfcomreaderfullgovernment-banking-and-brics-in-the-recent-financial-crisis 3457
983106983122983113983107 983111983151983158983141983154983150983149983141983150983156 983106983137983150983147983155 983137983150983140 983110983145983150983137983150983139983145983137983148 983123983156983137983156983141983139983154983137983142983156
34
Capitalization of the BNDES by Treasury of over R$2300 billion 2009-11hascaptured attention of many observers of Brazilian development Critics and advocates agreethat the BNDES has realized significant competitive advantages over private and foreignbanks and continues to serve as significant alternative to capital markets for large scaledevelopment projects However like the downturn in planned investments by Petrobras for
oil and gas exploration and production BNDES decreased planned investments fromR$1684 billion in 2010 to R$1397 billion in 2011 We believe this indicates the limits ofmanagement and passing of period of crisis both favoring finance from capital marketsbanks and public-private partnerships
India
Analysis of Brazilian federal banks suggests that these institutions provided policy alternativewhile realizing competitive advantage over private and foreign banks The modernization ofthese institutions helps explain why these large institutions were able to stay the effects ofcredit crunch and financial market downturn in Brazil This section explores data from the
Reserve Bank of India to compare market shares of types of banks from 1972-2008 and bankperformance from 2006-10 Further analysis will be required However the data appears tosupport our core argument that government banks have modernized and realized competitiveadvantages over private and foreign banks
First the number of branch offices which serves as a measure of institutionalcoverage across India of special concern for financial inclusion and the theory thatliberalization and privatizations would lead private banks to expand branch offices andincrease the supply of services From this perspective the trajectory of branch officessuggests that nationalized banks the State Bank of India and regional rural bankssustain much larger networks of branch offices that predominate while otherscheduled commercial (private and foreign) banks retain less than 8000 branch offices
Data from the Reserve Bank of India on the number of current accounts retainedby type of bank provide further evidence that the State Bank of India and its associates
8132019 Government Banking and BRICs in the Recent Financial Crisis
httpslidepdfcomreaderfullgovernment-banking-and-brics-in-the-recent-financial-crisis 3557
983106983122983113983107 983111983151983158983141983154983150983149983141983150983156 983106983137983150983147983155 983137983150983140 983110983145983150983137983150983139983145983137983148 983123983156983137983156983141983139983154983137983142983156
35
national banks and regional rural banks provide the bulk of banking accounts to theIndian population while private and foreign banks cherry pick upscale urban marketsreproducing capital drain and inequalities
Number of Current Accounts by Type of Bank 1972-1995
Since 1999 the pattern of predominance by alternative banking institutions and the minorrole of other scheduled commercial banks and foreign banks continues
The following figures report the value held in current accounts by type of banks first fromthe 1972-1995 period then from the 1999-2008 period For both time periods the trendconfirms that private and foreign banks remain at a competitive disadvantage in terms of thebroader market while the State Bank of India and its associates nationalized banks andregional rural banks tend to predominate
8132019 Government Banking and BRICs in the Recent Financial Crisis
httpslidepdfcomreaderfullgovernment-banking-and-brics-in-the-recent-financial-crisis 3657
983106983122983113983107 983111983151983158983141983154983150983149983141983150983156 983106983137983150983147983155 983137983150983140 983110983145983150983137983150983139983145983137983148 983123983156983137983156983141983139983154983137983142983156
36
Current Account Value by Type of Bank 1972-1995 R
Number of Deposit Accounts by type of bank 1999-2008
A similar pattern appears for the trajectory of savings accounts both the number of
accounts and the value held in savings accounts both for the 1972-1995 period We wereunable to organize data from the more recent period
8132019 Government Banking and BRICs in the Recent Financial Crisis
httpslidepdfcomreaderfullgovernment-banking-and-brics-in-the-recent-financial-crisis 3757
983106983122983113983107 983111983151983158983141983154983150983149983141983150983156 983106983137983150983147983155 983137983150983140 983110983145983150983137983150983139983145983137983148 983123983156983137983156983141983139983154983137983142983156
37
Number of Savings Accounts by Type of Bank 1972-1995
Value in Savings Accounts by Type of Bank 1972-1995
Number of Term Savings Accounts by Type of Bank 1972-1995
8132019 Government Banking and BRICs in the Recent Financial Crisis
httpslidepdfcomreaderfullgovernment-banking-and-brics-in-the-recent-financial-crisis 3857
983106983122983113983107 983111983151983158983141983154983150983149983141983150983156 983106983137983150983147983155 983137983150983140 983110983145983150983137983150983139983145983137983148 983123983156983137983156983141983139983154983137983142983156
38
Value in Term Savings Accounts by Type of Bank 1972-1995
The number and value of credits extended by banks from 1999-2008 appears mostpromising in terms of comparative analysis of bank performance and behavior Thesignificant spread at the end of the time series between the State Bank of India and itsassociates and foreign banks suggests the impact of foreign financial crisis and differentdomestic policies by these types of banks in India similar to that noted in the Brazilianexperience
Number of credits by type of bank 1999-2008
Value of credit by type of bank 1996-2008
8132019 Government Banking and BRICs in the Recent Financial Crisis
httpslidepdfcomreaderfullgovernment-banking-and-brics-in-the-recent-financial-crisis 3957
983106983122983113983107 983111983151983158983141983154983150983149983141983150983156 983106983137983150983147983155 983137983150983140 983110983145983150983137983150983139983145983137983148 983123983156983137983156983141983139983154983137983142983156
39
Further data from the Reserve Bank of India from 2008-10 permit closercomparison of government private and foreign banks in the recent financial crisis Interms of deposits investments total assets and net profits the dominant and expandingrole of government banking in India is apparent Further control variables (not reported)
include gross and net NPA types of income expenses and expenditures provisions andcontingencies and credit- and investment-deposit ratios provide control for bad bankingand confirm the counter cyclical policies during 2008-10 in India
THE FOLLOWING TABLES REQUIRE INTERPRETATION
Number of Banks 2006-7 2007-8 2008-9 2009-10 2010-11
State Bank of India amp Associates 8 8 7 7 6Nationalized Banks 20 20 20 20 20Old Private Sector Banks 17 15 15 15 14
New Private Sector Banks 8 8 7 7 7Foreign Banks 29 28 31 32 33Source RBI A Profile of Banks 2010-11
Number of Branch Offices 2006-7 2007-8 2008-9 2009-10 2010-11
State Bank of India amp Associates 14673 15848 16894 18178 18772Nationalized Banks 37435 39255 40956 43452 45640Old Private Sector Banks 4723 4690 4908 5220 5011New Private Sector Banks 2599 3635 4333 5232 6957
Foreign Banks 272 277 295 308 316Source RBI A Profile of Banks 2010-11
Number of Employees 2006-7 2007-8 2008-9 2009-10 2010-11
State Bank of India amp Associates 255699 249008 268598 266605 282453Nationalized Banks 473179 466400 462926 473041 475082Old Private Sector Banks 47994 48700 51341 55052 55075New Private Sector Banks 91060 110123 124998 127468 163604Foreign Banks 28426 31301 29582 28012 27968
Source RBI - India BanksAssociation
Business per employee (in lakh) 2006-7 2007-8 2008-9 2009-10 2010-11
State Bank of India amp Associates 43635 54922 65022 73743 79306Nationalized Banks 49001 61828 78316 93586 114477Old Private Sector Banks 48159 56932 63843 69749 8149New Private Sector Banks 80782 83196 78715 84041 82607Foreign Banks 97477 11255 128274 141139 155974Note Business = Deposits + Advances
8132019 Government Banking and BRICs in the Recent Financial Crisis
httpslidepdfcomreaderfullgovernment-banking-and-brics-in-the-recent-financial-crisis 4057
983106983122983113983107 983111983151983158983141983154983150983149983141983150983156 983106983137983150983147983155 983137983150983140 983110983145983150983137983150983139983145983137983148 983123983156983137983156983141983139983154983137983142983156
40
Profit per employee (in lakh) 2006-7 2007-8 2008-9 2009-10 2010-11
State Bank of India amp Associates 257 362 443 466 42Nationalized Banks 287 377 486 567 695Old Private Sector Banks 234 406 469 42 563New Private Sector Banks 587 685 677 847 893Foreign Banks 1613 2112 2539 1692 2759
Capital amp Reserves amp Surplus(Ycrore) 2006-7 2007-8 2008-9 2009-10 2010-11
State Bank of India amp Associates 42941 61706 72422 83726 84394Nationalized Banks 92689 113079 135920 157276 205857Old Private Sector Banks 10736 15315 17477 20171 23821New Private Sector Banks 39736 76056 82192 99813 114768Foreign Banks 33075 49332 59937 69176 80972
Deposits Ycrore 2006-7 2007-8 2008-9 2009-10 2010-11
State Bank of India amp Associates 633476 773875 1007041 1108086 1245862Nationalized Banks 1360724 1679993 2105706 2583934 3127122Old Private Sector Banks 138249 165589 199274 229897 264157New Private Sector Banks 413738 509444 537104 592904 738602Foreign Banks 150750 191161 214076 232099 240689
Investments Ycrore 2006-7 2007-8 2008-9 2009-10 2010-11
State Bank of India amp Associates 211875 263823 357624 387473 385697Nationalized Banks 452981 536018 655042 828125 942837Old Private Sector Banks 43647 54080 72393 83499 92617New Private Sector Banks 171008 224498 234139 270618 329403Foreign Banks 71471 98910 130354 159291 165499
Advances Ycrore 2006-7 2007-8 2008-9 2009-10 2010-11
State Bank of India amp Associates 482270 593722 739450 857937 994154Nationalized Banks 957877 1203678 1519762 1843082 2311478
Old Private Sector Banks 92887 111670 128504 154085 184647New Private Sector Banks 321865 406733 446824 478356 612886Foreign Banks 126339 161133 165385 163260 195539
Interest Income Ycrore 2006-7 2007-8 2008-9 2009-10 2010-11
State Bank of India amp Associates 53465 70428 89196 97954 109828Nationalized Banks 110720 142647 183892 208029 256490Old Private Sector Banks 11474 14614 18790 20497 23299New Private Sector Banks 38092 56377 66282 62309 73528
Foreign Banks 17924 24417 30322 26390 28520
8132019 Government Banking and BRICs in the Recent Financial Crisis
httpslidepdfcomreaderfullgovernment-banking-and-brics-in-the-recent-financial-crisis 4157
983106983122983113983107 983111983151983158983141983154983150983149983141983150983156 983106983137983150983147983155 983137983150983140 983110983145983150983137983150983139983145983137983148 983123983156983137983156983141983139983154983137983142983156
41
Other Income Ycrore 2006-7 2007-8 2008-9 2009-10 2010-11
State Bank of India amp Associates 9420 11818 16073 18394 19240Nationalized Banks 14264 20979 26394 30500 28625Old Private Sector Banks 1568 2184 2782 3152 3029
New Private Sector Banks 10745 14822 15078 17271 17697Foreign Banks 7044 10588 14894 9951 10972
Interest Expended Ycrore 2006-7 2007-8 2008-9 2009-10 2010-11
State Bank of India amp Associates 32607 47809 61770 66229 67018Nationalized Banks 69353 101093 131676 145712 164135Old Private Sector Banks 7055 9960 12834 14076 14768New Private Sector Banks 25802 38535 44123 37130 42347Foreign Banks 7603 10604 12819 8938 10622
Operating Expenses Ycrore 2006-7 2007-8 2008-9 2009-10 2010-11
State Bank of India amp Associates 15987 16993 20088 25283 29146Nationalized Banks 27268 29670 35416 40792 53819Old Private Sector Banks 2967 3235 3939 4715 5600New Private Sector Banks 12353 17032 17840 18136 22006Foreign Banks 7745 10353 12298 11102 12557
Cost of Funds 2006-7 2007-8 2008-9 2009-10 2010-11
State Bank of India amp Associates 475 59 594 532 48Nationalized Banks 48 582 609 537 493Old Private Sector Banks 498 62 667 613 55New Private Sector Banks 524 611 604 442 427Foreign Banks 403 433 446 283 311Cost of Funds = Ratio () of interest paid on deposits and borrowings to averageof opening and closing balances of deposits and borrowings
Return on advances adjusted toCoF 2006-7 2007-8 2008-9 2009-10 2010-11
State Bank of India amp Associates 372 365 395 36 405Nationalized Banks 399 369 409 382 427Old Private Sector Banks 406 426 515 482 492New Private Sector Banks 447 505 526 514 516Foreign Banks 574 66 815 716 564
2006-7 2007-8 2008-9 2009-10 2010-11
8132019 Government Banking and BRICs in the Recent Financial Crisis
httpslidepdfcomreaderfullgovernment-banking-and-brics-in-the-recent-financial-crisis 4257
983106983122983113983107 983111983151983158983141983154983150983149983141983150983156 983106983137983150983147983155 983137983150983140 983110983145983150983137983150983139983145983137983148 983123983156983137983156983141983139983154983137983142983156
42
Wages as of Total Expenses
State Bank of India amp Associates 2155 1589 1506 171 1921Nationalized Banks 1794 1405 1331 1365 1641Old Private Sector Banks 1689 1367 1326 1457 1675
New Private Sector Banks 936 956 1017 121 1383Foreign Banks 2008 1995 1944 2348 2331
Returns on Assets 2006-7 2007-8 2008-9 2009-10 2010-11
State Bank of India amp Associates 086 097 102 091 079Nationalized Banks 094 101 103 100 103Old Private Sector Banks 078 114 115 095 112New Private Sector Banks 109 113 112 138 151Foreign Banks 228 209 199 126 174
Capital Adequacy Ratio 2006-7 2007-8 2008-9 2009-10 2010-11
State Bank of India amp Associates 1232 1321 1396 1346 1225Nationalized Banks 1237 1213 1324 1318 1347Old Private Sector Banks 1208 1408 1476 1485 1456New Private Sector Banks 1199 1439 1533 1803 1687Foreign Banks 1239 1305 1432 1726 1672Note To 2007-8 = Basel I From 2008-09 = Basel-II
Net NPA Ratio 2006-7 2007-8 2008-9 2009-10 2010-11
State Bank of India amp Associates 132 143 147 150 149Nationalized Banks 094 077 068 091 092Old Private Sector Banks 096 066 09 082 053New Private Sector Banks 097 109 129 103 056Foreign Banks 073 077 181 182 067Net NPA Ratio = Net non-performing assets as net advances
In sum descriptive data from the Reserve Bank of India confirm the anomaly
and argument drawn from the Brazilian experience An important dimension of BRICcountry recovery from the global financial crisis and downturn is the counter cyclicallending policies and realization of competitive advantages of government banks Thisposes a series of new questions for business schools and scholars of public policyInstead of liberalization and privatization leading to transitions in BRIC countriestoward capital market centered financial systems and liberal market economies publicbanks have realized competitive advantages over private and foreign banks whileproviding policy alternatives to BRIC governments in the face of financial crisis andglobal economic slowdown We return to these implications in the conclusion
One development of note at the Reserve Bank of India is a policy focus onfinancial inclusion The 2008 report of the Committee on Financial Inclusion has beenfollowed by sections of the Reserve Bank of India Annual Report reserved fordiscussion of financial inclusion And instead of focusing on liberalization and
8132019 Government Banking and BRICs in the Recent Financial Crisis
httpslidepdfcomreaderfullgovernment-banking-and-brics-in-the-recent-financial-crisis 4357
983106983122983113983107 983111983151983158983141983154983150983149983141983150983156 983106983137983150983147983155 983137983150983140 983110983145983150983137983150983139983145983137983148 983123983156983137983156983141983139983154983137983142983156
43
privatization to ensure the spread of banking products and services alternative policieshave been explored One is of special note The Committee on Financial Inclusionrecommended issue of identity cards as bank cards This would profoundly change thelandscape of banking in India and has attracted attention from analysts at the CentralBank of Brazil charged with financial inclusion as well as the President of Indonesia
and apparently Uganda officials Given the revolution in information and card paymenttechnologies this policy proposal and pilot studies deserve close attention asalternatives to dramatically increase the pace of social inclusion of the bankless
8132019 Government Banking and BRICs in the Recent Financial Crisis
httpslidepdfcomreaderfullgovernment-banking-and-brics-in-the-recent-financial-crisis 4457
983106983122983113983107 983111983151983158983141983154983150983149983141983150983156 983106983137983150983147983155 983137983150983140 983110983145983150983137983150983139983145983137983148 983123983156983137983156983141983139983154983137983142983156
44
China
This section turns to a brief review of the Chinese banking sector to further explore therole of government banks in terms of their modernization competitive advantages
policy roles and capacity for counter cyclical credit that help explain why BRICcountries were able to avert the severe consequences of the global financial crisis
First figure A11 reports the basic structure of the banking system in China
Although we have been unable to compare the evolution of types of banks acrosstime in similar ways to the above data on India taken from the Reserve Bank of Indiaour research assistants have gathered the following comparative macroeconomicfinancial and balance sheet data on banking in China The data appear to be consistentwith the core argument presented in this paper ndash that government banks havemodernized since liberalization and provided policy makers with alternative means tocounter the effects of financial crisis abroad
8132019 Government Banking and BRICs in the Recent Financial Crisis
httpslidepdfcomreaderfullgovernment-banking-and-brics-in-the-recent-financial-crisis 4557
983106983122983113983107 983111983151983158983141983154983150983149983141983150983156 983106983137983150983147983155 983137983150983140 983110983145983150983137983150983139983145983137983148 983123983156983137983156983141983139983154983137983142983156
45
We lack more current information and were unable to collect data directly fromofficial sources in China to compare the trajectory of state owned private and foreignbanks As a substitute Figure 1 reports data from 2000-4 that permits initial observationof trends for this earlier period
Those present may not need reminding of the formidable record of economicgrowth in China during this 200-4 period that continues until today However data fromthe National Bureau of Statistics suggests that the Chinese banking system expanded atan even greater pace than the remarkable levels of GDP growth recorded for the 2000-4period Furthermore credit expansion was ldquoorganicrdquo in the sense that deposits
outpaced credit growth from 2000-4
Expansion of Loans in China 1999-2004
Loan Growth Total LoansYear on Year
Growth Total Depositssup1Year on Year
GrowthYear CNY billion CNY () CNY billion CNY()1999 9373 83 10878 1372000 9937 60 1238 1382001 11231 130 14362 1602002 13129 169 17092 1902003 159 211 20806 217
2004 18857 186 25319 217
sup1Based on preliminary estimates by the National Bureau of Statistics of the Peoplersquos Republic of ChinaSource National Bureau of Statistics of the PRC
Although we lack data comparable to that from the Reserve Bank of India ableto compare the trajectory of state private and foreign banks in China the sectoralbreakdown of loans and other banking and national account data confirms the profoundcapitalization of the Chinese banking system and GDP growth during from 1995-2004
8132019 Government Banking and BRICs in the Recent Financial Crisis
httpslidepdfcomreaderfullgovernment-banking-and-brics-in-the-recent-financial-crisis 4657
983106983122983113983107 983111983151983158983141983154983150983149983141983150983156 983106983137983150983147983155 983137983150983140 983110983145983150983137983150983139983145983137983148 983123983156983137983156983141983139983154983137983142983156
46
China Banking Sector Market Dimensions (1995 - 2004)
YearTotal
LoansCorp
LoansConsuLoans
HomeLoans
TotalDeposits Excess
GovBonds
CorpBonds GDP
GDPGrowth
()1995 52310 mdash mdash mdash 5376 145 330 65 5848 2511996 63100 mdash mdash mdash 6847 538 436 60 6788 1611997 73585 7341 17 130 8212 853 551 52 7446 971998 85002 8447 53 430 9529 102 9 777 68 7835 521999 95587 9394 164 1360 10831 1273 1054 78 8207 482000 108763 10453 424 3320 13486 261 1302 86 894 892001 118990 112 699 5600 15472 3573 1562 101 9593 732002 139800 12913 1067 8258 18339 4359 mdash mdash 10479 922003 169770 15401 1576 13302 22036 5059 mdash mdash 11669 1142004 194220 16848 1988 15800 25319 5897 mdash mdash 13657 170Figures = CNYB
This data reported in terms of percent GDP provides further clarity on the rapid
capitalization of loans It is of note that the bulk of loans during this period were to thecorporate sector with consumer and home loans lagging significantly
China Banking Sector Percent GDP
YEARTotal
LoansCorporate
LoansConsumer
LoansHomeLoans Deposits
ExcessDeposits
GovBonds
CorpBonds
1995 895 00 00 00 919 25 56 111996 929 00 00 00 1009 79 64 091997 988 986 02 02 1103 115 74 071998 1085 1078 07 05 1216 131 99 091999 1165 1145 20 17 1320 155 128 092000 1217 1169 47 37 1508 292 146 102001 1240 1167 73 58 1613 372 163 112002 1334 1232 102 79 1750 4162003 1455 1320 135 114 1888 4342004 1422 1234 146 116 1854 432
Sources China Banking Regulatory Commission Peoplersquos Bank of China and GoldmanSachs research estimates
Compilation of financial data from a select number of banks in China suggeststhat the pattern of bank change encountered in Brazil and India also describes theexperience of China The liberalization of the Chinese economy and the modernization
of state banks appear to describe the process of bank change instead of a process oftransition toward private banking and capital market centered financial systemAlthough we have been unable to draw data from Chinese monetary authorities thebalance sheet data suggests the clear predominance of large state banks in the politicaleconomy of banking and finance in China How these institutions were used to counterthe effects of financial crisis abroad and redirect domestic investment production andconsumption must remain a subject for further research
8132019 Government Banking and BRICs in the Recent Financial Crisis
httpslidepdfcomreaderfullgovernment-banking-and-brics-in-the-recent-financial-crisis 4757
983106983122983113983107 983111983151983158983141983154983150983149983141983150983156 983106983137983150983147983155 983137983150983140 983110983145983150983137983150983139983145983137983148 983123983156983137983156983141983139983154983137983142983156
47
Select Financial Data from Chinese Banks 2004()
CNY (billion)Total
AssetsGrossLoans
CustomerDeposits Equity
NPLRatio
()
Pre-prov
ProfitsNet
Profits
State Banks
ICBC 5671 3705 5105 163 190 653 23CCB 3905 2226 3489 195 39 605 484ABC (NA) mdashBOC 427 2146 3342 205 51 578 209Quasi-State
BoCom 1145 639 1023 54 30 131 16CMB 587 376 513 22 29 82 32CITIC Industrial 515 306 429 20 60 52 03SPDB 456 311 397 14 24 62 20China Everbright mdashGuangdong Development 345 216 301 mdash mdash mdash 32
Industrial Bank 341 203 283 10 25 37 11Quase-Private
Bank of Shanghai 216 106 179 83 51 32 26Hua Xia 304 181 270 92 40 29 10Shenzhen Development 198 126 166 43 114 28 03Bank of Beijing 209 85 174 71 mdash 26 07
Sector total 19422 25319 129Three state-banks 2692 3979 188Second tier banks 2549 3733 148
ABC = Agriculture Bank of China BOC = Bank of China
BOCOM = Bank of Communications CCB = China Construction BankCMB = China Merchantrsquos Bank CNY = yuanICBC = Industrial and Commercial Bank of ChinaNPL = nonperforming loanROA = return on assets ROE = return on equityprov = provisioningPRC = Peoplersquos Republic of ChinaSPDB = Shanghai Pudong Development BankNote Loan and deposit market share for BOC and ICBC are for their domestic operations onlySources Company data Goldman Sachs research estimates
Returns on Assets Equity and Domestic Market Shares of Major China Banks 2004()
CNY (billion) ROA () ROE ()Deposit Mkt
Share ()Loan MktShare ()
Mortgage MktShare()
State Banks
ICBC 004 14 199 187 253CCB 130 254 138 115 217ABC (NA)BOC 051 102 101 89 152Quasi-State
BoCom 015 45 37 29 34CMB 060 161 20 19 29
CITIC Industrial 007 17 17 16 18SPDB 048 153 16 16 26
8132019 Government Banking and BRICs in the Recent Financial Crisis
httpslidepdfcomreaderfullgovernment-banking-and-brics-in-the-recent-financial-crisis 4857
983106983122983113983107 983111983151983158983141983154983150983149983141983150983156 983106983137983150983147983155 983137983150983140 983110983145983150983137983150983139983145983137983148 983123983156983137983156983141983139983154983137983142983156
48
China EverbrightGuangdong Development mdash mdash 12 11 mdashIndustrial Bank 037 126 11 10 10Quase-Private
Bank of Shanghai 129 360 07 05 14Hua Xia 038 116 11 09 07Shenzhen Development 017 75 07 06 08Bank of Beijing 037 108 07 04 07
Sector totalThree state-banks 438 391 622Second tier banks 144 127 154
ABC = Agriculture Bank of China BOC = Bank of China BOCOM = Bank of Communications CCB =China Construction Bank CMB = China Merchantrsquos Bank CNY = yuanICBC = Industrial and Commercial Bank of China mkt = market NPL = nonperforming loan ROA =return on asset ROE = return on equity prov = provisioning PRC =Peoplersquos Republic of China SPDB = Shanghai Pudong Development BankNote Loan and deposit market share for BOC and ICBC are for their domestic operations onlySources Company data Goldman Sachs research estimates
Further data from 2006-10 from the Peoples Bank of China suggests that the big5 state banks continue to outperform the next 12 largest joint stock commercial banksThe big five have launched sales of shares to capitalize while listing on capital marketsand adopting reporting of financial data along lines of international standards Thisappears to be similar to Banco do Brasil policies that retain majority of shares in federalgovernment control while capitalizing the bank through issues of stock
Comparing the Performance of Big 5 State Banks and Next 12 Joint Stock CommercialBanks in China
2006 2007 2008 2009 2010
Profit Margin Big 5 State Banks 3116 3143 2586 3026 3269
Next 12 JS Commercial Banks 2050 2791 1796 2159 2365
Returns Big 5 State Banks 507 606 860 691 675(risk adj) Next 12 JS Commercial Banks 459 570 1016 714 723
Op Risk Big 5 State Banks 5548 5539 5215 5319 5322Next 12 JS Commercial Banks 5886 5721 5725 5831 5947
Leverage Big 5 State Banks 1626 1482 1724 173 1734Next 12 JS Commercial Banks 2826 2251 2064 2048 1936
ROE Big 5 State Banks 1424 1557 1999 1925 2037Next 12 JS Commercial Banks 1564 2049 2156 1840 1967
Big 4 and 11 JSCBsSource Peoples Bank of China China Financial Stability Reports 2007-11
Performance indicators reported by the Peoples Bank of China for the big 5 statebanks and 12 next largest joint stock commercial banks also suggest that the largestgovernment banks in China retain significant competitive advantages ndash and may providepolicy alternatives Given the current shift of economic policy in China away fromindustry and export led growth to more sustainable domestic oriented growth and socialinclusion the role of state banks clearly comes to the fore
8132019 Government Banking and BRICs in the Recent Financial Crisis
httpslidepdfcomreaderfullgovernment-banking-and-brics-in-the-recent-financial-crisis 4957
983106983122983113983107 983111983151983158983141983154983150983149983141983150983156 983106983137983150983147983155 983137983150983140 983110983145983150983137983150983139983145983137983148 983123983156983137983156983141983139983154983137983142983156
49
Net Operating Income of Big 5 State Banks and Next 12 CommercialBanks 100 million RMB YuanBig 5 State Banks 2006 2007 2008 2009 2010
Balance Net interest income 349703 500456 556790 532206 720152Net fee amp commission inc 48524 103817 138464 175469 232491
Investment income 216089 283725 338865 324037 340440
Other business income (1807) (17054) 47548 33791 2186
Net operating income 612509 870944 1081667 1065503 1314943
Percent Net interest income 5709 5746 5148 4995 5477
Net fee amp commission inc 792 1192 1280 1646 1768
Investment income 3528 3258 3133 3041 2589
Other business income (030) (196) 440 318 166
Net operating income 10000 10000 10000 100 100
Next 12 Joint Stock CommercialBanks 2006 2007 2008 2009 2010
Net interest income 87253 132945 198965 191276 281588
Net fee amp commission inc 7850 16247 27319 30115 42023
Investment income 20959 32172 44864 50767 50500
Other business income 2306 4498 16359 10384 7400
Net operating income 118468 185861 287507 282542 381511
Percent Net interest income 7365 7153 6920 6769 7381
Net fee amp commission inc 671 874 950 1066 1101
Investment income 1769 1731 1560 1797 1324
Other business income 195 242 569 368 194Net operating income 10000 10000 10000 10000 10000
Source Peoples Bank of China China Financial Stability Reports 2007-11
Big 4 and 11 JSCBsBig 5 = ICBC ABC BOC CCB BOCOMNext 12 Joint Stock Commercial Banks = China CITIC Bank Everbright Bank Huaxia BankGuangdong Development Bank Shenzhen Development Bank China Merchants Bank Shanghai PudongDevelopment Bank Industrial Bank China Minsheng Banking Corporation Evergrowing Bank ChinaZheshang Bank Bohai Bank
In conclusion bank change in China also appears to confirm our findings from
Brazil ndash that state banks have realized competitive advantages and increased marketshares since liberalization while providing counter cyclical credit to ameliorateadjustment to crisis The modernization of the China Postal Savings Bank is ofparticular interest given its social mission downmarket focus and 40000 branchOffices throughout the country Expansion of card payment services through the postalbank system confirms the importance of the Brazilian federal savings bank (CaixaEconocircmica Federal Caixa) as agent for federal government social policy and agentresponsible for management of citizenship cards (12 million) and payment of familygrants This back to the future modernization of savings banks has proved essential forovercoming notorious levels of social exclusion and inequality in Brazil Althoughenglish language materials are unavailable on the China Postal Savings Bank thisinstitution clearly presents profound opportunities for comparable policies in China
8132019 Government Banking and BRICs in the Recent Financial Crisis
httpslidepdfcomreaderfullgovernment-banking-and-brics-in-the-recent-financial-crisis 5057
983106983122983113983107 983111983151983158983141983154983150983149983141983150983156 983106983137983150983147983155 983137983150983140 983110983145983150983137983150983139983145983137983148 983123983156983137983156983141983139983154983137983142983156
50
Reported offer of microfinance services for poverty reduction as part of nationaleconomic stimulous plan may point to developments in this direction
Given that state planning capacity has long been at the center of attention intheories of financial statecraft the role of Chinese state banks in redirecting policiesaccording to the 12th 5 Year plan for 2011-15 seems critical From 2000-5 the 10th 5
Year plan emphasized infrastructure and the attraction of investment and labor skillsThe 11th 5 Year plan (2006-10) raised concerns about sustainability rather than growthlevels while also seeking to spread improvements to balance development better servepeople and improve the quality of life continue to support Center and West provincesand revitalize Northeast provinces In comparison the 12th 5 Year plan calls for morebalanced lsquoinclusiversquo growth and structural adjustemts more than 4 trillion RMB($US600 billion) for targeted industries and interior regions a focus on new energynew materials and information and high technologies biology and new medicineenergy converstaion and environmental protection aerospace marine and advancedmanufacturing This implies fundamental shifts away from industry to services that hasbeen reported in macroeconomic data for 2010 If past studies emphasized directed
credit and industrial change the role of Chinese state banks in realizing transformationscertainly warrants study
Although the domestic flow of funds process of liberalization (or the lackthereof) and insertion of banking into Chinese political economy is beyond the scope ofthis paper our findings from Brazil appear to provide valuable hypotheses about ChinaThat is to say the big state banks and other government banks in China remaincommanding heights not in the Marxist sense of providing means to reach socialismbut immense institutions with profound presence throughout politics and markets in thecountry In this sense our findings from Brazil appear to approximate patterns ofchange in China more than Washington Consensus expectations about liberalization andprivatizations to free private and foreign banks Financial statecraft draws attention tothe capitalization of Chinese state banks through stock Sales and listings on capitalmarkets However like the Banco do Brasil (that reformers in the 1990s sought to shiftcontrol to the private sector only to increase federal government shareholding) theChinese experience surely involves unexpected consequences and patterns of changedifferent than a linear transition to the Berle amp Means paradigm of corporategovernance
Russia The New State Duopoly
ldquoThe rush of 2003-8 increased the market share of foreign banks to 285 from
52 However the state-owned banks received enormous help from the federal budget in the days of the crisis thereby strengthening their dominant
position on the Russian financial market says Sergey Aleksashenko the formerDeputy chairman of Russias Central Bank quotes Russia Profile Today one
must not harbor any illusion of a fair competition with them all the main cash
flows in Russia are controlled by state-owned banks httpwwwbarentsnovacomnode1031
Description of banking policy in Russia during the global financial crisis can beobtained from Bank of Russia annual reports and related publications The figure on the
following page summarizes the financial flows to and from the Bank of RussiaAlthough central bank policy is beyond the scope of this study the role of state banks in
8132019 Government Banking and BRICs in the Recent Financial Crisis
httpslidepdfcomreaderfullgovernment-banking-and-brics-in-the-recent-financial-crisis 5157
983106983122983113983107 983111983151983158983141983154983150983149983141983150983156 983106983137983150983147983155 983137983150983140 983110983145983150983137983150983139983145983137983148 983123983156983137983156983141983139983154983137983142983156
51
channeling counter-cyclical credits released by the Bank of Russia appear to confirm thecore argument that emerges from our studies of the Brazilian banking system Furtherdata on the following pages also suggest that state banks in Russia performed wellduring 2008-10 confirming on the basis of sparse data taken from Bank of Russiareports and documents that public banks have modernized provided counter-cyclical
credit to reverse credit crunch and economic downturn while realizing competitiveadvantages over private and foreign banks
8132019 Government Banking and BRICs in the Recent Financial Crisis
httpslidepdfcomreaderfullgovernment-banking-and-brics-in-the-recent-financial-crisis 5257
983106983122983113983107 983111983151983158983141983154983150983149983141983150983156 983106983137983150983147983155 983137983150983140 983110983145983150983137983150983139983145983137983148 983123983156983137983156983141983139983154983137983142983156
52
The following aggregate figures reported by the Bank of Russia suggest severaltrends of significance First Chart 32 suggests that household deposits shifted fromRuble deposits to foreign currency pegged (or indexed) during 2008 Second Chart 33illustrates the substantial increase of non-bank overdue debt during second semester
2008
Consequently the financial results and profitability of banks declinedsignificantly during 2008 The greater confidence in deposits with government banksfound abroad suggests that this may have been critical in Russia
Performance data deom 2008-10 provides a clearer picture one that is consistentwith our findings in Brazil State banks appear to have outperformed all other types of
banks except medium and small regional banks The following table reports the averagereturns on assets and returns on equity reported by the Bank of Russia 2008-10
Returns on Assets and Equity by Type of Bank in Russia 2008-9
Return on assets Return on equity 2008 2009 2010 2008 2009 2010
-------------------------------------------------------------------------------------------------------------------State Banks 22 08 24 157 46 148Foreign Banks 18 11 21 146 83 145Large private banks 13 03 11 106 28 84Medium-Small Banks Moscow 15 12 14 68 52 67
Medium-Small Regional Banks 21 12 15 131 65 98--------------------------------------------------------------------------------------------------------------------Source Bank of Russia Bank Supervision Reports 2009 and 2010
8132019 Government Banking and BRICs in the Recent Financial Crisis
httpslidepdfcomreaderfullgovernment-banking-and-brics-in-the-recent-financial-crisis 5357
983106983122983113983107 983111983151983158983141983154983150983149983141983150983156 983106983137983150983147983155 983137983150983140 983110983145983150983137983150983139983145983137983148 983123983156983137983156983141983139983154983137983142983156
53
Further data from the Bank of Russia on the capital adequacy of Banks during2009-10 suggest that foreign banks and large private banks remain less capitalizedagainst risks according to Basel II guidelines albeit at levels almost double thatrecommended by the Bank for International Settlements (80 risk weighted) Although
further analysis is needed this data is consistent from that reported in Brazil thatgovernment banks tend to more cautious and more prudent in terms of placing asidehigher levels of reserves and patrimony against possible losses
Capital Adequacy of Banks by Type of Bank in Russia 2009-10
2009 2010 2011---------------------------------------------------------------------------------------------------------State Banks 184 227 186Foreign Banks 155 196 195Large Private Banks 140 181 155
Medium-Small Banks Moscow 316 312 268Medium-Small Regional Banks 219 241 207Non-Bank Credit Institutions 372 1038 678---------------------------------------------------------------------------------------------------------Source Bank of Russia Bank Supervision Report (Moscow) 2009 p 43
Finally Bank of Russia bank supervision reports also suggest that state banksexpanded their market shares of assets and capital during the years following the globalfinancial crisis While large private banks and foreign banks lost market share of bankassets and bank capital in Russia state banks increased their significant market sharefrom 405 ndash 426 percent and 471-476 percent of assets and capital respectivelyUnfortunately data from previous years and for specific banking groups was notobtained However this data does appear to indicate that our findings of competitiveadvantages and policy alternatives
Number and Market Share by Type of Bank
N Banks Assets Capital---------------------------- ---------------------------- ----------------------------
Type of Bank 2009 2010 2011 2009 2010 2011 2009 2010 2011-------------------------------------------------------------------------------------------------------------------------------State 17 22 27 405 439 458 471 489 473
Foreign 101 106 108 187 183 180 172 169 191Large Private 136 139 131 346 333 305 276 287 269Med-Small Moscow 361 335 317 27 26 26 43 34 35Medi-Small Regional 443 412 372 28 28 27 36 31 29Other Credit Institutions 50 51 57 07 04 04 01 02 03Total 1108 1058 100 100 100 100 100 100-------------------------------------------------------------------------------------------------------------------------------Source Bank of Russia Bank Supervision Report 2009 amp 2010
In sum politics and financial statecraft have led to the realization of significantcompetitive advantage by Russian state banks Sperbank and Vneshtorgbank increasedtheir share of bank assets from 32 percent in 2005 to over 50 percent by 2011 through
mergers and acquisitions and aggressive displacement of foreign banks Whatever thepolitics data from the Bank of Russia suggests that monetary authorities released a
8132019 Government Banking and BRICs in the Recent Financial Crisis
httpslidepdfcomreaderfullgovernment-banking-and-brics-in-the-recent-financial-crisis 5457
983106983122983113983107 983111983151983158983141983154983150983149983141983150983156 983106983137983150983147983155 983137983150983140 983110983145983150983137983150983139983145983137983148 983123983156983137983156983141983139983154983137983142983156
54
series of counter cyclical credit injections during 2008-9 to domestic bankinginstitutions Moreover data suggests that state banks continue to perform at or ahead oflevels reported by regional private and foreign banks The large market share andimproved performance of state banks reported in recent data suggests although the datais sparse that government banks in Russia have also modernized realized competitive
advantages and provided policy alternatives against the impact of financial crisisabroadWe were unable to find evidence of policy making toward social inclusion at the
Bank of Russia or Russian state banks despite the historical trajectory of the Sberbankas a savings bank under communism The context also appears to differ considerably Asurvey of the Zircon Research Group reportedly found that only 15 percent of Russiansretain bank accounts because of mistrust in banks and government This combination ofrealist politics and the realization of competitive advantages by Russian state bankssuggests that theories of economic statecraft in the realist tradition may indeed explainthe domestic developments under study
Conclusion
This paper reports evidence about government bank modernization and financialstatecraft in BRIC countries designed to counter the effects of crisis and shape domesticgrowth Government banks in BRIC countries have contributed to the widely notedadjustment of these economies to global financial crisis and economic downturnContrary to the Washington Consensus that prevailed during much of the 1980s and1990s (that privatization and liberalization especially of banking would free marketforces and deepen domestic financial systems) a quite different process of bank changeappears to have ensued after financial liberalization in the BRICs
Instead of replacement of state banks with private banks government banksremain central agents of domestic credit and growth and have modernized ldquojust intimerdquo The capitalization and realization of competitive advantages by large governmentbanks during the 2000s meant that once the US financial panic spread across capitalmarkets broke highly leveraged private and produced runs on private bank depositspolicy makers in BRIC countries nonetheless retained counter cyclical policyalternatives through their more solid large state banks
These findings counter traditional foci on the private sector individualentrepreneurship and ideals of free markets linked to the political and social advancesrecorded around the world in the last decades We report an anomaly for theories offinancial repression and the Washington Consensus about the virtues of privatization
and liberalization Although largely blamed for reproducing underdevelopment in thepast BRIC government banks averted excesses of private banking that drove creditbubbles such as home mortgages and derivatives in the US And since liberalization ofbanking (we have not adequately discussed how much liberalization occurred in eachcountry) government banks have modernized to compete with private and foreignbanks Government banks have realized competitive advantages and provided policyalternatives These two arguments help explain why BRIC countries have farecomparatively well in the face of financial crisis in core countries
Financial statecraft is therefore at the center of BRIC counter cyclical capacitiesand state planning Brazil Russia India and China fared significantly better thanadvanced and many developing countries in terms of adjusting to credit crunches and
export shocks This is because government banks proved critical interbank credit toretain confidence in domestic banking systems These institutions also presented other
8132019 Government Banking and BRICs in the Recent Financial Crisis
httpslidepdfcomreaderfullgovernment-banking-and-brics-in-the-recent-financial-crisis 5557
983106983122983113983107 983111983151983158983141983154983150983149983141983150983156 983106983137983150983147983155 983137983150983140 983110983145983150983137983150983139983145983137983148 983123983156983137983156983141983139983154983137983142983156
55
policy alternatives for political and social forces Politics shaped adjustment andrecovery through state banks differently in BRIC countries Given the realities of statecentered political realism in Russia the redirection of state banks toward goals ofChinese Five Year Plans and the modernization of the State Bank of India amidst anamorphous federalism the experience of Brazil with democratization and public bank
modernization may stand out (Armijo 2009)Further analysis of savings banks and cooperative banks also will be requiredAs members of the World Savings Bank Institute (a global association of savingsbanks) the Caixa in Brazil SNI and NABARD in India and China Postal Savings Bankappear to have provided access to very large numbers of previously unbanked citizensThis returns to traditional ideas of social banking and the history of savings banks thatwere founded throughout Europe since the late 18 th century The upmarket strategy andexpansion into investment banking and international banking of the Russian Sberbankconstrasts with downmarket strategies of savings banks in Brazil India and China
The financial press has recently reported doubts about bad loans in Chinese statebanks and cast doubt on the financial results posted and reported in this paper
However current estimates of 2-5 percent bad loans in Chinese state banks pale incomparison to the US$1240 billion in bad loans shifted to asset managementcompanies in the mid 2000s before capitalization of these institutions through sale ofshares Critics of state banking in Brazil also point to past levels of bad loans (reaching30-40 percent) because of their capture during military government delayed transitionBut the cost of capitalization and transfer of bad loans from Brazilian state banks alsoremained below US$400 billion and is still contingent on liquidation of assetmanagement companies created in 2001 In any case these numbers are very smallcompared to GAO estimates of US$120 trillion in emergency infusions by USmonetary authorities to banks and financial institutions from 2007-11
These are anomalies for recent market-based banking theory and neo-liberalpolicy designs However they do not run counter to orthodoxy in economics andbanking theory Over the last decades economic reforms (fiscal financial monetaryand banking) have improved transparency and brought public policy and marketexpectations closer However expectations about deregulation and free marketequilibria in banking and finance have succumbed in the face of panic and the stillsobering consequences of crisis The materials presented herein are descriptive and willrequire more careful analysis However given the urgency of searching for alternativedevelopment models and different approaches to financial statecraft in BRIC countriesand beyond we have taken the liberty to present research in initial stages and toprovoke thought along the lines suggested by our kind conveners
8132019 Government Banking and BRICs in the Recent Financial Crisis
httpslidepdfcomreaderfullgovernment-banking-and-brics-in-the-recent-financial-crisis 5657
983106983122983113983107 983111983151983158983141983154983150983149983141983150983156 983106983137983150983147983155 983137983150983140 983110983145983150983137983150983139983145983137983148 983123983156983137983156983141983139983154983137983142983156
56
Appendix on Alternative Banking and Social Inclusion
This appendix describes how ideas about government banking led to further work onalternative banking and social inclusion with help from the Rockefeller FoundationBellagio Center In July 2011 we were able to convene a conference designed to gather
scholars alternative banking executives and representatives from savings andcooperative bank associations to rethink strategies for social inclusion in the globalsouth and attempt to launch a new policy agenda Given the search for alternativestrategies to counter crisis and the advances of stabilization transparency and bankingsupervision in developing and emerging economies we call for alternative bankingcommunities in the global north and south to work together and help shape a new policyagenda for social inclusion Because savings banks credit cooperatives and otheralternative banking and finance institutions have realized competitive advantages andemerged from crisis we can now think beyond We believe that new policies may helpdeveloping and emerging nations redirect large domestic institutions such as postal andsavings banks toward meeting the UN millennium goals to eliminate poverty by 2015
Plans include writing a green paper on Core Principles for Alternative Bankingand Social Inclusion convening events to promote these principles through institutionalsupporters and networks and seeking adoption of these principles at policy venues suchas the World Savings Bank Institute the International Association of CooperativeBanks the Bank for International Settlements the International Financial ReportingStandards foundation the ISO International Standards Organization the Charter forResponsible Business regional development banks and the World Bank We also planto submit an edited volume of scholarly contributions on alternative banking and socialinclusion by year-end 2012 Interested parties are welcome to participate
Institutional supporters and networks include
Institutional SupportersColumbia University School of International and Public Affairs New YorkInstitute for Money Technology and Financial Inclusion University of CaliforniaIrvineKingacutes College Department of Management LondonSatildeo Paulo Business School Getulio Vargas FoundationSecond University of Naples
Networks
Association of Emerging Market Business Schools Satildeo Paulo BrazilCommunity of European Management Schools BrusselsCritical Political Economy NetworkEuropean Association of Co-operative Banks BrusselsGlobal Public Policy Network LondonInternational Cooperative Banking Association BrusselsSocial Science Finance Network AmsterdamSociety for Advancement of Social Economics PhiladelphiaWorld Savings Bank Institute Brussels
8132019 Government Banking and BRICs in the Recent Financial Crisis
httpslidepdfcomreaderfullgovernment-banking-and-brics-in-the-recent-financial-crisis 5757
983106983122983113983107 983111983151983158983141983154983150983149983141983150983156 983106983137983150983147983155 983137983150983140 983110983145983150983137983150983139983145983137983148 983123983156983137983156983141983139983154983137983142983156
Core Principles for Alternative Banking and Social Inclusion
Commitment to End Capital StarvationPromote access to and use of banking and financial services by all through newtechnologies and distribution channels to capitalize assets among the poor
Commitment to Universalize Income Savings Credit and FinanceProvide basic income via ATM cards and mobile banking to reach the poor and opennew channels of access to income savings credit finance insurance and opportunities
Prudent Banking and Regulatory ComplianceAlternative banking seeks to work within regulations guidelines and best practicesrecommended by domestic monetary authorities and international regulatory institutionssuch as the Bank for International Settlement Basel II Capital Risk Guidelines
Corporate Social Responsibility Leadership
Integrate corporate social responsibility into down-market business strategies andinstitutions of representation and democratization
Transparency and AccountabilityPublish annual reports and balance sheets in accord with international best practices offinancial social and sustainability reporting
Leadership in Provision of New Banking Services and Products to the PoorUse competitive advantages in banking and institutional networks to channel moreeffectively capital income and finance to the poor
Generate Sustainable Income and Household Asset AccumulationUse branch offices and new banking technologies to accelerate progress toward UNmillennium goals to eliminate poverty
Universalize Financial EducationPromote financial education to encourage responsible banking and finance and avertpredatory lending and unethical practices
Adopt Cutting Edge Technology and Management Practices to Provide
Competitive Alternative to Private Commercial and Investment Banks
Incorporate electronic card and mobile banking services to better serve the poorContribute to Realization of Bellagio Principles for SustainabilityPromote alternative banking and business practices that contribute to environmentallysustainable income consumption and production as stated in Bellagio Principles forSustainability
Respect and Build on National and Regional DifferencesI d f i l d l l i b ki i i i d i i l
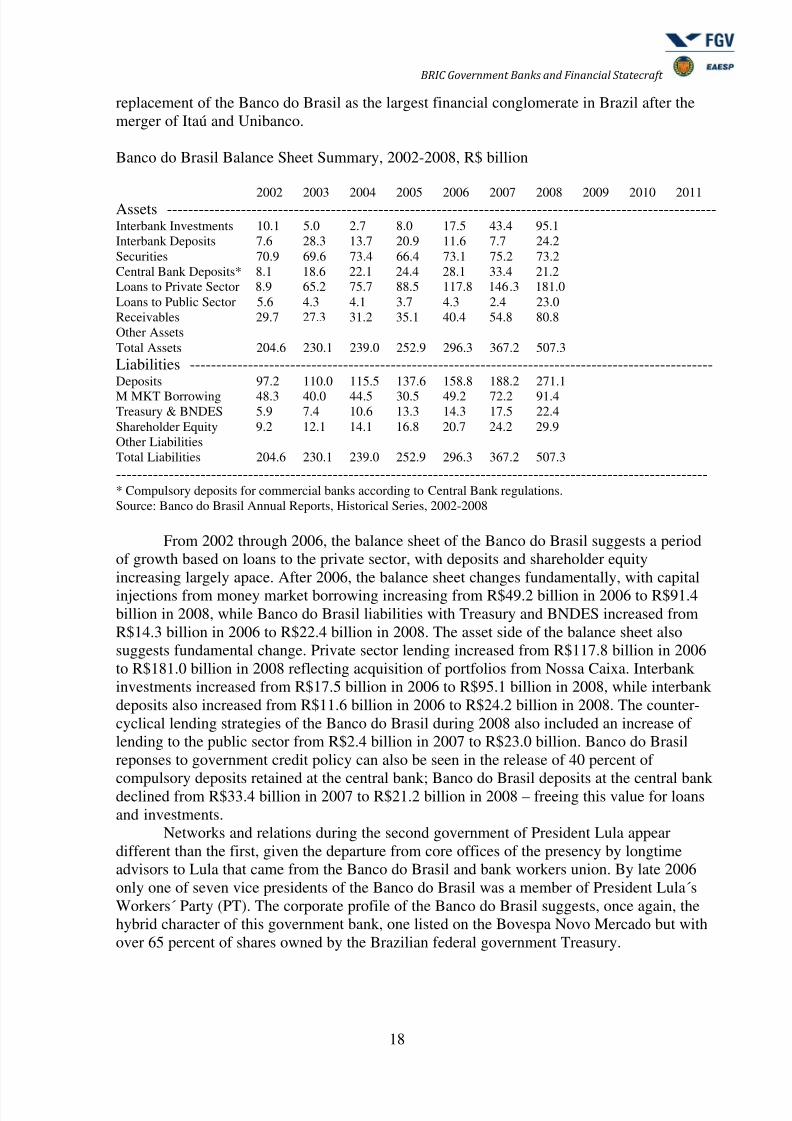
8132019 Government Banking and BRICs in the Recent Financial Crisis
httpslidepdfcomreaderfullgovernment-banking-and-brics-in-the-recent-financial-crisis 2157
983106983122983113983107 983111983151983158983141983154983150983149983141983150983156 983106983137983150983147983155 983137983150983140 983110983145983150983137983150983139983145983137983148 983123983156983137983156983141983139983154983137983142983156
21
largest Brazilian bank the performance and capital adequacy of the Banco do Brasil remainsat or above levels reported by the two largest private banks
In sum since liberalization of banking and finance and privatization of stategovernment banks during the 1990s the Banco do Brasil has been transformed from directstate owned bank into one of two very large financial conglomerates that dominate domestic
banking in Brazil Instead of retaining easy access to funds at Treasury to cover losses theBanco do Brasil has adopted international corporate governance standards to become listedon the Bovespa Novo Mercado and retains an important role in virtually every aspect ofBrazilian banking and finance Although sale of shares in the 1990s were designed to transfercorporate governance and control of the national bank to the private sector the federalgovernment retains 65 percent of stocks after two sale of stocks capitalized the bank duringthe 2000s The massive size and wide scope of Banco do Brasil networks across bankingfinancial markets political and social forces and business have led the bank to realize recordprofits during the period of growth from 2004-2008 and provide counter-cyclical credit toavert a further decline in industrial activity and the economy as the US and global financialcrisis hit Brazil first with a 50 percent decline in the Bovespa stock market and credit
shortage followed by a steep but short decline in industrial production in late 2008 Thetransparency of Banco do Brasil quarterly reports and advances in Central Bank of Brazilsupervision of domestic banking clarify the new tensions that have emerged during the PTgovernment of President Lula These tensions reflect the modernization and competitiveadvantages of the Banco do Brasil
Caixa Econocircmica Federal (Federal Savings Bank Caixa)
The third largest domestic bank the wholly government owned Federal Savings Bank Caixawas also called on by President Lula during the recent financial crisis to increase the pace ofgrowth provide counter cyclical credit during downturns and to reduce consumer andcorporate interest rates and bank spreads Review of balance sheets and policies since 2001suggest that the Caixa retains its core business in urban development home loans real estatetransfer of funds for government programs and services and lottery administration Howeverinvestment banking management of third party funds and the creation of of new products andservices have both increased profits and increased popular access to banking and socialservices The bank has recorded record profits since R$108 billion (2002) R$16 billion(2003) and R$14 billion (2004) The Caixa became the fourth largest Brazilian investmentbank by 2003 while gaining dealer status from the Central Bank of Brazil in primary andsecondary markets for government securities At year-end 2003 the bank retained anestimated R$767 billion of government paper (over ten percent of government paper) in its
portfolio assets earning over R$135 billion that year Since recovery of the Brazilianeconomy in 2004 the Caixa has reported strong profits and continued to improve thestructure of its balance sheet and converge toward international bank reporting standards
In terms of assets deposit base and the number of employees and branches the datasuggest that the Caixa has emerged from a process of rationalization and downsizing duringthe late 1990s and expanded ldquoorganicallyrdquo since capitalization in 2001 Assets declined fromover US$999 billion in 1997 to US$363 billion in 2002 after reorganization andcapitalization Deposits also declined from US$541 billion in 1997 to US$216 billion in2002 The number of employees and branches declined from 104253 and 2316 to 98971 and1803 respectively but returned to 104934 and 2428 by 2006 After reorganization andcapitalization in June 2001 Basel indexes and the ratio of fixed assets over equity indicate
substantial reform and transition toward international banking standards The Basel Index thatmeasures the adequacy of capital reserves against possible losses and risks increased from
8132019 Government Banking and BRICs in the Recent Financial Crisis
httpslidepdfcomreaderfullgovernment-banking-and-brics-in-the-recent-financial-crisis 2257
983106983122983113983107 983111983151983158983141983154983150983149983141983150983156 983106983137983150983147983155 983137983150983140 983110983145983150983137983150983139983145983137983148 983123983156983137983156983141983139983154983137983142983156
22
135 (49 in March 2001 before capitalization) to reach 278 and remain twice above theCentral Bank minimum of 110 at 252 in 2006 The ratio of fixed assets as a proportion ofequity also declines substantially from 638 at year end 2001 to 197 in 2007
Summary of Caixa Structure and Performance 1995-2007
Assets Profits Deposits Employees Branches Basel FAEquity1995 826 672 503 99866 23161996 907 2351 515 99343 21051997 999 875 541 96300 18031998 948 1693 499 94859 18191999 684 1571 344 94194 19192000 644 1362 322 104253 19212001 436 -1265 298 98971 2013 135 6382002 363 1462 216 106548 2147 146 5372003 521 2617 281 100498 2046 192 413
2004 556 2999 345 100164 2135 202 3612005 806 4852 456 106729 2321 278 2012006 981 4874 567 104934 2428 252 1972007 1409 4485 800 106770 2052 288 1282008 1266 5735 708 103895 2069 206 119
Note Assets amp Deposits = US$billion Profits = US$million Basel = BIS Basel Accord index of capital reserveadequacy FAEquity = Fixed Assets Equity a summary indicator of bank modernizationSource Central Bank of Brazil Top 50 Banks in Brazil available at wwwbcbgovbr
Caixa Annual Reports and transition toward Central Bank and international bankaccounting standards introduce breaks in the time series of financial performance after 2001
However international bank reporting standards have been used by the Caixa since 2005 andthe data provide further view of the policies and performance of the bank Table X reportsreturns on stockholder equity assets Basel solvency index immobilization index provisionsas a percent of credit operations bank efficiency index and coverage of personnel costs Thedata are consistent with the broader comparisons reported in chapter two that suggest highprofits and returns alongside higher levels of provisions and reserves against capital riskReturns on stockholder equity have remained above 20 percent per year reaching 306percent in 2008 Returns on liquid assets remained between 09 percent and 13 percentbelow the average levels recorded by private and foreign banks The Basel Index of the Caixaremained well above the 11 percent level required by the Central Bank declining from 279in 2005 to 206 in 2008
Caixa Performance Indicators 2005-2008
Indicator 2005 2006 2007 2008 2009 2010 2011--------------------------------------------------------------------------------------------------------------------------Return on Shareholder Equity 261 260 226 306Return on Liquid Assets 11 11 09 13Basel Solvency Index 279 253 289 206Immobilization Index 201 197 129 120Provisions as Credit Operations 101 98 91 86Efficiency Index 645 642 755 718Coverage of Personnel Costs 925 896 943 868
---------------------------------------------------------------------------------------------------------------------------Source Caixa Econocircmica Federal Relatoacuterios de Administraccedilatildeo 2005-2011
8132019 Government Banking and BRICs in the Recent Financial Crisis
httpslidepdfcomreaderfullgovernment-banking-and-brics-in-the-recent-financial-crisis 2357
983106983122983113983107 983111983151983158983141983154983150983149983141983150983156 983106983137983150983147983155 983137983150983140 983110983145983150983137983150983139983145983137983148 983123983156983137983156983141983139983154983137983142983156
23
The immobilization index of the Caixa also declined from 201 percent in 2005 to120 percent in 2008 suggesting transition toward standard levels of international bankingHowever the value of provisions as a percent of credit operations remains much higher thaninternational bank practices albeit declining from 101 percent in 2005 to 86 percent in2008 Finally both the substantial increase in efficiency index from 645 to 718 percent
suggests that the Caixa has distanced further from international private bank levels that tendto approach 500 percent This has resulted in the declining level of coverage of personnelcosts and indicates the comparatively larger organizational structure and less use ofoutsourced labor at the Caixa
Caixa Deposits and Sources of Funds 2005-2008 R$million
2005 2006 2007 2008 2009 2010 2011----------------------------------------------------------------------------------------------------------------Bank Deposits 692 863 1155 1320Savings Deposits 5328 6006 7560 9255Mid-Term Savings Deposits 3873 4219 4136 4862
Certificates (1270) (1412) (1244) (1831)Escrow (2602) (2806) (2891) (3031)
Funds and Programs 794 1034 1307 1100Other 009 015 019 013Caixa Total 10690 2139 14179 6552Bank System Total 68268 78148 92672 27482Caixa Deposits as Total (156) (155) (1531) (129)----------------------------------------------------------------------------------------------------------------Source Caixa Econocircmica Federal Relatoacuterios de Administraccedilatildeo 2005-2008
The liability side of Caixa balance sheets from 2005-8 suggests that the bank hasdistanced itself from reliance on official savings programs and funding toward consumerbank and savings deposits Bank deposits increased from R$69 billion in 2005 to overR$132 billion in 2008 Savings deposits increased from R$532 billion in 2005 to overR$925 billion in 2008 Furthermore the increase of mid-term savings deposits originatedfrom sale of savings certificates instead of escrow held by the Caixa the latter subject to
judicial review and removed from balance sheets in 2008 The value of funds deposited at theCaixa from government funds and programs increased from R$79 billion in 2005 to R$110billion in 2008 although it remains less than ten percent of total deposits In terms of totalvalue of deposits and savings the Caixa increased total value of deposits from 107 billion toover 165 billion from 2005-8
Caixa Loans 2005-8 R$ million2005 2006 2007 2008 2009 2020 2011
----------------------------------------------------------------------------------------------------------------Commercial 14652 16329 19134 28854
Consumer 8925 9474 11063 13747Business 5727 6854 8071 15107
Home 20208 26113 32475 45075Sewage and Infrastructure 1646 2556 3585 5445Other 690 691 694 689Risk Provision -3773 -4469 -5090 -6900Total Caixa Loans 37195 45689 55888 80062----------------------------------------------------------------------------------------------------------------Source Caixa Econocircmica Federal Relatoacuterios de Administraccedilatildeo 2005-8
8132019 Government Banking and BRICs in the Recent Financial Crisis
httpslidepdfcomreaderfullgovernment-banking-and-brics-in-the-recent-financial-crisis 2457
983106983122983113983107 983111983151983158983141983154983150983149983141983150983156 983106983137983150983147983155 983137983150983140 983110983145983150983137983150983139983145983137983148 983123983156983137983156983141983139983154983137983142983156
24
In terms of lending the data suggests that the primary focus of the Caixa on homeloans continued during the late 2000s although substantial increases in commercial lendingfor consumer credit and businesses suggest the diversification of the Caixa across creditmarkets Since 2005 Caixa lending to consumers and business increased from R$89 billionto R$137 billion and from R$57 billion to R$151 billion respectively in 2008
And unlike the high levels of bad and late credit reported during the adjustment to theend of high inflation in 1994-6 and financial crises (1994-5 1997 1998 1999 2001 2003)the level level of late loans at the Caixa fell substantially during the years of economicgrowth and credit expansion from 2006-2008 The percent of late over total loans at the Caixafell from 68 percent in 2006 to 40 percent in 2008 for commercial loans generally and from62 percent to 59 percent for consumer loans and 75 percent to 22 percent for loans tobusiness The value of late home loans as a percent of total home loans also fell from 31 to17 percent in 2008
Caixa AA-H Credit Classification 2001-8
Days Prov-Late ision 2001 2002 2003 2004 2005 2006 2007 2008 2009 2010 2011
---------------------------------------------------------------------------------------------------------------------------------------AA lt15 0 59 56 66 63 54 50 63 94A lt15 05 243 264 313 288 393 435 401 333---------------------------------------------------------------------------------------------------------------------------------------B 15-30 1 127 126 137 139 143 158 206 271C 31-60 3 203 166 145 169 167 192 194 192D 61-90 10 178 261 207 217 133 60 45 33---------------------------------------------------------------------------------------------------------------------------------------E 91-120 30 18 19 20 20 22 13 09 07F 121-50 50 49 15 15 14 10 07 07 07G 151-80 70 15 08 09 10 08 10 10 09
H gt180 100 104 87 85 77 68 72 61 51R$billion 2094 2353 2614 3016 3855 4736 5739 818---------------------------------------------------------------------------------------------------------------------------------------Source Caixa Annual Reports 2002-2008
The credit risk matrix of Caixa loans from 2001 to 2008 confirms this trend ofimprovement (See above table) The data also provide evidence of greater transparency andthe improvement of bank reporting and accounting standards as well as Central Banksupervision of banks Instead of two categories of credit (good = all loans up to 90 daysoverdue bad = loans over 90 days overdue) the Central Bank of Brazil has adoptedinternational standards of credit classification (from AA to H) and imposed regulations that
banks increase or decrease provisions according to the distribution of loans in thesecategories The scale of provisions required by the Central Bank vary from zero percentagainst loans classified as AA to provision of 100 percent of loan values for credits classifiedas H that is to say over 180 days late
The percent of loans over 180 days late has decreased from 104 percent of total in2001 to 51 percent in 2008 Furthermore all categories of late payment except for loansbetween 15-30 days late decreased significantly from 2001 through 2008 In comparisonloans classified as AA (paid and guaranteed) and A (paid on time) increased from 59 percentto 94 percent and 243 percent to 333 percent of total loans The only category of late loansthat increased over the period is that of loans 15-30 days overdue from 127 percent to 271percent of total
The central argument of this study is that Brazilian federal government banks retaininstitutional foundations of competitive advantage over private and foreign banks Further
8132019 Government Banking and BRICs in the Recent Financial Crisis
httpslidepdfcomreaderfullgovernment-banking-and-brics-in-the-recent-financial-crisis 2557
983106983122983113983107 983111983151983158983141983154983150983149983141983150983156 983106983137983150983147983155 983137983150983140 983110983145983150983137983150983139983145983137983148 983123983156983137983156983141983139983154983137983142983156
25
data that suggests this advantage can be seen in the increasing volume and market share ofthe Caixa in debit and credit cards The number of Caixa debit cards increased from 224million in 2002 to over 482 million in 2008 with Caixa market share of debit cards increasedfrom 196 percent ot total card market in 2002 to peak at 230 percent in 2005 and remainingat 219 percent of the total number of debit cards in Brazil in 2005
Two examples illustrate the institutional foundations of comparative advantage of theCaixa in the card payment industry First like other banks in Brazil the Caixa shares anagreement with Visa for payment processing However unlike other banks in Brazil theCaixa was contracted by the federal government to distribute ATM citizenship cards torecepients of federal government family grants and other transfer programs Apparentlywithout seeking approval the Caixa stamped its brandname on the federal government ATMcitizenship card and has continued to do so despite charges of unfair competition fromprivate domestic banks Furthermore a Caixa request to transform its 110 million ATMcitizenship cards into bank cards currently pending at the Central Bank would dramaticallyincrease the number of bank card holders in Brazil (1824 million at year end 2007)
Caixa Debit and Credit Card Market Shares 2002-2008
Million Debit Cards Million Credit Cards MillionCaixa Total Mkt Caixa Total Mkt Interbank Checks
----------------------------------------------------------------------------------------------------------------2002 224 1142 (196) 16 407 (39) 229502003 280 1254 (223) 18 440 (40) 213602004 320 1491 (213) 20 535 (37) 196702005 377 1639 (230) 25 675 (37) 183902006 384 1744 (220) 31 952 (32) 162202007 400 1824 (219) 39 1177 (33) 144902008 482 42----------------------------------------------------------------------------------------------------------------Source Central Bank of Brazil Diagnoacutestico do Sistema de Pagamentos de Varejo do Brasil Adendo Estatiacutesticondash 2007 p 9 and Caixa annual reports 2003-2008
Having reviewed the Banco do Brasil and Caixa a brief look at the counter-cyclicalpolicies and performance of the third Brazilian federal government bank ndash the BNDES ndash is inorder
Banco Nacional de Desenvolvimento Econocircmico e Social (National Bank for Economic
and Social Development BNDES)
The BNDES is a paradigmatic development bank The trajectory of the BNDES involves asequence of policies and financial practices that have shaped Brazilian development Duringthe 1950s the BNDE supplied direct credits for transportation electric energy infrastructureand steel production During the 1960s the bank diversified under financial reforms Duringthe 1970s the BNDE acted to complete state-led import substitution industrialization bychanneling foreign finance and forced savings into capital goods project lending and regionaldevelopment programs During the 1980s the bank shifted away from public investmentunder pressure of fiscal crisis and foreign debt During the 1990s the BNDES became agentfor the privatization of state owned enterprises The BNDES remained virtually the onlysource of long-term finance during a decade of financial crises in emerging markets (1994-2003) Since 2000 the bank has shifted toward ldquosecond generationrdquo reforms designed tofinance the private sector and free market forces deepen domestic capital and equity markets
8132019 Government Banking and BRICs in the Recent Financial Crisis
httpslidepdfcomreaderfullgovernment-banking-and-brics-in-the-recent-financial-crisis 2657
983106983122983113983107 983111983151983158983141983154983150983149983141983150983156 983106983137983150983147983155 983137983150983140 983110983145983150983137983150983139983145983137983148 983123983156983137983156983141983139983154983137983142983156
26
and lend to small medium and micro-enterprises Since 2004 capital inflows and a boomingdomestic stock market have reinforced the capacity of the BNDES to underwrite long-terminvestments and transform large Brazilian firms into multinational corporations Since 2007BNDES President Coutinho has pursued a full service approach attempting to help star-upsmall and medium firms provide funds to expand successful firms and participate in venture
capital funds to help enterprises transit toward corporate governance standards and initial orsecondary offerings of stock on the Bovespa exchange In 2008 as financial crisis led to ashortage of credit collapse of share prices and sharp decline in industrial production byfourth quarter 2008 the BNDES also provided lending of last resort to major Braziliancorporations while retaining long term goals for massive investments in deep sea petroleumproduction
BNDES Market Share of Interbank and Non-Bank Loans 1995-2008 US$ Billion
Interbank Loans Non-Bank Loans------------------------------------------ ------------------------------------------
BNDES Mkt Total BNDES Mkt Total-----------------------------------------------------------------------------------------------------------1995 156 (324) 481 80 (38) 20711996 181 (354) 511 109 (49) 21981997 197 (278) 707 145 (68) 21031998 216 (355) 608 230 (113) 20201999 204 (410) 497 150 (35) 14282000 243 (439) 553 152 (96) 15772001 259 (504) 515 145 (104) 13912002 233 (443) 525 137 (130) 10512003 261 (419) 622 200 (141) 14152004 306 (408) 749 218 (122) 17862005 343 (373) 918 277 (113) 24312006 388 (350) 1106 329 (102) 32312007 524 (335) 1563 432 (88) 48852008 530 (493) 1073 456 (96) 4743200920102011-----------------------------------------------------------------------------------------------------------Source Central Bank of Brazil Top 50 Banks 1995-2008
Revew of BNDES lending since 1995 suggests the realization of competitiveadvantages typical of a large centralized development bank Contrary to the extensive branchoffice networks retained by the Banco do Brasil and Caixa the BNDES retains under 1900employees (compared to 105000 at Caixa) in the Rio de Janeiro and four regional officesSince 1995 the BNDES increased its market share of non-bank loans from R$80 billion (38percent) to R$200 billion (141 percent) during the economic downturn risk aversion andcredit shortage in 2003 After 2003 the BNDES market share of loans to non-financialentities decreased to 88 percent of total loans albeit increasing during 2008 to 96 percentThis suggests that the BNDES has increased its market share of lending to non-financialsector since liberalization of the industry and privatization of state government banks
8132019 Government Banking and BRICs in the Recent Financial Crisis
httpslidepdfcomreaderfullgovernment-banking-and-brics-in-the-recent-financial-crisis 2757
983106983122983113983107 983111983151983158983141983154983150983149983141983150983156 983106983137983150983147983155 983137983150983140 983110983145983150983137983150983139983145983137983148 983123983156983137983156983141983139983154983137983142983156
27
BNDES inter-bank lending also increases substantially Since the Real Plan endedinertial inflation in 1994 the BNDES has expanded its market share of interbank lendingfrom 156 billion (324 percent) in 1995 to 530 billion (493 percent) in 2008 during creditshortage and stock market collapse During previous years of financial crisis and economicreversals the BNDES also increased interbank lending significantly For example during the
1999 and 2001 crises BNDES interbank lending increased to 410 percent and 504 percentof total This marked presence in interbank loan market reflects the role of the BNDES inproviding indirect lending to targeted sectors through private foreign and other governmentbanks in Brazil
BNDES Loan Approvals by Program 1995-2007 R$ Billion
Direct Lending 1999 2000 2001 2002 2003 2004 2005 2006 2007 2008 2009--------------------------------------------------------------------------------------------------------------------------------------Finem 51 55 68 133 79 114 132 145 220 285Capital Markets 16 19 09 08 09 06 20 34 35 104Export-Import 23 34 39 77 63 56 67 40 13 32
Sub-Total 91 109 118 219 153 177 220 221 269 424Percent Total (505) (474) (468) (585) (456) (447) (469) (430) (415) (464)
Indirect Lending--------------------------------------------------------------------------------------------------------------------------------------Finem 31 40 37 16 12 16 18 27 51 60Finame 16 25 33 40 53 66 93 107 170 221Finame Agro 07 13 18 30 28 45 21 14 20 27Finame Leasing 00 000 02 02 03 02 04 06 14 16Export-Import 14 23 20 40 56 54 73 97 67 95BNDESautom 18 17 22 24 27 34 36 35 50 55Sub-Total 89 120 134 154 182 220 249 292 379 484Percent Total (495) (526) (532) (415) (544) (553) (531) (570) (585)(536)
BNDES Total 180 230 252 374 335 398 469 513 648 908----------------------------------------------------------------------------------------------------------------Source BNDES statistics by modality available on wwwbndesgovbr
Review of BNDES finance by program suggests the evolution of credit policies from1995 through 2008 and increasing reliance on indirect lending through other financialintermediaries The three major programs of direct finance Financiamento aEmpreendimentos (Business Finance Finem) Mercado de Capitais (Capital Markets) andExport-Import finance remained between 505 percent and 415 percent of total BNDESlending with the exception of 2002 Indirect lending through six broad programs remained
between 495 percent and 585 pecent of total BNDES lending with the exception of 2002Indirect lending programs include Finem business lending Financiamento de Maquinas(Machine Finance Fineme) with agricultural and leasing modalities Export-Import financingand BNDES automatic lending provisions
These trends suggest the realization of competitive advantages over private andforeign banks in Brazil BNDES long term interest rates remained substantially lower thanSelic benchmark overnight inter-bank interest rates throughout this period while the lowercost of small staff and operations of the BNDES made lending at these rates viable Anothercompetitive advantage of the BNDES over private and foreign banks is the developmentbankacutes mandate as manager of funds from the forced savings fund Fundo de Amparo ao
Trabalhador (Worker Asssistance Fund FAT) Constitutionally mandated investments inproductive activities (not government bonds) increased from R$31 billion in 2000 to R$101
8132019 Government Banking and BRICs in the Recent Financial Crisis
httpslidepdfcomreaderfullgovernment-banking-and-brics-in-the-recent-financial-crisis 2857
983106983122983113983107 983111983151983158983141983154983150983149983141983150983156 983106983137983150983147983155 983137983150983140 983110983145983150983137983150983139983145983137983148 983123983156983137983156983141983139983154983137983142983156
28
billion in 2008 comprising 170 percent of BNDES liabilities This means that 170 percentof BNDES finance and lending is based on long-term deposits that provide no liquidity riskThis provides a competitive advantage over private and foreign banks
A closer look at BNDES lending by sector suggests that the bank still focuses
primarily on industry and infrastructure Despite the adoption of second generation reformsthat seek to free market forces and accelerate innovation and productivity through small andmedium enterprises BNDES lending still focuses on large scale industrial and long-terminfrastructure finance In this respect the BNDES embodies a persistent need in developingeconomy for state-led development banking along the lines emphasized by Lewis Myrdaland development economists 50 years ago This traditional sense of commanding heights thusstill captures the role of the BNDES in Brazilian political economy Despite more than twodecades of privatizations financial liberalization bank reforms and a variety of fiscalfinancial and economic reforms that have substantially modernized the domestic Brazilianeconomy and freed market forces the BNDES remains the single most important source forlong-term finance and credit The capitalization of the Bovespa stock market from 2004-
2008 for the first time in Brazilian history reduced the virtual monopoly of BNDES overlong term finance
BNDES Operations approved and invested by Sector 1998-2007 R$billion
1998 1999 2000 2001 2002 2003 2004 2005 2006 2007Industry ----------------------------------------------------------------------------------------------------------------------------approved 96 79 126 152 171 163 145 290 395 402invested 76 84 104 132 174 161 158 234 272 306
Infrastructure ----------------------------------------------------------------------------------------------------------------------approved 116 69 110 65 161 149 137 186 240 369invested 83 66 86 75 130 100 152 171 170 209
Other--------------------------------------------------------------------------------------------------------------------------------approved 18 47 40 54 79 93 117 69 108 126investedTotal --------------------------------------------------------------------------------------------------------------------------------approved 230 195 276 271 411 404 379 545 743 897invested 190 181 230 252 374 335 398 470 513 617
----------------------------------------------------------------------------------------------------------------Source BNDES Annual Reports 2003-2008 and testimony of BNDES President to Congress March 2009
Long-term investments have produced substantial profits at the BNDES The bank hasrecorded profits each year since 1999 increasing from over R$600 million in 1999 overR$32 billion during 2005 reaching over R$73 billion in 2007 The long-term character of
BNDES finance stands in stark contrast to policies at private banks Contrary to strategy ofprivate and foreign banks to trade and hold government paper described in chapter three theBNDES suspended purchase and trading in government paper because of constitutionalmandates to contribute to development and employment Furthermore the turn to capitalmarkets at the BNDES has provided substantial returns since 2004
However this does not mean that BNDES lending protected unproductive industriesInstead of wasting resources to unnecessarily bail out firms or provide crony credit highreturns and strong profits at the BNDES suggest that lending was sound Standard indicatorsof bank performance asset quality and capital reserves against credit and capital risk provideempirical control for this All these measures suggest that the BNDES weathered the periodof adjustment and sustained counter-cyclical investment policies without placing resources atrisk beyond Central Bank of Brazil regulations and BIS guidelines And returns have
8132019 Government Banking and BRICs in the Recent Financial Crisis
httpslidepdfcomreaderfullgovernment-banking-and-brics-in-the-recent-financial-crisis 2957
983106983122983113983107 983111983151983158983141983154983150983149983141983150983156 983106983137983150983147983155 983137983150983140 983110983145983150983137983150983139983145983137983148 983123983156983137983156983141983139983154983137983142983156
29
increased since recovery in 2004 BNDES participation in the booming Bovespa stock marketsince 2003 has provided record returns
The BNDESpar subsidiary that invests in capital markets has also recorded strongreturns during the period of economic growth and into the 2008 financial crisis BNDESparreturns on liquid assets increased from 75 percent in 2004 to 277 percent in 2007 declining
to 245 percent in 2008 Average returns on assets and stock holdings also remained highbuilding the assets held by the BNDESpar subsidiary from 141 billion in 2005 to 359 billionin 2008
This increased participation of the BNDES in capital markets involves new relationsand networks across government private sector labor unions the private pension funds ofgovernment bank and government enterprise employees and financial markets By 2007BNDES participation in stockholding and mutual funds reached across 261 forms and 25mutual funds totaling over R$910 billion reals The BNDES thereby retains broad portfoliothat represents institutional foundations of comparative advantage Furthermore unlike thepolicy of private and foreign banks to trade and hold high interest rate paying short termgovernment paper during the sudden stop of foreign finance and downturn in the Brazilian
business cycle (2002-3) the BNDES expanded credit operations and reduced financialoperations in secondary markets for indexed government paper This countered the perverseimpact of the liquidity preference among private and other government banks that increasedmarket pressures and led to shorter terms and higher cost of Brazilian government debt
BNDES aversion of government paper is required by constitutional mandate tomanage forced savings funds in ways that generate employment and income As noted alarge part of BNDES resources (liabilities) are from domestic official savings programs Thevalue of FAT resources increased from R$492 billion in 2003 to R$662 billion in 2005while the PIS-Pasep fund remained at approximately R$200 billion Foreign capital has alsobeen channeled to the BNDES through multilateral agencies and foreign bond issues Foreignloans to the BNDES have declined Multilateral agencies provided R$70 billion in 2003increased funding to R$129 billion during 2004 and continued to provide R$107 billion tothe BNDES during 2005
Comparison of BNDES structure and performance with development banks abroadsuggests both the large scale and scope of BNDES operations and controls formismanagement and political abuse of the bank In 2007 BNDES total assets are almostdouble the value reported by the Inter-American Development Bank (IADB) over frac12 thevalue of total assets held by the World Bank and almost ten times the value of assets held bythe French government development bank CAF Furthermore profits and loans from theBNDES far exceeded all three institutions The US$330 billion in loans reported by theBNDES far exceed the US$67 billion from the IADB the US$110 reported by the World
Bank and US$58 billion reported by the CAF BNDES profis returns on assets and return onliquid patrimony also far exceeded those reported by these three development banks thatserve as comparative control over performance and policies at the BNDES Finally lateloans at the BNDES remained at 011 percent of total loans well below levels reported by theWorld Bank comparable to the 010 percent reported by the IADB while considerably abovethe 001 percent reported by CAF
8132019 Government Banking and BRICs in the Recent Financial Crisis
httpslidepdfcomreaderfullgovernment-banking-and-brics-in-the-recent-financial-crisis 3057
983106983122983113983107 983111983151983158983141983154983150983149983141983150983156 983106983137983150983147983155 983137983150983140 983110983145983150983137983150983139983145983137983148 983123983156983137983156983141983139983154983137983142983156
30
Comparison of BNDES and Regional Development Banks 2007 US$ billion
BNDES IADB World Bank CAF----------------------------------------------------------------------------------------------------------------Total Assets 1144 699 2080 125
Liquid Patrimony 140 203 399 41Liquid Profits 38 01 -01 04Desembolsos 339 67 110 58Credit Portfolio 928 479 978 95Capitalization percent 123 291 192 328Return on Assets percent 38 47 na 36Return on PL percent 332 07 na 105Late Loans percent 011 010 086 001----------------------------------------------------------------------------------------------------------------Source BNDES Annual Report 2007
The large scale of BNDES lending and finance make it possible for governmentpolicy to provide counter cyclical credit to avert or ameliorate economic downturns andsubstitute private and foreign credit shortages In March 2009 testimony to Congress ongovernment policies during financial crisis BNDES President Coutinho argued that bankpolicy was to reduce the cost and increase the supply of credit Resources for counter cyclicallending during 2008-2009 came from Treasury loans to BNDES released by provisionaldecrees 439 and 414 summing R$175 billion transfer of R$60 billion in CVS funds sale ofFGTS Investment Fund and bank certificates summing R$170 billion Furthermore the thirdphase of conditional credit facility shared by Inter-American Development Bank and theBNDES provided the last tranch of a total US$60 billion for BNDES operations
Two further means were used by the BNDES to infuse capital during the collapse of
the stock market and shortage of credit during 2007-8 The counter cyclical policies of theBNDES can also be seen in the over two fold increase of BNDES holdings in private equityand investment funds Table 512 reports the value of private equity and investment fundholdings of the BNDES in 2007 and 2008 BNDES funds in private equity and mutual fundsincreased from R$4038 million in 2007 to over R$10 billion in 2008 The capitalization ofmutual funds and private equity firms by the BNDES also played an important countercyclical role during this period
BNDESpar Shareholding 2007-8 R$million
Percent Value ValueShares 2008 2007
----------------------------------------------------------------------------------------------------------------Ameacuterica Latina Logiacutestica 106 6386 -Aracruz 55 1292 1292Banco do Brasil 25 10854 12752Bom Gosto (2) 345 2458 -Brasil Telecom Part 30 1666 1958Braskem 52 2275 2432Brenco 209 1400 -CEG 345 1406 -CESP 57 2347 1397Coteminas 103 1150 1340
CPFL Energia 62 6081 5506Cia Sideruacutergica Nacional 36 1513 2686CVRD 40 15082 7098
8132019 Government Banking and BRICs in the Recent Financial Crisis
httpslidepdfcomreaderfullgovernment-banking-and-brics-in-the-recent-financial-crisis 3157
983106983122983113983107 983111983151983158983141983154983150983149983141983150983156 983106983137983150983147983155 983137983150983140 983110983145983150983137983150983139983145983137983148 983123983156983137983156983141983139983154983137983142983156
31
ELETROBRAacuteS (1) 118 22400 22400EMBRAER 50 1096 1096Gerdau 35 1533 490Independecircncia 139 2500 -JBS 130 14722 11370Klabin 202 5621 -
Light 336 8225 -Marfrig 146 8176 1020MPX Mineraccedilatildeo 26 1791 1791Ouro Fino 200 1057 840Paranapanema 175 1252 08Petrobraacutes 76 10226 10226Rede Energia SA 253 2633 -Tele Norte Leste Participaccedilotildees 16 1645 1645Valepar 97 26254 15585Subtotal 163055 102941Other firms 12223 12606Total 175278 115548----------------------------------------------------------------------------------------------------------------
Source BNDESpar Financial Statements 2008 pp
The BNDES also holds blocks of shares in many major Brazilian corporationsthrough its participation subsidiary BNDESpar Comparing value of investments in 2007 and2008 suggests that large purchases capitalized firms precisely as financial crisis and downturnin Bovespa stock market made it difficult for firms to find working capital Table X reportsthe percent of total company shares held by the BNDES and their respective market values(adjusted for risk of future losses) at year end 2007 and 2008 During this year of extremelyshort and expensive credit in Brazil caused by the international financial and banking crisisthe BNDES increased shareholding by over R$60 billion reals in 28 private Brazilianenterprises Further shareholding classified as X in Five firms (Bertin 269 Brasiliana 538
Copel 239 Rio Poliacutemeros 250 Telemar 313) Once again the BNDES provided access tocapital for firms caught in the sudden credit crunch and stock market collapse unable to meetobligations or raise funds through equity issues or commercial bank credit This countercyclical role of government banks has been critical in Brazil since the 19 th century
BNDESpar Private Equity and Fund Participation 2007-2008 R$million
Fund Manager 2008 2007-------------------------------------------------------------------------------------------------------------------------Brasil 21 Dynamo 46 60PROT Mellon Financial Services 4628 -
Logiacutestica Brasil Bradesco 135 -Fire BrasilPrivate 269 250FIPGG Governanccedila amp Gestatildeo Inv 289 311Opportunity Equity Partners Mellon Financial Services 1046 578Brasil Energia Bradesco 1184 655InfraBrasil ABN-Amro 677 251Rio Bravo Cinema Rio Bravo 116 110Brascan Petro amp Gaacutes Bank Brascan 136 113AG Angra Infra-Estrutura Bradesco 380 301Satildeo Paulo Metro Fund Bradesco 791 831Other Funds 653 572Total 10356 4038---------------------------------------------------------------------------------------------------------------------------
Source BNDESpar Financial Statements 2008
8132019 Government Banking and BRICs in the Recent Financial Crisis
httpslidepdfcomreaderfullgovernment-banking-and-brics-in-the-recent-financial-crisis 3257
983106983122983113983107 983111983151983158983141983154983150983149983141983150983156 983106983137983150983147983155 983137983150983140 983110983145983150983137983150983139983145983137983148 983123983156983137983156983141983139983154983137983142983156
32
Finally Brazilian federal government triennial plans include investment targets by theBNDES If current plans are compared to 2004-7 investments several structural changes inBNDES lending appear First BNDES plans for Oil and Petroleum production reveal aprofound change for Brazilian political economy In 1990 roughly 45 percent of oilconsumed in Brazil was imported In 2007 before oil price increased reversed the balance
Brazil reported domestic production levels sufficient to meet domestic consumptionFurthermore discoveries of substantial deep sea oil reserves have led the BNDES to planmassive investments involving Petrobras and other global petroleum firms For the 2009-2012 period investments in petroleum and gas (R$2697 billion) Petrochemicals (237) andEthanol (197) sum to over R$3130 billion
BNDES Triennial Investment Plans 2004-2012
2004-7 2007-10 2008-11 2009-12----------------------------------------------------------------------------------------------------------------Petroleum amp Gas 1472 1836 2028 2697
Mining 472 527 813 480Petrochemicals 64 174 264 237Steel 198 371 312 245Automotive 150 176 264 235Electronics 143 156 140 240Ethanol 166 205 205 197Paper amp Celulose 104 200 274 90Health 51 46 51 80Industry Total 2816 3802 4437 4501----------------------------------------------------------------------------------------------------------------Source BNDES Annual Reports 2002-2006
It is of note that President Dilma Roussef was instrumental in reducing the targets for2009-12 in petroleum and gas given indications that Petrobras and existing framework foroffshore oil prospecting and production proved unable to increase investments accordingly
The BNDES also retains a presence in government projects by providing managementassistance During 2008 BNDES staff provided management support for implementation of192 projects involving R$710 billion of total R$142 billion PT government growthacceleration projects BNDES staff also participated in the design management andimplementation of President Lularsquos Poliacutetica de Desenvolvimento Produtivo (Policy forProduction Development) involving R$2100 billion targeting production chains designed tomaximize employment and regional development benefits Finally the BNDES was alsocharged to create and co-manage a Fundo Amazonia with the Ministry of Environment toprovide incentives to reduce deforestation of the Amazon region BNDES Plans for 2009include completion of concession for construction of high speed train line and service for Riode Janeiro-Satildeo Paulo corridor two blocks of highway concession sales involving three majorhighways in each block of sales sale of management concessions for regional airports andthe reorganization of INFRAERO federal government airport management company
These policies reflect the goal of BNDES policy to launch firms on the stock marketrather than maintain direct credit and finance Exceptions during 2008 involve Auto andEthanol industies both for strategic and broader policy reasons Given the sharp downturn inauto sales during fourth quarter 2008 the BNDES provided significant lending to avert
further downsizing or failure of auto companies in Brazil Given the current globalredistribution of automobile production BNDES policies are designed to help the Brazilian
8132019 Government Banking and BRICs in the Recent Financial Crisis
httpslidepdfcomreaderfullgovernment-banking-and-brics-in-the-recent-financial-crisis 3357
983106983122983113983107 983111983151983158983141983154983150983149983141983150983156 983106983137983150983147983155 983137983150983140 983110983145983150983137983150983139983145983137983148 983123983156983137983156983141983139983154983137983142983156
33
operations of major auto firms through the period of adjustment and increase theattractiveness of domestic operations in global production strategies of multinational autocompanies Ethanol production also received massive funds to sustain an industry seen ascritical for alternative and sustainable fuel source capable of replacing petroleum Ethanolreached over 50 percent of automotive fuel sales in 2007
Under the Lula government (2003-10 the BNDES also resumed lending to state andmunicipal governments Since the renegotiation of municipal and state government debts inthe late 1990s states and municipalities have been largely prohibited from taking on debtThis was emplematic of the recentralization required to control fiscal excesses during militaryrule and the prolonged period of transition to democracy Policies during the 1990s weredesigned to avert overspending seen as critical to maintain price stability under the Real Plan(1994) In 2000 the Lei de Responsibilidade Fiscal (Fiscal Responsibility Law) largelyprohibited credit and finance to state and municipal governments Since 2000 municipalitiesand states have been required to submit detailed budget statements that in turn have been thebasis for a gradual return to sub-national government finance In August 2006 central bankand Treasury regulations freed municipalities to take on credit up to 12 times liquid receipts
Since then the BNDES has led in terms of credits and finance to subnational governmentsthrough a Programa Especial de Financiamento aos Estados e Distrito Federal
The BNDES also has developed the first system in Brazil for risk analysis ofmunicipal governments and has led in the market for municipal credit freed by August 2006procedures for approval at Treasury the Central Bank and Conselho Monetaacuterio Nacional(National Monetary Council) Prosecution of mayors and firms charged with managingmunicipal credits with the BNDES revealed fraudulent practices These funds for sub-national public finance also became critical mechanisms to counter severe budget shortfallscaused by financial crisis during 2008 Given that municipal and state government tax basesare shallow and that federal government transfers provide the bulk of sub-nationalgovernment resources the Lula administration allocated R$ 40 billion to the Fundo deParticipaccedilatildeo dos Estados (State Participation Fund) through a Programa Emergencial deFinanciamento (Emergency Finance Fund) administered by the BNDES
In sum the BNDES expanded credit and finance operations substantially during fouryears of sustained growth from 2004-2007 And having helped underwrite the stock marketboom and capitalized Brazilian firms directly and indirectly through credit finance mutualfunds and private equity funds the BNDES retained sufficient scale scope and capital baseto provide counter cyclical credit and finance to help firms adjust to financial crisis and creditshortage during 2008 In retrospect the growth of the BNDES since liberalization andprivatizations of state government banks in the 1990s suggest the comparative advantages of
development banking BNDES credit and finance fell to 52 percent of fixed capitalformation in 1995 Since then the turn to neo-developmentalism and a period of sustainedeconomic growth during the Lula administration increased the BNDES share of total fixedcapital formation during 2006 and 2007 to 126 and 141 percent Critics charge thatmonopoly over FGTS and PIS-PASEP official savings funds as liabilities provide theBNDES with unfair competitive advantage over private banks In 2008 forced savings fundssummed to only 17 percent of BNDES liabilities (resources) The BNDES does not relyexclusively on forced savings for competitive advantage Instead market-oriented policies
joint-ventures with private mutual funds investment funds private equity firms large blocksof shareholding in Brazilian firms and massive amounts of credit and investment to theprivate sector at below market but still profitable long term interest rates of 625 percent
suggest that the large scale and scope of BNDES operations provide institutional foundationsof competitive advantage over private and foreign banks
8132019 Government Banking and BRICs in the Recent Financial Crisis
httpslidepdfcomreaderfullgovernment-banking-and-brics-in-the-recent-financial-crisis 3457
983106983122983113983107 983111983151983158983141983154983150983149983141983150983156 983106983137983150983147983155 983137983150983140 983110983145983150983137983150983139983145983137983148 983123983156983137983156983141983139983154983137983142983156
34
Capitalization of the BNDES by Treasury of over R$2300 billion 2009-11hascaptured attention of many observers of Brazilian development Critics and advocates agreethat the BNDES has realized significant competitive advantages over private and foreignbanks and continues to serve as significant alternative to capital markets for large scaledevelopment projects However like the downturn in planned investments by Petrobras for
oil and gas exploration and production BNDES decreased planned investments fromR$1684 billion in 2010 to R$1397 billion in 2011 We believe this indicates the limits ofmanagement and passing of period of crisis both favoring finance from capital marketsbanks and public-private partnerships
India
Analysis of Brazilian federal banks suggests that these institutions provided policy alternativewhile realizing competitive advantage over private and foreign banks The modernization ofthese institutions helps explain why these large institutions were able to stay the effects ofcredit crunch and financial market downturn in Brazil This section explores data from the
Reserve Bank of India to compare market shares of types of banks from 1972-2008 and bankperformance from 2006-10 Further analysis will be required However the data appears tosupport our core argument that government banks have modernized and realized competitiveadvantages over private and foreign banks
First the number of branch offices which serves as a measure of institutionalcoverage across India of special concern for financial inclusion and the theory thatliberalization and privatizations would lead private banks to expand branch offices andincrease the supply of services From this perspective the trajectory of branch officessuggests that nationalized banks the State Bank of India and regional rural bankssustain much larger networks of branch offices that predominate while otherscheduled commercial (private and foreign) banks retain less than 8000 branch offices
Data from the Reserve Bank of India on the number of current accounts retainedby type of bank provide further evidence that the State Bank of India and its associates
8132019 Government Banking and BRICs in the Recent Financial Crisis
httpslidepdfcomreaderfullgovernment-banking-and-brics-in-the-recent-financial-crisis 3557
983106983122983113983107 983111983151983158983141983154983150983149983141983150983156 983106983137983150983147983155 983137983150983140 983110983145983150983137983150983139983145983137983148 983123983156983137983156983141983139983154983137983142983156
35
national banks and regional rural banks provide the bulk of banking accounts to theIndian population while private and foreign banks cherry pick upscale urban marketsreproducing capital drain and inequalities
Number of Current Accounts by Type of Bank 1972-1995
Since 1999 the pattern of predominance by alternative banking institutions and the minorrole of other scheduled commercial banks and foreign banks continues
The following figures report the value held in current accounts by type of banks first fromthe 1972-1995 period then from the 1999-2008 period For both time periods the trendconfirms that private and foreign banks remain at a competitive disadvantage in terms of thebroader market while the State Bank of India and its associates nationalized banks andregional rural banks tend to predominate
8132019 Government Banking and BRICs in the Recent Financial Crisis
httpslidepdfcomreaderfullgovernment-banking-and-brics-in-the-recent-financial-crisis 3657
983106983122983113983107 983111983151983158983141983154983150983149983141983150983156 983106983137983150983147983155 983137983150983140 983110983145983150983137983150983139983145983137983148 983123983156983137983156983141983139983154983137983142983156
36
Current Account Value by Type of Bank 1972-1995 R
Number of Deposit Accounts by type of bank 1999-2008
A similar pattern appears for the trajectory of savings accounts both the number of
accounts and the value held in savings accounts both for the 1972-1995 period We wereunable to organize data from the more recent period
8132019 Government Banking and BRICs in the Recent Financial Crisis
httpslidepdfcomreaderfullgovernment-banking-and-brics-in-the-recent-financial-crisis 3757
983106983122983113983107 983111983151983158983141983154983150983149983141983150983156 983106983137983150983147983155 983137983150983140 983110983145983150983137983150983139983145983137983148 983123983156983137983156983141983139983154983137983142983156
37
Number of Savings Accounts by Type of Bank 1972-1995
Value in Savings Accounts by Type of Bank 1972-1995
Number of Term Savings Accounts by Type of Bank 1972-1995
8132019 Government Banking and BRICs in the Recent Financial Crisis
httpslidepdfcomreaderfullgovernment-banking-and-brics-in-the-recent-financial-crisis 3857
983106983122983113983107 983111983151983158983141983154983150983149983141983150983156 983106983137983150983147983155 983137983150983140 983110983145983150983137983150983139983145983137983148 983123983156983137983156983141983139983154983137983142983156
38
Value in Term Savings Accounts by Type of Bank 1972-1995
The number and value of credits extended by banks from 1999-2008 appears mostpromising in terms of comparative analysis of bank performance and behavior Thesignificant spread at the end of the time series between the State Bank of India and itsassociates and foreign banks suggests the impact of foreign financial crisis and differentdomestic policies by these types of banks in India similar to that noted in the Brazilianexperience
Number of credits by type of bank 1999-2008
Value of credit by type of bank 1996-2008
8132019 Government Banking and BRICs in the Recent Financial Crisis
httpslidepdfcomreaderfullgovernment-banking-and-brics-in-the-recent-financial-crisis 3957
983106983122983113983107 983111983151983158983141983154983150983149983141983150983156 983106983137983150983147983155 983137983150983140 983110983145983150983137983150983139983145983137983148 983123983156983137983156983141983139983154983137983142983156
39
Further data from the Reserve Bank of India from 2008-10 permit closercomparison of government private and foreign banks in the recent financial crisis Interms of deposits investments total assets and net profits the dominant and expandingrole of government banking in India is apparent Further control variables (not reported)
include gross and net NPA types of income expenses and expenditures provisions andcontingencies and credit- and investment-deposit ratios provide control for bad bankingand confirm the counter cyclical policies during 2008-10 in India
THE FOLLOWING TABLES REQUIRE INTERPRETATION
Number of Banks 2006-7 2007-8 2008-9 2009-10 2010-11
State Bank of India amp Associates 8 8 7 7 6Nationalized Banks 20 20 20 20 20Old Private Sector Banks 17 15 15 15 14
New Private Sector Banks 8 8 7 7 7Foreign Banks 29 28 31 32 33Source RBI A Profile of Banks 2010-11
Number of Branch Offices 2006-7 2007-8 2008-9 2009-10 2010-11
State Bank of India amp Associates 14673 15848 16894 18178 18772Nationalized Banks 37435 39255 40956 43452 45640Old Private Sector Banks 4723 4690 4908 5220 5011New Private Sector Banks 2599 3635 4333 5232 6957
Foreign Banks 272 277 295 308 316Source RBI A Profile of Banks 2010-11
Number of Employees 2006-7 2007-8 2008-9 2009-10 2010-11
State Bank of India amp Associates 255699 249008 268598 266605 282453Nationalized Banks 473179 466400 462926 473041 475082Old Private Sector Banks 47994 48700 51341 55052 55075New Private Sector Banks 91060 110123 124998 127468 163604Foreign Banks 28426 31301 29582 28012 27968
Source RBI - India BanksAssociation
Business per employee (in lakh) 2006-7 2007-8 2008-9 2009-10 2010-11
State Bank of India amp Associates 43635 54922 65022 73743 79306Nationalized Banks 49001 61828 78316 93586 114477Old Private Sector Banks 48159 56932 63843 69749 8149New Private Sector Banks 80782 83196 78715 84041 82607Foreign Banks 97477 11255 128274 141139 155974Note Business = Deposits + Advances
8132019 Government Banking and BRICs in the Recent Financial Crisis
httpslidepdfcomreaderfullgovernment-banking-and-brics-in-the-recent-financial-crisis 4057
983106983122983113983107 983111983151983158983141983154983150983149983141983150983156 983106983137983150983147983155 983137983150983140 983110983145983150983137983150983139983145983137983148 983123983156983137983156983141983139983154983137983142983156
40
Profit per employee (in lakh) 2006-7 2007-8 2008-9 2009-10 2010-11
State Bank of India amp Associates 257 362 443 466 42Nationalized Banks 287 377 486 567 695Old Private Sector Banks 234 406 469 42 563New Private Sector Banks 587 685 677 847 893Foreign Banks 1613 2112 2539 1692 2759
Capital amp Reserves amp Surplus(Ycrore) 2006-7 2007-8 2008-9 2009-10 2010-11
State Bank of India amp Associates 42941 61706 72422 83726 84394Nationalized Banks 92689 113079 135920 157276 205857Old Private Sector Banks 10736 15315 17477 20171 23821New Private Sector Banks 39736 76056 82192 99813 114768Foreign Banks 33075 49332 59937 69176 80972
Deposits Ycrore 2006-7 2007-8 2008-9 2009-10 2010-11
State Bank of India amp Associates 633476 773875 1007041 1108086 1245862Nationalized Banks 1360724 1679993 2105706 2583934 3127122Old Private Sector Banks 138249 165589 199274 229897 264157New Private Sector Banks 413738 509444 537104 592904 738602Foreign Banks 150750 191161 214076 232099 240689
Investments Ycrore 2006-7 2007-8 2008-9 2009-10 2010-11
State Bank of India amp Associates 211875 263823 357624 387473 385697Nationalized Banks 452981 536018 655042 828125 942837Old Private Sector Banks 43647 54080 72393 83499 92617New Private Sector Banks 171008 224498 234139 270618 329403Foreign Banks 71471 98910 130354 159291 165499
Advances Ycrore 2006-7 2007-8 2008-9 2009-10 2010-11
State Bank of India amp Associates 482270 593722 739450 857937 994154Nationalized Banks 957877 1203678 1519762 1843082 2311478
Old Private Sector Banks 92887 111670 128504 154085 184647New Private Sector Banks 321865 406733 446824 478356 612886Foreign Banks 126339 161133 165385 163260 195539
Interest Income Ycrore 2006-7 2007-8 2008-9 2009-10 2010-11
State Bank of India amp Associates 53465 70428 89196 97954 109828Nationalized Banks 110720 142647 183892 208029 256490Old Private Sector Banks 11474 14614 18790 20497 23299New Private Sector Banks 38092 56377 66282 62309 73528
Foreign Banks 17924 24417 30322 26390 28520
8132019 Government Banking and BRICs in the Recent Financial Crisis
httpslidepdfcomreaderfullgovernment-banking-and-brics-in-the-recent-financial-crisis 4157
983106983122983113983107 983111983151983158983141983154983150983149983141983150983156 983106983137983150983147983155 983137983150983140 983110983145983150983137983150983139983145983137983148 983123983156983137983156983141983139983154983137983142983156
41
Other Income Ycrore 2006-7 2007-8 2008-9 2009-10 2010-11
State Bank of India amp Associates 9420 11818 16073 18394 19240Nationalized Banks 14264 20979 26394 30500 28625Old Private Sector Banks 1568 2184 2782 3152 3029
New Private Sector Banks 10745 14822 15078 17271 17697Foreign Banks 7044 10588 14894 9951 10972
Interest Expended Ycrore 2006-7 2007-8 2008-9 2009-10 2010-11
State Bank of India amp Associates 32607 47809 61770 66229 67018Nationalized Banks 69353 101093 131676 145712 164135Old Private Sector Banks 7055 9960 12834 14076 14768New Private Sector Banks 25802 38535 44123 37130 42347Foreign Banks 7603 10604 12819 8938 10622
Operating Expenses Ycrore 2006-7 2007-8 2008-9 2009-10 2010-11
State Bank of India amp Associates 15987 16993 20088 25283 29146Nationalized Banks 27268 29670 35416 40792 53819Old Private Sector Banks 2967 3235 3939 4715 5600New Private Sector Banks 12353 17032 17840 18136 22006Foreign Banks 7745 10353 12298 11102 12557
Cost of Funds 2006-7 2007-8 2008-9 2009-10 2010-11
State Bank of India amp Associates 475 59 594 532 48Nationalized Banks 48 582 609 537 493Old Private Sector Banks 498 62 667 613 55New Private Sector Banks 524 611 604 442 427Foreign Banks 403 433 446 283 311Cost of Funds = Ratio () of interest paid on deposits and borrowings to averageof opening and closing balances of deposits and borrowings
Return on advances adjusted toCoF 2006-7 2007-8 2008-9 2009-10 2010-11
State Bank of India amp Associates 372 365 395 36 405Nationalized Banks 399 369 409 382 427Old Private Sector Banks 406 426 515 482 492New Private Sector Banks 447 505 526 514 516Foreign Banks 574 66 815 716 564
2006-7 2007-8 2008-9 2009-10 2010-11
8132019 Government Banking and BRICs in the Recent Financial Crisis
httpslidepdfcomreaderfullgovernment-banking-and-brics-in-the-recent-financial-crisis 4257
983106983122983113983107 983111983151983158983141983154983150983149983141983150983156 983106983137983150983147983155 983137983150983140 983110983145983150983137983150983139983145983137983148 983123983156983137983156983141983139983154983137983142983156
42
Wages as of Total Expenses
State Bank of India amp Associates 2155 1589 1506 171 1921Nationalized Banks 1794 1405 1331 1365 1641Old Private Sector Banks 1689 1367 1326 1457 1675
New Private Sector Banks 936 956 1017 121 1383Foreign Banks 2008 1995 1944 2348 2331
Returns on Assets 2006-7 2007-8 2008-9 2009-10 2010-11
State Bank of India amp Associates 086 097 102 091 079Nationalized Banks 094 101 103 100 103Old Private Sector Banks 078 114 115 095 112New Private Sector Banks 109 113 112 138 151Foreign Banks 228 209 199 126 174
Capital Adequacy Ratio 2006-7 2007-8 2008-9 2009-10 2010-11
State Bank of India amp Associates 1232 1321 1396 1346 1225Nationalized Banks 1237 1213 1324 1318 1347Old Private Sector Banks 1208 1408 1476 1485 1456New Private Sector Banks 1199 1439 1533 1803 1687Foreign Banks 1239 1305 1432 1726 1672Note To 2007-8 = Basel I From 2008-09 = Basel-II
Net NPA Ratio 2006-7 2007-8 2008-9 2009-10 2010-11
State Bank of India amp Associates 132 143 147 150 149Nationalized Banks 094 077 068 091 092Old Private Sector Banks 096 066 09 082 053New Private Sector Banks 097 109 129 103 056Foreign Banks 073 077 181 182 067Net NPA Ratio = Net non-performing assets as net advances
In sum descriptive data from the Reserve Bank of India confirm the anomaly
and argument drawn from the Brazilian experience An important dimension of BRICcountry recovery from the global financial crisis and downturn is the counter cyclicallending policies and realization of competitive advantages of government banks Thisposes a series of new questions for business schools and scholars of public policyInstead of liberalization and privatization leading to transitions in BRIC countriestoward capital market centered financial systems and liberal market economies publicbanks have realized competitive advantages over private and foreign banks whileproviding policy alternatives to BRIC governments in the face of financial crisis andglobal economic slowdown We return to these implications in the conclusion
One development of note at the Reserve Bank of India is a policy focus onfinancial inclusion The 2008 report of the Committee on Financial Inclusion has beenfollowed by sections of the Reserve Bank of India Annual Report reserved fordiscussion of financial inclusion And instead of focusing on liberalization and
8132019 Government Banking and BRICs in the Recent Financial Crisis
httpslidepdfcomreaderfullgovernment-banking-and-brics-in-the-recent-financial-crisis 4357
983106983122983113983107 983111983151983158983141983154983150983149983141983150983156 983106983137983150983147983155 983137983150983140 983110983145983150983137983150983139983145983137983148 983123983156983137983156983141983139983154983137983142983156
43
privatization to ensure the spread of banking products and services alternative policieshave been explored One is of special note The Committee on Financial Inclusionrecommended issue of identity cards as bank cards This would profoundly change thelandscape of banking in India and has attracted attention from analysts at the CentralBank of Brazil charged with financial inclusion as well as the President of Indonesia
and apparently Uganda officials Given the revolution in information and card paymenttechnologies this policy proposal and pilot studies deserve close attention asalternatives to dramatically increase the pace of social inclusion of the bankless
8132019 Government Banking and BRICs in the Recent Financial Crisis
httpslidepdfcomreaderfullgovernment-banking-and-brics-in-the-recent-financial-crisis 4457
983106983122983113983107 983111983151983158983141983154983150983149983141983150983156 983106983137983150983147983155 983137983150983140 983110983145983150983137983150983139983145983137983148 983123983156983137983156983141983139983154983137983142983156
44
China
This section turns to a brief review of the Chinese banking sector to further explore therole of government banks in terms of their modernization competitive advantages
policy roles and capacity for counter cyclical credit that help explain why BRICcountries were able to avert the severe consequences of the global financial crisis
First figure A11 reports the basic structure of the banking system in China
Although we have been unable to compare the evolution of types of banks acrosstime in similar ways to the above data on India taken from the Reserve Bank of Indiaour research assistants have gathered the following comparative macroeconomicfinancial and balance sheet data on banking in China The data appear to be consistentwith the core argument presented in this paper ndash that government banks havemodernized since liberalization and provided policy makers with alternative means tocounter the effects of financial crisis abroad
8132019 Government Banking and BRICs in the Recent Financial Crisis
httpslidepdfcomreaderfullgovernment-banking-and-brics-in-the-recent-financial-crisis 4557
983106983122983113983107 983111983151983158983141983154983150983149983141983150983156 983106983137983150983147983155 983137983150983140 983110983145983150983137983150983139983145983137983148 983123983156983137983156983141983139983154983137983142983156
45
We lack more current information and were unable to collect data directly fromofficial sources in China to compare the trajectory of state owned private and foreignbanks As a substitute Figure 1 reports data from 2000-4 that permits initial observationof trends for this earlier period
Those present may not need reminding of the formidable record of economicgrowth in China during this 200-4 period that continues until today However data fromthe National Bureau of Statistics suggests that the Chinese banking system expanded atan even greater pace than the remarkable levels of GDP growth recorded for the 2000-4period Furthermore credit expansion was ldquoorganicrdquo in the sense that deposits
outpaced credit growth from 2000-4
Expansion of Loans in China 1999-2004
Loan Growth Total LoansYear on Year
Growth Total Depositssup1Year on Year
GrowthYear CNY billion CNY () CNY billion CNY()1999 9373 83 10878 1372000 9937 60 1238 1382001 11231 130 14362 1602002 13129 169 17092 1902003 159 211 20806 217
2004 18857 186 25319 217
sup1Based on preliminary estimates by the National Bureau of Statistics of the Peoplersquos Republic of ChinaSource National Bureau of Statistics of the PRC
Although we lack data comparable to that from the Reserve Bank of India ableto compare the trajectory of state private and foreign banks in China the sectoralbreakdown of loans and other banking and national account data confirms the profoundcapitalization of the Chinese banking system and GDP growth during from 1995-2004
8132019 Government Banking and BRICs in the Recent Financial Crisis
httpslidepdfcomreaderfullgovernment-banking-and-brics-in-the-recent-financial-crisis 4657
983106983122983113983107 983111983151983158983141983154983150983149983141983150983156 983106983137983150983147983155 983137983150983140 983110983145983150983137983150983139983145983137983148 983123983156983137983156983141983139983154983137983142983156
46
China Banking Sector Market Dimensions (1995 - 2004)
YearTotal
LoansCorp
LoansConsuLoans
HomeLoans
TotalDeposits Excess
GovBonds
CorpBonds GDP
GDPGrowth
()1995 52310 mdash mdash mdash 5376 145 330 65 5848 2511996 63100 mdash mdash mdash 6847 538 436 60 6788 1611997 73585 7341 17 130 8212 853 551 52 7446 971998 85002 8447 53 430 9529 102 9 777 68 7835 521999 95587 9394 164 1360 10831 1273 1054 78 8207 482000 108763 10453 424 3320 13486 261 1302 86 894 892001 118990 112 699 5600 15472 3573 1562 101 9593 732002 139800 12913 1067 8258 18339 4359 mdash mdash 10479 922003 169770 15401 1576 13302 22036 5059 mdash mdash 11669 1142004 194220 16848 1988 15800 25319 5897 mdash mdash 13657 170Figures = CNYB
This data reported in terms of percent GDP provides further clarity on the rapid
capitalization of loans It is of note that the bulk of loans during this period were to thecorporate sector with consumer and home loans lagging significantly
China Banking Sector Percent GDP
YEARTotal
LoansCorporate
LoansConsumer
LoansHomeLoans Deposits
ExcessDeposits
GovBonds
CorpBonds
1995 895 00 00 00 919 25 56 111996 929 00 00 00 1009 79 64 091997 988 986 02 02 1103 115 74 071998 1085 1078 07 05 1216 131 99 091999 1165 1145 20 17 1320 155 128 092000 1217 1169 47 37 1508 292 146 102001 1240 1167 73 58 1613 372 163 112002 1334 1232 102 79 1750 4162003 1455 1320 135 114 1888 4342004 1422 1234 146 116 1854 432
Sources China Banking Regulatory Commission Peoplersquos Bank of China and GoldmanSachs research estimates
Compilation of financial data from a select number of banks in China suggeststhat the pattern of bank change encountered in Brazil and India also describes theexperience of China The liberalization of the Chinese economy and the modernization
of state banks appear to describe the process of bank change instead of a process oftransition toward private banking and capital market centered financial systemAlthough we have been unable to draw data from Chinese monetary authorities thebalance sheet data suggests the clear predominance of large state banks in the politicaleconomy of banking and finance in China How these institutions were used to counterthe effects of financial crisis abroad and redirect domestic investment production andconsumption must remain a subject for further research
8132019 Government Banking and BRICs in the Recent Financial Crisis
httpslidepdfcomreaderfullgovernment-banking-and-brics-in-the-recent-financial-crisis 4757
983106983122983113983107 983111983151983158983141983154983150983149983141983150983156 983106983137983150983147983155 983137983150983140 983110983145983150983137983150983139983145983137983148 983123983156983137983156983141983139983154983137983142983156
47
Select Financial Data from Chinese Banks 2004()
CNY (billion)Total
AssetsGrossLoans
CustomerDeposits Equity
NPLRatio
()
Pre-prov
ProfitsNet
Profits
State Banks
ICBC 5671 3705 5105 163 190 653 23CCB 3905 2226 3489 195 39 605 484ABC (NA) mdashBOC 427 2146 3342 205 51 578 209Quasi-State
BoCom 1145 639 1023 54 30 131 16CMB 587 376 513 22 29 82 32CITIC Industrial 515 306 429 20 60 52 03SPDB 456 311 397 14 24 62 20China Everbright mdashGuangdong Development 345 216 301 mdash mdash mdash 32
Industrial Bank 341 203 283 10 25 37 11Quase-Private
Bank of Shanghai 216 106 179 83 51 32 26Hua Xia 304 181 270 92 40 29 10Shenzhen Development 198 126 166 43 114 28 03Bank of Beijing 209 85 174 71 mdash 26 07
Sector total 19422 25319 129Three state-banks 2692 3979 188Second tier banks 2549 3733 148
ABC = Agriculture Bank of China BOC = Bank of China
BOCOM = Bank of Communications CCB = China Construction BankCMB = China Merchantrsquos Bank CNY = yuanICBC = Industrial and Commercial Bank of ChinaNPL = nonperforming loanROA = return on assets ROE = return on equityprov = provisioningPRC = Peoplersquos Republic of ChinaSPDB = Shanghai Pudong Development BankNote Loan and deposit market share for BOC and ICBC are for their domestic operations onlySources Company data Goldman Sachs research estimates
Returns on Assets Equity and Domestic Market Shares of Major China Banks 2004()
CNY (billion) ROA () ROE ()Deposit Mkt
Share ()Loan MktShare ()
Mortgage MktShare()
State Banks
ICBC 004 14 199 187 253CCB 130 254 138 115 217ABC (NA)BOC 051 102 101 89 152Quasi-State
BoCom 015 45 37 29 34CMB 060 161 20 19 29
CITIC Industrial 007 17 17 16 18SPDB 048 153 16 16 26
8132019 Government Banking and BRICs in the Recent Financial Crisis
httpslidepdfcomreaderfullgovernment-banking-and-brics-in-the-recent-financial-crisis 4857
983106983122983113983107 983111983151983158983141983154983150983149983141983150983156 983106983137983150983147983155 983137983150983140 983110983145983150983137983150983139983145983137983148 983123983156983137983156983141983139983154983137983142983156
48
China EverbrightGuangdong Development mdash mdash 12 11 mdashIndustrial Bank 037 126 11 10 10Quase-Private
Bank of Shanghai 129 360 07 05 14Hua Xia 038 116 11 09 07Shenzhen Development 017 75 07 06 08Bank of Beijing 037 108 07 04 07
Sector totalThree state-banks 438 391 622Second tier banks 144 127 154
ABC = Agriculture Bank of China BOC = Bank of China BOCOM = Bank of Communications CCB =China Construction Bank CMB = China Merchantrsquos Bank CNY = yuanICBC = Industrial and Commercial Bank of China mkt = market NPL = nonperforming loan ROA =return on asset ROE = return on equity prov = provisioning PRC =Peoplersquos Republic of China SPDB = Shanghai Pudong Development BankNote Loan and deposit market share for BOC and ICBC are for their domestic operations onlySources Company data Goldman Sachs research estimates
Further data from 2006-10 from the Peoples Bank of China suggests that the big5 state banks continue to outperform the next 12 largest joint stock commercial banksThe big five have launched sales of shares to capitalize while listing on capital marketsand adopting reporting of financial data along lines of international standards Thisappears to be similar to Banco do Brasil policies that retain majority of shares in federalgovernment control while capitalizing the bank through issues of stock
Comparing the Performance of Big 5 State Banks and Next 12 Joint Stock CommercialBanks in China
2006 2007 2008 2009 2010
Profit Margin Big 5 State Banks 3116 3143 2586 3026 3269
Next 12 JS Commercial Banks 2050 2791 1796 2159 2365
Returns Big 5 State Banks 507 606 860 691 675(risk adj) Next 12 JS Commercial Banks 459 570 1016 714 723
Op Risk Big 5 State Banks 5548 5539 5215 5319 5322Next 12 JS Commercial Banks 5886 5721 5725 5831 5947
Leverage Big 5 State Banks 1626 1482 1724 173 1734Next 12 JS Commercial Banks 2826 2251 2064 2048 1936
ROE Big 5 State Banks 1424 1557 1999 1925 2037Next 12 JS Commercial Banks 1564 2049 2156 1840 1967
Big 4 and 11 JSCBsSource Peoples Bank of China China Financial Stability Reports 2007-11
Performance indicators reported by the Peoples Bank of China for the big 5 statebanks and 12 next largest joint stock commercial banks also suggest that the largestgovernment banks in China retain significant competitive advantages ndash and may providepolicy alternatives Given the current shift of economic policy in China away fromindustry and export led growth to more sustainable domestic oriented growth and socialinclusion the role of state banks clearly comes to the fore
8132019 Government Banking and BRICs in the Recent Financial Crisis
httpslidepdfcomreaderfullgovernment-banking-and-brics-in-the-recent-financial-crisis 4957
983106983122983113983107 983111983151983158983141983154983150983149983141983150983156 983106983137983150983147983155 983137983150983140 983110983145983150983137983150983139983145983137983148 983123983156983137983156983141983139983154983137983142983156
49
Net Operating Income of Big 5 State Banks and Next 12 CommercialBanks 100 million RMB YuanBig 5 State Banks 2006 2007 2008 2009 2010
Balance Net interest income 349703 500456 556790 532206 720152Net fee amp commission inc 48524 103817 138464 175469 232491
Investment income 216089 283725 338865 324037 340440
Other business income (1807) (17054) 47548 33791 2186
Net operating income 612509 870944 1081667 1065503 1314943
Percent Net interest income 5709 5746 5148 4995 5477
Net fee amp commission inc 792 1192 1280 1646 1768
Investment income 3528 3258 3133 3041 2589
Other business income (030) (196) 440 318 166
Net operating income 10000 10000 10000 100 100
Next 12 Joint Stock CommercialBanks 2006 2007 2008 2009 2010
Net interest income 87253 132945 198965 191276 281588
Net fee amp commission inc 7850 16247 27319 30115 42023
Investment income 20959 32172 44864 50767 50500
Other business income 2306 4498 16359 10384 7400
Net operating income 118468 185861 287507 282542 381511
Percent Net interest income 7365 7153 6920 6769 7381
Net fee amp commission inc 671 874 950 1066 1101
Investment income 1769 1731 1560 1797 1324
Other business income 195 242 569 368 194Net operating income 10000 10000 10000 10000 10000
Source Peoples Bank of China China Financial Stability Reports 2007-11
Big 4 and 11 JSCBsBig 5 = ICBC ABC BOC CCB BOCOMNext 12 Joint Stock Commercial Banks = China CITIC Bank Everbright Bank Huaxia BankGuangdong Development Bank Shenzhen Development Bank China Merchants Bank Shanghai PudongDevelopment Bank Industrial Bank China Minsheng Banking Corporation Evergrowing Bank ChinaZheshang Bank Bohai Bank
In conclusion bank change in China also appears to confirm our findings from
Brazil ndash that state banks have realized competitive advantages and increased marketshares since liberalization while providing counter cyclical credit to ameliorateadjustment to crisis The modernization of the China Postal Savings Bank is ofparticular interest given its social mission downmarket focus and 40000 branchOffices throughout the country Expansion of card payment services through the postalbank system confirms the importance of the Brazilian federal savings bank (CaixaEconocircmica Federal Caixa) as agent for federal government social policy and agentresponsible for management of citizenship cards (12 million) and payment of familygrants This back to the future modernization of savings banks has proved essential forovercoming notorious levels of social exclusion and inequality in Brazil Althoughenglish language materials are unavailable on the China Postal Savings Bank thisinstitution clearly presents profound opportunities for comparable policies in China
8132019 Government Banking and BRICs in the Recent Financial Crisis
httpslidepdfcomreaderfullgovernment-banking-and-brics-in-the-recent-financial-crisis 5057
983106983122983113983107 983111983151983158983141983154983150983149983141983150983156 983106983137983150983147983155 983137983150983140 983110983145983150983137983150983139983145983137983148 983123983156983137983156983141983139983154983137983142983156
50
Reported offer of microfinance services for poverty reduction as part of nationaleconomic stimulous plan may point to developments in this direction
Given that state planning capacity has long been at the center of attention intheories of financial statecraft the role of Chinese state banks in redirecting policiesaccording to the 12th 5 Year plan for 2011-15 seems critical From 2000-5 the 10th 5
Year plan emphasized infrastructure and the attraction of investment and labor skillsThe 11th 5 Year plan (2006-10) raised concerns about sustainability rather than growthlevels while also seeking to spread improvements to balance development better servepeople and improve the quality of life continue to support Center and West provincesand revitalize Northeast provinces In comparison the 12th 5 Year plan calls for morebalanced lsquoinclusiversquo growth and structural adjustemts more than 4 trillion RMB($US600 billion) for targeted industries and interior regions a focus on new energynew materials and information and high technologies biology and new medicineenergy converstaion and environmental protection aerospace marine and advancedmanufacturing This implies fundamental shifts away from industry to services that hasbeen reported in macroeconomic data for 2010 If past studies emphasized directed
credit and industrial change the role of Chinese state banks in realizing transformationscertainly warrants study
Although the domestic flow of funds process of liberalization (or the lackthereof) and insertion of banking into Chinese political economy is beyond the scope ofthis paper our findings from Brazil appear to provide valuable hypotheses about ChinaThat is to say the big state banks and other government banks in China remaincommanding heights not in the Marxist sense of providing means to reach socialismbut immense institutions with profound presence throughout politics and markets in thecountry In this sense our findings from Brazil appear to approximate patterns ofchange in China more than Washington Consensus expectations about liberalization andprivatizations to free private and foreign banks Financial statecraft draws attention tothe capitalization of Chinese state banks through stock Sales and listings on capitalmarkets However like the Banco do Brasil (that reformers in the 1990s sought to shiftcontrol to the private sector only to increase federal government shareholding) theChinese experience surely involves unexpected consequences and patterns of changedifferent than a linear transition to the Berle amp Means paradigm of corporategovernance
Russia The New State Duopoly
ldquoThe rush of 2003-8 increased the market share of foreign banks to 285 from
52 However the state-owned banks received enormous help from the federal budget in the days of the crisis thereby strengthening their dominant
position on the Russian financial market says Sergey Aleksashenko the formerDeputy chairman of Russias Central Bank quotes Russia Profile Today one
must not harbor any illusion of a fair competition with them all the main cash
flows in Russia are controlled by state-owned banks httpwwwbarentsnovacomnode1031
Description of banking policy in Russia during the global financial crisis can beobtained from Bank of Russia annual reports and related publications The figure on the
following page summarizes the financial flows to and from the Bank of RussiaAlthough central bank policy is beyond the scope of this study the role of state banks in
8132019 Government Banking and BRICs in the Recent Financial Crisis
httpslidepdfcomreaderfullgovernment-banking-and-brics-in-the-recent-financial-crisis 5157
983106983122983113983107 983111983151983158983141983154983150983149983141983150983156 983106983137983150983147983155 983137983150983140 983110983145983150983137983150983139983145983137983148 983123983156983137983156983141983139983154983137983142983156
51
channeling counter-cyclical credits released by the Bank of Russia appear to confirm thecore argument that emerges from our studies of the Brazilian banking system Furtherdata on the following pages also suggest that state banks in Russia performed wellduring 2008-10 confirming on the basis of sparse data taken from Bank of Russiareports and documents that public banks have modernized provided counter-cyclical
credit to reverse credit crunch and economic downturn while realizing competitiveadvantages over private and foreign banks
8132019 Government Banking and BRICs in the Recent Financial Crisis
httpslidepdfcomreaderfullgovernment-banking-and-brics-in-the-recent-financial-crisis 5257
983106983122983113983107 983111983151983158983141983154983150983149983141983150983156 983106983137983150983147983155 983137983150983140 983110983145983150983137983150983139983145983137983148 983123983156983137983156983141983139983154983137983142983156
52
The following aggregate figures reported by the Bank of Russia suggest severaltrends of significance First Chart 32 suggests that household deposits shifted fromRuble deposits to foreign currency pegged (or indexed) during 2008 Second Chart 33illustrates the substantial increase of non-bank overdue debt during second semester
2008
Consequently the financial results and profitability of banks declinedsignificantly during 2008 The greater confidence in deposits with government banksfound abroad suggests that this may have been critical in Russia
Performance data deom 2008-10 provides a clearer picture one that is consistentwith our findings in Brazil State banks appear to have outperformed all other types of
banks except medium and small regional banks The following table reports the averagereturns on assets and returns on equity reported by the Bank of Russia 2008-10
Returns on Assets and Equity by Type of Bank in Russia 2008-9
Return on assets Return on equity 2008 2009 2010 2008 2009 2010
-------------------------------------------------------------------------------------------------------------------State Banks 22 08 24 157 46 148Foreign Banks 18 11 21 146 83 145Large private banks 13 03 11 106 28 84Medium-Small Banks Moscow 15 12 14 68 52 67
Medium-Small Regional Banks 21 12 15 131 65 98--------------------------------------------------------------------------------------------------------------------Source Bank of Russia Bank Supervision Reports 2009 and 2010
8132019 Government Banking and BRICs in the Recent Financial Crisis
httpslidepdfcomreaderfullgovernment-banking-and-brics-in-the-recent-financial-crisis 5357
983106983122983113983107 983111983151983158983141983154983150983149983141983150983156 983106983137983150983147983155 983137983150983140 983110983145983150983137983150983139983145983137983148 983123983156983137983156983141983139983154983137983142983156
53
Further data from the Bank of Russia on the capital adequacy of Banks during2009-10 suggest that foreign banks and large private banks remain less capitalizedagainst risks according to Basel II guidelines albeit at levels almost double thatrecommended by the Bank for International Settlements (80 risk weighted) Although
further analysis is needed this data is consistent from that reported in Brazil thatgovernment banks tend to more cautious and more prudent in terms of placing asidehigher levels of reserves and patrimony against possible losses
Capital Adequacy of Banks by Type of Bank in Russia 2009-10
2009 2010 2011---------------------------------------------------------------------------------------------------------State Banks 184 227 186Foreign Banks 155 196 195Large Private Banks 140 181 155
Medium-Small Banks Moscow 316 312 268Medium-Small Regional Banks 219 241 207Non-Bank Credit Institutions 372 1038 678---------------------------------------------------------------------------------------------------------Source Bank of Russia Bank Supervision Report (Moscow) 2009 p 43
Finally Bank of Russia bank supervision reports also suggest that state banksexpanded their market shares of assets and capital during the years following the globalfinancial crisis While large private banks and foreign banks lost market share of bankassets and bank capital in Russia state banks increased their significant market sharefrom 405 ndash 426 percent and 471-476 percent of assets and capital respectivelyUnfortunately data from previous years and for specific banking groups was notobtained However this data does appear to indicate that our findings of competitiveadvantages and policy alternatives
Number and Market Share by Type of Bank
N Banks Assets Capital---------------------------- ---------------------------- ----------------------------
Type of Bank 2009 2010 2011 2009 2010 2011 2009 2010 2011-------------------------------------------------------------------------------------------------------------------------------State 17 22 27 405 439 458 471 489 473
Foreign 101 106 108 187 183 180 172 169 191Large Private 136 139 131 346 333 305 276 287 269Med-Small Moscow 361 335 317 27 26 26 43 34 35Medi-Small Regional 443 412 372 28 28 27 36 31 29Other Credit Institutions 50 51 57 07 04 04 01 02 03Total 1108 1058 100 100 100 100 100 100-------------------------------------------------------------------------------------------------------------------------------Source Bank of Russia Bank Supervision Report 2009 amp 2010
In sum politics and financial statecraft have led to the realization of significantcompetitive advantage by Russian state banks Sperbank and Vneshtorgbank increasedtheir share of bank assets from 32 percent in 2005 to over 50 percent by 2011 through
mergers and acquisitions and aggressive displacement of foreign banks Whatever thepolitics data from the Bank of Russia suggests that monetary authorities released a
8132019 Government Banking and BRICs in the Recent Financial Crisis
httpslidepdfcomreaderfullgovernment-banking-and-brics-in-the-recent-financial-crisis 5457
983106983122983113983107 983111983151983158983141983154983150983149983141983150983156 983106983137983150983147983155 983137983150983140 983110983145983150983137983150983139983145983137983148 983123983156983137983156983141983139983154983137983142983156
54
series of counter cyclical credit injections during 2008-9 to domestic bankinginstitutions Moreover data suggests that state banks continue to perform at or ahead oflevels reported by regional private and foreign banks The large market share andimproved performance of state banks reported in recent data suggests although the datais sparse that government banks in Russia have also modernized realized competitive
advantages and provided policy alternatives against the impact of financial crisisabroadWe were unable to find evidence of policy making toward social inclusion at the
Bank of Russia or Russian state banks despite the historical trajectory of the Sberbankas a savings bank under communism The context also appears to differ considerably Asurvey of the Zircon Research Group reportedly found that only 15 percent of Russiansretain bank accounts because of mistrust in banks and government This combination ofrealist politics and the realization of competitive advantages by Russian state bankssuggests that theories of economic statecraft in the realist tradition may indeed explainthe domestic developments under study
Conclusion
This paper reports evidence about government bank modernization and financialstatecraft in BRIC countries designed to counter the effects of crisis and shape domesticgrowth Government banks in BRIC countries have contributed to the widely notedadjustment of these economies to global financial crisis and economic downturnContrary to the Washington Consensus that prevailed during much of the 1980s and1990s (that privatization and liberalization especially of banking would free marketforces and deepen domestic financial systems) a quite different process of bank changeappears to have ensued after financial liberalization in the BRICs
Instead of replacement of state banks with private banks government banksremain central agents of domestic credit and growth and have modernized ldquojust intimerdquo The capitalization and realization of competitive advantages by large governmentbanks during the 2000s meant that once the US financial panic spread across capitalmarkets broke highly leveraged private and produced runs on private bank depositspolicy makers in BRIC countries nonetheless retained counter cyclical policyalternatives through their more solid large state banks
These findings counter traditional foci on the private sector individualentrepreneurship and ideals of free markets linked to the political and social advancesrecorded around the world in the last decades We report an anomaly for theories offinancial repression and the Washington Consensus about the virtues of privatization
and liberalization Although largely blamed for reproducing underdevelopment in thepast BRIC government banks averted excesses of private banking that drove creditbubbles such as home mortgages and derivatives in the US And since liberalization ofbanking (we have not adequately discussed how much liberalization occurred in eachcountry) government banks have modernized to compete with private and foreignbanks Government banks have realized competitive advantages and provided policyalternatives These two arguments help explain why BRIC countries have farecomparatively well in the face of financial crisis in core countries
Financial statecraft is therefore at the center of BRIC counter cyclical capacitiesand state planning Brazil Russia India and China fared significantly better thanadvanced and many developing countries in terms of adjusting to credit crunches and
export shocks This is because government banks proved critical interbank credit toretain confidence in domestic banking systems These institutions also presented other
8132019 Government Banking and BRICs in the Recent Financial Crisis
httpslidepdfcomreaderfullgovernment-banking-and-brics-in-the-recent-financial-crisis 5557
983106983122983113983107 983111983151983158983141983154983150983149983141983150983156 983106983137983150983147983155 983137983150983140 983110983145983150983137983150983139983145983137983148 983123983156983137983156983141983139983154983137983142983156
55
policy alternatives for political and social forces Politics shaped adjustment andrecovery through state banks differently in BRIC countries Given the realities of statecentered political realism in Russia the redirection of state banks toward goals ofChinese Five Year Plans and the modernization of the State Bank of India amidst anamorphous federalism the experience of Brazil with democratization and public bank
modernization may stand out (Armijo 2009)Further analysis of savings banks and cooperative banks also will be requiredAs members of the World Savings Bank Institute (a global association of savingsbanks) the Caixa in Brazil SNI and NABARD in India and China Postal Savings Bankappear to have provided access to very large numbers of previously unbanked citizensThis returns to traditional ideas of social banking and the history of savings banks thatwere founded throughout Europe since the late 18 th century The upmarket strategy andexpansion into investment banking and international banking of the Russian Sberbankconstrasts with downmarket strategies of savings banks in Brazil India and China
The financial press has recently reported doubts about bad loans in Chinese statebanks and cast doubt on the financial results posted and reported in this paper
However current estimates of 2-5 percent bad loans in Chinese state banks pale incomparison to the US$1240 billion in bad loans shifted to asset managementcompanies in the mid 2000s before capitalization of these institutions through sale ofshares Critics of state banking in Brazil also point to past levels of bad loans (reaching30-40 percent) because of their capture during military government delayed transitionBut the cost of capitalization and transfer of bad loans from Brazilian state banks alsoremained below US$400 billion and is still contingent on liquidation of assetmanagement companies created in 2001 In any case these numbers are very smallcompared to GAO estimates of US$120 trillion in emergency infusions by USmonetary authorities to banks and financial institutions from 2007-11
These are anomalies for recent market-based banking theory and neo-liberalpolicy designs However they do not run counter to orthodoxy in economics andbanking theory Over the last decades economic reforms (fiscal financial monetaryand banking) have improved transparency and brought public policy and marketexpectations closer However expectations about deregulation and free marketequilibria in banking and finance have succumbed in the face of panic and the stillsobering consequences of crisis The materials presented herein are descriptive and willrequire more careful analysis However given the urgency of searching for alternativedevelopment models and different approaches to financial statecraft in BRIC countriesand beyond we have taken the liberty to present research in initial stages and toprovoke thought along the lines suggested by our kind conveners
8132019 Government Banking and BRICs in the Recent Financial Crisis
httpslidepdfcomreaderfullgovernment-banking-and-brics-in-the-recent-financial-crisis 5657
983106983122983113983107 983111983151983158983141983154983150983149983141983150983156 983106983137983150983147983155 983137983150983140 983110983145983150983137983150983139983145983137983148 983123983156983137983156983141983139983154983137983142983156
56
Appendix on Alternative Banking and Social Inclusion
This appendix describes how ideas about government banking led to further work onalternative banking and social inclusion with help from the Rockefeller FoundationBellagio Center In July 2011 we were able to convene a conference designed to gather
scholars alternative banking executives and representatives from savings andcooperative bank associations to rethink strategies for social inclusion in the globalsouth and attempt to launch a new policy agenda Given the search for alternativestrategies to counter crisis and the advances of stabilization transparency and bankingsupervision in developing and emerging economies we call for alternative bankingcommunities in the global north and south to work together and help shape a new policyagenda for social inclusion Because savings banks credit cooperatives and otheralternative banking and finance institutions have realized competitive advantages andemerged from crisis we can now think beyond We believe that new policies may helpdeveloping and emerging nations redirect large domestic institutions such as postal andsavings banks toward meeting the UN millennium goals to eliminate poverty by 2015
Plans include writing a green paper on Core Principles for Alternative Bankingand Social Inclusion convening events to promote these principles through institutionalsupporters and networks and seeking adoption of these principles at policy venues suchas the World Savings Bank Institute the International Association of CooperativeBanks the Bank for International Settlements the International Financial ReportingStandards foundation the ISO International Standards Organization the Charter forResponsible Business regional development banks and the World Bank We also planto submit an edited volume of scholarly contributions on alternative banking and socialinclusion by year-end 2012 Interested parties are welcome to participate
Institutional supporters and networks include
Institutional SupportersColumbia University School of International and Public Affairs New YorkInstitute for Money Technology and Financial Inclusion University of CaliforniaIrvineKingacutes College Department of Management LondonSatildeo Paulo Business School Getulio Vargas FoundationSecond University of Naples
Networks
Association of Emerging Market Business Schools Satildeo Paulo BrazilCommunity of European Management Schools BrusselsCritical Political Economy NetworkEuropean Association of Co-operative Banks BrusselsGlobal Public Policy Network LondonInternational Cooperative Banking Association BrusselsSocial Science Finance Network AmsterdamSociety for Advancement of Social Economics PhiladelphiaWorld Savings Bank Institute Brussels
8132019 Government Banking and BRICs in the Recent Financial Crisis
httpslidepdfcomreaderfullgovernment-banking-and-brics-in-the-recent-financial-crisis 5757
983106983122983113983107 983111983151983158983141983154983150983149983141983150983156 983106983137983150983147983155 983137983150983140 983110983145983150983137983150983139983145983137983148 983123983156983137983156983141983139983154983137983142983156
Core Principles for Alternative Banking and Social Inclusion
Commitment to End Capital StarvationPromote access to and use of banking and financial services by all through newtechnologies and distribution channels to capitalize assets among the poor
Commitment to Universalize Income Savings Credit and FinanceProvide basic income via ATM cards and mobile banking to reach the poor and opennew channels of access to income savings credit finance insurance and opportunities
Prudent Banking and Regulatory ComplianceAlternative banking seeks to work within regulations guidelines and best practicesrecommended by domestic monetary authorities and international regulatory institutionssuch as the Bank for International Settlement Basel II Capital Risk Guidelines
Corporate Social Responsibility Leadership
Integrate corporate social responsibility into down-market business strategies andinstitutions of representation and democratization
Transparency and AccountabilityPublish annual reports and balance sheets in accord with international best practices offinancial social and sustainability reporting
Leadership in Provision of New Banking Services and Products to the PoorUse competitive advantages in banking and institutional networks to channel moreeffectively capital income and finance to the poor
Generate Sustainable Income and Household Asset AccumulationUse branch offices and new banking technologies to accelerate progress toward UNmillennium goals to eliminate poverty
Universalize Financial EducationPromote financial education to encourage responsible banking and finance and avertpredatory lending and unethical practices
Adopt Cutting Edge Technology and Management Practices to Provide
Competitive Alternative to Private Commercial and Investment Banks
Incorporate electronic card and mobile banking services to better serve the poorContribute to Realization of Bellagio Principles for SustainabilityPromote alternative banking and business practices that contribute to environmentallysustainable income consumption and production as stated in Bellagio Principles forSustainability
Respect and Build on National and Regional DifferencesI d f i l d l l i b ki i i i d i i l
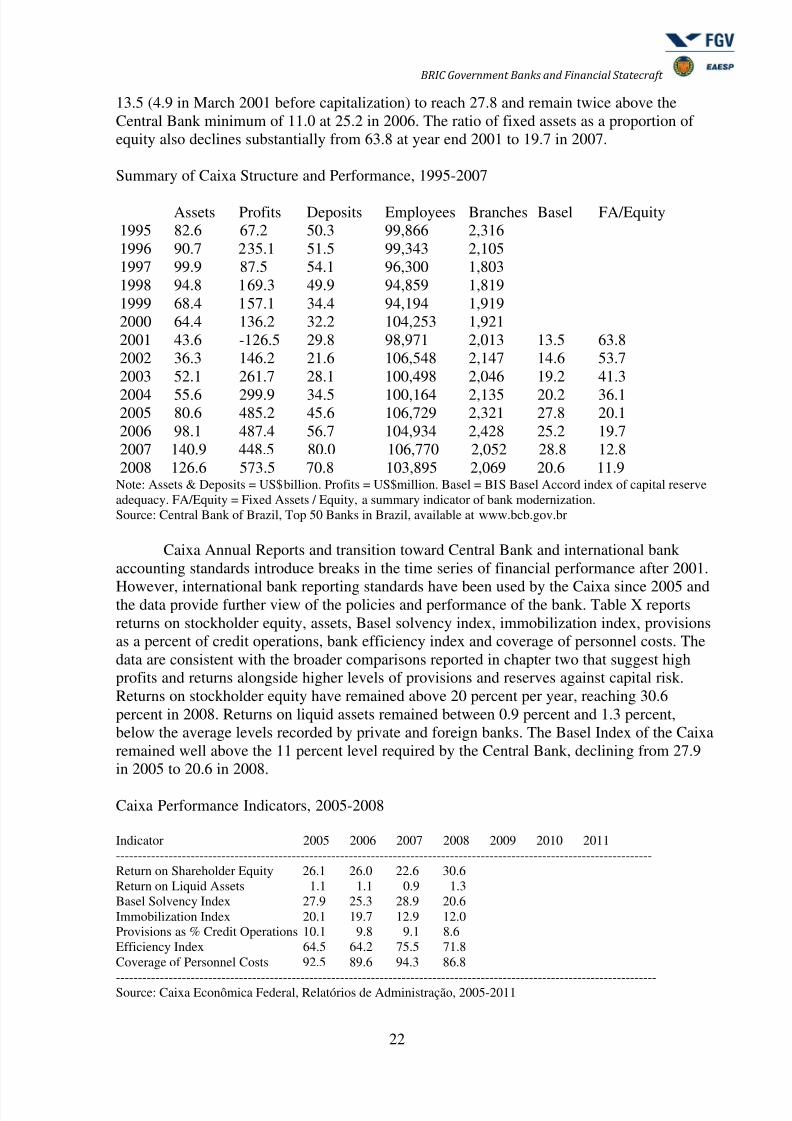
8132019 Government Banking and BRICs in the Recent Financial Crisis
httpslidepdfcomreaderfullgovernment-banking-and-brics-in-the-recent-financial-crisis 2357
983106983122983113983107 983111983151983158983141983154983150983149983141983150983156 983106983137983150983147983155 983137983150983140 983110983145983150983137983150983139983145983137983148 983123983156983137983156983141983139983154983137983142983156
23
The immobilization index of the Caixa also declined from 201 percent in 2005 to120 percent in 2008 suggesting transition toward standard levels of international bankingHowever the value of provisions as a percent of credit operations remains much higher thaninternational bank practices albeit declining from 101 percent in 2005 to 86 percent in2008 Finally both the substantial increase in efficiency index from 645 to 718 percent
suggests that the Caixa has distanced further from international private bank levels that tendto approach 500 percent This has resulted in the declining level of coverage of personnelcosts and indicates the comparatively larger organizational structure and less use ofoutsourced labor at the Caixa
Caixa Deposits and Sources of Funds 2005-2008 R$million
2005 2006 2007 2008 2009 2010 2011----------------------------------------------------------------------------------------------------------------Bank Deposits 692 863 1155 1320Savings Deposits 5328 6006 7560 9255Mid-Term Savings Deposits 3873 4219 4136 4862
Certificates (1270) (1412) (1244) (1831)Escrow (2602) (2806) (2891) (3031)
Funds and Programs 794 1034 1307 1100Other 009 015 019 013Caixa Total 10690 2139 14179 6552Bank System Total 68268 78148 92672 27482Caixa Deposits as Total (156) (155) (1531) (129)----------------------------------------------------------------------------------------------------------------Source Caixa Econocircmica Federal Relatoacuterios de Administraccedilatildeo 2005-2008
The liability side of Caixa balance sheets from 2005-8 suggests that the bank hasdistanced itself from reliance on official savings programs and funding toward consumerbank and savings deposits Bank deposits increased from R$69 billion in 2005 to overR$132 billion in 2008 Savings deposits increased from R$532 billion in 2005 to overR$925 billion in 2008 Furthermore the increase of mid-term savings deposits originatedfrom sale of savings certificates instead of escrow held by the Caixa the latter subject to
judicial review and removed from balance sheets in 2008 The value of funds deposited at theCaixa from government funds and programs increased from R$79 billion in 2005 to R$110billion in 2008 although it remains less than ten percent of total deposits In terms of totalvalue of deposits and savings the Caixa increased total value of deposits from 107 billion toover 165 billion from 2005-8
Caixa Loans 2005-8 R$ million2005 2006 2007 2008 2009 2020 2011
----------------------------------------------------------------------------------------------------------------Commercial 14652 16329 19134 28854
Consumer 8925 9474 11063 13747Business 5727 6854 8071 15107
Home 20208 26113 32475 45075Sewage and Infrastructure 1646 2556 3585 5445Other 690 691 694 689Risk Provision -3773 -4469 -5090 -6900Total Caixa Loans 37195 45689 55888 80062----------------------------------------------------------------------------------------------------------------Source Caixa Econocircmica Federal Relatoacuterios de Administraccedilatildeo 2005-8
8132019 Government Banking and BRICs in the Recent Financial Crisis
httpslidepdfcomreaderfullgovernment-banking-and-brics-in-the-recent-financial-crisis 2457
983106983122983113983107 983111983151983158983141983154983150983149983141983150983156 983106983137983150983147983155 983137983150983140 983110983145983150983137983150983139983145983137983148 983123983156983137983156983141983139983154983137983142983156
24
In terms of lending the data suggests that the primary focus of the Caixa on homeloans continued during the late 2000s although substantial increases in commercial lendingfor consumer credit and businesses suggest the diversification of the Caixa across creditmarkets Since 2005 Caixa lending to consumers and business increased from R$89 billionto R$137 billion and from R$57 billion to R$151 billion respectively in 2008
And unlike the high levels of bad and late credit reported during the adjustment to theend of high inflation in 1994-6 and financial crises (1994-5 1997 1998 1999 2001 2003)the level level of late loans at the Caixa fell substantially during the years of economicgrowth and credit expansion from 2006-2008 The percent of late over total loans at the Caixafell from 68 percent in 2006 to 40 percent in 2008 for commercial loans generally and from62 percent to 59 percent for consumer loans and 75 percent to 22 percent for loans tobusiness The value of late home loans as a percent of total home loans also fell from 31 to17 percent in 2008
Caixa AA-H Credit Classification 2001-8
Days Prov-Late ision 2001 2002 2003 2004 2005 2006 2007 2008 2009 2010 2011
---------------------------------------------------------------------------------------------------------------------------------------AA lt15 0 59 56 66 63 54 50 63 94A lt15 05 243 264 313 288 393 435 401 333---------------------------------------------------------------------------------------------------------------------------------------B 15-30 1 127 126 137 139 143 158 206 271C 31-60 3 203 166 145 169 167 192 194 192D 61-90 10 178 261 207 217 133 60 45 33---------------------------------------------------------------------------------------------------------------------------------------E 91-120 30 18 19 20 20 22 13 09 07F 121-50 50 49 15 15 14 10 07 07 07G 151-80 70 15 08 09 10 08 10 10 09
H gt180 100 104 87 85 77 68 72 61 51R$billion 2094 2353 2614 3016 3855 4736 5739 818---------------------------------------------------------------------------------------------------------------------------------------Source Caixa Annual Reports 2002-2008
The credit risk matrix of Caixa loans from 2001 to 2008 confirms this trend ofimprovement (See above table) The data also provide evidence of greater transparency andthe improvement of bank reporting and accounting standards as well as Central Banksupervision of banks Instead of two categories of credit (good = all loans up to 90 daysoverdue bad = loans over 90 days overdue) the Central Bank of Brazil has adoptedinternational standards of credit classification (from AA to H) and imposed regulations that
banks increase or decrease provisions according to the distribution of loans in thesecategories The scale of provisions required by the Central Bank vary from zero percentagainst loans classified as AA to provision of 100 percent of loan values for credits classifiedas H that is to say over 180 days late
The percent of loans over 180 days late has decreased from 104 percent of total in2001 to 51 percent in 2008 Furthermore all categories of late payment except for loansbetween 15-30 days late decreased significantly from 2001 through 2008 In comparisonloans classified as AA (paid and guaranteed) and A (paid on time) increased from 59 percentto 94 percent and 243 percent to 333 percent of total loans The only category of late loansthat increased over the period is that of loans 15-30 days overdue from 127 percent to 271percent of total
The central argument of this study is that Brazilian federal government banks retaininstitutional foundations of competitive advantage over private and foreign banks Further
8132019 Government Banking and BRICs in the Recent Financial Crisis
httpslidepdfcomreaderfullgovernment-banking-and-brics-in-the-recent-financial-crisis 2557
983106983122983113983107 983111983151983158983141983154983150983149983141983150983156 983106983137983150983147983155 983137983150983140 983110983145983150983137983150983139983145983137983148 983123983156983137983156983141983139983154983137983142983156
25
data that suggests this advantage can be seen in the increasing volume and market share ofthe Caixa in debit and credit cards The number of Caixa debit cards increased from 224million in 2002 to over 482 million in 2008 with Caixa market share of debit cards increasedfrom 196 percent ot total card market in 2002 to peak at 230 percent in 2005 and remainingat 219 percent of the total number of debit cards in Brazil in 2005
Two examples illustrate the institutional foundations of comparative advantage of theCaixa in the card payment industry First like other banks in Brazil the Caixa shares anagreement with Visa for payment processing However unlike other banks in Brazil theCaixa was contracted by the federal government to distribute ATM citizenship cards torecepients of federal government family grants and other transfer programs Apparentlywithout seeking approval the Caixa stamped its brandname on the federal government ATMcitizenship card and has continued to do so despite charges of unfair competition fromprivate domestic banks Furthermore a Caixa request to transform its 110 million ATMcitizenship cards into bank cards currently pending at the Central Bank would dramaticallyincrease the number of bank card holders in Brazil (1824 million at year end 2007)
Caixa Debit and Credit Card Market Shares 2002-2008
Million Debit Cards Million Credit Cards MillionCaixa Total Mkt Caixa Total Mkt Interbank Checks
----------------------------------------------------------------------------------------------------------------2002 224 1142 (196) 16 407 (39) 229502003 280 1254 (223) 18 440 (40) 213602004 320 1491 (213) 20 535 (37) 196702005 377 1639 (230) 25 675 (37) 183902006 384 1744 (220) 31 952 (32) 162202007 400 1824 (219) 39 1177 (33) 144902008 482 42----------------------------------------------------------------------------------------------------------------Source Central Bank of Brazil Diagnoacutestico do Sistema de Pagamentos de Varejo do Brasil Adendo Estatiacutesticondash 2007 p 9 and Caixa annual reports 2003-2008
Having reviewed the Banco do Brasil and Caixa a brief look at the counter-cyclicalpolicies and performance of the third Brazilian federal government bank ndash the BNDES ndash is inorder
Banco Nacional de Desenvolvimento Econocircmico e Social (National Bank for Economic
and Social Development BNDES)
The BNDES is a paradigmatic development bank The trajectory of the BNDES involves asequence of policies and financial practices that have shaped Brazilian development Duringthe 1950s the BNDE supplied direct credits for transportation electric energy infrastructureand steel production During the 1960s the bank diversified under financial reforms Duringthe 1970s the BNDE acted to complete state-led import substitution industrialization bychanneling foreign finance and forced savings into capital goods project lending and regionaldevelopment programs During the 1980s the bank shifted away from public investmentunder pressure of fiscal crisis and foreign debt During the 1990s the BNDES became agentfor the privatization of state owned enterprises The BNDES remained virtually the onlysource of long-term finance during a decade of financial crises in emerging markets (1994-2003) Since 2000 the bank has shifted toward ldquosecond generationrdquo reforms designed tofinance the private sector and free market forces deepen domestic capital and equity markets
8132019 Government Banking and BRICs in the Recent Financial Crisis
httpslidepdfcomreaderfullgovernment-banking-and-brics-in-the-recent-financial-crisis 2657
983106983122983113983107 983111983151983158983141983154983150983149983141983150983156 983106983137983150983147983155 983137983150983140 983110983145983150983137983150983139983145983137983148 983123983156983137983156983141983139983154983137983142983156
26
and lend to small medium and micro-enterprises Since 2004 capital inflows and a boomingdomestic stock market have reinforced the capacity of the BNDES to underwrite long-terminvestments and transform large Brazilian firms into multinational corporations Since 2007BNDES President Coutinho has pursued a full service approach attempting to help star-upsmall and medium firms provide funds to expand successful firms and participate in venture
capital funds to help enterprises transit toward corporate governance standards and initial orsecondary offerings of stock on the Bovespa exchange In 2008 as financial crisis led to ashortage of credit collapse of share prices and sharp decline in industrial production byfourth quarter 2008 the BNDES also provided lending of last resort to major Braziliancorporations while retaining long term goals for massive investments in deep sea petroleumproduction
BNDES Market Share of Interbank and Non-Bank Loans 1995-2008 US$ Billion
Interbank Loans Non-Bank Loans------------------------------------------ ------------------------------------------
BNDES Mkt Total BNDES Mkt Total-----------------------------------------------------------------------------------------------------------1995 156 (324) 481 80 (38) 20711996 181 (354) 511 109 (49) 21981997 197 (278) 707 145 (68) 21031998 216 (355) 608 230 (113) 20201999 204 (410) 497 150 (35) 14282000 243 (439) 553 152 (96) 15772001 259 (504) 515 145 (104) 13912002 233 (443) 525 137 (130) 10512003 261 (419) 622 200 (141) 14152004 306 (408) 749 218 (122) 17862005 343 (373) 918 277 (113) 24312006 388 (350) 1106 329 (102) 32312007 524 (335) 1563 432 (88) 48852008 530 (493) 1073 456 (96) 4743200920102011-----------------------------------------------------------------------------------------------------------Source Central Bank of Brazil Top 50 Banks 1995-2008
Revew of BNDES lending since 1995 suggests the realization of competitiveadvantages typical of a large centralized development bank Contrary to the extensive branchoffice networks retained by the Banco do Brasil and Caixa the BNDES retains under 1900employees (compared to 105000 at Caixa) in the Rio de Janeiro and four regional officesSince 1995 the BNDES increased its market share of non-bank loans from R$80 billion (38percent) to R$200 billion (141 percent) during the economic downturn risk aversion andcredit shortage in 2003 After 2003 the BNDES market share of loans to non-financialentities decreased to 88 percent of total loans albeit increasing during 2008 to 96 percentThis suggests that the BNDES has increased its market share of lending to non-financialsector since liberalization of the industry and privatization of state government banks
8132019 Government Banking and BRICs in the Recent Financial Crisis
httpslidepdfcomreaderfullgovernment-banking-and-brics-in-the-recent-financial-crisis 2757
983106983122983113983107 983111983151983158983141983154983150983149983141983150983156 983106983137983150983147983155 983137983150983140 983110983145983150983137983150983139983145983137983148 983123983156983137983156983141983139983154983137983142983156
27
BNDES inter-bank lending also increases substantially Since the Real Plan endedinertial inflation in 1994 the BNDES has expanded its market share of interbank lendingfrom 156 billion (324 percent) in 1995 to 530 billion (493 percent) in 2008 during creditshortage and stock market collapse During previous years of financial crisis and economicreversals the BNDES also increased interbank lending significantly For example during the
1999 and 2001 crises BNDES interbank lending increased to 410 percent and 504 percentof total This marked presence in interbank loan market reflects the role of the BNDES inproviding indirect lending to targeted sectors through private foreign and other governmentbanks in Brazil
BNDES Loan Approvals by Program 1995-2007 R$ Billion
Direct Lending 1999 2000 2001 2002 2003 2004 2005 2006 2007 2008 2009--------------------------------------------------------------------------------------------------------------------------------------Finem 51 55 68 133 79 114 132 145 220 285Capital Markets 16 19 09 08 09 06 20 34 35 104Export-Import 23 34 39 77 63 56 67 40 13 32
Sub-Total 91 109 118 219 153 177 220 221 269 424Percent Total (505) (474) (468) (585) (456) (447) (469) (430) (415) (464)
Indirect Lending--------------------------------------------------------------------------------------------------------------------------------------Finem 31 40 37 16 12 16 18 27 51 60Finame 16 25 33 40 53 66 93 107 170 221Finame Agro 07 13 18 30 28 45 21 14 20 27Finame Leasing 00 000 02 02 03 02 04 06 14 16Export-Import 14 23 20 40 56 54 73 97 67 95BNDESautom 18 17 22 24 27 34 36 35 50 55Sub-Total 89 120 134 154 182 220 249 292 379 484Percent Total (495) (526) (532) (415) (544) (553) (531) (570) (585)(536)
BNDES Total 180 230 252 374 335 398 469 513 648 908----------------------------------------------------------------------------------------------------------------Source BNDES statistics by modality available on wwwbndesgovbr
Review of BNDES finance by program suggests the evolution of credit policies from1995 through 2008 and increasing reliance on indirect lending through other financialintermediaries The three major programs of direct finance Financiamento aEmpreendimentos (Business Finance Finem) Mercado de Capitais (Capital Markets) andExport-Import finance remained between 505 percent and 415 percent of total BNDESlending with the exception of 2002 Indirect lending through six broad programs remained
between 495 percent and 585 pecent of total BNDES lending with the exception of 2002Indirect lending programs include Finem business lending Financiamento de Maquinas(Machine Finance Fineme) with agricultural and leasing modalities Export-Import financingand BNDES automatic lending provisions
These trends suggest the realization of competitive advantages over private andforeign banks in Brazil BNDES long term interest rates remained substantially lower thanSelic benchmark overnight inter-bank interest rates throughout this period while the lowercost of small staff and operations of the BNDES made lending at these rates viable Anothercompetitive advantage of the BNDES over private and foreign banks is the developmentbankacutes mandate as manager of funds from the forced savings fund Fundo de Amparo ao
Trabalhador (Worker Asssistance Fund FAT) Constitutionally mandated investments inproductive activities (not government bonds) increased from R$31 billion in 2000 to R$101
8132019 Government Banking and BRICs in the Recent Financial Crisis
httpslidepdfcomreaderfullgovernment-banking-and-brics-in-the-recent-financial-crisis 2857
983106983122983113983107 983111983151983158983141983154983150983149983141983150983156 983106983137983150983147983155 983137983150983140 983110983145983150983137983150983139983145983137983148 983123983156983137983156983141983139983154983137983142983156
28
billion in 2008 comprising 170 percent of BNDES liabilities This means that 170 percentof BNDES finance and lending is based on long-term deposits that provide no liquidity riskThis provides a competitive advantage over private and foreign banks
A closer look at BNDES lending by sector suggests that the bank still focuses
primarily on industry and infrastructure Despite the adoption of second generation reformsthat seek to free market forces and accelerate innovation and productivity through small andmedium enterprises BNDES lending still focuses on large scale industrial and long-terminfrastructure finance In this respect the BNDES embodies a persistent need in developingeconomy for state-led development banking along the lines emphasized by Lewis Myrdaland development economists 50 years ago This traditional sense of commanding heights thusstill captures the role of the BNDES in Brazilian political economy Despite more than twodecades of privatizations financial liberalization bank reforms and a variety of fiscalfinancial and economic reforms that have substantially modernized the domestic Brazilianeconomy and freed market forces the BNDES remains the single most important source forlong-term finance and credit The capitalization of the Bovespa stock market from 2004-
2008 for the first time in Brazilian history reduced the virtual monopoly of BNDES overlong term finance
BNDES Operations approved and invested by Sector 1998-2007 R$billion
1998 1999 2000 2001 2002 2003 2004 2005 2006 2007Industry ----------------------------------------------------------------------------------------------------------------------------approved 96 79 126 152 171 163 145 290 395 402invested 76 84 104 132 174 161 158 234 272 306
Infrastructure ----------------------------------------------------------------------------------------------------------------------approved 116 69 110 65 161 149 137 186 240 369invested 83 66 86 75 130 100 152 171 170 209
Other--------------------------------------------------------------------------------------------------------------------------------approved 18 47 40 54 79 93 117 69 108 126investedTotal --------------------------------------------------------------------------------------------------------------------------------approved 230 195 276 271 411 404 379 545 743 897invested 190 181 230 252 374 335 398 470 513 617
----------------------------------------------------------------------------------------------------------------Source BNDES Annual Reports 2003-2008 and testimony of BNDES President to Congress March 2009
Long-term investments have produced substantial profits at the BNDES The bank hasrecorded profits each year since 1999 increasing from over R$600 million in 1999 overR$32 billion during 2005 reaching over R$73 billion in 2007 The long-term character of
BNDES finance stands in stark contrast to policies at private banks Contrary to strategy ofprivate and foreign banks to trade and hold government paper described in chapter three theBNDES suspended purchase and trading in government paper because of constitutionalmandates to contribute to development and employment Furthermore the turn to capitalmarkets at the BNDES has provided substantial returns since 2004
However this does not mean that BNDES lending protected unproductive industriesInstead of wasting resources to unnecessarily bail out firms or provide crony credit highreturns and strong profits at the BNDES suggest that lending was sound Standard indicatorsof bank performance asset quality and capital reserves against credit and capital risk provideempirical control for this All these measures suggest that the BNDES weathered the periodof adjustment and sustained counter-cyclical investment policies without placing resources atrisk beyond Central Bank of Brazil regulations and BIS guidelines And returns have
8132019 Government Banking and BRICs in the Recent Financial Crisis
httpslidepdfcomreaderfullgovernment-banking-and-brics-in-the-recent-financial-crisis 2957
983106983122983113983107 983111983151983158983141983154983150983149983141983150983156 983106983137983150983147983155 983137983150983140 983110983145983150983137983150983139983145983137983148 983123983156983137983156983141983139983154983137983142983156
29
increased since recovery in 2004 BNDES participation in the booming Bovespa stock marketsince 2003 has provided record returns
The BNDESpar subsidiary that invests in capital markets has also recorded strongreturns during the period of economic growth and into the 2008 financial crisis BNDESparreturns on liquid assets increased from 75 percent in 2004 to 277 percent in 2007 declining
to 245 percent in 2008 Average returns on assets and stock holdings also remained highbuilding the assets held by the BNDESpar subsidiary from 141 billion in 2005 to 359 billionin 2008
This increased participation of the BNDES in capital markets involves new relationsand networks across government private sector labor unions the private pension funds ofgovernment bank and government enterprise employees and financial markets By 2007BNDES participation in stockholding and mutual funds reached across 261 forms and 25mutual funds totaling over R$910 billion reals The BNDES thereby retains broad portfoliothat represents institutional foundations of comparative advantage Furthermore unlike thepolicy of private and foreign banks to trade and hold high interest rate paying short termgovernment paper during the sudden stop of foreign finance and downturn in the Brazilian
business cycle (2002-3) the BNDES expanded credit operations and reduced financialoperations in secondary markets for indexed government paper This countered the perverseimpact of the liquidity preference among private and other government banks that increasedmarket pressures and led to shorter terms and higher cost of Brazilian government debt
BNDES aversion of government paper is required by constitutional mandate tomanage forced savings funds in ways that generate employment and income As noted alarge part of BNDES resources (liabilities) are from domestic official savings programs Thevalue of FAT resources increased from R$492 billion in 2003 to R$662 billion in 2005while the PIS-Pasep fund remained at approximately R$200 billion Foreign capital has alsobeen channeled to the BNDES through multilateral agencies and foreign bond issues Foreignloans to the BNDES have declined Multilateral agencies provided R$70 billion in 2003increased funding to R$129 billion during 2004 and continued to provide R$107 billion tothe BNDES during 2005
Comparison of BNDES structure and performance with development banks abroadsuggests both the large scale and scope of BNDES operations and controls formismanagement and political abuse of the bank In 2007 BNDES total assets are almostdouble the value reported by the Inter-American Development Bank (IADB) over frac12 thevalue of total assets held by the World Bank and almost ten times the value of assets held bythe French government development bank CAF Furthermore profits and loans from theBNDES far exceeded all three institutions The US$330 billion in loans reported by theBNDES far exceed the US$67 billion from the IADB the US$110 reported by the World
Bank and US$58 billion reported by the CAF BNDES profis returns on assets and return onliquid patrimony also far exceeded those reported by these three development banks thatserve as comparative control over performance and policies at the BNDES Finally lateloans at the BNDES remained at 011 percent of total loans well below levels reported by theWorld Bank comparable to the 010 percent reported by the IADB while considerably abovethe 001 percent reported by CAF
8132019 Government Banking and BRICs in the Recent Financial Crisis
httpslidepdfcomreaderfullgovernment-banking-and-brics-in-the-recent-financial-crisis 3057
983106983122983113983107 983111983151983158983141983154983150983149983141983150983156 983106983137983150983147983155 983137983150983140 983110983145983150983137983150983139983145983137983148 983123983156983137983156983141983139983154983137983142983156
30
Comparison of BNDES and Regional Development Banks 2007 US$ billion
BNDES IADB World Bank CAF----------------------------------------------------------------------------------------------------------------Total Assets 1144 699 2080 125
Liquid Patrimony 140 203 399 41Liquid Profits 38 01 -01 04Desembolsos 339 67 110 58Credit Portfolio 928 479 978 95Capitalization percent 123 291 192 328Return on Assets percent 38 47 na 36Return on PL percent 332 07 na 105Late Loans percent 011 010 086 001----------------------------------------------------------------------------------------------------------------Source BNDES Annual Report 2007
The large scale of BNDES lending and finance make it possible for governmentpolicy to provide counter cyclical credit to avert or ameliorate economic downturns andsubstitute private and foreign credit shortages In March 2009 testimony to Congress ongovernment policies during financial crisis BNDES President Coutinho argued that bankpolicy was to reduce the cost and increase the supply of credit Resources for counter cyclicallending during 2008-2009 came from Treasury loans to BNDES released by provisionaldecrees 439 and 414 summing R$175 billion transfer of R$60 billion in CVS funds sale ofFGTS Investment Fund and bank certificates summing R$170 billion Furthermore the thirdphase of conditional credit facility shared by Inter-American Development Bank and theBNDES provided the last tranch of a total US$60 billion for BNDES operations
Two further means were used by the BNDES to infuse capital during the collapse of
the stock market and shortage of credit during 2007-8 The counter cyclical policies of theBNDES can also be seen in the over two fold increase of BNDES holdings in private equityand investment funds Table 512 reports the value of private equity and investment fundholdings of the BNDES in 2007 and 2008 BNDES funds in private equity and mutual fundsincreased from R$4038 million in 2007 to over R$10 billion in 2008 The capitalization ofmutual funds and private equity firms by the BNDES also played an important countercyclical role during this period
BNDESpar Shareholding 2007-8 R$million
Percent Value ValueShares 2008 2007
----------------------------------------------------------------------------------------------------------------Ameacuterica Latina Logiacutestica 106 6386 -Aracruz 55 1292 1292Banco do Brasil 25 10854 12752Bom Gosto (2) 345 2458 -Brasil Telecom Part 30 1666 1958Braskem 52 2275 2432Brenco 209 1400 -CEG 345 1406 -CESP 57 2347 1397Coteminas 103 1150 1340
CPFL Energia 62 6081 5506Cia Sideruacutergica Nacional 36 1513 2686CVRD 40 15082 7098
8132019 Government Banking and BRICs in the Recent Financial Crisis
httpslidepdfcomreaderfullgovernment-banking-and-brics-in-the-recent-financial-crisis 3157
983106983122983113983107 983111983151983158983141983154983150983149983141983150983156 983106983137983150983147983155 983137983150983140 983110983145983150983137983150983139983145983137983148 983123983156983137983156983141983139983154983137983142983156
31
ELETROBRAacuteS (1) 118 22400 22400EMBRAER 50 1096 1096Gerdau 35 1533 490Independecircncia 139 2500 -JBS 130 14722 11370Klabin 202 5621 -
Light 336 8225 -Marfrig 146 8176 1020MPX Mineraccedilatildeo 26 1791 1791Ouro Fino 200 1057 840Paranapanema 175 1252 08Petrobraacutes 76 10226 10226Rede Energia SA 253 2633 -Tele Norte Leste Participaccedilotildees 16 1645 1645Valepar 97 26254 15585Subtotal 163055 102941Other firms 12223 12606Total 175278 115548----------------------------------------------------------------------------------------------------------------
Source BNDESpar Financial Statements 2008 pp
The BNDES also holds blocks of shares in many major Brazilian corporationsthrough its participation subsidiary BNDESpar Comparing value of investments in 2007 and2008 suggests that large purchases capitalized firms precisely as financial crisis and downturnin Bovespa stock market made it difficult for firms to find working capital Table X reportsthe percent of total company shares held by the BNDES and their respective market values(adjusted for risk of future losses) at year end 2007 and 2008 During this year of extremelyshort and expensive credit in Brazil caused by the international financial and banking crisisthe BNDES increased shareholding by over R$60 billion reals in 28 private Brazilianenterprises Further shareholding classified as X in Five firms (Bertin 269 Brasiliana 538
Copel 239 Rio Poliacutemeros 250 Telemar 313) Once again the BNDES provided access tocapital for firms caught in the sudden credit crunch and stock market collapse unable to meetobligations or raise funds through equity issues or commercial bank credit This countercyclical role of government banks has been critical in Brazil since the 19 th century
BNDESpar Private Equity and Fund Participation 2007-2008 R$million
Fund Manager 2008 2007-------------------------------------------------------------------------------------------------------------------------Brasil 21 Dynamo 46 60PROT Mellon Financial Services 4628 -
Logiacutestica Brasil Bradesco 135 -Fire BrasilPrivate 269 250FIPGG Governanccedila amp Gestatildeo Inv 289 311Opportunity Equity Partners Mellon Financial Services 1046 578Brasil Energia Bradesco 1184 655InfraBrasil ABN-Amro 677 251Rio Bravo Cinema Rio Bravo 116 110Brascan Petro amp Gaacutes Bank Brascan 136 113AG Angra Infra-Estrutura Bradesco 380 301Satildeo Paulo Metro Fund Bradesco 791 831Other Funds 653 572Total 10356 4038---------------------------------------------------------------------------------------------------------------------------
Source BNDESpar Financial Statements 2008
8132019 Government Banking and BRICs in the Recent Financial Crisis
httpslidepdfcomreaderfullgovernment-banking-and-brics-in-the-recent-financial-crisis 3257
983106983122983113983107 983111983151983158983141983154983150983149983141983150983156 983106983137983150983147983155 983137983150983140 983110983145983150983137983150983139983145983137983148 983123983156983137983156983141983139983154983137983142983156
32
Finally Brazilian federal government triennial plans include investment targets by theBNDES If current plans are compared to 2004-7 investments several structural changes inBNDES lending appear First BNDES plans for Oil and Petroleum production reveal aprofound change for Brazilian political economy In 1990 roughly 45 percent of oilconsumed in Brazil was imported In 2007 before oil price increased reversed the balance
Brazil reported domestic production levels sufficient to meet domestic consumptionFurthermore discoveries of substantial deep sea oil reserves have led the BNDES to planmassive investments involving Petrobras and other global petroleum firms For the 2009-2012 period investments in petroleum and gas (R$2697 billion) Petrochemicals (237) andEthanol (197) sum to over R$3130 billion
BNDES Triennial Investment Plans 2004-2012
2004-7 2007-10 2008-11 2009-12----------------------------------------------------------------------------------------------------------------Petroleum amp Gas 1472 1836 2028 2697
Mining 472 527 813 480Petrochemicals 64 174 264 237Steel 198 371 312 245Automotive 150 176 264 235Electronics 143 156 140 240Ethanol 166 205 205 197Paper amp Celulose 104 200 274 90Health 51 46 51 80Industry Total 2816 3802 4437 4501----------------------------------------------------------------------------------------------------------------Source BNDES Annual Reports 2002-2006
It is of note that President Dilma Roussef was instrumental in reducing the targets for2009-12 in petroleum and gas given indications that Petrobras and existing framework foroffshore oil prospecting and production proved unable to increase investments accordingly
The BNDES also retains a presence in government projects by providing managementassistance During 2008 BNDES staff provided management support for implementation of192 projects involving R$710 billion of total R$142 billion PT government growthacceleration projects BNDES staff also participated in the design management andimplementation of President Lularsquos Poliacutetica de Desenvolvimento Produtivo (Policy forProduction Development) involving R$2100 billion targeting production chains designed tomaximize employment and regional development benefits Finally the BNDES was alsocharged to create and co-manage a Fundo Amazonia with the Ministry of Environment toprovide incentives to reduce deforestation of the Amazon region BNDES Plans for 2009include completion of concession for construction of high speed train line and service for Riode Janeiro-Satildeo Paulo corridor two blocks of highway concession sales involving three majorhighways in each block of sales sale of management concessions for regional airports andthe reorganization of INFRAERO federal government airport management company
These policies reflect the goal of BNDES policy to launch firms on the stock marketrather than maintain direct credit and finance Exceptions during 2008 involve Auto andEthanol industies both for strategic and broader policy reasons Given the sharp downturn inauto sales during fourth quarter 2008 the BNDES provided significant lending to avert
further downsizing or failure of auto companies in Brazil Given the current globalredistribution of automobile production BNDES policies are designed to help the Brazilian
8132019 Government Banking and BRICs in the Recent Financial Crisis
httpslidepdfcomreaderfullgovernment-banking-and-brics-in-the-recent-financial-crisis 3357
983106983122983113983107 983111983151983158983141983154983150983149983141983150983156 983106983137983150983147983155 983137983150983140 983110983145983150983137983150983139983145983137983148 983123983156983137983156983141983139983154983137983142983156
33
operations of major auto firms through the period of adjustment and increase theattractiveness of domestic operations in global production strategies of multinational autocompanies Ethanol production also received massive funds to sustain an industry seen ascritical for alternative and sustainable fuel source capable of replacing petroleum Ethanolreached over 50 percent of automotive fuel sales in 2007
Under the Lula government (2003-10 the BNDES also resumed lending to state andmunicipal governments Since the renegotiation of municipal and state government debts inthe late 1990s states and municipalities have been largely prohibited from taking on debtThis was emplematic of the recentralization required to control fiscal excesses during militaryrule and the prolonged period of transition to democracy Policies during the 1990s weredesigned to avert overspending seen as critical to maintain price stability under the Real Plan(1994) In 2000 the Lei de Responsibilidade Fiscal (Fiscal Responsibility Law) largelyprohibited credit and finance to state and municipal governments Since 2000 municipalitiesand states have been required to submit detailed budget statements that in turn have been thebasis for a gradual return to sub-national government finance In August 2006 central bankand Treasury regulations freed municipalities to take on credit up to 12 times liquid receipts
Since then the BNDES has led in terms of credits and finance to subnational governmentsthrough a Programa Especial de Financiamento aos Estados e Distrito Federal
The BNDES also has developed the first system in Brazil for risk analysis ofmunicipal governments and has led in the market for municipal credit freed by August 2006procedures for approval at Treasury the Central Bank and Conselho Monetaacuterio Nacional(National Monetary Council) Prosecution of mayors and firms charged with managingmunicipal credits with the BNDES revealed fraudulent practices These funds for sub-national public finance also became critical mechanisms to counter severe budget shortfallscaused by financial crisis during 2008 Given that municipal and state government tax basesare shallow and that federal government transfers provide the bulk of sub-nationalgovernment resources the Lula administration allocated R$ 40 billion to the Fundo deParticipaccedilatildeo dos Estados (State Participation Fund) through a Programa Emergencial deFinanciamento (Emergency Finance Fund) administered by the BNDES
In sum the BNDES expanded credit and finance operations substantially during fouryears of sustained growth from 2004-2007 And having helped underwrite the stock marketboom and capitalized Brazilian firms directly and indirectly through credit finance mutualfunds and private equity funds the BNDES retained sufficient scale scope and capital baseto provide counter cyclical credit and finance to help firms adjust to financial crisis and creditshortage during 2008 In retrospect the growth of the BNDES since liberalization andprivatizations of state government banks in the 1990s suggest the comparative advantages of
development banking BNDES credit and finance fell to 52 percent of fixed capitalformation in 1995 Since then the turn to neo-developmentalism and a period of sustainedeconomic growth during the Lula administration increased the BNDES share of total fixedcapital formation during 2006 and 2007 to 126 and 141 percent Critics charge thatmonopoly over FGTS and PIS-PASEP official savings funds as liabilities provide theBNDES with unfair competitive advantage over private banks In 2008 forced savings fundssummed to only 17 percent of BNDES liabilities (resources) The BNDES does not relyexclusively on forced savings for competitive advantage Instead market-oriented policies
joint-ventures with private mutual funds investment funds private equity firms large blocksof shareholding in Brazilian firms and massive amounts of credit and investment to theprivate sector at below market but still profitable long term interest rates of 625 percent
suggest that the large scale and scope of BNDES operations provide institutional foundationsof competitive advantage over private and foreign banks
8132019 Government Banking and BRICs in the Recent Financial Crisis
httpslidepdfcomreaderfullgovernment-banking-and-brics-in-the-recent-financial-crisis 3457
983106983122983113983107 983111983151983158983141983154983150983149983141983150983156 983106983137983150983147983155 983137983150983140 983110983145983150983137983150983139983145983137983148 983123983156983137983156983141983139983154983137983142983156
34
Capitalization of the BNDES by Treasury of over R$2300 billion 2009-11hascaptured attention of many observers of Brazilian development Critics and advocates agreethat the BNDES has realized significant competitive advantages over private and foreignbanks and continues to serve as significant alternative to capital markets for large scaledevelopment projects However like the downturn in planned investments by Petrobras for
oil and gas exploration and production BNDES decreased planned investments fromR$1684 billion in 2010 to R$1397 billion in 2011 We believe this indicates the limits ofmanagement and passing of period of crisis both favoring finance from capital marketsbanks and public-private partnerships
India
Analysis of Brazilian federal banks suggests that these institutions provided policy alternativewhile realizing competitive advantage over private and foreign banks The modernization ofthese institutions helps explain why these large institutions were able to stay the effects ofcredit crunch and financial market downturn in Brazil This section explores data from the
Reserve Bank of India to compare market shares of types of banks from 1972-2008 and bankperformance from 2006-10 Further analysis will be required However the data appears tosupport our core argument that government banks have modernized and realized competitiveadvantages over private and foreign banks
First the number of branch offices which serves as a measure of institutionalcoverage across India of special concern for financial inclusion and the theory thatliberalization and privatizations would lead private banks to expand branch offices andincrease the supply of services From this perspective the trajectory of branch officessuggests that nationalized banks the State Bank of India and regional rural bankssustain much larger networks of branch offices that predominate while otherscheduled commercial (private and foreign) banks retain less than 8000 branch offices
Data from the Reserve Bank of India on the number of current accounts retainedby type of bank provide further evidence that the State Bank of India and its associates
8132019 Government Banking and BRICs in the Recent Financial Crisis
httpslidepdfcomreaderfullgovernment-banking-and-brics-in-the-recent-financial-crisis 3557
983106983122983113983107 983111983151983158983141983154983150983149983141983150983156 983106983137983150983147983155 983137983150983140 983110983145983150983137983150983139983145983137983148 983123983156983137983156983141983139983154983137983142983156
35
national banks and regional rural banks provide the bulk of banking accounts to theIndian population while private and foreign banks cherry pick upscale urban marketsreproducing capital drain and inequalities
Number of Current Accounts by Type of Bank 1972-1995
Since 1999 the pattern of predominance by alternative banking institutions and the minorrole of other scheduled commercial banks and foreign banks continues
The following figures report the value held in current accounts by type of banks first fromthe 1972-1995 period then from the 1999-2008 period For both time periods the trendconfirms that private and foreign banks remain at a competitive disadvantage in terms of thebroader market while the State Bank of India and its associates nationalized banks andregional rural banks tend to predominate
8132019 Government Banking and BRICs in the Recent Financial Crisis
httpslidepdfcomreaderfullgovernment-banking-and-brics-in-the-recent-financial-crisis 3657
983106983122983113983107 983111983151983158983141983154983150983149983141983150983156 983106983137983150983147983155 983137983150983140 983110983145983150983137983150983139983145983137983148 983123983156983137983156983141983139983154983137983142983156
36
Current Account Value by Type of Bank 1972-1995 R
Number of Deposit Accounts by type of bank 1999-2008
A similar pattern appears for the trajectory of savings accounts both the number of
accounts and the value held in savings accounts both for the 1972-1995 period We wereunable to organize data from the more recent period
8132019 Government Banking and BRICs in the Recent Financial Crisis
httpslidepdfcomreaderfullgovernment-banking-and-brics-in-the-recent-financial-crisis 3757
983106983122983113983107 983111983151983158983141983154983150983149983141983150983156 983106983137983150983147983155 983137983150983140 983110983145983150983137983150983139983145983137983148 983123983156983137983156983141983139983154983137983142983156
37
Number of Savings Accounts by Type of Bank 1972-1995
Value in Savings Accounts by Type of Bank 1972-1995
Number of Term Savings Accounts by Type of Bank 1972-1995
8132019 Government Banking and BRICs in the Recent Financial Crisis
httpslidepdfcomreaderfullgovernment-banking-and-brics-in-the-recent-financial-crisis 3857
983106983122983113983107 983111983151983158983141983154983150983149983141983150983156 983106983137983150983147983155 983137983150983140 983110983145983150983137983150983139983145983137983148 983123983156983137983156983141983139983154983137983142983156
38
Value in Term Savings Accounts by Type of Bank 1972-1995
The number and value of credits extended by banks from 1999-2008 appears mostpromising in terms of comparative analysis of bank performance and behavior Thesignificant spread at the end of the time series between the State Bank of India and itsassociates and foreign banks suggests the impact of foreign financial crisis and differentdomestic policies by these types of banks in India similar to that noted in the Brazilianexperience
Number of credits by type of bank 1999-2008
Value of credit by type of bank 1996-2008
8132019 Government Banking and BRICs in the Recent Financial Crisis
httpslidepdfcomreaderfullgovernment-banking-and-brics-in-the-recent-financial-crisis 3957
983106983122983113983107 983111983151983158983141983154983150983149983141983150983156 983106983137983150983147983155 983137983150983140 983110983145983150983137983150983139983145983137983148 983123983156983137983156983141983139983154983137983142983156
39
Further data from the Reserve Bank of India from 2008-10 permit closercomparison of government private and foreign banks in the recent financial crisis Interms of deposits investments total assets and net profits the dominant and expandingrole of government banking in India is apparent Further control variables (not reported)
include gross and net NPA types of income expenses and expenditures provisions andcontingencies and credit- and investment-deposit ratios provide control for bad bankingand confirm the counter cyclical policies during 2008-10 in India
THE FOLLOWING TABLES REQUIRE INTERPRETATION
Number of Banks 2006-7 2007-8 2008-9 2009-10 2010-11
State Bank of India amp Associates 8 8 7 7 6Nationalized Banks 20 20 20 20 20Old Private Sector Banks 17 15 15 15 14
New Private Sector Banks 8 8 7 7 7Foreign Banks 29 28 31 32 33Source RBI A Profile of Banks 2010-11
Number of Branch Offices 2006-7 2007-8 2008-9 2009-10 2010-11
State Bank of India amp Associates 14673 15848 16894 18178 18772Nationalized Banks 37435 39255 40956 43452 45640Old Private Sector Banks 4723 4690 4908 5220 5011New Private Sector Banks 2599 3635 4333 5232 6957
Foreign Banks 272 277 295 308 316Source RBI A Profile of Banks 2010-11
Number of Employees 2006-7 2007-8 2008-9 2009-10 2010-11
State Bank of India amp Associates 255699 249008 268598 266605 282453Nationalized Banks 473179 466400 462926 473041 475082Old Private Sector Banks 47994 48700 51341 55052 55075New Private Sector Banks 91060 110123 124998 127468 163604Foreign Banks 28426 31301 29582 28012 27968
Source RBI - India BanksAssociation
Business per employee (in lakh) 2006-7 2007-8 2008-9 2009-10 2010-11
State Bank of India amp Associates 43635 54922 65022 73743 79306Nationalized Banks 49001 61828 78316 93586 114477Old Private Sector Banks 48159 56932 63843 69749 8149New Private Sector Banks 80782 83196 78715 84041 82607Foreign Banks 97477 11255 128274 141139 155974Note Business = Deposits + Advances
8132019 Government Banking and BRICs in the Recent Financial Crisis
httpslidepdfcomreaderfullgovernment-banking-and-brics-in-the-recent-financial-crisis 4057
983106983122983113983107 983111983151983158983141983154983150983149983141983150983156 983106983137983150983147983155 983137983150983140 983110983145983150983137983150983139983145983137983148 983123983156983137983156983141983139983154983137983142983156
40
Profit per employee (in lakh) 2006-7 2007-8 2008-9 2009-10 2010-11
State Bank of India amp Associates 257 362 443 466 42Nationalized Banks 287 377 486 567 695Old Private Sector Banks 234 406 469 42 563New Private Sector Banks 587 685 677 847 893Foreign Banks 1613 2112 2539 1692 2759
Capital amp Reserves amp Surplus(Ycrore) 2006-7 2007-8 2008-9 2009-10 2010-11
State Bank of India amp Associates 42941 61706 72422 83726 84394Nationalized Banks 92689 113079 135920 157276 205857Old Private Sector Banks 10736 15315 17477 20171 23821New Private Sector Banks 39736 76056 82192 99813 114768Foreign Banks 33075 49332 59937 69176 80972
Deposits Ycrore 2006-7 2007-8 2008-9 2009-10 2010-11
State Bank of India amp Associates 633476 773875 1007041 1108086 1245862Nationalized Banks 1360724 1679993 2105706 2583934 3127122Old Private Sector Banks 138249 165589 199274 229897 264157New Private Sector Banks 413738 509444 537104 592904 738602Foreign Banks 150750 191161 214076 232099 240689
Investments Ycrore 2006-7 2007-8 2008-9 2009-10 2010-11
State Bank of India amp Associates 211875 263823 357624 387473 385697Nationalized Banks 452981 536018 655042 828125 942837Old Private Sector Banks 43647 54080 72393 83499 92617New Private Sector Banks 171008 224498 234139 270618 329403Foreign Banks 71471 98910 130354 159291 165499
Advances Ycrore 2006-7 2007-8 2008-9 2009-10 2010-11
State Bank of India amp Associates 482270 593722 739450 857937 994154Nationalized Banks 957877 1203678 1519762 1843082 2311478
Old Private Sector Banks 92887 111670 128504 154085 184647New Private Sector Banks 321865 406733 446824 478356 612886Foreign Banks 126339 161133 165385 163260 195539
Interest Income Ycrore 2006-7 2007-8 2008-9 2009-10 2010-11
State Bank of India amp Associates 53465 70428 89196 97954 109828Nationalized Banks 110720 142647 183892 208029 256490Old Private Sector Banks 11474 14614 18790 20497 23299New Private Sector Banks 38092 56377 66282 62309 73528
Foreign Banks 17924 24417 30322 26390 28520
8132019 Government Banking and BRICs in the Recent Financial Crisis
httpslidepdfcomreaderfullgovernment-banking-and-brics-in-the-recent-financial-crisis 4157
983106983122983113983107 983111983151983158983141983154983150983149983141983150983156 983106983137983150983147983155 983137983150983140 983110983145983150983137983150983139983145983137983148 983123983156983137983156983141983139983154983137983142983156
41
Other Income Ycrore 2006-7 2007-8 2008-9 2009-10 2010-11
State Bank of India amp Associates 9420 11818 16073 18394 19240Nationalized Banks 14264 20979 26394 30500 28625Old Private Sector Banks 1568 2184 2782 3152 3029
New Private Sector Banks 10745 14822 15078 17271 17697Foreign Banks 7044 10588 14894 9951 10972
Interest Expended Ycrore 2006-7 2007-8 2008-9 2009-10 2010-11
State Bank of India amp Associates 32607 47809 61770 66229 67018Nationalized Banks 69353 101093 131676 145712 164135Old Private Sector Banks 7055 9960 12834 14076 14768New Private Sector Banks 25802 38535 44123 37130 42347Foreign Banks 7603 10604 12819 8938 10622
Operating Expenses Ycrore 2006-7 2007-8 2008-9 2009-10 2010-11
State Bank of India amp Associates 15987 16993 20088 25283 29146Nationalized Banks 27268 29670 35416 40792 53819Old Private Sector Banks 2967 3235 3939 4715 5600New Private Sector Banks 12353 17032 17840 18136 22006Foreign Banks 7745 10353 12298 11102 12557
Cost of Funds 2006-7 2007-8 2008-9 2009-10 2010-11
State Bank of India amp Associates 475 59 594 532 48Nationalized Banks 48 582 609 537 493Old Private Sector Banks 498 62 667 613 55New Private Sector Banks 524 611 604 442 427Foreign Banks 403 433 446 283 311Cost of Funds = Ratio () of interest paid on deposits and borrowings to averageof opening and closing balances of deposits and borrowings
Return on advances adjusted toCoF 2006-7 2007-8 2008-9 2009-10 2010-11
State Bank of India amp Associates 372 365 395 36 405Nationalized Banks 399 369 409 382 427Old Private Sector Banks 406 426 515 482 492New Private Sector Banks 447 505 526 514 516Foreign Banks 574 66 815 716 564
2006-7 2007-8 2008-9 2009-10 2010-11
8132019 Government Banking and BRICs in the Recent Financial Crisis
httpslidepdfcomreaderfullgovernment-banking-and-brics-in-the-recent-financial-crisis 4257
983106983122983113983107 983111983151983158983141983154983150983149983141983150983156 983106983137983150983147983155 983137983150983140 983110983145983150983137983150983139983145983137983148 983123983156983137983156983141983139983154983137983142983156
42
Wages as of Total Expenses
State Bank of India amp Associates 2155 1589 1506 171 1921Nationalized Banks 1794 1405 1331 1365 1641Old Private Sector Banks 1689 1367 1326 1457 1675
New Private Sector Banks 936 956 1017 121 1383Foreign Banks 2008 1995 1944 2348 2331
Returns on Assets 2006-7 2007-8 2008-9 2009-10 2010-11
State Bank of India amp Associates 086 097 102 091 079Nationalized Banks 094 101 103 100 103Old Private Sector Banks 078 114 115 095 112New Private Sector Banks 109 113 112 138 151Foreign Banks 228 209 199 126 174
Capital Adequacy Ratio 2006-7 2007-8 2008-9 2009-10 2010-11
State Bank of India amp Associates 1232 1321 1396 1346 1225Nationalized Banks 1237 1213 1324 1318 1347Old Private Sector Banks 1208 1408 1476 1485 1456New Private Sector Banks 1199 1439 1533 1803 1687Foreign Banks 1239 1305 1432 1726 1672Note To 2007-8 = Basel I From 2008-09 = Basel-II
Net NPA Ratio 2006-7 2007-8 2008-9 2009-10 2010-11
State Bank of India amp Associates 132 143 147 150 149Nationalized Banks 094 077 068 091 092Old Private Sector Banks 096 066 09 082 053New Private Sector Banks 097 109 129 103 056Foreign Banks 073 077 181 182 067Net NPA Ratio = Net non-performing assets as net advances
In sum descriptive data from the Reserve Bank of India confirm the anomaly
and argument drawn from the Brazilian experience An important dimension of BRICcountry recovery from the global financial crisis and downturn is the counter cyclicallending policies and realization of competitive advantages of government banks Thisposes a series of new questions for business schools and scholars of public policyInstead of liberalization and privatization leading to transitions in BRIC countriestoward capital market centered financial systems and liberal market economies publicbanks have realized competitive advantages over private and foreign banks whileproviding policy alternatives to BRIC governments in the face of financial crisis andglobal economic slowdown We return to these implications in the conclusion
One development of note at the Reserve Bank of India is a policy focus onfinancial inclusion The 2008 report of the Committee on Financial Inclusion has beenfollowed by sections of the Reserve Bank of India Annual Report reserved fordiscussion of financial inclusion And instead of focusing on liberalization and
8132019 Government Banking and BRICs in the Recent Financial Crisis
httpslidepdfcomreaderfullgovernment-banking-and-brics-in-the-recent-financial-crisis 4357
983106983122983113983107 983111983151983158983141983154983150983149983141983150983156 983106983137983150983147983155 983137983150983140 983110983145983150983137983150983139983145983137983148 983123983156983137983156983141983139983154983137983142983156
43
privatization to ensure the spread of banking products and services alternative policieshave been explored One is of special note The Committee on Financial Inclusionrecommended issue of identity cards as bank cards This would profoundly change thelandscape of banking in India and has attracted attention from analysts at the CentralBank of Brazil charged with financial inclusion as well as the President of Indonesia
and apparently Uganda officials Given the revolution in information and card paymenttechnologies this policy proposal and pilot studies deserve close attention asalternatives to dramatically increase the pace of social inclusion of the bankless
8132019 Government Banking and BRICs in the Recent Financial Crisis
httpslidepdfcomreaderfullgovernment-banking-and-brics-in-the-recent-financial-crisis 4457
983106983122983113983107 983111983151983158983141983154983150983149983141983150983156 983106983137983150983147983155 983137983150983140 983110983145983150983137983150983139983145983137983148 983123983156983137983156983141983139983154983137983142983156
44
China
This section turns to a brief review of the Chinese banking sector to further explore therole of government banks in terms of their modernization competitive advantages
policy roles and capacity for counter cyclical credit that help explain why BRICcountries were able to avert the severe consequences of the global financial crisis
First figure A11 reports the basic structure of the banking system in China
Although we have been unable to compare the evolution of types of banks acrosstime in similar ways to the above data on India taken from the Reserve Bank of Indiaour research assistants have gathered the following comparative macroeconomicfinancial and balance sheet data on banking in China The data appear to be consistentwith the core argument presented in this paper ndash that government banks havemodernized since liberalization and provided policy makers with alternative means tocounter the effects of financial crisis abroad
8132019 Government Banking and BRICs in the Recent Financial Crisis
httpslidepdfcomreaderfullgovernment-banking-and-brics-in-the-recent-financial-crisis 4557
983106983122983113983107 983111983151983158983141983154983150983149983141983150983156 983106983137983150983147983155 983137983150983140 983110983145983150983137983150983139983145983137983148 983123983156983137983156983141983139983154983137983142983156
45
We lack more current information and were unable to collect data directly fromofficial sources in China to compare the trajectory of state owned private and foreignbanks As a substitute Figure 1 reports data from 2000-4 that permits initial observationof trends for this earlier period
Those present may not need reminding of the formidable record of economicgrowth in China during this 200-4 period that continues until today However data fromthe National Bureau of Statistics suggests that the Chinese banking system expanded atan even greater pace than the remarkable levels of GDP growth recorded for the 2000-4period Furthermore credit expansion was ldquoorganicrdquo in the sense that deposits
outpaced credit growth from 2000-4
Expansion of Loans in China 1999-2004
Loan Growth Total LoansYear on Year
Growth Total Depositssup1Year on Year
GrowthYear CNY billion CNY () CNY billion CNY()1999 9373 83 10878 1372000 9937 60 1238 1382001 11231 130 14362 1602002 13129 169 17092 1902003 159 211 20806 217
2004 18857 186 25319 217
sup1Based on preliminary estimates by the National Bureau of Statistics of the Peoplersquos Republic of ChinaSource National Bureau of Statistics of the PRC
Although we lack data comparable to that from the Reserve Bank of India ableto compare the trajectory of state private and foreign banks in China the sectoralbreakdown of loans and other banking and national account data confirms the profoundcapitalization of the Chinese banking system and GDP growth during from 1995-2004
8132019 Government Banking and BRICs in the Recent Financial Crisis
httpslidepdfcomreaderfullgovernment-banking-and-brics-in-the-recent-financial-crisis 4657
983106983122983113983107 983111983151983158983141983154983150983149983141983150983156 983106983137983150983147983155 983137983150983140 983110983145983150983137983150983139983145983137983148 983123983156983137983156983141983139983154983137983142983156
46
China Banking Sector Market Dimensions (1995 - 2004)
YearTotal
LoansCorp
LoansConsuLoans
HomeLoans
TotalDeposits Excess
GovBonds
CorpBonds GDP
GDPGrowth
()1995 52310 mdash mdash mdash 5376 145 330 65 5848 2511996 63100 mdash mdash mdash 6847 538 436 60 6788 1611997 73585 7341 17 130 8212 853 551 52 7446 971998 85002 8447 53 430 9529 102 9 777 68 7835 521999 95587 9394 164 1360 10831 1273 1054 78 8207 482000 108763 10453 424 3320 13486 261 1302 86 894 892001 118990 112 699 5600 15472 3573 1562 101 9593 732002 139800 12913 1067 8258 18339 4359 mdash mdash 10479 922003 169770 15401 1576 13302 22036 5059 mdash mdash 11669 1142004 194220 16848 1988 15800 25319 5897 mdash mdash 13657 170Figures = CNYB
This data reported in terms of percent GDP provides further clarity on the rapid
capitalization of loans It is of note that the bulk of loans during this period were to thecorporate sector with consumer and home loans lagging significantly
China Banking Sector Percent GDP
YEARTotal
LoansCorporate
LoansConsumer
LoansHomeLoans Deposits
ExcessDeposits
GovBonds
CorpBonds
1995 895 00 00 00 919 25 56 111996 929 00 00 00 1009 79 64 091997 988 986 02 02 1103 115 74 071998 1085 1078 07 05 1216 131 99 091999 1165 1145 20 17 1320 155 128 092000 1217 1169 47 37 1508 292 146 102001 1240 1167 73 58 1613 372 163 112002 1334 1232 102 79 1750 4162003 1455 1320 135 114 1888 4342004 1422 1234 146 116 1854 432
Sources China Banking Regulatory Commission Peoplersquos Bank of China and GoldmanSachs research estimates
Compilation of financial data from a select number of banks in China suggeststhat the pattern of bank change encountered in Brazil and India also describes theexperience of China The liberalization of the Chinese economy and the modernization
of state banks appear to describe the process of bank change instead of a process oftransition toward private banking and capital market centered financial systemAlthough we have been unable to draw data from Chinese monetary authorities thebalance sheet data suggests the clear predominance of large state banks in the politicaleconomy of banking and finance in China How these institutions were used to counterthe effects of financial crisis abroad and redirect domestic investment production andconsumption must remain a subject for further research
8132019 Government Banking and BRICs in the Recent Financial Crisis
httpslidepdfcomreaderfullgovernment-banking-and-brics-in-the-recent-financial-crisis 4757
983106983122983113983107 983111983151983158983141983154983150983149983141983150983156 983106983137983150983147983155 983137983150983140 983110983145983150983137983150983139983145983137983148 983123983156983137983156983141983139983154983137983142983156
47
Select Financial Data from Chinese Banks 2004()
CNY (billion)Total
AssetsGrossLoans
CustomerDeposits Equity
NPLRatio
()
Pre-prov
ProfitsNet
Profits
State Banks
ICBC 5671 3705 5105 163 190 653 23CCB 3905 2226 3489 195 39 605 484ABC (NA) mdashBOC 427 2146 3342 205 51 578 209Quasi-State
BoCom 1145 639 1023 54 30 131 16CMB 587 376 513 22 29 82 32CITIC Industrial 515 306 429 20 60 52 03SPDB 456 311 397 14 24 62 20China Everbright mdashGuangdong Development 345 216 301 mdash mdash mdash 32
Industrial Bank 341 203 283 10 25 37 11Quase-Private
Bank of Shanghai 216 106 179 83 51 32 26Hua Xia 304 181 270 92 40 29 10Shenzhen Development 198 126 166 43 114 28 03Bank of Beijing 209 85 174 71 mdash 26 07
Sector total 19422 25319 129Three state-banks 2692 3979 188Second tier banks 2549 3733 148
ABC = Agriculture Bank of China BOC = Bank of China
BOCOM = Bank of Communications CCB = China Construction BankCMB = China Merchantrsquos Bank CNY = yuanICBC = Industrial and Commercial Bank of ChinaNPL = nonperforming loanROA = return on assets ROE = return on equityprov = provisioningPRC = Peoplersquos Republic of ChinaSPDB = Shanghai Pudong Development BankNote Loan and deposit market share for BOC and ICBC are for their domestic operations onlySources Company data Goldman Sachs research estimates
Returns on Assets Equity and Domestic Market Shares of Major China Banks 2004()
CNY (billion) ROA () ROE ()Deposit Mkt
Share ()Loan MktShare ()
Mortgage MktShare()
State Banks
ICBC 004 14 199 187 253CCB 130 254 138 115 217ABC (NA)BOC 051 102 101 89 152Quasi-State
BoCom 015 45 37 29 34CMB 060 161 20 19 29
CITIC Industrial 007 17 17 16 18SPDB 048 153 16 16 26
8132019 Government Banking and BRICs in the Recent Financial Crisis
httpslidepdfcomreaderfullgovernment-banking-and-brics-in-the-recent-financial-crisis 4857
983106983122983113983107 983111983151983158983141983154983150983149983141983150983156 983106983137983150983147983155 983137983150983140 983110983145983150983137983150983139983145983137983148 983123983156983137983156983141983139983154983137983142983156
48
China EverbrightGuangdong Development mdash mdash 12 11 mdashIndustrial Bank 037 126 11 10 10Quase-Private
Bank of Shanghai 129 360 07 05 14Hua Xia 038 116 11 09 07Shenzhen Development 017 75 07 06 08Bank of Beijing 037 108 07 04 07
Sector totalThree state-banks 438 391 622Second tier banks 144 127 154
ABC = Agriculture Bank of China BOC = Bank of China BOCOM = Bank of Communications CCB =China Construction Bank CMB = China Merchantrsquos Bank CNY = yuanICBC = Industrial and Commercial Bank of China mkt = market NPL = nonperforming loan ROA =return on asset ROE = return on equity prov = provisioning PRC =Peoplersquos Republic of China SPDB = Shanghai Pudong Development BankNote Loan and deposit market share for BOC and ICBC are for their domestic operations onlySources Company data Goldman Sachs research estimates
Further data from 2006-10 from the Peoples Bank of China suggests that the big5 state banks continue to outperform the next 12 largest joint stock commercial banksThe big five have launched sales of shares to capitalize while listing on capital marketsand adopting reporting of financial data along lines of international standards Thisappears to be similar to Banco do Brasil policies that retain majority of shares in federalgovernment control while capitalizing the bank through issues of stock
Comparing the Performance of Big 5 State Banks and Next 12 Joint Stock CommercialBanks in China
2006 2007 2008 2009 2010
Profit Margin Big 5 State Banks 3116 3143 2586 3026 3269
Next 12 JS Commercial Banks 2050 2791 1796 2159 2365
Returns Big 5 State Banks 507 606 860 691 675(risk adj) Next 12 JS Commercial Banks 459 570 1016 714 723
Op Risk Big 5 State Banks 5548 5539 5215 5319 5322Next 12 JS Commercial Banks 5886 5721 5725 5831 5947
Leverage Big 5 State Banks 1626 1482 1724 173 1734Next 12 JS Commercial Banks 2826 2251 2064 2048 1936
ROE Big 5 State Banks 1424 1557 1999 1925 2037Next 12 JS Commercial Banks 1564 2049 2156 1840 1967
Big 4 and 11 JSCBsSource Peoples Bank of China China Financial Stability Reports 2007-11
Performance indicators reported by the Peoples Bank of China for the big 5 statebanks and 12 next largest joint stock commercial banks also suggest that the largestgovernment banks in China retain significant competitive advantages ndash and may providepolicy alternatives Given the current shift of economic policy in China away fromindustry and export led growth to more sustainable domestic oriented growth and socialinclusion the role of state banks clearly comes to the fore
8132019 Government Banking and BRICs in the Recent Financial Crisis
httpslidepdfcomreaderfullgovernment-banking-and-brics-in-the-recent-financial-crisis 4957
983106983122983113983107 983111983151983158983141983154983150983149983141983150983156 983106983137983150983147983155 983137983150983140 983110983145983150983137983150983139983145983137983148 983123983156983137983156983141983139983154983137983142983156
49
Net Operating Income of Big 5 State Banks and Next 12 CommercialBanks 100 million RMB YuanBig 5 State Banks 2006 2007 2008 2009 2010
Balance Net interest income 349703 500456 556790 532206 720152Net fee amp commission inc 48524 103817 138464 175469 232491
Investment income 216089 283725 338865 324037 340440
Other business income (1807) (17054) 47548 33791 2186
Net operating income 612509 870944 1081667 1065503 1314943
Percent Net interest income 5709 5746 5148 4995 5477
Net fee amp commission inc 792 1192 1280 1646 1768
Investment income 3528 3258 3133 3041 2589
Other business income (030) (196) 440 318 166
Net operating income 10000 10000 10000 100 100
Next 12 Joint Stock CommercialBanks 2006 2007 2008 2009 2010
Net interest income 87253 132945 198965 191276 281588
Net fee amp commission inc 7850 16247 27319 30115 42023
Investment income 20959 32172 44864 50767 50500
Other business income 2306 4498 16359 10384 7400
Net operating income 118468 185861 287507 282542 381511
Percent Net interest income 7365 7153 6920 6769 7381
Net fee amp commission inc 671 874 950 1066 1101
Investment income 1769 1731 1560 1797 1324
Other business income 195 242 569 368 194Net operating income 10000 10000 10000 10000 10000
Source Peoples Bank of China China Financial Stability Reports 2007-11
Big 4 and 11 JSCBsBig 5 = ICBC ABC BOC CCB BOCOMNext 12 Joint Stock Commercial Banks = China CITIC Bank Everbright Bank Huaxia BankGuangdong Development Bank Shenzhen Development Bank China Merchants Bank Shanghai PudongDevelopment Bank Industrial Bank China Minsheng Banking Corporation Evergrowing Bank ChinaZheshang Bank Bohai Bank
In conclusion bank change in China also appears to confirm our findings from
Brazil ndash that state banks have realized competitive advantages and increased marketshares since liberalization while providing counter cyclical credit to ameliorateadjustment to crisis The modernization of the China Postal Savings Bank is ofparticular interest given its social mission downmarket focus and 40000 branchOffices throughout the country Expansion of card payment services through the postalbank system confirms the importance of the Brazilian federal savings bank (CaixaEconocircmica Federal Caixa) as agent for federal government social policy and agentresponsible for management of citizenship cards (12 million) and payment of familygrants This back to the future modernization of savings banks has proved essential forovercoming notorious levels of social exclusion and inequality in Brazil Althoughenglish language materials are unavailable on the China Postal Savings Bank thisinstitution clearly presents profound opportunities for comparable policies in China
8132019 Government Banking and BRICs in the Recent Financial Crisis
httpslidepdfcomreaderfullgovernment-banking-and-brics-in-the-recent-financial-crisis 5057
983106983122983113983107 983111983151983158983141983154983150983149983141983150983156 983106983137983150983147983155 983137983150983140 983110983145983150983137983150983139983145983137983148 983123983156983137983156983141983139983154983137983142983156
50
Reported offer of microfinance services for poverty reduction as part of nationaleconomic stimulous plan may point to developments in this direction
Given that state planning capacity has long been at the center of attention intheories of financial statecraft the role of Chinese state banks in redirecting policiesaccording to the 12th 5 Year plan for 2011-15 seems critical From 2000-5 the 10th 5
Year plan emphasized infrastructure and the attraction of investment and labor skillsThe 11th 5 Year plan (2006-10) raised concerns about sustainability rather than growthlevels while also seeking to spread improvements to balance development better servepeople and improve the quality of life continue to support Center and West provincesand revitalize Northeast provinces In comparison the 12th 5 Year plan calls for morebalanced lsquoinclusiversquo growth and structural adjustemts more than 4 trillion RMB($US600 billion) for targeted industries and interior regions a focus on new energynew materials and information and high technologies biology and new medicineenergy converstaion and environmental protection aerospace marine and advancedmanufacturing This implies fundamental shifts away from industry to services that hasbeen reported in macroeconomic data for 2010 If past studies emphasized directed
credit and industrial change the role of Chinese state banks in realizing transformationscertainly warrants study
Although the domestic flow of funds process of liberalization (or the lackthereof) and insertion of banking into Chinese political economy is beyond the scope ofthis paper our findings from Brazil appear to provide valuable hypotheses about ChinaThat is to say the big state banks and other government banks in China remaincommanding heights not in the Marxist sense of providing means to reach socialismbut immense institutions with profound presence throughout politics and markets in thecountry In this sense our findings from Brazil appear to approximate patterns ofchange in China more than Washington Consensus expectations about liberalization andprivatizations to free private and foreign banks Financial statecraft draws attention tothe capitalization of Chinese state banks through stock Sales and listings on capitalmarkets However like the Banco do Brasil (that reformers in the 1990s sought to shiftcontrol to the private sector only to increase federal government shareholding) theChinese experience surely involves unexpected consequences and patterns of changedifferent than a linear transition to the Berle amp Means paradigm of corporategovernance
Russia The New State Duopoly
ldquoThe rush of 2003-8 increased the market share of foreign banks to 285 from
52 However the state-owned banks received enormous help from the federal budget in the days of the crisis thereby strengthening their dominant
position on the Russian financial market says Sergey Aleksashenko the formerDeputy chairman of Russias Central Bank quotes Russia Profile Today one
must not harbor any illusion of a fair competition with them all the main cash
flows in Russia are controlled by state-owned banks httpwwwbarentsnovacomnode1031
Description of banking policy in Russia during the global financial crisis can beobtained from Bank of Russia annual reports and related publications The figure on the
following page summarizes the financial flows to and from the Bank of RussiaAlthough central bank policy is beyond the scope of this study the role of state banks in
8132019 Government Banking and BRICs in the Recent Financial Crisis
httpslidepdfcomreaderfullgovernment-banking-and-brics-in-the-recent-financial-crisis 5157
983106983122983113983107 983111983151983158983141983154983150983149983141983150983156 983106983137983150983147983155 983137983150983140 983110983145983150983137983150983139983145983137983148 983123983156983137983156983141983139983154983137983142983156
51
channeling counter-cyclical credits released by the Bank of Russia appear to confirm thecore argument that emerges from our studies of the Brazilian banking system Furtherdata on the following pages also suggest that state banks in Russia performed wellduring 2008-10 confirming on the basis of sparse data taken from Bank of Russiareports and documents that public banks have modernized provided counter-cyclical
credit to reverse credit crunch and economic downturn while realizing competitiveadvantages over private and foreign banks
8132019 Government Banking and BRICs in the Recent Financial Crisis
httpslidepdfcomreaderfullgovernment-banking-and-brics-in-the-recent-financial-crisis 5257
983106983122983113983107 983111983151983158983141983154983150983149983141983150983156 983106983137983150983147983155 983137983150983140 983110983145983150983137983150983139983145983137983148 983123983156983137983156983141983139983154983137983142983156
52
The following aggregate figures reported by the Bank of Russia suggest severaltrends of significance First Chart 32 suggests that household deposits shifted fromRuble deposits to foreign currency pegged (or indexed) during 2008 Second Chart 33illustrates the substantial increase of non-bank overdue debt during second semester
2008
Consequently the financial results and profitability of banks declinedsignificantly during 2008 The greater confidence in deposits with government banksfound abroad suggests that this may have been critical in Russia
Performance data deom 2008-10 provides a clearer picture one that is consistentwith our findings in Brazil State banks appear to have outperformed all other types of
banks except medium and small regional banks The following table reports the averagereturns on assets and returns on equity reported by the Bank of Russia 2008-10
Returns on Assets and Equity by Type of Bank in Russia 2008-9
Return on assets Return on equity 2008 2009 2010 2008 2009 2010
-------------------------------------------------------------------------------------------------------------------State Banks 22 08 24 157 46 148Foreign Banks 18 11 21 146 83 145Large private banks 13 03 11 106 28 84Medium-Small Banks Moscow 15 12 14 68 52 67
Medium-Small Regional Banks 21 12 15 131 65 98--------------------------------------------------------------------------------------------------------------------Source Bank of Russia Bank Supervision Reports 2009 and 2010
8132019 Government Banking and BRICs in the Recent Financial Crisis
httpslidepdfcomreaderfullgovernment-banking-and-brics-in-the-recent-financial-crisis 5357
983106983122983113983107 983111983151983158983141983154983150983149983141983150983156 983106983137983150983147983155 983137983150983140 983110983145983150983137983150983139983145983137983148 983123983156983137983156983141983139983154983137983142983156
53
Further data from the Bank of Russia on the capital adequacy of Banks during2009-10 suggest that foreign banks and large private banks remain less capitalizedagainst risks according to Basel II guidelines albeit at levels almost double thatrecommended by the Bank for International Settlements (80 risk weighted) Although
further analysis is needed this data is consistent from that reported in Brazil thatgovernment banks tend to more cautious and more prudent in terms of placing asidehigher levels of reserves and patrimony against possible losses
Capital Adequacy of Banks by Type of Bank in Russia 2009-10
2009 2010 2011---------------------------------------------------------------------------------------------------------State Banks 184 227 186Foreign Banks 155 196 195Large Private Banks 140 181 155
Medium-Small Banks Moscow 316 312 268Medium-Small Regional Banks 219 241 207Non-Bank Credit Institutions 372 1038 678---------------------------------------------------------------------------------------------------------Source Bank of Russia Bank Supervision Report (Moscow) 2009 p 43
Finally Bank of Russia bank supervision reports also suggest that state banksexpanded their market shares of assets and capital during the years following the globalfinancial crisis While large private banks and foreign banks lost market share of bankassets and bank capital in Russia state banks increased their significant market sharefrom 405 ndash 426 percent and 471-476 percent of assets and capital respectivelyUnfortunately data from previous years and for specific banking groups was notobtained However this data does appear to indicate that our findings of competitiveadvantages and policy alternatives
Number and Market Share by Type of Bank
N Banks Assets Capital---------------------------- ---------------------------- ----------------------------
Type of Bank 2009 2010 2011 2009 2010 2011 2009 2010 2011-------------------------------------------------------------------------------------------------------------------------------State 17 22 27 405 439 458 471 489 473
Foreign 101 106 108 187 183 180 172 169 191Large Private 136 139 131 346 333 305 276 287 269Med-Small Moscow 361 335 317 27 26 26 43 34 35Medi-Small Regional 443 412 372 28 28 27 36 31 29Other Credit Institutions 50 51 57 07 04 04 01 02 03Total 1108 1058 100 100 100 100 100 100-------------------------------------------------------------------------------------------------------------------------------Source Bank of Russia Bank Supervision Report 2009 amp 2010
In sum politics and financial statecraft have led to the realization of significantcompetitive advantage by Russian state banks Sperbank and Vneshtorgbank increasedtheir share of bank assets from 32 percent in 2005 to over 50 percent by 2011 through
mergers and acquisitions and aggressive displacement of foreign banks Whatever thepolitics data from the Bank of Russia suggests that monetary authorities released a
8132019 Government Banking and BRICs in the Recent Financial Crisis
httpslidepdfcomreaderfullgovernment-banking-and-brics-in-the-recent-financial-crisis 5457
983106983122983113983107 983111983151983158983141983154983150983149983141983150983156 983106983137983150983147983155 983137983150983140 983110983145983150983137983150983139983145983137983148 983123983156983137983156983141983139983154983137983142983156
54
series of counter cyclical credit injections during 2008-9 to domestic bankinginstitutions Moreover data suggests that state banks continue to perform at or ahead oflevels reported by regional private and foreign banks The large market share andimproved performance of state banks reported in recent data suggests although the datais sparse that government banks in Russia have also modernized realized competitive
advantages and provided policy alternatives against the impact of financial crisisabroadWe were unable to find evidence of policy making toward social inclusion at the
Bank of Russia or Russian state banks despite the historical trajectory of the Sberbankas a savings bank under communism The context also appears to differ considerably Asurvey of the Zircon Research Group reportedly found that only 15 percent of Russiansretain bank accounts because of mistrust in banks and government This combination ofrealist politics and the realization of competitive advantages by Russian state bankssuggests that theories of economic statecraft in the realist tradition may indeed explainthe domestic developments under study
Conclusion
This paper reports evidence about government bank modernization and financialstatecraft in BRIC countries designed to counter the effects of crisis and shape domesticgrowth Government banks in BRIC countries have contributed to the widely notedadjustment of these economies to global financial crisis and economic downturnContrary to the Washington Consensus that prevailed during much of the 1980s and1990s (that privatization and liberalization especially of banking would free marketforces and deepen domestic financial systems) a quite different process of bank changeappears to have ensued after financial liberalization in the BRICs
Instead of replacement of state banks with private banks government banksremain central agents of domestic credit and growth and have modernized ldquojust intimerdquo The capitalization and realization of competitive advantages by large governmentbanks during the 2000s meant that once the US financial panic spread across capitalmarkets broke highly leveraged private and produced runs on private bank depositspolicy makers in BRIC countries nonetheless retained counter cyclical policyalternatives through their more solid large state banks
These findings counter traditional foci on the private sector individualentrepreneurship and ideals of free markets linked to the political and social advancesrecorded around the world in the last decades We report an anomaly for theories offinancial repression and the Washington Consensus about the virtues of privatization
and liberalization Although largely blamed for reproducing underdevelopment in thepast BRIC government banks averted excesses of private banking that drove creditbubbles such as home mortgages and derivatives in the US And since liberalization ofbanking (we have not adequately discussed how much liberalization occurred in eachcountry) government banks have modernized to compete with private and foreignbanks Government banks have realized competitive advantages and provided policyalternatives These two arguments help explain why BRIC countries have farecomparatively well in the face of financial crisis in core countries
Financial statecraft is therefore at the center of BRIC counter cyclical capacitiesand state planning Brazil Russia India and China fared significantly better thanadvanced and many developing countries in terms of adjusting to credit crunches and
export shocks This is because government banks proved critical interbank credit toretain confidence in domestic banking systems These institutions also presented other
8132019 Government Banking and BRICs in the Recent Financial Crisis
httpslidepdfcomreaderfullgovernment-banking-and-brics-in-the-recent-financial-crisis 5557
983106983122983113983107 983111983151983158983141983154983150983149983141983150983156 983106983137983150983147983155 983137983150983140 983110983145983150983137983150983139983145983137983148 983123983156983137983156983141983139983154983137983142983156
55
policy alternatives for political and social forces Politics shaped adjustment andrecovery through state banks differently in BRIC countries Given the realities of statecentered political realism in Russia the redirection of state banks toward goals ofChinese Five Year Plans and the modernization of the State Bank of India amidst anamorphous federalism the experience of Brazil with democratization and public bank
modernization may stand out (Armijo 2009)Further analysis of savings banks and cooperative banks also will be requiredAs members of the World Savings Bank Institute (a global association of savingsbanks) the Caixa in Brazil SNI and NABARD in India and China Postal Savings Bankappear to have provided access to very large numbers of previously unbanked citizensThis returns to traditional ideas of social banking and the history of savings banks thatwere founded throughout Europe since the late 18 th century The upmarket strategy andexpansion into investment banking and international banking of the Russian Sberbankconstrasts with downmarket strategies of savings banks in Brazil India and China
The financial press has recently reported doubts about bad loans in Chinese statebanks and cast doubt on the financial results posted and reported in this paper
However current estimates of 2-5 percent bad loans in Chinese state banks pale incomparison to the US$1240 billion in bad loans shifted to asset managementcompanies in the mid 2000s before capitalization of these institutions through sale ofshares Critics of state banking in Brazil also point to past levels of bad loans (reaching30-40 percent) because of their capture during military government delayed transitionBut the cost of capitalization and transfer of bad loans from Brazilian state banks alsoremained below US$400 billion and is still contingent on liquidation of assetmanagement companies created in 2001 In any case these numbers are very smallcompared to GAO estimates of US$120 trillion in emergency infusions by USmonetary authorities to banks and financial institutions from 2007-11
These are anomalies for recent market-based banking theory and neo-liberalpolicy designs However they do not run counter to orthodoxy in economics andbanking theory Over the last decades economic reforms (fiscal financial monetaryand banking) have improved transparency and brought public policy and marketexpectations closer However expectations about deregulation and free marketequilibria in banking and finance have succumbed in the face of panic and the stillsobering consequences of crisis The materials presented herein are descriptive and willrequire more careful analysis However given the urgency of searching for alternativedevelopment models and different approaches to financial statecraft in BRIC countriesand beyond we have taken the liberty to present research in initial stages and toprovoke thought along the lines suggested by our kind conveners
8132019 Government Banking and BRICs in the Recent Financial Crisis
httpslidepdfcomreaderfullgovernment-banking-and-brics-in-the-recent-financial-crisis 5657
983106983122983113983107 983111983151983158983141983154983150983149983141983150983156 983106983137983150983147983155 983137983150983140 983110983145983150983137983150983139983145983137983148 983123983156983137983156983141983139983154983137983142983156
56
Appendix on Alternative Banking and Social Inclusion
This appendix describes how ideas about government banking led to further work onalternative banking and social inclusion with help from the Rockefeller FoundationBellagio Center In July 2011 we were able to convene a conference designed to gather
scholars alternative banking executives and representatives from savings andcooperative bank associations to rethink strategies for social inclusion in the globalsouth and attempt to launch a new policy agenda Given the search for alternativestrategies to counter crisis and the advances of stabilization transparency and bankingsupervision in developing and emerging economies we call for alternative bankingcommunities in the global north and south to work together and help shape a new policyagenda for social inclusion Because savings banks credit cooperatives and otheralternative banking and finance institutions have realized competitive advantages andemerged from crisis we can now think beyond We believe that new policies may helpdeveloping and emerging nations redirect large domestic institutions such as postal andsavings banks toward meeting the UN millennium goals to eliminate poverty by 2015
Plans include writing a green paper on Core Principles for Alternative Bankingand Social Inclusion convening events to promote these principles through institutionalsupporters and networks and seeking adoption of these principles at policy venues suchas the World Savings Bank Institute the International Association of CooperativeBanks the Bank for International Settlements the International Financial ReportingStandards foundation the ISO International Standards Organization the Charter forResponsible Business regional development banks and the World Bank We also planto submit an edited volume of scholarly contributions on alternative banking and socialinclusion by year-end 2012 Interested parties are welcome to participate
Institutional supporters and networks include
Institutional SupportersColumbia University School of International and Public Affairs New YorkInstitute for Money Technology and Financial Inclusion University of CaliforniaIrvineKingacutes College Department of Management LondonSatildeo Paulo Business School Getulio Vargas FoundationSecond University of Naples
Networks
Association of Emerging Market Business Schools Satildeo Paulo BrazilCommunity of European Management Schools BrusselsCritical Political Economy NetworkEuropean Association of Co-operative Banks BrusselsGlobal Public Policy Network LondonInternational Cooperative Banking Association BrusselsSocial Science Finance Network AmsterdamSociety for Advancement of Social Economics PhiladelphiaWorld Savings Bank Institute Brussels
8132019 Government Banking and BRICs in the Recent Financial Crisis
httpslidepdfcomreaderfullgovernment-banking-and-brics-in-the-recent-financial-crisis 5757
983106983122983113983107 983111983151983158983141983154983150983149983141983150983156 983106983137983150983147983155 983137983150983140 983110983145983150983137983150983139983145983137983148 983123983156983137983156983141983139983154983137983142983156
Core Principles for Alternative Banking and Social Inclusion
Commitment to End Capital StarvationPromote access to and use of banking and financial services by all through newtechnologies and distribution channels to capitalize assets among the poor
Commitment to Universalize Income Savings Credit and FinanceProvide basic income via ATM cards and mobile banking to reach the poor and opennew channels of access to income savings credit finance insurance and opportunities
Prudent Banking and Regulatory ComplianceAlternative banking seeks to work within regulations guidelines and best practicesrecommended by domestic monetary authorities and international regulatory institutionssuch as the Bank for International Settlement Basel II Capital Risk Guidelines
Corporate Social Responsibility Leadership
Integrate corporate social responsibility into down-market business strategies andinstitutions of representation and democratization
Transparency and AccountabilityPublish annual reports and balance sheets in accord with international best practices offinancial social and sustainability reporting
Leadership in Provision of New Banking Services and Products to the PoorUse competitive advantages in banking and institutional networks to channel moreeffectively capital income and finance to the poor
Generate Sustainable Income and Household Asset AccumulationUse branch offices and new banking technologies to accelerate progress toward UNmillennium goals to eliminate poverty
Universalize Financial EducationPromote financial education to encourage responsible banking and finance and avertpredatory lending and unethical practices
Adopt Cutting Edge Technology and Management Practices to Provide
Competitive Alternative to Private Commercial and Investment Banks
Incorporate electronic card and mobile banking services to better serve the poorContribute to Realization of Bellagio Principles for SustainabilityPromote alternative banking and business practices that contribute to environmentallysustainable income consumption and production as stated in Bellagio Principles forSustainability
Respect and Build on National and Regional DifferencesI d f i l d l l i b ki i i i d i i l
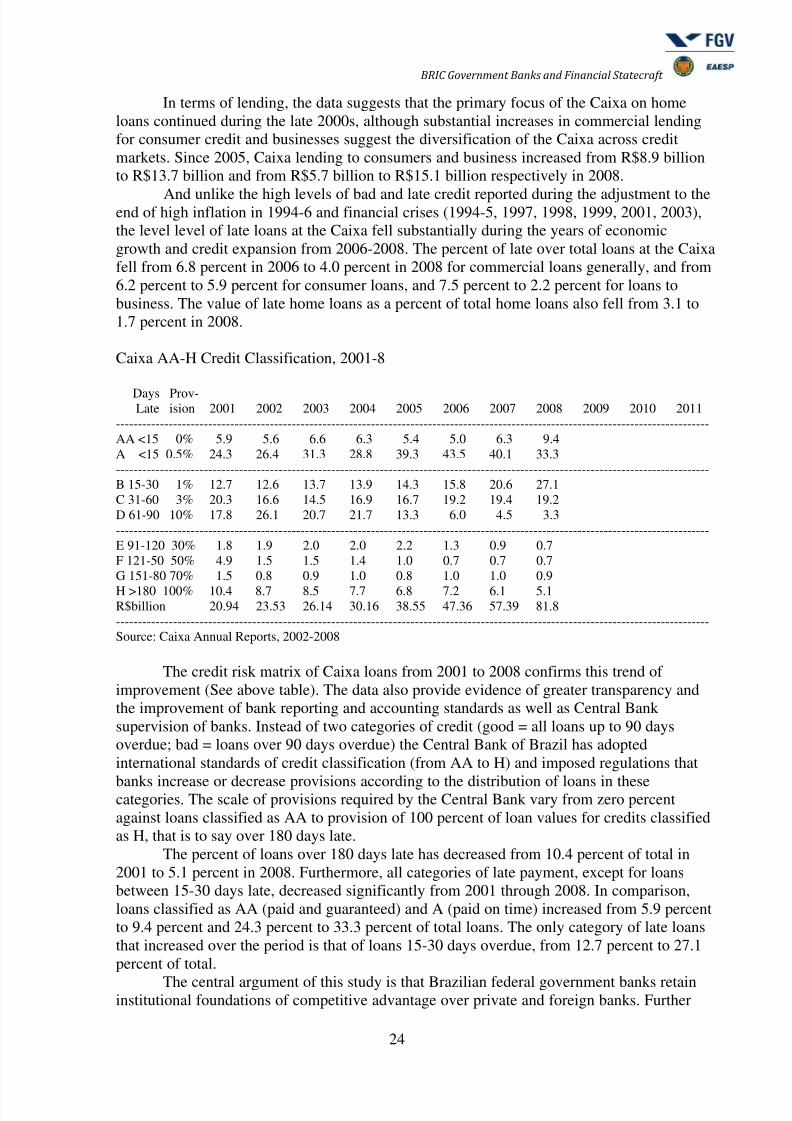
8132019 Government Banking and BRICs in the Recent Financial Crisis
httpslidepdfcomreaderfullgovernment-banking-and-brics-in-the-recent-financial-crisis 2757
983106983122983113983107 983111983151983158983141983154983150983149983141983150983156 983106983137983150983147983155 983137983150983140 983110983145983150983137983150983139983145983137983148 983123983156983137983156983141983139983154983137983142983156
27
BNDES inter-bank lending also increases substantially Since the Real Plan endedinertial inflation in 1994 the BNDES has expanded its market share of interbank lendingfrom 156 billion (324 percent) in 1995 to 530 billion (493 percent) in 2008 during creditshortage and stock market collapse During previous years of financial crisis and economicreversals the BNDES also increased interbank lending significantly For example during the
1999 and 2001 crises BNDES interbank lending increased to 410 percent and 504 percentof total This marked presence in interbank loan market reflects the role of the BNDES inproviding indirect lending to targeted sectors through private foreign and other governmentbanks in Brazil
BNDES Loan Approvals by Program 1995-2007 R$ Billion
Direct Lending 1999 2000 2001 2002 2003 2004 2005 2006 2007 2008 2009--------------------------------------------------------------------------------------------------------------------------------------Finem 51 55 68 133 79 114 132 145 220 285Capital Markets 16 19 09 08 09 06 20 34 35 104Export-Import 23 34 39 77 63 56 67 40 13 32
Sub-Total 91 109 118 219 153 177 220 221 269 424Percent Total (505) (474) (468) (585) (456) (447) (469) (430) (415) (464)
Indirect Lending--------------------------------------------------------------------------------------------------------------------------------------Finem 31 40 37 16 12 16 18 27 51 60Finame 16 25 33 40 53 66 93 107 170 221Finame Agro 07 13 18 30 28 45 21 14 20 27Finame Leasing 00 000 02 02 03 02 04 06 14 16Export-Import 14 23 20 40 56 54 73 97 67 95BNDESautom 18 17 22 24 27 34 36 35 50 55Sub-Total 89 120 134 154 182 220 249 292 379 484Percent Total (495) (526) (532) (415) (544) (553) (531) (570) (585)(536)
BNDES Total 180 230 252 374 335 398 469 513 648 908----------------------------------------------------------------------------------------------------------------Source BNDES statistics by modality available on wwwbndesgovbr
Review of BNDES finance by program suggests the evolution of credit policies from1995 through 2008 and increasing reliance on indirect lending through other financialintermediaries The three major programs of direct finance Financiamento aEmpreendimentos (Business Finance Finem) Mercado de Capitais (Capital Markets) andExport-Import finance remained between 505 percent and 415 percent of total BNDESlending with the exception of 2002 Indirect lending through six broad programs remained
between 495 percent and 585 pecent of total BNDES lending with the exception of 2002Indirect lending programs include Finem business lending Financiamento de Maquinas(Machine Finance Fineme) with agricultural and leasing modalities Export-Import financingand BNDES automatic lending provisions
These trends suggest the realization of competitive advantages over private andforeign banks in Brazil BNDES long term interest rates remained substantially lower thanSelic benchmark overnight inter-bank interest rates throughout this period while the lowercost of small staff and operations of the BNDES made lending at these rates viable Anothercompetitive advantage of the BNDES over private and foreign banks is the developmentbankacutes mandate as manager of funds from the forced savings fund Fundo de Amparo ao
Trabalhador (Worker Asssistance Fund FAT) Constitutionally mandated investments inproductive activities (not government bonds) increased from R$31 billion in 2000 to R$101
8132019 Government Banking and BRICs in the Recent Financial Crisis
httpslidepdfcomreaderfullgovernment-banking-and-brics-in-the-recent-financial-crisis 2857
983106983122983113983107 983111983151983158983141983154983150983149983141983150983156 983106983137983150983147983155 983137983150983140 983110983145983150983137983150983139983145983137983148 983123983156983137983156983141983139983154983137983142983156
28
billion in 2008 comprising 170 percent of BNDES liabilities This means that 170 percentof BNDES finance and lending is based on long-term deposits that provide no liquidity riskThis provides a competitive advantage over private and foreign banks
A closer look at BNDES lending by sector suggests that the bank still focuses
primarily on industry and infrastructure Despite the adoption of second generation reformsthat seek to free market forces and accelerate innovation and productivity through small andmedium enterprises BNDES lending still focuses on large scale industrial and long-terminfrastructure finance In this respect the BNDES embodies a persistent need in developingeconomy for state-led development banking along the lines emphasized by Lewis Myrdaland development economists 50 years ago This traditional sense of commanding heights thusstill captures the role of the BNDES in Brazilian political economy Despite more than twodecades of privatizations financial liberalization bank reforms and a variety of fiscalfinancial and economic reforms that have substantially modernized the domestic Brazilianeconomy and freed market forces the BNDES remains the single most important source forlong-term finance and credit The capitalization of the Bovespa stock market from 2004-
2008 for the first time in Brazilian history reduced the virtual monopoly of BNDES overlong term finance
BNDES Operations approved and invested by Sector 1998-2007 R$billion
1998 1999 2000 2001 2002 2003 2004 2005 2006 2007Industry ----------------------------------------------------------------------------------------------------------------------------approved 96 79 126 152 171 163 145 290 395 402invested 76 84 104 132 174 161 158 234 272 306
Infrastructure ----------------------------------------------------------------------------------------------------------------------approved 116 69 110 65 161 149 137 186 240 369invested 83 66 86 75 130 100 152 171 170 209
Other--------------------------------------------------------------------------------------------------------------------------------approved 18 47 40 54 79 93 117 69 108 126investedTotal --------------------------------------------------------------------------------------------------------------------------------approved 230 195 276 271 411 404 379 545 743 897invested 190 181 230 252 374 335 398 470 513 617
----------------------------------------------------------------------------------------------------------------Source BNDES Annual Reports 2003-2008 and testimony of BNDES President to Congress March 2009
Long-term investments have produced substantial profits at the BNDES The bank hasrecorded profits each year since 1999 increasing from over R$600 million in 1999 overR$32 billion during 2005 reaching over R$73 billion in 2007 The long-term character of
BNDES finance stands in stark contrast to policies at private banks Contrary to strategy ofprivate and foreign banks to trade and hold government paper described in chapter three theBNDES suspended purchase and trading in government paper because of constitutionalmandates to contribute to development and employment Furthermore the turn to capitalmarkets at the BNDES has provided substantial returns since 2004
However this does not mean that BNDES lending protected unproductive industriesInstead of wasting resources to unnecessarily bail out firms or provide crony credit highreturns and strong profits at the BNDES suggest that lending was sound Standard indicatorsof bank performance asset quality and capital reserves against credit and capital risk provideempirical control for this All these measures suggest that the BNDES weathered the periodof adjustment and sustained counter-cyclical investment policies without placing resources atrisk beyond Central Bank of Brazil regulations and BIS guidelines And returns have
8132019 Government Banking and BRICs in the Recent Financial Crisis
httpslidepdfcomreaderfullgovernment-banking-and-brics-in-the-recent-financial-crisis 2957
983106983122983113983107 983111983151983158983141983154983150983149983141983150983156 983106983137983150983147983155 983137983150983140 983110983145983150983137983150983139983145983137983148 983123983156983137983156983141983139983154983137983142983156
29
increased since recovery in 2004 BNDES participation in the booming Bovespa stock marketsince 2003 has provided record returns
The BNDESpar subsidiary that invests in capital markets has also recorded strongreturns during the period of economic growth and into the 2008 financial crisis BNDESparreturns on liquid assets increased from 75 percent in 2004 to 277 percent in 2007 declining
to 245 percent in 2008 Average returns on assets and stock holdings also remained highbuilding the assets held by the BNDESpar subsidiary from 141 billion in 2005 to 359 billionin 2008
This increased participation of the BNDES in capital markets involves new relationsand networks across government private sector labor unions the private pension funds ofgovernment bank and government enterprise employees and financial markets By 2007BNDES participation in stockholding and mutual funds reached across 261 forms and 25mutual funds totaling over R$910 billion reals The BNDES thereby retains broad portfoliothat represents institutional foundations of comparative advantage Furthermore unlike thepolicy of private and foreign banks to trade and hold high interest rate paying short termgovernment paper during the sudden stop of foreign finance and downturn in the Brazilian
business cycle (2002-3) the BNDES expanded credit operations and reduced financialoperations in secondary markets for indexed government paper This countered the perverseimpact of the liquidity preference among private and other government banks that increasedmarket pressures and led to shorter terms and higher cost of Brazilian government debt
BNDES aversion of government paper is required by constitutional mandate tomanage forced savings funds in ways that generate employment and income As noted alarge part of BNDES resources (liabilities) are from domestic official savings programs Thevalue of FAT resources increased from R$492 billion in 2003 to R$662 billion in 2005while the PIS-Pasep fund remained at approximately R$200 billion Foreign capital has alsobeen channeled to the BNDES through multilateral agencies and foreign bond issues Foreignloans to the BNDES have declined Multilateral agencies provided R$70 billion in 2003increased funding to R$129 billion during 2004 and continued to provide R$107 billion tothe BNDES during 2005
Comparison of BNDES structure and performance with development banks abroadsuggests both the large scale and scope of BNDES operations and controls formismanagement and political abuse of the bank In 2007 BNDES total assets are almostdouble the value reported by the Inter-American Development Bank (IADB) over frac12 thevalue of total assets held by the World Bank and almost ten times the value of assets held bythe French government development bank CAF Furthermore profits and loans from theBNDES far exceeded all three institutions The US$330 billion in loans reported by theBNDES far exceed the US$67 billion from the IADB the US$110 reported by the World
Bank and US$58 billion reported by the CAF BNDES profis returns on assets and return onliquid patrimony also far exceeded those reported by these three development banks thatserve as comparative control over performance and policies at the BNDES Finally lateloans at the BNDES remained at 011 percent of total loans well below levels reported by theWorld Bank comparable to the 010 percent reported by the IADB while considerably abovethe 001 percent reported by CAF
8132019 Government Banking and BRICs in the Recent Financial Crisis
httpslidepdfcomreaderfullgovernment-banking-and-brics-in-the-recent-financial-crisis 3057
983106983122983113983107 983111983151983158983141983154983150983149983141983150983156 983106983137983150983147983155 983137983150983140 983110983145983150983137983150983139983145983137983148 983123983156983137983156983141983139983154983137983142983156
30
Comparison of BNDES and Regional Development Banks 2007 US$ billion
BNDES IADB World Bank CAF----------------------------------------------------------------------------------------------------------------Total Assets 1144 699 2080 125
Liquid Patrimony 140 203 399 41Liquid Profits 38 01 -01 04Desembolsos 339 67 110 58Credit Portfolio 928 479 978 95Capitalization percent 123 291 192 328Return on Assets percent 38 47 na 36Return on PL percent 332 07 na 105Late Loans percent 011 010 086 001----------------------------------------------------------------------------------------------------------------Source BNDES Annual Report 2007
The large scale of BNDES lending and finance make it possible for governmentpolicy to provide counter cyclical credit to avert or ameliorate economic downturns andsubstitute private and foreign credit shortages In March 2009 testimony to Congress ongovernment policies during financial crisis BNDES President Coutinho argued that bankpolicy was to reduce the cost and increase the supply of credit Resources for counter cyclicallending during 2008-2009 came from Treasury loans to BNDES released by provisionaldecrees 439 and 414 summing R$175 billion transfer of R$60 billion in CVS funds sale ofFGTS Investment Fund and bank certificates summing R$170 billion Furthermore the thirdphase of conditional credit facility shared by Inter-American Development Bank and theBNDES provided the last tranch of a total US$60 billion for BNDES operations
Two further means were used by the BNDES to infuse capital during the collapse of
the stock market and shortage of credit during 2007-8 The counter cyclical policies of theBNDES can also be seen in the over two fold increase of BNDES holdings in private equityand investment funds Table 512 reports the value of private equity and investment fundholdings of the BNDES in 2007 and 2008 BNDES funds in private equity and mutual fundsincreased from R$4038 million in 2007 to over R$10 billion in 2008 The capitalization ofmutual funds and private equity firms by the BNDES also played an important countercyclical role during this period
BNDESpar Shareholding 2007-8 R$million
Percent Value ValueShares 2008 2007
----------------------------------------------------------------------------------------------------------------Ameacuterica Latina Logiacutestica 106 6386 -Aracruz 55 1292 1292Banco do Brasil 25 10854 12752Bom Gosto (2) 345 2458 -Brasil Telecom Part 30 1666 1958Braskem 52 2275 2432Brenco 209 1400 -CEG 345 1406 -CESP 57 2347 1397Coteminas 103 1150 1340
CPFL Energia 62 6081 5506Cia Sideruacutergica Nacional 36 1513 2686CVRD 40 15082 7098
8132019 Government Banking and BRICs in the Recent Financial Crisis
httpslidepdfcomreaderfullgovernment-banking-and-brics-in-the-recent-financial-crisis 3157
983106983122983113983107 983111983151983158983141983154983150983149983141983150983156 983106983137983150983147983155 983137983150983140 983110983145983150983137983150983139983145983137983148 983123983156983137983156983141983139983154983137983142983156
31
ELETROBRAacuteS (1) 118 22400 22400EMBRAER 50 1096 1096Gerdau 35 1533 490Independecircncia 139 2500 -JBS 130 14722 11370Klabin 202 5621 -
Light 336 8225 -Marfrig 146 8176 1020MPX Mineraccedilatildeo 26 1791 1791Ouro Fino 200 1057 840Paranapanema 175 1252 08Petrobraacutes 76 10226 10226Rede Energia SA 253 2633 -Tele Norte Leste Participaccedilotildees 16 1645 1645Valepar 97 26254 15585Subtotal 163055 102941Other firms 12223 12606Total 175278 115548----------------------------------------------------------------------------------------------------------------
Source BNDESpar Financial Statements 2008 pp
The BNDES also holds blocks of shares in many major Brazilian corporationsthrough its participation subsidiary BNDESpar Comparing value of investments in 2007 and2008 suggests that large purchases capitalized firms precisely as financial crisis and downturnin Bovespa stock market made it difficult for firms to find working capital Table X reportsthe percent of total company shares held by the BNDES and their respective market values(adjusted for risk of future losses) at year end 2007 and 2008 During this year of extremelyshort and expensive credit in Brazil caused by the international financial and banking crisisthe BNDES increased shareholding by over R$60 billion reals in 28 private Brazilianenterprises Further shareholding classified as X in Five firms (Bertin 269 Brasiliana 538
Copel 239 Rio Poliacutemeros 250 Telemar 313) Once again the BNDES provided access tocapital for firms caught in the sudden credit crunch and stock market collapse unable to meetobligations or raise funds through equity issues or commercial bank credit This countercyclical role of government banks has been critical in Brazil since the 19 th century
BNDESpar Private Equity and Fund Participation 2007-2008 R$million
Fund Manager 2008 2007-------------------------------------------------------------------------------------------------------------------------Brasil 21 Dynamo 46 60PROT Mellon Financial Services 4628 -
Logiacutestica Brasil Bradesco 135 -Fire BrasilPrivate 269 250FIPGG Governanccedila amp Gestatildeo Inv 289 311Opportunity Equity Partners Mellon Financial Services 1046 578Brasil Energia Bradesco 1184 655InfraBrasil ABN-Amro 677 251Rio Bravo Cinema Rio Bravo 116 110Brascan Petro amp Gaacutes Bank Brascan 136 113AG Angra Infra-Estrutura Bradesco 380 301Satildeo Paulo Metro Fund Bradesco 791 831Other Funds 653 572Total 10356 4038---------------------------------------------------------------------------------------------------------------------------
Source BNDESpar Financial Statements 2008
8132019 Government Banking and BRICs in the Recent Financial Crisis
httpslidepdfcomreaderfullgovernment-banking-and-brics-in-the-recent-financial-crisis 3257
983106983122983113983107 983111983151983158983141983154983150983149983141983150983156 983106983137983150983147983155 983137983150983140 983110983145983150983137983150983139983145983137983148 983123983156983137983156983141983139983154983137983142983156
32
Finally Brazilian federal government triennial plans include investment targets by theBNDES If current plans are compared to 2004-7 investments several structural changes inBNDES lending appear First BNDES plans for Oil and Petroleum production reveal aprofound change for Brazilian political economy In 1990 roughly 45 percent of oilconsumed in Brazil was imported In 2007 before oil price increased reversed the balance
Brazil reported domestic production levels sufficient to meet domestic consumptionFurthermore discoveries of substantial deep sea oil reserves have led the BNDES to planmassive investments involving Petrobras and other global petroleum firms For the 2009-2012 period investments in petroleum and gas (R$2697 billion) Petrochemicals (237) andEthanol (197) sum to over R$3130 billion
BNDES Triennial Investment Plans 2004-2012
2004-7 2007-10 2008-11 2009-12----------------------------------------------------------------------------------------------------------------Petroleum amp Gas 1472 1836 2028 2697
Mining 472 527 813 480Petrochemicals 64 174 264 237Steel 198 371 312 245Automotive 150 176 264 235Electronics 143 156 140 240Ethanol 166 205 205 197Paper amp Celulose 104 200 274 90Health 51 46 51 80Industry Total 2816 3802 4437 4501----------------------------------------------------------------------------------------------------------------Source BNDES Annual Reports 2002-2006
It is of note that President Dilma Roussef was instrumental in reducing the targets for2009-12 in petroleum and gas given indications that Petrobras and existing framework foroffshore oil prospecting and production proved unable to increase investments accordingly
The BNDES also retains a presence in government projects by providing managementassistance During 2008 BNDES staff provided management support for implementation of192 projects involving R$710 billion of total R$142 billion PT government growthacceleration projects BNDES staff also participated in the design management andimplementation of President Lularsquos Poliacutetica de Desenvolvimento Produtivo (Policy forProduction Development) involving R$2100 billion targeting production chains designed tomaximize employment and regional development benefits Finally the BNDES was alsocharged to create and co-manage a Fundo Amazonia with the Ministry of Environment toprovide incentives to reduce deforestation of the Amazon region BNDES Plans for 2009include completion of concession for construction of high speed train line and service for Riode Janeiro-Satildeo Paulo corridor two blocks of highway concession sales involving three majorhighways in each block of sales sale of management concessions for regional airports andthe reorganization of INFRAERO federal government airport management company
These policies reflect the goal of BNDES policy to launch firms on the stock marketrather than maintain direct credit and finance Exceptions during 2008 involve Auto andEthanol industies both for strategic and broader policy reasons Given the sharp downturn inauto sales during fourth quarter 2008 the BNDES provided significant lending to avert
further downsizing or failure of auto companies in Brazil Given the current globalredistribution of automobile production BNDES policies are designed to help the Brazilian
8132019 Government Banking and BRICs in the Recent Financial Crisis
httpslidepdfcomreaderfullgovernment-banking-and-brics-in-the-recent-financial-crisis 3357
983106983122983113983107 983111983151983158983141983154983150983149983141983150983156 983106983137983150983147983155 983137983150983140 983110983145983150983137983150983139983145983137983148 983123983156983137983156983141983139983154983137983142983156
33
operations of major auto firms through the period of adjustment and increase theattractiveness of domestic operations in global production strategies of multinational autocompanies Ethanol production also received massive funds to sustain an industry seen ascritical for alternative and sustainable fuel source capable of replacing petroleum Ethanolreached over 50 percent of automotive fuel sales in 2007
Under the Lula government (2003-10 the BNDES also resumed lending to state andmunicipal governments Since the renegotiation of municipal and state government debts inthe late 1990s states and municipalities have been largely prohibited from taking on debtThis was emplematic of the recentralization required to control fiscal excesses during militaryrule and the prolonged period of transition to democracy Policies during the 1990s weredesigned to avert overspending seen as critical to maintain price stability under the Real Plan(1994) In 2000 the Lei de Responsibilidade Fiscal (Fiscal Responsibility Law) largelyprohibited credit and finance to state and municipal governments Since 2000 municipalitiesand states have been required to submit detailed budget statements that in turn have been thebasis for a gradual return to sub-national government finance In August 2006 central bankand Treasury regulations freed municipalities to take on credit up to 12 times liquid receipts
Since then the BNDES has led in terms of credits and finance to subnational governmentsthrough a Programa Especial de Financiamento aos Estados e Distrito Federal
The BNDES also has developed the first system in Brazil for risk analysis ofmunicipal governments and has led in the market for municipal credit freed by August 2006procedures for approval at Treasury the Central Bank and Conselho Monetaacuterio Nacional(National Monetary Council) Prosecution of mayors and firms charged with managingmunicipal credits with the BNDES revealed fraudulent practices These funds for sub-national public finance also became critical mechanisms to counter severe budget shortfallscaused by financial crisis during 2008 Given that municipal and state government tax basesare shallow and that federal government transfers provide the bulk of sub-nationalgovernment resources the Lula administration allocated R$ 40 billion to the Fundo deParticipaccedilatildeo dos Estados (State Participation Fund) through a Programa Emergencial deFinanciamento (Emergency Finance Fund) administered by the BNDES
In sum the BNDES expanded credit and finance operations substantially during fouryears of sustained growth from 2004-2007 And having helped underwrite the stock marketboom and capitalized Brazilian firms directly and indirectly through credit finance mutualfunds and private equity funds the BNDES retained sufficient scale scope and capital baseto provide counter cyclical credit and finance to help firms adjust to financial crisis and creditshortage during 2008 In retrospect the growth of the BNDES since liberalization andprivatizations of state government banks in the 1990s suggest the comparative advantages of
development banking BNDES credit and finance fell to 52 percent of fixed capitalformation in 1995 Since then the turn to neo-developmentalism and a period of sustainedeconomic growth during the Lula administration increased the BNDES share of total fixedcapital formation during 2006 and 2007 to 126 and 141 percent Critics charge thatmonopoly over FGTS and PIS-PASEP official savings funds as liabilities provide theBNDES with unfair competitive advantage over private banks In 2008 forced savings fundssummed to only 17 percent of BNDES liabilities (resources) The BNDES does not relyexclusively on forced savings for competitive advantage Instead market-oriented policies
joint-ventures with private mutual funds investment funds private equity firms large blocksof shareholding in Brazilian firms and massive amounts of credit and investment to theprivate sector at below market but still profitable long term interest rates of 625 percent
suggest that the large scale and scope of BNDES operations provide institutional foundationsof competitive advantage over private and foreign banks
8132019 Government Banking and BRICs in the Recent Financial Crisis
httpslidepdfcomreaderfullgovernment-banking-and-brics-in-the-recent-financial-crisis 3457
983106983122983113983107 983111983151983158983141983154983150983149983141983150983156 983106983137983150983147983155 983137983150983140 983110983145983150983137983150983139983145983137983148 983123983156983137983156983141983139983154983137983142983156
34
Capitalization of the BNDES by Treasury of over R$2300 billion 2009-11hascaptured attention of many observers of Brazilian development Critics and advocates agreethat the BNDES has realized significant competitive advantages over private and foreignbanks and continues to serve as significant alternative to capital markets for large scaledevelopment projects However like the downturn in planned investments by Petrobras for
oil and gas exploration and production BNDES decreased planned investments fromR$1684 billion in 2010 to R$1397 billion in 2011 We believe this indicates the limits ofmanagement and passing of period of crisis both favoring finance from capital marketsbanks and public-private partnerships
India
Analysis of Brazilian federal banks suggests that these institutions provided policy alternativewhile realizing competitive advantage over private and foreign banks The modernization ofthese institutions helps explain why these large institutions were able to stay the effects ofcredit crunch and financial market downturn in Brazil This section explores data from the
Reserve Bank of India to compare market shares of types of banks from 1972-2008 and bankperformance from 2006-10 Further analysis will be required However the data appears tosupport our core argument that government banks have modernized and realized competitiveadvantages over private and foreign banks
First the number of branch offices which serves as a measure of institutionalcoverage across India of special concern for financial inclusion and the theory thatliberalization and privatizations would lead private banks to expand branch offices andincrease the supply of services From this perspective the trajectory of branch officessuggests that nationalized banks the State Bank of India and regional rural bankssustain much larger networks of branch offices that predominate while otherscheduled commercial (private and foreign) banks retain less than 8000 branch offices
Data from the Reserve Bank of India on the number of current accounts retainedby type of bank provide further evidence that the State Bank of India and its associates
8132019 Government Banking and BRICs in the Recent Financial Crisis
httpslidepdfcomreaderfullgovernment-banking-and-brics-in-the-recent-financial-crisis 3557
983106983122983113983107 983111983151983158983141983154983150983149983141983150983156 983106983137983150983147983155 983137983150983140 983110983145983150983137983150983139983145983137983148 983123983156983137983156983141983139983154983137983142983156
35
national banks and regional rural banks provide the bulk of banking accounts to theIndian population while private and foreign banks cherry pick upscale urban marketsreproducing capital drain and inequalities
Number of Current Accounts by Type of Bank 1972-1995
Since 1999 the pattern of predominance by alternative banking institutions and the minorrole of other scheduled commercial banks and foreign banks continues
The following figures report the value held in current accounts by type of banks first fromthe 1972-1995 period then from the 1999-2008 period For both time periods the trendconfirms that private and foreign banks remain at a competitive disadvantage in terms of thebroader market while the State Bank of India and its associates nationalized banks andregional rural banks tend to predominate
8132019 Government Banking and BRICs in the Recent Financial Crisis
httpslidepdfcomreaderfullgovernment-banking-and-brics-in-the-recent-financial-crisis 3657
983106983122983113983107 983111983151983158983141983154983150983149983141983150983156 983106983137983150983147983155 983137983150983140 983110983145983150983137983150983139983145983137983148 983123983156983137983156983141983139983154983137983142983156
36
Current Account Value by Type of Bank 1972-1995 R
Number of Deposit Accounts by type of bank 1999-2008
A similar pattern appears for the trajectory of savings accounts both the number of
accounts and the value held in savings accounts both for the 1972-1995 period We wereunable to organize data from the more recent period
8132019 Government Banking and BRICs in the Recent Financial Crisis
httpslidepdfcomreaderfullgovernment-banking-and-brics-in-the-recent-financial-crisis 3757
983106983122983113983107 983111983151983158983141983154983150983149983141983150983156 983106983137983150983147983155 983137983150983140 983110983145983150983137983150983139983145983137983148 983123983156983137983156983141983139983154983137983142983156
37
Number of Savings Accounts by Type of Bank 1972-1995
Value in Savings Accounts by Type of Bank 1972-1995
Number of Term Savings Accounts by Type of Bank 1972-1995
8132019 Government Banking and BRICs in the Recent Financial Crisis
httpslidepdfcomreaderfullgovernment-banking-and-brics-in-the-recent-financial-crisis 3857
983106983122983113983107 983111983151983158983141983154983150983149983141983150983156 983106983137983150983147983155 983137983150983140 983110983145983150983137983150983139983145983137983148 983123983156983137983156983141983139983154983137983142983156
38
Value in Term Savings Accounts by Type of Bank 1972-1995
The number and value of credits extended by banks from 1999-2008 appears mostpromising in terms of comparative analysis of bank performance and behavior Thesignificant spread at the end of the time series between the State Bank of India and itsassociates and foreign banks suggests the impact of foreign financial crisis and differentdomestic policies by these types of banks in India similar to that noted in the Brazilianexperience
Number of credits by type of bank 1999-2008
Value of credit by type of bank 1996-2008
8132019 Government Banking and BRICs in the Recent Financial Crisis
httpslidepdfcomreaderfullgovernment-banking-and-brics-in-the-recent-financial-crisis 3957
983106983122983113983107 983111983151983158983141983154983150983149983141983150983156 983106983137983150983147983155 983137983150983140 983110983145983150983137983150983139983145983137983148 983123983156983137983156983141983139983154983137983142983156
39
Further data from the Reserve Bank of India from 2008-10 permit closercomparison of government private and foreign banks in the recent financial crisis Interms of deposits investments total assets and net profits the dominant and expandingrole of government banking in India is apparent Further control variables (not reported)
include gross and net NPA types of income expenses and expenditures provisions andcontingencies and credit- and investment-deposit ratios provide control for bad bankingand confirm the counter cyclical policies during 2008-10 in India
THE FOLLOWING TABLES REQUIRE INTERPRETATION
Number of Banks 2006-7 2007-8 2008-9 2009-10 2010-11
State Bank of India amp Associates 8 8 7 7 6Nationalized Banks 20 20 20 20 20Old Private Sector Banks 17 15 15 15 14
New Private Sector Banks 8 8 7 7 7Foreign Banks 29 28 31 32 33Source RBI A Profile of Banks 2010-11
Number of Branch Offices 2006-7 2007-8 2008-9 2009-10 2010-11
State Bank of India amp Associates 14673 15848 16894 18178 18772Nationalized Banks 37435 39255 40956 43452 45640Old Private Sector Banks 4723 4690 4908 5220 5011New Private Sector Banks 2599 3635 4333 5232 6957
Foreign Banks 272 277 295 308 316Source RBI A Profile of Banks 2010-11
Number of Employees 2006-7 2007-8 2008-9 2009-10 2010-11
State Bank of India amp Associates 255699 249008 268598 266605 282453Nationalized Banks 473179 466400 462926 473041 475082Old Private Sector Banks 47994 48700 51341 55052 55075New Private Sector Banks 91060 110123 124998 127468 163604Foreign Banks 28426 31301 29582 28012 27968
Source RBI - India BanksAssociation
Business per employee (in lakh) 2006-7 2007-8 2008-9 2009-10 2010-11
State Bank of India amp Associates 43635 54922 65022 73743 79306Nationalized Banks 49001 61828 78316 93586 114477Old Private Sector Banks 48159 56932 63843 69749 8149New Private Sector Banks 80782 83196 78715 84041 82607Foreign Banks 97477 11255 128274 141139 155974Note Business = Deposits + Advances
8132019 Government Banking and BRICs in the Recent Financial Crisis
httpslidepdfcomreaderfullgovernment-banking-and-brics-in-the-recent-financial-crisis 4057
983106983122983113983107 983111983151983158983141983154983150983149983141983150983156 983106983137983150983147983155 983137983150983140 983110983145983150983137983150983139983145983137983148 983123983156983137983156983141983139983154983137983142983156
40
Profit per employee (in lakh) 2006-7 2007-8 2008-9 2009-10 2010-11
State Bank of India amp Associates 257 362 443 466 42Nationalized Banks 287 377 486 567 695Old Private Sector Banks 234 406 469 42 563New Private Sector Banks 587 685 677 847 893Foreign Banks 1613 2112 2539 1692 2759
Capital amp Reserves amp Surplus(Ycrore) 2006-7 2007-8 2008-9 2009-10 2010-11
State Bank of India amp Associates 42941 61706 72422 83726 84394Nationalized Banks 92689 113079 135920 157276 205857Old Private Sector Banks 10736 15315 17477 20171 23821New Private Sector Banks 39736 76056 82192 99813 114768Foreign Banks 33075 49332 59937 69176 80972
Deposits Ycrore 2006-7 2007-8 2008-9 2009-10 2010-11
State Bank of India amp Associates 633476 773875 1007041 1108086 1245862Nationalized Banks 1360724 1679993 2105706 2583934 3127122Old Private Sector Banks 138249 165589 199274 229897 264157New Private Sector Banks 413738 509444 537104 592904 738602Foreign Banks 150750 191161 214076 232099 240689
Investments Ycrore 2006-7 2007-8 2008-9 2009-10 2010-11
State Bank of India amp Associates 211875 263823 357624 387473 385697Nationalized Banks 452981 536018 655042 828125 942837Old Private Sector Banks 43647 54080 72393 83499 92617New Private Sector Banks 171008 224498 234139 270618 329403Foreign Banks 71471 98910 130354 159291 165499
Advances Ycrore 2006-7 2007-8 2008-9 2009-10 2010-11
State Bank of India amp Associates 482270 593722 739450 857937 994154Nationalized Banks 957877 1203678 1519762 1843082 2311478
Old Private Sector Banks 92887 111670 128504 154085 184647New Private Sector Banks 321865 406733 446824 478356 612886Foreign Banks 126339 161133 165385 163260 195539
Interest Income Ycrore 2006-7 2007-8 2008-9 2009-10 2010-11
State Bank of India amp Associates 53465 70428 89196 97954 109828Nationalized Banks 110720 142647 183892 208029 256490Old Private Sector Banks 11474 14614 18790 20497 23299New Private Sector Banks 38092 56377 66282 62309 73528
Foreign Banks 17924 24417 30322 26390 28520
8132019 Government Banking and BRICs in the Recent Financial Crisis
httpslidepdfcomreaderfullgovernment-banking-and-brics-in-the-recent-financial-crisis 4157
983106983122983113983107 983111983151983158983141983154983150983149983141983150983156 983106983137983150983147983155 983137983150983140 983110983145983150983137983150983139983145983137983148 983123983156983137983156983141983139983154983137983142983156
41
Other Income Ycrore 2006-7 2007-8 2008-9 2009-10 2010-11
State Bank of India amp Associates 9420 11818 16073 18394 19240Nationalized Banks 14264 20979 26394 30500 28625Old Private Sector Banks 1568 2184 2782 3152 3029
New Private Sector Banks 10745 14822 15078 17271 17697Foreign Banks 7044 10588 14894 9951 10972
Interest Expended Ycrore 2006-7 2007-8 2008-9 2009-10 2010-11
State Bank of India amp Associates 32607 47809 61770 66229 67018Nationalized Banks 69353 101093 131676 145712 164135Old Private Sector Banks 7055 9960 12834 14076 14768New Private Sector Banks 25802 38535 44123 37130 42347Foreign Banks 7603 10604 12819 8938 10622
Operating Expenses Ycrore 2006-7 2007-8 2008-9 2009-10 2010-11
State Bank of India amp Associates 15987 16993 20088 25283 29146Nationalized Banks 27268 29670 35416 40792 53819Old Private Sector Banks 2967 3235 3939 4715 5600New Private Sector Banks 12353 17032 17840 18136 22006Foreign Banks 7745 10353 12298 11102 12557
Cost of Funds 2006-7 2007-8 2008-9 2009-10 2010-11
State Bank of India amp Associates 475 59 594 532 48Nationalized Banks 48 582 609 537 493Old Private Sector Banks 498 62 667 613 55New Private Sector Banks 524 611 604 442 427Foreign Banks 403 433 446 283 311Cost of Funds = Ratio () of interest paid on deposits and borrowings to averageof opening and closing balances of deposits and borrowings
Return on advances adjusted toCoF 2006-7 2007-8 2008-9 2009-10 2010-11
State Bank of India amp Associates 372 365 395 36 405Nationalized Banks 399 369 409 382 427Old Private Sector Banks 406 426 515 482 492New Private Sector Banks 447 505 526 514 516Foreign Banks 574 66 815 716 564
2006-7 2007-8 2008-9 2009-10 2010-11
8132019 Government Banking and BRICs in the Recent Financial Crisis
httpslidepdfcomreaderfullgovernment-banking-and-brics-in-the-recent-financial-crisis 4257
983106983122983113983107 983111983151983158983141983154983150983149983141983150983156 983106983137983150983147983155 983137983150983140 983110983145983150983137983150983139983145983137983148 983123983156983137983156983141983139983154983137983142983156
42
Wages as of Total Expenses
State Bank of India amp Associates 2155 1589 1506 171 1921Nationalized Banks 1794 1405 1331 1365 1641Old Private Sector Banks 1689 1367 1326 1457 1675
New Private Sector Banks 936 956 1017 121 1383Foreign Banks 2008 1995 1944 2348 2331
Returns on Assets 2006-7 2007-8 2008-9 2009-10 2010-11
State Bank of India amp Associates 086 097 102 091 079Nationalized Banks 094 101 103 100 103Old Private Sector Banks 078 114 115 095 112New Private Sector Banks 109 113 112 138 151Foreign Banks 228 209 199 126 174
Capital Adequacy Ratio 2006-7 2007-8 2008-9 2009-10 2010-11
State Bank of India amp Associates 1232 1321 1396 1346 1225Nationalized Banks 1237 1213 1324 1318 1347Old Private Sector Banks 1208 1408 1476 1485 1456New Private Sector Banks 1199 1439 1533 1803 1687Foreign Banks 1239 1305 1432 1726 1672Note To 2007-8 = Basel I From 2008-09 = Basel-II
Net NPA Ratio 2006-7 2007-8 2008-9 2009-10 2010-11
State Bank of India amp Associates 132 143 147 150 149Nationalized Banks 094 077 068 091 092Old Private Sector Banks 096 066 09 082 053New Private Sector Banks 097 109 129 103 056Foreign Banks 073 077 181 182 067Net NPA Ratio = Net non-performing assets as net advances
In sum descriptive data from the Reserve Bank of India confirm the anomaly
and argument drawn from the Brazilian experience An important dimension of BRICcountry recovery from the global financial crisis and downturn is the counter cyclicallending policies and realization of competitive advantages of government banks Thisposes a series of new questions for business schools and scholars of public policyInstead of liberalization and privatization leading to transitions in BRIC countriestoward capital market centered financial systems and liberal market economies publicbanks have realized competitive advantages over private and foreign banks whileproviding policy alternatives to BRIC governments in the face of financial crisis andglobal economic slowdown We return to these implications in the conclusion
One development of note at the Reserve Bank of India is a policy focus onfinancial inclusion The 2008 report of the Committee on Financial Inclusion has beenfollowed by sections of the Reserve Bank of India Annual Report reserved fordiscussion of financial inclusion And instead of focusing on liberalization and
8132019 Government Banking and BRICs in the Recent Financial Crisis
httpslidepdfcomreaderfullgovernment-banking-and-brics-in-the-recent-financial-crisis 4357
983106983122983113983107 983111983151983158983141983154983150983149983141983150983156 983106983137983150983147983155 983137983150983140 983110983145983150983137983150983139983145983137983148 983123983156983137983156983141983139983154983137983142983156
43
privatization to ensure the spread of banking products and services alternative policieshave been explored One is of special note The Committee on Financial Inclusionrecommended issue of identity cards as bank cards This would profoundly change thelandscape of banking in India and has attracted attention from analysts at the CentralBank of Brazil charged with financial inclusion as well as the President of Indonesia
and apparently Uganda officials Given the revolution in information and card paymenttechnologies this policy proposal and pilot studies deserve close attention asalternatives to dramatically increase the pace of social inclusion of the bankless
8132019 Government Banking and BRICs in the Recent Financial Crisis
httpslidepdfcomreaderfullgovernment-banking-and-brics-in-the-recent-financial-crisis 4457
983106983122983113983107 983111983151983158983141983154983150983149983141983150983156 983106983137983150983147983155 983137983150983140 983110983145983150983137983150983139983145983137983148 983123983156983137983156983141983139983154983137983142983156
44
China
This section turns to a brief review of the Chinese banking sector to further explore therole of government banks in terms of their modernization competitive advantages
policy roles and capacity for counter cyclical credit that help explain why BRICcountries were able to avert the severe consequences of the global financial crisis
First figure A11 reports the basic structure of the banking system in China
Although we have been unable to compare the evolution of types of banks acrosstime in similar ways to the above data on India taken from the Reserve Bank of Indiaour research assistants have gathered the following comparative macroeconomicfinancial and balance sheet data on banking in China The data appear to be consistentwith the core argument presented in this paper ndash that government banks havemodernized since liberalization and provided policy makers with alternative means tocounter the effects of financial crisis abroad
8132019 Government Banking and BRICs in the Recent Financial Crisis
httpslidepdfcomreaderfullgovernment-banking-and-brics-in-the-recent-financial-crisis 4557
983106983122983113983107 983111983151983158983141983154983150983149983141983150983156 983106983137983150983147983155 983137983150983140 983110983145983150983137983150983139983145983137983148 983123983156983137983156983141983139983154983137983142983156
45
We lack more current information and were unable to collect data directly fromofficial sources in China to compare the trajectory of state owned private and foreignbanks As a substitute Figure 1 reports data from 2000-4 that permits initial observationof trends for this earlier period
Those present may not need reminding of the formidable record of economicgrowth in China during this 200-4 period that continues until today However data fromthe National Bureau of Statistics suggests that the Chinese banking system expanded atan even greater pace than the remarkable levels of GDP growth recorded for the 2000-4period Furthermore credit expansion was ldquoorganicrdquo in the sense that deposits
outpaced credit growth from 2000-4
Expansion of Loans in China 1999-2004
Loan Growth Total LoansYear on Year
Growth Total Depositssup1Year on Year
GrowthYear CNY billion CNY () CNY billion CNY()1999 9373 83 10878 1372000 9937 60 1238 1382001 11231 130 14362 1602002 13129 169 17092 1902003 159 211 20806 217
2004 18857 186 25319 217
sup1Based on preliminary estimates by the National Bureau of Statistics of the Peoplersquos Republic of ChinaSource National Bureau of Statistics of the PRC
Although we lack data comparable to that from the Reserve Bank of India ableto compare the trajectory of state private and foreign banks in China the sectoralbreakdown of loans and other banking and national account data confirms the profoundcapitalization of the Chinese banking system and GDP growth during from 1995-2004
8132019 Government Banking and BRICs in the Recent Financial Crisis
httpslidepdfcomreaderfullgovernment-banking-and-brics-in-the-recent-financial-crisis 4657
983106983122983113983107 983111983151983158983141983154983150983149983141983150983156 983106983137983150983147983155 983137983150983140 983110983145983150983137983150983139983145983137983148 983123983156983137983156983141983139983154983137983142983156
46
China Banking Sector Market Dimensions (1995 - 2004)
YearTotal
LoansCorp
LoansConsuLoans
HomeLoans
TotalDeposits Excess
GovBonds
CorpBonds GDP
GDPGrowth
()1995 52310 mdash mdash mdash 5376 145 330 65 5848 2511996 63100 mdash mdash mdash 6847 538 436 60 6788 1611997 73585 7341 17 130 8212 853 551 52 7446 971998 85002 8447 53 430 9529 102 9 777 68 7835 521999 95587 9394 164 1360 10831 1273 1054 78 8207 482000 108763 10453 424 3320 13486 261 1302 86 894 892001 118990 112 699 5600 15472 3573 1562 101 9593 732002 139800 12913 1067 8258 18339 4359 mdash mdash 10479 922003 169770 15401 1576 13302 22036 5059 mdash mdash 11669 1142004 194220 16848 1988 15800 25319 5897 mdash mdash 13657 170Figures = CNYB
This data reported in terms of percent GDP provides further clarity on the rapid
capitalization of loans It is of note that the bulk of loans during this period were to thecorporate sector with consumer and home loans lagging significantly
China Banking Sector Percent GDP
YEARTotal
LoansCorporate
LoansConsumer
LoansHomeLoans Deposits
ExcessDeposits
GovBonds
CorpBonds
1995 895 00 00 00 919 25 56 111996 929 00 00 00 1009 79 64 091997 988 986 02 02 1103 115 74 071998 1085 1078 07 05 1216 131 99 091999 1165 1145 20 17 1320 155 128 092000 1217 1169 47 37 1508 292 146 102001 1240 1167 73 58 1613 372 163 112002 1334 1232 102 79 1750 4162003 1455 1320 135 114 1888 4342004 1422 1234 146 116 1854 432
Sources China Banking Regulatory Commission Peoplersquos Bank of China and GoldmanSachs research estimates
Compilation of financial data from a select number of banks in China suggeststhat the pattern of bank change encountered in Brazil and India also describes theexperience of China The liberalization of the Chinese economy and the modernization
of state banks appear to describe the process of bank change instead of a process oftransition toward private banking and capital market centered financial systemAlthough we have been unable to draw data from Chinese monetary authorities thebalance sheet data suggests the clear predominance of large state banks in the politicaleconomy of banking and finance in China How these institutions were used to counterthe effects of financial crisis abroad and redirect domestic investment production andconsumption must remain a subject for further research
8132019 Government Banking and BRICs in the Recent Financial Crisis
httpslidepdfcomreaderfullgovernment-banking-and-brics-in-the-recent-financial-crisis 4757
983106983122983113983107 983111983151983158983141983154983150983149983141983150983156 983106983137983150983147983155 983137983150983140 983110983145983150983137983150983139983145983137983148 983123983156983137983156983141983139983154983137983142983156
47
Select Financial Data from Chinese Banks 2004()
CNY (billion)Total
AssetsGrossLoans
CustomerDeposits Equity
NPLRatio
()
Pre-prov
ProfitsNet
Profits
State Banks
ICBC 5671 3705 5105 163 190 653 23CCB 3905 2226 3489 195 39 605 484ABC (NA) mdashBOC 427 2146 3342 205 51 578 209Quasi-State
BoCom 1145 639 1023 54 30 131 16CMB 587 376 513 22 29 82 32CITIC Industrial 515 306 429 20 60 52 03SPDB 456 311 397 14 24 62 20China Everbright mdashGuangdong Development 345 216 301 mdash mdash mdash 32
Industrial Bank 341 203 283 10 25 37 11Quase-Private
Bank of Shanghai 216 106 179 83 51 32 26Hua Xia 304 181 270 92 40 29 10Shenzhen Development 198 126 166 43 114 28 03Bank of Beijing 209 85 174 71 mdash 26 07
Sector total 19422 25319 129Three state-banks 2692 3979 188Second tier banks 2549 3733 148
ABC = Agriculture Bank of China BOC = Bank of China
BOCOM = Bank of Communications CCB = China Construction BankCMB = China Merchantrsquos Bank CNY = yuanICBC = Industrial and Commercial Bank of ChinaNPL = nonperforming loanROA = return on assets ROE = return on equityprov = provisioningPRC = Peoplersquos Republic of ChinaSPDB = Shanghai Pudong Development BankNote Loan and deposit market share for BOC and ICBC are for their domestic operations onlySources Company data Goldman Sachs research estimates
Returns on Assets Equity and Domestic Market Shares of Major China Banks 2004()
CNY (billion) ROA () ROE ()Deposit Mkt
Share ()Loan MktShare ()
Mortgage MktShare()
State Banks
ICBC 004 14 199 187 253CCB 130 254 138 115 217ABC (NA)BOC 051 102 101 89 152Quasi-State
BoCom 015 45 37 29 34CMB 060 161 20 19 29
CITIC Industrial 007 17 17 16 18SPDB 048 153 16 16 26
8132019 Government Banking and BRICs in the Recent Financial Crisis
httpslidepdfcomreaderfullgovernment-banking-and-brics-in-the-recent-financial-crisis 4857
983106983122983113983107 983111983151983158983141983154983150983149983141983150983156 983106983137983150983147983155 983137983150983140 983110983145983150983137983150983139983145983137983148 983123983156983137983156983141983139983154983137983142983156
48
China EverbrightGuangdong Development mdash mdash 12 11 mdashIndustrial Bank 037 126 11 10 10Quase-Private
Bank of Shanghai 129 360 07 05 14Hua Xia 038 116 11 09 07Shenzhen Development 017 75 07 06 08Bank of Beijing 037 108 07 04 07
Sector totalThree state-banks 438 391 622Second tier banks 144 127 154
ABC = Agriculture Bank of China BOC = Bank of China BOCOM = Bank of Communications CCB =China Construction Bank CMB = China Merchantrsquos Bank CNY = yuanICBC = Industrial and Commercial Bank of China mkt = market NPL = nonperforming loan ROA =return on asset ROE = return on equity prov = provisioning PRC =Peoplersquos Republic of China SPDB = Shanghai Pudong Development BankNote Loan and deposit market share for BOC and ICBC are for their domestic operations onlySources Company data Goldman Sachs research estimates
Further data from 2006-10 from the Peoples Bank of China suggests that the big5 state banks continue to outperform the next 12 largest joint stock commercial banksThe big five have launched sales of shares to capitalize while listing on capital marketsand adopting reporting of financial data along lines of international standards Thisappears to be similar to Banco do Brasil policies that retain majority of shares in federalgovernment control while capitalizing the bank through issues of stock
Comparing the Performance of Big 5 State Banks and Next 12 Joint Stock CommercialBanks in China
2006 2007 2008 2009 2010
Profit Margin Big 5 State Banks 3116 3143 2586 3026 3269
Next 12 JS Commercial Banks 2050 2791 1796 2159 2365
Returns Big 5 State Banks 507 606 860 691 675(risk adj) Next 12 JS Commercial Banks 459 570 1016 714 723
Op Risk Big 5 State Banks 5548 5539 5215 5319 5322Next 12 JS Commercial Banks 5886 5721 5725 5831 5947
Leverage Big 5 State Banks 1626 1482 1724 173 1734Next 12 JS Commercial Banks 2826 2251 2064 2048 1936
ROE Big 5 State Banks 1424 1557 1999 1925 2037Next 12 JS Commercial Banks 1564 2049 2156 1840 1967
Big 4 and 11 JSCBsSource Peoples Bank of China China Financial Stability Reports 2007-11
Performance indicators reported by the Peoples Bank of China for the big 5 statebanks and 12 next largest joint stock commercial banks also suggest that the largestgovernment banks in China retain significant competitive advantages ndash and may providepolicy alternatives Given the current shift of economic policy in China away fromindustry and export led growth to more sustainable domestic oriented growth and socialinclusion the role of state banks clearly comes to the fore
8132019 Government Banking and BRICs in the Recent Financial Crisis
httpslidepdfcomreaderfullgovernment-banking-and-brics-in-the-recent-financial-crisis 4957
983106983122983113983107 983111983151983158983141983154983150983149983141983150983156 983106983137983150983147983155 983137983150983140 983110983145983150983137983150983139983145983137983148 983123983156983137983156983141983139983154983137983142983156
49
Net Operating Income of Big 5 State Banks and Next 12 CommercialBanks 100 million RMB YuanBig 5 State Banks 2006 2007 2008 2009 2010
Balance Net interest income 349703 500456 556790 532206 720152Net fee amp commission inc 48524 103817 138464 175469 232491
Investment income 216089 283725 338865 324037 340440
Other business income (1807) (17054) 47548 33791 2186
Net operating income 612509 870944 1081667 1065503 1314943
Percent Net interest income 5709 5746 5148 4995 5477
Net fee amp commission inc 792 1192 1280 1646 1768
Investment income 3528 3258 3133 3041 2589
Other business income (030) (196) 440 318 166
Net operating income 10000 10000 10000 100 100
Next 12 Joint Stock CommercialBanks 2006 2007 2008 2009 2010
Net interest income 87253 132945 198965 191276 281588
Net fee amp commission inc 7850 16247 27319 30115 42023
Investment income 20959 32172 44864 50767 50500
Other business income 2306 4498 16359 10384 7400
Net operating income 118468 185861 287507 282542 381511
Percent Net interest income 7365 7153 6920 6769 7381
Net fee amp commission inc 671 874 950 1066 1101
Investment income 1769 1731 1560 1797 1324
Other business income 195 242 569 368 194Net operating income 10000 10000 10000 10000 10000
Source Peoples Bank of China China Financial Stability Reports 2007-11
Big 4 and 11 JSCBsBig 5 = ICBC ABC BOC CCB BOCOMNext 12 Joint Stock Commercial Banks = China CITIC Bank Everbright Bank Huaxia BankGuangdong Development Bank Shenzhen Development Bank China Merchants Bank Shanghai PudongDevelopment Bank Industrial Bank China Minsheng Banking Corporation Evergrowing Bank ChinaZheshang Bank Bohai Bank
In conclusion bank change in China also appears to confirm our findings from
Brazil ndash that state banks have realized competitive advantages and increased marketshares since liberalization while providing counter cyclical credit to ameliorateadjustment to crisis The modernization of the China Postal Savings Bank is ofparticular interest given its social mission downmarket focus and 40000 branchOffices throughout the country Expansion of card payment services through the postalbank system confirms the importance of the Brazilian federal savings bank (CaixaEconocircmica Federal Caixa) as agent for federal government social policy and agentresponsible for management of citizenship cards (12 million) and payment of familygrants This back to the future modernization of savings banks has proved essential forovercoming notorious levels of social exclusion and inequality in Brazil Althoughenglish language materials are unavailable on the China Postal Savings Bank thisinstitution clearly presents profound opportunities for comparable policies in China
8132019 Government Banking and BRICs in the Recent Financial Crisis
httpslidepdfcomreaderfullgovernment-banking-and-brics-in-the-recent-financial-crisis 5057
983106983122983113983107 983111983151983158983141983154983150983149983141983150983156 983106983137983150983147983155 983137983150983140 983110983145983150983137983150983139983145983137983148 983123983156983137983156983141983139983154983137983142983156
50
Reported offer of microfinance services for poverty reduction as part of nationaleconomic stimulous plan may point to developments in this direction
Given that state planning capacity has long been at the center of attention intheories of financial statecraft the role of Chinese state banks in redirecting policiesaccording to the 12th 5 Year plan for 2011-15 seems critical From 2000-5 the 10th 5
Year plan emphasized infrastructure and the attraction of investment and labor skillsThe 11th 5 Year plan (2006-10) raised concerns about sustainability rather than growthlevels while also seeking to spread improvements to balance development better servepeople and improve the quality of life continue to support Center and West provincesand revitalize Northeast provinces In comparison the 12th 5 Year plan calls for morebalanced lsquoinclusiversquo growth and structural adjustemts more than 4 trillion RMB($US600 billion) for targeted industries and interior regions a focus on new energynew materials and information and high technologies biology and new medicineenergy converstaion and environmental protection aerospace marine and advancedmanufacturing This implies fundamental shifts away from industry to services that hasbeen reported in macroeconomic data for 2010 If past studies emphasized directed
credit and industrial change the role of Chinese state banks in realizing transformationscertainly warrants study
Although the domestic flow of funds process of liberalization (or the lackthereof) and insertion of banking into Chinese political economy is beyond the scope ofthis paper our findings from Brazil appear to provide valuable hypotheses about ChinaThat is to say the big state banks and other government banks in China remaincommanding heights not in the Marxist sense of providing means to reach socialismbut immense institutions with profound presence throughout politics and markets in thecountry In this sense our findings from Brazil appear to approximate patterns ofchange in China more than Washington Consensus expectations about liberalization andprivatizations to free private and foreign banks Financial statecraft draws attention tothe capitalization of Chinese state banks through stock Sales and listings on capitalmarkets However like the Banco do Brasil (that reformers in the 1990s sought to shiftcontrol to the private sector only to increase federal government shareholding) theChinese experience surely involves unexpected consequences and patterns of changedifferent than a linear transition to the Berle amp Means paradigm of corporategovernance
Russia The New State Duopoly
ldquoThe rush of 2003-8 increased the market share of foreign banks to 285 from
52 However the state-owned banks received enormous help from the federal budget in the days of the crisis thereby strengthening their dominant
position on the Russian financial market says Sergey Aleksashenko the formerDeputy chairman of Russias Central Bank quotes Russia Profile Today one
must not harbor any illusion of a fair competition with them all the main cash
flows in Russia are controlled by state-owned banks httpwwwbarentsnovacomnode1031
Description of banking policy in Russia during the global financial crisis can beobtained from Bank of Russia annual reports and related publications The figure on the
following page summarizes the financial flows to and from the Bank of RussiaAlthough central bank policy is beyond the scope of this study the role of state banks in
8132019 Government Banking and BRICs in the Recent Financial Crisis
httpslidepdfcomreaderfullgovernment-banking-and-brics-in-the-recent-financial-crisis 5157
983106983122983113983107 983111983151983158983141983154983150983149983141983150983156 983106983137983150983147983155 983137983150983140 983110983145983150983137983150983139983145983137983148 983123983156983137983156983141983139983154983137983142983156
51
channeling counter-cyclical credits released by the Bank of Russia appear to confirm thecore argument that emerges from our studies of the Brazilian banking system Furtherdata on the following pages also suggest that state banks in Russia performed wellduring 2008-10 confirming on the basis of sparse data taken from Bank of Russiareports and documents that public banks have modernized provided counter-cyclical
credit to reverse credit crunch and economic downturn while realizing competitiveadvantages over private and foreign banks
8132019 Government Banking and BRICs in the Recent Financial Crisis
httpslidepdfcomreaderfullgovernment-banking-and-brics-in-the-recent-financial-crisis 5257
983106983122983113983107 983111983151983158983141983154983150983149983141983150983156 983106983137983150983147983155 983137983150983140 983110983145983150983137983150983139983145983137983148 983123983156983137983156983141983139983154983137983142983156
52
The following aggregate figures reported by the Bank of Russia suggest severaltrends of significance First Chart 32 suggests that household deposits shifted fromRuble deposits to foreign currency pegged (or indexed) during 2008 Second Chart 33illustrates the substantial increase of non-bank overdue debt during second semester
2008
Consequently the financial results and profitability of banks declinedsignificantly during 2008 The greater confidence in deposits with government banksfound abroad suggests that this may have been critical in Russia
Performance data deom 2008-10 provides a clearer picture one that is consistentwith our findings in Brazil State banks appear to have outperformed all other types of
banks except medium and small regional banks The following table reports the averagereturns on assets and returns on equity reported by the Bank of Russia 2008-10
Returns on Assets and Equity by Type of Bank in Russia 2008-9
Return on assets Return on equity 2008 2009 2010 2008 2009 2010
-------------------------------------------------------------------------------------------------------------------State Banks 22 08 24 157 46 148Foreign Banks 18 11 21 146 83 145Large private banks 13 03 11 106 28 84Medium-Small Banks Moscow 15 12 14 68 52 67
Medium-Small Regional Banks 21 12 15 131 65 98--------------------------------------------------------------------------------------------------------------------Source Bank of Russia Bank Supervision Reports 2009 and 2010
8132019 Government Banking and BRICs in the Recent Financial Crisis
httpslidepdfcomreaderfullgovernment-banking-and-brics-in-the-recent-financial-crisis 5357
983106983122983113983107 983111983151983158983141983154983150983149983141983150983156 983106983137983150983147983155 983137983150983140 983110983145983150983137983150983139983145983137983148 983123983156983137983156983141983139983154983137983142983156
53
Further data from the Bank of Russia on the capital adequacy of Banks during2009-10 suggest that foreign banks and large private banks remain less capitalizedagainst risks according to Basel II guidelines albeit at levels almost double thatrecommended by the Bank for International Settlements (80 risk weighted) Although
further analysis is needed this data is consistent from that reported in Brazil thatgovernment banks tend to more cautious and more prudent in terms of placing asidehigher levels of reserves and patrimony against possible losses
Capital Adequacy of Banks by Type of Bank in Russia 2009-10
2009 2010 2011---------------------------------------------------------------------------------------------------------State Banks 184 227 186Foreign Banks 155 196 195Large Private Banks 140 181 155
Medium-Small Banks Moscow 316 312 268Medium-Small Regional Banks 219 241 207Non-Bank Credit Institutions 372 1038 678---------------------------------------------------------------------------------------------------------Source Bank of Russia Bank Supervision Report (Moscow) 2009 p 43
Finally Bank of Russia bank supervision reports also suggest that state banksexpanded their market shares of assets and capital during the years following the globalfinancial crisis While large private banks and foreign banks lost market share of bankassets and bank capital in Russia state banks increased their significant market sharefrom 405 ndash 426 percent and 471-476 percent of assets and capital respectivelyUnfortunately data from previous years and for specific banking groups was notobtained However this data does appear to indicate that our findings of competitiveadvantages and policy alternatives
Number and Market Share by Type of Bank
N Banks Assets Capital---------------------------- ---------------------------- ----------------------------
Type of Bank 2009 2010 2011 2009 2010 2011 2009 2010 2011-------------------------------------------------------------------------------------------------------------------------------State 17 22 27 405 439 458 471 489 473
Foreign 101 106 108 187 183 180 172 169 191Large Private 136 139 131 346 333 305 276 287 269Med-Small Moscow 361 335 317 27 26 26 43 34 35Medi-Small Regional 443 412 372 28 28 27 36 31 29Other Credit Institutions 50 51 57 07 04 04 01 02 03Total 1108 1058 100 100 100 100 100 100-------------------------------------------------------------------------------------------------------------------------------Source Bank of Russia Bank Supervision Report 2009 amp 2010
In sum politics and financial statecraft have led to the realization of significantcompetitive advantage by Russian state banks Sperbank and Vneshtorgbank increasedtheir share of bank assets from 32 percent in 2005 to over 50 percent by 2011 through
mergers and acquisitions and aggressive displacement of foreign banks Whatever thepolitics data from the Bank of Russia suggests that monetary authorities released a
8132019 Government Banking and BRICs in the Recent Financial Crisis
httpslidepdfcomreaderfullgovernment-banking-and-brics-in-the-recent-financial-crisis 5457
983106983122983113983107 983111983151983158983141983154983150983149983141983150983156 983106983137983150983147983155 983137983150983140 983110983145983150983137983150983139983145983137983148 983123983156983137983156983141983139983154983137983142983156
54
series of counter cyclical credit injections during 2008-9 to domestic bankinginstitutions Moreover data suggests that state banks continue to perform at or ahead oflevels reported by regional private and foreign banks The large market share andimproved performance of state banks reported in recent data suggests although the datais sparse that government banks in Russia have also modernized realized competitive
advantages and provided policy alternatives against the impact of financial crisisabroadWe were unable to find evidence of policy making toward social inclusion at the
Bank of Russia or Russian state banks despite the historical trajectory of the Sberbankas a savings bank under communism The context also appears to differ considerably Asurvey of the Zircon Research Group reportedly found that only 15 percent of Russiansretain bank accounts because of mistrust in banks and government This combination ofrealist politics and the realization of competitive advantages by Russian state bankssuggests that theories of economic statecraft in the realist tradition may indeed explainthe domestic developments under study
Conclusion
This paper reports evidence about government bank modernization and financialstatecraft in BRIC countries designed to counter the effects of crisis and shape domesticgrowth Government banks in BRIC countries have contributed to the widely notedadjustment of these economies to global financial crisis and economic downturnContrary to the Washington Consensus that prevailed during much of the 1980s and1990s (that privatization and liberalization especially of banking would free marketforces and deepen domestic financial systems) a quite different process of bank changeappears to have ensued after financial liberalization in the BRICs
Instead of replacement of state banks with private banks government banksremain central agents of domestic credit and growth and have modernized ldquojust intimerdquo The capitalization and realization of competitive advantages by large governmentbanks during the 2000s meant that once the US financial panic spread across capitalmarkets broke highly leveraged private and produced runs on private bank depositspolicy makers in BRIC countries nonetheless retained counter cyclical policyalternatives through their more solid large state banks
These findings counter traditional foci on the private sector individualentrepreneurship and ideals of free markets linked to the political and social advancesrecorded around the world in the last decades We report an anomaly for theories offinancial repression and the Washington Consensus about the virtues of privatization
and liberalization Although largely blamed for reproducing underdevelopment in thepast BRIC government banks averted excesses of private banking that drove creditbubbles such as home mortgages and derivatives in the US And since liberalization ofbanking (we have not adequately discussed how much liberalization occurred in eachcountry) government banks have modernized to compete with private and foreignbanks Government banks have realized competitive advantages and provided policyalternatives These two arguments help explain why BRIC countries have farecomparatively well in the face of financial crisis in core countries
Financial statecraft is therefore at the center of BRIC counter cyclical capacitiesand state planning Brazil Russia India and China fared significantly better thanadvanced and many developing countries in terms of adjusting to credit crunches and
export shocks This is because government banks proved critical interbank credit toretain confidence in domestic banking systems These institutions also presented other
8132019 Government Banking and BRICs in the Recent Financial Crisis
httpslidepdfcomreaderfullgovernment-banking-and-brics-in-the-recent-financial-crisis 5557
983106983122983113983107 983111983151983158983141983154983150983149983141983150983156 983106983137983150983147983155 983137983150983140 983110983145983150983137983150983139983145983137983148 983123983156983137983156983141983139983154983137983142983156
55
policy alternatives for political and social forces Politics shaped adjustment andrecovery through state banks differently in BRIC countries Given the realities of statecentered political realism in Russia the redirection of state banks toward goals ofChinese Five Year Plans and the modernization of the State Bank of India amidst anamorphous federalism the experience of Brazil with democratization and public bank
modernization may stand out (Armijo 2009)Further analysis of savings banks and cooperative banks also will be requiredAs members of the World Savings Bank Institute (a global association of savingsbanks) the Caixa in Brazil SNI and NABARD in India and China Postal Savings Bankappear to have provided access to very large numbers of previously unbanked citizensThis returns to traditional ideas of social banking and the history of savings banks thatwere founded throughout Europe since the late 18 th century The upmarket strategy andexpansion into investment banking and international banking of the Russian Sberbankconstrasts with downmarket strategies of savings banks in Brazil India and China
The financial press has recently reported doubts about bad loans in Chinese statebanks and cast doubt on the financial results posted and reported in this paper
However current estimates of 2-5 percent bad loans in Chinese state banks pale incomparison to the US$1240 billion in bad loans shifted to asset managementcompanies in the mid 2000s before capitalization of these institutions through sale ofshares Critics of state banking in Brazil also point to past levels of bad loans (reaching30-40 percent) because of their capture during military government delayed transitionBut the cost of capitalization and transfer of bad loans from Brazilian state banks alsoremained below US$400 billion and is still contingent on liquidation of assetmanagement companies created in 2001 In any case these numbers are very smallcompared to GAO estimates of US$120 trillion in emergency infusions by USmonetary authorities to banks and financial institutions from 2007-11
These are anomalies for recent market-based banking theory and neo-liberalpolicy designs However they do not run counter to orthodoxy in economics andbanking theory Over the last decades economic reforms (fiscal financial monetaryand banking) have improved transparency and brought public policy and marketexpectations closer However expectations about deregulation and free marketequilibria in banking and finance have succumbed in the face of panic and the stillsobering consequences of crisis The materials presented herein are descriptive and willrequire more careful analysis However given the urgency of searching for alternativedevelopment models and different approaches to financial statecraft in BRIC countriesand beyond we have taken the liberty to present research in initial stages and toprovoke thought along the lines suggested by our kind conveners
8132019 Government Banking and BRICs in the Recent Financial Crisis
httpslidepdfcomreaderfullgovernment-banking-and-brics-in-the-recent-financial-crisis 5657
983106983122983113983107 983111983151983158983141983154983150983149983141983150983156 983106983137983150983147983155 983137983150983140 983110983145983150983137983150983139983145983137983148 983123983156983137983156983141983139983154983137983142983156
56
Appendix on Alternative Banking and Social Inclusion
This appendix describes how ideas about government banking led to further work onalternative banking and social inclusion with help from the Rockefeller FoundationBellagio Center In July 2011 we were able to convene a conference designed to gather
scholars alternative banking executives and representatives from savings andcooperative bank associations to rethink strategies for social inclusion in the globalsouth and attempt to launch a new policy agenda Given the search for alternativestrategies to counter crisis and the advances of stabilization transparency and bankingsupervision in developing and emerging economies we call for alternative bankingcommunities in the global north and south to work together and help shape a new policyagenda for social inclusion Because savings banks credit cooperatives and otheralternative banking and finance institutions have realized competitive advantages andemerged from crisis we can now think beyond We believe that new policies may helpdeveloping and emerging nations redirect large domestic institutions such as postal andsavings banks toward meeting the UN millennium goals to eliminate poverty by 2015
Plans include writing a green paper on Core Principles for Alternative Bankingand Social Inclusion convening events to promote these principles through institutionalsupporters and networks and seeking adoption of these principles at policy venues suchas the World Savings Bank Institute the International Association of CooperativeBanks the Bank for International Settlements the International Financial ReportingStandards foundation the ISO International Standards Organization the Charter forResponsible Business regional development banks and the World Bank We also planto submit an edited volume of scholarly contributions on alternative banking and socialinclusion by year-end 2012 Interested parties are welcome to participate
Institutional supporters and networks include
Institutional SupportersColumbia University School of International and Public Affairs New YorkInstitute for Money Technology and Financial Inclusion University of CaliforniaIrvineKingacutes College Department of Management LondonSatildeo Paulo Business School Getulio Vargas FoundationSecond University of Naples
Networks
Association of Emerging Market Business Schools Satildeo Paulo BrazilCommunity of European Management Schools BrusselsCritical Political Economy NetworkEuropean Association of Co-operative Banks BrusselsGlobal Public Policy Network LondonInternational Cooperative Banking Association BrusselsSocial Science Finance Network AmsterdamSociety for Advancement of Social Economics PhiladelphiaWorld Savings Bank Institute Brussels
8132019 Government Banking and BRICs in the Recent Financial Crisis
httpslidepdfcomreaderfullgovernment-banking-and-brics-in-the-recent-financial-crisis 5757
983106983122983113983107 983111983151983158983141983154983150983149983141983150983156 983106983137983150983147983155 983137983150983140 983110983145983150983137983150983139983145983137983148 983123983156983137983156983141983139983154983137983142983156
Core Principles for Alternative Banking and Social Inclusion
Commitment to End Capital StarvationPromote access to and use of banking and financial services by all through newtechnologies and distribution channels to capitalize assets among the poor
Commitment to Universalize Income Savings Credit and FinanceProvide basic income via ATM cards and mobile banking to reach the poor and opennew channels of access to income savings credit finance insurance and opportunities
Prudent Banking and Regulatory ComplianceAlternative banking seeks to work within regulations guidelines and best practicesrecommended by domestic monetary authorities and international regulatory institutionssuch as the Bank for International Settlement Basel II Capital Risk Guidelines
Corporate Social Responsibility Leadership
Integrate corporate social responsibility into down-market business strategies andinstitutions of representation and democratization
Transparency and AccountabilityPublish annual reports and balance sheets in accord with international best practices offinancial social and sustainability reporting
Leadership in Provision of New Banking Services and Products to the PoorUse competitive advantages in banking and institutional networks to channel moreeffectively capital income and finance to the poor
Generate Sustainable Income and Household Asset AccumulationUse branch offices and new banking technologies to accelerate progress toward UNmillennium goals to eliminate poverty
Universalize Financial EducationPromote financial education to encourage responsible banking and finance and avertpredatory lending and unethical practices
Adopt Cutting Edge Technology and Management Practices to Provide
Competitive Alternative to Private Commercial and Investment Banks
Incorporate electronic card and mobile banking services to better serve the poorContribute to Realization of Bellagio Principles for SustainabilityPromote alternative banking and business practices that contribute to environmentallysustainable income consumption and production as stated in Bellagio Principles forSustainability
Respect and Build on National and Regional DifferencesI d f i l d l l i b ki i i i d i i l
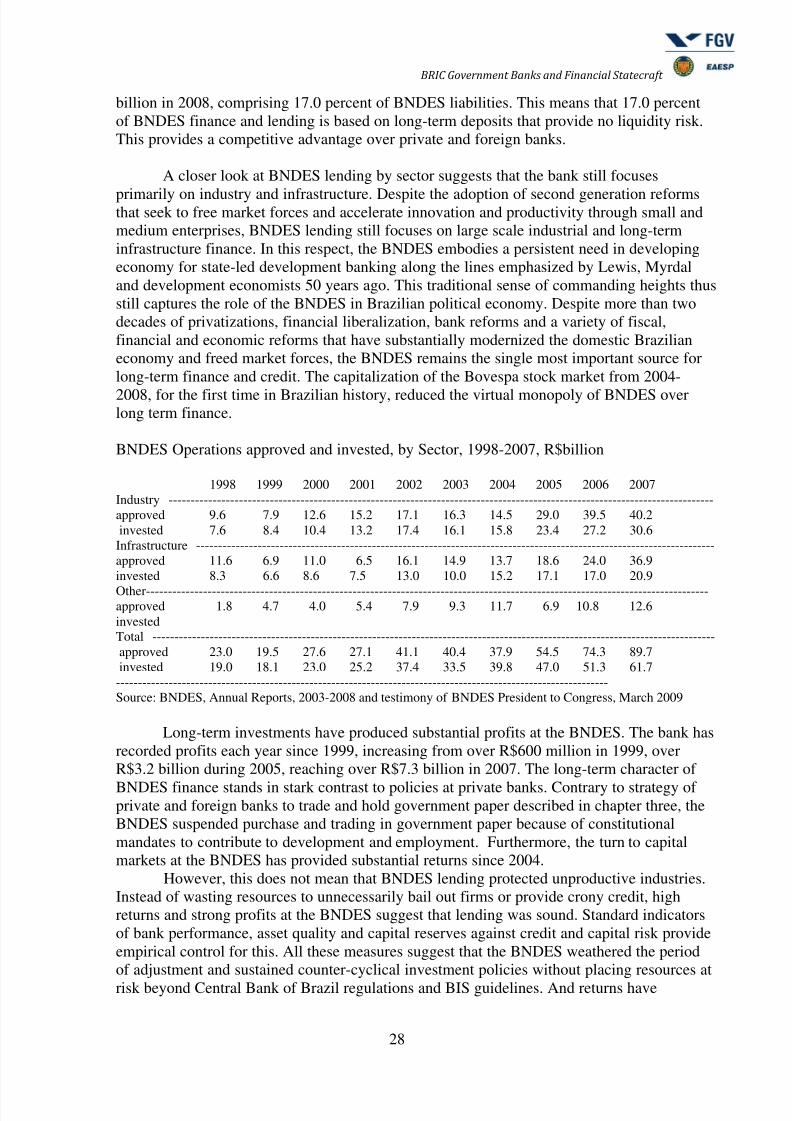
8132019 Government Banking and BRICs in the Recent Financial Crisis
httpslidepdfcomreaderfullgovernment-banking-and-brics-in-the-recent-financial-crisis 2857
983106983122983113983107 983111983151983158983141983154983150983149983141983150983156 983106983137983150983147983155 983137983150983140 983110983145983150983137983150983139983145983137983148 983123983156983137983156983141983139983154983137983142983156
28
billion in 2008 comprising 170 percent of BNDES liabilities This means that 170 percentof BNDES finance and lending is based on long-term deposits that provide no liquidity riskThis provides a competitive advantage over private and foreign banks
A closer look at BNDES lending by sector suggests that the bank still focuses
primarily on industry and infrastructure Despite the adoption of second generation reformsthat seek to free market forces and accelerate innovation and productivity through small andmedium enterprises BNDES lending still focuses on large scale industrial and long-terminfrastructure finance In this respect the BNDES embodies a persistent need in developingeconomy for state-led development banking along the lines emphasized by Lewis Myrdaland development economists 50 years ago This traditional sense of commanding heights thusstill captures the role of the BNDES in Brazilian political economy Despite more than twodecades of privatizations financial liberalization bank reforms and a variety of fiscalfinancial and economic reforms that have substantially modernized the domestic Brazilianeconomy and freed market forces the BNDES remains the single most important source forlong-term finance and credit The capitalization of the Bovespa stock market from 2004-
2008 for the first time in Brazilian history reduced the virtual monopoly of BNDES overlong term finance
BNDES Operations approved and invested by Sector 1998-2007 R$billion
1998 1999 2000 2001 2002 2003 2004 2005 2006 2007Industry ----------------------------------------------------------------------------------------------------------------------------approved 96 79 126 152 171 163 145 290 395 402invested 76 84 104 132 174 161 158 234 272 306
Infrastructure ----------------------------------------------------------------------------------------------------------------------approved 116 69 110 65 161 149 137 186 240 369invested 83 66 86 75 130 100 152 171 170 209
Other--------------------------------------------------------------------------------------------------------------------------------approved 18 47 40 54 79 93 117 69 108 126investedTotal --------------------------------------------------------------------------------------------------------------------------------approved 230 195 276 271 411 404 379 545 743 897invested 190 181 230 252 374 335 398 470 513 617
----------------------------------------------------------------------------------------------------------------Source BNDES Annual Reports 2003-2008 and testimony of BNDES President to Congress March 2009
Long-term investments have produced substantial profits at the BNDES The bank hasrecorded profits each year since 1999 increasing from over R$600 million in 1999 overR$32 billion during 2005 reaching over R$73 billion in 2007 The long-term character of
BNDES finance stands in stark contrast to policies at private banks Contrary to strategy ofprivate and foreign banks to trade and hold government paper described in chapter three theBNDES suspended purchase and trading in government paper because of constitutionalmandates to contribute to development and employment Furthermore the turn to capitalmarkets at the BNDES has provided substantial returns since 2004
However this does not mean that BNDES lending protected unproductive industriesInstead of wasting resources to unnecessarily bail out firms or provide crony credit highreturns and strong profits at the BNDES suggest that lending was sound Standard indicatorsof bank performance asset quality and capital reserves against credit and capital risk provideempirical control for this All these measures suggest that the BNDES weathered the periodof adjustment and sustained counter-cyclical investment policies without placing resources atrisk beyond Central Bank of Brazil regulations and BIS guidelines And returns have
8132019 Government Banking and BRICs in the Recent Financial Crisis
httpslidepdfcomreaderfullgovernment-banking-and-brics-in-the-recent-financial-crisis 2957
983106983122983113983107 983111983151983158983141983154983150983149983141983150983156 983106983137983150983147983155 983137983150983140 983110983145983150983137983150983139983145983137983148 983123983156983137983156983141983139983154983137983142983156
29
increased since recovery in 2004 BNDES participation in the booming Bovespa stock marketsince 2003 has provided record returns
The BNDESpar subsidiary that invests in capital markets has also recorded strongreturns during the period of economic growth and into the 2008 financial crisis BNDESparreturns on liquid assets increased from 75 percent in 2004 to 277 percent in 2007 declining
to 245 percent in 2008 Average returns on assets and stock holdings also remained highbuilding the assets held by the BNDESpar subsidiary from 141 billion in 2005 to 359 billionin 2008
This increased participation of the BNDES in capital markets involves new relationsand networks across government private sector labor unions the private pension funds ofgovernment bank and government enterprise employees and financial markets By 2007BNDES participation in stockholding and mutual funds reached across 261 forms and 25mutual funds totaling over R$910 billion reals The BNDES thereby retains broad portfoliothat represents institutional foundations of comparative advantage Furthermore unlike thepolicy of private and foreign banks to trade and hold high interest rate paying short termgovernment paper during the sudden stop of foreign finance and downturn in the Brazilian
business cycle (2002-3) the BNDES expanded credit operations and reduced financialoperations in secondary markets for indexed government paper This countered the perverseimpact of the liquidity preference among private and other government banks that increasedmarket pressures and led to shorter terms and higher cost of Brazilian government debt
BNDES aversion of government paper is required by constitutional mandate tomanage forced savings funds in ways that generate employment and income As noted alarge part of BNDES resources (liabilities) are from domestic official savings programs Thevalue of FAT resources increased from R$492 billion in 2003 to R$662 billion in 2005while the PIS-Pasep fund remained at approximately R$200 billion Foreign capital has alsobeen channeled to the BNDES through multilateral agencies and foreign bond issues Foreignloans to the BNDES have declined Multilateral agencies provided R$70 billion in 2003increased funding to R$129 billion during 2004 and continued to provide R$107 billion tothe BNDES during 2005
Comparison of BNDES structure and performance with development banks abroadsuggests both the large scale and scope of BNDES operations and controls formismanagement and political abuse of the bank In 2007 BNDES total assets are almostdouble the value reported by the Inter-American Development Bank (IADB) over frac12 thevalue of total assets held by the World Bank and almost ten times the value of assets held bythe French government development bank CAF Furthermore profits and loans from theBNDES far exceeded all three institutions The US$330 billion in loans reported by theBNDES far exceed the US$67 billion from the IADB the US$110 reported by the World
Bank and US$58 billion reported by the CAF BNDES profis returns on assets and return onliquid patrimony also far exceeded those reported by these three development banks thatserve as comparative control over performance and policies at the BNDES Finally lateloans at the BNDES remained at 011 percent of total loans well below levels reported by theWorld Bank comparable to the 010 percent reported by the IADB while considerably abovethe 001 percent reported by CAF
8132019 Government Banking and BRICs in the Recent Financial Crisis
httpslidepdfcomreaderfullgovernment-banking-and-brics-in-the-recent-financial-crisis 3057
983106983122983113983107 983111983151983158983141983154983150983149983141983150983156 983106983137983150983147983155 983137983150983140 983110983145983150983137983150983139983145983137983148 983123983156983137983156983141983139983154983137983142983156
30
Comparison of BNDES and Regional Development Banks 2007 US$ billion
BNDES IADB World Bank CAF----------------------------------------------------------------------------------------------------------------Total Assets 1144 699 2080 125
Liquid Patrimony 140 203 399 41Liquid Profits 38 01 -01 04Desembolsos 339 67 110 58Credit Portfolio 928 479 978 95Capitalization percent 123 291 192 328Return on Assets percent 38 47 na 36Return on PL percent 332 07 na 105Late Loans percent 011 010 086 001----------------------------------------------------------------------------------------------------------------Source BNDES Annual Report 2007
The large scale of BNDES lending and finance make it possible for governmentpolicy to provide counter cyclical credit to avert or ameliorate economic downturns andsubstitute private and foreign credit shortages In March 2009 testimony to Congress ongovernment policies during financial crisis BNDES President Coutinho argued that bankpolicy was to reduce the cost and increase the supply of credit Resources for counter cyclicallending during 2008-2009 came from Treasury loans to BNDES released by provisionaldecrees 439 and 414 summing R$175 billion transfer of R$60 billion in CVS funds sale ofFGTS Investment Fund and bank certificates summing R$170 billion Furthermore the thirdphase of conditional credit facility shared by Inter-American Development Bank and theBNDES provided the last tranch of a total US$60 billion for BNDES operations
Two further means were used by the BNDES to infuse capital during the collapse of
the stock market and shortage of credit during 2007-8 The counter cyclical policies of theBNDES can also be seen in the over two fold increase of BNDES holdings in private equityand investment funds Table 512 reports the value of private equity and investment fundholdings of the BNDES in 2007 and 2008 BNDES funds in private equity and mutual fundsincreased from R$4038 million in 2007 to over R$10 billion in 2008 The capitalization ofmutual funds and private equity firms by the BNDES also played an important countercyclical role during this period
BNDESpar Shareholding 2007-8 R$million
Percent Value ValueShares 2008 2007
----------------------------------------------------------------------------------------------------------------Ameacuterica Latina Logiacutestica 106 6386 -Aracruz 55 1292 1292Banco do Brasil 25 10854 12752Bom Gosto (2) 345 2458 -Brasil Telecom Part 30 1666 1958Braskem 52 2275 2432Brenco 209 1400 -CEG 345 1406 -CESP 57 2347 1397Coteminas 103 1150 1340
CPFL Energia 62 6081 5506Cia Sideruacutergica Nacional 36 1513 2686CVRD 40 15082 7098
8132019 Government Banking and BRICs in the Recent Financial Crisis
httpslidepdfcomreaderfullgovernment-banking-and-brics-in-the-recent-financial-crisis 3157
983106983122983113983107 983111983151983158983141983154983150983149983141983150983156 983106983137983150983147983155 983137983150983140 983110983145983150983137983150983139983145983137983148 983123983156983137983156983141983139983154983137983142983156
31
ELETROBRAacuteS (1) 118 22400 22400EMBRAER 50 1096 1096Gerdau 35 1533 490Independecircncia 139 2500 -JBS 130 14722 11370Klabin 202 5621 -
Light 336 8225 -Marfrig 146 8176 1020MPX Mineraccedilatildeo 26 1791 1791Ouro Fino 200 1057 840Paranapanema 175 1252 08Petrobraacutes 76 10226 10226Rede Energia SA 253 2633 -Tele Norte Leste Participaccedilotildees 16 1645 1645Valepar 97 26254 15585Subtotal 163055 102941Other firms 12223 12606Total 175278 115548----------------------------------------------------------------------------------------------------------------
Source BNDESpar Financial Statements 2008 pp
The BNDES also holds blocks of shares in many major Brazilian corporationsthrough its participation subsidiary BNDESpar Comparing value of investments in 2007 and2008 suggests that large purchases capitalized firms precisely as financial crisis and downturnin Bovespa stock market made it difficult for firms to find working capital Table X reportsthe percent of total company shares held by the BNDES and their respective market values(adjusted for risk of future losses) at year end 2007 and 2008 During this year of extremelyshort and expensive credit in Brazil caused by the international financial and banking crisisthe BNDES increased shareholding by over R$60 billion reals in 28 private Brazilianenterprises Further shareholding classified as X in Five firms (Bertin 269 Brasiliana 538
Copel 239 Rio Poliacutemeros 250 Telemar 313) Once again the BNDES provided access tocapital for firms caught in the sudden credit crunch and stock market collapse unable to meetobligations or raise funds through equity issues or commercial bank credit This countercyclical role of government banks has been critical in Brazil since the 19 th century
BNDESpar Private Equity and Fund Participation 2007-2008 R$million
Fund Manager 2008 2007-------------------------------------------------------------------------------------------------------------------------Brasil 21 Dynamo 46 60PROT Mellon Financial Services 4628 -
Logiacutestica Brasil Bradesco 135 -Fire BrasilPrivate 269 250FIPGG Governanccedila amp Gestatildeo Inv 289 311Opportunity Equity Partners Mellon Financial Services 1046 578Brasil Energia Bradesco 1184 655InfraBrasil ABN-Amro 677 251Rio Bravo Cinema Rio Bravo 116 110Brascan Petro amp Gaacutes Bank Brascan 136 113AG Angra Infra-Estrutura Bradesco 380 301Satildeo Paulo Metro Fund Bradesco 791 831Other Funds 653 572Total 10356 4038---------------------------------------------------------------------------------------------------------------------------
Source BNDESpar Financial Statements 2008
8132019 Government Banking and BRICs in the Recent Financial Crisis
httpslidepdfcomreaderfullgovernment-banking-and-brics-in-the-recent-financial-crisis 3257
983106983122983113983107 983111983151983158983141983154983150983149983141983150983156 983106983137983150983147983155 983137983150983140 983110983145983150983137983150983139983145983137983148 983123983156983137983156983141983139983154983137983142983156
32
Finally Brazilian federal government triennial plans include investment targets by theBNDES If current plans are compared to 2004-7 investments several structural changes inBNDES lending appear First BNDES plans for Oil and Petroleum production reveal aprofound change for Brazilian political economy In 1990 roughly 45 percent of oilconsumed in Brazil was imported In 2007 before oil price increased reversed the balance
Brazil reported domestic production levels sufficient to meet domestic consumptionFurthermore discoveries of substantial deep sea oil reserves have led the BNDES to planmassive investments involving Petrobras and other global petroleum firms For the 2009-2012 period investments in petroleum and gas (R$2697 billion) Petrochemicals (237) andEthanol (197) sum to over R$3130 billion
BNDES Triennial Investment Plans 2004-2012
2004-7 2007-10 2008-11 2009-12----------------------------------------------------------------------------------------------------------------Petroleum amp Gas 1472 1836 2028 2697
Mining 472 527 813 480Petrochemicals 64 174 264 237Steel 198 371 312 245Automotive 150 176 264 235Electronics 143 156 140 240Ethanol 166 205 205 197Paper amp Celulose 104 200 274 90Health 51 46 51 80Industry Total 2816 3802 4437 4501----------------------------------------------------------------------------------------------------------------Source BNDES Annual Reports 2002-2006
It is of note that President Dilma Roussef was instrumental in reducing the targets for2009-12 in petroleum and gas given indications that Petrobras and existing framework foroffshore oil prospecting and production proved unable to increase investments accordingly
The BNDES also retains a presence in government projects by providing managementassistance During 2008 BNDES staff provided management support for implementation of192 projects involving R$710 billion of total R$142 billion PT government growthacceleration projects BNDES staff also participated in the design management andimplementation of President Lularsquos Poliacutetica de Desenvolvimento Produtivo (Policy forProduction Development) involving R$2100 billion targeting production chains designed tomaximize employment and regional development benefits Finally the BNDES was alsocharged to create and co-manage a Fundo Amazonia with the Ministry of Environment toprovide incentives to reduce deforestation of the Amazon region BNDES Plans for 2009include completion of concession for construction of high speed train line and service for Riode Janeiro-Satildeo Paulo corridor two blocks of highway concession sales involving three majorhighways in each block of sales sale of management concessions for regional airports andthe reorganization of INFRAERO federal government airport management company
These policies reflect the goal of BNDES policy to launch firms on the stock marketrather than maintain direct credit and finance Exceptions during 2008 involve Auto andEthanol industies both for strategic and broader policy reasons Given the sharp downturn inauto sales during fourth quarter 2008 the BNDES provided significant lending to avert
further downsizing or failure of auto companies in Brazil Given the current globalredistribution of automobile production BNDES policies are designed to help the Brazilian
8132019 Government Banking and BRICs in the Recent Financial Crisis
httpslidepdfcomreaderfullgovernment-banking-and-brics-in-the-recent-financial-crisis 3357
983106983122983113983107 983111983151983158983141983154983150983149983141983150983156 983106983137983150983147983155 983137983150983140 983110983145983150983137983150983139983145983137983148 983123983156983137983156983141983139983154983137983142983156
33
operations of major auto firms through the period of adjustment and increase theattractiveness of domestic operations in global production strategies of multinational autocompanies Ethanol production also received massive funds to sustain an industry seen ascritical for alternative and sustainable fuel source capable of replacing petroleum Ethanolreached over 50 percent of automotive fuel sales in 2007
Under the Lula government (2003-10 the BNDES also resumed lending to state andmunicipal governments Since the renegotiation of municipal and state government debts inthe late 1990s states and municipalities have been largely prohibited from taking on debtThis was emplematic of the recentralization required to control fiscal excesses during militaryrule and the prolonged period of transition to democracy Policies during the 1990s weredesigned to avert overspending seen as critical to maintain price stability under the Real Plan(1994) In 2000 the Lei de Responsibilidade Fiscal (Fiscal Responsibility Law) largelyprohibited credit and finance to state and municipal governments Since 2000 municipalitiesand states have been required to submit detailed budget statements that in turn have been thebasis for a gradual return to sub-national government finance In August 2006 central bankand Treasury regulations freed municipalities to take on credit up to 12 times liquid receipts
Since then the BNDES has led in terms of credits and finance to subnational governmentsthrough a Programa Especial de Financiamento aos Estados e Distrito Federal
The BNDES also has developed the first system in Brazil for risk analysis ofmunicipal governments and has led in the market for municipal credit freed by August 2006procedures for approval at Treasury the Central Bank and Conselho Monetaacuterio Nacional(National Monetary Council) Prosecution of mayors and firms charged with managingmunicipal credits with the BNDES revealed fraudulent practices These funds for sub-national public finance also became critical mechanisms to counter severe budget shortfallscaused by financial crisis during 2008 Given that municipal and state government tax basesare shallow and that federal government transfers provide the bulk of sub-nationalgovernment resources the Lula administration allocated R$ 40 billion to the Fundo deParticipaccedilatildeo dos Estados (State Participation Fund) through a Programa Emergencial deFinanciamento (Emergency Finance Fund) administered by the BNDES
In sum the BNDES expanded credit and finance operations substantially during fouryears of sustained growth from 2004-2007 And having helped underwrite the stock marketboom and capitalized Brazilian firms directly and indirectly through credit finance mutualfunds and private equity funds the BNDES retained sufficient scale scope and capital baseto provide counter cyclical credit and finance to help firms adjust to financial crisis and creditshortage during 2008 In retrospect the growth of the BNDES since liberalization andprivatizations of state government banks in the 1990s suggest the comparative advantages of
development banking BNDES credit and finance fell to 52 percent of fixed capitalformation in 1995 Since then the turn to neo-developmentalism and a period of sustainedeconomic growth during the Lula administration increased the BNDES share of total fixedcapital formation during 2006 and 2007 to 126 and 141 percent Critics charge thatmonopoly over FGTS and PIS-PASEP official savings funds as liabilities provide theBNDES with unfair competitive advantage over private banks In 2008 forced savings fundssummed to only 17 percent of BNDES liabilities (resources) The BNDES does not relyexclusively on forced savings for competitive advantage Instead market-oriented policies
joint-ventures with private mutual funds investment funds private equity firms large blocksof shareholding in Brazilian firms and massive amounts of credit and investment to theprivate sector at below market but still profitable long term interest rates of 625 percent
suggest that the large scale and scope of BNDES operations provide institutional foundationsof competitive advantage over private and foreign banks
8132019 Government Banking and BRICs in the Recent Financial Crisis
httpslidepdfcomreaderfullgovernment-banking-and-brics-in-the-recent-financial-crisis 3457
983106983122983113983107 983111983151983158983141983154983150983149983141983150983156 983106983137983150983147983155 983137983150983140 983110983145983150983137983150983139983145983137983148 983123983156983137983156983141983139983154983137983142983156
34
Capitalization of the BNDES by Treasury of over R$2300 billion 2009-11hascaptured attention of many observers of Brazilian development Critics and advocates agreethat the BNDES has realized significant competitive advantages over private and foreignbanks and continues to serve as significant alternative to capital markets for large scaledevelopment projects However like the downturn in planned investments by Petrobras for
oil and gas exploration and production BNDES decreased planned investments fromR$1684 billion in 2010 to R$1397 billion in 2011 We believe this indicates the limits ofmanagement and passing of period of crisis both favoring finance from capital marketsbanks and public-private partnerships
India
Analysis of Brazilian federal banks suggests that these institutions provided policy alternativewhile realizing competitive advantage over private and foreign banks The modernization ofthese institutions helps explain why these large institutions were able to stay the effects ofcredit crunch and financial market downturn in Brazil This section explores data from the
Reserve Bank of India to compare market shares of types of banks from 1972-2008 and bankperformance from 2006-10 Further analysis will be required However the data appears tosupport our core argument that government banks have modernized and realized competitiveadvantages over private and foreign banks
First the number of branch offices which serves as a measure of institutionalcoverage across India of special concern for financial inclusion and the theory thatliberalization and privatizations would lead private banks to expand branch offices andincrease the supply of services From this perspective the trajectory of branch officessuggests that nationalized banks the State Bank of India and regional rural bankssustain much larger networks of branch offices that predominate while otherscheduled commercial (private and foreign) banks retain less than 8000 branch offices
Data from the Reserve Bank of India on the number of current accounts retainedby type of bank provide further evidence that the State Bank of India and its associates
8132019 Government Banking and BRICs in the Recent Financial Crisis
httpslidepdfcomreaderfullgovernment-banking-and-brics-in-the-recent-financial-crisis 3557
983106983122983113983107 983111983151983158983141983154983150983149983141983150983156 983106983137983150983147983155 983137983150983140 983110983145983150983137983150983139983145983137983148 983123983156983137983156983141983139983154983137983142983156
35
national banks and regional rural banks provide the bulk of banking accounts to theIndian population while private and foreign banks cherry pick upscale urban marketsreproducing capital drain and inequalities
Number of Current Accounts by Type of Bank 1972-1995
Since 1999 the pattern of predominance by alternative banking institutions and the minorrole of other scheduled commercial banks and foreign banks continues
The following figures report the value held in current accounts by type of banks first fromthe 1972-1995 period then from the 1999-2008 period For both time periods the trendconfirms that private and foreign banks remain at a competitive disadvantage in terms of thebroader market while the State Bank of India and its associates nationalized banks andregional rural banks tend to predominate
8132019 Government Banking and BRICs in the Recent Financial Crisis
httpslidepdfcomreaderfullgovernment-banking-and-brics-in-the-recent-financial-crisis 3657
983106983122983113983107 983111983151983158983141983154983150983149983141983150983156 983106983137983150983147983155 983137983150983140 983110983145983150983137983150983139983145983137983148 983123983156983137983156983141983139983154983137983142983156
36
Current Account Value by Type of Bank 1972-1995 R
Number of Deposit Accounts by type of bank 1999-2008
A similar pattern appears for the trajectory of savings accounts both the number of
accounts and the value held in savings accounts both for the 1972-1995 period We wereunable to organize data from the more recent period
8132019 Government Banking and BRICs in the Recent Financial Crisis
httpslidepdfcomreaderfullgovernment-banking-and-brics-in-the-recent-financial-crisis 3757
983106983122983113983107 983111983151983158983141983154983150983149983141983150983156 983106983137983150983147983155 983137983150983140 983110983145983150983137983150983139983145983137983148 983123983156983137983156983141983139983154983137983142983156
37
Number of Savings Accounts by Type of Bank 1972-1995
Value in Savings Accounts by Type of Bank 1972-1995
Number of Term Savings Accounts by Type of Bank 1972-1995
8132019 Government Banking and BRICs in the Recent Financial Crisis
httpslidepdfcomreaderfullgovernment-banking-and-brics-in-the-recent-financial-crisis 3857
983106983122983113983107 983111983151983158983141983154983150983149983141983150983156 983106983137983150983147983155 983137983150983140 983110983145983150983137983150983139983145983137983148 983123983156983137983156983141983139983154983137983142983156
38
Value in Term Savings Accounts by Type of Bank 1972-1995
The number and value of credits extended by banks from 1999-2008 appears mostpromising in terms of comparative analysis of bank performance and behavior Thesignificant spread at the end of the time series between the State Bank of India and itsassociates and foreign banks suggests the impact of foreign financial crisis and differentdomestic policies by these types of banks in India similar to that noted in the Brazilianexperience
Number of credits by type of bank 1999-2008
Value of credit by type of bank 1996-2008
8132019 Government Banking and BRICs in the Recent Financial Crisis
httpslidepdfcomreaderfullgovernment-banking-and-brics-in-the-recent-financial-crisis 3957
983106983122983113983107 983111983151983158983141983154983150983149983141983150983156 983106983137983150983147983155 983137983150983140 983110983145983150983137983150983139983145983137983148 983123983156983137983156983141983139983154983137983142983156
39
Further data from the Reserve Bank of India from 2008-10 permit closercomparison of government private and foreign banks in the recent financial crisis Interms of deposits investments total assets and net profits the dominant and expandingrole of government banking in India is apparent Further control variables (not reported)
include gross and net NPA types of income expenses and expenditures provisions andcontingencies and credit- and investment-deposit ratios provide control for bad bankingand confirm the counter cyclical policies during 2008-10 in India
THE FOLLOWING TABLES REQUIRE INTERPRETATION
Number of Banks 2006-7 2007-8 2008-9 2009-10 2010-11
State Bank of India amp Associates 8 8 7 7 6Nationalized Banks 20 20 20 20 20Old Private Sector Banks 17 15 15 15 14
New Private Sector Banks 8 8 7 7 7Foreign Banks 29 28 31 32 33Source RBI A Profile of Banks 2010-11
Number of Branch Offices 2006-7 2007-8 2008-9 2009-10 2010-11
State Bank of India amp Associates 14673 15848 16894 18178 18772Nationalized Banks 37435 39255 40956 43452 45640Old Private Sector Banks 4723 4690 4908 5220 5011New Private Sector Banks 2599 3635 4333 5232 6957
Foreign Banks 272 277 295 308 316Source RBI A Profile of Banks 2010-11
Number of Employees 2006-7 2007-8 2008-9 2009-10 2010-11
State Bank of India amp Associates 255699 249008 268598 266605 282453Nationalized Banks 473179 466400 462926 473041 475082Old Private Sector Banks 47994 48700 51341 55052 55075New Private Sector Banks 91060 110123 124998 127468 163604Foreign Banks 28426 31301 29582 28012 27968
Source RBI - India BanksAssociation
Business per employee (in lakh) 2006-7 2007-8 2008-9 2009-10 2010-11
State Bank of India amp Associates 43635 54922 65022 73743 79306Nationalized Banks 49001 61828 78316 93586 114477Old Private Sector Banks 48159 56932 63843 69749 8149New Private Sector Banks 80782 83196 78715 84041 82607Foreign Banks 97477 11255 128274 141139 155974Note Business = Deposits + Advances
8132019 Government Banking and BRICs in the Recent Financial Crisis
httpslidepdfcomreaderfullgovernment-banking-and-brics-in-the-recent-financial-crisis 4057
983106983122983113983107 983111983151983158983141983154983150983149983141983150983156 983106983137983150983147983155 983137983150983140 983110983145983150983137983150983139983145983137983148 983123983156983137983156983141983139983154983137983142983156
40
Profit per employee (in lakh) 2006-7 2007-8 2008-9 2009-10 2010-11
State Bank of India amp Associates 257 362 443 466 42Nationalized Banks 287 377 486 567 695Old Private Sector Banks 234 406 469 42 563New Private Sector Banks 587 685 677 847 893Foreign Banks 1613 2112 2539 1692 2759
Capital amp Reserves amp Surplus(Ycrore) 2006-7 2007-8 2008-9 2009-10 2010-11
State Bank of India amp Associates 42941 61706 72422 83726 84394Nationalized Banks 92689 113079 135920 157276 205857Old Private Sector Banks 10736 15315 17477 20171 23821New Private Sector Banks 39736 76056 82192 99813 114768Foreign Banks 33075 49332 59937 69176 80972
Deposits Ycrore 2006-7 2007-8 2008-9 2009-10 2010-11
State Bank of India amp Associates 633476 773875 1007041 1108086 1245862Nationalized Banks 1360724 1679993 2105706 2583934 3127122Old Private Sector Banks 138249 165589 199274 229897 264157New Private Sector Banks 413738 509444 537104 592904 738602Foreign Banks 150750 191161 214076 232099 240689
Investments Ycrore 2006-7 2007-8 2008-9 2009-10 2010-11
State Bank of India amp Associates 211875 263823 357624 387473 385697Nationalized Banks 452981 536018 655042 828125 942837Old Private Sector Banks 43647 54080 72393 83499 92617New Private Sector Banks 171008 224498 234139 270618 329403Foreign Banks 71471 98910 130354 159291 165499
Advances Ycrore 2006-7 2007-8 2008-9 2009-10 2010-11
State Bank of India amp Associates 482270 593722 739450 857937 994154Nationalized Banks 957877 1203678 1519762 1843082 2311478
Old Private Sector Banks 92887 111670 128504 154085 184647New Private Sector Banks 321865 406733 446824 478356 612886Foreign Banks 126339 161133 165385 163260 195539
Interest Income Ycrore 2006-7 2007-8 2008-9 2009-10 2010-11
State Bank of India amp Associates 53465 70428 89196 97954 109828Nationalized Banks 110720 142647 183892 208029 256490Old Private Sector Banks 11474 14614 18790 20497 23299New Private Sector Banks 38092 56377 66282 62309 73528
Foreign Banks 17924 24417 30322 26390 28520
8132019 Government Banking and BRICs in the Recent Financial Crisis
httpslidepdfcomreaderfullgovernment-banking-and-brics-in-the-recent-financial-crisis 4157
983106983122983113983107 983111983151983158983141983154983150983149983141983150983156 983106983137983150983147983155 983137983150983140 983110983145983150983137983150983139983145983137983148 983123983156983137983156983141983139983154983137983142983156
41
Other Income Ycrore 2006-7 2007-8 2008-9 2009-10 2010-11
State Bank of India amp Associates 9420 11818 16073 18394 19240Nationalized Banks 14264 20979 26394 30500 28625Old Private Sector Banks 1568 2184 2782 3152 3029
New Private Sector Banks 10745 14822 15078 17271 17697Foreign Banks 7044 10588 14894 9951 10972
Interest Expended Ycrore 2006-7 2007-8 2008-9 2009-10 2010-11
State Bank of India amp Associates 32607 47809 61770 66229 67018Nationalized Banks 69353 101093 131676 145712 164135Old Private Sector Banks 7055 9960 12834 14076 14768New Private Sector Banks 25802 38535 44123 37130 42347Foreign Banks 7603 10604 12819 8938 10622
Operating Expenses Ycrore 2006-7 2007-8 2008-9 2009-10 2010-11
State Bank of India amp Associates 15987 16993 20088 25283 29146Nationalized Banks 27268 29670 35416 40792 53819Old Private Sector Banks 2967 3235 3939 4715 5600New Private Sector Banks 12353 17032 17840 18136 22006Foreign Banks 7745 10353 12298 11102 12557
Cost of Funds 2006-7 2007-8 2008-9 2009-10 2010-11
State Bank of India amp Associates 475 59 594 532 48Nationalized Banks 48 582 609 537 493Old Private Sector Banks 498 62 667 613 55New Private Sector Banks 524 611 604 442 427Foreign Banks 403 433 446 283 311Cost of Funds = Ratio () of interest paid on deposits and borrowings to averageof opening and closing balances of deposits and borrowings
Return on advances adjusted toCoF 2006-7 2007-8 2008-9 2009-10 2010-11
State Bank of India amp Associates 372 365 395 36 405Nationalized Banks 399 369 409 382 427Old Private Sector Banks 406 426 515 482 492New Private Sector Banks 447 505 526 514 516Foreign Banks 574 66 815 716 564
2006-7 2007-8 2008-9 2009-10 2010-11
8132019 Government Banking and BRICs in the Recent Financial Crisis
httpslidepdfcomreaderfullgovernment-banking-and-brics-in-the-recent-financial-crisis 4257
983106983122983113983107 983111983151983158983141983154983150983149983141983150983156 983106983137983150983147983155 983137983150983140 983110983145983150983137983150983139983145983137983148 983123983156983137983156983141983139983154983137983142983156
42
Wages as of Total Expenses
State Bank of India amp Associates 2155 1589 1506 171 1921Nationalized Banks 1794 1405 1331 1365 1641Old Private Sector Banks 1689 1367 1326 1457 1675
New Private Sector Banks 936 956 1017 121 1383Foreign Banks 2008 1995 1944 2348 2331
Returns on Assets 2006-7 2007-8 2008-9 2009-10 2010-11
State Bank of India amp Associates 086 097 102 091 079Nationalized Banks 094 101 103 100 103Old Private Sector Banks 078 114 115 095 112New Private Sector Banks 109 113 112 138 151Foreign Banks 228 209 199 126 174
Capital Adequacy Ratio 2006-7 2007-8 2008-9 2009-10 2010-11
State Bank of India amp Associates 1232 1321 1396 1346 1225Nationalized Banks 1237 1213 1324 1318 1347Old Private Sector Banks 1208 1408 1476 1485 1456New Private Sector Banks 1199 1439 1533 1803 1687Foreign Banks 1239 1305 1432 1726 1672Note To 2007-8 = Basel I From 2008-09 = Basel-II
Net NPA Ratio 2006-7 2007-8 2008-9 2009-10 2010-11
State Bank of India amp Associates 132 143 147 150 149Nationalized Banks 094 077 068 091 092Old Private Sector Banks 096 066 09 082 053New Private Sector Banks 097 109 129 103 056Foreign Banks 073 077 181 182 067Net NPA Ratio = Net non-performing assets as net advances
In sum descriptive data from the Reserve Bank of India confirm the anomaly
and argument drawn from the Brazilian experience An important dimension of BRICcountry recovery from the global financial crisis and downturn is the counter cyclicallending policies and realization of competitive advantages of government banks Thisposes a series of new questions for business schools and scholars of public policyInstead of liberalization and privatization leading to transitions in BRIC countriestoward capital market centered financial systems and liberal market economies publicbanks have realized competitive advantages over private and foreign banks whileproviding policy alternatives to BRIC governments in the face of financial crisis andglobal economic slowdown We return to these implications in the conclusion
One development of note at the Reserve Bank of India is a policy focus onfinancial inclusion The 2008 report of the Committee on Financial Inclusion has beenfollowed by sections of the Reserve Bank of India Annual Report reserved fordiscussion of financial inclusion And instead of focusing on liberalization and
8132019 Government Banking and BRICs in the Recent Financial Crisis
httpslidepdfcomreaderfullgovernment-banking-and-brics-in-the-recent-financial-crisis 4357
983106983122983113983107 983111983151983158983141983154983150983149983141983150983156 983106983137983150983147983155 983137983150983140 983110983145983150983137983150983139983145983137983148 983123983156983137983156983141983139983154983137983142983156
43
privatization to ensure the spread of banking products and services alternative policieshave been explored One is of special note The Committee on Financial Inclusionrecommended issue of identity cards as bank cards This would profoundly change thelandscape of banking in India and has attracted attention from analysts at the CentralBank of Brazil charged with financial inclusion as well as the President of Indonesia
and apparently Uganda officials Given the revolution in information and card paymenttechnologies this policy proposal and pilot studies deserve close attention asalternatives to dramatically increase the pace of social inclusion of the bankless
8132019 Government Banking and BRICs in the Recent Financial Crisis
httpslidepdfcomreaderfullgovernment-banking-and-brics-in-the-recent-financial-crisis 4457
983106983122983113983107 983111983151983158983141983154983150983149983141983150983156 983106983137983150983147983155 983137983150983140 983110983145983150983137983150983139983145983137983148 983123983156983137983156983141983139983154983137983142983156
44
China
This section turns to a brief review of the Chinese banking sector to further explore therole of government banks in terms of their modernization competitive advantages
policy roles and capacity for counter cyclical credit that help explain why BRICcountries were able to avert the severe consequences of the global financial crisis
First figure A11 reports the basic structure of the banking system in China
Although we have been unable to compare the evolution of types of banks acrosstime in similar ways to the above data on India taken from the Reserve Bank of Indiaour research assistants have gathered the following comparative macroeconomicfinancial and balance sheet data on banking in China The data appear to be consistentwith the core argument presented in this paper ndash that government banks havemodernized since liberalization and provided policy makers with alternative means tocounter the effects of financial crisis abroad
8132019 Government Banking and BRICs in the Recent Financial Crisis
httpslidepdfcomreaderfullgovernment-banking-and-brics-in-the-recent-financial-crisis 4557
983106983122983113983107 983111983151983158983141983154983150983149983141983150983156 983106983137983150983147983155 983137983150983140 983110983145983150983137983150983139983145983137983148 983123983156983137983156983141983139983154983137983142983156
45
We lack more current information and were unable to collect data directly fromofficial sources in China to compare the trajectory of state owned private and foreignbanks As a substitute Figure 1 reports data from 2000-4 that permits initial observationof trends for this earlier period
Those present may not need reminding of the formidable record of economicgrowth in China during this 200-4 period that continues until today However data fromthe National Bureau of Statistics suggests that the Chinese banking system expanded atan even greater pace than the remarkable levels of GDP growth recorded for the 2000-4period Furthermore credit expansion was ldquoorganicrdquo in the sense that deposits
outpaced credit growth from 2000-4
Expansion of Loans in China 1999-2004
Loan Growth Total LoansYear on Year
Growth Total Depositssup1Year on Year
GrowthYear CNY billion CNY () CNY billion CNY()1999 9373 83 10878 1372000 9937 60 1238 1382001 11231 130 14362 1602002 13129 169 17092 1902003 159 211 20806 217
2004 18857 186 25319 217
sup1Based on preliminary estimates by the National Bureau of Statistics of the Peoplersquos Republic of ChinaSource National Bureau of Statistics of the PRC
Although we lack data comparable to that from the Reserve Bank of India ableto compare the trajectory of state private and foreign banks in China the sectoralbreakdown of loans and other banking and national account data confirms the profoundcapitalization of the Chinese banking system and GDP growth during from 1995-2004
8132019 Government Banking and BRICs in the Recent Financial Crisis
httpslidepdfcomreaderfullgovernment-banking-and-brics-in-the-recent-financial-crisis 4657
983106983122983113983107 983111983151983158983141983154983150983149983141983150983156 983106983137983150983147983155 983137983150983140 983110983145983150983137983150983139983145983137983148 983123983156983137983156983141983139983154983137983142983156
46
China Banking Sector Market Dimensions (1995 - 2004)
YearTotal
LoansCorp
LoansConsuLoans
HomeLoans
TotalDeposits Excess
GovBonds
CorpBonds GDP
GDPGrowth
()1995 52310 mdash mdash mdash 5376 145 330 65 5848 2511996 63100 mdash mdash mdash 6847 538 436 60 6788 1611997 73585 7341 17 130 8212 853 551 52 7446 971998 85002 8447 53 430 9529 102 9 777 68 7835 521999 95587 9394 164 1360 10831 1273 1054 78 8207 482000 108763 10453 424 3320 13486 261 1302 86 894 892001 118990 112 699 5600 15472 3573 1562 101 9593 732002 139800 12913 1067 8258 18339 4359 mdash mdash 10479 922003 169770 15401 1576 13302 22036 5059 mdash mdash 11669 1142004 194220 16848 1988 15800 25319 5897 mdash mdash 13657 170Figures = CNYB
This data reported in terms of percent GDP provides further clarity on the rapid
capitalization of loans It is of note that the bulk of loans during this period were to thecorporate sector with consumer and home loans lagging significantly
China Banking Sector Percent GDP
YEARTotal
LoansCorporate
LoansConsumer
LoansHomeLoans Deposits
ExcessDeposits
GovBonds
CorpBonds
1995 895 00 00 00 919 25 56 111996 929 00 00 00 1009 79 64 091997 988 986 02 02 1103 115 74 071998 1085 1078 07 05 1216 131 99 091999 1165 1145 20 17 1320 155 128 092000 1217 1169 47 37 1508 292 146 102001 1240 1167 73 58 1613 372 163 112002 1334 1232 102 79 1750 4162003 1455 1320 135 114 1888 4342004 1422 1234 146 116 1854 432
Sources China Banking Regulatory Commission Peoplersquos Bank of China and GoldmanSachs research estimates
Compilation of financial data from a select number of banks in China suggeststhat the pattern of bank change encountered in Brazil and India also describes theexperience of China The liberalization of the Chinese economy and the modernization
of state banks appear to describe the process of bank change instead of a process oftransition toward private banking and capital market centered financial systemAlthough we have been unable to draw data from Chinese monetary authorities thebalance sheet data suggests the clear predominance of large state banks in the politicaleconomy of banking and finance in China How these institutions were used to counterthe effects of financial crisis abroad and redirect domestic investment production andconsumption must remain a subject for further research
8132019 Government Banking and BRICs in the Recent Financial Crisis
httpslidepdfcomreaderfullgovernment-banking-and-brics-in-the-recent-financial-crisis 4757
983106983122983113983107 983111983151983158983141983154983150983149983141983150983156 983106983137983150983147983155 983137983150983140 983110983145983150983137983150983139983145983137983148 983123983156983137983156983141983139983154983137983142983156
47
Select Financial Data from Chinese Banks 2004()
CNY (billion)Total
AssetsGrossLoans
CustomerDeposits Equity
NPLRatio
()
Pre-prov
ProfitsNet
Profits
State Banks
ICBC 5671 3705 5105 163 190 653 23CCB 3905 2226 3489 195 39 605 484ABC (NA) mdashBOC 427 2146 3342 205 51 578 209Quasi-State
BoCom 1145 639 1023 54 30 131 16CMB 587 376 513 22 29 82 32CITIC Industrial 515 306 429 20 60 52 03SPDB 456 311 397 14 24 62 20China Everbright mdashGuangdong Development 345 216 301 mdash mdash mdash 32
Industrial Bank 341 203 283 10 25 37 11Quase-Private
Bank of Shanghai 216 106 179 83 51 32 26Hua Xia 304 181 270 92 40 29 10Shenzhen Development 198 126 166 43 114 28 03Bank of Beijing 209 85 174 71 mdash 26 07
Sector total 19422 25319 129Three state-banks 2692 3979 188Second tier banks 2549 3733 148
ABC = Agriculture Bank of China BOC = Bank of China
BOCOM = Bank of Communications CCB = China Construction BankCMB = China Merchantrsquos Bank CNY = yuanICBC = Industrial and Commercial Bank of ChinaNPL = nonperforming loanROA = return on assets ROE = return on equityprov = provisioningPRC = Peoplersquos Republic of ChinaSPDB = Shanghai Pudong Development BankNote Loan and deposit market share for BOC and ICBC are for their domestic operations onlySources Company data Goldman Sachs research estimates
Returns on Assets Equity and Domestic Market Shares of Major China Banks 2004()
CNY (billion) ROA () ROE ()Deposit Mkt
Share ()Loan MktShare ()
Mortgage MktShare()
State Banks
ICBC 004 14 199 187 253CCB 130 254 138 115 217ABC (NA)BOC 051 102 101 89 152Quasi-State
BoCom 015 45 37 29 34CMB 060 161 20 19 29
CITIC Industrial 007 17 17 16 18SPDB 048 153 16 16 26
8132019 Government Banking and BRICs in the Recent Financial Crisis
httpslidepdfcomreaderfullgovernment-banking-and-brics-in-the-recent-financial-crisis 4857
983106983122983113983107 983111983151983158983141983154983150983149983141983150983156 983106983137983150983147983155 983137983150983140 983110983145983150983137983150983139983145983137983148 983123983156983137983156983141983139983154983137983142983156
48
China EverbrightGuangdong Development mdash mdash 12 11 mdashIndustrial Bank 037 126 11 10 10Quase-Private
Bank of Shanghai 129 360 07 05 14Hua Xia 038 116 11 09 07Shenzhen Development 017 75 07 06 08Bank of Beijing 037 108 07 04 07
Sector totalThree state-banks 438 391 622Second tier banks 144 127 154
ABC = Agriculture Bank of China BOC = Bank of China BOCOM = Bank of Communications CCB =China Construction Bank CMB = China Merchantrsquos Bank CNY = yuanICBC = Industrial and Commercial Bank of China mkt = market NPL = nonperforming loan ROA =return on asset ROE = return on equity prov = provisioning PRC =Peoplersquos Republic of China SPDB = Shanghai Pudong Development BankNote Loan and deposit market share for BOC and ICBC are for their domestic operations onlySources Company data Goldman Sachs research estimates
Further data from 2006-10 from the Peoples Bank of China suggests that the big5 state banks continue to outperform the next 12 largest joint stock commercial banksThe big five have launched sales of shares to capitalize while listing on capital marketsand adopting reporting of financial data along lines of international standards Thisappears to be similar to Banco do Brasil policies that retain majority of shares in federalgovernment control while capitalizing the bank through issues of stock
Comparing the Performance of Big 5 State Banks and Next 12 Joint Stock CommercialBanks in China
2006 2007 2008 2009 2010
Profit Margin Big 5 State Banks 3116 3143 2586 3026 3269
Next 12 JS Commercial Banks 2050 2791 1796 2159 2365
Returns Big 5 State Banks 507 606 860 691 675(risk adj) Next 12 JS Commercial Banks 459 570 1016 714 723
Op Risk Big 5 State Banks 5548 5539 5215 5319 5322Next 12 JS Commercial Banks 5886 5721 5725 5831 5947
Leverage Big 5 State Banks 1626 1482 1724 173 1734Next 12 JS Commercial Banks 2826 2251 2064 2048 1936
ROE Big 5 State Banks 1424 1557 1999 1925 2037Next 12 JS Commercial Banks 1564 2049 2156 1840 1967
Big 4 and 11 JSCBsSource Peoples Bank of China China Financial Stability Reports 2007-11
Performance indicators reported by the Peoples Bank of China for the big 5 statebanks and 12 next largest joint stock commercial banks also suggest that the largestgovernment banks in China retain significant competitive advantages ndash and may providepolicy alternatives Given the current shift of economic policy in China away fromindustry and export led growth to more sustainable domestic oriented growth and socialinclusion the role of state banks clearly comes to the fore
8132019 Government Banking and BRICs in the Recent Financial Crisis
httpslidepdfcomreaderfullgovernment-banking-and-brics-in-the-recent-financial-crisis 4957
983106983122983113983107 983111983151983158983141983154983150983149983141983150983156 983106983137983150983147983155 983137983150983140 983110983145983150983137983150983139983145983137983148 983123983156983137983156983141983139983154983137983142983156
49
Net Operating Income of Big 5 State Banks and Next 12 CommercialBanks 100 million RMB YuanBig 5 State Banks 2006 2007 2008 2009 2010
Balance Net interest income 349703 500456 556790 532206 720152Net fee amp commission inc 48524 103817 138464 175469 232491
Investment income 216089 283725 338865 324037 340440
Other business income (1807) (17054) 47548 33791 2186
Net operating income 612509 870944 1081667 1065503 1314943
Percent Net interest income 5709 5746 5148 4995 5477
Net fee amp commission inc 792 1192 1280 1646 1768
Investment income 3528 3258 3133 3041 2589
Other business income (030) (196) 440 318 166
Net operating income 10000 10000 10000 100 100
Next 12 Joint Stock CommercialBanks 2006 2007 2008 2009 2010
Net interest income 87253 132945 198965 191276 281588
Net fee amp commission inc 7850 16247 27319 30115 42023
Investment income 20959 32172 44864 50767 50500
Other business income 2306 4498 16359 10384 7400
Net operating income 118468 185861 287507 282542 381511
Percent Net interest income 7365 7153 6920 6769 7381
Net fee amp commission inc 671 874 950 1066 1101
Investment income 1769 1731 1560 1797 1324
Other business income 195 242 569 368 194Net operating income 10000 10000 10000 10000 10000
Source Peoples Bank of China China Financial Stability Reports 2007-11
Big 4 and 11 JSCBsBig 5 = ICBC ABC BOC CCB BOCOMNext 12 Joint Stock Commercial Banks = China CITIC Bank Everbright Bank Huaxia BankGuangdong Development Bank Shenzhen Development Bank China Merchants Bank Shanghai PudongDevelopment Bank Industrial Bank China Minsheng Banking Corporation Evergrowing Bank ChinaZheshang Bank Bohai Bank
In conclusion bank change in China also appears to confirm our findings from
Brazil ndash that state banks have realized competitive advantages and increased marketshares since liberalization while providing counter cyclical credit to ameliorateadjustment to crisis The modernization of the China Postal Savings Bank is ofparticular interest given its social mission downmarket focus and 40000 branchOffices throughout the country Expansion of card payment services through the postalbank system confirms the importance of the Brazilian federal savings bank (CaixaEconocircmica Federal Caixa) as agent for federal government social policy and agentresponsible for management of citizenship cards (12 million) and payment of familygrants This back to the future modernization of savings banks has proved essential forovercoming notorious levels of social exclusion and inequality in Brazil Althoughenglish language materials are unavailable on the China Postal Savings Bank thisinstitution clearly presents profound opportunities for comparable policies in China
8132019 Government Banking and BRICs in the Recent Financial Crisis
httpslidepdfcomreaderfullgovernment-banking-and-brics-in-the-recent-financial-crisis 5057
983106983122983113983107 983111983151983158983141983154983150983149983141983150983156 983106983137983150983147983155 983137983150983140 983110983145983150983137983150983139983145983137983148 983123983156983137983156983141983139983154983137983142983156
50
Reported offer of microfinance services for poverty reduction as part of nationaleconomic stimulous plan may point to developments in this direction
Given that state planning capacity has long been at the center of attention intheories of financial statecraft the role of Chinese state banks in redirecting policiesaccording to the 12th 5 Year plan for 2011-15 seems critical From 2000-5 the 10th 5
Year plan emphasized infrastructure and the attraction of investment and labor skillsThe 11th 5 Year plan (2006-10) raised concerns about sustainability rather than growthlevels while also seeking to spread improvements to balance development better servepeople and improve the quality of life continue to support Center and West provincesand revitalize Northeast provinces In comparison the 12th 5 Year plan calls for morebalanced lsquoinclusiversquo growth and structural adjustemts more than 4 trillion RMB($US600 billion) for targeted industries and interior regions a focus on new energynew materials and information and high technologies biology and new medicineenergy converstaion and environmental protection aerospace marine and advancedmanufacturing This implies fundamental shifts away from industry to services that hasbeen reported in macroeconomic data for 2010 If past studies emphasized directed
credit and industrial change the role of Chinese state banks in realizing transformationscertainly warrants study
Although the domestic flow of funds process of liberalization (or the lackthereof) and insertion of banking into Chinese political economy is beyond the scope ofthis paper our findings from Brazil appear to provide valuable hypotheses about ChinaThat is to say the big state banks and other government banks in China remaincommanding heights not in the Marxist sense of providing means to reach socialismbut immense institutions with profound presence throughout politics and markets in thecountry In this sense our findings from Brazil appear to approximate patterns ofchange in China more than Washington Consensus expectations about liberalization andprivatizations to free private and foreign banks Financial statecraft draws attention tothe capitalization of Chinese state banks through stock Sales and listings on capitalmarkets However like the Banco do Brasil (that reformers in the 1990s sought to shiftcontrol to the private sector only to increase federal government shareholding) theChinese experience surely involves unexpected consequences and patterns of changedifferent than a linear transition to the Berle amp Means paradigm of corporategovernance
Russia The New State Duopoly
ldquoThe rush of 2003-8 increased the market share of foreign banks to 285 from
52 However the state-owned banks received enormous help from the federal budget in the days of the crisis thereby strengthening their dominant
position on the Russian financial market says Sergey Aleksashenko the formerDeputy chairman of Russias Central Bank quotes Russia Profile Today one
must not harbor any illusion of a fair competition with them all the main cash
flows in Russia are controlled by state-owned banks httpwwwbarentsnovacomnode1031
Description of banking policy in Russia during the global financial crisis can beobtained from Bank of Russia annual reports and related publications The figure on the
following page summarizes the financial flows to and from the Bank of RussiaAlthough central bank policy is beyond the scope of this study the role of state banks in
8132019 Government Banking and BRICs in the Recent Financial Crisis
httpslidepdfcomreaderfullgovernment-banking-and-brics-in-the-recent-financial-crisis 5157
983106983122983113983107 983111983151983158983141983154983150983149983141983150983156 983106983137983150983147983155 983137983150983140 983110983145983150983137983150983139983145983137983148 983123983156983137983156983141983139983154983137983142983156
51
channeling counter-cyclical credits released by the Bank of Russia appear to confirm thecore argument that emerges from our studies of the Brazilian banking system Furtherdata on the following pages also suggest that state banks in Russia performed wellduring 2008-10 confirming on the basis of sparse data taken from Bank of Russiareports and documents that public banks have modernized provided counter-cyclical
credit to reverse credit crunch and economic downturn while realizing competitiveadvantages over private and foreign banks
8132019 Government Banking and BRICs in the Recent Financial Crisis
httpslidepdfcomreaderfullgovernment-banking-and-brics-in-the-recent-financial-crisis 5257
983106983122983113983107 983111983151983158983141983154983150983149983141983150983156 983106983137983150983147983155 983137983150983140 983110983145983150983137983150983139983145983137983148 983123983156983137983156983141983139983154983137983142983156
52
The following aggregate figures reported by the Bank of Russia suggest severaltrends of significance First Chart 32 suggests that household deposits shifted fromRuble deposits to foreign currency pegged (or indexed) during 2008 Second Chart 33illustrates the substantial increase of non-bank overdue debt during second semester
2008
Consequently the financial results and profitability of banks declinedsignificantly during 2008 The greater confidence in deposits with government banksfound abroad suggests that this may have been critical in Russia
Performance data deom 2008-10 provides a clearer picture one that is consistentwith our findings in Brazil State banks appear to have outperformed all other types of
banks except medium and small regional banks The following table reports the averagereturns on assets and returns on equity reported by the Bank of Russia 2008-10
Returns on Assets and Equity by Type of Bank in Russia 2008-9
Return on assets Return on equity 2008 2009 2010 2008 2009 2010
-------------------------------------------------------------------------------------------------------------------State Banks 22 08 24 157 46 148Foreign Banks 18 11 21 146 83 145Large private banks 13 03 11 106 28 84Medium-Small Banks Moscow 15 12 14 68 52 67
Medium-Small Regional Banks 21 12 15 131 65 98--------------------------------------------------------------------------------------------------------------------Source Bank of Russia Bank Supervision Reports 2009 and 2010
8132019 Government Banking and BRICs in the Recent Financial Crisis
httpslidepdfcomreaderfullgovernment-banking-and-brics-in-the-recent-financial-crisis 5357
983106983122983113983107 983111983151983158983141983154983150983149983141983150983156 983106983137983150983147983155 983137983150983140 983110983145983150983137983150983139983145983137983148 983123983156983137983156983141983139983154983137983142983156
53
Further data from the Bank of Russia on the capital adequacy of Banks during2009-10 suggest that foreign banks and large private banks remain less capitalizedagainst risks according to Basel II guidelines albeit at levels almost double thatrecommended by the Bank for International Settlements (80 risk weighted) Although
further analysis is needed this data is consistent from that reported in Brazil thatgovernment banks tend to more cautious and more prudent in terms of placing asidehigher levels of reserves and patrimony against possible losses
Capital Adequacy of Banks by Type of Bank in Russia 2009-10
2009 2010 2011---------------------------------------------------------------------------------------------------------State Banks 184 227 186Foreign Banks 155 196 195Large Private Banks 140 181 155
Medium-Small Banks Moscow 316 312 268Medium-Small Regional Banks 219 241 207Non-Bank Credit Institutions 372 1038 678---------------------------------------------------------------------------------------------------------Source Bank of Russia Bank Supervision Report (Moscow) 2009 p 43
Finally Bank of Russia bank supervision reports also suggest that state banksexpanded their market shares of assets and capital during the years following the globalfinancial crisis While large private banks and foreign banks lost market share of bankassets and bank capital in Russia state banks increased their significant market sharefrom 405 ndash 426 percent and 471-476 percent of assets and capital respectivelyUnfortunately data from previous years and for specific banking groups was notobtained However this data does appear to indicate that our findings of competitiveadvantages and policy alternatives
Number and Market Share by Type of Bank
N Banks Assets Capital---------------------------- ---------------------------- ----------------------------
Type of Bank 2009 2010 2011 2009 2010 2011 2009 2010 2011-------------------------------------------------------------------------------------------------------------------------------State 17 22 27 405 439 458 471 489 473
Foreign 101 106 108 187 183 180 172 169 191Large Private 136 139 131 346 333 305 276 287 269Med-Small Moscow 361 335 317 27 26 26 43 34 35Medi-Small Regional 443 412 372 28 28 27 36 31 29Other Credit Institutions 50 51 57 07 04 04 01 02 03Total 1108 1058 100 100 100 100 100 100-------------------------------------------------------------------------------------------------------------------------------Source Bank of Russia Bank Supervision Report 2009 amp 2010
In sum politics and financial statecraft have led to the realization of significantcompetitive advantage by Russian state banks Sperbank and Vneshtorgbank increasedtheir share of bank assets from 32 percent in 2005 to over 50 percent by 2011 through
mergers and acquisitions and aggressive displacement of foreign banks Whatever thepolitics data from the Bank of Russia suggests that monetary authorities released a
8132019 Government Banking and BRICs in the Recent Financial Crisis
httpslidepdfcomreaderfullgovernment-banking-and-brics-in-the-recent-financial-crisis 5457
983106983122983113983107 983111983151983158983141983154983150983149983141983150983156 983106983137983150983147983155 983137983150983140 983110983145983150983137983150983139983145983137983148 983123983156983137983156983141983139983154983137983142983156
54
series of counter cyclical credit injections during 2008-9 to domestic bankinginstitutions Moreover data suggests that state banks continue to perform at or ahead oflevels reported by regional private and foreign banks The large market share andimproved performance of state banks reported in recent data suggests although the datais sparse that government banks in Russia have also modernized realized competitive
advantages and provided policy alternatives against the impact of financial crisisabroadWe were unable to find evidence of policy making toward social inclusion at the
Bank of Russia or Russian state banks despite the historical trajectory of the Sberbankas a savings bank under communism The context also appears to differ considerably Asurvey of the Zircon Research Group reportedly found that only 15 percent of Russiansretain bank accounts because of mistrust in banks and government This combination ofrealist politics and the realization of competitive advantages by Russian state bankssuggests that theories of economic statecraft in the realist tradition may indeed explainthe domestic developments under study
Conclusion
This paper reports evidence about government bank modernization and financialstatecraft in BRIC countries designed to counter the effects of crisis and shape domesticgrowth Government banks in BRIC countries have contributed to the widely notedadjustment of these economies to global financial crisis and economic downturnContrary to the Washington Consensus that prevailed during much of the 1980s and1990s (that privatization and liberalization especially of banking would free marketforces and deepen domestic financial systems) a quite different process of bank changeappears to have ensued after financial liberalization in the BRICs
Instead of replacement of state banks with private banks government banksremain central agents of domestic credit and growth and have modernized ldquojust intimerdquo The capitalization and realization of competitive advantages by large governmentbanks during the 2000s meant that once the US financial panic spread across capitalmarkets broke highly leveraged private and produced runs on private bank depositspolicy makers in BRIC countries nonetheless retained counter cyclical policyalternatives through their more solid large state banks
These findings counter traditional foci on the private sector individualentrepreneurship and ideals of free markets linked to the political and social advancesrecorded around the world in the last decades We report an anomaly for theories offinancial repression and the Washington Consensus about the virtues of privatization
and liberalization Although largely blamed for reproducing underdevelopment in thepast BRIC government banks averted excesses of private banking that drove creditbubbles such as home mortgages and derivatives in the US And since liberalization ofbanking (we have not adequately discussed how much liberalization occurred in eachcountry) government banks have modernized to compete with private and foreignbanks Government banks have realized competitive advantages and provided policyalternatives These two arguments help explain why BRIC countries have farecomparatively well in the face of financial crisis in core countries
Financial statecraft is therefore at the center of BRIC counter cyclical capacitiesand state planning Brazil Russia India and China fared significantly better thanadvanced and many developing countries in terms of adjusting to credit crunches and
export shocks This is because government banks proved critical interbank credit toretain confidence in domestic banking systems These institutions also presented other
8132019 Government Banking and BRICs in the Recent Financial Crisis
httpslidepdfcomreaderfullgovernment-banking-and-brics-in-the-recent-financial-crisis 5557
983106983122983113983107 983111983151983158983141983154983150983149983141983150983156 983106983137983150983147983155 983137983150983140 983110983145983150983137983150983139983145983137983148 983123983156983137983156983141983139983154983137983142983156
55
policy alternatives for political and social forces Politics shaped adjustment andrecovery through state banks differently in BRIC countries Given the realities of statecentered political realism in Russia the redirection of state banks toward goals ofChinese Five Year Plans and the modernization of the State Bank of India amidst anamorphous federalism the experience of Brazil with democratization and public bank
modernization may stand out (Armijo 2009)Further analysis of savings banks and cooperative banks also will be requiredAs members of the World Savings Bank Institute (a global association of savingsbanks) the Caixa in Brazil SNI and NABARD in India and China Postal Savings Bankappear to have provided access to very large numbers of previously unbanked citizensThis returns to traditional ideas of social banking and the history of savings banks thatwere founded throughout Europe since the late 18 th century The upmarket strategy andexpansion into investment banking and international banking of the Russian Sberbankconstrasts with downmarket strategies of savings banks in Brazil India and China
The financial press has recently reported doubts about bad loans in Chinese statebanks and cast doubt on the financial results posted and reported in this paper
However current estimates of 2-5 percent bad loans in Chinese state banks pale incomparison to the US$1240 billion in bad loans shifted to asset managementcompanies in the mid 2000s before capitalization of these institutions through sale ofshares Critics of state banking in Brazil also point to past levels of bad loans (reaching30-40 percent) because of their capture during military government delayed transitionBut the cost of capitalization and transfer of bad loans from Brazilian state banks alsoremained below US$400 billion and is still contingent on liquidation of assetmanagement companies created in 2001 In any case these numbers are very smallcompared to GAO estimates of US$120 trillion in emergency infusions by USmonetary authorities to banks and financial institutions from 2007-11
These are anomalies for recent market-based banking theory and neo-liberalpolicy designs However they do not run counter to orthodoxy in economics andbanking theory Over the last decades economic reforms (fiscal financial monetaryand banking) have improved transparency and brought public policy and marketexpectations closer However expectations about deregulation and free marketequilibria in banking and finance have succumbed in the face of panic and the stillsobering consequences of crisis The materials presented herein are descriptive and willrequire more careful analysis However given the urgency of searching for alternativedevelopment models and different approaches to financial statecraft in BRIC countriesand beyond we have taken the liberty to present research in initial stages and toprovoke thought along the lines suggested by our kind conveners
8132019 Government Banking and BRICs in the Recent Financial Crisis
httpslidepdfcomreaderfullgovernment-banking-and-brics-in-the-recent-financial-crisis 5657
983106983122983113983107 983111983151983158983141983154983150983149983141983150983156 983106983137983150983147983155 983137983150983140 983110983145983150983137983150983139983145983137983148 983123983156983137983156983141983139983154983137983142983156
56
Appendix on Alternative Banking and Social Inclusion
This appendix describes how ideas about government banking led to further work onalternative banking and social inclusion with help from the Rockefeller FoundationBellagio Center In July 2011 we were able to convene a conference designed to gather
scholars alternative banking executives and representatives from savings andcooperative bank associations to rethink strategies for social inclusion in the globalsouth and attempt to launch a new policy agenda Given the search for alternativestrategies to counter crisis and the advances of stabilization transparency and bankingsupervision in developing and emerging economies we call for alternative bankingcommunities in the global north and south to work together and help shape a new policyagenda for social inclusion Because savings banks credit cooperatives and otheralternative banking and finance institutions have realized competitive advantages andemerged from crisis we can now think beyond We believe that new policies may helpdeveloping and emerging nations redirect large domestic institutions such as postal andsavings banks toward meeting the UN millennium goals to eliminate poverty by 2015
Plans include writing a green paper on Core Principles for Alternative Bankingand Social Inclusion convening events to promote these principles through institutionalsupporters and networks and seeking adoption of these principles at policy venues suchas the World Savings Bank Institute the International Association of CooperativeBanks the Bank for International Settlements the International Financial ReportingStandards foundation the ISO International Standards Organization the Charter forResponsible Business regional development banks and the World Bank We also planto submit an edited volume of scholarly contributions on alternative banking and socialinclusion by year-end 2012 Interested parties are welcome to participate
Institutional supporters and networks include
Institutional SupportersColumbia University School of International and Public Affairs New YorkInstitute for Money Technology and Financial Inclusion University of CaliforniaIrvineKingacutes College Department of Management LondonSatildeo Paulo Business School Getulio Vargas FoundationSecond University of Naples
Networks
Association of Emerging Market Business Schools Satildeo Paulo BrazilCommunity of European Management Schools BrusselsCritical Political Economy NetworkEuropean Association of Co-operative Banks BrusselsGlobal Public Policy Network LondonInternational Cooperative Banking Association BrusselsSocial Science Finance Network AmsterdamSociety for Advancement of Social Economics PhiladelphiaWorld Savings Bank Institute Brussels
8132019 Government Banking and BRICs in the Recent Financial Crisis
httpslidepdfcomreaderfullgovernment-banking-and-brics-in-the-recent-financial-crisis 5757
983106983122983113983107 983111983151983158983141983154983150983149983141983150983156 983106983137983150983147983155 983137983150983140 983110983145983150983137983150983139983145983137983148 983123983156983137983156983141983139983154983137983142983156
Core Principles for Alternative Banking and Social Inclusion
Commitment to End Capital StarvationPromote access to and use of banking and financial services by all through newtechnologies and distribution channels to capitalize assets among the poor
Commitment to Universalize Income Savings Credit and FinanceProvide basic income via ATM cards and mobile banking to reach the poor and opennew channels of access to income savings credit finance insurance and opportunities
Prudent Banking and Regulatory ComplianceAlternative banking seeks to work within regulations guidelines and best practicesrecommended by domestic monetary authorities and international regulatory institutionssuch as the Bank for International Settlement Basel II Capital Risk Guidelines
Corporate Social Responsibility Leadership
Integrate corporate social responsibility into down-market business strategies andinstitutions of representation and democratization
Transparency and AccountabilityPublish annual reports and balance sheets in accord with international best practices offinancial social and sustainability reporting
Leadership in Provision of New Banking Services and Products to the PoorUse competitive advantages in banking and institutional networks to channel moreeffectively capital income and finance to the poor
Generate Sustainable Income and Household Asset AccumulationUse branch offices and new banking technologies to accelerate progress toward UNmillennium goals to eliminate poverty
Universalize Financial EducationPromote financial education to encourage responsible banking and finance and avertpredatory lending and unethical practices
Adopt Cutting Edge Technology and Management Practices to Provide
Competitive Alternative to Private Commercial and Investment Banks
Incorporate electronic card and mobile banking services to better serve the poorContribute to Realization of Bellagio Principles for SustainabilityPromote alternative banking and business practices that contribute to environmentallysustainable income consumption and production as stated in Bellagio Principles forSustainability
Respect and Build on National and Regional DifferencesI d f i l d l l i b ki i i i d i i l
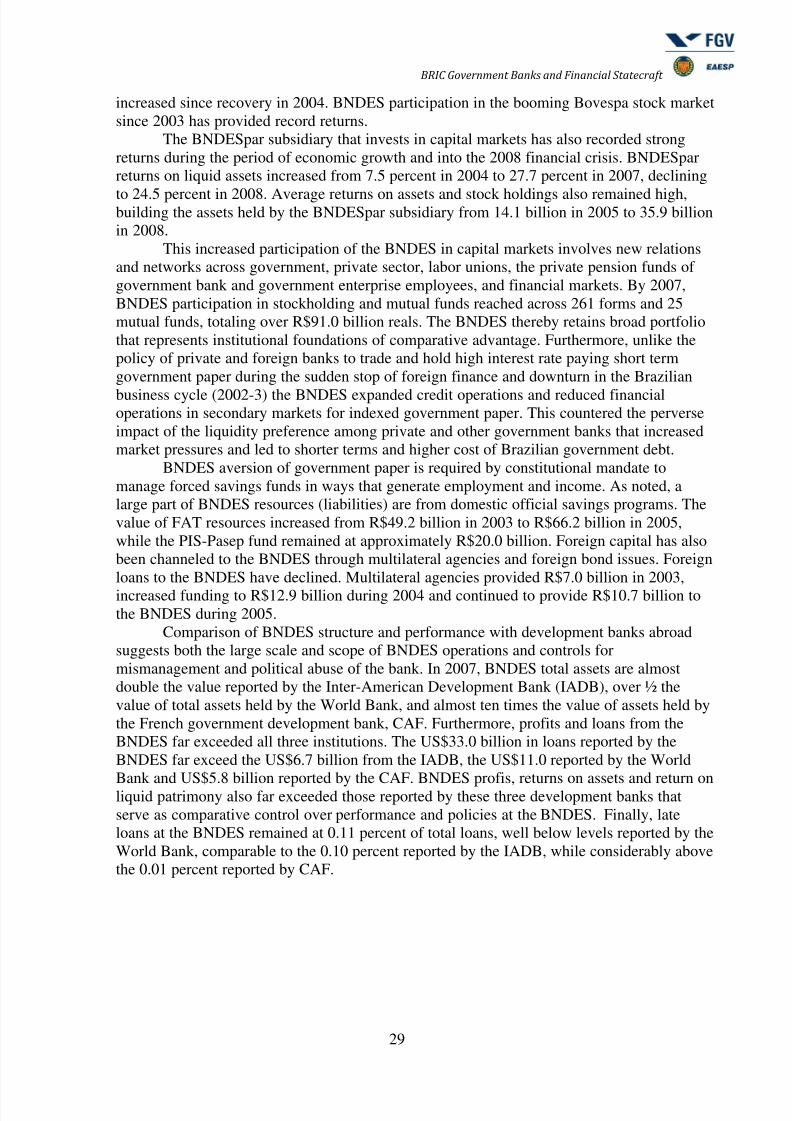
8132019 Government Banking and BRICs in the Recent Financial Crisis
httpslidepdfcomreaderfullgovernment-banking-and-brics-in-the-recent-financial-crisis 3157
983106983122983113983107 983111983151983158983141983154983150983149983141983150983156 983106983137983150983147983155 983137983150983140 983110983145983150983137983150983139983145983137983148 983123983156983137983156983141983139983154983137983142983156
31
ELETROBRAacuteS (1) 118 22400 22400EMBRAER 50 1096 1096Gerdau 35 1533 490Independecircncia 139 2500 -JBS 130 14722 11370Klabin 202 5621 -
Light 336 8225 -Marfrig 146 8176 1020MPX Mineraccedilatildeo 26 1791 1791Ouro Fino 200 1057 840Paranapanema 175 1252 08Petrobraacutes 76 10226 10226Rede Energia SA 253 2633 -Tele Norte Leste Participaccedilotildees 16 1645 1645Valepar 97 26254 15585Subtotal 163055 102941Other firms 12223 12606Total 175278 115548----------------------------------------------------------------------------------------------------------------
Source BNDESpar Financial Statements 2008 pp
The BNDES also holds blocks of shares in many major Brazilian corporationsthrough its participation subsidiary BNDESpar Comparing value of investments in 2007 and2008 suggests that large purchases capitalized firms precisely as financial crisis and downturnin Bovespa stock market made it difficult for firms to find working capital Table X reportsthe percent of total company shares held by the BNDES and their respective market values(adjusted for risk of future losses) at year end 2007 and 2008 During this year of extremelyshort and expensive credit in Brazil caused by the international financial and banking crisisthe BNDES increased shareholding by over R$60 billion reals in 28 private Brazilianenterprises Further shareholding classified as X in Five firms (Bertin 269 Brasiliana 538
Copel 239 Rio Poliacutemeros 250 Telemar 313) Once again the BNDES provided access tocapital for firms caught in the sudden credit crunch and stock market collapse unable to meetobligations or raise funds through equity issues or commercial bank credit This countercyclical role of government banks has been critical in Brazil since the 19 th century
BNDESpar Private Equity and Fund Participation 2007-2008 R$million
Fund Manager 2008 2007-------------------------------------------------------------------------------------------------------------------------Brasil 21 Dynamo 46 60PROT Mellon Financial Services 4628 -
Logiacutestica Brasil Bradesco 135 -Fire BrasilPrivate 269 250FIPGG Governanccedila amp Gestatildeo Inv 289 311Opportunity Equity Partners Mellon Financial Services 1046 578Brasil Energia Bradesco 1184 655InfraBrasil ABN-Amro 677 251Rio Bravo Cinema Rio Bravo 116 110Brascan Petro amp Gaacutes Bank Brascan 136 113AG Angra Infra-Estrutura Bradesco 380 301Satildeo Paulo Metro Fund Bradesco 791 831Other Funds 653 572Total 10356 4038---------------------------------------------------------------------------------------------------------------------------
Source BNDESpar Financial Statements 2008
8132019 Government Banking and BRICs in the Recent Financial Crisis
httpslidepdfcomreaderfullgovernment-banking-and-brics-in-the-recent-financial-crisis 3257
983106983122983113983107 983111983151983158983141983154983150983149983141983150983156 983106983137983150983147983155 983137983150983140 983110983145983150983137983150983139983145983137983148 983123983156983137983156983141983139983154983137983142983156
32
Finally Brazilian federal government triennial plans include investment targets by theBNDES If current plans are compared to 2004-7 investments several structural changes inBNDES lending appear First BNDES plans for Oil and Petroleum production reveal aprofound change for Brazilian political economy In 1990 roughly 45 percent of oilconsumed in Brazil was imported In 2007 before oil price increased reversed the balance
Brazil reported domestic production levels sufficient to meet domestic consumptionFurthermore discoveries of substantial deep sea oil reserves have led the BNDES to planmassive investments involving Petrobras and other global petroleum firms For the 2009-2012 period investments in petroleum and gas (R$2697 billion) Petrochemicals (237) andEthanol (197) sum to over R$3130 billion
BNDES Triennial Investment Plans 2004-2012
2004-7 2007-10 2008-11 2009-12----------------------------------------------------------------------------------------------------------------Petroleum amp Gas 1472 1836 2028 2697
Mining 472 527 813 480Petrochemicals 64 174 264 237Steel 198 371 312 245Automotive 150 176 264 235Electronics 143 156 140 240Ethanol 166 205 205 197Paper amp Celulose 104 200 274 90Health 51 46 51 80Industry Total 2816 3802 4437 4501----------------------------------------------------------------------------------------------------------------Source BNDES Annual Reports 2002-2006
It is of note that President Dilma Roussef was instrumental in reducing the targets for2009-12 in petroleum and gas given indications that Petrobras and existing framework foroffshore oil prospecting and production proved unable to increase investments accordingly
The BNDES also retains a presence in government projects by providing managementassistance During 2008 BNDES staff provided management support for implementation of192 projects involving R$710 billion of total R$142 billion PT government growthacceleration projects BNDES staff also participated in the design management andimplementation of President Lularsquos Poliacutetica de Desenvolvimento Produtivo (Policy forProduction Development) involving R$2100 billion targeting production chains designed tomaximize employment and regional development benefits Finally the BNDES was alsocharged to create and co-manage a Fundo Amazonia with the Ministry of Environment toprovide incentives to reduce deforestation of the Amazon region BNDES Plans for 2009include completion of concession for construction of high speed train line and service for Riode Janeiro-Satildeo Paulo corridor two blocks of highway concession sales involving three majorhighways in each block of sales sale of management concessions for regional airports andthe reorganization of INFRAERO federal government airport management company
These policies reflect the goal of BNDES policy to launch firms on the stock marketrather than maintain direct credit and finance Exceptions during 2008 involve Auto andEthanol industies both for strategic and broader policy reasons Given the sharp downturn inauto sales during fourth quarter 2008 the BNDES provided significant lending to avert
further downsizing or failure of auto companies in Brazil Given the current globalredistribution of automobile production BNDES policies are designed to help the Brazilian
8132019 Government Banking and BRICs in the Recent Financial Crisis
httpslidepdfcomreaderfullgovernment-banking-and-brics-in-the-recent-financial-crisis 3357
983106983122983113983107 983111983151983158983141983154983150983149983141983150983156 983106983137983150983147983155 983137983150983140 983110983145983150983137983150983139983145983137983148 983123983156983137983156983141983139983154983137983142983156
33
operations of major auto firms through the period of adjustment and increase theattractiveness of domestic operations in global production strategies of multinational autocompanies Ethanol production also received massive funds to sustain an industry seen ascritical for alternative and sustainable fuel source capable of replacing petroleum Ethanolreached over 50 percent of automotive fuel sales in 2007
Under the Lula government (2003-10 the BNDES also resumed lending to state andmunicipal governments Since the renegotiation of municipal and state government debts inthe late 1990s states and municipalities have been largely prohibited from taking on debtThis was emplematic of the recentralization required to control fiscal excesses during militaryrule and the prolonged period of transition to democracy Policies during the 1990s weredesigned to avert overspending seen as critical to maintain price stability under the Real Plan(1994) In 2000 the Lei de Responsibilidade Fiscal (Fiscal Responsibility Law) largelyprohibited credit and finance to state and municipal governments Since 2000 municipalitiesand states have been required to submit detailed budget statements that in turn have been thebasis for a gradual return to sub-national government finance In August 2006 central bankand Treasury regulations freed municipalities to take on credit up to 12 times liquid receipts
Since then the BNDES has led in terms of credits and finance to subnational governmentsthrough a Programa Especial de Financiamento aos Estados e Distrito Federal
The BNDES also has developed the first system in Brazil for risk analysis ofmunicipal governments and has led in the market for municipal credit freed by August 2006procedures for approval at Treasury the Central Bank and Conselho Monetaacuterio Nacional(National Monetary Council) Prosecution of mayors and firms charged with managingmunicipal credits with the BNDES revealed fraudulent practices These funds for sub-national public finance also became critical mechanisms to counter severe budget shortfallscaused by financial crisis during 2008 Given that municipal and state government tax basesare shallow and that federal government transfers provide the bulk of sub-nationalgovernment resources the Lula administration allocated R$ 40 billion to the Fundo deParticipaccedilatildeo dos Estados (State Participation Fund) through a Programa Emergencial deFinanciamento (Emergency Finance Fund) administered by the BNDES
In sum the BNDES expanded credit and finance operations substantially during fouryears of sustained growth from 2004-2007 And having helped underwrite the stock marketboom and capitalized Brazilian firms directly and indirectly through credit finance mutualfunds and private equity funds the BNDES retained sufficient scale scope and capital baseto provide counter cyclical credit and finance to help firms adjust to financial crisis and creditshortage during 2008 In retrospect the growth of the BNDES since liberalization andprivatizations of state government banks in the 1990s suggest the comparative advantages of
development banking BNDES credit and finance fell to 52 percent of fixed capitalformation in 1995 Since then the turn to neo-developmentalism and a period of sustainedeconomic growth during the Lula administration increased the BNDES share of total fixedcapital formation during 2006 and 2007 to 126 and 141 percent Critics charge thatmonopoly over FGTS and PIS-PASEP official savings funds as liabilities provide theBNDES with unfair competitive advantage over private banks In 2008 forced savings fundssummed to only 17 percent of BNDES liabilities (resources) The BNDES does not relyexclusively on forced savings for competitive advantage Instead market-oriented policies
joint-ventures with private mutual funds investment funds private equity firms large blocksof shareholding in Brazilian firms and massive amounts of credit and investment to theprivate sector at below market but still profitable long term interest rates of 625 percent
suggest that the large scale and scope of BNDES operations provide institutional foundationsof competitive advantage over private and foreign banks
8132019 Government Banking and BRICs in the Recent Financial Crisis
httpslidepdfcomreaderfullgovernment-banking-and-brics-in-the-recent-financial-crisis 3457
983106983122983113983107 983111983151983158983141983154983150983149983141983150983156 983106983137983150983147983155 983137983150983140 983110983145983150983137983150983139983145983137983148 983123983156983137983156983141983139983154983137983142983156
34
Capitalization of the BNDES by Treasury of over R$2300 billion 2009-11hascaptured attention of many observers of Brazilian development Critics and advocates agreethat the BNDES has realized significant competitive advantages over private and foreignbanks and continues to serve as significant alternative to capital markets for large scaledevelopment projects However like the downturn in planned investments by Petrobras for
oil and gas exploration and production BNDES decreased planned investments fromR$1684 billion in 2010 to R$1397 billion in 2011 We believe this indicates the limits ofmanagement and passing of period of crisis both favoring finance from capital marketsbanks and public-private partnerships
India
Analysis of Brazilian federal banks suggests that these institutions provided policy alternativewhile realizing competitive advantage over private and foreign banks The modernization ofthese institutions helps explain why these large institutions were able to stay the effects ofcredit crunch and financial market downturn in Brazil This section explores data from the
Reserve Bank of India to compare market shares of types of banks from 1972-2008 and bankperformance from 2006-10 Further analysis will be required However the data appears tosupport our core argument that government banks have modernized and realized competitiveadvantages over private and foreign banks
First the number of branch offices which serves as a measure of institutionalcoverage across India of special concern for financial inclusion and the theory thatliberalization and privatizations would lead private banks to expand branch offices andincrease the supply of services From this perspective the trajectory of branch officessuggests that nationalized banks the State Bank of India and regional rural bankssustain much larger networks of branch offices that predominate while otherscheduled commercial (private and foreign) banks retain less than 8000 branch offices
Data from the Reserve Bank of India on the number of current accounts retainedby type of bank provide further evidence that the State Bank of India and its associates
8132019 Government Banking and BRICs in the Recent Financial Crisis
httpslidepdfcomreaderfullgovernment-banking-and-brics-in-the-recent-financial-crisis 3557
983106983122983113983107 983111983151983158983141983154983150983149983141983150983156 983106983137983150983147983155 983137983150983140 983110983145983150983137983150983139983145983137983148 983123983156983137983156983141983139983154983137983142983156
35
national banks and regional rural banks provide the bulk of banking accounts to theIndian population while private and foreign banks cherry pick upscale urban marketsreproducing capital drain and inequalities
Number of Current Accounts by Type of Bank 1972-1995
Since 1999 the pattern of predominance by alternative banking institutions and the minorrole of other scheduled commercial banks and foreign banks continues
The following figures report the value held in current accounts by type of banks first fromthe 1972-1995 period then from the 1999-2008 period For both time periods the trendconfirms that private and foreign banks remain at a competitive disadvantage in terms of thebroader market while the State Bank of India and its associates nationalized banks andregional rural banks tend to predominate
8132019 Government Banking and BRICs in the Recent Financial Crisis
httpslidepdfcomreaderfullgovernment-banking-and-brics-in-the-recent-financial-crisis 3657
983106983122983113983107 983111983151983158983141983154983150983149983141983150983156 983106983137983150983147983155 983137983150983140 983110983145983150983137983150983139983145983137983148 983123983156983137983156983141983139983154983137983142983156
36
Current Account Value by Type of Bank 1972-1995 R
Number of Deposit Accounts by type of bank 1999-2008
A similar pattern appears for the trajectory of savings accounts both the number of
accounts and the value held in savings accounts both for the 1972-1995 period We wereunable to organize data from the more recent period
8132019 Government Banking and BRICs in the Recent Financial Crisis
httpslidepdfcomreaderfullgovernment-banking-and-brics-in-the-recent-financial-crisis 3757
983106983122983113983107 983111983151983158983141983154983150983149983141983150983156 983106983137983150983147983155 983137983150983140 983110983145983150983137983150983139983145983137983148 983123983156983137983156983141983139983154983137983142983156
37
Number of Savings Accounts by Type of Bank 1972-1995
Value in Savings Accounts by Type of Bank 1972-1995
Number of Term Savings Accounts by Type of Bank 1972-1995
8132019 Government Banking and BRICs in the Recent Financial Crisis
httpslidepdfcomreaderfullgovernment-banking-and-brics-in-the-recent-financial-crisis 3857
983106983122983113983107 983111983151983158983141983154983150983149983141983150983156 983106983137983150983147983155 983137983150983140 983110983145983150983137983150983139983145983137983148 983123983156983137983156983141983139983154983137983142983156
38
Value in Term Savings Accounts by Type of Bank 1972-1995
The number and value of credits extended by banks from 1999-2008 appears mostpromising in terms of comparative analysis of bank performance and behavior Thesignificant spread at the end of the time series between the State Bank of India and itsassociates and foreign banks suggests the impact of foreign financial crisis and differentdomestic policies by these types of banks in India similar to that noted in the Brazilianexperience
Number of credits by type of bank 1999-2008
Value of credit by type of bank 1996-2008
8132019 Government Banking and BRICs in the Recent Financial Crisis
httpslidepdfcomreaderfullgovernment-banking-and-brics-in-the-recent-financial-crisis 3957
983106983122983113983107 983111983151983158983141983154983150983149983141983150983156 983106983137983150983147983155 983137983150983140 983110983145983150983137983150983139983145983137983148 983123983156983137983156983141983139983154983137983142983156
39
Further data from the Reserve Bank of India from 2008-10 permit closercomparison of government private and foreign banks in the recent financial crisis Interms of deposits investments total assets and net profits the dominant and expandingrole of government banking in India is apparent Further control variables (not reported)
include gross and net NPA types of income expenses and expenditures provisions andcontingencies and credit- and investment-deposit ratios provide control for bad bankingand confirm the counter cyclical policies during 2008-10 in India
THE FOLLOWING TABLES REQUIRE INTERPRETATION
Number of Banks 2006-7 2007-8 2008-9 2009-10 2010-11
State Bank of India amp Associates 8 8 7 7 6Nationalized Banks 20 20 20 20 20Old Private Sector Banks 17 15 15 15 14
New Private Sector Banks 8 8 7 7 7Foreign Banks 29 28 31 32 33Source RBI A Profile of Banks 2010-11
Number of Branch Offices 2006-7 2007-8 2008-9 2009-10 2010-11
State Bank of India amp Associates 14673 15848 16894 18178 18772Nationalized Banks 37435 39255 40956 43452 45640Old Private Sector Banks 4723 4690 4908 5220 5011New Private Sector Banks 2599 3635 4333 5232 6957
Foreign Banks 272 277 295 308 316Source RBI A Profile of Banks 2010-11
Number of Employees 2006-7 2007-8 2008-9 2009-10 2010-11
State Bank of India amp Associates 255699 249008 268598 266605 282453Nationalized Banks 473179 466400 462926 473041 475082Old Private Sector Banks 47994 48700 51341 55052 55075New Private Sector Banks 91060 110123 124998 127468 163604Foreign Banks 28426 31301 29582 28012 27968
Source RBI - India BanksAssociation
Business per employee (in lakh) 2006-7 2007-8 2008-9 2009-10 2010-11
State Bank of India amp Associates 43635 54922 65022 73743 79306Nationalized Banks 49001 61828 78316 93586 114477Old Private Sector Banks 48159 56932 63843 69749 8149New Private Sector Banks 80782 83196 78715 84041 82607Foreign Banks 97477 11255 128274 141139 155974Note Business = Deposits + Advances
8132019 Government Banking and BRICs in the Recent Financial Crisis
httpslidepdfcomreaderfullgovernment-banking-and-brics-in-the-recent-financial-crisis 4057
983106983122983113983107 983111983151983158983141983154983150983149983141983150983156 983106983137983150983147983155 983137983150983140 983110983145983150983137983150983139983145983137983148 983123983156983137983156983141983139983154983137983142983156
40
Profit per employee (in lakh) 2006-7 2007-8 2008-9 2009-10 2010-11
State Bank of India amp Associates 257 362 443 466 42Nationalized Banks 287 377 486 567 695Old Private Sector Banks 234 406 469 42 563New Private Sector Banks 587 685 677 847 893Foreign Banks 1613 2112 2539 1692 2759
Capital amp Reserves amp Surplus(Ycrore) 2006-7 2007-8 2008-9 2009-10 2010-11
State Bank of India amp Associates 42941 61706 72422 83726 84394Nationalized Banks 92689 113079 135920 157276 205857Old Private Sector Banks 10736 15315 17477 20171 23821New Private Sector Banks 39736 76056 82192 99813 114768Foreign Banks 33075 49332 59937 69176 80972
Deposits Ycrore 2006-7 2007-8 2008-9 2009-10 2010-11
State Bank of India amp Associates 633476 773875 1007041 1108086 1245862Nationalized Banks 1360724 1679993 2105706 2583934 3127122Old Private Sector Banks 138249 165589 199274 229897 264157New Private Sector Banks 413738 509444 537104 592904 738602Foreign Banks 150750 191161 214076 232099 240689
Investments Ycrore 2006-7 2007-8 2008-9 2009-10 2010-11
State Bank of India amp Associates 211875 263823 357624 387473 385697Nationalized Banks 452981 536018 655042 828125 942837Old Private Sector Banks 43647 54080 72393 83499 92617New Private Sector Banks 171008 224498 234139 270618 329403Foreign Banks 71471 98910 130354 159291 165499
Advances Ycrore 2006-7 2007-8 2008-9 2009-10 2010-11
State Bank of India amp Associates 482270 593722 739450 857937 994154Nationalized Banks 957877 1203678 1519762 1843082 2311478
Old Private Sector Banks 92887 111670 128504 154085 184647New Private Sector Banks 321865 406733 446824 478356 612886Foreign Banks 126339 161133 165385 163260 195539
Interest Income Ycrore 2006-7 2007-8 2008-9 2009-10 2010-11
State Bank of India amp Associates 53465 70428 89196 97954 109828Nationalized Banks 110720 142647 183892 208029 256490Old Private Sector Banks 11474 14614 18790 20497 23299New Private Sector Banks 38092 56377 66282 62309 73528
Foreign Banks 17924 24417 30322 26390 28520
8132019 Government Banking and BRICs in the Recent Financial Crisis
httpslidepdfcomreaderfullgovernment-banking-and-brics-in-the-recent-financial-crisis 4157
983106983122983113983107 983111983151983158983141983154983150983149983141983150983156 983106983137983150983147983155 983137983150983140 983110983145983150983137983150983139983145983137983148 983123983156983137983156983141983139983154983137983142983156
41
Other Income Ycrore 2006-7 2007-8 2008-9 2009-10 2010-11
State Bank of India amp Associates 9420 11818 16073 18394 19240Nationalized Banks 14264 20979 26394 30500 28625Old Private Sector Banks 1568 2184 2782 3152 3029
New Private Sector Banks 10745 14822 15078 17271 17697Foreign Banks 7044 10588 14894 9951 10972
Interest Expended Ycrore 2006-7 2007-8 2008-9 2009-10 2010-11
State Bank of India amp Associates 32607 47809 61770 66229 67018Nationalized Banks 69353 101093 131676 145712 164135Old Private Sector Banks 7055 9960 12834 14076 14768New Private Sector Banks 25802 38535 44123 37130 42347Foreign Banks 7603 10604 12819 8938 10622
Operating Expenses Ycrore 2006-7 2007-8 2008-9 2009-10 2010-11
State Bank of India amp Associates 15987 16993 20088 25283 29146Nationalized Banks 27268 29670 35416 40792 53819Old Private Sector Banks 2967 3235 3939 4715 5600New Private Sector Banks 12353 17032 17840 18136 22006Foreign Banks 7745 10353 12298 11102 12557
Cost of Funds 2006-7 2007-8 2008-9 2009-10 2010-11
State Bank of India amp Associates 475 59 594 532 48Nationalized Banks 48 582 609 537 493Old Private Sector Banks 498 62 667 613 55New Private Sector Banks 524 611 604 442 427Foreign Banks 403 433 446 283 311Cost of Funds = Ratio () of interest paid on deposits and borrowings to averageof opening and closing balances of deposits and borrowings
Return on advances adjusted toCoF 2006-7 2007-8 2008-9 2009-10 2010-11
State Bank of India amp Associates 372 365 395 36 405Nationalized Banks 399 369 409 382 427Old Private Sector Banks 406 426 515 482 492New Private Sector Banks 447 505 526 514 516Foreign Banks 574 66 815 716 564
2006-7 2007-8 2008-9 2009-10 2010-11
8132019 Government Banking and BRICs in the Recent Financial Crisis
httpslidepdfcomreaderfullgovernment-banking-and-brics-in-the-recent-financial-crisis 4257
983106983122983113983107 983111983151983158983141983154983150983149983141983150983156 983106983137983150983147983155 983137983150983140 983110983145983150983137983150983139983145983137983148 983123983156983137983156983141983139983154983137983142983156
42
Wages as of Total Expenses
State Bank of India amp Associates 2155 1589 1506 171 1921Nationalized Banks 1794 1405 1331 1365 1641Old Private Sector Banks 1689 1367 1326 1457 1675
New Private Sector Banks 936 956 1017 121 1383Foreign Banks 2008 1995 1944 2348 2331
Returns on Assets 2006-7 2007-8 2008-9 2009-10 2010-11
State Bank of India amp Associates 086 097 102 091 079Nationalized Banks 094 101 103 100 103Old Private Sector Banks 078 114 115 095 112New Private Sector Banks 109 113 112 138 151Foreign Banks 228 209 199 126 174
Capital Adequacy Ratio 2006-7 2007-8 2008-9 2009-10 2010-11
State Bank of India amp Associates 1232 1321 1396 1346 1225Nationalized Banks 1237 1213 1324 1318 1347Old Private Sector Banks 1208 1408 1476 1485 1456New Private Sector Banks 1199 1439 1533 1803 1687Foreign Banks 1239 1305 1432 1726 1672Note To 2007-8 = Basel I From 2008-09 = Basel-II
Net NPA Ratio 2006-7 2007-8 2008-9 2009-10 2010-11
State Bank of India amp Associates 132 143 147 150 149Nationalized Banks 094 077 068 091 092Old Private Sector Banks 096 066 09 082 053New Private Sector Banks 097 109 129 103 056Foreign Banks 073 077 181 182 067Net NPA Ratio = Net non-performing assets as net advances
In sum descriptive data from the Reserve Bank of India confirm the anomaly
and argument drawn from the Brazilian experience An important dimension of BRICcountry recovery from the global financial crisis and downturn is the counter cyclicallending policies and realization of competitive advantages of government banks Thisposes a series of new questions for business schools and scholars of public policyInstead of liberalization and privatization leading to transitions in BRIC countriestoward capital market centered financial systems and liberal market economies publicbanks have realized competitive advantages over private and foreign banks whileproviding policy alternatives to BRIC governments in the face of financial crisis andglobal economic slowdown We return to these implications in the conclusion
One development of note at the Reserve Bank of India is a policy focus onfinancial inclusion The 2008 report of the Committee on Financial Inclusion has beenfollowed by sections of the Reserve Bank of India Annual Report reserved fordiscussion of financial inclusion And instead of focusing on liberalization and
8132019 Government Banking and BRICs in the Recent Financial Crisis
httpslidepdfcomreaderfullgovernment-banking-and-brics-in-the-recent-financial-crisis 4357
983106983122983113983107 983111983151983158983141983154983150983149983141983150983156 983106983137983150983147983155 983137983150983140 983110983145983150983137983150983139983145983137983148 983123983156983137983156983141983139983154983137983142983156
43
privatization to ensure the spread of banking products and services alternative policieshave been explored One is of special note The Committee on Financial Inclusionrecommended issue of identity cards as bank cards This would profoundly change thelandscape of banking in India and has attracted attention from analysts at the CentralBank of Brazil charged with financial inclusion as well as the President of Indonesia
and apparently Uganda officials Given the revolution in information and card paymenttechnologies this policy proposal and pilot studies deserve close attention asalternatives to dramatically increase the pace of social inclusion of the bankless
8132019 Government Banking and BRICs in the Recent Financial Crisis
httpslidepdfcomreaderfullgovernment-banking-and-brics-in-the-recent-financial-crisis 4457
983106983122983113983107 983111983151983158983141983154983150983149983141983150983156 983106983137983150983147983155 983137983150983140 983110983145983150983137983150983139983145983137983148 983123983156983137983156983141983139983154983137983142983156
44
China
This section turns to a brief review of the Chinese banking sector to further explore therole of government banks in terms of their modernization competitive advantages
policy roles and capacity for counter cyclical credit that help explain why BRICcountries were able to avert the severe consequences of the global financial crisis
First figure A11 reports the basic structure of the banking system in China
Although we have been unable to compare the evolution of types of banks acrosstime in similar ways to the above data on India taken from the Reserve Bank of Indiaour research assistants have gathered the following comparative macroeconomicfinancial and balance sheet data on banking in China The data appear to be consistentwith the core argument presented in this paper ndash that government banks havemodernized since liberalization and provided policy makers with alternative means tocounter the effects of financial crisis abroad
8132019 Government Banking and BRICs in the Recent Financial Crisis
httpslidepdfcomreaderfullgovernment-banking-and-brics-in-the-recent-financial-crisis 4557
983106983122983113983107 983111983151983158983141983154983150983149983141983150983156 983106983137983150983147983155 983137983150983140 983110983145983150983137983150983139983145983137983148 983123983156983137983156983141983139983154983137983142983156
45
We lack more current information and were unable to collect data directly fromofficial sources in China to compare the trajectory of state owned private and foreignbanks As a substitute Figure 1 reports data from 2000-4 that permits initial observationof trends for this earlier period
Those present may not need reminding of the formidable record of economicgrowth in China during this 200-4 period that continues until today However data fromthe National Bureau of Statistics suggests that the Chinese banking system expanded atan even greater pace than the remarkable levels of GDP growth recorded for the 2000-4period Furthermore credit expansion was ldquoorganicrdquo in the sense that deposits
outpaced credit growth from 2000-4
Expansion of Loans in China 1999-2004
Loan Growth Total LoansYear on Year
Growth Total Depositssup1Year on Year
GrowthYear CNY billion CNY () CNY billion CNY()1999 9373 83 10878 1372000 9937 60 1238 1382001 11231 130 14362 1602002 13129 169 17092 1902003 159 211 20806 217
2004 18857 186 25319 217
sup1Based on preliminary estimates by the National Bureau of Statistics of the Peoplersquos Republic of ChinaSource National Bureau of Statistics of the PRC
Although we lack data comparable to that from the Reserve Bank of India ableto compare the trajectory of state private and foreign banks in China the sectoralbreakdown of loans and other banking and national account data confirms the profoundcapitalization of the Chinese banking system and GDP growth during from 1995-2004
8132019 Government Banking and BRICs in the Recent Financial Crisis
httpslidepdfcomreaderfullgovernment-banking-and-brics-in-the-recent-financial-crisis 4657
983106983122983113983107 983111983151983158983141983154983150983149983141983150983156 983106983137983150983147983155 983137983150983140 983110983145983150983137983150983139983145983137983148 983123983156983137983156983141983139983154983137983142983156
46
China Banking Sector Market Dimensions (1995 - 2004)
YearTotal
LoansCorp
LoansConsuLoans
HomeLoans
TotalDeposits Excess
GovBonds
CorpBonds GDP
GDPGrowth
()1995 52310 mdash mdash mdash 5376 145 330 65 5848 2511996 63100 mdash mdash mdash 6847 538 436 60 6788 1611997 73585 7341 17 130 8212 853 551 52 7446 971998 85002 8447 53 430 9529 102 9 777 68 7835 521999 95587 9394 164 1360 10831 1273 1054 78 8207 482000 108763 10453 424 3320 13486 261 1302 86 894 892001 118990 112 699 5600 15472 3573 1562 101 9593 732002 139800 12913 1067 8258 18339 4359 mdash mdash 10479 922003 169770 15401 1576 13302 22036 5059 mdash mdash 11669 1142004 194220 16848 1988 15800 25319 5897 mdash mdash 13657 170Figures = CNYB
This data reported in terms of percent GDP provides further clarity on the rapid
capitalization of loans It is of note that the bulk of loans during this period were to thecorporate sector with consumer and home loans lagging significantly
China Banking Sector Percent GDP
YEARTotal
LoansCorporate
LoansConsumer
LoansHomeLoans Deposits
ExcessDeposits
GovBonds
CorpBonds
1995 895 00 00 00 919 25 56 111996 929 00 00 00 1009 79 64 091997 988 986 02 02 1103 115 74 071998 1085 1078 07 05 1216 131 99 091999 1165 1145 20 17 1320 155 128 092000 1217 1169 47 37 1508 292 146 102001 1240 1167 73 58 1613 372 163 112002 1334 1232 102 79 1750 4162003 1455 1320 135 114 1888 4342004 1422 1234 146 116 1854 432
Sources China Banking Regulatory Commission Peoplersquos Bank of China and GoldmanSachs research estimates
Compilation of financial data from a select number of banks in China suggeststhat the pattern of bank change encountered in Brazil and India also describes theexperience of China The liberalization of the Chinese economy and the modernization
of state banks appear to describe the process of bank change instead of a process oftransition toward private banking and capital market centered financial systemAlthough we have been unable to draw data from Chinese monetary authorities thebalance sheet data suggests the clear predominance of large state banks in the politicaleconomy of banking and finance in China How these institutions were used to counterthe effects of financial crisis abroad and redirect domestic investment production andconsumption must remain a subject for further research
8132019 Government Banking and BRICs in the Recent Financial Crisis
httpslidepdfcomreaderfullgovernment-banking-and-brics-in-the-recent-financial-crisis 4757
983106983122983113983107 983111983151983158983141983154983150983149983141983150983156 983106983137983150983147983155 983137983150983140 983110983145983150983137983150983139983145983137983148 983123983156983137983156983141983139983154983137983142983156
47
Select Financial Data from Chinese Banks 2004()
CNY (billion)Total
AssetsGrossLoans
CustomerDeposits Equity
NPLRatio
()
Pre-prov
ProfitsNet
Profits
State Banks
ICBC 5671 3705 5105 163 190 653 23CCB 3905 2226 3489 195 39 605 484ABC (NA) mdashBOC 427 2146 3342 205 51 578 209Quasi-State
BoCom 1145 639 1023 54 30 131 16CMB 587 376 513 22 29 82 32CITIC Industrial 515 306 429 20 60 52 03SPDB 456 311 397 14 24 62 20China Everbright mdashGuangdong Development 345 216 301 mdash mdash mdash 32
Industrial Bank 341 203 283 10 25 37 11Quase-Private
Bank of Shanghai 216 106 179 83 51 32 26Hua Xia 304 181 270 92 40 29 10Shenzhen Development 198 126 166 43 114 28 03Bank of Beijing 209 85 174 71 mdash 26 07
Sector total 19422 25319 129Three state-banks 2692 3979 188Second tier banks 2549 3733 148
ABC = Agriculture Bank of China BOC = Bank of China
BOCOM = Bank of Communications CCB = China Construction BankCMB = China Merchantrsquos Bank CNY = yuanICBC = Industrial and Commercial Bank of ChinaNPL = nonperforming loanROA = return on assets ROE = return on equityprov = provisioningPRC = Peoplersquos Republic of ChinaSPDB = Shanghai Pudong Development BankNote Loan and deposit market share for BOC and ICBC are for their domestic operations onlySources Company data Goldman Sachs research estimates
Returns on Assets Equity and Domestic Market Shares of Major China Banks 2004()
CNY (billion) ROA () ROE ()Deposit Mkt
Share ()Loan MktShare ()
Mortgage MktShare()
State Banks
ICBC 004 14 199 187 253CCB 130 254 138 115 217ABC (NA)BOC 051 102 101 89 152Quasi-State
BoCom 015 45 37 29 34CMB 060 161 20 19 29
CITIC Industrial 007 17 17 16 18SPDB 048 153 16 16 26
8132019 Government Banking and BRICs in the Recent Financial Crisis
httpslidepdfcomreaderfullgovernment-banking-and-brics-in-the-recent-financial-crisis 4857
983106983122983113983107 983111983151983158983141983154983150983149983141983150983156 983106983137983150983147983155 983137983150983140 983110983145983150983137983150983139983145983137983148 983123983156983137983156983141983139983154983137983142983156
48
China EverbrightGuangdong Development mdash mdash 12 11 mdashIndustrial Bank 037 126 11 10 10Quase-Private
Bank of Shanghai 129 360 07 05 14Hua Xia 038 116 11 09 07Shenzhen Development 017 75 07 06 08Bank of Beijing 037 108 07 04 07
Sector totalThree state-banks 438 391 622Second tier banks 144 127 154
ABC = Agriculture Bank of China BOC = Bank of China BOCOM = Bank of Communications CCB =China Construction Bank CMB = China Merchantrsquos Bank CNY = yuanICBC = Industrial and Commercial Bank of China mkt = market NPL = nonperforming loan ROA =return on asset ROE = return on equity prov = provisioning PRC =Peoplersquos Republic of China SPDB = Shanghai Pudong Development BankNote Loan and deposit market share for BOC and ICBC are for their domestic operations onlySources Company data Goldman Sachs research estimates
Further data from 2006-10 from the Peoples Bank of China suggests that the big5 state banks continue to outperform the next 12 largest joint stock commercial banksThe big five have launched sales of shares to capitalize while listing on capital marketsand adopting reporting of financial data along lines of international standards Thisappears to be similar to Banco do Brasil policies that retain majority of shares in federalgovernment control while capitalizing the bank through issues of stock
Comparing the Performance of Big 5 State Banks and Next 12 Joint Stock CommercialBanks in China
2006 2007 2008 2009 2010
Profit Margin Big 5 State Banks 3116 3143 2586 3026 3269
Next 12 JS Commercial Banks 2050 2791 1796 2159 2365
Returns Big 5 State Banks 507 606 860 691 675(risk adj) Next 12 JS Commercial Banks 459 570 1016 714 723
Op Risk Big 5 State Banks 5548 5539 5215 5319 5322Next 12 JS Commercial Banks 5886 5721 5725 5831 5947
Leverage Big 5 State Banks 1626 1482 1724 173 1734Next 12 JS Commercial Banks 2826 2251 2064 2048 1936
ROE Big 5 State Banks 1424 1557 1999 1925 2037Next 12 JS Commercial Banks 1564 2049 2156 1840 1967
Big 4 and 11 JSCBsSource Peoples Bank of China China Financial Stability Reports 2007-11
Performance indicators reported by the Peoples Bank of China for the big 5 statebanks and 12 next largest joint stock commercial banks also suggest that the largestgovernment banks in China retain significant competitive advantages ndash and may providepolicy alternatives Given the current shift of economic policy in China away fromindustry and export led growth to more sustainable domestic oriented growth and socialinclusion the role of state banks clearly comes to the fore
8132019 Government Banking and BRICs in the Recent Financial Crisis
httpslidepdfcomreaderfullgovernment-banking-and-brics-in-the-recent-financial-crisis 4957
983106983122983113983107 983111983151983158983141983154983150983149983141983150983156 983106983137983150983147983155 983137983150983140 983110983145983150983137983150983139983145983137983148 983123983156983137983156983141983139983154983137983142983156
49
Net Operating Income of Big 5 State Banks and Next 12 CommercialBanks 100 million RMB YuanBig 5 State Banks 2006 2007 2008 2009 2010
Balance Net interest income 349703 500456 556790 532206 720152Net fee amp commission inc 48524 103817 138464 175469 232491
Investment income 216089 283725 338865 324037 340440
Other business income (1807) (17054) 47548 33791 2186
Net operating income 612509 870944 1081667 1065503 1314943
Percent Net interest income 5709 5746 5148 4995 5477
Net fee amp commission inc 792 1192 1280 1646 1768
Investment income 3528 3258 3133 3041 2589
Other business income (030) (196) 440 318 166
Net operating income 10000 10000 10000 100 100
Next 12 Joint Stock CommercialBanks 2006 2007 2008 2009 2010
Net interest income 87253 132945 198965 191276 281588
Net fee amp commission inc 7850 16247 27319 30115 42023
Investment income 20959 32172 44864 50767 50500
Other business income 2306 4498 16359 10384 7400
Net operating income 118468 185861 287507 282542 381511
Percent Net interest income 7365 7153 6920 6769 7381
Net fee amp commission inc 671 874 950 1066 1101
Investment income 1769 1731 1560 1797 1324
Other business income 195 242 569 368 194Net operating income 10000 10000 10000 10000 10000
Source Peoples Bank of China China Financial Stability Reports 2007-11
Big 4 and 11 JSCBsBig 5 = ICBC ABC BOC CCB BOCOMNext 12 Joint Stock Commercial Banks = China CITIC Bank Everbright Bank Huaxia BankGuangdong Development Bank Shenzhen Development Bank China Merchants Bank Shanghai PudongDevelopment Bank Industrial Bank China Minsheng Banking Corporation Evergrowing Bank ChinaZheshang Bank Bohai Bank
In conclusion bank change in China also appears to confirm our findings from
Brazil ndash that state banks have realized competitive advantages and increased marketshares since liberalization while providing counter cyclical credit to ameliorateadjustment to crisis The modernization of the China Postal Savings Bank is ofparticular interest given its social mission downmarket focus and 40000 branchOffices throughout the country Expansion of card payment services through the postalbank system confirms the importance of the Brazilian federal savings bank (CaixaEconocircmica Federal Caixa) as agent for federal government social policy and agentresponsible for management of citizenship cards (12 million) and payment of familygrants This back to the future modernization of savings banks has proved essential forovercoming notorious levels of social exclusion and inequality in Brazil Althoughenglish language materials are unavailable on the China Postal Savings Bank thisinstitution clearly presents profound opportunities for comparable policies in China
8132019 Government Banking and BRICs in the Recent Financial Crisis
httpslidepdfcomreaderfullgovernment-banking-and-brics-in-the-recent-financial-crisis 5057
983106983122983113983107 983111983151983158983141983154983150983149983141983150983156 983106983137983150983147983155 983137983150983140 983110983145983150983137983150983139983145983137983148 983123983156983137983156983141983139983154983137983142983156
50
Reported offer of microfinance services for poverty reduction as part of nationaleconomic stimulous plan may point to developments in this direction
Given that state planning capacity has long been at the center of attention intheories of financial statecraft the role of Chinese state banks in redirecting policiesaccording to the 12th 5 Year plan for 2011-15 seems critical From 2000-5 the 10th 5
Year plan emphasized infrastructure and the attraction of investment and labor skillsThe 11th 5 Year plan (2006-10) raised concerns about sustainability rather than growthlevels while also seeking to spread improvements to balance development better servepeople and improve the quality of life continue to support Center and West provincesand revitalize Northeast provinces In comparison the 12th 5 Year plan calls for morebalanced lsquoinclusiversquo growth and structural adjustemts more than 4 trillion RMB($US600 billion) for targeted industries and interior regions a focus on new energynew materials and information and high technologies biology and new medicineenergy converstaion and environmental protection aerospace marine and advancedmanufacturing This implies fundamental shifts away from industry to services that hasbeen reported in macroeconomic data for 2010 If past studies emphasized directed
credit and industrial change the role of Chinese state banks in realizing transformationscertainly warrants study
Although the domestic flow of funds process of liberalization (or the lackthereof) and insertion of banking into Chinese political economy is beyond the scope ofthis paper our findings from Brazil appear to provide valuable hypotheses about ChinaThat is to say the big state banks and other government banks in China remaincommanding heights not in the Marxist sense of providing means to reach socialismbut immense institutions with profound presence throughout politics and markets in thecountry In this sense our findings from Brazil appear to approximate patterns ofchange in China more than Washington Consensus expectations about liberalization andprivatizations to free private and foreign banks Financial statecraft draws attention tothe capitalization of Chinese state banks through stock Sales and listings on capitalmarkets However like the Banco do Brasil (that reformers in the 1990s sought to shiftcontrol to the private sector only to increase federal government shareholding) theChinese experience surely involves unexpected consequences and patterns of changedifferent than a linear transition to the Berle amp Means paradigm of corporategovernance
Russia The New State Duopoly
ldquoThe rush of 2003-8 increased the market share of foreign banks to 285 from
52 However the state-owned banks received enormous help from the federal budget in the days of the crisis thereby strengthening their dominant
position on the Russian financial market says Sergey Aleksashenko the formerDeputy chairman of Russias Central Bank quotes Russia Profile Today one
must not harbor any illusion of a fair competition with them all the main cash
flows in Russia are controlled by state-owned banks httpwwwbarentsnovacomnode1031
Description of banking policy in Russia during the global financial crisis can beobtained from Bank of Russia annual reports and related publications The figure on the
following page summarizes the financial flows to and from the Bank of RussiaAlthough central bank policy is beyond the scope of this study the role of state banks in
8132019 Government Banking and BRICs in the Recent Financial Crisis
httpslidepdfcomreaderfullgovernment-banking-and-brics-in-the-recent-financial-crisis 5157
983106983122983113983107 983111983151983158983141983154983150983149983141983150983156 983106983137983150983147983155 983137983150983140 983110983145983150983137983150983139983145983137983148 983123983156983137983156983141983139983154983137983142983156
51
channeling counter-cyclical credits released by the Bank of Russia appear to confirm thecore argument that emerges from our studies of the Brazilian banking system Furtherdata on the following pages also suggest that state banks in Russia performed wellduring 2008-10 confirming on the basis of sparse data taken from Bank of Russiareports and documents that public banks have modernized provided counter-cyclical
credit to reverse credit crunch and economic downturn while realizing competitiveadvantages over private and foreign banks
8132019 Government Banking and BRICs in the Recent Financial Crisis
httpslidepdfcomreaderfullgovernment-banking-and-brics-in-the-recent-financial-crisis 5257
983106983122983113983107 983111983151983158983141983154983150983149983141983150983156 983106983137983150983147983155 983137983150983140 983110983145983150983137983150983139983145983137983148 983123983156983137983156983141983139983154983137983142983156
52
The following aggregate figures reported by the Bank of Russia suggest severaltrends of significance First Chart 32 suggests that household deposits shifted fromRuble deposits to foreign currency pegged (or indexed) during 2008 Second Chart 33illustrates the substantial increase of non-bank overdue debt during second semester
2008
Consequently the financial results and profitability of banks declinedsignificantly during 2008 The greater confidence in deposits with government banksfound abroad suggests that this may have been critical in Russia
Performance data deom 2008-10 provides a clearer picture one that is consistentwith our findings in Brazil State banks appear to have outperformed all other types of
banks except medium and small regional banks The following table reports the averagereturns on assets and returns on equity reported by the Bank of Russia 2008-10
Returns on Assets and Equity by Type of Bank in Russia 2008-9
Return on assets Return on equity 2008 2009 2010 2008 2009 2010
-------------------------------------------------------------------------------------------------------------------State Banks 22 08 24 157 46 148Foreign Banks 18 11 21 146 83 145Large private banks 13 03 11 106 28 84Medium-Small Banks Moscow 15 12 14 68 52 67
Medium-Small Regional Banks 21 12 15 131 65 98--------------------------------------------------------------------------------------------------------------------Source Bank of Russia Bank Supervision Reports 2009 and 2010
8132019 Government Banking and BRICs in the Recent Financial Crisis
httpslidepdfcomreaderfullgovernment-banking-and-brics-in-the-recent-financial-crisis 5357
983106983122983113983107 983111983151983158983141983154983150983149983141983150983156 983106983137983150983147983155 983137983150983140 983110983145983150983137983150983139983145983137983148 983123983156983137983156983141983139983154983137983142983156
53
Further data from the Bank of Russia on the capital adequacy of Banks during2009-10 suggest that foreign banks and large private banks remain less capitalizedagainst risks according to Basel II guidelines albeit at levels almost double thatrecommended by the Bank for International Settlements (80 risk weighted) Although
further analysis is needed this data is consistent from that reported in Brazil thatgovernment banks tend to more cautious and more prudent in terms of placing asidehigher levels of reserves and patrimony against possible losses
Capital Adequacy of Banks by Type of Bank in Russia 2009-10
2009 2010 2011---------------------------------------------------------------------------------------------------------State Banks 184 227 186Foreign Banks 155 196 195Large Private Banks 140 181 155
Medium-Small Banks Moscow 316 312 268Medium-Small Regional Banks 219 241 207Non-Bank Credit Institutions 372 1038 678---------------------------------------------------------------------------------------------------------Source Bank of Russia Bank Supervision Report (Moscow) 2009 p 43
Finally Bank of Russia bank supervision reports also suggest that state banksexpanded their market shares of assets and capital during the years following the globalfinancial crisis While large private banks and foreign banks lost market share of bankassets and bank capital in Russia state banks increased their significant market sharefrom 405 ndash 426 percent and 471-476 percent of assets and capital respectivelyUnfortunately data from previous years and for specific banking groups was notobtained However this data does appear to indicate that our findings of competitiveadvantages and policy alternatives
Number and Market Share by Type of Bank
N Banks Assets Capital---------------------------- ---------------------------- ----------------------------
Type of Bank 2009 2010 2011 2009 2010 2011 2009 2010 2011-------------------------------------------------------------------------------------------------------------------------------State 17 22 27 405 439 458 471 489 473
Foreign 101 106 108 187 183 180 172 169 191Large Private 136 139 131 346 333 305 276 287 269Med-Small Moscow 361 335 317 27 26 26 43 34 35Medi-Small Regional 443 412 372 28 28 27 36 31 29Other Credit Institutions 50 51 57 07 04 04 01 02 03Total 1108 1058 100 100 100 100 100 100-------------------------------------------------------------------------------------------------------------------------------Source Bank of Russia Bank Supervision Report 2009 amp 2010
In sum politics and financial statecraft have led to the realization of significantcompetitive advantage by Russian state banks Sperbank and Vneshtorgbank increasedtheir share of bank assets from 32 percent in 2005 to over 50 percent by 2011 through
mergers and acquisitions and aggressive displacement of foreign banks Whatever thepolitics data from the Bank of Russia suggests that monetary authorities released a
8132019 Government Banking and BRICs in the Recent Financial Crisis
httpslidepdfcomreaderfullgovernment-banking-and-brics-in-the-recent-financial-crisis 5457
983106983122983113983107 983111983151983158983141983154983150983149983141983150983156 983106983137983150983147983155 983137983150983140 983110983145983150983137983150983139983145983137983148 983123983156983137983156983141983139983154983137983142983156
54
series of counter cyclical credit injections during 2008-9 to domestic bankinginstitutions Moreover data suggests that state banks continue to perform at or ahead oflevels reported by regional private and foreign banks The large market share andimproved performance of state banks reported in recent data suggests although the datais sparse that government banks in Russia have also modernized realized competitive
advantages and provided policy alternatives against the impact of financial crisisabroadWe were unable to find evidence of policy making toward social inclusion at the
Bank of Russia or Russian state banks despite the historical trajectory of the Sberbankas a savings bank under communism The context also appears to differ considerably Asurvey of the Zircon Research Group reportedly found that only 15 percent of Russiansretain bank accounts because of mistrust in banks and government This combination ofrealist politics and the realization of competitive advantages by Russian state bankssuggests that theories of economic statecraft in the realist tradition may indeed explainthe domestic developments under study
Conclusion
This paper reports evidence about government bank modernization and financialstatecraft in BRIC countries designed to counter the effects of crisis and shape domesticgrowth Government banks in BRIC countries have contributed to the widely notedadjustment of these economies to global financial crisis and economic downturnContrary to the Washington Consensus that prevailed during much of the 1980s and1990s (that privatization and liberalization especially of banking would free marketforces and deepen domestic financial systems) a quite different process of bank changeappears to have ensued after financial liberalization in the BRICs
Instead of replacement of state banks with private banks government banksremain central agents of domestic credit and growth and have modernized ldquojust intimerdquo The capitalization and realization of competitive advantages by large governmentbanks during the 2000s meant that once the US financial panic spread across capitalmarkets broke highly leveraged private and produced runs on private bank depositspolicy makers in BRIC countries nonetheless retained counter cyclical policyalternatives through their more solid large state banks
These findings counter traditional foci on the private sector individualentrepreneurship and ideals of free markets linked to the political and social advancesrecorded around the world in the last decades We report an anomaly for theories offinancial repression and the Washington Consensus about the virtues of privatization
and liberalization Although largely blamed for reproducing underdevelopment in thepast BRIC government banks averted excesses of private banking that drove creditbubbles such as home mortgages and derivatives in the US And since liberalization ofbanking (we have not adequately discussed how much liberalization occurred in eachcountry) government banks have modernized to compete with private and foreignbanks Government banks have realized competitive advantages and provided policyalternatives These two arguments help explain why BRIC countries have farecomparatively well in the face of financial crisis in core countries
Financial statecraft is therefore at the center of BRIC counter cyclical capacitiesand state planning Brazil Russia India and China fared significantly better thanadvanced and many developing countries in terms of adjusting to credit crunches and
export shocks This is because government banks proved critical interbank credit toretain confidence in domestic banking systems These institutions also presented other
8132019 Government Banking and BRICs in the Recent Financial Crisis
httpslidepdfcomreaderfullgovernment-banking-and-brics-in-the-recent-financial-crisis 5557
983106983122983113983107 983111983151983158983141983154983150983149983141983150983156 983106983137983150983147983155 983137983150983140 983110983145983150983137983150983139983145983137983148 983123983156983137983156983141983139983154983137983142983156
55
policy alternatives for political and social forces Politics shaped adjustment andrecovery through state banks differently in BRIC countries Given the realities of statecentered political realism in Russia the redirection of state banks toward goals ofChinese Five Year Plans and the modernization of the State Bank of India amidst anamorphous federalism the experience of Brazil with democratization and public bank
modernization may stand out (Armijo 2009)Further analysis of savings banks and cooperative banks also will be requiredAs members of the World Savings Bank Institute (a global association of savingsbanks) the Caixa in Brazil SNI and NABARD in India and China Postal Savings Bankappear to have provided access to very large numbers of previously unbanked citizensThis returns to traditional ideas of social banking and the history of savings banks thatwere founded throughout Europe since the late 18 th century The upmarket strategy andexpansion into investment banking and international banking of the Russian Sberbankconstrasts with downmarket strategies of savings banks in Brazil India and China
The financial press has recently reported doubts about bad loans in Chinese statebanks and cast doubt on the financial results posted and reported in this paper
However current estimates of 2-5 percent bad loans in Chinese state banks pale incomparison to the US$1240 billion in bad loans shifted to asset managementcompanies in the mid 2000s before capitalization of these institutions through sale ofshares Critics of state banking in Brazil also point to past levels of bad loans (reaching30-40 percent) because of their capture during military government delayed transitionBut the cost of capitalization and transfer of bad loans from Brazilian state banks alsoremained below US$400 billion and is still contingent on liquidation of assetmanagement companies created in 2001 In any case these numbers are very smallcompared to GAO estimates of US$120 trillion in emergency infusions by USmonetary authorities to banks and financial institutions from 2007-11
These are anomalies for recent market-based banking theory and neo-liberalpolicy designs However they do not run counter to orthodoxy in economics andbanking theory Over the last decades economic reforms (fiscal financial monetaryand banking) have improved transparency and brought public policy and marketexpectations closer However expectations about deregulation and free marketequilibria in banking and finance have succumbed in the face of panic and the stillsobering consequences of crisis The materials presented herein are descriptive and willrequire more careful analysis However given the urgency of searching for alternativedevelopment models and different approaches to financial statecraft in BRIC countriesand beyond we have taken the liberty to present research in initial stages and toprovoke thought along the lines suggested by our kind conveners
8132019 Government Banking and BRICs in the Recent Financial Crisis
httpslidepdfcomreaderfullgovernment-banking-and-brics-in-the-recent-financial-crisis 5657
983106983122983113983107 983111983151983158983141983154983150983149983141983150983156 983106983137983150983147983155 983137983150983140 983110983145983150983137983150983139983145983137983148 983123983156983137983156983141983139983154983137983142983156
56
Appendix on Alternative Banking and Social Inclusion
This appendix describes how ideas about government banking led to further work onalternative banking and social inclusion with help from the Rockefeller FoundationBellagio Center In July 2011 we were able to convene a conference designed to gather
scholars alternative banking executives and representatives from savings andcooperative bank associations to rethink strategies for social inclusion in the globalsouth and attempt to launch a new policy agenda Given the search for alternativestrategies to counter crisis and the advances of stabilization transparency and bankingsupervision in developing and emerging economies we call for alternative bankingcommunities in the global north and south to work together and help shape a new policyagenda for social inclusion Because savings banks credit cooperatives and otheralternative banking and finance institutions have realized competitive advantages andemerged from crisis we can now think beyond We believe that new policies may helpdeveloping and emerging nations redirect large domestic institutions such as postal andsavings banks toward meeting the UN millennium goals to eliminate poverty by 2015
Plans include writing a green paper on Core Principles for Alternative Bankingand Social Inclusion convening events to promote these principles through institutionalsupporters and networks and seeking adoption of these principles at policy venues suchas the World Savings Bank Institute the International Association of CooperativeBanks the Bank for International Settlements the International Financial ReportingStandards foundation the ISO International Standards Organization the Charter forResponsible Business regional development banks and the World Bank We also planto submit an edited volume of scholarly contributions on alternative banking and socialinclusion by year-end 2012 Interested parties are welcome to participate
Institutional supporters and networks include
Institutional SupportersColumbia University School of International and Public Affairs New YorkInstitute for Money Technology and Financial Inclusion University of CaliforniaIrvineKingacutes College Department of Management LondonSatildeo Paulo Business School Getulio Vargas FoundationSecond University of Naples
Networks
Association of Emerging Market Business Schools Satildeo Paulo BrazilCommunity of European Management Schools BrusselsCritical Political Economy NetworkEuropean Association of Co-operative Banks BrusselsGlobal Public Policy Network LondonInternational Cooperative Banking Association BrusselsSocial Science Finance Network AmsterdamSociety for Advancement of Social Economics PhiladelphiaWorld Savings Bank Institute Brussels
8132019 Government Banking and BRICs in the Recent Financial Crisis
httpslidepdfcomreaderfullgovernment-banking-and-brics-in-the-recent-financial-crisis 5757
983106983122983113983107 983111983151983158983141983154983150983149983141983150983156 983106983137983150983147983155 983137983150983140 983110983145983150983137983150983139983145983137983148 983123983156983137983156983141983139983154983137983142983156
Core Principles for Alternative Banking and Social Inclusion
Commitment to End Capital StarvationPromote access to and use of banking and financial services by all through newtechnologies and distribution channels to capitalize assets among the poor
Commitment to Universalize Income Savings Credit and FinanceProvide basic income via ATM cards and mobile banking to reach the poor and opennew channels of access to income savings credit finance insurance and opportunities
Prudent Banking and Regulatory ComplianceAlternative banking seeks to work within regulations guidelines and best practicesrecommended by domestic monetary authorities and international regulatory institutionssuch as the Bank for International Settlement Basel II Capital Risk Guidelines
Corporate Social Responsibility Leadership
Integrate corporate social responsibility into down-market business strategies andinstitutions of representation and democratization
Transparency and AccountabilityPublish annual reports and balance sheets in accord with international best practices offinancial social and sustainability reporting
Leadership in Provision of New Banking Services and Products to the PoorUse competitive advantages in banking and institutional networks to channel moreeffectively capital income and finance to the poor
Generate Sustainable Income and Household Asset AccumulationUse branch offices and new banking technologies to accelerate progress toward UNmillennium goals to eliminate poverty
Universalize Financial EducationPromote financial education to encourage responsible banking and finance and avertpredatory lending and unethical practices
Adopt Cutting Edge Technology and Management Practices to Provide
Competitive Alternative to Private Commercial and Investment Banks
Incorporate electronic card and mobile banking services to better serve the poorContribute to Realization of Bellagio Principles for SustainabilityPromote alternative banking and business practices that contribute to environmentallysustainable income consumption and production as stated in Bellagio Principles forSustainability
Respect and Build on National and Regional DifferencesI d f i l d l l i b ki i i i d i i l
8132019 Government Banking and BRICs in the Recent Financial Crisis
httpslidepdfcomreaderfullgovernment-banking-and-brics-in-the-recent-financial-crisis 3257
983106983122983113983107 983111983151983158983141983154983150983149983141983150983156 983106983137983150983147983155 983137983150983140 983110983145983150983137983150983139983145983137983148 983123983156983137983156983141983139983154983137983142983156
32
Finally Brazilian federal government triennial plans include investment targets by theBNDES If current plans are compared to 2004-7 investments several structural changes inBNDES lending appear First BNDES plans for Oil and Petroleum production reveal aprofound change for Brazilian political economy In 1990 roughly 45 percent of oilconsumed in Brazil was imported In 2007 before oil price increased reversed the balance
Brazil reported domestic production levels sufficient to meet domestic consumptionFurthermore discoveries of substantial deep sea oil reserves have led the BNDES to planmassive investments involving Petrobras and other global petroleum firms For the 2009-2012 period investments in petroleum and gas (R$2697 billion) Petrochemicals (237) andEthanol (197) sum to over R$3130 billion
BNDES Triennial Investment Plans 2004-2012
2004-7 2007-10 2008-11 2009-12----------------------------------------------------------------------------------------------------------------Petroleum amp Gas 1472 1836 2028 2697
Mining 472 527 813 480Petrochemicals 64 174 264 237Steel 198 371 312 245Automotive 150 176 264 235Electronics 143 156 140 240Ethanol 166 205 205 197Paper amp Celulose 104 200 274 90Health 51 46 51 80Industry Total 2816 3802 4437 4501----------------------------------------------------------------------------------------------------------------Source BNDES Annual Reports 2002-2006
It is of note that President Dilma Roussef was instrumental in reducing the targets for2009-12 in petroleum and gas given indications that Petrobras and existing framework foroffshore oil prospecting and production proved unable to increase investments accordingly
The BNDES also retains a presence in government projects by providing managementassistance During 2008 BNDES staff provided management support for implementation of192 projects involving R$710 billion of total R$142 billion PT government growthacceleration projects BNDES staff also participated in the design management andimplementation of President Lularsquos Poliacutetica de Desenvolvimento Produtivo (Policy forProduction Development) involving R$2100 billion targeting production chains designed tomaximize employment and regional development benefits Finally the BNDES was alsocharged to create and co-manage a Fundo Amazonia with the Ministry of Environment toprovide incentives to reduce deforestation of the Amazon region BNDES Plans for 2009include completion of concession for construction of high speed train line and service for Riode Janeiro-Satildeo Paulo corridor two blocks of highway concession sales involving three majorhighways in each block of sales sale of management concessions for regional airports andthe reorganization of INFRAERO federal government airport management company
These policies reflect the goal of BNDES policy to launch firms on the stock marketrather than maintain direct credit and finance Exceptions during 2008 involve Auto andEthanol industies both for strategic and broader policy reasons Given the sharp downturn inauto sales during fourth quarter 2008 the BNDES provided significant lending to avert
further downsizing or failure of auto companies in Brazil Given the current globalredistribution of automobile production BNDES policies are designed to help the Brazilian
8132019 Government Banking and BRICs in the Recent Financial Crisis
httpslidepdfcomreaderfullgovernment-banking-and-brics-in-the-recent-financial-crisis 3357
983106983122983113983107 983111983151983158983141983154983150983149983141983150983156 983106983137983150983147983155 983137983150983140 983110983145983150983137983150983139983145983137983148 983123983156983137983156983141983139983154983137983142983156
33
operations of major auto firms through the period of adjustment and increase theattractiveness of domestic operations in global production strategies of multinational autocompanies Ethanol production also received massive funds to sustain an industry seen ascritical for alternative and sustainable fuel source capable of replacing petroleum Ethanolreached over 50 percent of automotive fuel sales in 2007
Under the Lula government (2003-10 the BNDES also resumed lending to state andmunicipal governments Since the renegotiation of municipal and state government debts inthe late 1990s states and municipalities have been largely prohibited from taking on debtThis was emplematic of the recentralization required to control fiscal excesses during militaryrule and the prolonged period of transition to democracy Policies during the 1990s weredesigned to avert overspending seen as critical to maintain price stability under the Real Plan(1994) In 2000 the Lei de Responsibilidade Fiscal (Fiscal Responsibility Law) largelyprohibited credit and finance to state and municipal governments Since 2000 municipalitiesand states have been required to submit detailed budget statements that in turn have been thebasis for a gradual return to sub-national government finance In August 2006 central bankand Treasury regulations freed municipalities to take on credit up to 12 times liquid receipts
Since then the BNDES has led in terms of credits and finance to subnational governmentsthrough a Programa Especial de Financiamento aos Estados e Distrito Federal
The BNDES also has developed the first system in Brazil for risk analysis ofmunicipal governments and has led in the market for municipal credit freed by August 2006procedures for approval at Treasury the Central Bank and Conselho Monetaacuterio Nacional(National Monetary Council) Prosecution of mayors and firms charged with managingmunicipal credits with the BNDES revealed fraudulent practices These funds for sub-national public finance also became critical mechanisms to counter severe budget shortfallscaused by financial crisis during 2008 Given that municipal and state government tax basesare shallow and that federal government transfers provide the bulk of sub-nationalgovernment resources the Lula administration allocated R$ 40 billion to the Fundo deParticipaccedilatildeo dos Estados (State Participation Fund) through a Programa Emergencial deFinanciamento (Emergency Finance Fund) administered by the BNDES
In sum the BNDES expanded credit and finance operations substantially during fouryears of sustained growth from 2004-2007 And having helped underwrite the stock marketboom and capitalized Brazilian firms directly and indirectly through credit finance mutualfunds and private equity funds the BNDES retained sufficient scale scope and capital baseto provide counter cyclical credit and finance to help firms adjust to financial crisis and creditshortage during 2008 In retrospect the growth of the BNDES since liberalization andprivatizations of state government banks in the 1990s suggest the comparative advantages of
development banking BNDES credit and finance fell to 52 percent of fixed capitalformation in 1995 Since then the turn to neo-developmentalism and a period of sustainedeconomic growth during the Lula administration increased the BNDES share of total fixedcapital formation during 2006 and 2007 to 126 and 141 percent Critics charge thatmonopoly over FGTS and PIS-PASEP official savings funds as liabilities provide theBNDES with unfair competitive advantage over private banks In 2008 forced savings fundssummed to only 17 percent of BNDES liabilities (resources) The BNDES does not relyexclusively on forced savings for competitive advantage Instead market-oriented policies
joint-ventures with private mutual funds investment funds private equity firms large blocksof shareholding in Brazilian firms and massive amounts of credit and investment to theprivate sector at below market but still profitable long term interest rates of 625 percent
suggest that the large scale and scope of BNDES operations provide institutional foundationsof competitive advantage over private and foreign banks
8132019 Government Banking and BRICs in the Recent Financial Crisis
httpslidepdfcomreaderfullgovernment-banking-and-brics-in-the-recent-financial-crisis 3457
983106983122983113983107 983111983151983158983141983154983150983149983141983150983156 983106983137983150983147983155 983137983150983140 983110983145983150983137983150983139983145983137983148 983123983156983137983156983141983139983154983137983142983156
34
Capitalization of the BNDES by Treasury of over R$2300 billion 2009-11hascaptured attention of many observers of Brazilian development Critics and advocates agreethat the BNDES has realized significant competitive advantages over private and foreignbanks and continues to serve as significant alternative to capital markets for large scaledevelopment projects However like the downturn in planned investments by Petrobras for
oil and gas exploration and production BNDES decreased planned investments fromR$1684 billion in 2010 to R$1397 billion in 2011 We believe this indicates the limits ofmanagement and passing of period of crisis both favoring finance from capital marketsbanks and public-private partnerships
India
Analysis of Brazilian federal banks suggests that these institutions provided policy alternativewhile realizing competitive advantage over private and foreign banks The modernization ofthese institutions helps explain why these large institutions were able to stay the effects ofcredit crunch and financial market downturn in Brazil This section explores data from the
Reserve Bank of India to compare market shares of types of banks from 1972-2008 and bankperformance from 2006-10 Further analysis will be required However the data appears tosupport our core argument that government banks have modernized and realized competitiveadvantages over private and foreign banks
First the number of branch offices which serves as a measure of institutionalcoverage across India of special concern for financial inclusion and the theory thatliberalization and privatizations would lead private banks to expand branch offices andincrease the supply of services From this perspective the trajectory of branch officessuggests that nationalized banks the State Bank of India and regional rural bankssustain much larger networks of branch offices that predominate while otherscheduled commercial (private and foreign) banks retain less than 8000 branch offices
Data from the Reserve Bank of India on the number of current accounts retainedby type of bank provide further evidence that the State Bank of India and its associates
8132019 Government Banking and BRICs in the Recent Financial Crisis
httpslidepdfcomreaderfullgovernment-banking-and-brics-in-the-recent-financial-crisis 3557
983106983122983113983107 983111983151983158983141983154983150983149983141983150983156 983106983137983150983147983155 983137983150983140 983110983145983150983137983150983139983145983137983148 983123983156983137983156983141983139983154983137983142983156
35
national banks and regional rural banks provide the bulk of banking accounts to theIndian population while private and foreign banks cherry pick upscale urban marketsreproducing capital drain and inequalities
Number of Current Accounts by Type of Bank 1972-1995
Since 1999 the pattern of predominance by alternative banking institutions and the minorrole of other scheduled commercial banks and foreign banks continues
The following figures report the value held in current accounts by type of banks first fromthe 1972-1995 period then from the 1999-2008 period For both time periods the trendconfirms that private and foreign banks remain at a competitive disadvantage in terms of thebroader market while the State Bank of India and its associates nationalized banks andregional rural banks tend to predominate
8132019 Government Banking and BRICs in the Recent Financial Crisis
httpslidepdfcomreaderfullgovernment-banking-and-brics-in-the-recent-financial-crisis 3657
983106983122983113983107 983111983151983158983141983154983150983149983141983150983156 983106983137983150983147983155 983137983150983140 983110983145983150983137983150983139983145983137983148 983123983156983137983156983141983139983154983137983142983156
36
Current Account Value by Type of Bank 1972-1995 R
Number of Deposit Accounts by type of bank 1999-2008
A similar pattern appears for the trajectory of savings accounts both the number of
accounts and the value held in savings accounts both for the 1972-1995 period We wereunable to organize data from the more recent period
8132019 Government Banking and BRICs in the Recent Financial Crisis
httpslidepdfcomreaderfullgovernment-banking-and-brics-in-the-recent-financial-crisis 3757
983106983122983113983107 983111983151983158983141983154983150983149983141983150983156 983106983137983150983147983155 983137983150983140 983110983145983150983137983150983139983145983137983148 983123983156983137983156983141983139983154983137983142983156
37
Number of Savings Accounts by Type of Bank 1972-1995
Value in Savings Accounts by Type of Bank 1972-1995
Number of Term Savings Accounts by Type of Bank 1972-1995
8132019 Government Banking and BRICs in the Recent Financial Crisis
httpslidepdfcomreaderfullgovernment-banking-and-brics-in-the-recent-financial-crisis 3857
983106983122983113983107 983111983151983158983141983154983150983149983141983150983156 983106983137983150983147983155 983137983150983140 983110983145983150983137983150983139983145983137983148 983123983156983137983156983141983139983154983137983142983156
38
Value in Term Savings Accounts by Type of Bank 1972-1995
The number and value of credits extended by banks from 1999-2008 appears mostpromising in terms of comparative analysis of bank performance and behavior Thesignificant spread at the end of the time series between the State Bank of India and itsassociates and foreign banks suggests the impact of foreign financial crisis and differentdomestic policies by these types of banks in India similar to that noted in the Brazilianexperience
Number of credits by type of bank 1999-2008
Value of credit by type of bank 1996-2008
8132019 Government Banking and BRICs in the Recent Financial Crisis
httpslidepdfcomreaderfullgovernment-banking-and-brics-in-the-recent-financial-crisis 3957
983106983122983113983107 983111983151983158983141983154983150983149983141983150983156 983106983137983150983147983155 983137983150983140 983110983145983150983137983150983139983145983137983148 983123983156983137983156983141983139983154983137983142983156
39
Further data from the Reserve Bank of India from 2008-10 permit closercomparison of government private and foreign banks in the recent financial crisis Interms of deposits investments total assets and net profits the dominant and expandingrole of government banking in India is apparent Further control variables (not reported)
include gross and net NPA types of income expenses and expenditures provisions andcontingencies and credit- and investment-deposit ratios provide control for bad bankingand confirm the counter cyclical policies during 2008-10 in India
THE FOLLOWING TABLES REQUIRE INTERPRETATION
Number of Banks 2006-7 2007-8 2008-9 2009-10 2010-11
State Bank of India amp Associates 8 8 7 7 6Nationalized Banks 20 20 20 20 20Old Private Sector Banks 17 15 15 15 14
New Private Sector Banks 8 8 7 7 7Foreign Banks 29 28 31 32 33Source RBI A Profile of Banks 2010-11
Number of Branch Offices 2006-7 2007-8 2008-9 2009-10 2010-11
State Bank of India amp Associates 14673 15848 16894 18178 18772Nationalized Banks 37435 39255 40956 43452 45640Old Private Sector Banks 4723 4690 4908 5220 5011New Private Sector Banks 2599 3635 4333 5232 6957
Foreign Banks 272 277 295 308 316Source RBI A Profile of Banks 2010-11
Number of Employees 2006-7 2007-8 2008-9 2009-10 2010-11
State Bank of India amp Associates 255699 249008 268598 266605 282453Nationalized Banks 473179 466400 462926 473041 475082Old Private Sector Banks 47994 48700 51341 55052 55075New Private Sector Banks 91060 110123 124998 127468 163604Foreign Banks 28426 31301 29582 28012 27968
Source RBI - India BanksAssociation
Business per employee (in lakh) 2006-7 2007-8 2008-9 2009-10 2010-11
State Bank of India amp Associates 43635 54922 65022 73743 79306Nationalized Banks 49001 61828 78316 93586 114477Old Private Sector Banks 48159 56932 63843 69749 8149New Private Sector Banks 80782 83196 78715 84041 82607Foreign Banks 97477 11255 128274 141139 155974Note Business = Deposits + Advances
8132019 Government Banking and BRICs in the Recent Financial Crisis
httpslidepdfcomreaderfullgovernment-banking-and-brics-in-the-recent-financial-crisis 4057
983106983122983113983107 983111983151983158983141983154983150983149983141983150983156 983106983137983150983147983155 983137983150983140 983110983145983150983137983150983139983145983137983148 983123983156983137983156983141983139983154983137983142983156
40
Profit per employee (in lakh) 2006-7 2007-8 2008-9 2009-10 2010-11
State Bank of India amp Associates 257 362 443 466 42Nationalized Banks 287 377 486 567 695Old Private Sector Banks 234 406 469 42 563New Private Sector Banks 587 685 677 847 893Foreign Banks 1613 2112 2539 1692 2759
Capital amp Reserves amp Surplus(Ycrore) 2006-7 2007-8 2008-9 2009-10 2010-11
State Bank of India amp Associates 42941 61706 72422 83726 84394Nationalized Banks 92689 113079 135920 157276 205857Old Private Sector Banks 10736 15315 17477 20171 23821New Private Sector Banks 39736 76056 82192 99813 114768Foreign Banks 33075 49332 59937 69176 80972
Deposits Ycrore 2006-7 2007-8 2008-9 2009-10 2010-11
State Bank of India amp Associates 633476 773875 1007041 1108086 1245862Nationalized Banks 1360724 1679993 2105706 2583934 3127122Old Private Sector Banks 138249 165589 199274 229897 264157New Private Sector Banks 413738 509444 537104 592904 738602Foreign Banks 150750 191161 214076 232099 240689
Investments Ycrore 2006-7 2007-8 2008-9 2009-10 2010-11
State Bank of India amp Associates 211875 263823 357624 387473 385697Nationalized Banks 452981 536018 655042 828125 942837Old Private Sector Banks 43647 54080 72393 83499 92617New Private Sector Banks 171008 224498 234139 270618 329403Foreign Banks 71471 98910 130354 159291 165499
Advances Ycrore 2006-7 2007-8 2008-9 2009-10 2010-11
State Bank of India amp Associates 482270 593722 739450 857937 994154Nationalized Banks 957877 1203678 1519762 1843082 2311478
Old Private Sector Banks 92887 111670 128504 154085 184647New Private Sector Banks 321865 406733 446824 478356 612886Foreign Banks 126339 161133 165385 163260 195539
Interest Income Ycrore 2006-7 2007-8 2008-9 2009-10 2010-11
State Bank of India amp Associates 53465 70428 89196 97954 109828Nationalized Banks 110720 142647 183892 208029 256490Old Private Sector Banks 11474 14614 18790 20497 23299New Private Sector Banks 38092 56377 66282 62309 73528
Foreign Banks 17924 24417 30322 26390 28520
8132019 Government Banking and BRICs in the Recent Financial Crisis
httpslidepdfcomreaderfullgovernment-banking-and-brics-in-the-recent-financial-crisis 4157
983106983122983113983107 983111983151983158983141983154983150983149983141983150983156 983106983137983150983147983155 983137983150983140 983110983145983150983137983150983139983145983137983148 983123983156983137983156983141983139983154983137983142983156
41
Other Income Ycrore 2006-7 2007-8 2008-9 2009-10 2010-11
State Bank of India amp Associates 9420 11818 16073 18394 19240Nationalized Banks 14264 20979 26394 30500 28625Old Private Sector Banks 1568 2184 2782 3152 3029
New Private Sector Banks 10745 14822 15078 17271 17697Foreign Banks 7044 10588 14894 9951 10972
Interest Expended Ycrore 2006-7 2007-8 2008-9 2009-10 2010-11
State Bank of India amp Associates 32607 47809 61770 66229 67018Nationalized Banks 69353 101093 131676 145712 164135Old Private Sector Banks 7055 9960 12834 14076 14768New Private Sector Banks 25802 38535 44123 37130 42347Foreign Banks 7603 10604 12819 8938 10622
Operating Expenses Ycrore 2006-7 2007-8 2008-9 2009-10 2010-11
State Bank of India amp Associates 15987 16993 20088 25283 29146Nationalized Banks 27268 29670 35416 40792 53819Old Private Sector Banks 2967 3235 3939 4715 5600New Private Sector Banks 12353 17032 17840 18136 22006Foreign Banks 7745 10353 12298 11102 12557
Cost of Funds 2006-7 2007-8 2008-9 2009-10 2010-11
State Bank of India amp Associates 475 59 594 532 48Nationalized Banks 48 582 609 537 493Old Private Sector Banks 498 62 667 613 55New Private Sector Banks 524 611 604 442 427Foreign Banks 403 433 446 283 311Cost of Funds = Ratio () of interest paid on deposits and borrowings to averageof opening and closing balances of deposits and borrowings
Return on advances adjusted toCoF 2006-7 2007-8 2008-9 2009-10 2010-11
State Bank of India amp Associates 372 365 395 36 405Nationalized Banks 399 369 409 382 427Old Private Sector Banks 406 426 515 482 492New Private Sector Banks 447 505 526 514 516Foreign Banks 574 66 815 716 564
2006-7 2007-8 2008-9 2009-10 2010-11
8132019 Government Banking and BRICs in the Recent Financial Crisis
httpslidepdfcomreaderfullgovernment-banking-and-brics-in-the-recent-financial-crisis 4257
983106983122983113983107 983111983151983158983141983154983150983149983141983150983156 983106983137983150983147983155 983137983150983140 983110983145983150983137983150983139983145983137983148 983123983156983137983156983141983139983154983137983142983156
42
Wages as of Total Expenses
State Bank of India amp Associates 2155 1589 1506 171 1921Nationalized Banks 1794 1405 1331 1365 1641Old Private Sector Banks 1689 1367 1326 1457 1675
New Private Sector Banks 936 956 1017 121 1383Foreign Banks 2008 1995 1944 2348 2331
Returns on Assets 2006-7 2007-8 2008-9 2009-10 2010-11
State Bank of India amp Associates 086 097 102 091 079Nationalized Banks 094 101 103 100 103Old Private Sector Banks 078 114 115 095 112New Private Sector Banks 109 113 112 138 151Foreign Banks 228 209 199 126 174
Capital Adequacy Ratio 2006-7 2007-8 2008-9 2009-10 2010-11
State Bank of India amp Associates 1232 1321 1396 1346 1225Nationalized Banks 1237 1213 1324 1318 1347Old Private Sector Banks 1208 1408 1476 1485 1456New Private Sector Banks 1199 1439 1533 1803 1687Foreign Banks 1239 1305 1432 1726 1672Note To 2007-8 = Basel I From 2008-09 = Basel-II
Net NPA Ratio 2006-7 2007-8 2008-9 2009-10 2010-11
State Bank of India amp Associates 132 143 147 150 149Nationalized Banks 094 077 068 091 092Old Private Sector Banks 096 066 09 082 053New Private Sector Banks 097 109 129 103 056Foreign Banks 073 077 181 182 067Net NPA Ratio = Net non-performing assets as net advances
In sum descriptive data from the Reserve Bank of India confirm the anomaly
and argument drawn from the Brazilian experience An important dimension of BRICcountry recovery from the global financial crisis and downturn is the counter cyclicallending policies and realization of competitive advantages of government banks Thisposes a series of new questions for business schools and scholars of public policyInstead of liberalization and privatization leading to transitions in BRIC countriestoward capital market centered financial systems and liberal market economies publicbanks have realized competitive advantages over private and foreign banks whileproviding policy alternatives to BRIC governments in the face of financial crisis andglobal economic slowdown We return to these implications in the conclusion
One development of note at the Reserve Bank of India is a policy focus onfinancial inclusion The 2008 report of the Committee on Financial Inclusion has beenfollowed by sections of the Reserve Bank of India Annual Report reserved fordiscussion of financial inclusion And instead of focusing on liberalization and
8132019 Government Banking and BRICs in the Recent Financial Crisis
httpslidepdfcomreaderfullgovernment-banking-and-brics-in-the-recent-financial-crisis 4357
983106983122983113983107 983111983151983158983141983154983150983149983141983150983156 983106983137983150983147983155 983137983150983140 983110983145983150983137983150983139983145983137983148 983123983156983137983156983141983139983154983137983142983156
43
privatization to ensure the spread of banking products and services alternative policieshave been explored One is of special note The Committee on Financial Inclusionrecommended issue of identity cards as bank cards This would profoundly change thelandscape of banking in India and has attracted attention from analysts at the CentralBank of Brazil charged with financial inclusion as well as the President of Indonesia
and apparently Uganda officials Given the revolution in information and card paymenttechnologies this policy proposal and pilot studies deserve close attention asalternatives to dramatically increase the pace of social inclusion of the bankless
8132019 Government Banking and BRICs in the Recent Financial Crisis
httpslidepdfcomreaderfullgovernment-banking-and-brics-in-the-recent-financial-crisis 4457
983106983122983113983107 983111983151983158983141983154983150983149983141983150983156 983106983137983150983147983155 983137983150983140 983110983145983150983137983150983139983145983137983148 983123983156983137983156983141983139983154983137983142983156
44
China
This section turns to a brief review of the Chinese banking sector to further explore therole of government banks in terms of their modernization competitive advantages
policy roles and capacity for counter cyclical credit that help explain why BRICcountries were able to avert the severe consequences of the global financial crisis
First figure A11 reports the basic structure of the banking system in China
Although we have been unable to compare the evolution of types of banks acrosstime in similar ways to the above data on India taken from the Reserve Bank of Indiaour research assistants have gathered the following comparative macroeconomicfinancial and balance sheet data on banking in China The data appear to be consistentwith the core argument presented in this paper ndash that government banks havemodernized since liberalization and provided policy makers with alternative means tocounter the effects of financial crisis abroad
8132019 Government Banking and BRICs in the Recent Financial Crisis
httpslidepdfcomreaderfullgovernment-banking-and-brics-in-the-recent-financial-crisis 4557
983106983122983113983107 983111983151983158983141983154983150983149983141983150983156 983106983137983150983147983155 983137983150983140 983110983145983150983137983150983139983145983137983148 983123983156983137983156983141983139983154983137983142983156
45
We lack more current information and were unable to collect data directly fromofficial sources in China to compare the trajectory of state owned private and foreignbanks As a substitute Figure 1 reports data from 2000-4 that permits initial observationof trends for this earlier period
Those present may not need reminding of the formidable record of economicgrowth in China during this 200-4 period that continues until today However data fromthe National Bureau of Statistics suggests that the Chinese banking system expanded atan even greater pace than the remarkable levels of GDP growth recorded for the 2000-4period Furthermore credit expansion was ldquoorganicrdquo in the sense that deposits
outpaced credit growth from 2000-4
Expansion of Loans in China 1999-2004
Loan Growth Total LoansYear on Year
Growth Total Depositssup1Year on Year
GrowthYear CNY billion CNY () CNY billion CNY()1999 9373 83 10878 1372000 9937 60 1238 1382001 11231 130 14362 1602002 13129 169 17092 1902003 159 211 20806 217
2004 18857 186 25319 217
sup1Based on preliminary estimates by the National Bureau of Statistics of the Peoplersquos Republic of ChinaSource National Bureau of Statistics of the PRC
Although we lack data comparable to that from the Reserve Bank of India ableto compare the trajectory of state private and foreign banks in China the sectoralbreakdown of loans and other banking and national account data confirms the profoundcapitalization of the Chinese banking system and GDP growth during from 1995-2004
8132019 Government Banking and BRICs in the Recent Financial Crisis
httpslidepdfcomreaderfullgovernment-banking-and-brics-in-the-recent-financial-crisis 4657
983106983122983113983107 983111983151983158983141983154983150983149983141983150983156 983106983137983150983147983155 983137983150983140 983110983145983150983137983150983139983145983137983148 983123983156983137983156983141983139983154983137983142983156
46
China Banking Sector Market Dimensions (1995 - 2004)
YearTotal
LoansCorp
LoansConsuLoans
HomeLoans
TotalDeposits Excess
GovBonds
CorpBonds GDP
GDPGrowth
()1995 52310 mdash mdash mdash 5376 145 330 65 5848 2511996 63100 mdash mdash mdash 6847 538 436 60 6788 1611997 73585 7341 17 130 8212 853 551 52 7446 971998 85002 8447 53 430 9529 102 9 777 68 7835 521999 95587 9394 164 1360 10831 1273 1054 78 8207 482000 108763 10453 424 3320 13486 261 1302 86 894 892001 118990 112 699 5600 15472 3573 1562 101 9593 732002 139800 12913 1067 8258 18339 4359 mdash mdash 10479 922003 169770 15401 1576 13302 22036 5059 mdash mdash 11669 1142004 194220 16848 1988 15800 25319 5897 mdash mdash 13657 170Figures = CNYB
This data reported in terms of percent GDP provides further clarity on the rapid
capitalization of loans It is of note that the bulk of loans during this period were to thecorporate sector with consumer and home loans lagging significantly
China Banking Sector Percent GDP
YEARTotal
LoansCorporate
LoansConsumer
LoansHomeLoans Deposits
ExcessDeposits
GovBonds
CorpBonds
1995 895 00 00 00 919 25 56 111996 929 00 00 00 1009 79 64 091997 988 986 02 02 1103 115 74 071998 1085 1078 07 05 1216 131 99 091999 1165 1145 20 17 1320 155 128 092000 1217 1169 47 37 1508 292 146 102001 1240 1167 73 58 1613 372 163 112002 1334 1232 102 79 1750 4162003 1455 1320 135 114 1888 4342004 1422 1234 146 116 1854 432
Sources China Banking Regulatory Commission Peoplersquos Bank of China and GoldmanSachs research estimates
Compilation of financial data from a select number of banks in China suggeststhat the pattern of bank change encountered in Brazil and India also describes theexperience of China The liberalization of the Chinese economy and the modernization
of state banks appear to describe the process of bank change instead of a process oftransition toward private banking and capital market centered financial systemAlthough we have been unable to draw data from Chinese monetary authorities thebalance sheet data suggests the clear predominance of large state banks in the politicaleconomy of banking and finance in China How these institutions were used to counterthe effects of financial crisis abroad and redirect domestic investment production andconsumption must remain a subject for further research
8132019 Government Banking and BRICs in the Recent Financial Crisis
httpslidepdfcomreaderfullgovernment-banking-and-brics-in-the-recent-financial-crisis 4757
983106983122983113983107 983111983151983158983141983154983150983149983141983150983156 983106983137983150983147983155 983137983150983140 983110983145983150983137983150983139983145983137983148 983123983156983137983156983141983139983154983137983142983156
47
Select Financial Data from Chinese Banks 2004()
CNY (billion)Total
AssetsGrossLoans
CustomerDeposits Equity
NPLRatio
()
Pre-prov
ProfitsNet
Profits
State Banks
ICBC 5671 3705 5105 163 190 653 23CCB 3905 2226 3489 195 39 605 484ABC (NA) mdashBOC 427 2146 3342 205 51 578 209Quasi-State
BoCom 1145 639 1023 54 30 131 16CMB 587 376 513 22 29 82 32CITIC Industrial 515 306 429 20 60 52 03SPDB 456 311 397 14 24 62 20China Everbright mdashGuangdong Development 345 216 301 mdash mdash mdash 32
Industrial Bank 341 203 283 10 25 37 11Quase-Private
Bank of Shanghai 216 106 179 83 51 32 26Hua Xia 304 181 270 92 40 29 10Shenzhen Development 198 126 166 43 114 28 03Bank of Beijing 209 85 174 71 mdash 26 07
Sector total 19422 25319 129Three state-banks 2692 3979 188Second tier banks 2549 3733 148
ABC = Agriculture Bank of China BOC = Bank of China
BOCOM = Bank of Communications CCB = China Construction BankCMB = China Merchantrsquos Bank CNY = yuanICBC = Industrial and Commercial Bank of ChinaNPL = nonperforming loanROA = return on assets ROE = return on equityprov = provisioningPRC = Peoplersquos Republic of ChinaSPDB = Shanghai Pudong Development BankNote Loan and deposit market share for BOC and ICBC are for their domestic operations onlySources Company data Goldman Sachs research estimates
Returns on Assets Equity and Domestic Market Shares of Major China Banks 2004()
CNY (billion) ROA () ROE ()Deposit Mkt
Share ()Loan MktShare ()
Mortgage MktShare()
State Banks
ICBC 004 14 199 187 253CCB 130 254 138 115 217ABC (NA)BOC 051 102 101 89 152Quasi-State
BoCom 015 45 37 29 34CMB 060 161 20 19 29
CITIC Industrial 007 17 17 16 18SPDB 048 153 16 16 26
8132019 Government Banking and BRICs in the Recent Financial Crisis
httpslidepdfcomreaderfullgovernment-banking-and-brics-in-the-recent-financial-crisis 4857
983106983122983113983107 983111983151983158983141983154983150983149983141983150983156 983106983137983150983147983155 983137983150983140 983110983145983150983137983150983139983145983137983148 983123983156983137983156983141983139983154983137983142983156
48
China EverbrightGuangdong Development mdash mdash 12 11 mdashIndustrial Bank 037 126 11 10 10Quase-Private
Bank of Shanghai 129 360 07 05 14Hua Xia 038 116 11 09 07Shenzhen Development 017 75 07 06 08Bank of Beijing 037 108 07 04 07
Sector totalThree state-banks 438 391 622Second tier banks 144 127 154
ABC = Agriculture Bank of China BOC = Bank of China BOCOM = Bank of Communications CCB =China Construction Bank CMB = China Merchantrsquos Bank CNY = yuanICBC = Industrial and Commercial Bank of China mkt = market NPL = nonperforming loan ROA =return on asset ROE = return on equity prov = provisioning PRC =Peoplersquos Republic of China SPDB = Shanghai Pudong Development BankNote Loan and deposit market share for BOC and ICBC are for their domestic operations onlySources Company data Goldman Sachs research estimates
Further data from 2006-10 from the Peoples Bank of China suggests that the big5 state banks continue to outperform the next 12 largest joint stock commercial banksThe big five have launched sales of shares to capitalize while listing on capital marketsand adopting reporting of financial data along lines of international standards Thisappears to be similar to Banco do Brasil policies that retain majority of shares in federalgovernment control while capitalizing the bank through issues of stock
Comparing the Performance of Big 5 State Banks and Next 12 Joint Stock CommercialBanks in China
2006 2007 2008 2009 2010
Profit Margin Big 5 State Banks 3116 3143 2586 3026 3269
Next 12 JS Commercial Banks 2050 2791 1796 2159 2365
Returns Big 5 State Banks 507 606 860 691 675(risk adj) Next 12 JS Commercial Banks 459 570 1016 714 723
Op Risk Big 5 State Banks 5548 5539 5215 5319 5322Next 12 JS Commercial Banks 5886 5721 5725 5831 5947
Leverage Big 5 State Banks 1626 1482 1724 173 1734Next 12 JS Commercial Banks 2826 2251 2064 2048 1936
ROE Big 5 State Banks 1424 1557 1999 1925 2037Next 12 JS Commercial Banks 1564 2049 2156 1840 1967
Big 4 and 11 JSCBsSource Peoples Bank of China China Financial Stability Reports 2007-11
Performance indicators reported by the Peoples Bank of China for the big 5 statebanks and 12 next largest joint stock commercial banks also suggest that the largestgovernment banks in China retain significant competitive advantages ndash and may providepolicy alternatives Given the current shift of economic policy in China away fromindustry and export led growth to more sustainable domestic oriented growth and socialinclusion the role of state banks clearly comes to the fore
8132019 Government Banking and BRICs in the Recent Financial Crisis
httpslidepdfcomreaderfullgovernment-banking-and-brics-in-the-recent-financial-crisis 4957
983106983122983113983107 983111983151983158983141983154983150983149983141983150983156 983106983137983150983147983155 983137983150983140 983110983145983150983137983150983139983145983137983148 983123983156983137983156983141983139983154983137983142983156
49
Net Operating Income of Big 5 State Banks and Next 12 CommercialBanks 100 million RMB YuanBig 5 State Banks 2006 2007 2008 2009 2010
Balance Net interest income 349703 500456 556790 532206 720152Net fee amp commission inc 48524 103817 138464 175469 232491
Investment income 216089 283725 338865 324037 340440
Other business income (1807) (17054) 47548 33791 2186
Net operating income 612509 870944 1081667 1065503 1314943
Percent Net interest income 5709 5746 5148 4995 5477
Net fee amp commission inc 792 1192 1280 1646 1768
Investment income 3528 3258 3133 3041 2589
Other business income (030) (196) 440 318 166
Net operating income 10000 10000 10000 100 100
Next 12 Joint Stock CommercialBanks 2006 2007 2008 2009 2010
Net interest income 87253 132945 198965 191276 281588
Net fee amp commission inc 7850 16247 27319 30115 42023
Investment income 20959 32172 44864 50767 50500
Other business income 2306 4498 16359 10384 7400
Net operating income 118468 185861 287507 282542 381511
Percent Net interest income 7365 7153 6920 6769 7381
Net fee amp commission inc 671 874 950 1066 1101
Investment income 1769 1731 1560 1797 1324
Other business income 195 242 569 368 194Net operating income 10000 10000 10000 10000 10000
Source Peoples Bank of China China Financial Stability Reports 2007-11
Big 4 and 11 JSCBsBig 5 = ICBC ABC BOC CCB BOCOMNext 12 Joint Stock Commercial Banks = China CITIC Bank Everbright Bank Huaxia BankGuangdong Development Bank Shenzhen Development Bank China Merchants Bank Shanghai PudongDevelopment Bank Industrial Bank China Minsheng Banking Corporation Evergrowing Bank ChinaZheshang Bank Bohai Bank
In conclusion bank change in China also appears to confirm our findings from
Brazil ndash that state banks have realized competitive advantages and increased marketshares since liberalization while providing counter cyclical credit to ameliorateadjustment to crisis The modernization of the China Postal Savings Bank is ofparticular interest given its social mission downmarket focus and 40000 branchOffices throughout the country Expansion of card payment services through the postalbank system confirms the importance of the Brazilian federal savings bank (CaixaEconocircmica Federal Caixa) as agent for federal government social policy and agentresponsible for management of citizenship cards (12 million) and payment of familygrants This back to the future modernization of savings banks has proved essential forovercoming notorious levels of social exclusion and inequality in Brazil Althoughenglish language materials are unavailable on the China Postal Savings Bank thisinstitution clearly presents profound opportunities for comparable policies in China
8132019 Government Banking and BRICs in the Recent Financial Crisis
httpslidepdfcomreaderfullgovernment-banking-and-brics-in-the-recent-financial-crisis 5057
983106983122983113983107 983111983151983158983141983154983150983149983141983150983156 983106983137983150983147983155 983137983150983140 983110983145983150983137983150983139983145983137983148 983123983156983137983156983141983139983154983137983142983156
50
Reported offer of microfinance services for poverty reduction as part of nationaleconomic stimulous plan may point to developments in this direction
Given that state planning capacity has long been at the center of attention intheories of financial statecraft the role of Chinese state banks in redirecting policiesaccording to the 12th 5 Year plan for 2011-15 seems critical From 2000-5 the 10th 5
Year plan emphasized infrastructure and the attraction of investment and labor skillsThe 11th 5 Year plan (2006-10) raised concerns about sustainability rather than growthlevels while also seeking to spread improvements to balance development better servepeople and improve the quality of life continue to support Center and West provincesand revitalize Northeast provinces In comparison the 12th 5 Year plan calls for morebalanced lsquoinclusiversquo growth and structural adjustemts more than 4 trillion RMB($US600 billion) for targeted industries and interior regions a focus on new energynew materials and information and high technologies biology and new medicineenergy converstaion and environmental protection aerospace marine and advancedmanufacturing This implies fundamental shifts away from industry to services that hasbeen reported in macroeconomic data for 2010 If past studies emphasized directed
credit and industrial change the role of Chinese state banks in realizing transformationscertainly warrants study
Although the domestic flow of funds process of liberalization (or the lackthereof) and insertion of banking into Chinese political economy is beyond the scope ofthis paper our findings from Brazil appear to provide valuable hypotheses about ChinaThat is to say the big state banks and other government banks in China remaincommanding heights not in the Marxist sense of providing means to reach socialismbut immense institutions with profound presence throughout politics and markets in thecountry In this sense our findings from Brazil appear to approximate patterns ofchange in China more than Washington Consensus expectations about liberalization andprivatizations to free private and foreign banks Financial statecraft draws attention tothe capitalization of Chinese state banks through stock Sales and listings on capitalmarkets However like the Banco do Brasil (that reformers in the 1990s sought to shiftcontrol to the private sector only to increase federal government shareholding) theChinese experience surely involves unexpected consequences and patterns of changedifferent than a linear transition to the Berle amp Means paradigm of corporategovernance
Russia The New State Duopoly
ldquoThe rush of 2003-8 increased the market share of foreign banks to 285 from
52 However the state-owned banks received enormous help from the federal budget in the days of the crisis thereby strengthening their dominant
position on the Russian financial market says Sergey Aleksashenko the formerDeputy chairman of Russias Central Bank quotes Russia Profile Today one
must not harbor any illusion of a fair competition with them all the main cash
flows in Russia are controlled by state-owned banks httpwwwbarentsnovacomnode1031
Description of banking policy in Russia during the global financial crisis can beobtained from Bank of Russia annual reports and related publications The figure on the
following page summarizes the financial flows to and from the Bank of RussiaAlthough central bank policy is beyond the scope of this study the role of state banks in
8132019 Government Banking and BRICs in the Recent Financial Crisis
httpslidepdfcomreaderfullgovernment-banking-and-brics-in-the-recent-financial-crisis 5157
983106983122983113983107 983111983151983158983141983154983150983149983141983150983156 983106983137983150983147983155 983137983150983140 983110983145983150983137983150983139983145983137983148 983123983156983137983156983141983139983154983137983142983156
51
channeling counter-cyclical credits released by the Bank of Russia appear to confirm thecore argument that emerges from our studies of the Brazilian banking system Furtherdata on the following pages also suggest that state banks in Russia performed wellduring 2008-10 confirming on the basis of sparse data taken from Bank of Russiareports and documents that public banks have modernized provided counter-cyclical
credit to reverse credit crunch and economic downturn while realizing competitiveadvantages over private and foreign banks
8132019 Government Banking and BRICs in the Recent Financial Crisis
httpslidepdfcomreaderfullgovernment-banking-and-brics-in-the-recent-financial-crisis 5257
983106983122983113983107 983111983151983158983141983154983150983149983141983150983156 983106983137983150983147983155 983137983150983140 983110983145983150983137983150983139983145983137983148 983123983156983137983156983141983139983154983137983142983156
52
The following aggregate figures reported by the Bank of Russia suggest severaltrends of significance First Chart 32 suggests that household deposits shifted fromRuble deposits to foreign currency pegged (or indexed) during 2008 Second Chart 33illustrates the substantial increase of non-bank overdue debt during second semester
2008
Consequently the financial results and profitability of banks declinedsignificantly during 2008 The greater confidence in deposits with government banksfound abroad suggests that this may have been critical in Russia
Performance data deom 2008-10 provides a clearer picture one that is consistentwith our findings in Brazil State banks appear to have outperformed all other types of
banks except medium and small regional banks The following table reports the averagereturns on assets and returns on equity reported by the Bank of Russia 2008-10
Returns on Assets and Equity by Type of Bank in Russia 2008-9
Return on assets Return on equity 2008 2009 2010 2008 2009 2010
-------------------------------------------------------------------------------------------------------------------State Banks 22 08 24 157 46 148Foreign Banks 18 11 21 146 83 145Large private banks 13 03 11 106 28 84Medium-Small Banks Moscow 15 12 14 68 52 67
Medium-Small Regional Banks 21 12 15 131 65 98--------------------------------------------------------------------------------------------------------------------Source Bank of Russia Bank Supervision Reports 2009 and 2010
8132019 Government Banking and BRICs in the Recent Financial Crisis
httpslidepdfcomreaderfullgovernment-banking-and-brics-in-the-recent-financial-crisis 5357
983106983122983113983107 983111983151983158983141983154983150983149983141983150983156 983106983137983150983147983155 983137983150983140 983110983145983150983137983150983139983145983137983148 983123983156983137983156983141983139983154983137983142983156
53
Further data from the Bank of Russia on the capital adequacy of Banks during2009-10 suggest that foreign banks and large private banks remain less capitalizedagainst risks according to Basel II guidelines albeit at levels almost double thatrecommended by the Bank for International Settlements (80 risk weighted) Although
further analysis is needed this data is consistent from that reported in Brazil thatgovernment banks tend to more cautious and more prudent in terms of placing asidehigher levels of reserves and patrimony against possible losses
Capital Adequacy of Banks by Type of Bank in Russia 2009-10
2009 2010 2011---------------------------------------------------------------------------------------------------------State Banks 184 227 186Foreign Banks 155 196 195Large Private Banks 140 181 155
Medium-Small Banks Moscow 316 312 268Medium-Small Regional Banks 219 241 207Non-Bank Credit Institutions 372 1038 678---------------------------------------------------------------------------------------------------------Source Bank of Russia Bank Supervision Report (Moscow) 2009 p 43
Finally Bank of Russia bank supervision reports also suggest that state banksexpanded their market shares of assets and capital during the years following the globalfinancial crisis While large private banks and foreign banks lost market share of bankassets and bank capital in Russia state banks increased their significant market sharefrom 405 ndash 426 percent and 471-476 percent of assets and capital respectivelyUnfortunately data from previous years and for specific banking groups was notobtained However this data does appear to indicate that our findings of competitiveadvantages and policy alternatives
Number and Market Share by Type of Bank
N Banks Assets Capital---------------------------- ---------------------------- ----------------------------
Type of Bank 2009 2010 2011 2009 2010 2011 2009 2010 2011-------------------------------------------------------------------------------------------------------------------------------State 17 22 27 405 439 458 471 489 473
Foreign 101 106 108 187 183 180 172 169 191Large Private 136 139 131 346 333 305 276 287 269Med-Small Moscow 361 335 317 27 26 26 43 34 35Medi-Small Regional 443 412 372 28 28 27 36 31 29Other Credit Institutions 50 51 57 07 04 04 01 02 03Total 1108 1058 100 100 100 100 100 100-------------------------------------------------------------------------------------------------------------------------------Source Bank of Russia Bank Supervision Report 2009 amp 2010
In sum politics and financial statecraft have led to the realization of significantcompetitive advantage by Russian state banks Sperbank and Vneshtorgbank increasedtheir share of bank assets from 32 percent in 2005 to over 50 percent by 2011 through
mergers and acquisitions and aggressive displacement of foreign banks Whatever thepolitics data from the Bank of Russia suggests that monetary authorities released a
8132019 Government Banking and BRICs in the Recent Financial Crisis
httpslidepdfcomreaderfullgovernment-banking-and-brics-in-the-recent-financial-crisis 5457
983106983122983113983107 983111983151983158983141983154983150983149983141983150983156 983106983137983150983147983155 983137983150983140 983110983145983150983137983150983139983145983137983148 983123983156983137983156983141983139983154983137983142983156
54
series of counter cyclical credit injections during 2008-9 to domestic bankinginstitutions Moreover data suggests that state banks continue to perform at or ahead oflevels reported by regional private and foreign banks The large market share andimproved performance of state banks reported in recent data suggests although the datais sparse that government banks in Russia have also modernized realized competitive
advantages and provided policy alternatives against the impact of financial crisisabroadWe were unable to find evidence of policy making toward social inclusion at the
Bank of Russia or Russian state banks despite the historical trajectory of the Sberbankas a savings bank under communism The context also appears to differ considerably Asurvey of the Zircon Research Group reportedly found that only 15 percent of Russiansretain bank accounts because of mistrust in banks and government This combination ofrealist politics and the realization of competitive advantages by Russian state bankssuggests that theories of economic statecraft in the realist tradition may indeed explainthe domestic developments under study
Conclusion
This paper reports evidence about government bank modernization and financialstatecraft in BRIC countries designed to counter the effects of crisis and shape domesticgrowth Government banks in BRIC countries have contributed to the widely notedadjustment of these economies to global financial crisis and economic downturnContrary to the Washington Consensus that prevailed during much of the 1980s and1990s (that privatization and liberalization especially of banking would free marketforces and deepen domestic financial systems) a quite different process of bank changeappears to have ensued after financial liberalization in the BRICs
Instead of replacement of state banks with private banks government banksremain central agents of domestic credit and growth and have modernized ldquojust intimerdquo The capitalization and realization of competitive advantages by large governmentbanks during the 2000s meant that once the US financial panic spread across capitalmarkets broke highly leveraged private and produced runs on private bank depositspolicy makers in BRIC countries nonetheless retained counter cyclical policyalternatives through their more solid large state banks
These findings counter traditional foci on the private sector individualentrepreneurship and ideals of free markets linked to the political and social advancesrecorded around the world in the last decades We report an anomaly for theories offinancial repression and the Washington Consensus about the virtues of privatization
and liberalization Although largely blamed for reproducing underdevelopment in thepast BRIC government banks averted excesses of private banking that drove creditbubbles such as home mortgages and derivatives in the US And since liberalization ofbanking (we have not adequately discussed how much liberalization occurred in eachcountry) government banks have modernized to compete with private and foreignbanks Government banks have realized competitive advantages and provided policyalternatives These two arguments help explain why BRIC countries have farecomparatively well in the face of financial crisis in core countries
Financial statecraft is therefore at the center of BRIC counter cyclical capacitiesand state planning Brazil Russia India and China fared significantly better thanadvanced and many developing countries in terms of adjusting to credit crunches and
export shocks This is because government banks proved critical interbank credit toretain confidence in domestic banking systems These institutions also presented other
8132019 Government Banking and BRICs in the Recent Financial Crisis
httpslidepdfcomreaderfullgovernment-banking-and-brics-in-the-recent-financial-crisis 5557
983106983122983113983107 983111983151983158983141983154983150983149983141983150983156 983106983137983150983147983155 983137983150983140 983110983145983150983137983150983139983145983137983148 983123983156983137983156983141983139983154983137983142983156
55
policy alternatives for political and social forces Politics shaped adjustment andrecovery through state banks differently in BRIC countries Given the realities of statecentered political realism in Russia the redirection of state banks toward goals ofChinese Five Year Plans and the modernization of the State Bank of India amidst anamorphous federalism the experience of Brazil with democratization and public bank
modernization may stand out (Armijo 2009)Further analysis of savings banks and cooperative banks also will be requiredAs members of the World Savings Bank Institute (a global association of savingsbanks) the Caixa in Brazil SNI and NABARD in India and China Postal Savings Bankappear to have provided access to very large numbers of previously unbanked citizensThis returns to traditional ideas of social banking and the history of savings banks thatwere founded throughout Europe since the late 18 th century The upmarket strategy andexpansion into investment banking and international banking of the Russian Sberbankconstrasts with downmarket strategies of savings banks in Brazil India and China
The financial press has recently reported doubts about bad loans in Chinese statebanks and cast doubt on the financial results posted and reported in this paper
However current estimates of 2-5 percent bad loans in Chinese state banks pale incomparison to the US$1240 billion in bad loans shifted to asset managementcompanies in the mid 2000s before capitalization of these institutions through sale ofshares Critics of state banking in Brazil also point to past levels of bad loans (reaching30-40 percent) because of their capture during military government delayed transitionBut the cost of capitalization and transfer of bad loans from Brazilian state banks alsoremained below US$400 billion and is still contingent on liquidation of assetmanagement companies created in 2001 In any case these numbers are very smallcompared to GAO estimates of US$120 trillion in emergency infusions by USmonetary authorities to banks and financial institutions from 2007-11
These are anomalies for recent market-based banking theory and neo-liberalpolicy designs However they do not run counter to orthodoxy in economics andbanking theory Over the last decades economic reforms (fiscal financial monetaryand banking) have improved transparency and brought public policy and marketexpectations closer However expectations about deregulation and free marketequilibria in banking and finance have succumbed in the face of panic and the stillsobering consequences of crisis The materials presented herein are descriptive and willrequire more careful analysis However given the urgency of searching for alternativedevelopment models and different approaches to financial statecraft in BRIC countriesand beyond we have taken the liberty to present research in initial stages and toprovoke thought along the lines suggested by our kind conveners
8132019 Government Banking and BRICs in the Recent Financial Crisis
httpslidepdfcomreaderfullgovernment-banking-and-brics-in-the-recent-financial-crisis 5657
983106983122983113983107 983111983151983158983141983154983150983149983141983150983156 983106983137983150983147983155 983137983150983140 983110983145983150983137983150983139983145983137983148 983123983156983137983156983141983139983154983137983142983156
56
Appendix on Alternative Banking and Social Inclusion
This appendix describes how ideas about government banking led to further work onalternative banking and social inclusion with help from the Rockefeller FoundationBellagio Center In July 2011 we were able to convene a conference designed to gather
scholars alternative banking executives and representatives from savings andcooperative bank associations to rethink strategies for social inclusion in the globalsouth and attempt to launch a new policy agenda Given the search for alternativestrategies to counter crisis and the advances of stabilization transparency and bankingsupervision in developing and emerging economies we call for alternative bankingcommunities in the global north and south to work together and help shape a new policyagenda for social inclusion Because savings banks credit cooperatives and otheralternative banking and finance institutions have realized competitive advantages andemerged from crisis we can now think beyond We believe that new policies may helpdeveloping and emerging nations redirect large domestic institutions such as postal andsavings banks toward meeting the UN millennium goals to eliminate poverty by 2015
Plans include writing a green paper on Core Principles for Alternative Bankingand Social Inclusion convening events to promote these principles through institutionalsupporters and networks and seeking adoption of these principles at policy venues suchas the World Savings Bank Institute the International Association of CooperativeBanks the Bank for International Settlements the International Financial ReportingStandards foundation the ISO International Standards Organization the Charter forResponsible Business regional development banks and the World Bank We also planto submit an edited volume of scholarly contributions on alternative banking and socialinclusion by year-end 2012 Interested parties are welcome to participate
Institutional supporters and networks include
Institutional SupportersColumbia University School of International and Public Affairs New YorkInstitute for Money Technology and Financial Inclusion University of CaliforniaIrvineKingacutes College Department of Management LondonSatildeo Paulo Business School Getulio Vargas FoundationSecond University of Naples
Networks
Association of Emerging Market Business Schools Satildeo Paulo BrazilCommunity of European Management Schools BrusselsCritical Political Economy NetworkEuropean Association of Co-operative Banks BrusselsGlobal Public Policy Network LondonInternational Cooperative Banking Association BrusselsSocial Science Finance Network AmsterdamSociety for Advancement of Social Economics PhiladelphiaWorld Savings Bank Institute Brussels
8132019 Government Banking and BRICs in the Recent Financial Crisis
httpslidepdfcomreaderfullgovernment-banking-and-brics-in-the-recent-financial-crisis 5757
983106983122983113983107 983111983151983158983141983154983150983149983141983150983156 983106983137983150983147983155 983137983150983140 983110983145983150983137983150983139983145983137983148 983123983156983137983156983141983139983154983137983142983156
Core Principles for Alternative Banking and Social Inclusion
Commitment to End Capital StarvationPromote access to and use of banking and financial services by all through newtechnologies and distribution channels to capitalize assets among the poor
Commitment to Universalize Income Savings Credit and FinanceProvide basic income via ATM cards and mobile banking to reach the poor and opennew channels of access to income savings credit finance insurance and opportunities
Prudent Banking and Regulatory ComplianceAlternative banking seeks to work within regulations guidelines and best practicesrecommended by domestic monetary authorities and international regulatory institutionssuch as the Bank for International Settlement Basel II Capital Risk Guidelines
Corporate Social Responsibility Leadership
Integrate corporate social responsibility into down-market business strategies andinstitutions of representation and democratization
Transparency and AccountabilityPublish annual reports and balance sheets in accord with international best practices offinancial social and sustainability reporting
Leadership in Provision of New Banking Services and Products to the PoorUse competitive advantages in banking and institutional networks to channel moreeffectively capital income and finance to the poor
Generate Sustainable Income and Household Asset AccumulationUse branch offices and new banking technologies to accelerate progress toward UNmillennium goals to eliminate poverty
Universalize Financial EducationPromote financial education to encourage responsible banking and finance and avertpredatory lending and unethical practices
Adopt Cutting Edge Technology and Management Practices to Provide
Competitive Alternative to Private Commercial and Investment Banks
Incorporate electronic card and mobile banking services to better serve the poorContribute to Realization of Bellagio Principles for SustainabilityPromote alternative banking and business practices that contribute to environmentallysustainable income consumption and production as stated in Bellagio Principles forSustainability
Respect and Build on National and Regional DifferencesI d f i l d l l i b ki i i i d i i l

8132019 Government Banking and BRICs in the Recent Financial Crisis
httpslidepdfcomreaderfullgovernment-banking-and-brics-in-the-recent-financial-crisis 3457
983106983122983113983107 983111983151983158983141983154983150983149983141983150983156 983106983137983150983147983155 983137983150983140 983110983145983150983137983150983139983145983137983148 983123983156983137983156983141983139983154983137983142983156
34
Capitalization of the BNDES by Treasury of over R$2300 billion 2009-11hascaptured attention of many observers of Brazilian development Critics and advocates agreethat the BNDES has realized significant competitive advantages over private and foreignbanks and continues to serve as significant alternative to capital markets for large scaledevelopment projects However like the downturn in planned investments by Petrobras for
oil and gas exploration and production BNDES decreased planned investments fromR$1684 billion in 2010 to R$1397 billion in 2011 We believe this indicates the limits ofmanagement and passing of period of crisis both favoring finance from capital marketsbanks and public-private partnerships
India
Analysis of Brazilian federal banks suggests that these institutions provided policy alternativewhile realizing competitive advantage over private and foreign banks The modernization ofthese institutions helps explain why these large institutions were able to stay the effects ofcredit crunch and financial market downturn in Brazil This section explores data from the
Reserve Bank of India to compare market shares of types of banks from 1972-2008 and bankperformance from 2006-10 Further analysis will be required However the data appears tosupport our core argument that government banks have modernized and realized competitiveadvantages over private and foreign banks
First the number of branch offices which serves as a measure of institutionalcoverage across India of special concern for financial inclusion and the theory thatliberalization and privatizations would lead private banks to expand branch offices andincrease the supply of services From this perspective the trajectory of branch officessuggests that nationalized banks the State Bank of India and regional rural bankssustain much larger networks of branch offices that predominate while otherscheduled commercial (private and foreign) banks retain less than 8000 branch offices
Data from the Reserve Bank of India on the number of current accounts retainedby type of bank provide further evidence that the State Bank of India and its associates
8132019 Government Banking and BRICs in the Recent Financial Crisis
httpslidepdfcomreaderfullgovernment-banking-and-brics-in-the-recent-financial-crisis 3557
983106983122983113983107 983111983151983158983141983154983150983149983141983150983156 983106983137983150983147983155 983137983150983140 983110983145983150983137983150983139983145983137983148 983123983156983137983156983141983139983154983137983142983156
35
national banks and regional rural banks provide the bulk of banking accounts to theIndian population while private and foreign banks cherry pick upscale urban marketsreproducing capital drain and inequalities
Number of Current Accounts by Type of Bank 1972-1995
Since 1999 the pattern of predominance by alternative banking institutions and the minorrole of other scheduled commercial banks and foreign banks continues
The following figures report the value held in current accounts by type of banks first fromthe 1972-1995 period then from the 1999-2008 period For both time periods the trendconfirms that private and foreign banks remain at a competitive disadvantage in terms of thebroader market while the State Bank of India and its associates nationalized banks andregional rural banks tend to predominate
8132019 Government Banking and BRICs in the Recent Financial Crisis
httpslidepdfcomreaderfullgovernment-banking-and-brics-in-the-recent-financial-crisis 3657
983106983122983113983107 983111983151983158983141983154983150983149983141983150983156 983106983137983150983147983155 983137983150983140 983110983145983150983137983150983139983145983137983148 983123983156983137983156983141983139983154983137983142983156
36
Current Account Value by Type of Bank 1972-1995 R
Number of Deposit Accounts by type of bank 1999-2008
A similar pattern appears for the trajectory of savings accounts both the number of
accounts and the value held in savings accounts both for the 1972-1995 period We wereunable to organize data from the more recent period
8132019 Government Banking and BRICs in the Recent Financial Crisis
httpslidepdfcomreaderfullgovernment-banking-and-brics-in-the-recent-financial-crisis 3757
983106983122983113983107 983111983151983158983141983154983150983149983141983150983156 983106983137983150983147983155 983137983150983140 983110983145983150983137983150983139983145983137983148 983123983156983137983156983141983139983154983137983142983156
37
Number of Savings Accounts by Type of Bank 1972-1995
Value in Savings Accounts by Type of Bank 1972-1995
Number of Term Savings Accounts by Type of Bank 1972-1995
8132019 Government Banking and BRICs in the Recent Financial Crisis
httpslidepdfcomreaderfullgovernment-banking-and-brics-in-the-recent-financial-crisis 3857
983106983122983113983107 983111983151983158983141983154983150983149983141983150983156 983106983137983150983147983155 983137983150983140 983110983145983150983137983150983139983145983137983148 983123983156983137983156983141983139983154983137983142983156
38
Value in Term Savings Accounts by Type of Bank 1972-1995
The number and value of credits extended by banks from 1999-2008 appears mostpromising in terms of comparative analysis of bank performance and behavior Thesignificant spread at the end of the time series between the State Bank of India and itsassociates and foreign banks suggests the impact of foreign financial crisis and differentdomestic policies by these types of banks in India similar to that noted in the Brazilianexperience
Number of credits by type of bank 1999-2008
Value of credit by type of bank 1996-2008
8132019 Government Banking and BRICs in the Recent Financial Crisis
httpslidepdfcomreaderfullgovernment-banking-and-brics-in-the-recent-financial-crisis 3957
983106983122983113983107 983111983151983158983141983154983150983149983141983150983156 983106983137983150983147983155 983137983150983140 983110983145983150983137983150983139983145983137983148 983123983156983137983156983141983139983154983137983142983156
39
Further data from the Reserve Bank of India from 2008-10 permit closercomparison of government private and foreign banks in the recent financial crisis Interms of deposits investments total assets and net profits the dominant and expandingrole of government banking in India is apparent Further control variables (not reported)
include gross and net NPA types of income expenses and expenditures provisions andcontingencies and credit- and investment-deposit ratios provide control for bad bankingand confirm the counter cyclical policies during 2008-10 in India
THE FOLLOWING TABLES REQUIRE INTERPRETATION
Number of Banks 2006-7 2007-8 2008-9 2009-10 2010-11
State Bank of India amp Associates 8 8 7 7 6Nationalized Banks 20 20 20 20 20Old Private Sector Banks 17 15 15 15 14
New Private Sector Banks 8 8 7 7 7Foreign Banks 29 28 31 32 33Source RBI A Profile of Banks 2010-11
Number of Branch Offices 2006-7 2007-8 2008-9 2009-10 2010-11
State Bank of India amp Associates 14673 15848 16894 18178 18772Nationalized Banks 37435 39255 40956 43452 45640Old Private Sector Banks 4723 4690 4908 5220 5011New Private Sector Banks 2599 3635 4333 5232 6957
Foreign Banks 272 277 295 308 316Source RBI A Profile of Banks 2010-11
Number of Employees 2006-7 2007-8 2008-9 2009-10 2010-11
State Bank of India amp Associates 255699 249008 268598 266605 282453Nationalized Banks 473179 466400 462926 473041 475082Old Private Sector Banks 47994 48700 51341 55052 55075New Private Sector Banks 91060 110123 124998 127468 163604Foreign Banks 28426 31301 29582 28012 27968
Source RBI - India BanksAssociation
Business per employee (in lakh) 2006-7 2007-8 2008-9 2009-10 2010-11
State Bank of India amp Associates 43635 54922 65022 73743 79306Nationalized Banks 49001 61828 78316 93586 114477Old Private Sector Banks 48159 56932 63843 69749 8149New Private Sector Banks 80782 83196 78715 84041 82607Foreign Banks 97477 11255 128274 141139 155974Note Business = Deposits + Advances
8132019 Government Banking and BRICs in the Recent Financial Crisis
httpslidepdfcomreaderfullgovernment-banking-and-brics-in-the-recent-financial-crisis 4057
983106983122983113983107 983111983151983158983141983154983150983149983141983150983156 983106983137983150983147983155 983137983150983140 983110983145983150983137983150983139983145983137983148 983123983156983137983156983141983139983154983137983142983156
40
Profit per employee (in lakh) 2006-7 2007-8 2008-9 2009-10 2010-11
State Bank of India amp Associates 257 362 443 466 42Nationalized Banks 287 377 486 567 695Old Private Sector Banks 234 406 469 42 563New Private Sector Banks 587 685 677 847 893Foreign Banks 1613 2112 2539 1692 2759
Capital amp Reserves amp Surplus(Ycrore) 2006-7 2007-8 2008-9 2009-10 2010-11
State Bank of India amp Associates 42941 61706 72422 83726 84394Nationalized Banks 92689 113079 135920 157276 205857Old Private Sector Banks 10736 15315 17477 20171 23821New Private Sector Banks 39736 76056 82192 99813 114768Foreign Banks 33075 49332 59937 69176 80972
Deposits Ycrore 2006-7 2007-8 2008-9 2009-10 2010-11
State Bank of India amp Associates 633476 773875 1007041 1108086 1245862Nationalized Banks 1360724 1679993 2105706 2583934 3127122Old Private Sector Banks 138249 165589 199274 229897 264157New Private Sector Banks 413738 509444 537104 592904 738602Foreign Banks 150750 191161 214076 232099 240689
Investments Ycrore 2006-7 2007-8 2008-9 2009-10 2010-11
State Bank of India amp Associates 211875 263823 357624 387473 385697Nationalized Banks 452981 536018 655042 828125 942837Old Private Sector Banks 43647 54080 72393 83499 92617New Private Sector Banks 171008 224498 234139 270618 329403Foreign Banks 71471 98910 130354 159291 165499
Advances Ycrore 2006-7 2007-8 2008-9 2009-10 2010-11
State Bank of India amp Associates 482270 593722 739450 857937 994154Nationalized Banks 957877 1203678 1519762 1843082 2311478
Old Private Sector Banks 92887 111670 128504 154085 184647New Private Sector Banks 321865 406733 446824 478356 612886Foreign Banks 126339 161133 165385 163260 195539
Interest Income Ycrore 2006-7 2007-8 2008-9 2009-10 2010-11
State Bank of India amp Associates 53465 70428 89196 97954 109828Nationalized Banks 110720 142647 183892 208029 256490Old Private Sector Banks 11474 14614 18790 20497 23299New Private Sector Banks 38092 56377 66282 62309 73528
Foreign Banks 17924 24417 30322 26390 28520
8132019 Government Banking and BRICs in the Recent Financial Crisis
httpslidepdfcomreaderfullgovernment-banking-and-brics-in-the-recent-financial-crisis 4157
983106983122983113983107 983111983151983158983141983154983150983149983141983150983156 983106983137983150983147983155 983137983150983140 983110983145983150983137983150983139983145983137983148 983123983156983137983156983141983139983154983137983142983156
41
Other Income Ycrore 2006-7 2007-8 2008-9 2009-10 2010-11
State Bank of India amp Associates 9420 11818 16073 18394 19240Nationalized Banks 14264 20979 26394 30500 28625Old Private Sector Banks 1568 2184 2782 3152 3029
New Private Sector Banks 10745 14822 15078 17271 17697Foreign Banks 7044 10588 14894 9951 10972
Interest Expended Ycrore 2006-7 2007-8 2008-9 2009-10 2010-11
State Bank of India amp Associates 32607 47809 61770 66229 67018Nationalized Banks 69353 101093 131676 145712 164135Old Private Sector Banks 7055 9960 12834 14076 14768New Private Sector Banks 25802 38535 44123 37130 42347Foreign Banks 7603 10604 12819 8938 10622
Operating Expenses Ycrore 2006-7 2007-8 2008-9 2009-10 2010-11
State Bank of India amp Associates 15987 16993 20088 25283 29146Nationalized Banks 27268 29670 35416 40792 53819Old Private Sector Banks 2967 3235 3939 4715 5600New Private Sector Banks 12353 17032 17840 18136 22006Foreign Banks 7745 10353 12298 11102 12557
Cost of Funds 2006-7 2007-8 2008-9 2009-10 2010-11
State Bank of India amp Associates 475 59 594 532 48Nationalized Banks 48 582 609 537 493Old Private Sector Banks 498 62 667 613 55New Private Sector Banks 524 611 604 442 427Foreign Banks 403 433 446 283 311Cost of Funds = Ratio () of interest paid on deposits and borrowings to averageof opening and closing balances of deposits and borrowings
Return on advances adjusted toCoF 2006-7 2007-8 2008-9 2009-10 2010-11
State Bank of India amp Associates 372 365 395 36 405Nationalized Banks 399 369 409 382 427Old Private Sector Banks 406 426 515 482 492New Private Sector Banks 447 505 526 514 516Foreign Banks 574 66 815 716 564
2006-7 2007-8 2008-9 2009-10 2010-11
8132019 Government Banking and BRICs in the Recent Financial Crisis
httpslidepdfcomreaderfullgovernment-banking-and-brics-in-the-recent-financial-crisis 4257
983106983122983113983107 983111983151983158983141983154983150983149983141983150983156 983106983137983150983147983155 983137983150983140 983110983145983150983137983150983139983145983137983148 983123983156983137983156983141983139983154983137983142983156
42
Wages as of Total Expenses
State Bank of India amp Associates 2155 1589 1506 171 1921Nationalized Banks 1794 1405 1331 1365 1641Old Private Sector Banks 1689 1367 1326 1457 1675
New Private Sector Banks 936 956 1017 121 1383Foreign Banks 2008 1995 1944 2348 2331
Returns on Assets 2006-7 2007-8 2008-9 2009-10 2010-11
State Bank of India amp Associates 086 097 102 091 079Nationalized Banks 094 101 103 100 103Old Private Sector Banks 078 114 115 095 112New Private Sector Banks 109 113 112 138 151Foreign Banks 228 209 199 126 174
Capital Adequacy Ratio 2006-7 2007-8 2008-9 2009-10 2010-11
State Bank of India amp Associates 1232 1321 1396 1346 1225Nationalized Banks 1237 1213 1324 1318 1347Old Private Sector Banks 1208 1408 1476 1485 1456New Private Sector Banks 1199 1439 1533 1803 1687Foreign Banks 1239 1305 1432 1726 1672Note To 2007-8 = Basel I From 2008-09 = Basel-II
Net NPA Ratio 2006-7 2007-8 2008-9 2009-10 2010-11
State Bank of India amp Associates 132 143 147 150 149Nationalized Banks 094 077 068 091 092Old Private Sector Banks 096 066 09 082 053New Private Sector Banks 097 109 129 103 056Foreign Banks 073 077 181 182 067Net NPA Ratio = Net non-performing assets as net advances
In sum descriptive data from the Reserve Bank of India confirm the anomaly
and argument drawn from the Brazilian experience An important dimension of BRICcountry recovery from the global financial crisis and downturn is the counter cyclicallending policies and realization of competitive advantages of government banks Thisposes a series of new questions for business schools and scholars of public policyInstead of liberalization and privatization leading to transitions in BRIC countriestoward capital market centered financial systems and liberal market economies publicbanks have realized competitive advantages over private and foreign banks whileproviding policy alternatives to BRIC governments in the face of financial crisis andglobal economic slowdown We return to these implications in the conclusion
One development of note at the Reserve Bank of India is a policy focus onfinancial inclusion The 2008 report of the Committee on Financial Inclusion has beenfollowed by sections of the Reserve Bank of India Annual Report reserved fordiscussion of financial inclusion And instead of focusing on liberalization and
8132019 Government Banking and BRICs in the Recent Financial Crisis
httpslidepdfcomreaderfullgovernment-banking-and-brics-in-the-recent-financial-crisis 4357
983106983122983113983107 983111983151983158983141983154983150983149983141983150983156 983106983137983150983147983155 983137983150983140 983110983145983150983137983150983139983145983137983148 983123983156983137983156983141983139983154983137983142983156
43
privatization to ensure the spread of banking products and services alternative policieshave been explored One is of special note The Committee on Financial Inclusionrecommended issue of identity cards as bank cards This would profoundly change thelandscape of banking in India and has attracted attention from analysts at the CentralBank of Brazil charged with financial inclusion as well as the President of Indonesia
and apparently Uganda officials Given the revolution in information and card paymenttechnologies this policy proposal and pilot studies deserve close attention asalternatives to dramatically increase the pace of social inclusion of the bankless
8132019 Government Banking and BRICs in the Recent Financial Crisis
httpslidepdfcomreaderfullgovernment-banking-and-brics-in-the-recent-financial-crisis 4457
983106983122983113983107 983111983151983158983141983154983150983149983141983150983156 983106983137983150983147983155 983137983150983140 983110983145983150983137983150983139983145983137983148 983123983156983137983156983141983139983154983137983142983156
44
China
This section turns to a brief review of the Chinese banking sector to further explore therole of government banks in terms of their modernization competitive advantages
policy roles and capacity for counter cyclical credit that help explain why BRICcountries were able to avert the severe consequences of the global financial crisis
First figure A11 reports the basic structure of the banking system in China
Although we have been unable to compare the evolution of types of banks acrosstime in similar ways to the above data on India taken from the Reserve Bank of Indiaour research assistants have gathered the following comparative macroeconomicfinancial and balance sheet data on banking in China The data appear to be consistentwith the core argument presented in this paper ndash that government banks havemodernized since liberalization and provided policy makers with alternative means tocounter the effects of financial crisis abroad
8132019 Government Banking and BRICs in the Recent Financial Crisis
httpslidepdfcomreaderfullgovernment-banking-and-brics-in-the-recent-financial-crisis 4557
983106983122983113983107 983111983151983158983141983154983150983149983141983150983156 983106983137983150983147983155 983137983150983140 983110983145983150983137983150983139983145983137983148 983123983156983137983156983141983139983154983137983142983156
45
We lack more current information and were unable to collect data directly fromofficial sources in China to compare the trajectory of state owned private and foreignbanks As a substitute Figure 1 reports data from 2000-4 that permits initial observationof trends for this earlier period
Those present may not need reminding of the formidable record of economicgrowth in China during this 200-4 period that continues until today However data fromthe National Bureau of Statistics suggests that the Chinese banking system expanded atan even greater pace than the remarkable levels of GDP growth recorded for the 2000-4period Furthermore credit expansion was ldquoorganicrdquo in the sense that deposits
outpaced credit growth from 2000-4
Expansion of Loans in China 1999-2004
Loan Growth Total LoansYear on Year
Growth Total Depositssup1Year on Year
GrowthYear CNY billion CNY () CNY billion CNY()1999 9373 83 10878 1372000 9937 60 1238 1382001 11231 130 14362 1602002 13129 169 17092 1902003 159 211 20806 217
2004 18857 186 25319 217
sup1Based on preliminary estimates by the National Bureau of Statistics of the Peoplersquos Republic of ChinaSource National Bureau of Statistics of the PRC
Although we lack data comparable to that from the Reserve Bank of India ableto compare the trajectory of state private and foreign banks in China the sectoralbreakdown of loans and other banking and national account data confirms the profoundcapitalization of the Chinese banking system and GDP growth during from 1995-2004
8132019 Government Banking and BRICs in the Recent Financial Crisis
httpslidepdfcomreaderfullgovernment-banking-and-brics-in-the-recent-financial-crisis 4657
983106983122983113983107 983111983151983158983141983154983150983149983141983150983156 983106983137983150983147983155 983137983150983140 983110983145983150983137983150983139983145983137983148 983123983156983137983156983141983139983154983137983142983156
46
China Banking Sector Market Dimensions (1995 - 2004)
YearTotal
LoansCorp
LoansConsuLoans
HomeLoans
TotalDeposits Excess
GovBonds
CorpBonds GDP
GDPGrowth
()1995 52310 mdash mdash mdash 5376 145 330 65 5848 2511996 63100 mdash mdash mdash 6847 538 436 60 6788 1611997 73585 7341 17 130 8212 853 551 52 7446 971998 85002 8447 53 430 9529 102 9 777 68 7835 521999 95587 9394 164 1360 10831 1273 1054 78 8207 482000 108763 10453 424 3320 13486 261 1302 86 894 892001 118990 112 699 5600 15472 3573 1562 101 9593 732002 139800 12913 1067 8258 18339 4359 mdash mdash 10479 922003 169770 15401 1576 13302 22036 5059 mdash mdash 11669 1142004 194220 16848 1988 15800 25319 5897 mdash mdash 13657 170Figures = CNYB
This data reported in terms of percent GDP provides further clarity on the rapid
capitalization of loans It is of note that the bulk of loans during this period were to thecorporate sector with consumer and home loans lagging significantly
China Banking Sector Percent GDP
YEARTotal
LoansCorporate
LoansConsumer
LoansHomeLoans Deposits
ExcessDeposits
GovBonds
CorpBonds
1995 895 00 00 00 919 25 56 111996 929 00 00 00 1009 79 64 091997 988 986 02 02 1103 115 74 071998 1085 1078 07 05 1216 131 99 091999 1165 1145 20 17 1320 155 128 092000 1217 1169 47 37 1508 292 146 102001 1240 1167 73 58 1613 372 163 112002 1334 1232 102 79 1750 4162003 1455 1320 135 114 1888 4342004 1422 1234 146 116 1854 432
Sources China Banking Regulatory Commission Peoplersquos Bank of China and GoldmanSachs research estimates
Compilation of financial data from a select number of banks in China suggeststhat the pattern of bank change encountered in Brazil and India also describes theexperience of China The liberalization of the Chinese economy and the modernization
of state banks appear to describe the process of bank change instead of a process oftransition toward private banking and capital market centered financial systemAlthough we have been unable to draw data from Chinese monetary authorities thebalance sheet data suggests the clear predominance of large state banks in the politicaleconomy of banking and finance in China How these institutions were used to counterthe effects of financial crisis abroad and redirect domestic investment production andconsumption must remain a subject for further research
8132019 Government Banking and BRICs in the Recent Financial Crisis
httpslidepdfcomreaderfullgovernment-banking-and-brics-in-the-recent-financial-crisis 4757
983106983122983113983107 983111983151983158983141983154983150983149983141983150983156 983106983137983150983147983155 983137983150983140 983110983145983150983137983150983139983145983137983148 983123983156983137983156983141983139983154983137983142983156
47
Select Financial Data from Chinese Banks 2004()
CNY (billion)Total
AssetsGrossLoans
CustomerDeposits Equity
NPLRatio
()
Pre-prov
ProfitsNet
Profits
State Banks
ICBC 5671 3705 5105 163 190 653 23CCB 3905 2226 3489 195 39 605 484ABC (NA) mdashBOC 427 2146 3342 205 51 578 209Quasi-State
BoCom 1145 639 1023 54 30 131 16CMB 587 376 513 22 29 82 32CITIC Industrial 515 306 429 20 60 52 03SPDB 456 311 397 14 24 62 20China Everbright mdashGuangdong Development 345 216 301 mdash mdash mdash 32
Industrial Bank 341 203 283 10 25 37 11Quase-Private
Bank of Shanghai 216 106 179 83 51 32 26Hua Xia 304 181 270 92 40 29 10Shenzhen Development 198 126 166 43 114 28 03Bank of Beijing 209 85 174 71 mdash 26 07
Sector total 19422 25319 129Three state-banks 2692 3979 188Second tier banks 2549 3733 148
ABC = Agriculture Bank of China BOC = Bank of China
BOCOM = Bank of Communications CCB = China Construction BankCMB = China Merchantrsquos Bank CNY = yuanICBC = Industrial and Commercial Bank of ChinaNPL = nonperforming loanROA = return on assets ROE = return on equityprov = provisioningPRC = Peoplersquos Republic of ChinaSPDB = Shanghai Pudong Development BankNote Loan and deposit market share for BOC and ICBC are for their domestic operations onlySources Company data Goldman Sachs research estimates
Returns on Assets Equity and Domestic Market Shares of Major China Banks 2004()
CNY (billion) ROA () ROE ()Deposit Mkt
Share ()Loan MktShare ()
Mortgage MktShare()
State Banks
ICBC 004 14 199 187 253CCB 130 254 138 115 217ABC (NA)BOC 051 102 101 89 152Quasi-State
BoCom 015 45 37 29 34CMB 060 161 20 19 29
CITIC Industrial 007 17 17 16 18SPDB 048 153 16 16 26
8132019 Government Banking and BRICs in the Recent Financial Crisis
httpslidepdfcomreaderfullgovernment-banking-and-brics-in-the-recent-financial-crisis 4857
983106983122983113983107 983111983151983158983141983154983150983149983141983150983156 983106983137983150983147983155 983137983150983140 983110983145983150983137983150983139983145983137983148 983123983156983137983156983141983139983154983137983142983156
48
China EverbrightGuangdong Development mdash mdash 12 11 mdashIndustrial Bank 037 126 11 10 10Quase-Private
Bank of Shanghai 129 360 07 05 14Hua Xia 038 116 11 09 07Shenzhen Development 017 75 07 06 08Bank of Beijing 037 108 07 04 07
Sector totalThree state-banks 438 391 622Second tier banks 144 127 154
ABC = Agriculture Bank of China BOC = Bank of China BOCOM = Bank of Communications CCB =China Construction Bank CMB = China Merchantrsquos Bank CNY = yuanICBC = Industrial and Commercial Bank of China mkt = market NPL = nonperforming loan ROA =return on asset ROE = return on equity prov = provisioning PRC =Peoplersquos Republic of China SPDB = Shanghai Pudong Development BankNote Loan and deposit market share for BOC and ICBC are for their domestic operations onlySources Company data Goldman Sachs research estimates
Further data from 2006-10 from the Peoples Bank of China suggests that the big5 state banks continue to outperform the next 12 largest joint stock commercial banksThe big five have launched sales of shares to capitalize while listing on capital marketsand adopting reporting of financial data along lines of international standards Thisappears to be similar to Banco do Brasil policies that retain majority of shares in federalgovernment control while capitalizing the bank through issues of stock
Comparing the Performance of Big 5 State Banks and Next 12 Joint Stock CommercialBanks in China
2006 2007 2008 2009 2010
Profit Margin Big 5 State Banks 3116 3143 2586 3026 3269
Next 12 JS Commercial Banks 2050 2791 1796 2159 2365
Returns Big 5 State Banks 507 606 860 691 675(risk adj) Next 12 JS Commercial Banks 459 570 1016 714 723
Op Risk Big 5 State Banks 5548 5539 5215 5319 5322Next 12 JS Commercial Banks 5886 5721 5725 5831 5947
Leverage Big 5 State Banks 1626 1482 1724 173 1734Next 12 JS Commercial Banks 2826 2251 2064 2048 1936
ROE Big 5 State Banks 1424 1557 1999 1925 2037Next 12 JS Commercial Banks 1564 2049 2156 1840 1967
Big 4 and 11 JSCBsSource Peoples Bank of China China Financial Stability Reports 2007-11
Performance indicators reported by the Peoples Bank of China for the big 5 statebanks and 12 next largest joint stock commercial banks also suggest that the largestgovernment banks in China retain significant competitive advantages ndash and may providepolicy alternatives Given the current shift of economic policy in China away fromindustry and export led growth to more sustainable domestic oriented growth and socialinclusion the role of state banks clearly comes to the fore
8132019 Government Banking and BRICs in the Recent Financial Crisis
httpslidepdfcomreaderfullgovernment-banking-and-brics-in-the-recent-financial-crisis 4957
983106983122983113983107 983111983151983158983141983154983150983149983141983150983156 983106983137983150983147983155 983137983150983140 983110983145983150983137983150983139983145983137983148 983123983156983137983156983141983139983154983137983142983156
49
Net Operating Income of Big 5 State Banks and Next 12 CommercialBanks 100 million RMB YuanBig 5 State Banks 2006 2007 2008 2009 2010
Balance Net interest income 349703 500456 556790 532206 720152Net fee amp commission inc 48524 103817 138464 175469 232491
Investment income 216089 283725 338865 324037 340440
Other business income (1807) (17054) 47548 33791 2186
Net operating income 612509 870944 1081667 1065503 1314943
Percent Net interest income 5709 5746 5148 4995 5477
Net fee amp commission inc 792 1192 1280 1646 1768
Investment income 3528 3258 3133 3041 2589
Other business income (030) (196) 440 318 166
Net operating income 10000 10000 10000 100 100
Next 12 Joint Stock CommercialBanks 2006 2007 2008 2009 2010
Net interest income 87253 132945 198965 191276 281588
Net fee amp commission inc 7850 16247 27319 30115 42023
Investment income 20959 32172 44864 50767 50500
Other business income 2306 4498 16359 10384 7400
Net operating income 118468 185861 287507 282542 381511
Percent Net interest income 7365 7153 6920 6769 7381
Net fee amp commission inc 671 874 950 1066 1101
Investment income 1769 1731 1560 1797 1324
Other business income 195 242 569 368 194Net operating income 10000 10000 10000 10000 10000
Source Peoples Bank of China China Financial Stability Reports 2007-11
Big 4 and 11 JSCBsBig 5 = ICBC ABC BOC CCB BOCOMNext 12 Joint Stock Commercial Banks = China CITIC Bank Everbright Bank Huaxia BankGuangdong Development Bank Shenzhen Development Bank China Merchants Bank Shanghai PudongDevelopment Bank Industrial Bank China Minsheng Banking Corporation Evergrowing Bank ChinaZheshang Bank Bohai Bank
In conclusion bank change in China also appears to confirm our findings from
Brazil ndash that state banks have realized competitive advantages and increased marketshares since liberalization while providing counter cyclical credit to ameliorateadjustment to crisis The modernization of the China Postal Savings Bank is ofparticular interest given its social mission downmarket focus and 40000 branchOffices throughout the country Expansion of card payment services through the postalbank system confirms the importance of the Brazilian federal savings bank (CaixaEconocircmica Federal Caixa) as agent for federal government social policy and agentresponsible for management of citizenship cards (12 million) and payment of familygrants This back to the future modernization of savings banks has proved essential forovercoming notorious levels of social exclusion and inequality in Brazil Althoughenglish language materials are unavailable on the China Postal Savings Bank thisinstitution clearly presents profound opportunities for comparable policies in China
8132019 Government Banking and BRICs in the Recent Financial Crisis
httpslidepdfcomreaderfullgovernment-banking-and-brics-in-the-recent-financial-crisis 5057
983106983122983113983107 983111983151983158983141983154983150983149983141983150983156 983106983137983150983147983155 983137983150983140 983110983145983150983137983150983139983145983137983148 983123983156983137983156983141983139983154983137983142983156
50
Reported offer of microfinance services for poverty reduction as part of nationaleconomic stimulous plan may point to developments in this direction
Given that state planning capacity has long been at the center of attention intheories of financial statecraft the role of Chinese state banks in redirecting policiesaccording to the 12th 5 Year plan for 2011-15 seems critical From 2000-5 the 10th 5
Year plan emphasized infrastructure and the attraction of investment and labor skillsThe 11th 5 Year plan (2006-10) raised concerns about sustainability rather than growthlevels while also seeking to spread improvements to balance development better servepeople and improve the quality of life continue to support Center and West provincesand revitalize Northeast provinces In comparison the 12th 5 Year plan calls for morebalanced lsquoinclusiversquo growth and structural adjustemts more than 4 trillion RMB($US600 billion) for targeted industries and interior regions a focus on new energynew materials and information and high technologies biology and new medicineenergy converstaion and environmental protection aerospace marine and advancedmanufacturing This implies fundamental shifts away from industry to services that hasbeen reported in macroeconomic data for 2010 If past studies emphasized directed
credit and industrial change the role of Chinese state banks in realizing transformationscertainly warrants study
Although the domestic flow of funds process of liberalization (or the lackthereof) and insertion of banking into Chinese political economy is beyond the scope ofthis paper our findings from Brazil appear to provide valuable hypotheses about ChinaThat is to say the big state banks and other government banks in China remaincommanding heights not in the Marxist sense of providing means to reach socialismbut immense institutions with profound presence throughout politics and markets in thecountry In this sense our findings from Brazil appear to approximate patterns ofchange in China more than Washington Consensus expectations about liberalization andprivatizations to free private and foreign banks Financial statecraft draws attention tothe capitalization of Chinese state banks through stock Sales and listings on capitalmarkets However like the Banco do Brasil (that reformers in the 1990s sought to shiftcontrol to the private sector only to increase federal government shareholding) theChinese experience surely involves unexpected consequences and patterns of changedifferent than a linear transition to the Berle amp Means paradigm of corporategovernance
Russia The New State Duopoly
ldquoThe rush of 2003-8 increased the market share of foreign banks to 285 from
52 However the state-owned banks received enormous help from the federal budget in the days of the crisis thereby strengthening their dominant
position on the Russian financial market says Sergey Aleksashenko the formerDeputy chairman of Russias Central Bank quotes Russia Profile Today one
must not harbor any illusion of a fair competition with them all the main cash
flows in Russia are controlled by state-owned banks httpwwwbarentsnovacomnode1031
Description of banking policy in Russia during the global financial crisis can beobtained from Bank of Russia annual reports and related publications The figure on the
following page summarizes the financial flows to and from the Bank of RussiaAlthough central bank policy is beyond the scope of this study the role of state banks in
8132019 Government Banking and BRICs in the Recent Financial Crisis
httpslidepdfcomreaderfullgovernment-banking-and-brics-in-the-recent-financial-crisis 5157
983106983122983113983107 983111983151983158983141983154983150983149983141983150983156 983106983137983150983147983155 983137983150983140 983110983145983150983137983150983139983145983137983148 983123983156983137983156983141983139983154983137983142983156
51
channeling counter-cyclical credits released by the Bank of Russia appear to confirm thecore argument that emerges from our studies of the Brazilian banking system Furtherdata on the following pages also suggest that state banks in Russia performed wellduring 2008-10 confirming on the basis of sparse data taken from Bank of Russiareports and documents that public banks have modernized provided counter-cyclical
credit to reverse credit crunch and economic downturn while realizing competitiveadvantages over private and foreign banks
8132019 Government Banking and BRICs in the Recent Financial Crisis
httpslidepdfcomreaderfullgovernment-banking-and-brics-in-the-recent-financial-crisis 5257
983106983122983113983107 983111983151983158983141983154983150983149983141983150983156 983106983137983150983147983155 983137983150983140 983110983145983150983137983150983139983145983137983148 983123983156983137983156983141983139983154983137983142983156
52
The following aggregate figures reported by the Bank of Russia suggest severaltrends of significance First Chart 32 suggests that household deposits shifted fromRuble deposits to foreign currency pegged (or indexed) during 2008 Second Chart 33illustrates the substantial increase of non-bank overdue debt during second semester
2008
Consequently the financial results and profitability of banks declinedsignificantly during 2008 The greater confidence in deposits with government banksfound abroad suggests that this may have been critical in Russia
Performance data deom 2008-10 provides a clearer picture one that is consistentwith our findings in Brazil State banks appear to have outperformed all other types of
banks except medium and small regional banks The following table reports the averagereturns on assets and returns on equity reported by the Bank of Russia 2008-10
Returns on Assets and Equity by Type of Bank in Russia 2008-9
Return on assets Return on equity 2008 2009 2010 2008 2009 2010
-------------------------------------------------------------------------------------------------------------------State Banks 22 08 24 157 46 148Foreign Banks 18 11 21 146 83 145Large private banks 13 03 11 106 28 84Medium-Small Banks Moscow 15 12 14 68 52 67
Medium-Small Regional Banks 21 12 15 131 65 98--------------------------------------------------------------------------------------------------------------------Source Bank of Russia Bank Supervision Reports 2009 and 2010
8132019 Government Banking and BRICs in the Recent Financial Crisis
httpslidepdfcomreaderfullgovernment-banking-and-brics-in-the-recent-financial-crisis 5357
983106983122983113983107 983111983151983158983141983154983150983149983141983150983156 983106983137983150983147983155 983137983150983140 983110983145983150983137983150983139983145983137983148 983123983156983137983156983141983139983154983137983142983156
53
Further data from the Bank of Russia on the capital adequacy of Banks during2009-10 suggest that foreign banks and large private banks remain less capitalizedagainst risks according to Basel II guidelines albeit at levels almost double thatrecommended by the Bank for International Settlements (80 risk weighted) Although
further analysis is needed this data is consistent from that reported in Brazil thatgovernment banks tend to more cautious and more prudent in terms of placing asidehigher levels of reserves and patrimony against possible losses
Capital Adequacy of Banks by Type of Bank in Russia 2009-10
2009 2010 2011---------------------------------------------------------------------------------------------------------State Banks 184 227 186Foreign Banks 155 196 195Large Private Banks 140 181 155
Medium-Small Banks Moscow 316 312 268Medium-Small Regional Banks 219 241 207Non-Bank Credit Institutions 372 1038 678---------------------------------------------------------------------------------------------------------Source Bank of Russia Bank Supervision Report (Moscow) 2009 p 43
Finally Bank of Russia bank supervision reports also suggest that state banksexpanded their market shares of assets and capital during the years following the globalfinancial crisis While large private banks and foreign banks lost market share of bankassets and bank capital in Russia state banks increased their significant market sharefrom 405 ndash 426 percent and 471-476 percent of assets and capital respectivelyUnfortunately data from previous years and for specific banking groups was notobtained However this data does appear to indicate that our findings of competitiveadvantages and policy alternatives
Number and Market Share by Type of Bank
N Banks Assets Capital---------------------------- ---------------------------- ----------------------------
Type of Bank 2009 2010 2011 2009 2010 2011 2009 2010 2011-------------------------------------------------------------------------------------------------------------------------------State 17 22 27 405 439 458 471 489 473
Foreign 101 106 108 187 183 180 172 169 191Large Private 136 139 131 346 333 305 276 287 269Med-Small Moscow 361 335 317 27 26 26 43 34 35Medi-Small Regional 443 412 372 28 28 27 36 31 29Other Credit Institutions 50 51 57 07 04 04 01 02 03Total 1108 1058 100 100 100 100 100 100-------------------------------------------------------------------------------------------------------------------------------Source Bank of Russia Bank Supervision Report 2009 amp 2010
In sum politics and financial statecraft have led to the realization of significantcompetitive advantage by Russian state banks Sperbank and Vneshtorgbank increasedtheir share of bank assets from 32 percent in 2005 to over 50 percent by 2011 through
mergers and acquisitions and aggressive displacement of foreign banks Whatever thepolitics data from the Bank of Russia suggests that monetary authorities released a
8132019 Government Banking and BRICs in the Recent Financial Crisis
httpslidepdfcomreaderfullgovernment-banking-and-brics-in-the-recent-financial-crisis 5457
983106983122983113983107 983111983151983158983141983154983150983149983141983150983156 983106983137983150983147983155 983137983150983140 983110983145983150983137983150983139983145983137983148 983123983156983137983156983141983139983154983137983142983156
54
series of counter cyclical credit injections during 2008-9 to domestic bankinginstitutions Moreover data suggests that state banks continue to perform at or ahead oflevels reported by regional private and foreign banks The large market share andimproved performance of state banks reported in recent data suggests although the datais sparse that government banks in Russia have also modernized realized competitive
advantages and provided policy alternatives against the impact of financial crisisabroadWe were unable to find evidence of policy making toward social inclusion at the
Bank of Russia or Russian state banks despite the historical trajectory of the Sberbankas a savings bank under communism The context also appears to differ considerably Asurvey of the Zircon Research Group reportedly found that only 15 percent of Russiansretain bank accounts because of mistrust in banks and government This combination ofrealist politics and the realization of competitive advantages by Russian state bankssuggests that theories of economic statecraft in the realist tradition may indeed explainthe domestic developments under study
Conclusion
This paper reports evidence about government bank modernization and financialstatecraft in BRIC countries designed to counter the effects of crisis and shape domesticgrowth Government banks in BRIC countries have contributed to the widely notedadjustment of these economies to global financial crisis and economic downturnContrary to the Washington Consensus that prevailed during much of the 1980s and1990s (that privatization and liberalization especially of banking would free marketforces and deepen domestic financial systems) a quite different process of bank changeappears to have ensued after financial liberalization in the BRICs
Instead of replacement of state banks with private banks government banksremain central agents of domestic credit and growth and have modernized ldquojust intimerdquo The capitalization and realization of competitive advantages by large governmentbanks during the 2000s meant that once the US financial panic spread across capitalmarkets broke highly leveraged private and produced runs on private bank depositspolicy makers in BRIC countries nonetheless retained counter cyclical policyalternatives through their more solid large state banks
These findings counter traditional foci on the private sector individualentrepreneurship and ideals of free markets linked to the political and social advancesrecorded around the world in the last decades We report an anomaly for theories offinancial repression and the Washington Consensus about the virtues of privatization
and liberalization Although largely blamed for reproducing underdevelopment in thepast BRIC government banks averted excesses of private banking that drove creditbubbles such as home mortgages and derivatives in the US And since liberalization ofbanking (we have not adequately discussed how much liberalization occurred in eachcountry) government banks have modernized to compete with private and foreignbanks Government banks have realized competitive advantages and provided policyalternatives These two arguments help explain why BRIC countries have farecomparatively well in the face of financial crisis in core countries
Financial statecraft is therefore at the center of BRIC counter cyclical capacitiesand state planning Brazil Russia India and China fared significantly better thanadvanced and many developing countries in terms of adjusting to credit crunches and
export shocks This is because government banks proved critical interbank credit toretain confidence in domestic banking systems These institutions also presented other
8132019 Government Banking and BRICs in the Recent Financial Crisis
httpslidepdfcomreaderfullgovernment-banking-and-brics-in-the-recent-financial-crisis 5557
983106983122983113983107 983111983151983158983141983154983150983149983141983150983156 983106983137983150983147983155 983137983150983140 983110983145983150983137983150983139983145983137983148 983123983156983137983156983141983139983154983137983142983156
55
policy alternatives for political and social forces Politics shaped adjustment andrecovery through state banks differently in BRIC countries Given the realities of statecentered political realism in Russia the redirection of state banks toward goals ofChinese Five Year Plans and the modernization of the State Bank of India amidst anamorphous federalism the experience of Brazil with democratization and public bank
modernization may stand out (Armijo 2009)Further analysis of savings banks and cooperative banks also will be requiredAs members of the World Savings Bank Institute (a global association of savingsbanks) the Caixa in Brazil SNI and NABARD in India and China Postal Savings Bankappear to have provided access to very large numbers of previously unbanked citizensThis returns to traditional ideas of social banking and the history of savings banks thatwere founded throughout Europe since the late 18 th century The upmarket strategy andexpansion into investment banking and international banking of the Russian Sberbankconstrasts with downmarket strategies of savings banks in Brazil India and China
The financial press has recently reported doubts about bad loans in Chinese statebanks and cast doubt on the financial results posted and reported in this paper
However current estimates of 2-5 percent bad loans in Chinese state banks pale incomparison to the US$1240 billion in bad loans shifted to asset managementcompanies in the mid 2000s before capitalization of these institutions through sale ofshares Critics of state banking in Brazil also point to past levels of bad loans (reaching30-40 percent) because of their capture during military government delayed transitionBut the cost of capitalization and transfer of bad loans from Brazilian state banks alsoremained below US$400 billion and is still contingent on liquidation of assetmanagement companies created in 2001 In any case these numbers are very smallcompared to GAO estimates of US$120 trillion in emergency infusions by USmonetary authorities to banks and financial institutions from 2007-11
These are anomalies for recent market-based banking theory and neo-liberalpolicy designs However they do not run counter to orthodoxy in economics andbanking theory Over the last decades economic reforms (fiscal financial monetaryand banking) have improved transparency and brought public policy and marketexpectations closer However expectations about deregulation and free marketequilibria in banking and finance have succumbed in the face of panic and the stillsobering consequences of crisis The materials presented herein are descriptive and willrequire more careful analysis However given the urgency of searching for alternativedevelopment models and different approaches to financial statecraft in BRIC countriesand beyond we have taken the liberty to present research in initial stages and toprovoke thought along the lines suggested by our kind conveners
8132019 Government Banking and BRICs in the Recent Financial Crisis
httpslidepdfcomreaderfullgovernment-banking-and-brics-in-the-recent-financial-crisis 5657
983106983122983113983107 983111983151983158983141983154983150983149983141983150983156 983106983137983150983147983155 983137983150983140 983110983145983150983137983150983139983145983137983148 983123983156983137983156983141983139983154983137983142983156
56
Appendix on Alternative Banking and Social Inclusion
This appendix describes how ideas about government banking led to further work onalternative banking and social inclusion with help from the Rockefeller FoundationBellagio Center In July 2011 we were able to convene a conference designed to gather
scholars alternative banking executives and representatives from savings andcooperative bank associations to rethink strategies for social inclusion in the globalsouth and attempt to launch a new policy agenda Given the search for alternativestrategies to counter crisis and the advances of stabilization transparency and bankingsupervision in developing and emerging economies we call for alternative bankingcommunities in the global north and south to work together and help shape a new policyagenda for social inclusion Because savings banks credit cooperatives and otheralternative banking and finance institutions have realized competitive advantages andemerged from crisis we can now think beyond We believe that new policies may helpdeveloping and emerging nations redirect large domestic institutions such as postal andsavings banks toward meeting the UN millennium goals to eliminate poverty by 2015
Plans include writing a green paper on Core Principles for Alternative Bankingand Social Inclusion convening events to promote these principles through institutionalsupporters and networks and seeking adoption of these principles at policy venues suchas the World Savings Bank Institute the International Association of CooperativeBanks the Bank for International Settlements the International Financial ReportingStandards foundation the ISO International Standards Organization the Charter forResponsible Business regional development banks and the World Bank We also planto submit an edited volume of scholarly contributions on alternative banking and socialinclusion by year-end 2012 Interested parties are welcome to participate
Institutional supporters and networks include
Institutional SupportersColumbia University School of International and Public Affairs New YorkInstitute for Money Technology and Financial Inclusion University of CaliforniaIrvineKingacutes College Department of Management LondonSatildeo Paulo Business School Getulio Vargas FoundationSecond University of Naples
Networks
Association of Emerging Market Business Schools Satildeo Paulo BrazilCommunity of European Management Schools BrusselsCritical Political Economy NetworkEuropean Association of Co-operative Banks BrusselsGlobal Public Policy Network LondonInternational Cooperative Banking Association BrusselsSocial Science Finance Network AmsterdamSociety for Advancement of Social Economics PhiladelphiaWorld Savings Bank Institute Brussels
8132019 Government Banking and BRICs in the Recent Financial Crisis
httpslidepdfcomreaderfullgovernment-banking-and-brics-in-the-recent-financial-crisis 5757
983106983122983113983107 983111983151983158983141983154983150983149983141983150983156 983106983137983150983147983155 983137983150983140 983110983145983150983137983150983139983145983137983148 983123983156983137983156983141983139983154983137983142983156
Core Principles for Alternative Banking and Social Inclusion
Commitment to End Capital StarvationPromote access to and use of banking and financial services by all through newtechnologies and distribution channels to capitalize assets among the poor
Commitment to Universalize Income Savings Credit and FinanceProvide basic income via ATM cards and mobile banking to reach the poor and opennew channels of access to income savings credit finance insurance and opportunities
Prudent Banking and Regulatory ComplianceAlternative banking seeks to work within regulations guidelines and best practicesrecommended by domestic monetary authorities and international regulatory institutionssuch as the Bank for International Settlement Basel II Capital Risk Guidelines
Corporate Social Responsibility Leadership
Integrate corporate social responsibility into down-market business strategies andinstitutions of representation and democratization
Transparency and AccountabilityPublish annual reports and balance sheets in accord with international best practices offinancial social and sustainability reporting
Leadership in Provision of New Banking Services and Products to the PoorUse competitive advantages in banking and institutional networks to channel moreeffectively capital income and finance to the poor
Generate Sustainable Income and Household Asset AccumulationUse branch offices and new banking technologies to accelerate progress toward UNmillennium goals to eliminate poverty
Universalize Financial EducationPromote financial education to encourage responsible banking and finance and avertpredatory lending and unethical practices
Adopt Cutting Edge Technology and Management Practices to Provide
Competitive Alternative to Private Commercial and Investment Banks
Incorporate electronic card and mobile banking services to better serve the poorContribute to Realization of Bellagio Principles for SustainabilityPromote alternative banking and business practices that contribute to environmentallysustainable income consumption and production as stated in Bellagio Principles forSustainability
Respect and Build on National and Regional DifferencesI d f i l d l l i b ki i i i d i i l
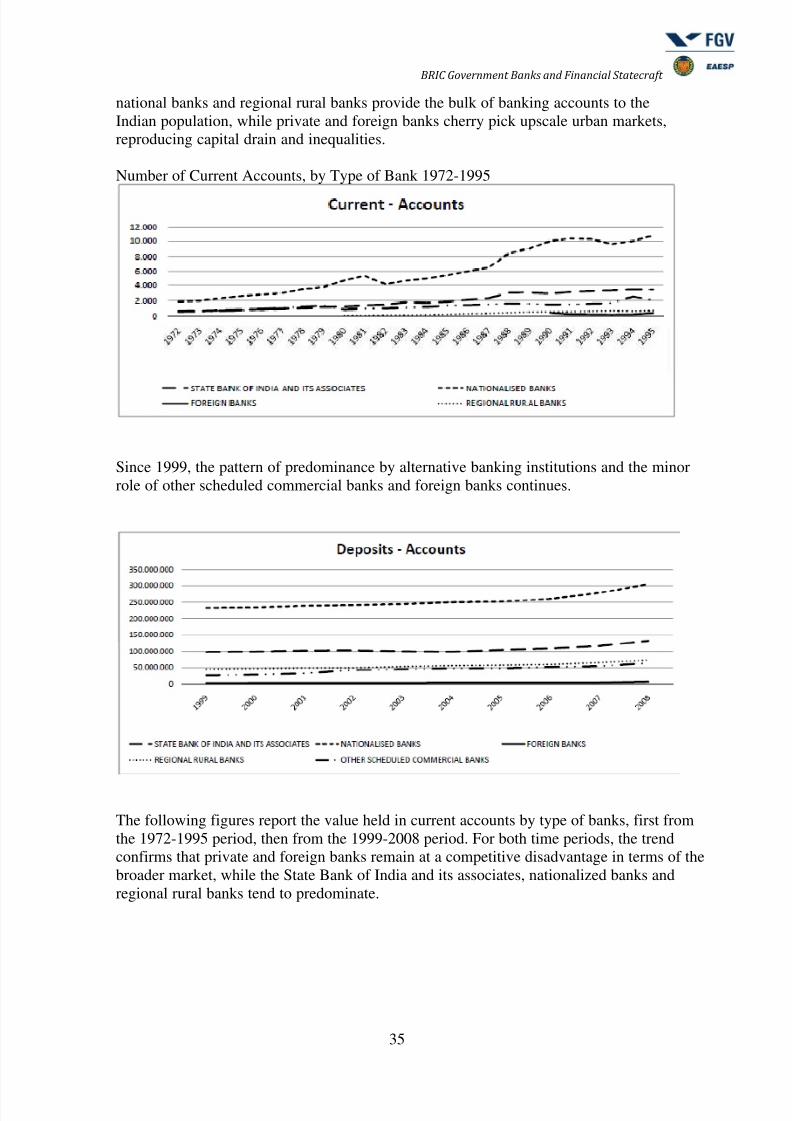
8132019 Government Banking and BRICs in the Recent Financial Crisis
httpslidepdfcomreaderfullgovernment-banking-and-brics-in-the-recent-financial-crisis 3757
983106983122983113983107 983111983151983158983141983154983150983149983141983150983156 983106983137983150983147983155 983137983150983140 983110983145983150983137983150983139983145983137983148 983123983156983137983156983141983139983154983137983142983156
37
Number of Savings Accounts by Type of Bank 1972-1995
Value in Savings Accounts by Type of Bank 1972-1995
Number of Term Savings Accounts by Type of Bank 1972-1995
8132019 Government Banking and BRICs in the Recent Financial Crisis
httpslidepdfcomreaderfullgovernment-banking-and-brics-in-the-recent-financial-crisis 3857
983106983122983113983107 983111983151983158983141983154983150983149983141983150983156 983106983137983150983147983155 983137983150983140 983110983145983150983137983150983139983145983137983148 983123983156983137983156983141983139983154983137983142983156
38
Value in Term Savings Accounts by Type of Bank 1972-1995
The number and value of credits extended by banks from 1999-2008 appears mostpromising in terms of comparative analysis of bank performance and behavior Thesignificant spread at the end of the time series between the State Bank of India and itsassociates and foreign banks suggests the impact of foreign financial crisis and differentdomestic policies by these types of banks in India similar to that noted in the Brazilianexperience
Number of credits by type of bank 1999-2008
Value of credit by type of bank 1996-2008
8132019 Government Banking and BRICs in the Recent Financial Crisis
httpslidepdfcomreaderfullgovernment-banking-and-brics-in-the-recent-financial-crisis 3957
983106983122983113983107 983111983151983158983141983154983150983149983141983150983156 983106983137983150983147983155 983137983150983140 983110983145983150983137983150983139983145983137983148 983123983156983137983156983141983139983154983137983142983156
39
Further data from the Reserve Bank of India from 2008-10 permit closercomparison of government private and foreign banks in the recent financial crisis Interms of deposits investments total assets and net profits the dominant and expandingrole of government banking in India is apparent Further control variables (not reported)
include gross and net NPA types of income expenses and expenditures provisions andcontingencies and credit- and investment-deposit ratios provide control for bad bankingand confirm the counter cyclical policies during 2008-10 in India
THE FOLLOWING TABLES REQUIRE INTERPRETATION
Number of Banks 2006-7 2007-8 2008-9 2009-10 2010-11
State Bank of India amp Associates 8 8 7 7 6Nationalized Banks 20 20 20 20 20Old Private Sector Banks 17 15 15 15 14
New Private Sector Banks 8 8 7 7 7Foreign Banks 29 28 31 32 33Source RBI A Profile of Banks 2010-11
Number of Branch Offices 2006-7 2007-8 2008-9 2009-10 2010-11
State Bank of India amp Associates 14673 15848 16894 18178 18772Nationalized Banks 37435 39255 40956 43452 45640Old Private Sector Banks 4723 4690 4908 5220 5011New Private Sector Banks 2599 3635 4333 5232 6957
Foreign Banks 272 277 295 308 316Source RBI A Profile of Banks 2010-11
Number of Employees 2006-7 2007-8 2008-9 2009-10 2010-11
State Bank of India amp Associates 255699 249008 268598 266605 282453Nationalized Banks 473179 466400 462926 473041 475082Old Private Sector Banks 47994 48700 51341 55052 55075New Private Sector Banks 91060 110123 124998 127468 163604Foreign Banks 28426 31301 29582 28012 27968
Source RBI - India BanksAssociation
Business per employee (in lakh) 2006-7 2007-8 2008-9 2009-10 2010-11
State Bank of India amp Associates 43635 54922 65022 73743 79306Nationalized Banks 49001 61828 78316 93586 114477Old Private Sector Banks 48159 56932 63843 69749 8149New Private Sector Banks 80782 83196 78715 84041 82607Foreign Banks 97477 11255 128274 141139 155974Note Business = Deposits + Advances
8132019 Government Banking and BRICs in the Recent Financial Crisis
httpslidepdfcomreaderfullgovernment-banking-and-brics-in-the-recent-financial-crisis 4057
983106983122983113983107 983111983151983158983141983154983150983149983141983150983156 983106983137983150983147983155 983137983150983140 983110983145983150983137983150983139983145983137983148 983123983156983137983156983141983139983154983137983142983156
40
Profit per employee (in lakh) 2006-7 2007-8 2008-9 2009-10 2010-11
State Bank of India amp Associates 257 362 443 466 42Nationalized Banks 287 377 486 567 695Old Private Sector Banks 234 406 469 42 563New Private Sector Banks 587 685 677 847 893Foreign Banks 1613 2112 2539 1692 2759
Capital amp Reserves amp Surplus(Ycrore) 2006-7 2007-8 2008-9 2009-10 2010-11
State Bank of India amp Associates 42941 61706 72422 83726 84394Nationalized Banks 92689 113079 135920 157276 205857Old Private Sector Banks 10736 15315 17477 20171 23821New Private Sector Banks 39736 76056 82192 99813 114768Foreign Banks 33075 49332 59937 69176 80972
Deposits Ycrore 2006-7 2007-8 2008-9 2009-10 2010-11
State Bank of India amp Associates 633476 773875 1007041 1108086 1245862Nationalized Banks 1360724 1679993 2105706 2583934 3127122Old Private Sector Banks 138249 165589 199274 229897 264157New Private Sector Banks 413738 509444 537104 592904 738602Foreign Banks 150750 191161 214076 232099 240689
Investments Ycrore 2006-7 2007-8 2008-9 2009-10 2010-11
State Bank of India amp Associates 211875 263823 357624 387473 385697Nationalized Banks 452981 536018 655042 828125 942837Old Private Sector Banks 43647 54080 72393 83499 92617New Private Sector Banks 171008 224498 234139 270618 329403Foreign Banks 71471 98910 130354 159291 165499
Advances Ycrore 2006-7 2007-8 2008-9 2009-10 2010-11
State Bank of India amp Associates 482270 593722 739450 857937 994154Nationalized Banks 957877 1203678 1519762 1843082 2311478
Old Private Sector Banks 92887 111670 128504 154085 184647New Private Sector Banks 321865 406733 446824 478356 612886Foreign Banks 126339 161133 165385 163260 195539
Interest Income Ycrore 2006-7 2007-8 2008-9 2009-10 2010-11
State Bank of India amp Associates 53465 70428 89196 97954 109828Nationalized Banks 110720 142647 183892 208029 256490Old Private Sector Banks 11474 14614 18790 20497 23299New Private Sector Banks 38092 56377 66282 62309 73528
Foreign Banks 17924 24417 30322 26390 28520
8132019 Government Banking and BRICs in the Recent Financial Crisis
httpslidepdfcomreaderfullgovernment-banking-and-brics-in-the-recent-financial-crisis 4157
983106983122983113983107 983111983151983158983141983154983150983149983141983150983156 983106983137983150983147983155 983137983150983140 983110983145983150983137983150983139983145983137983148 983123983156983137983156983141983139983154983137983142983156
41
Other Income Ycrore 2006-7 2007-8 2008-9 2009-10 2010-11
State Bank of India amp Associates 9420 11818 16073 18394 19240Nationalized Banks 14264 20979 26394 30500 28625Old Private Sector Banks 1568 2184 2782 3152 3029
New Private Sector Banks 10745 14822 15078 17271 17697Foreign Banks 7044 10588 14894 9951 10972
Interest Expended Ycrore 2006-7 2007-8 2008-9 2009-10 2010-11
State Bank of India amp Associates 32607 47809 61770 66229 67018Nationalized Banks 69353 101093 131676 145712 164135Old Private Sector Banks 7055 9960 12834 14076 14768New Private Sector Banks 25802 38535 44123 37130 42347Foreign Banks 7603 10604 12819 8938 10622
Operating Expenses Ycrore 2006-7 2007-8 2008-9 2009-10 2010-11
State Bank of India amp Associates 15987 16993 20088 25283 29146Nationalized Banks 27268 29670 35416 40792 53819Old Private Sector Banks 2967 3235 3939 4715 5600New Private Sector Banks 12353 17032 17840 18136 22006Foreign Banks 7745 10353 12298 11102 12557
Cost of Funds 2006-7 2007-8 2008-9 2009-10 2010-11
State Bank of India amp Associates 475 59 594 532 48Nationalized Banks 48 582 609 537 493Old Private Sector Banks 498 62 667 613 55New Private Sector Banks 524 611 604 442 427Foreign Banks 403 433 446 283 311Cost of Funds = Ratio () of interest paid on deposits and borrowings to averageof opening and closing balances of deposits and borrowings
Return on advances adjusted toCoF 2006-7 2007-8 2008-9 2009-10 2010-11
State Bank of India amp Associates 372 365 395 36 405Nationalized Banks 399 369 409 382 427Old Private Sector Banks 406 426 515 482 492New Private Sector Banks 447 505 526 514 516Foreign Banks 574 66 815 716 564
2006-7 2007-8 2008-9 2009-10 2010-11
8132019 Government Banking and BRICs in the Recent Financial Crisis
httpslidepdfcomreaderfullgovernment-banking-and-brics-in-the-recent-financial-crisis 4257
983106983122983113983107 983111983151983158983141983154983150983149983141983150983156 983106983137983150983147983155 983137983150983140 983110983145983150983137983150983139983145983137983148 983123983156983137983156983141983139983154983137983142983156
42
Wages as of Total Expenses
State Bank of India amp Associates 2155 1589 1506 171 1921Nationalized Banks 1794 1405 1331 1365 1641Old Private Sector Banks 1689 1367 1326 1457 1675
New Private Sector Banks 936 956 1017 121 1383Foreign Banks 2008 1995 1944 2348 2331
Returns on Assets 2006-7 2007-8 2008-9 2009-10 2010-11
State Bank of India amp Associates 086 097 102 091 079Nationalized Banks 094 101 103 100 103Old Private Sector Banks 078 114 115 095 112New Private Sector Banks 109 113 112 138 151Foreign Banks 228 209 199 126 174
Capital Adequacy Ratio 2006-7 2007-8 2008-9 2009-10 2010-11
State Bank of India amp Associates 1232 1321 1396 1346 1225Nationalized Banks 1237 1213 1324 1318 1347Old Private Sector Banks 1208 1408 1476 1485 1456New Private Sector Banks 1199 1439 1533 1803 1687Foreign Banks 1239 1305 1432 1726 1672Note To 2007-8 = Basel I From 2008-09 = Basel-II
Net NPA Ratio 2006-7 2007-8 2008-9 2009-10 2010-11
State Bank of India amp Associates 132 143 147 150 149Nationalized Banks 094 077 068 091 092Old Private Sector Banks 096 066 09 082 053New Private Sector Banks 097 109 129 103 056Foreign Banks 073 077 181 182 067Net NPA Ratio = Net non-performing assets as net advances
In sum descriptive data from the Reserve Bank of India confirm the anomaly
and argument drawn from the Brazilian experience An important dimension of BRICcountry recovery from the global financial crisis and downturn is the counter cyclicallending policies and realization of competitive advantages of government banks Thisposes a series of new questions for business schools and scholars of public policyInstead of liberalization and privatization leading to transitions in BRIC countriestoward capital market centered financial systems and liberal market economies publicbanks have realized competitive advantages over private and foreign banks whileproviding policy alternatives to BRIC governments in the face of financial crisis andglobal economic slowdown We return to these implications in the conclusion
One development of note at the Reserve Bank of India is a policy focus onfinancial inclusion The 2008 report of the Committee on Financial Inclusion has beenfollowed by sections of the Reserve Bank of India Annual Report reserved fordiscussion of financial inclusion And instead of focusing on liberalization and
8132019 Government Banking and BRICs in the Recent Financial Crisis
httpslidepdfcomreaderfullgovernment-banking-and-brics-in-the-recent-financial-crisis 4357
983106983122983113983107 983111983151983158983141983154983150983149983141983150983156 983106983137983150983147983155 983137983150983140 983110983145983150983137983150983139983145983137983148 983123983156983137983156983141983139983154983137983142983156
43
privatization to ensure the spread of banking products and services alternative policieshave been explored One is of special note The Committee on Financial Inclusionrecommended issue of identity cards as bank cards This would profoundly change thelandscape of banking in India and has attracted attention from analysts at the CentralBank of Brazil charged with financial inclusion as well as the President of Indonesia
and apparently Uganda officials Given the revolution in information and card paymenttechnologies this policy proposal and pilot studies deserve close attention asalternatives to dramatically increase the pace of social inclusion of the bankless
8132019 Government Banking and BRICs in the Recent Financial Crisis
httpslidepdfcomreaderfullgovernment-banking-and-brics-in-the-recent-financial-crisis 4457
983106983122983113983107 983111983151983158983141983154983150983149983141983150983156 983106983137983150983147983155 983137983150983140 983110983145983150983137983150983139983145983137983148 983123983156983137983156983141983139983154983137983142983156
44
China
This section turns to a brief review of the Chinese banking sector to further explore therole of government banks in terms of their modernization competitive advantages
policy roles and capacity for counter cyclical credit that help explain why BRICcountries were able to avert the severe consequences of the global financial crisis
First figure A11 reports the basic structure of the banking system in China
Although we have been unable to compare the evolution of types of banks acrosstime in similar ways to the above data on India taken from the Reserve Bank of Indiaour research assistants have gathered the following comparative macroeconomicfinancial and balance sheet data on banking in China The data appear to be consistentwith the core argument presented in this paper ndash that government banks havemodernized since liberalization and provided policy makers with alternative means tocounter the effects of financial crisis abroad
8132019 Government Banking and BRICs in the Recent Financial Crisis
httpslidepdfcomreaderfullgovernment-banking-and-brics-in-the-recent-financial-crisis 4557
983106983122983113983107 983111983151983158983141983154983150983149983141983150983156 983106983137983150983147983155 983137983150983140 983110983145983150983137983150983139983145983137983148 983123983156983137983156983141983139983154983137983142983156
45
We lack more current information and were unable to collect data directly fromofficial sources in China to compare the trajectory of state owned private and foreignbanks As a substitute Figure 1 reports data from 2000-4 that permits initial observationof trends for this earlier period
Those present may not need reminding of the formidable record of economicgrowth in China during this 200-4 period that continues until today However data fromthe National Bureau of Statistics suggests that the Chinese banking system expanded atan even greater pace than the remarkable levels of GDP growth recorded for the 2000-4period Furthermore credit expansion was ldquoorganicrdquo in the sense that deposits
outpaced credit growth from 2000-4
Expansion of Loans in China 1999-2004
Loan Growth Total LoansYear on Year
Growth Total Depositssup1Year on Year
GrowthYear CNY billion CNY () CNY billion CNY()1999 9373 83 10878 1372000 9937 60 1238 1382001 11231 130 14362 1602002 13129 169 17092 1902003 159 211 20806 217
2004 18857 186 25319 217
sup1Based on preliminary estimates by the National Bureau of Statistics of the Peoplersquos Republic of ChinaSource National Bureau of Statistics of the PRC
Although we lack data comparable to that from the Reserve Bank of India ableto compare the trajectory of state private and foreign banks in China the sectoralbreakdown of loans and other banking and national account data confirms the profoundcapitalization of the Chinese banking system and GDP growth during from 1995-2004
8132019 Government Banking and BRICs in the Recent Financial Crisis
httpslidepdfcomreaderfullgovernment-banking-and-brics-in-the-recent-financial-crisis 4657
983106983122983113983107 983111983151983158983141983154983150983149983141983150983156 983106983137983150983147983155 983137983150983140 983110983145983150983137983150983139983145983137983148 983123983156983137983156983141983139983154983137983142983156
46
China Banking Sector Market Dimensions (1995 - 2004)
YearTotal
LoansCorp
LoansConsuLoans
HomeLoans
TotalDeposits Excess
GovBonds
CorpBonds GDP
GDPGrowth
()1995 52310 mdash mdash mdash 5376 145 330 65 5848 2511996 63100 mdash mdash mdash 6847 538 436 60 6788 1611997 73585 7341 17 130 8212 853 551 52 7446 971998 85002 8447 53 430 9529 102 9 777 68 7835 521999 95587 9394 164 1360 10831 1273 1054 78 8207 482000 108763 10453 424 3320 13486 261 1302 86 894 892001 118990 112 699 5600 15472 3573 1562 101 9593 732002 139800 12913 1067 8258 18339 4359 mdash mdash 10479 922003 169770 15401 1576 13302 22036 5059 mdash mdash 11669 1142004 194220 16848 1988 15800 25319 5897 mdash mdash 13657 170Figures = CNYB
This data reported in terms of percent GDP provides further clarity on the rapid
capitalization of loans It is of note that the bulk of loans during this period were to thecorporate sector with consumer and home loans lagging significantly
China Banking Sector Percent GDP
YEARTotal
LoansCorporate
LoansConsumer
LoansHomeLoans Deposits
ExcessDeposits
GovBonds
CorpBonds
1995 895 00 00 00 919 25 56 111996 929 00 00 00 1009 79 64 091997 988 986 02 02 1103 115 74 071998 1085 1078 07 05 1216 131 99 091999 1165 1145 20 17 1320 155 128 092000 1217 1169 47 37 1508 292 146 102001 1240 1167 73 58 1613 372 163 112002 1334 1232 102 79 1750 4162003 1455 1320 135 114 1888 4342004 1422 1234 146 116 1854 432
Sources China Banking Regulatory Commission Peoplersquos Bank of China and GoldmanSachs research estimates
Compilation of financial data from a select number of banks in China suggeststhat the pattern of bank change encountered in Brazil and India also describes theexperience of China The liberalization of the Chinese economy and the modernization
of state banks appear to describe the process of bank change instead of a process oftransition toward private banking and capital market centered financial systemAlthough we have been unable to draw data from Chinese monetary authorities thebalance sheet data suggests the clear predominance of large state banks in the politicaleconomy of banking and finance in China How these institutions were used to counterthe effects of financial crisis abroad and redirect domestic investment production andconsumption must remain a subject for further research
8132019 Government Banking and BRICs in the Recent Financial Crisis
httpslidepdfcomreaderfullgovernment-banking-and-brics-in-the-recent-financial-crisis 4757
983106983122983113983107 983111983151983158983141983154983150983149983141983150983156 983106983137983150983147983155 983137983150983140 983110983145983150983137983150983139983145983137983148 983123983156983137983156983141983139983154983137983142983156
47
Select Financial Data from Chinese Banks 2004()
CNY (billion)Total
AssetsGrossLoans
CustomerDeposits Equity
NPLRatio
()
Pre-prov
ProfitsNet
Profits
State Banks
ICBC 5671 3705 5105 163 190 653 23CCB 3905 2226 3489 195 39 605 484ABC (NA) mdashBOC 427 2146 3342 205 51 578 209Quasi-State
BoCom 1145 639 1023 54 30 131 16CMB 587 376 513 22 29 82 32CITIC Industrial 515 306 429 20 60 52 03SPDB 456 311 397 14 24 62 20China Everbright mdashGuangdong Development 345 216 301 mdash mdash mdash 32
Industrial Bank 341 203 283 10 25 37 11Quase-Private
Bank of Shanghai 216 106 179 83 51 32 26Hua Xia 304 181 270 92 40 29 10Shenzhen Development 198 126 166 43 114 28 03Bank of Beijing 209 85 174 71 mdash 26 07
Sector total 19422 25319 129Three state-banks 2692 3979 188Second tier banks 2549 3733 148
ABC = Agriculture Bank of China BOC = Bank of China
BOCOM = Bank of Communications CCB = China Construction BankCMB = China Merchantrsquos Bank CNY = yuanICBC = Industrial and Commercial Bank of ChinaNPL = nonperforming loanROA = return on assets ROE = return on equityprov = provisioningPRC = Peoplersquos Republic of ChinaSPDB = Shanghai Pudong Development BankNote Loan and deposit market share for BOC and ICBC are for their domestic operations onlySources Company data Goldman Sachs research estimates
Returns on Assets Equity and Domestic Market Shares of Major China Banks 2004()
CNY (billion) ROA () ROE ()Deposit Mkt
Share ()Loan MktShare ()
Mortgage MktShare()
State Banks
ICBC 004 14 199 187 253CCB 130 254 138 115 217ABC (NA)BOC 051 102 101 89 152Quasi-State
BoCom 015 45 37 29 34CMB 060 161 20 19 29
CITIC Industrial 007 17 17 16 18SPDB 048 153 16 16 26
8132019 Government Banking and BRICs in the Recent Financial Crisis
httpslidepdfcomreaderfullgovernment-banking-and-brics-in-the-recent-financial-crisis 4857
983106983122983113983107 983111983151983158983141983154983150983149983141983150983156 983106983137983150983147983155 983137983150983140 983110983145983150983137983150983139983145983137983148 983123983156983137983156983141983139983154983137983142983156
48
China EverbrightGuangdong Development mdash mdash 12 11 mdashIndustrial Bank 037 126 11 10 10Quase-Private
Bank of Shanghai 129 360 07 05 14Hua Xia 038 116 11 09 07Shenzhen Development 017 75 07 06 08Bank of Beijing 037 108 07 04 07
Sector totalThree state-banks 438 391 622Second tier banks 144 127 154
ABC = Agriculture Bank of China BOC = Bank of China BOCOM = Bank of Communications CCB =China Construction Bank CMB = China Merchantrsquos Bank CNY = yuanICBC = Industrial and Commercial Bank of China mkt = market NPL = nonperforming loan ROA =return on asset ROE = return on equity prov = provisioning PRC =Peoplersquos Republic of China SPDB = Shanghai Pudong Development BankNote Loan and deposit market share for BOC and ICBC are for their domestic operations onlySources Company data Goldman Sachs research estimates
Further data from 2006-10 from the Peoples Bank of China suggests that the big5 state banks continue to outperform the next 12 largest joint stock commercial banksThe big five have launched sales of shares to capitalize while listing on capital marketsand adopting reporting of financial data along lines of international standards Thisappears to be similar to Banco do Brasil policies that retain majority of shares in federalgovernment control while capitalizing the bank through issues of stock
Comparing the Performance of Big 5 State Banks and Next 12 Joint Stock CommercialBanks in China
2006 2007 2008 2009 2010
Profit Margin Big 5 State Banks 3116 3143 2586 3026 3269
Next 12 JS Commercial Banks 2050 2791 1796 2159 2365
Returns Big 5 State Banks 507 606 860 691 675(risk adj) Next 12 JS Commercial Banks 459 570 1016 714 723
Op Risk Big 5 State Banks 5548 5539 5215 5319 5322Next 12 JS Commercial Banks 5886 5721 5725 5831 5947
Leverage Big 5 State Banks 1626 1482 1724 173 1734Next 12 JS Commercial Banks 2826 2251 2064 2048 1936
ROE Big 5 State Banks 1424 1557 1999 1925 2037Next 12 JS Commercial Banks 1564 2049 2156 1840 1967
Big 4 and 11 JSCBsSource Peoples Bank of China China Financial Stability Reports 2007-11
Performance indicators reported by the Peoples Bank of China for the big 5 statebanks and 12 next largest joint stock commercial banks also suggest that the largestgovernment banks in China retain significant competitive advantages ndash and may providepolicy alternatives Given the current shift of economic policy in China away fromindustry and export led growth to more sustainable domestic oriented growth and socialinclusion the role of state banks clearly comes to the fore
8132019 Government Banking and BRICs in the Recent Financial Crisis
httpslidepdfcomreaderfullgovernment-banking-and-brics-in-the-recent-financial-crisis 4957
983106983122983113983107 983111983151983158983141983154983150983149983141983150983156 983106983137983150983147983155 983137983150983140 983110983145983150983137983150983139983145983137983148 983123983156983137983156983141983139983154983137983142983156
49
Net Operating Income of Big 5 State Banks and Next 12 CommercialBanks 100 million RMB YuanBig 5 State Banks 2006 2007 2008 2009 2010
Balance Net interest income 349703 500456 556790 532206 720152Net fee amp commission inc 48524 103817 138464 175469 232491
Investment income 216089 283725 338865 324037 340440
Other business income (1807) (17054) 47548 33791 2186
Net operating income 612509 870944 1081667 1065503 1314943
Percent Net interest income 5709 5746 5148 4995 5477
Net fee amp commission inc 792 1192 1280 1646 1768
Investment income 3528 3258 3133 3041 2589
Other business income (030) (196) 440 318 166
Net operating income 10000 10000 10000 100 100
Next 12 Joint Stock CommercialBanks 2006 2007 2008 2009 2010
Net interest income 87253 132945 198965 191276 281588
Net fee amp commission inc 7850 16247 27319 30115 42023
Investment income 20959 32172 44864 50767 50500
Other business income 2306 4498 16359 10384 7400
Net operating income 118468 185861 287507 282542 381511
Percent Net interest income 7365 7153 6920 6769 7381
Net fee amp commission inc 671 874 950 1066 1101
Investment income 1769 1731 1560 1797 1324
Other business income 195 242 569 368 194Net operating income 10000 10000 10000 10000 10000
Source Peoples Bank of China China Financial Stability Reports 2007-11
Big 4 and 11 JSCBsBig 5 = ICBC ABC BOC CCB BOCOMNext 12 Joint Stock Commercial Banks = China CITIC Bank Everbright Bank Huaxia BankGuangdong Development Bank Shenzhen Development Bank China Merchants Bank Shanghai PudongDevelopment Bank Industrial Bank China Minsheng Banking Corporation Evergrowing Bank ChinaZheshang Bank Bohai Bank
In conclusion bank change in China also appears to confirm our findings from
Brazil ndash that state banks have realized competitive advantages and increased marketshares since liberalization while providing counter cyclical credit to ameliorateadjustment to crisis The modernization of the China Postal Savings Bank is ofparticular interest given its social mission downmarket focus and 40000 branchOffices throughout the country Expansion of card payment services through the postalbank system confirms the importance of the Brazilian federal savings bank (CaixaEconocircmica Federal Caixa) as agent for federal government social policy and agentresponsible for management of citizenship cards (12 million) and payment of familygrants This back to the future modernization of savings banks has proved essential forovercoming notorious levels of social exclusion and inequality in Brazil Althoughenglish language materials are unavailable on the China Postal Savings Bank thisinstitution clearly presents profound opportunities for comparable policies in China
8132019 Government Banking and BRICs in the Recent Financial Crisis
httpslidepdfcomreaderfullgovernment-banking-and-brics-in-the-recent-financial-crisis 5057
983106983122983113983107 983111983151983158983141983154983150983149983141983150983156 983106983137983150983147983155 983137983150983140 983110983145983150983137983150983139983145983137983148 983123983156983137983156983141983139983154983137983142983156
50
Reported offer of microfinance services for poverty reduction as part of nationaleconomic stimulous plan may point to developments in this direction
Given that state planning capacity has long been at the center of attention intheories of financial statecraft the role of Chinese state banks in redirecting policiesaccording to the 12th 5 Year plan for 2011-15 seems critical From 2000-5 the 10th 5
Year plan emphasized infrastructure and the attraction of investment and labor skillsThe 11th 5 Year plan (2006-10) raised concerns about sustainability rather than growthlevels while also seeking to spread improvements to balance development better servepeople and improve the quality of life continue to support Center and West provincesand revitalize Northeast provinces In comparison the 12th 5 Year plan calls for morebalanced lsquoinclusiversquo growth and structural adjustemts more than 4 trillion RMB($US600 billion) for targeted industries and interior regions a focus on new energynew materials and information and high technologies biology and new medicineenergy converstaion and environmental protection aerospace marine and advancedmanufacturing This implies fundamental shifts away from industry to services that hasbeen reported in macroeconomic data for 2010 If past studies emphasized directed
credit and industrial change the role of Chinese state banks in realizing transformationscertainly warrants study
Although the domestic flow of funds process of liberalization (or the lackthereof) and insertion of banking into Chinese political economy is beyond the scope ofthis paper our findings from Brazil appear to provide valuable hypotheses about ChinaThat is to say the big state banks and other government banks in China remaincommanding heights not in the Marxist sense of providing means to reach socialismbut immense institutions with profound presence throughout politics and markets in thecountry In this sense our findings from Brazil appear to approximate patterns ofchange in China more than Washington Consensus expectations about liberalization andprivatizations to free private and foreign banks Financial statecraft draws attention tothe capitalization of Chinese state banks through stock Sales and listings on capitalmarkets However like the Banco do Brasil (that reformers in the 1990s sought to shiftcontrol to the private sector only to increase federal government shareholding) theChinese experience surely involves unexpected consequences and patterns of changedifferent than a linear transition to the Berle amp Means paradigm of corporategovernance
Russia The New State Duopoly
ldquoThe rush of 2003-8 increased the market share of foreign banks to 285 from
52 However the state-owned banks received enormous help from the federal budget in the days of the crisis thereby strengthening their dominant
position on the Russian financial market says Sergey Aleksashenko the formerDeputy chairman of Russias Central Bank quotes Russia Profile Today one
must not harbor any illusion of a fair competition with them all the main cash
flows in Russia are controlled by state-owned banks httpwwwbarentsnovacomnode1031
Description of banking policy in Russia during the global financial crisis can beobtained from Bank of Russia annual reports and related publications The figure on the
following page summarizes the financial flows to and from the Bank of RussiaAlthough central bank policy is beyond the scope of this study the role of state banks in
8132019 Government Banking and BRICs in the Recent Financial Crisis
httpslidepdfcomreaderfullgovernment-banking-and-brics-in-the-recent-financial-crisis 5157
983106983122983113983107 983111983151983158983141983154983150983149983141983150983156 983106983137983150983147983155 983137983150983140 983110983145983150983137983150983139983145983137983148 983123983156983137983156983141983139983154983137983142983156
51
channeling counter-cyclical credits released by the Bank of Russia appear to confirm thecore argument that emerges from our studies of the Brazilian banking system Furtherdata on the following pages also suggest that state banks in Russia performed wellduring 2008-10 confirming on the basis of sparse data taken from Bank of Russiareports and documents that public banks have modernized provided counter-cyclical
credit to reverse credit crunch and economic downturn while realizing competitiveadvantages over private and foreign banks
8132019 Government Banking and BRICs in the Recent Financial Crisis
httpslidepdfcomreaderfullgovernment-banking-and-brics-in-the-recent-financial-crisis 5257
983106983122983113983107 983111983151983158983141983154983150983149983141983150983156 983106983137983150983147983155 983137983150983140 983110983145983150983137983150983139983145983137983148 983123983156983137983156983141983139983154983137983142983156
52
The following aggregate figures reported by the Bank of Russia suggest severaltrends of significance First Chart 32 suggests that household deposits shifted fromRuble deposits to foreign currency pegged (or indexed) during 2008 Second Chart 33illustrates the substantial increase of non-bank overdue debt during second semester
2008
Consequently the financial results and profitability of banks declinedsignificantly during 2008 The greater confidence in deposits with government banksfound abroad suggests that this may have been critical in Russia
Performance data deom 2008-10 provides a clearer picture one that is consistentwith our findings in Brazil State banks appear to have outperformed all other types of
banks except medium and small regional banks The following table reports the averagereturns on assets and returns on equity reported by the Bank of Russia 2008-10
Returns on Assets and Equity by Type of Bank in Russia 2008-9
Return on assets Return on equity 2008 2009 2010 2008 2009 2010
-------------------------------------------------------------------------------------------------------------------State Banks 22 08 24 157 46 148Foreign Banks 18 11 21 146 83 145Large private banks 13 03 11 106 28 84Medium-Small Banks Moscow 15 12 14 68 52 67
Medium-Small Regional Banks 21 12 15 131 65 98--------------------------------------------------------------------------------------------------------------------Source Bank of Russia Bank Supervision Reports 2009 and 2010
8132019 Government Banking and BRICs in the Recent Financial Crisis
httpslidepdfcomreaderfullgovernment-banking-and-brics-in-the-recent-financial-crisis 5357
983106983122983113983107 983111983151983158983141983154983150983149983141983150983156 983106983137983150983147983155 983137983150983140 983110983145983150983137983150983139983145983137983148 983123983156983137983156983141983139983154983137983142983156
53
Further data from the Bank of Russia on the capital adequacy of Banks during2009-10 suggest that foreign banks and large private banks remain less capitalizedagainst risks according to Basel II guidelines albeit at levels almost double thatrecommended by the Bank for International Settlements (80 risk weighted) Although
further analysis is needed this data is consistent from that reported in Brazil thatgovernment banks tend to more cautious and more prudent in terms of placing asidehigher levels of reserves and patrimony against possible losses
Capital Adequacy of Banks by Type of Bank in Russia 2009-10
2009 2010 2011---------------------------------------------------------------------------------------------------------State Banks 184 227 186Foreign Banks 155 196 195Large Private Banks 140 181 155
Medium-Small Banks Moscow 316 312 268Medium-Small Regional Banks 219 241 207Non-Bank Credit Institutions 372 1038 678---------------------------------------------------------------------------------------------------------Source Bank of Russia Bank Supervision Report (Moscow) 2009 p 43
Finally Bank of Russia bank supervision reports also suggest that state banksexpanded their market shares of assets and capital during the years following the globalfinancial crisis While large private banks and foreign banks lost market share of bankassets and bank capital in Russia state banks increased their significant market sharefrom 405 ndash 426 percent and 471-476 percent of assets and capital respectivelyUnfortunately data from previous years and for specific banking groups was notobtained However this data does appear to indicate that our findings of competitiveadvantages and policy alternatives
Number and Market Share by Type of Bank
N Banks Assets Capital---------------------------- ---------------------------- ----------------------------
Type of Bank 2009 2010 2011 2009 2010 2011 2009 2010 2011-------------------------------------------------------------------------------------------------------------------------------State 17 22 27 405 439 458 471 489 473
Foreign 101 106 108 187 183 180 172 169 191Large Private 136 139 131 346 333 305 276 287 269Med-Small Moscow 361 335 317 27 26 26 43 34 35Medi-Small Regional 443 412 372 28 28 27 36 31 29Other Credit Institutions 50 51 57 07 04 04 01 02 03Total 1108 1058 100 100 100 100 100 100-------------------------------------------------------------------------------------------------------------------------------Source Bank of Russia Bank Supervision Report 2009 amp 2010
In sum politics and financial statecraft have led to the realization of significantcompetitive advantage by Russian state banks Sperbank and Vneshtorgbank increasedtheir share of bank assets from 32 percent in 2005 to over 50 percent by 2011 through
mergers and acquisitions and aggressive displacement of foreign banks Whatever thepolitics data from the Bank of Russia suggests that monetary authorities released a
8132019 Government Banking and BRICs in the Recent Financial Crisis
httpslidepdfcomreaderfullgovernment-banking-and-brics-in-the-recent-financial-crisis 5457
983106983122983113983107 983111983151983158983141983154983150983149983141983150983156 983106983137983150983147983155 983137983150983140 983110983145983150983137983150983139983145983137983148 983123983156983137983156983141983139983154983137983142983156
54
series of counter cyclical credit injections during 2008-9 to domestic bankinginstitutions Moreover data suggests that state banks continue to perform at or ahead oflevels reported by regional private and foreign banks The large market share andimproved performance of state banks reported in recent data suggests although the datais sparse that government banks in Russia have also modernized realized competitive
advantages and provided policy alternatives against the impact of financial crisisabroadWe were unable to find evidence of policy making toward social inclusion at the
Bank of Russia or Russian state banks despite the historical trajectory of the Sberbankas a savings bank under communism The context also appears to differ considerably Asurvey of the Zircon Research Group reportedly found that only 15 percent of Russiansretain bank accounts because of mistrust in banks and government This combination ofrealist politics and the realization of competitive advantages by Russian state bankssuggests that theories of economic statecraft in the realist tradition may indeed explainthe domestic developments under study
Conclusion
This paper reports evidence about government bank modernization and financialstatecraft in BRIC countries designed to counter the effects of crisis and shape domesticgrowth Government banks in BRIC countries have contributed to the widely notedadjustment of these economies to global financial crisis and economic downturnContrary to the Washington Consensus that prevailed during much of the 1980s and1990s (that privatization and liberalization especially of banking would free marketforces and deepen domestic financial systems) a quite different process of bank changeappears to have ensued after financial liberalization in the BRICs
Instead of replacement of state banks with private banks government banksremain central agents of domestic credit and growth and have modernized ldquojust intimerdquo The capitalization and realization of competitive advantages by large governmentbanks during the 2000s meant that once the US financial panic spread across capitalmarkets broke highly leveraged private and produced runs on private bank depositspolicy makers in BRIC countries nonetheless retained counter cyclical policyalternatives through their more solid large state banks
These findings counter traditional foci on the private sector individualentrepreneurship and ideals of free markets linked to the political and social advancesrecorded around the world in the last decades We report an anomaly for theories offinancial repression and the Washington Consensus about the virtues of privatization
and liberalization Although largely blamed for reproducing underdevelopment in thepast BRIC government banks averted excesses of private banking that drove creditbubbles such as home mortgages and derivatives in the US And since liberalization ofbanking (we have not adequately discussed how much liberalization occurred in eachcountry) government banks have modernized to compete with private and foreignbanks Government banks have realized competitive advantages and provided policyalternatives These two arguments help explain why BRIC countries have farecomparatively well in the face of financial crisis in core countries
Financial statecraft is therefore at the center of BRIC counter cyclical capacitiesand state planning Brazil Russia India and China fared significantly better thanadvanced and many developing countries in terms of adjusting to credit crunches and
export shocks This is because government banks proved critical interbank credit toretain confidence in domestic banking systems These institutions also presented other
8132019 Government Banking and BRICs in the Recent Financial Crisis
httpslidepdfcomreaderfullgovernment-banking-and-brics-in-the-recent-financial-crisis 5557
983106983122983113983107 983111983151983158983141983154983150983149983141983150983156 983106983137983150983147983155 983137983150983140 983110983145983150983137983150983139983145983137983148 983123983156983137983156983141983139983154983137983142983156
55
policy alternatives for political and social forces Politics shaped adjustment andrecovery through state banks differently in BRIC countries Given the realities of statecentered political realism in Russia the redirection of state banks toward goals ofChinese Five Year Plans and the modernization of the State Bank of India amidst anamorphous federalism the experience of Brazil with democratization and public bank
modernization may stand out (Armijo 2009)Further analysis of savings banks and cooperative banks also will be requiredAs members of the World Savings Bank Institute (a global association of savingsbanks) the Caixa in Brazil SNI and NABARD in India and China Postal Savings Bankappear to have provided access to very large numbers of previously unbanked citizensThis returns to traditional ideas of social banking and the history of savings banks thatwere founded throughout Europe since the late 18 th century The upmarket strategy andexpansion into investment banking and international banking of the Russian Sberbankconstrasts with downmarket strategies of savings banks in Brazil India and China
The financial press has recently reported doubts about bad loans in Chinese statebanks and cast doubt on the financial results posted and reported in this paper
However current estimates of 2-5 percent bad loans in Chinese state banks pale incomparison to the US$1240 billion in bad loans shifted to asset managementcompanies in the mid 2000s before capitalization of these institutions through sale ofshares Critics of state banking in Brazil also point to past levels of bad loans (reaching30-40 percent) because of their capture during military government delayed transitionBut the cost of capitalization and transfer of bad loans from Brazilian state banks alsoremained below US$400 billion and is still contingent on liquidation of assetmanagement companies created in 2001 In any case these numbers are very smallcompared to GAO estimates of US$120 trillion in emergency infusions by USmonetary authorities to banks and financial institutions from 2007-11
These are anomalies for recent market-based banking theory and neo-liberalpolicy designs However they do not run counter to orthodoxy in economics andbanking theory Over the last decades economic reforms (fiscal financial monetaryand banking) have improved transparency and brought public policy and marketexpectations closer However expectations about deregulation and free marketequilibria in banking and finance have succumbed in the face of panic and the stillsobering consequences of crisis The materials presented herein are descriptive and willrequire more careful analysis However given the urgency of searching for alternativedevelopment models and different approaches to financial statecraft in BRIC countriesand beyond we have taken the liberty to present research in initial stages and toprovoke thought along the lines suggested by our kind conveners
8132019 Government Banking and BRICs in the Recent Financial Crisis
httpslidepdfcomreaderfullgovernment-banking-and-brics-in-the-recent-financial-crisis 5657
983106983122983113983107 983111983151983158983141983154983150983149983141983150983156 983106983137983150983147983155 983137983150983140 983110983145983150983137983150983139983145983137983148 983123983156983137983156983141983139983154983137983142983156
56
Appendix on Alternative Banking and Social Inclusion
This appendix describes how ideas about government banking led to further work onalternative banking and social inclusion with help from the Rockefeller FoundationBellagio Center In July 2011 we were able to convene a conference designed to gather
scholars alternative banking executives and representatives from savings andcooperative bank associations to rethink strategies for social inclusion in the globalsouth and attempt to launch a new policy agenda Given the search for alternativestrategies to counter crisis and the advances of stabilization transparency and bankingsupervision in developing and emerging economies we call for alternative bankingcommunities in the global north and south to work together and help shape a new policyagenda for social inclusion Because savings banks credit cooperatives and otheralternative banking and finance institutions have realized competitive advantages andemerged from crisis we can now think beyond We believe that new policies may helpdeveloping and emerging nations redirect large domestic institutions such as postal andsavings banks toward meeting the UN millennium goals to eliminate poverty by 2015
Plans include writing a green paper on Core Principles for Alternative Bankingand Social Inclusion convening events to promote these principles through institutionalsupporters and networks and seeking adoption of these principles at policy venues suchas the World Savings Bank Institute the International Association of CooperativeBanks the Bank for International Settlements the International Financial ReportingStandards foundation the ISO International Standards Organization the Charter forResponsible Business regional development banks and the World Bank We also planto submit an edited volume of scholarly contributions on alternative banking and socialinclusion by year-end 2012 Interested parties are welcome to participate
Institutional supporters and networks include
Institutional SupportersColumbia University School of International and Public Affairs New YorkInstitute for Money Technology and Financial Inclusion University of CaliforniaIrvineKingacutes College Department of Management LondonSatildeo Paulo Business School Getulio Vargas FoundationSecond University of Naples
Networks
Association of Emerging Market Business Schools Satildeo Paulo BrazilCommunity of European Management Schools BrusselsCritical Political Economy NetworkEuropean Association of Co-operative Banks BrusselsGlobal Public Policy Network LondonInternational Cooperative Banking Association BrusselsSocial Science Finance Network AmsterdamSociety for Advancement of Social Economics PhiladelphiaWorld Savings Bank Institute Brussels
8132019 Government Banking and BRICs in the Recent Financial Crisis
httpslidepdfcomreaderfullgovernment-banking-and-brics-in-the-recent-financial-crisis 5757
983106983122983113983107 983111983151983158983141983154983150983149983141983150983156 983106983137983150983147983155 983137983150983140 983110983145983150983137983150983139983145983137983148 983123983156983137983156983141983139983154983137983142983156
Core Principles for Alternative Banking and Social Inclusion
Commitment to End Capital StarvationPromote access to and use of banking and financial services by all through newtechnologies and distribution channels to capitalize assets among the poor
Commitment to Universalize Income Savings Credit and FinanceProvide basic income via ATM cards and mobile banking to reach the poor and opennew channels of access to income savings credit finance insurance and opportunities
Prudent Banking and Regulatory ComplianceAlternative banking seeks to work within regulations guidelines and best practicesrecommended by domestic monetary authorities and international regulatory institutionssuch as the Bank for International Settlement Basel II Capital Risk Guidelines
Corporate Social Responsibility Leadership
Integrate corporate social responsibility into down-market business strategies andinstitutions of representation and democratization
Transparency and AccountabilityPublish annual reports and balance sheets in accord with international best practices offinancial social and sustainability reporting
Leadership in Provision of New Banking Services and Products to the PoorUse competitive advantages in banking and institutional networks to channel moreeffectively capital income and finance to the poor
Generate Sustainable Income and Household Asset AccumulationUse branch offices and new banking technologies to accelerate progress toward UNmillennium goals to eliminate poverty
Universalize Financial EducationPromote financial education to encourage responsible banking and finance and avertpredatory lending and unethical practices
Adopt Cutting Edge Technology and Management Practices to Provide
Competitive Alternative to Private Commercial and Investment Banks
Incorporate electronic card and mobile banking services to better serve the poorContribute to Realization of Bellagio Principles for SustainabilityPromote alternative banking and business practices that contribute to environmentallysustainable income consumption and production as stated in Bellagio Principles forSustainability
Respect and Build on National and Regional DifferencesI d f i l d l l i b ki i i i d i i l
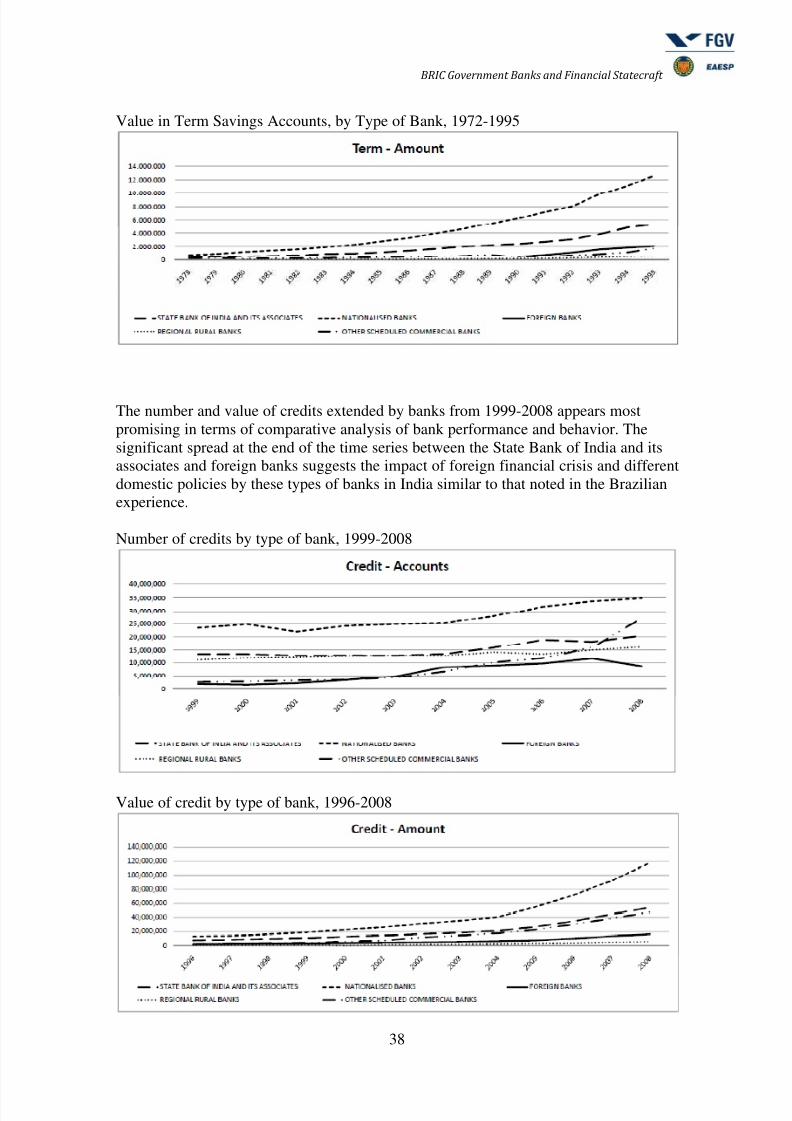
8132019 Government Banking and BRICs in the Recent Financial Crisis
httpslidepdfcomreaderfullgovernment-banking-and-brics-in-the-recent-financial-crisis 4057
983106983122983113983107 983111983151983158983141983154983150983149983141983150983156 983106983137983150983147983155 983137983150983140 983110983145983150983137983150983139983145983137983148 983123983156983137983156983141983139983154983137983142983156
40
Profit per employee (in lakh) 2006-7 2007-8 2008-9 2009-10 2010-11
State Bank of India amp Associates 257 362 443 466 42Nationalized Banks 287 377 486 567 695Old Private Sector Banks 234 406 469 42 563New Private Sector Banks 587 685 677 847 893Foreign Banks 1613 2112 2539 1692 2759
Capital amp Reserves amp Surplus(Ycrore) 2006-7 2007-8 2008-9 2009-10 2010-11
State Bank of India amp Associates 42941 61706 72422 83726 84394Nationalized Banks 92689 113079 135920 157276 205857Old Private Sector Banks 10736 15315 17477 20171 23821New Private Sector Banks 39736 76056 82192 99813 114768Foreign Banks 33075 49332 59937 69176 80972
Deposits Ycrore 2006-7 2007-8 2008-9 2009-10 2010-11
State Bank of India amp Associates 633476 773875 1007041 1108086 1245862Nationalized Banks 1360724 1679993 2105706 2583934 3127122Old Private Sector Banks 138249 165589 199274 229897 264157New Private Sector Banks 413738 509444 537104 592904 738602Foreign Banks 150750 191161 214076 232099 240689
Investments Ycrore 2006-7 2007-8 2008-9 2009-10 2010-11
State Bank of India amp Associates 211875 263823 357624 387473 385697Nationalized Banks 452981 536018 655042 828125 942837Old Private Sector Banks 43647 54080 72393 83499 92617New Private Sector Banks 171008 224498 234139 270618 329403Foreign Banks 71471 98910 130354 159291 165499
Advances Ycrore 2006-7 2007-8 2008-9 2009-10 2010-11
State Bank of India amp Associates 482270 593722 739450 857937 994154Nationalized Banks 957877 1203678 1519762 1843082 2311478
Old Private Sector Banks 92887 111670 128504 154085 184647New Private Sector Banks 321865 406733 446824 478356 612886Foreign Banks 126339 161133 165385 163260 195539
Interest Income Ycrore 2006-7 2007-8 2008-9 2009-10 2010-11
State Bank of India amp Associates 53465 70428 89196 97954 109828Nationalized Banks 110720 142647 183892 208029 256490Old Private Sector Banks 11474 14614 18790 20497 23299New Private Sector Banks 38092 56377 66282 62309 73528
Foreign Banks 17924 24417 30322 26390 28520
8132019 Government Banking and BRICs in the Recent Financial Crisis
httpslidepdfcomreaderfullgovernment-banking-and-brics-in-the-recent-financial-crisis 4157
983106983122983113983107 983111983151983158983141983154983150983149983141983150983156 983106983137983150983147983155 983137983150983140 983110983145983150983137983150983139983145983137983148 983123983156983137983156983141983139983154983137983142983156
41
Other Income Ycrore 2006-7 2007-8 2008-9 2009-10 2010-11
State Bank of India amp Associates 9420 11818 16073 18394 19240Nationalized Banks 14264 20979 26394 30500 28625Old Private Sector Banks 1568 2184 2782 3152 3029
New Private Sector Banks 10745 14822 15078 17271 17697Foreign Banks 7044 10588 14894 9951 10972
Interest Expended Ycrore 2006-7 2007-8 2008-9 2009-10 2010-11
State Bank of India amp Associates 32607 47809 61770 66229 67018Nationalized Banks 69353 101093 131676 145712 164135Old Private Sector Banks 7055 9960 12834 14076 14768New Private Sector Banks 25802 38535 44123 37130 42347Foreign Banks 7603 10604 12819 8938 10622
Operating Expenses Ycrore 2006-7 2007-8 2008-9 2009-10 2010-11
State Bank of India amp Associates 15987 16993 20088 25283 29146Nationalized Banks 27268 29670 35416 40792 53819Old Private Sector Banks 2967 3235 3939 4715 5600New Private Sector Banks 12353 17032 17840 18136 22006Foreign Banks 7745 10353 12298 11102 12557
Cost of Funds 2006-7 2007-8 2008-9 2009-10 2010-11
State Bank of India amp Associates 475 59 594 532 48Nationalized Banks 48 582 609 537 493Old Private Sector Banks 498 62 667 613 55New Private Sector Banks 524 611 604 442 427Foreign Banks 403 433 446 283 311Cost of Funds = Ratio () of interest paid on deposits and borrowings to averageof opening and closing balances of deposits and borrowings
Return on advances adjusted toCoF 2006-7 2007-8 2008-9 2009-10 2010-11
State Bank of India amp Associates 372 365 395 36 405Nationalized Banks 399 369 409 382 427Old Private Sector Banks 406 426 515 482 492New Private Sector Banks 447 505 526 514 516Foreign Banks 574 66 815 716 564
2006-7 2007-8 2008-9 2009-10 2010-11
8132019 Government Banking and BRICs in the Recent Financial Crisis
httpslidepdfcomreaderfullgovernment-banking-and-brics-in-the-recent-financial-crisis 4257
983106983122983113983107 983111983151983158983141983154983150983149983141983150983156 983106983137983150983147983155 983137983150983140 983110983145983150983137983150983139983145983137983148 983123983156983137983156983141983139983154983137983142983156
42
Wages as of Total Expenses
State Bank of India amp Associates 2155 1589 1506 171 1921Nationalized Banks 1794 1405 1331 1365 1641Old Private Sector Banks 1689 1367 1326 1457 1675
New Private Sector Banks 936 956 1017 121 1383Foreign Banks 2008 1995 1944 2348 2331
Returns on Assets 2006-7 2007-8 2008-9 2009-10 2010-11
State Bank of India amp Associates 086 097 102 091 079Nationalized Banks 094 101 103 100 103Old Private Sector Banks 078 114 115 095 112New Private Sector Banks 109 113 112 138 151Foreign Banks 228 209 199 126 174
Capital Adequacy Ratio 2006-7 2007-8 2008-9 2009-10 2010-11
State Bank of India amp Associates 1232 1321 1396 1346 1225Nationalized Banks 1237 1213 1324 1318 1347Old Private Sector Banks 1208 1408 1476 1485 1456New Private Sector Banks 1199 1439 1533 1803 1687Foreign Banks 1239 1305 1432 1726 1672Note To 2007-8 = Basel I From 2008-09 = Basel-II
Net NPA Ratio 2006-7 2007-8 2008-9 2009-10 2010-11
State Bank of India amp Associates 132 143 147 150 149Nationalized Banks 094 077 068 091 092Old Private Sector Banks 096 066 09 082 053New Private Sector Banks 097 109 129 103 056Foreign Banks 073 077 181 182 067Net NPA Ratio = Net non-performing assets as net advances
In sum descriptive data from the Reserve Bank of India confirm the anomaly
and argument drawn from the Brazilian experience An important dimension of BRICcountry recovery from the global financial crisis and downturn is the counter cyclicallending policies and realization of competitive advantages of government banks Thisposes a series of new questions for business schools and scholars of public policyInstead of liberalization and privatization leading to transitions in BRIC countriestoward capital market centered financial systems and liberal market economies publicbanks have realized competitive advantages over private and foreign banks whileproviding policy alternatives to BRIC governments in the face of financial crisis andglobal economic slowdown We return to these implications in the conclusion
One development of note at the Reserve Bank of India is a policy focus onfinancial inclusion The 2008 report of the Committee on Financial Inclusion has beenfollowed by sections of the Reserve Bank of India Annual Report reserved fordiscussion of financial inclusion And instead of focusing on liberalization and
8132019 Government Banking and BRICs in the Recent Financial Crisis
httpslidepdfcomreaderfullgovernment-banking-and-brics-in-the-recent-financial-crisis 4357
983106983122983113983107 983111983151983158983141983154983150983149983141983150983156 983106983137983150983147983155 983137983150983140 983110983145983150983137983150983139983145983137983148 983123983156983137983156983141983139983154983137983142983156
43
privatization to ensure the spread of banking products and services alternative policieshave been explored One is of special note The Committee on Financial Inclusionrecommended issue of identity cards as bank cards This would profoundly change thelandscape of banking in India and has attracted attention from analysts at the CentralBank of Brazil charged with financial inclusion as well as the President of Indonesia
and apparently Uganda officials Given the revolution in information and card paymenttechnologies this policy proposal and pilot studies deserve close attention asalternatives to dramatically increase the pace of social inclusion of the bankless
8132019 Government Banking and BRICs in the Recent Financial Crisis
httpslidepdfcomreaderfullgovernment-banking-and-brics-in-the-recent-financial-crisis 4457
983106983122983113983107 983111983151983158983141983154983150983149983141983150983156 983106983137983150983147983155 983137983150983140 983110983145983150983137983150983139983145983137983148 983123983156983137983156983141983139983154983137983142983156
44
China
This section turns to a brief review of the Chinese banking sector to further explore therole of government banks in terms of their modernization competitive advantages
policy roles and capacity for counter cyclical credit that help explain why BRICcountries were able to avert the severe consequences of the global financial crisis
First figure A11 reports the basic structure of the banking system in China
Although we have been unable to compare the evolution of types of banks acrosstime in similar ways to the above data on India taken from the Reserve Bank of Indiaour research assistants have gathered the following comparative macroeconomicfinancial and balance sheet data on banking in China The data appear to be consistentwith the core argument presented in this paper ndash that government banks havemodernized since liberalization and provided policy makers with alternative means tocounter the effects of financial crisis abroad
8132019 Government Banking and BRICs in the Recent Financial Crisis
httpslidepdfcomreaderfullgovernment-banking-and-brics-in-the-recent-financial-crisis 4557
983106983122983113983107 983111983151983158983141983154983150983149983141983150983156 983106983137983150983147983155 983137983150983140 983110983145983150983137983150983139983145983137983148 983123983156983137983156983141983139983154983137983142983156
45
We lack more current information and were unable to collect data directly fromofficial sources in China to compare the trajectory of state owned private and foreignbanks As a substitute Figure 1 reports data from 2000-4 that permits initial observationof trends for this earlier period
Those present may not need reminding of the formidable record of economicgrowth in China during this 200-4 period that continues until today However data fromthe National Bureau of Statistics suggests that the Chinese banking system expanded atan even greater pace than the remarkable levels of GDP growth recorded for the 2000-4period Furthermore credit expansion was ldquoorganicrdquo in the sense that deposits
outpaced credit growth from 2000-4
Expansion of Loans in China 1999-2004
Loan Growth Total LoansYear on Year
Growth Total Depositssup1Year on Year
GrowthYear CNY billion CNY () CNY billion CNY()1999 9373 83 10878 1372000 9937 60 1238 1382001 11231 130 14362 1602002 13129 169 17092 1902003 159 211 20806 217
2004 18857 186 25319 217
sup1Based on preliminary estimates by the National Bureau of Statistics of the Peoplersquos Republic of ChinaSource National Bureau of Statistics of the PRC
Although we lack data comparable to that from the Reserve Bank of India ableto compare the trajectory of state private and foreign banks in China the sectoralbreakdown of loans and other banking and national account data confirms the profoundcapitalization of the Chinese banking system and GDP growth during from 1995-2004
8132019 Government Banking and BRICs in the Recent Financial Crisis
httpslidepdfcomreaderfullgovernment-banking-and-brics-in-the-recent-financial-crisis 4657
983106983122983113983107 983111983151983158983141983154983150983149983141983150983156 983106983137983150983147983155 983137983150983140 983110983145983150983137983150983139983145983137983148 983123983156983137983156983141983139983154983137983142983156
46
China Banking Sector Market Dimensions (1995 - 2004)
YearTotal
LoansCorp
LoansConsuLoans
HomeLoans
TotalDeposits Excess
GovBonds
CorpBonds GDP
GDPGrowth
()1995 52310 mdash mdash mdash 5376 145 330 65 5848 2511996 63100 mdash mdash mdash 6847 538 436 60 6788 1611997 73585 7341 17 130 8212 853 551 52 7446 971998 85002 8447 53 430 9529 102 9 777 68 7835 521999 95587 9394 164 1360 10831 1273 1054 78 8207 482000 108763 10453 424 3320 13486 261 1302 86 894 892001 118990 112 699 5600 15472 3573 1562 101 9593 732002 139800 12913 1067 8258 18339 4359 mdash mdash 10479 922003 169770 15401 1576 13302 22036 5059 mdash mdash 11669 1142004 194220 16848 1988 15800 25319 5897 mdash mdash 13657 170Figures = CNYB
This data reported in terms of percent GDP provides further clarity on the rapid
capitalization of loans It is of note that the bulk of loans during this period were to thecorporate sector with consumer and home loans lagging significantly
China Banking Sector Percent GDP
YEARTotal
LoansCorporate
LoansConsumer
LoansHomeLoans Deposits
ExcessDeposits
GovBonds
CorpBonds
1995 895 00 00 00 919 25 56 111996 929 00 00 00 1009 79 64 091997 988 986 02 02 1103 115 74 071998 1085 1078 07 05 1216 131 99 091999 1165 1145 20 17 1320 155 128 092000 1217 1169 47 37 1508 292 146 102001 1240 1167 73 58 1613 372 163 112002 1334 1232 102 79 1750 4162003 1455 1320 135 114 1888 4342004 1422 1234 146 116 1854 432
Sources China Banking Regulatory Commission Peoplersquos Bank of China and GoldmanSachs research estimates
Compilation of financial data from a select number of banks in China suggeststhat the pattern of bank change encountered in Brazil and India also describes theexperience of China The liberalization of the Chinese economy and the modernization
of state banks appear to describe the process of bank change instead of a process oftransition toward private banking and capital market centered financial systemAlthough we have been unable to draw data from Chinese monetary authorities thebalance sheet data suggests the clear predominance of large state banks in the politicaleconomy of banking and finance in China How these institutions were used to counterthe effects of financial crisis abroad and redirect domestic investment production andconsumption must remain a subject for further research
8132019 Government Banking and BRICs in the Recent Financial Crisis
httpslidepdfcomreaderfullgovernment-banking-and-brics-in-the-recent-financial-crisis 4757
983106983122983113983107 983111983151983158983141983154983150983149983141983150983156 983106983137983150983147983155 983137983150983140 983110983145983150983137983150983139983145983137983148 983123983156983137983156983141983139983154983137983142983156
47
Select Financial Data from Chinese Banks 2004()
CNY (billion)Total
AssetsGrossLoans
CustomerDeposits Equity
NPLRatio
()
Pre-prov
ProfitsNet
Profits
State Banks
ICBC 5671 3705 5105 163 190 653 23CCB 3905 2226 3489 195 39 605 484ABC (NA) mdashBOC 427 2146 3342 205 51 578 209Quasi-State
BoCom 1145 639 1023 54 30 131 16CMB 587 376 513 22 29 82 32CITIC Industrial 515 306 429 20 60 52 03SPDB 456 311 397 14 24 62 20China Everbright mdashGuangdong Development 345 216 301 mdash mdash mdash 32
Industrial Bank 341 203 283 10 25 37 11Quase-Private
Bank of Shanghai 216 106 179 83 51 32 26Hua Xia 304 181 270 92 40 29 10Shenzhen Development 198 126 166 43 114 28 03Bank of Beijing 209 85 174 71 mdash 26 07
Sector total 19422 25319 129Three state-banks 2692 3979 188Second tier banks 2549 3733 148
ABC = Agriculture Bank of China BOC = Bank of China
BOCOM = Bank of Communications CCB = China Construction BankCMB = China Merchantrsquos Bank CNY = yuanICBC = Industrial and Commercial Bank of ChinaNPL = nonperforming loanROA = return on assets ROE = return on equityprov = provisioningPRC = Peoplersquos Republic of ChinaSPDB = Shanghai Pudong Development BankNote Loan and deposit market share for BOC and ICBC are for their domestic operations onlySources Company data Goldman Sachs research estimates
Returns on Assets Equity and Domestic Market Shares of Major China Banks 2004()
CNY (billion) ROA () ROE ()Deposit Mkt
Share ()Loan MktShare ()
Mortgage MktShare()
State Banks
ICBC 004 14 199 187 253CCB 130 254 138 115 217ABC (NA)BOC 051 102 101 89 152Quasi-State
BoCom 015 45 37 29 34CMB 060 161 20 19 29
CITIC Industrial 007 17 17 16 18SPDB 048 153 16 16 26
8132019 Government Banking and BRICs in the Recent Financial Crisis
httpslidepdfcomreaderfullgovernment-banking-and-brics-in-the-recent-financial-crisis 4857
983106983122983113983107 983111983151983158983141983154983150983149983141983150983156 983106983137983150983147983155 983137983150983140 983110983145983150983137983150983139983145983137983148 983123983156983137983156983141983139983154983137983142983156
48
China EverbrightGuangdong Development mdash mdash 12 11 mdashIndustrial Bank 037 126 11 10 10Quase-Private
Bank of Shanghai 129 360 07 05 14Hua Xia 038 116 11 09 07Shenzhen Development 017 75 07 06 08Bank of Beijing 037 108 07 04 07
Sector totalThree state-banks 438 391 622Second tier banks 144 127 154
ABC = Agriculture Bank of China BOC = Bank of China BOCOM = Bank of Communications CCB =China Construction Bank CMB = China Merchantrsquos Bank CNY = yuanICBC = Industrial and Commercial Bank of China mkt = market NPL = nonperforming loan ROA =return on asset ROE = return on equity prov = provisioning PRC =Peoplersquos Republic of China SPDB = Shanghai Pudong Development BankNote Loan and deposit market share for BOC and ICBC are for their domestic operations onlySources Company data Goldman Sachs research estimates
Further data from 2006-10 from the Peoples Bank of China suggests that the big5 state banks continue to outperform the next 12 largest joint stock commercial banksThe big five have launched sales of shares to capitalize while listing on capital marketsand adopting reporting of financial data along lines of international standards Thisappears to be similar to Banco do Brasil policies that retain majority of shares in federalgovernment control while capitalizing the bank through issues of stock
Comparing the Performance of Big 5 State Banks and Next 12 Joint Stock CommercialBanks in China
2006 2007 2008 2009 2010
Profit Margin Big 5 State Banks 3116 3143 2586 3026 3269
Next 12 JS Commercial Banks 2050 2791 1796 2159 2365
Returns Big 5 State Banks 507 606 860 691 675(risk adj) Next 12 JS Commercial Banks 459 570 1016 714 723
Op Risk Big 5 State Banks 5548 5539 5215 5319 5322Next 12 JS Commercial Banks 5886 5721 5725 5831 5947
Leverage Big 5 State Banks 1626 1482 1724 173 1734Next 12 JS Commercial Banks 2826 2251 2064 2048 1936
ROE Big 5 State Banks 1424 1557 1999 1925 2037Next 12 JS Commercial Banks 1564 2049 2156 1840 1967
Big 4 and 11 JSCBsSource Peoples Bank of China China Financial Stability Reports 2007-11
Performance indicators reported by the Peoples Bank of China for the big 5 statebanks and 12 next largest joint stock commercial banks also suggest that the largestgovernment banks in China retain significant competitive advantages ndash and may providepolicy alternatives Given the current shift of economic policy in China away fromindustry and export led growth to more sustainable domestic oriented growth and socialinclusion the role of state banks clearly comes to the fore
8132019 Government Banking and BRICs in the Recent Financial Crisis
httpslidepdfcomreaderfullgovernment-banking-and-brics-in-the-recent-financial-crisis 4957
983106983122983113983107 983111983151983158983141983154983150983149983141983150983156 983106983137983150983147983155 983137983150983140 983110983145983150983137983150983139983145983137983148 983123983156983137983156983141983139983154983137983142983156
49
Net Operating Income of Big 5 State Banks and Next 12 CommercialBanks 100 million RMB YuanBig 5 State Banks 2006 2007 2008 2009 2010
Balance Net interest income 349703 500456 556790 532206 720152Net fee amp commission inc 48524 103817 138464 175469 232491
Investment income 216089 283725 338865 324037 340440
Other business income (1807) (17054) 47548 33791 2186
Net operating income 612509 870944 1081667 1065503 1314943
Percent Net interest income 5709 5746 5148 4995 5477
Net fee amp commission inc 792 1192 1280 1646 1768
Investment income 3528 3258 3133 3041 2589
Other business income (030) (196) 440 318 166
Net operating income 10000 10000 10000 100 100
Next 12 Joint Stock CommercialBanks 2006 2007 2008 2009 2010
Net interest income 87253 132945 198965 191276 281588
Net fee amp commission inc 7850 16247 27319 30115 42023
Investment income 20959 32172 44864 50767 50500
Other business income 2306 4498 16359 10384 7400
Net operating income 118468 185861 287507 282542 381511
Percent Net interest income 7365 7153 6920 6769 7381
Net fee amp commission inc 671 874 950 1066 1101
Investment income 1769 1731 1560 1797 1324
Other business income 195 242 569 368 194Net operating income 10000 10000 10000 10000 10000
Source Peoples Bank of China China Financial Stability Reports 2007-11
Big 4 and 11 JSCBsBig 5 = ICBC ABC BOC CCB BOCOMNext 12 Joint Stock Commercial Banks = China CITIC Bank Everbright Bank Huaxia BankGuangdong Development Bank Shenzhen Development Bank China Merchants Bank Shanghai PudongDevelopment Bank Industrial Bank China Minsheng Banking Corporation Evergrowing Bank ChinaZheshang Bank Bohai Bank
In conclusion bank change in China also appears to confirm our findings from
Brazil ndash that state banks have realized competitive advantages and increased marketshares since liberalization while providing counter cyclical credit to ameliorateadjustment to crisis The modernization of the China Postal Savings Bank is ofparticular interest given its social mission downmarket focus and 40000 branchOffices throughout the country Expansion of card payment services through the postalbank system confirms the importance of the Brazilian federal savings bank (CaixaEconocircmica Federal Caixa) as agent for federal government social policy and agentresponsible for management of citizenship cards (12 million) and payment of familygrants This back to the future modernization of savings banks has proved essential forovercoming notorious levels of social exclusion and inequality in Brazil Althoughenglish language materials are unavailable on the China Postal Savings Bank thisinstitution clearly presents profound opportunities for comparable policies in China
8132019 Government Banking and BRICs in the Recent Financial Crisis
httpslidepdfcomreaderfullgovernment-banking-and-brics-in-the-recent-financial-crisis 5057
983106983122983113983107 983111983151983158983141983154983150983149983141983150983156 983106983137983150983147983155 983137983150983140 983110983145983150983137983150983139983145983137983148 983123983156983137983156983141983139983154983137983142983156
50
Reported offer of microfinance services for poverty reduction as part of nationaleconomic stimulous plan may point to developments in this direction
Given that state planning capacity has long been at the center of attention intheories of financial statecraft the role of Chinese state banks in redirecting policiesaccording to the 12th 5 Year plan for 2011-15 seems critical From 2000-5 the 10th 5
Year plan emphasized infrastructure and the attraction of investment and labor skillsThe 11th 5 Year plan (2006-10) raised concerns about sustainability rather than growthlevels while also seeking to spread improvements to balance development better servepeople and improve the quality of life continue to support Center and West provincesand revitalize Northeast provinces In comparison the 12th 5 Year plan calls for morebalanced lsquoinclusiversquo growth and structural adjustemts more than 4 trillion RMB($US600 billion) for targeted industries and interior regions a focus on new energynew materials and information and high technologies biology and new medicineenergy converstaion and environmental protection aerospace marine and advancedmanufacturing This implies fundamental shifts away from industry to services that hasbeen reported in macroeconomic data for 2010 If past studies emphasized directed
credit and industrial change the role of Chinese state banks in realizing transformationscertainly warrants study
Although the domestic flow of funds process of liberalization (or the lackthereof) and insertion of banking into Chinese political economy is beyond the scope ofthis paper our findings from Brazil appear to provide valuable hypotheses about ChinaThat is to say the big state banks and other government banks in China remaincommanding heights not in the Marxist sense of providing means to reach socialismbut immense institutions with profound presence throughout politics and markets in thecountry In this sense our findings from Brazil appear to approximate patterns ofchange in China more than Washington Consensus expectations about liberalization andprivatizations to free private and foreign banks Financial statecraft draws attention tothe capitalization of Chinese state banks through stock Sales and listings on capitalmarkets However like the Banco do Brasil (that reformers in the 1990s sought to shiftcontrol to the private sector only to increase federal government shareholding) theChinese experience surely involves unexpected consequences and patterns of changedifferent than a linear transition to the Berle amp Means paradigm of corporategovernance
Russia The New State Duopoly
ldquoThe rush of 2003-8 increased the market share of foreign banks to 285 from
52 However the state-owned banks received enormous help from the federal budget in the days of the crisis thereby strengthening their dominant
position on the Russian financial market says Sergey Aleksashenko the formerDeputy chairman of Russias Central Bank quotes Russia Profile Today one
must not harbor any illusion of a fair competition with them all the main cash
flows in Russia are controlled by state-owned banks httpwwwbarentsnovacomnode1031
Description of banking policy in Russia during the global financial crisis can beobtained from Bank of Russia annual reports and related publications The figure on the
following page summarizes the financial flows to and from the Bank of RussiaAlthough central bank policy is beyond the scope of this study the role of state banks in
8132019 Government Banking and BRICs in the Recent Financial Crisis
httpslidepdfcomreaderfullgovernment-banking-and-brics-in-the-recent-financial-crisis 5157
983106983122983113983107 983111983151983158983141983154983150983149983141983150983156 983106983137983150983147983155 983137983150983140 983110983145983150983137983150983139983145983137983148 983123983156983137983156983141983139983154983137983142983156
51
channeling counter-cyclical credits released by the Bank of Russia appear to confirm thecore argument that emerges from our studies of the Brazilian banking system Furtherdata on the following pages also suggest that state banks in Russia performed wellduring 2008-10 confirming on the basis of sparse data taken from Bank of Russiareports and documents that public banks have modernized provided counter-cyclical
credit to reverse credit crunch and economic downturn while realizing competitiveadvantages over private and foreign banks
8132019 Government Banking and BRICs in the Recent Financial Crisis
httpslidepdfcomreaderfullgovernment-banking-and-brics-in-the-recent-financial-crisis 5257
983106983122983113983107 983111983151983158983141983154983150983149983141983150983156 983106983137983150983147983155 983137983150983140 983110983145983150983137983150983139983145983137983148 983123983156983137983156983141983139983154983137983142983156
52
The following aggregate figures reported by the Bank of Russia suggest severaltrends of significance First Chart 32 suggests that household deposits shifted fromRuble deposits to foreign currency pegged (or indexed) during 2008 Second Chart 33illustrates the substantial increase of non-bank overdue debt during second semester
2008
Consequently the financial results and profitability of banks declinedsignificantly during 2008 The greater confidence in deposits with government banksfound abroad suggests that this may have been critical in Russia
Performance data deom 2008-10 provides a clearer picture one that is consistentwith our findings in Brazil State banks appear to have outperformed all other types of
banks except medium and small regional banks The following table reports the averagereturns on assets and returns on equity reported by the Bank of Russia 2008-10
Returns on Assets and Equity by Type of Bank in Russia 2008-9
Return on assets Return on equity 2008 2009 2010 2008 2009 2010
-------------------------------------------------------------------------------------------------------------------State Banks 22 08 24 157 46 148Foreign Banks 18 11 21 146 83 145Large private banks 13 03 11 106 28 84Medium-Small Banks Moscow 15 12 14 68 52 67
Medium-Small Regional Banks 21 12 15 131 65 98--------------------------------------------------------------------------------------------------------------------Source Bank of Russia Bank Supervision Reports 2009 and 2010
8132019 Government Banking and BRICs in the Recent Financial Crisis
httpslidepdfcomreaderfullgovernment-banking-and-brics-in-the-recent-financial-crisis 5357
983106983122983113983107 983111983151983158983141983154983150983149983141983150983156 983106983137983150983147983155 983137983150983140 983110983145983150983137983150983139983145983137983148 983123983156983137983156983141983139983154983137983142983156
53
Further data from the Bank of Russia on the capital adequacy of Banks during2009-10 suggest that foreign banks and large private banks remain less capitalizedagainst risks according to Basel II guidelines albeit at levels almost double thatrecommended by the Bank for International Settlements (80 risk weighted) Although
further analysis is needed this data is consistent from that reported in Brazil thatgovernment banks tend to more cautious and more prudent in terms of placing asidehigher levels of reserves and patrimony against possible losses
Capital Adequacy of Banks by Type of Bank in Russia 2009-10
2009 2010 2011---------------------------------------------------------------------------------------------------------State Banks 184 227 186Foreign Banks 155 196 195Large Private Banks 140 181 155
Medium-Small Banks Moscow 316 312 268Medium-Small Regional Banks 219 241 207Non-Bank Credit Institutions 372 1038 678---------------------------------------------------------------------------------------------------------Source Bank of Russia Bank Supervision Report (Moscow) 2009 p 43
Finally Bank of Russia bank supervision reports also suggest that state banksexpanded their market shares of assets and capital during the years following the globalfinancial crisis While large private banks and foreign banks lost market share of bankassets and bank capital in Russia state banks increased their significant market sharefrom 405 ndash 426 percent and 471-476 percent of assets and capital respectivelyUnfortunately data from previous years and for specific banking groups was notobtained However this data does appear to indicate that our findings of competitiveadvantages and policy alternatives
Number and Market Share by Type of Bank
N Banks Assets Capital---------------------------- ---------------------------- ----------------------------
Type of Bank 2009 2010 2011 2009 2010 2011 2009 2010 2011-------------------------------------------------------------------------------------------------------------------------------State 17 22 27 405 439 458 471 489 473
Foreign 101 106 108 187 183 180 172 169 191Large Private 136 139 131 346 333 305 276 287 269Med-Small Moscow 361 335 317 27 26 26 43 34 35Medi-Small Regional 443 412 372 28 28 27 36 31 29Other Credit Institutions 50 51 57 07 04 04 01 02 03Total 1108 1058 100 100 100 100 100 100-------------------------------------------------------------------------------------------------------------------------------Source Bank of Russia Bank Supervision Report 2009 amp 2010
In sum politics and financial statecraft have led to the realization of significantcompetitive advantage by Russian state banks Sperbank and Vneshtorgbank increasedtheir share of bank assets from 32 percent in 2005 to over 50 percent by 2011 through
mergers and acquisitions and aggressive displacement of foreign banks Whatever thepolitics data from the Bank of Russia suggests that monetary authorities released a
8132019 Government Banking and BRICs in the Recent Financial Crisis
httpslidepdfcomreaderfullgovernment-banking-and-brics-in-the-recent-financial-crisis 5457
983106983122983113983107 983111983151983158983141983154983150983149983141983150983156 983106983137983150983147983155 983137983150983140 983110983145983150983137983150983139983145983137983148 983123983156983137983156983141983139983154983137983142983156
54
series of counter cyclical credit injections during 2008-9 to domestic bankinginstitutions Moreover data suggests that state banks continue to perform at or ahead oflevels reported by regional private and foreign banks The large market share andimproved performance of state banks reported in recent data suggests although the datais sparse that government banks in Russia have also modernized realized competitive
advantages and provided policy alternatives against the impact of financial crisisabroadWe were unable to find evidence of policy making toward social inclusion at the
Bank of Russia or Russian state banks despite the historical trajectory of the Sberbankas a savings bank under communism The context also appears to differ considerably Asurvey of the Zircon Research Group reportedly found that only 15 percent of Russiansretain bank accounts because of mistrust in banks and government This combination ofrealist politics and the realization of competitive advantages by Russian state bankssuggests that theories of economic statecraft in the realist tradition may indeed explainthe domestic developments under study
Conclusion
This paper reports evidence about government bank modernization and financialstatecraft in BRIC countries designed to counter the effects of crisis and shape domesticgrowth Government banks in BRIC countries have contributed to the widely notedadjustment of these economies to global financial crisis and economic downturnContrary to the Washington Consensus that prevailed during much of the 1980s and1990s (that privatization and liberalization especially of banking would free marketforces and deepen domestic financial systems) a quite different process of bank changeappears to have ensued after financial liberalization in the BRICs
Instead of replacement of state banks with private banks government banksremain central agents of domestic credit and growth and have modernized ldquojust intimerdquo The capitalization and realization of competitive advantages by large governmentbanks during the 2000s meant that once the US financial panic spread across capitalmarkets broke highly leveraged private and produced runs on private bank depositspolicy makers in BRIC countries nonetheless retained counter cyclical policyalternatives through their more solid large state banks
These findings counter traditional foci on the private sector individualentrepreneurship and ideals of free markets linked to the political and social advancesrecorded around the world in the last decades We report an anomaly for theories offinancial repression and the Washington Consensus about the virtues of privatization
and liberalization Although largely blamed for reproducing underdevelopment in thepast BRIC government banks averted excesses of private banking that drove creditbubbles such as home mortgages and derivatives in the US And since liberalization ofbanking (we have not adequately discussed how much liberalization occurred in eachcountry) government banks have modernized to compete with private and foreignbanks Government banks have realized competitive advantages and provided policyalternatives These two arguments help explain why BRIC countries have farecomparatively well in the face of financial crisis in core countries
Financial statecraft is therefore at the center of BRIC counter cyclical capacitiesand state planning Brazil Russia India and China fared significantly better thanadvanced and many developing countries in terms of adjusting to credit crunches and
export shocks This is because government banks proved critical interbank credit toretain confidence in domestic banking systems These institutions also presented other
8132019 Government Banking and BRICs in the Recent Financial Crisis
httpslidepdfcomreaderfullgovernment-banking-and-brics-in-the-recent-financial-crisis 5557
983106983122983113983107 983111983151983158983141983154983150983149983141983150983156 983106983137983150983147983155 983137983150983140 983110983145983150983137983150983139983145983137983148 983123983156983137983156983141983139983154983137983142983156
55
policy alternatives for political and social forces Politics shaped adjustment andrecovery through state banks differently in BRIC countries Given the realities of statecentered political realism in Russia the redirection of state banks toward goals ofChinese Five Year Plans and the modernization of the State Bank of India amidst anamorphous federalism the experience of Brazil with democratization and public bank
modernization may stand out (Armijo 2009)Further analysis of savings banks and cooperative banks also will be requiredAs members of the World Savings Bank Institute (a global association of savingsbanks) the Caixa in Brazil SNI and NABARD in India and China Postal Savings Bankappear to have provided access to very large numbers of previously unbanked citizensThis returns to traditional ideas of social banking and the history of savings banks thatwere founded throughout Europe since the late 18 th century The upmarket strategy andexpansion into investment banking and international banking of the Russian Sberbankconstrasts with downmarket strategies of savings banks in Brazil India and China
The financial press has recently reported doubts about bad loans in Chinese statebanks and cast doubt on the financial results posted and reported in this paper
However current estimates of 2-5 percent bad loans in Chinese state banks pale incomparison to the US$1240 billion in bad loans shifted to asset managementcompanies in the mid 2000s before capitalization of these institutions through sale ofshares Critics of state banking in Brazil also point to past levels of bad loans (reaching30-40 percent) because of their capture during military government delayed transitionBut the cost of capitalization and transfer of bad loans from Brazilian state banks alsoremained below US$400 billion and is still contingent on liquidation of assetmanagement companies created in 2001 In any case these numbers are very smallcompared to GAO estimates of US$120 trillion in emergency infusions by USmonetary authorities to banks and financial institutions from 2007-11
These are anomalies for recent market-based banking theory and neo-liberalpolicy designs However they do not run counter to orthodoxy in economics andbanking theory Over the last decades economic reforms (fiscal financial monetaryand banking) have improved transparency and brought public policy and marketexpectations closer However expectations about deregulation and free marketequilibria in banking and finance have succumbed in the face of panic and the stillsobering consequences of crisis The materials presented herein are descriptive and willrequire more careful analysis However given the urgency of searching for alternativedevelopment models and different approaches to financial statecraft in BRIC countriesand beyond we have taken the liberty to present research in initial stages and toprovoke thought along the lines suggested by our kind conveners
8132019 Government Banking and BRICs in the Recent Financial Crisis
httpslidepdfcomreaderfullgovernment-banking-and-brics-in-the-recent-financial-crisis 5657
983106983122983113983107 983111983151983158983141983154983150983149983141983150983156 983106983137983150983147983155 983137983150983140 983110983145983150983137983150983139983145983137983148 983123983156983137983156983141983139983154983137983142983156
56
Appendix on Alternative Banking and Social Inclusion
This appendix describes how ideas about government banking led to further work onalternative banking and social inclusion with help from the Rockefeller FoundationBellagio Center In July 2011 we were able to convene a conference designed to gather
scholars alternative banking executives and representatives from savings andcooperative bank associations to rethink strategies for social inclusion in the globalsouth and attempt to launch a new policy agenda Given the search for alternativestrategies to counter crisis and the advances of stabilization transparency and bankingsupervision in developing and emerging economies we call for alternative bankingcommunities in the global north and south to work together and help shape a new policyagenda for social inclusion Because savings banks credit cooperatives and otheralternative banking and finance institutions have realized competitive advantages andemerged from crisis we can now think beyond We believe that new policies may helpdeveloping and emerging nations redirect large domestic institutions such as postal andsavings banks toward meeting the UN millennium goals to eliminate poverty by 2015
Plans include writing a green paper on Core Principles for Alternative Bankingand Social Inclusion convening events to promote these principles through institutionalsupporters and networks and seeking adoption of these principles at policy venues suchas the World Savings Bank Institute the International Association of CooperativeBanks the Bank for International Settlements the International Financial ReportingStandards foundation the ISO International Standards Organization the Charter forResponsible Business regional development banks and the World Bank We also planto submit an edited volume of scholarly contributions on alternative banking and socialinclusion by year-end 2012 Interested parties are welcome to participate
Institutional supporters and networks include
Institutional SupportersColumbia University School of International and Public Affairs New YorkInstitute for Money Technology and Financial Inclusion University of CaliforniaIrvineKingacutes College Department of Management LondonSatildeo Paulo Business School Getulio Vargas FoundationSecond University of Naples
Networks
Association of Emerging Market Business Schools Satildeo Paulo BrazilCommunity of European Management Schools BrusselsCritical Political Economy NetworkEuropean Association of Co-operative Banks BrusselsGlobal Public Policy Network LondonInternational Cooperative Banking Association BrusselsSocial Science Finance Network AmsterdamSociety for Advancement of Social Economics PhiladelphiaWorld Savings Bank Institute Brussels
8132019 Government Banking and BRICs in the Recent Financial Crisis
httpslidepdfcomreaderfullgovernment-banking-and-brics-in-the-recent-financial-crisis 5757
983106983122983113983107 983111983151983158983141983154983150983149983141983150983156 983106983137983150983147983155 983137983150983140 983110983145983150983137983150983139983145983137983148 983123983156983137983156983141983139983154983137983142983156
Core Principles for Alternative Banking and Social Inclusion
Commitment to End Capital StarvationPromote access to and use of banking and financial services by all through newtechnologies and distribution channels to capitalize assets among the poor
Commitment to Universalize Income Savings Credit and FinanceProvide basic income via ATM cards and mobile banking to reach the poor and opennew channels of access to income savings credit finance insurance and opportunities
Prudent Banking and Regulatory ComplianceAlternative banking seeks to work within regulations guidelines and best practicesrecommended by domestic monetary authorities and international regulatory institutionssuch as the Bank for International Settlement Basel II Capital Risk Guidelines
Corporate Social Responsibility Leadership
Integrate corporate social responsibility into down-market business strategies andinstitutions of representation and democratization
Transparency and AccountabilityPublish annual reports and balance sheets in accord with international best practices offinancial social and sustainability reporting
Leadership in Provision of New Banking Services and Products to the PoorUse competitive advantages in banking and institutional networks to channel moreeffectively capital income and finance to the poor
Generate Sustainable Income and Household Asset AccumulationUse branch offices and new banking technologies to accelerate progress toward UNmillennium goals to eliminate poverty
Universalize Financial EducationPromote financial education to encourage responsible banking and finance and avertpredatory lending and unethical practices
Adopt Cutting Edge Technology and Management Practices to Provide
Competitive Alternative to Private Commercial and Investment Banks
Incorporate electronic card and mobile banking services to better serve the poorContribute to Realization of Bellagio Principles for SustainabilityPromote alternative banking and business practices that contribute to environmentallysustainable income consumption and production as stated in Bellagio Principles forSustainability
Respect and Build on National and Regional DifferencesI d f i l d l l i b ki i i i d i i l
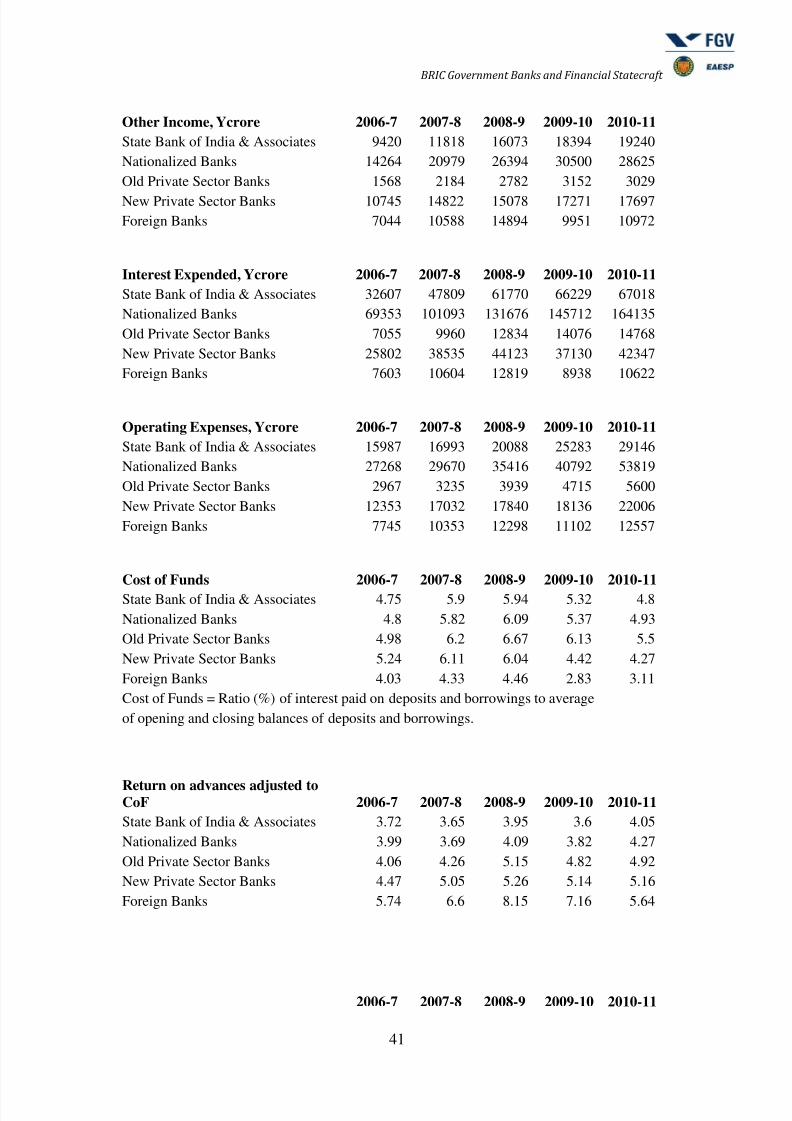
8132019 Government Banking and BRICs in the Recent Financial Crisis
httpslidepdfcomreaderfullgovernment-banking-and-brics-in-the-recent-financial-crisis 4457
983106983122983113983107 983111983151983158983141983154983150983149983141983150983156 983106983137983150983147983155 983137983150983140 983110983145983150983137983150983139983145983137983148 983123983156983137983156983141983139983154983137983142983156
44
China
This section turns to a brief review of the Chinese banking sector to further explore therole of government banks in terms of their modernization competitive advantages
policy roles and capacity for counter cyclical credit that help explain why BRICcountries were able to avert the severe consequences of the global financial crisis
First figure A11 reports the basic structure of the banking system in China
Although we have been unable to compare the evolution of types of banks acrosstime in similar ways to the above data on India taken from the Reserve Bank of Indiaour research assistants have gathered the following comparative macroeconomicfinancial and balance sheet data on banking in China The data appear to be consistentwith the core argument presented in this paper ndash that government banks havemodernized since liberalization and provided policy makers with alternative means tocounter the effects of financial crisis abroad
8132019 Government Banking and BRICs in the Recent Financial Crisis
httpslidepdfcomreaderfullgovernment-banking-and-brics-in-the-recent-financial-crisis 4557
983106983122983113983107 983111983151983158983141983154983150983149983141983150983156 983106983137983150983147983155 983137983150983140 983110983145983150983137983150983139983145983137983148 983123983156983137983156983141983139983154983137983142983156
45
We lack more current information and were unable to collect data directly fromofficial sources in China to compare the trajectory of state owned private and foreignbanks As a substitute Figure 1 reports data from 2000-4 that permits initial observationof trends for this earlier period
Those present may not need reminding of the formidable record of economicgrowth in China during this 200-4 period that continues until today However data fromthe National Bureau of Statistics suggests that the Chinese banking system expanded atan even greater pace than the remarkable levels of GDP growth recorded for the 2000-4period Furthermore credit expansion was ldquoorganicrdquo in the sense that deposits
outpaced credit growth from 2000-4
Expansion of Loans in China 1999-2004
Loan Growth Total LoansYear on Year
Growth Total Depositssup1Year on Year
GrowthYear CNY billion CNY () CNY billion CNY()1999 9373 83 10878 1372000 9937 60 1238 1382001 11231 130 14362 1602002 13129 169 17092 1902003 159 211 20806 217
2004 18857 186 25319 217
sup1Based on preliminary estimates by the National Bureau of Statistics of the Peoplersquos Republic of ChinaSource National Bureau of Statistics of the PRC
Although we lack data comparable to that from the Reserve Bank of India ableto compare the trajectory of state private and foreign banks in China the sectoralbreakdown of loans and other banking and national account data confirms the profoundcapitalization of the Chinese banking system and GDP growth during from 1995-2004
8132019 Government Banking and BRICs in the Recent Financial Crisis
httpslidepdfcomreaderfullgovernment-banking-and-brics-in-the-recent-financial-crisis 4657
983106983122983113983107 983111983151983158983141983154983150983149983141983150983156 983106983137983150983147983155 983137983150983140 983110983145983150983137983150983139983145983137983148 983123983156983137983156983141983139983154983137983142983156
46
China Banking Sector Market Dimensions (1995 - 2004)
YearTotal
LoansCorp
LoansConsuLoans
HomeLoans
TotalDeposits Excess
GovBonds
CorpBonds GDP
GDPGrowth
()1995 52310 mdash mdash mdash 5376 145 330 65 5848 2511996 63100 mdash mdash mdash 6847 538 436 60 6788 1611997 73585 7341 17 130 8212 853 551 52 7446 971998 85002 8447 53 430 9529 102 9 777 68 7835 521999 95587 9394 164 1360 10831 1273 1054 78 8207 482000 108763 10453 424 3320 13486 261 1302 86 894 892001 118990 112 699 5600 15472 3573 1562 101 9593 732002 139800 12913 1067 8258 18339 4359 mdash mdash 10479 922003 169770 15401 1576 13302 22036 5059 mdash mdash 11669 1142004 194220 16848 1988 15800 25319 5897 mdash mdash 13657 170Figures = CNYB
This data reported in terms of percent GDP provides further clarity on the rapid
capitalization of loans It is of note that the bulk of loans during this period were to thecorporate sector with consumer and home loans lagging significantly
China Banking Sector Percent GDP
YEARTotal
LoansCorporate
LoansConsumer
LoansHomeLoans Deposits
ExcessDeposits
GovBonds
CorpBonds
1995 895 00 00 00 919 25 56 111996 929 00 00 00 1009 79 64 091997 988 986 02 02 1103 115 74 071998 1085 1078 07 05 1216 131 99 091999 1165 1145 20 17 1320 155 128 092000 1217 1169 47 37 1508 292 146 102001 1240 1167 73 58 1613 372 163 112002 1334 1232 102 79 1750 4162003 1455 1320 135 114 1888 4342004 1422 1234 146 116 1854 432
Sources China Banking Regulatory Commission Peoplersquos Bank of China and GoldmanSachs research estimates
Compilation of financial data from a select number of banks in China suggeststhat the pattern of bank change encountered in Brazil and India also describes theexperience of China The liberalization of the Chinese economy and the modernization
of state banks appear to describe the process of bank change instead of a process oftransition toward private banking and capital market centered financial systemAlthough we have been unable to draw data from Chinese monetary authorities thebalance sheet data suggests the clear predominance of large state banks in the politicaleconomy of banking and finance in China How these institutions were used to counterthe effects of financial crisis abroad and redirect domestic investment production andconsumption must remain a subject for further research
8132019 Government Banking and BRICs in the Recent Financial Crisis
httpslidepdfcomreaderfullgovernment-banking-and-brics-in-the-recent-financial-crisis 4757
983106983122983113983107 983111983151983158983141983154983150983149983141983150983156 983106983137983150983147983155 983137983150983140 983110983145983150983137983150983139983145983137983148 983123983156983137983156983141983139983154983137983142983156
47
Select Financial Data from Chinese Banks 2004()
CNY (billion)Total
AssetsGrossLoans
CustomerDeposits Equity
NPLRatio
()
Pre-prov
ProfitsNet
Profits
State Banks
ICBC 5671 3705 5105 163 190 653 23CCB 3905 2226 3489 195 39 605 484ABC (NA) mdashBOC 427 2146 3342 205 51 578 209Quasi-State
BoCom 1145 639 1023 54 30 131 16CMB 587 376 513 22 29 82 32CITIC Industrial 515 306 429 20 60 52 03SPDB 456 311 397 14 24 62 20China Everbright mdashGuangdong Development 345 216 301 mdash mdash mdash 32
Industrial Bank 341 203 283 10 25 37 11Quase-Private
Bank of Shanghai 216 106 179 83 51 32 26Hua Xia 304 181 270 92 40 29 10Shenzhen Development 198 126 166 43 114 28 03Bank of Beijing 209 85 174 71 mdash 26 07
Sector total 19422 25319 129Three state-banks 2692 3979 188Second tier banks 2549 3733 148
ABC = Agriculture Bank of China BOC = Bank of China
BOCOM = Bank of Communications CCB = China Construction BankCMB = China Merchantrsquos Bank CNY = yuanICBC = Industrial and Commercial Bank of ChinaNPL = nonperforming loanROA = return on assets ROE = return on equityprov = provisioningPRC = Peoplersquos Republic of ChinaSPDB = Shanghai Pudong Development BankNote Loan and deposit market share for BOC and ICBC are for their domestic operations onlySources Company data Goldman Sachs research estimates
Returns on Assets Equity and Domestic Market Shares of Major China Banks 2004()
CNY (billion) ROA () ROE ()Deposit Mkt
Share ()Loan MktShare ()
Mortgage MktShare()
State Banks
ICBC 004 14 199 187 253CCB 130 254 138 115 217ABC (NA)BOC 051 102 101 89 152Quasi-State
BoCom 015 45 37 29 34CMB 060 161 20 19 29
CITIC Industrial 007 17 17 16 18SPDB 048 153 16 16 26
8132019 Government Banking and BRICs in the Recent Financial Crisis
httpslidepdfcomreaderfullgovernment-banking-and-brics-in-the-recent-financial-crisis 4857
983106983122983113983107 983111983151983158983141983154983150983149983141983150983156 983106983137983150983147983155 983137983150983140 983110983145983150983137983150983139983145983137983148 983123983156983137983156983141983139983154983137983142983156
48
China EverbrightGuangdong Development mdash mdash 12 11 mdashIndustrial Bank 037 126 11 10 10Quase-Private
Bank of Shanghai 129 360 07 05 14Hua Xia 038 116 11 09 07Shenzhen Development 017 75 07 06 08Bank of Beijing 037 108 07 04 07
Sector totalThree state-banks 438 391 622Second tier banks 144 127 154
ABC = Agriculture Bank of China BOC = Bank of China BOCOM = Bank of Communications CCB =China Construction Bank CMB = China Merchantrsquos Bank CNY = yuanICBC = Industrial and Commercial Bank of China mkt = market NPL = nonperforming loan ROA =return on asset ROE = return on equity prov = provisioning PRC =Peoplersquos Republic of China SPDB = Shanghai Pudong Development BankNote Loan and deposit market share for BOC and ICBC are for their domestic operations onlySources Company data Goldman Sachs research estimates
Further data from 2006-10 from the Peoples Bank of China suggests that the big5 state banks continue to outperform the next 12 largest joint stock commercial banksThe big five have launched sales of shares to capitalize while listing on capital marketsand adopting reporting of financial data along lines of international standards Thisappears to be similar to Banco do Brasil policies that retain majority of shares in federalgovernment control while capitalizing the bank through issues of stock
Comparing the Performance of Big 5 State Banks and Next 12 Joint Stock CommercialBanks in China
2006 2007 2008 2009 2010
Profit Margin Big 5 State Banks 3116 3143 2586 3026 3269
Next 12 JS Commercial Banks 2050 2791 1796 2159 2365
Returns Big 5 State Banks 507 606 860 691 675(risk adj) Next 12 JS Commercial Banks 459 570 1016 714 723
Op Risk Big 5 State Banks 5548 5539 5215 5319 5322Next 12 JS Commercial Banks 5886 5721 5725 5831 5947
Leverage Big 5 State Banks 1626 1482 1724 173 1734Next 12 JS Commercial Banks 2826 2251 2064 2048 1936
ROE Big 5 State Banks 1424 1557 1999 1925 2037Next 12 JS Commercial Banks 1564 2049 2156 1840 1967
Big 4 and 11 JSCBsSource Peoples Bank of China China Financial Stability Reports 2007-11
Performance indicators reported by the Peoples Bank of China for the big 5 statebanks and 12 next largest joint stock commercial banks also suggest that the largestgovernment banks in China retain significant competitive advantages ndash and may providepolicy alternatives Given the current shift of economic policy in China away fromindustry and export led growth to more sustainable domestic oriented growth and socialinclusion the role of state banks clearly comes to the fore
8132019 Government Banking and BRICs in the Recent Financial Crisis
httpslidepdfcomreaderfullgovernment-banking-and-brics-in-the-recent-financial-crisis 4957
983106983122983113983107 983111983151983158983141983154983150983149983141983150983156 983106983137983150983147983155 983137983150983140 983110983145983150983137983150983139983145983137983148 983123983156983137983156983141983139983154983137983142983156
49
Net Operating Income of Big 5 State Banks and Next 12 CommercialBanks 100 million RMB YuanBig 5 State Banks 2006 2007 2008 2009 2010
Balance Net interest income 349703 500456 556790 532206 720152Net fee amp commission inc 48524 103817 138464 175469 232491
Investment income 216089 283725 338865 324037 340440
Other business income (1807) (17054) 47548 33791 2186
Net operating income 612509 870944 1081667 1065503 1314943
Percent Net interest income 5709 5746 5148 4995 5477
Net fee amp commission inc 792 1192 1280 1646 1768
Investment income 3528 3258 3133 3041 2589
Other business income (030) (196) 440 318 166
Net operating income 10000 10000 10000 100 100
Next 12 Joint Stock CommercialBanks 2006 2007 2008 2009 2010
Net interest income 87253 132945 198965 191276 281588
Net fee amp commission inc 7850 16247 27319 30115 42023
Investment income 20959 32172 44864 50767 50500
Other business income 2306 4498 16359 10384 7400
Net operating income 118468 185861 287507 282542 381511
Percent Net interest income 7365 7153 6920 6769 7381
Net fee amp commission inc 671 874 950 1066 1101
Investment income 1769 1731 1560 1797 1324
Other business income 195 242 569 368 194Net operating income 10000 10000 10000 10000 10000
Source Peoples Bank of China China Financial Stability Reports 2007-11
Big 4 and 11 JSCBsBig 5 = ICBC ABC BOC CCB BOCOMNext 12 Joint Stock Commercial Banks = China CITIC Bank Everbright Bank Huaxia BankGuangdong Development Bank Shenzhen Development Bank China Merchants Bank Shanghai PudongDevelopment Bank Industrial Bank China Minsheng Banking Corporation Evergrowing Bank ChinaZheshang Bank Bohai Bank
In conclusion bank change in China also appears to confirm our findings from
Brazil ndash that state banks have realized competitive advantages and increased marketshares since liberalization while providing counter cyclical credit to ameliorateadjustment to crisis The modernization of the China Postal Savings Bank is ofparticular interest given its social mission downmarket focus and 40000 branchOffices throughout the country Expansion of card payment services through the postalbank system confirms the importance of the Brazilian federal savings bank (CaixaEconocircmica Federal Caixa) as agent for federal government social policy and agentresponsible for management of citizenship cards (12 million) and payment of familygrants This back to the future modernization of savings banks has proved essential forovercoming notorious levels of social exclusion and inequality in Brazil Althoughenglish language materials are unavailable on the China Postal Savings Bank thisinstitution clearly presents profound opportunities for comparable policies in China
8132019 Government Banking and BRICs in the Recent Financial Crisis
httpslidepdfcomreaderfullgovernment-banking-and-brics-in-the-recent-financial-crisis 5057
983106983122983113983107 983111983151983158983141983154983150983149983141983150983156 983106983137983150983147983155 983137983150983140 983110983145983150983137983150983139983145983137983148 983123983156983137983156983141983139983154983137983142983156
50
Reported offer of microfinance services for poverty reduction as part of nationaleconomic stimulous plan may point to developments in this direction
Given that state planning capacity has long been at the center of attention intheories of financial statecraft the role of Chinese state banks in redirecting policiesaccording to the 12th 5 Year plan for 2011-15 seems critical From 2000-5 the 10th 5
Year plan emphasized infrastructure and the attraction of investment and labor skillsThe 11th 5 Year plan (2006-10) raised concerns about sustainability rather than growthlevels while also seeking to spread improvements to balance development better servepeople and improve the quality of life continue to support Center and West provincesand revitalize Northeast provinces In comparison the 12th 5 Year plan calls for morebalanced lsquoinclusiversquo growth and structural adjustemts more than 4 trillion RMB($US600 billion) for targeted industries and interior regions a focus on new energynew materials and information and high technologies biology and new medicineenergy converstaion and environmental protection aerospace marine and advancedmanufacturing This implies fundamental shifts away from industry to services that hasbeen reported in macroeconomic data for 2010 If past studies emphasized directed
credit and industrial change the role of Chinese state banks in realizing transformationscertainly warrants study
Although the domestic flow of funds process of liberalization (or the lackthereof) and insertion of banking into Chinese political economy is beyond the scope ofthis paper our findings from Brazil appear to provide valuable hypotheses about ChinaThat is to say the big state banks and other government banks in China remaincommanding heights not in the Marxist sense of providing means to reach socialismbut immense institutions with profound presence throughout politics and markets in thecountry In this sense our findings from Brazil appear to approximate patterns ofchange in China more than Washington Consensus expectations about liberalization andprivatizations to free private and foreign banks Financial statecraft draws attention tothe capitalization of Chinese state banks through stock Sales and listings on capitalmarkets However like the Banco do Brasil (that reformers in the 1990s sought to shiftcontrol to the private sector only to increase federal government shareholding) theChinese experience surely involves unexpected consequences and patterns of changedifferent than a linear transition to the Berle amp Means paradigm of corporategovernance
Russia The New State Duopoly
ldquoThe rush of 2003-8 increased the market share of foreign banks to 285 from
52 However the state-owned banks received enormous help from the federal budget in the days of the crisis thereby strengthening their dominant
position on the Russian financial market says Sergey Aleksashenko the formerDeputy chairman of Russias Central Bank quotes Russia Profile Today one
must not harbor any illusion of a fair competition with them all the main cash
flows in Russia are controlled by state-owned banks httpwwwbarentsnovacomnode1031
Description of banking policy in Russia during the global financial crisis can beobtained from Bank of Russia annual reports and related publications The figure on the
following page summarizes the financial flows to and from the Bank of RussiaAlthough central bank policy is beyond the scope of this study the role of state banks in
8132019 Government Banking and BRICs in the Recent Financial Crisis
httpslidepdfcomreaderfullgovernment-banking-and-brics-in-the-recent-financial-crisis 5157
983106983122983113983107 983111983151983158983141983154983150983149983141983150983156 983106983137983150983147983155 983137983150983140 983110983145983150983137983150983139983145983137983148 983123983156983137983156983141983139983154983137983142983156
51
channeling counter-cyclical credits released by the Bank of Russia appear to confirm thecore argument that emerges from our studies of the Brazilian banking system Furtherdata on the following pages also suggest that state banks in Russia performed wellduring 2008-10 confirming on the basis of sparse data taken from Bank of Russiareports and documents that public banks have modernized provided counter-cyclical
credit to reverse credit crunch and economic downturn while realizing competitiveadvantages over private and foreign banks
8132019 Government Banking and BRICs in the Recent Financial Crisis
httpslidepdfcomreaderfullgovernment-banking-and-brics-in-the-recent-financial-crisis 5257
983106983122983113983107 983111983151983158983141983154983150983149983141983150983156 983106983137983150983147983155 983137983150983140 983110983145983150983137983150983139983145983137983148 983123983156983137983156983141983139983154983137983142983156
52
The following aggregate figures reported by the Bank of Russia suggest severaltrends of significance First Chart 32 suggests that household deposits shifted fromRuble deposits to foreign currency pegged (or indexed) during 2008 Second Chart 33illustrates the substantial increase of non-bank overdue debt during second semester
2008
Consequently the financial results and profitability of banks declinedsignificantly during 2008 The greater confidence in deposits with government banksfound abroad suggests that this may have been critical in Russia
Performance data deom 2008-10 provides a clearer picture one that is consistentwith our findings in Brazil State banks appear to have outperformed all other types of
banks except medium and small regional banks The following table reports the averagereturns on assets and returns on equity reported by the Bank of Russia 2008-10
Returns on Assets and Equity by Type of Bank in Russia 2008-9
Return on assets Return on equity 2008 2009 2010 2008 2009 2010
-------------------------------------------------------------------------------------------------------------------State Banks 22 08 24 157 46 148Foreign Banks 18 11 21 146 83 145Large private banks 13 03 11 106 28 84Medium-Small Banks Moscow 15 12 14 68 52 67
Medium-Small Regional Banks 21 12 15 131 65 98--------------------------------------------------------------------------------------------------------------------Source Bank of Russia Bank Supervision Reports 2009 and 2010
8132019 Government Banking and BRICs in the Recent Financial Crisis
httpslidepdfcomreaderfullgovernment-banking-and-brics-in-the-recent-financial-crisis 5357
983106983122983113983107 983111983151983158983141983154983150983149983141983150983156 983106983137983150983147983155 983137983150983140 983110983145983150983137983150983139983145983137983148 983123983156983137983156983141983139983154983137983142983156
53
Further data from the Bank of Russia on the capital adequacy of Banks during2009-10 suggest that foreign banks and large private banks remain less capitalizedagainst risks according to Basel II guidelines albeit at levels almost double thatrecommended by the Bank for International Settlements (80 risk weighted) Although
further analysis is needed this data is consistent from that reported in Brazil thatgovernment banks tend to more cautious and more prudent in terms of placing asidehigher levels of reserves and patrimony against possible losses
Capital Adequacy of Banks by Type of Bank in Russia 2009-10
2009 2010 2011---------------------------------------------------------------------------------------------------------State Banks 184 227 186Foreign Banks 155 196 195Large Private Banks 140 181 155
Medium-Small Banks Moscow 316 312 268Medium-Small Regional Banks 219 241 207Non-Bank Credit Institutions 372 1038 678---------------------------------------------------------------------------------------------------------Source Bank of Russia Bank Supervision Report (Moscow) 2009 p 43
Finally Bank of Russia bank supervision reports also suggest that state banksexpanded their market shares of assets and capital during the years following the globalfinancial crisis While large private banks and foreign banks lost market share of bankassets and bank capital in Russia state banks increased their significant market sharefrom 405 ndash 426 percent and 471-476 percent of assets and capital respectivelyUnfortunately data from previous years and for specific banking groups was notobtained However this data does appear to indicate that our findings of competitiveadvantages and policy alternatives
Number and Market Share by Type of Bank
N Banks Assets Capital---------------------------- ---------------------------- ----------------------------
Type of Bank 2009 2010 2011 2009 2010 2011 2009 2010 2011-------------------------------------------------------------------------------------------------------------------------------State 17 22 27 405 439 458 471 489 473
Foreign 101 106 108 187 183 180 172 169 191Large Private 136 139 131 346 333 305 276 287 269Med-Small Moscow 361 335 317 27 26 26 43 34 35Medi-Small Regional 443 412 372 28 28 27 36 31 29Other Credit Institutions 50 51 57 07 04 04 01 02 03Total 1108 1058 100 100 100 100 100 100-------------------------------------------------------------------------------------------------------------------------------Source Bank of Russia Bank Supervision Report 2009 amp 2010
In sum politics and financial statecraft have led to the realization of significantcompetitive advantage by Russian state banks Sperbank and Vneshtorgbank increasedtheir share of bank assets from 32 percent in 2005 to over 50 percent by 2011 through
mergers and acquisitions and aggressive displacement of foreign banks Whatever thepolitics data from the Bank of Russia suggests that monetary authorities released a
8132019 Government Banking and BRICs in the Recent Financial Crisis
httpslidepdfcomreaderfullgovernment-banking-and-brics-in-the-recent-financial-crisis 5457
983106983122983113983107 983111983151983158983141983154983150983149983141983150983156 983106983137983150983147983155 983137983150983140 983110983145983150983137983150983139983145983137983148 983123983156983137983156983141983139983154983137983142983156
54
series of counter cyclical credit injections during 2008-9 to domestic bankinginstitutions Moreover data suggests that state banks continue to perform at or ahead oflevels reported by regional private and foreign banks The large market share andimproved performance of state banks reported in recent data suggests although the datais sparse that government banks in Russia have also modernized realized competitive
advantages and provided policy alternatives against the impact of financial crisisabroadWe were unable to find evidence of policy making toward social inclusion at the
Bank of Russia or Russian state banks despite the historical trajectory of the Sberbankas a savings bank under communism The context also appears to differ considerably Asurvey of the Zircon Research Group reportedly found that only 15 percent of Russiansretain bank accounts because of mistrust in banks and government This combination ofrealist politics and the realization of competitive advantages by Russian state bankssuggests that theories of economic statecraft in the realist tradition may indeed explainthe domestic developments under study
Conclusion
This paper reports evidence about government bank modernization and financialstatecraft in BRIC countries designed to counter the effects of crisis and shape domesticgrowth Government banks in BRIC countries have contributed to the widely notedadjustment of these economies to global financial crisis and economic downturnContrary to the Washington Consensus that prevailed during much of the 1980s and1990s (that privatization and liberalization especially of banking would free marketforces and deepen domestic financial systems) a quite different process of bank changeappears to have ensued after financial liberalization in the BRICs
Instead of replacement of state banks with private banks government banksremain central agents of domestic credit and growth and have modernized ldquojust intimerdquo The capitalization and realization of competitive advantages by large governmentbanks during the 2000s meant that once the US financial panic spread across capitalmarkets broke highly leveraged private and produced runs on private bank depositspolicy makers in BRIC countries nonetheless retained counter cyclical policyalternatives through their more solid large state banks
These findings counter traditional foci on the private sector individualentrepreneurship and ideals of free markets linked to the political and social advancesrecorded around the world in the last decades We report an anomaly for theories offinancial repression and the Washington Consensus about the virtues of privatization
and liberalization Although largely blamed for reproducing underdevelopment in thepast BRIC government banks averted excesses of private banking that drove creditbubbles such as home mortgages and derivatives in the US And since liberalization ofbanking (we have not adequately discussed how much liberalization occurred in eachcountry) government banks have modernized to compete with private and foreignbanks Government banks have realized competitive advantages and provided policyalternatives These two arguments help explain why BRIC countries have farecomparatively well in the face of financial crisis in core countries
Financial statecraft is therefore at the center of BRIC counter cyclical capacitiesand state planning Brazil Russia India and China fared significantly better thanadvanced and many developing countries in terms of adjusting to credit crunches and
export shocks This is because government banks proved critical interbank credit toretain confidence in domestic banking systems These institutions also presented other
8132019 Government Banking and BRICs in the Recent Financial Crisis
httpslidepdfcomreaderfullgovernment-banking-and-brics-in-the-recent-financial-crisis 5557
983106983122983113983107 983111983151983158983141983154983150983149983141983150983156 983106983137983150983147983155 983137983150983140 983110983145983150983137983150983139983145983137983148 983123983156983137983156983141983139983154983137983142983156
55
policy alternatives for political and social forces Politics shaped adjustment andrecovery through state banks differently in BRIC countries Given the realities of statecentered political realism in Russia the redirection of state banks toward goals ofChinese Five Year Plans and the modernization of the State Bank of India amidst anamorphous federalism the experience of Brazil with democratization and public bank
modernization may stand out (Armijo 2009)Further analysis of savings banks and cooperative banks also will be requiredAs members of the World Savings Bank Institute (a global association of savingsbanks) the Caixa in Brazil SNI and NABARD in India and China Postal Savings Bankappear to have provided access to very large numbers of previously unbanked citizensThis returns to traditional ideas of social banking and the history of savings banks thatwere founded throughout Europe since the late 18 th century The upmarket strategy andexpansion into investment banking and international banking of the Russian Sberbankconstrasts with downmarket strategies of savings banks in Brazil India and China
The financial press has recently reported doubts about bad loans in Chinese statebanks and cast doubt on the financial results posted and reported in this paper
However current estimates of 2-5 percent bad loans in Chinese state banks pale incomparison to the US$1240 billion in bad loans shifted to asset managementcompanies in the mid 2000s before capitalization of these institutions through sale ofshares Critics of state banking in Brazil also point to past levels of bad loans (reaching30-40 percent) because of their capture during military government delayed transitionBut the cost of capitalization and transfer of bad loans from Brazilian state banks alsoremained below US$400 billion and is still contingent on liquidation of assetmanagement companies created in 2001 In any case these numbers are very smallcompared to GAO estimates of US$120 trillion in emergency infusions by USmonetary authorities to banks and financial institutions from 2007-11
These are anomalies for recent market-based banking theory and neo-liberalpolicy designs However they do not run counter to orthodoxy in economics andbanking theory Over the last decades economic reforms (fiscal financial monetaryand banking) have improved transparency and brought public policy and marketexpectations closer However expectations about deregulation and free marketequilibria in banking and finance have succumbed in the face of panic and the stillsobering consequences of crisis The materials presented herein are descriptive and willrequire more careful analysis However given the urgency of searching for alternativedevelopment models and different approaches to financial statecraft in BRIC countriesand beyond we have taken the liberty to present research in initial stages and toprovoke thought along the lines suggested by our kind conveners
8132019 Government Banking and BRICs in the Recent Financial Crisis
httpslidepdfcomreaderfullgovernment-banking-and-brics-in-the-recent-financial-crisis 5657
983106983122983113983107 983111983151983158983141983154983150983149983141983150983156 983106983137983150983147983155 983137983150983140 983110983145983150983137983150983139983145983137983148 983123983156983137983156983141983139983154983137983142983156
56
Appendix on Alternative Banking and Social Inclusion
This appendix describes how ideas about government banking led to further work onalternative banking and social inclusion with help from the Rockefeller FoundationBellagio Center In July 2011 we were able to convene a conference designed to gather
scholars alternative banking executives and representatives from savings andcooperative bank associations to rethink strategies for social inclusion in the globalsouth and attempt to launch a new policy agenda Given the search for alternativestrategies to counter crisis and the advances of stabilization transparency and bankingsupervision in developing and emerging economies we call for alternative bankingcommunities in the global north and south to work together and help shape a new policyagenda for social inclusion Because savings banks credit cooperatives and otheralternative banking and finance institutions have realized competitive advantages andemerged from crisis we can now think beyond We believe that new policies may helpdeveloping and emerging nations redirect large domestic institutions such as postal andsavings banks toward meeting the UN millennium goals to eliminate poverty by 2015
Plans include writing a green paper on Core Principles for Alternative Bankingand Social Inclusion convening events to promote these principles through institutionalsupporters and networks and seeking adoption of these principles at policy venues suchas the World Savings Bank Institute the International Association of CooperativeBanks the Bank for International Settlements the International Financial ReportingStandards foundation the ISO International Standards Organization the Charter forResponsible Business regional development banks and the World Bank We also planto submit an edited volume of scholarly contributions on alternative banking and socialinclusion by year-end 2012 Interested parties are welcome to participate
Institutional supporters and networks include
Institutional SupportersColumbia University School of International and Public Affairs New YorkInstitute for Money Technology and Financial Inclusion University of CaliforniaIrvineKingacutes College Department of Management LondonSatildeo Paulo Business School Getulio Vargas FoundationSecond University of Naples
Networks
Association of Emerging Market Business Schools Satildeo Paulo BrazilCommunity of European Management Schools BrusselsCritical Political Economy NetworkEuropean Association of Co-operative Banks BrusselsGlobal Public Policy Network LondonInternational Cooperative Banking Association BrusselsSocial Science Finance Network AmsterdamSociety for Advancement of Social Economics PhiladelphiaWorld Savings Bank Institute Brussels
8132019 Government Banking and BRICs in the Recent Financial Crisis
httpslidepdfcomreaderfullgovernment-banking-and-brics-in-the-recent-financial-crisis 5757
983106983122983113983107 983111983151983158983141983154983150983149983141983150983156 983106983137983150983147983155 983137983150983140 983110983145983150983137983150983139983145983137983148 983123983156983137983156983141983139983154983137983142983156
Core Principles for Alternative Banking and Social Inclusion
Commitment to End Capital StarvationPromote access to and use of banking and financial services by all through newtechnologies and distribution channels to capitalize assets among the poor
Commitment to Universalize Income Savings Credit and FinanceProvide basic income via ATM cards and mobile banking to reach the poor and opennew channels of access to income savings credit finance insurance and opportunities
Prudent Banking and Regulatory ComplianceAlternative banking seeks to work within regulations guidelines and best practicesrecommended by domestic monetary authorities and international regulatory institutionssuch as the Bank for International Settlement Basel II Capital Risk Guidelines
Corporate Social Responsibility Leadership
Integrate corporate social responsibility into down-market business strategies andinstitutions of representation and democratization
Transparency and AccountabilityPublish annual reports and balance sheets in accord with international best practices offinancial social and sustainability reporting
Leadership in Provision of New Banking Services and Products to the PoorUse competitive advantages in banking and institutional networks to channel moreeffectively capital income and finance to the poor
Generate Sustainable Income and Household Asset AccumulationUse branch offices and new banking technologies to accelerate progress toward UNmillennium goals to eliminate poverty
Universalize Financial EducationPromote financial education to encourage responsible banking and finance and avertpredatory lending and unethical practices
Adopt Cutting Edge Technology and Management Practices to Provide
Competitive Alternative to Private Commercial and Investment Banks
Incorporate electronic card and mobile banking services to better serve the poorContribute to Realization of Bellagio Principles for SustainabilityPromote alternative banking and business practices that contribute to environmentallysustainable income consumption and production as stated in Bellagio Principles forSustainability
Respect and Build on National and Regional DifferencesI d f i l d l l i b ki i i i d i i l
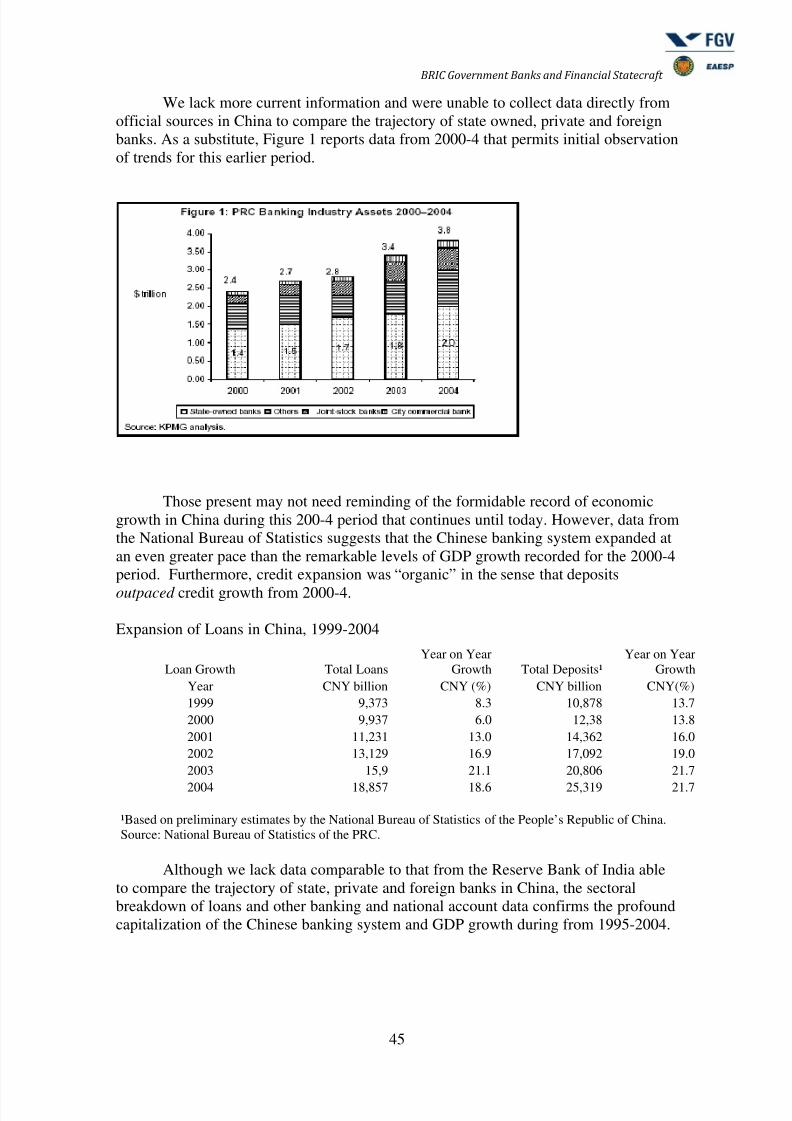
8132019 Government Banking and BRICs in the Recent Financial Crisis
httpslidepdfcomreaderfullgovernment-banking-and-brics-in-the-recent-financial-crisis 4657
983106983122983113983107 983111983151983158983141983154983150983149983141983150983156 983106983137983150983147983155 983137983150983140 983110983145983150983137983150983139983145983137983148 983123983156983137983156983141983139983154983137983142983156
46
China Banking Sector Market Dimensions (1995 - 2004)
YearTotal
LoansCorp
LoansConsuLoans
HomeLoans
TotalDeposits Excess
GovBonds
CorpBonds GDP
GDPGrowth
()1995 52310 mdash mdash mdash 5376 145 330 65 5848 2511996 63100 mdash mdash mdash 6847 538 436 60 6788 1611997 73585 7341 17 130 8212 853 551 52 7446 971998 85002 8447 53 430 9529 102 9 777 68 7835 521999 95587 9394 164 1360 10831 1273 1054 78 8207 482000 108763 10453 424 3320 13486 261 1302 86 894 892001 118990 112 699 5600 15472 3573 1562 101 9593 732002 139800 12913 1067 8258 18339 4359 mdash mdash 10479 922003 169770 15401 1576 13302 22036 5059 mdash mdash 11669 1142004 194220 16848 1988 15800 25319 5897 mdash mdash 13657 170Figures = CNYB
This data reported in terms of percent GDP provides further clarity on the rapid
capitalization of loans It is of note that the bulk of loans during this period were to thecorporate sector with consumer and home loans lagging significantly
China Banking Sector Percent GDP
YEARTotal
LoansCorporate
LoansConsumer
LoansHomeLoans Deposits
ExcessDeposits
GovBonds
CorpBonds
1995 895 00 00 00 919 25 56 111996 929 00 00 00 1009 79 64 091997 988 986 02 02 1103 115 74 071998 1085 1078 07 05 1216 131 99 091999 1165 1145 20 17 1320 155 128 092000 1217 1169 47 37 1508 292 146 102001 1240 1167 73 58 1613 372 163 112002 1334 1232 102 79 1750 4162003 1455 1320 135 114 1888 4342004 1422 1234 146 116 1854 432
Sources China Banking Regulatory Commission Peoplersquos Bank of China and GoldmanSachs research estimates
Compilation of financial data from a select number of banks in China suggeststhat the pattern of bank change encountered in Brazil and India also describes theexperience of China The liberalization of the Chinese economy and the modernization
of state banks appear to describe the process of bank change instead of a process oftransition toward private banking and capital market centered financial systemAlthough we have been unable to draw data from Chinese monetary authorities thebalance sheet data suggests the clear predominance of large state banks in the politicaleconomy of banking and finance in China How these institutions were used to counterthe effects of financial crisis abroad and redirect domestic investment production andconsumption must remain a subject for further research
8132019 Government Banking and BRICs in the Recent Financial Crisis
httpslidepdfcomreaderfullgovernment-banking-and-brics-in-the-recent-financial-crisis 4757
983106983122983113983107 983111983151983158983141983154983150983149983141983150983156 983106983137983150983147983155 983137983150983140 983110983145983150983137983150983139983145983137983148 983123983156983137983156983141983139983154983137983142983156
47
Select Financial Data from Chinese Banks 2004()
CNY (billion)Total
AssetsGrossLoans
CustomerDeposits Equity
NPLRatio
()
Pre-prov
ProfitsNet
Profits
State Banks
ICBC 5671 3705 5105 163 190 653 23CCB 3905 2226 3489 195 39 605 484ABC (NA) mdashBOC 427 2146 3342 205 51 578 209Quasi-State
BoCom 1145 639 1023 54 30 131 16CMB 587 376 513 22 29 82 32CITIC Industrial 515 306 429 20 60 52 03SPDB 456 311 397 14 24 62 20China Everbright mdashGuangdong Development 345 216 301 mdash mdash mdash 32
Industrial Bank 341 203 283 10 25 37 11Quase-Private
Bank of Shanghai 216 106 179 83 51 32 26Hua Xia 304 181 270 92 40 29 10Shenzhen Development 198 126 166 43 114 28 03Bank of Beijing 209 85 174 71 mdash 26 07
Sector total 19422 25319 129Three state-banks 2692 3979 188Second tier banks 2549 3733 148
ABC = Agriculture Bank of China BOC = Bank of China
BOCOM = Bank of Communications CCB = China Construction BankCMB = China Merchantrsquos Bank CNY = yuanICBC = Industrial and Commercial Bank of ChinaNPL = nonperforming loanROA = return on assets ROE = return on equityprov = provisioningPRC = Peoplersquos Republic of ChinaSPDB = Shanghai Pudong Development BankNote Loan and deposit market share for BOC and ICBC are for their domestic operations onlySources Company data Goldman Sachs research estimates
Returns on Assets Equity and Domestic Market Shares of Major China Banks 2004()
CNY (billion) ROA () ROE ()Deposit Mkt
Share ()Loan MktShare ()
Mortgage MktShare()
State Banks
ICBC 004 14 199 187 253CCB 130 254 138 115 217ABC (NA)BOC 051 102 101 89 152Quasi-State
BoCom 015 45 37 29 34CMB 060 161 20 19 29
CITIC Industrial 007 17 17 16 18SPDB 048 153 16 16 26
8132019 Government Banking and BRICs in the Recent Financial Crisis
httpslidepdfcomreaderfullgovernment-banking-and-brics-in-the-recent-financial-crisis 4857
983106983122983113983107 983111983151983158983141983154983150983149983141983150983156 983106983137983150983147983155 983137983150983140 983110983145983150983137983150983139983145983137983148 983123983156983137983156983141983139983154983137983142983156
48
China EverbrightGuangdong Development mdash mdash 12 11 mdashIndustrial Bank 037 126 11 10 10Quase-Private
Bank of Shanghai 129 360 07 05 14Hua Xia 038 116 11 09 07Shenzhen Development 017 75 07 06 08Bank of Beijing 037 108 07 04 07
Sector totalThree state-banks 438 391 622Second tier banks 144 127 154
ABC = Agriculture Bank of China BOC = Bank of China BOCOM = Bank of Communications CCB =China Construction Bank CMB = China Merchantrsquos Bank CNY = yuanICBC = Industrial and Commercial Bank of China mkt = market NPL = nonperforming loan ROA =return on asset ROE = return on equity prov = provisioning PRC =Peoplersquos Republic of China SPDB = Shanghai Pudong Development BankNote Loan and deposit market share for BOC and ICBC are for their domestic operations onlySources Company data Goldman Sachs research estimates
Further data from 2006-10 from the Peoples Bank of China suggests that the big5 state banks continue to outperform the next 12 largest joint stock commercial banksThe big five have launched sales of shares to capitalize while listing on capital marketsand adopting reporting of financial data along lines of international standards Thisappears to be similar to Banco do Brasil policies that retain majority of shares in federalgovernment control while capitalizing the bank through issues of stock
Comparing the Performance of Big 5 State Banks and Next 12 Joint Stock CommercialBanks in China
2006 2007 2008 2009 2010
Profit Margin Big 5 State Banks 3116 3143 2586 3026 3269
Next 12 JS Commercial Banks 2050 2791 1796 2159 2365
Returns Big 5 State Banks 507 606 860 691 675(risk adj) Next 12 JS Commercial Banks 459 570 1016 714 723
Op Risk Big 5 State Banks 5548 5539 5215 5319 5322Next 12 JS Commercial Banks 5886 5721 5725 5831 5947
Leverage Big 5 State Banks 1626 1482 1724 173 1734Next 12 JS Commercial Banks 2826 2251 2064 2048 1936
ROE Big 5 State Banks 1424 1557 1999 1925 2037Next 12 JS Commercial Banks 1564 2049 2156 1840 1967
Big 4 and 11 JSCBsSource Peoples Bank of China China Financial Stability Reports 2007-11
Performance indicators reported by the Peoples Bank of China for the big 5 statebanks and 12 next largest joint stock commercial banks also suggest that the largestgovernment banks in China retain significant competitive advantages ndash and may providepolicy alternatives Given the current shift of economic policy in China away fromindustry and export led growth to more sustainable domestic oriented growth and socialinclusion the role of state banks clearly comes to the fore
8132019 Government Banking and BRICs in the Recent Financial Crisis
httpslidepdfcomreaderfullgovernment-banking-and-brics-in-the-recent-financial-crisis 4957
983106983122983113983107 983111983151983158983141983154983150983149983141983150983156 983106983137983150983147983155 983137983150983140 983110983145983150983137983150983139983145983137983148 983123983156983137983156983141983139983154983137983142983156
49
Net Operating Income of Big 5 State Banks and Next 12 CommercialBanks 100 million RMB YuanBig 5 State Banks 2006 2007 2008 2009 2010
Balance Net interest income 349703 500456 556790 532206 720152Net fee amp commission inc 48524 103817 138464 175469 232491
Investment income 216089 283725 338865 324037 340440
Other business income (1807) (17054) 47548 33791 2186
Net operating income 612509 870944 1081667 1065503 1314943
Percent Net interest income 5709 5746 5148 4995 5477
Net fee amp commission inc 792 1192 1280 1646 1768
Investment income 3528 3258 3133 3041 2589
Other business income (030) (196) 440 318 166
Net operating income 10000 10000 10000 100 100
Next 12 Joint Stock CommercialBanks 2006 2007 2008 2009 2010
Net interest income 87253 132945 198965 191276 281588
Net fee amp commission inc 7850 16247 27319 30115 42023
Investment income 20959 32172 44864 50767 50500
Other business income 2306 4498 16359 10384 7400
Net operating income 118468 185861 287507 282542 381511
Percent Net interest income 7365 7153 6920 6769 7381
Net fee amp commission inc 671 874 950 1066 1101
Investment income 1769 1731 1560 1797 1324
Other business income 195 242 569 368 194Net operating income 10000 10000 10000 10000 10000
Source Peoples Bank of China China Financial Stability Reports 2007-11
Big 4 and 11 JSCBsBig 5 = ICBC ABC BOC CCB BOCOMNext 12 Joint Stock Commercial Banks = China CITIC Bank Everbright Bank Huaxia BankGuangdong Development Bank Shenzhen Development Bank China Merchants Bank Shanghai PudongDevelopment Bank Industrial Bank China Minsheng Banking Corporation Evergrowing Bank ChinaZheshang Bank Bohai Bank
In conclusion bank change in China also appears to confirm our findings from
Brazil ndash that state banks have realized competitive advantages and increased marketshares since liberalization while providing counter cyclical credit to ameliorateadjustment to crisis The modernization of the China Postal Savings Bank is ofparticular interest given its social mission downmarket focus and 40000 branchOffices throughout the country Expansion of card payment services through the postalbank system confirms the importance of the Brazilian federal savings bank (CaixaEconocircmica Federal Caixa) as agent for federal government social policy and agentresponsible for management of citizenship cards (12 million) and payment of familygrants This back to the future modernization of savings banks has proved essential forovercoming notorious levels of social exclusion and inequality in Brazil Althoughenglish language materials are unavailable on the China Postal Savings Bank thisinstitution clearly presents profound opportunities for comparable policies in China
8132019 Government Banking and BRICs in the Recent Financial Crisis
httpslidepdfcomreaderfullgovernment-banking-and-brics-in-the-recent-financial-crisis 5057
983106983122983113983107 983111983151983158983141983154983150983149983141983150983156 983106983137983150983147983155 983137983150983140 983110983145983150983137983150983139983145983137983148 983123983156983137983156983141983139983154983137983142983156
50
Reported offer of microfinance services for poverty reduction as part of nationaleconomic stimulous plan may point to developments in this direction
Given that state planning capacity has long been at the center of attention intheories of financial statecraft the role of Chinese state banks in redirecting policiesaccording to the 12th 5 Year plan for 2011-15 seems critical From 2000-5 the 10th 5
Year plan emphasized infrastructure and the attraction of investment and labor skillsThe 11th 5 Year plan (2006-10) raised concerns about sustainability rather than growthlevels while also seeking to spread improvements to balance development better servepeople and improve the quality of life continue to support Center and West provincesand revitalize Northeast provinces In comparison the 12th 5 Year plan calls for morebalanced lsquoinclusiversquo growth and structural adjustemts more than 4 trillion RMB($US600 billion) for targeted industries and interior regions a focus on new energynew materials and information and high technologies biology and new medicineenergy converstaion and environmental protection aerospace marine and advancedmanufacturing This implies fundamental shifts away from industry to services that hasbeen reported in macroeconomic data for 2010 If past studies emphasized directed
credit and industrial change the role of Chinese state banks in realizing transformationscertainly warrants study
Although the domestic flow of funds process of liberalization (or the lackthereof) and insertion of banking into Chinese political economy is beyond the scope ofthis paper our findings from Brazil appear to provide valuable hypotheses about ChinaThat is to say the big state banks and other government banks in China remaincommanding heights not in the Marxist sense of providing means to reach socialismbut immense institutions with profound presence throughout politics and markets in thecountry In this sense our findings from Brazil appear to approximate patterns ofchange in China more than Washington Consensus expectations about liberalization andprivatizations to free private and foreign banks Financial statecraft draws attention tothe capitalization of Chinese state banks through stock Sales and listings on capitalmarkets However like the Banco do Brasil (that reformers in the 1990s sought to shiftcontrol to the private sector only to increase federal government shareholding) theChinese experience surely involves unexpected consequences and patterns of changedifferent than a linear transition to the Berle amp Means paradigm of corporategovernance
Russia The New State Duopoly
ldquoThe rush of 2003-8 increased the market share of foreign banks to 285 from
52 However the state-owned banks received enormous help from the federal budget in the days of the crisis thereby strengthening their dominant
position on the Russian financial market says Sergey Aleksashenko the formerDeputy chairman of Russias Central Bank quotes Russia Profile Today one
must not harbor any illusion of a fair competition with them all the main cash
flows in Russia are controlled by state-owned banks httpwwwbarentsnovacomnode1031
Description of banking policy in Russia during the global financial crisis can beobtained from Bank of Russia annual reports and related publications The figure on the
following page summarizes the financial flows to and from the Bank of RussiaAlthough central bank policy is beyond the scope of this study the role of state banks in
8132019 Government Banking and BRICs in the Recent Financial Crisis
httpslidepdfcomreaderfullgovernment-banking-and-brics-in-the-recent-financial-crisis 5157
983106983122983113983107 983111983151983158983141983154983150983149983141983150983156 983106983137983150983147983155 983137983150983140 983110983145983150983137983150983139983145983137983148 983123983156983137983156983141983139983154983137983142983156
51
channeling counter-cyclical credits released by the Bank of Russia appear to confirm thecore argument that emerges from our studies of the Brazilian banking system Furtherdata on the following pages also suggest that state banks in Russia performed wellduring 2008-10 confirming on the basis of sparse data taken from Bank of Russiareports and documents that public banks have modernized provided counter-cyclical
credit to reverse credit crunch and economic downturn while realizing competitiveadvantages over private and foreign banks
8132019 Government Banking and BRICs in the Recent Financial Crisis
httpslidepdfcomreaderfullgovernment-banking-and-brics-in-the-recent-financial-crisis 5257
983106983122983113983107 983111983151983158983141983154983150983149983141983150983156 983106983137983150983147983155 983137983150983140 983110983145983150983137983150983139983145983137983148 983123983156983137983156983141983139983154983137983142983156
52
The following aggregate figures reported by the Bank of Russia suggest severaltrends of significance First Chart 32 suggests that household deposits shifted fromRuble deposits to foreign currency pegged (or indexed) during 2008 Second Chart 33illustrates the substantial increase of non-bank overdue debt during second semester
2008
Consequently the financial results and profitability of banks declinedsignificantly during 2008 The greater confidence in deposits with government banksfound abroad suggests that this may have been critical in Russia
Performance data deom 2008-10 provides a clearer picture one that is consistentwith our findings in Brazil State banks appear to have outperformed all other types of
banks except medium and small regional banks The following table reports the averagereturns on assets and returns on equity reported by the Bank of Russia 2008-10
Returns on Assets and Equity by Type of Bank in Russia 2008-9
Return on assets Return on equity 2008 2009 2010 2008 2009 2010
-------------------------------------------------------------------------------------------------------------------State Banks 22 08 24 157 46 148Foreign Banks 18 11 21 146 83 145Large private banks 13 03 11 106 28 84Medium-Small Banks Moscow 15 12 14 68 52 67
Medium-Small Regional Banks 21 12 15 131 65 98--------------------------------------------------------------------------------------------------------------------Source Bank of Russia Bank Supervision Reports 2009 and 2010
8132019 Government Banking and BRICs in the Recent Financial Crisis
httpslidepdfcomreaderfullgovernment-banking-and-brics-in-the-recent-financial-crisis 5357
983106983122983113983107 983111983151983158983141983154983150983149983141983150983156 983106983137983150983147983155 983137983150983140 983110983145983150983137983150983139983145983137983148 983123983156983137983156983141983139983154983137983142983156
53
Further data from the Bank of Russia on the capital adequacy of Banks during2009-10 suggest that foreign banks and large private banks remain less capitalizedagainst risks according to Basel II guidelines albeit at levels almost double thatrecommended by the Bank for International Settlements (80 risk weighted) Although
further analysis is needed this data is consistent from that reported in Brazil thatgovernment banks tend to more cautious and more prudent in terms of placing asidehigher levels of reserves and patrimony against possible losses
Capital Adequacy of Banks by Type of Bank in Russia 2009-10
2009 2010 2011---------------------------------------------------------------------------------------------------------State Banks 184 227 186Foreign Banks 155 196 195Large Private Banks 140 181 155
Medium-Small Banks Moscow 316 312 268Medium-Small Regional Banks 219 241 207Non-Bank Credit Institutions 372 1038 678---------------------------------------------------------------------------------------------------------Source Bank of Russia Bank Supervision Report (Moscow) 2009 p 43
Finally Bank of Russia bank supervision reports also suggest that state banksexpanded their market shares of assets and capital during the years following the globalfinancial crisis While large private banks and foreign banks lost market share of bankassets and bank capital in Russia state banks increased their significant market sharefrom 405 ndash 426 percent and 471-476 percent of assets and capital respectivelyUnfortunately data from previous years and for specific banking groups was notobtained However this data does appear to indicate that our findings of competitiveadvantages and policy alternatives
Number and Market Share by Type of Bank
N Banks Assets Capital---------------------------- ---------------------------- ----------------------------
Type of Bank 2009 2010 2011 2009 2010 2011 2009 2010 2011-------------------------------------------------------------------------------------------------------------------------------State 17 22 27 405 439 458 471 489 473
Foreign 101 106 108 187 183 180 172 169 191Large Private 136 139 131 346 333 305 276 287 269Med-Small Moscow 361 335 317 27 26 26 43 34 35Medi-Small Regional 443 412 372 28 28 27 36 31 29Other Credit Institutions 50 51 57 07 04 04 01 02 03Total 1108 1058 100 100 100 100 100 100-------------------------------------------------------------------------------------------------------------------------------Source Bank of Russia Bank Supervision Report 2009 amp 2010
In sum politics and financial statecraft have led to the realization of significantcompetitive advantage by Russian state banks Sperbank and Vneshtorgbank increasedtheir share of bank assets from 32 percent in 2005 to over 50 percent by 2011 through
mergers and acquisitions and aggressive displacement of foreign banks Whatever thepolitics data from the Bank of Russia suggests that monetary authorities released a
8132019 Government Banking and BRICs in the Recent Financial Crisis
httpslidepdfcomreaderfullgovernment-banking-and-brics-in-the-recent-financial-crisis 5457
983106983122983113983107 983111983151983158983141983154983150983149983141983150983156 983106983137983150983147983155 983137983150983140 983110983145983150983137983150983139983145983137983148 983123983156983137983156983141983139983154983137983142983156
54
series of counter cyclical credit injections during 2008-9 to domestic bankinginstitutions Moreover data suggests that state banks continue to perform at or ahead oflevels reported by regional private and foreign banks The large market share andimproved performance of state banks reported in recent data suggests although the datais sparse that government banks in Russia have also modernized realized competitive
advantages and provided policy alternatives against the impact of financial crisisabroadWe were unable to find evidence of policy making toward social inclusion at the
Bank of Russia or Russian state banks despite the historical trajectory of the Sberbankas a savings bank under communism The context also appears to differ considerably Asurvey of the Zircon Research Group reportedly found that only 15 percent of Russiansretain bank accounts because of mistrust in banks and government This combination ofrealist politics and the realization of competitive advantages by Russian state bankssuggests that theories of economic statecraft in the realist tradition may indeed explainthe domestic developments under study
Conclusion
This paper reports evidence about government bank modernization and financialstatecraft in BRIC countries designed to counter the effects of crisis and shape domesticgrowth Government banks in BRIC countries have contributed to the widely notedadjustment of these economies to global financial crisis and economic downturnContrary to the Washington Consensus that prevailed during much of the 1980s and1990s (that privatization and liberalization especially of banking would free marketforces and deepen domestic financial systems) a quite different process of bank changeappears to have ensued after financial liberalization in the BRICs
Instead of replacement of state banks with private banks government banksremain central agents of domestic credit and growth and have modernized ldquojust intimerdquo The capitalization and realization of competitive advantages by large governmentbanks during the 2000s meant that once the US financial panic spread across capitalmarkets broke highly leveraged private and produced runs on private bank depositspolicy makers in BRIC countries nonetheless retained counter cyclical policyalternatives through their more solid large state banks
These findings counter traditional foci on the private sector individualentrepreneurship and ideals of free markets linked to the political and social advancesrecorded around the world in the last decades We report an anomaly for theories offinancial repression and the Washington Consensus about the virtues of privatization
and liberalization Although largely blamed for reproducing underdevelopment in thepast BRIC government banks averted excesses of private banking that drove creditbubbles such as home mortgages and derivatives in the US And since liberalization ofbanking (we have not adequately discussed how much liberalization occurred in eachcountry) government banks have modernized to compete with private and foreignbanks Government banks have realized competitive advantages and provided policyalternatives These two arguments help explain why BRIC countries have farecomparatively well in the face of financial crisis in core countries
Financial statecraft is therefore at the center of BRIC counter cyclical capacitiesand state planning Brazil Russia India and China fared significantly better thanadvanced and many developing countries in terms of adjusting to credit crunches and
export shocks This is because government banks proved critical interbank credit toretain confidence in domestic banking systems These institutions also presented other
8132019 Government Banking and BRICs in the Recent Financial Crisis
httpslidepdfcomreaderfullgovernment-banking-and-brics-in-the-recent-financial-crisis 5557
983106983122983113983107 983111983151983158983141983154983150983149983141983150983156 983106983137983150983147983155 983137983150983140 983110983145983150983137983150983139983145983137983148 983123983156983137983156983141983139983154983137983142983156
55
policy alternatives for political and social forces Politics shaped adjustment andrecovery through state banks differently in BRIC countries Given the realities of statecentered political realism in Russia the redirection of state banks toward goals ofChinese Five Year Plans and the modernization of the State Bank of India amidst anamorphous federalism the experience of Brazil with democratization and public bank
modernization may stand out (Armijo 2009)Further analysis of savings banks and cooperative banks also will be requiredAs members of the World Savings Bank Institute (a global association of savingsbanks) the Caixa in Brazil SNI and NABARD in India and China Postal Savings Bankappear to have provided access to very large numbers of previously unbanked citizensThis returns to traditional ideas of social banking and the history of savings banks thatwere founded throughout Europe since the late 18 th century The upmarket strategy andexpansion into investment banking and international banking of the Russian Sberbankconstrasts with downmarket strategies of savings banks in Brazil India and China
The financial press has recently reported doubts about bad loans in Chinese statebanks and cast doubt on the financial results posted and reported in this paper
However current estimates of 2-5 percent bad loans in Chinese state banks pale incomparison to the US$1240 billion in bad loans shifted to asset managementcompanies in the mid 2000s before capitalization of these institutions through sale ofshares Critics of state banking in Brazil also point to past levels of bad loans (reaching30-40 percent) because of their capture during military government delayed transitionBut the cost of capitalization and transfer of bad loans from Brazilian state banks alsoremained below US$400 billion and is still contingent on liquidation of assetmanagement companies created in 2001 In any case these numbers are very smallcompared to GAO estimates of US$120 trillion in emergency infusions by USmonetary authorities to banks and financial institutions from 2007-11
These are anomalies for recent market-based banking theory and neo-liberalpolicy designs However they do not run counter to orthodoxy in economics andbanking theory Over the last decades economic reforms (fiscal financial monetaryand banking) have improved transparency and brought public policy and marketexpectations closer However expectations about deregulation and free marketequilibria in banking and finance have succumbed in the face of panic and the stillsobering consequences of crisis The materials presented herein are descriptive and willrequire more careful analysis However given the urgency of searching for alternativedevelopment models and different approaches to financial statecraft in BRIC countriesand beyond we have taken the liberty to present research in initial stages and toprovoke thought along the lines suggested by our kind conveners
8132019 Government Banking and BRICs in the Recent Financial Crisis
httpslidepdfcomreaderfullgovernment-banking-and-brics-in-the-recent-financial-crisis 5657
983106983122983113983107 983111983151983158983141983154983150983149983141983150983156 983106983137983150983147983155 983137983150983140 983110983145983150983137983150983139983145983137983148 983123983156983137983156983141983139983154983137983142983156
56
Appendix on Alternative Banking and Social Inclusion
This appendix describes how ideas about government banking led to further work onalternative banking and social inclusion with help from the Rockefeller FoundationBellagio Center In July 2011 we were able to convene a conference designed to gather
scholars alternative banking executives and representatives from savings andcooperative bank associations to rethink strategies for social inclusion in the globalsouth and attempt to launch a new policy agenda Given the search for alternativestrategies to counter crisis and the advances of stabilization transparency and bankingsupervision in developing and emerging economies we call for alternative bankingcommunities in the global north and south to work together and help shape a new policyagenda for social inclusion Because savings banks credit cooperatives and otheralternative banking and finance institutions have realized competitive advantages andemerged from crisis we can now think beyond We believe that new policies may helpdeveloping and emerging nations redirect large domestic institutions such as postal andsavings banks toward meeting the UN millennium goals to eliminate poverty by 2015
Plans include writing a green paper on Core Principles for Alternative Bankingand Social Inclusion convening events to promote these principles through institutionalsupporters and networks and seeking adoption of these principles at policy venues suchas the World Savings Bank Institute the International Association of CooperativeBanks the Bank for International Settlements the International Financial ReportingStandards foundation the ISO International Standards Organization the Charter forResponsible Business regional development banks and the World Bank We also planto submit an edited volume of scholarly contributions on alternative banking and socialinclusion by year-end 2012 Interested parties are welcome to participate
Institutional supporters and networks include
Institutional SupportersColumbia University School of International and Public Affairs New YorkInstitute for Money Technology and Financial Inclusion University of CaliforniaIrvineKingacutes College Department of Management LondonSatildeo Paulo Business School Getulio Vargas FoundationSecond University of Naples
Networks
Association of Emerging Market Business Schools Satildeo Paulo BrazilCommunity of European Management Schools BrusselsCritical Political Economy NetworkEuropean Association of Co-operative Banks BrusselsGlobal Public Policy Network LondonInternational Cooperative Banking Association BrusselsSocial Science Finance Network AmsterdamSociety for Advancement of Social Economics PhiladelphiaWorld Savings Bank Institute Brussels
8132019 Government Banking and BRICs in the Recent Financial Crisis
httpslidepdfcomreaderfullgovernment-banking-and-brics-in-the-recent-financial-crisis 5757
983106983122983113983107 983111983151983158983141983154983150983149983141983150983156 983106983137983150983147983155 983137983150983140 983110983145983150983137983150983139983145983137983148 983123983156983137983156983141983139983154983137983142983156
Core Principles for Alternative Banking and Social Inclusion
Commitment to End Capital StarvationPromote access to and use of banking and financial services by all through newtechnologies and distribution channels to capitalize assets among the poor
Commitment to Universalize Income Savings Credit and FinanceProvide basic income via ATM cards and mobile banking to reach the poor and opennew channels of access to income savings credit finance insurance and opportunities
Prudent Banking and Regulatory ComplianceAlternative banking seeks to work within regulations guidelines and best practicesrecommended by domestic monetary authorities and international regulatory institutionssuch as the Bank for International Settlement Basel II Capital Risk Guidelines
Corporate Social Responsibility Leadership
Integrate corporate social responsibility into down-market business strategies andinstitutions of representation and democratization
Transparency and AccountabilityPublish annual reports and balance sheets in accord with international best practices offinancial social and sustainability reporting
Leadership in Provision of New Banking Services and Products to the PoorUse competitive advantages in banking and institutional networks to channel moreeffectively capital income and finance to the poor
Generate Sustainable Income and Household Asset AccumulationUse branch offices and new banking technologies to accelerate progress toward UNmillennium goals to eliminate poverty
Universalize Financial EducationPromote financial education to encourage responsible banking and finance and avertpredatory lending and unethical practices
Adopt Cutting Edge Technology and Management Practices to Provide
Competitive Alternative to Private Commercial and Investment Banks
Incorporate electronic card and mobile banking services to better serve the poorContribute to Realization of Bellagio Principles for SustainabilityPromote alternative banking and business practices that contribute to environmentallysustainable income consumption and production as stated in Bellagio Principles forSustainability
Respect and Build on National and Regional DifferencesI d f i l d l l i b ki i i i d i i l
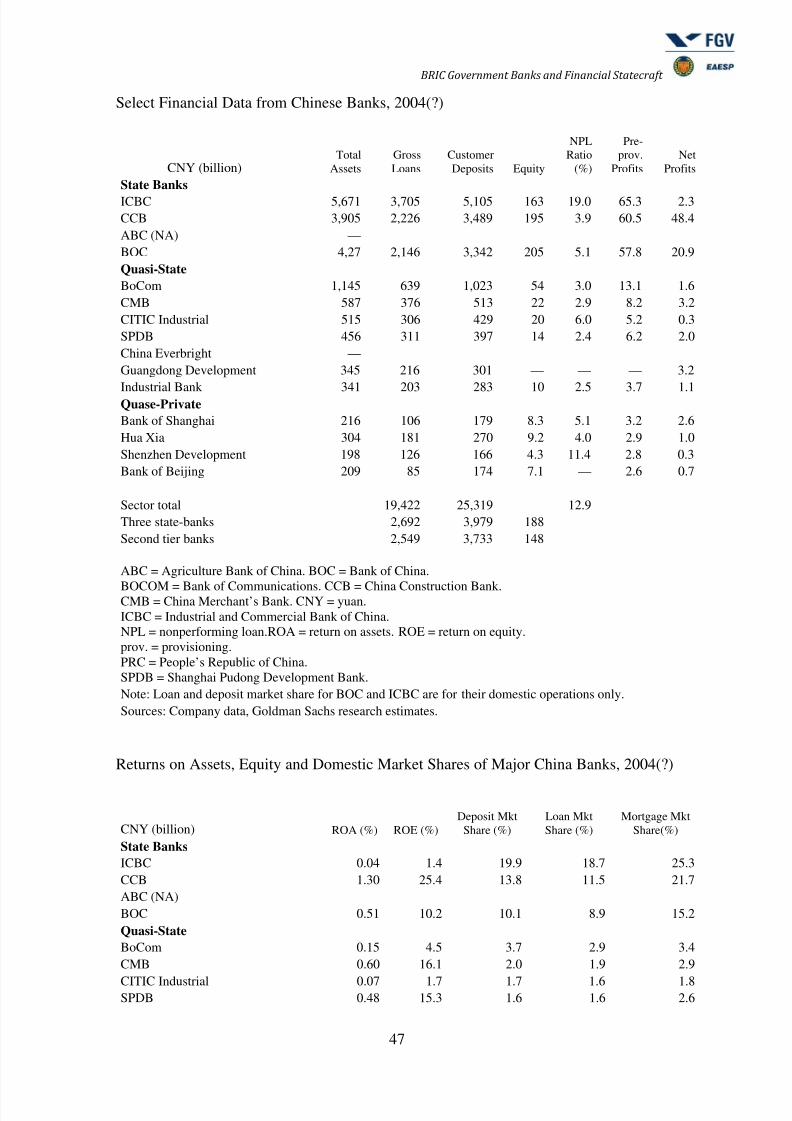
8132019 Government Banking and BRICs in the Recent Financial Crisis
httpslidepdfcomreaderfullgovernment-banking-and-brics-in-the-recent-financial-crisis 4757
983106983122983113983107 983111983151983158983141983154983150983149983141983150983156 983106983137983150983147983155 983137983150983140 983110983145983150983137983150983139983145983137983148 983123983156983137983156983141983139983154983137983142983156
47
Select Financial Data from Chinese Banks 2004()
CNY (billion)Total
AssetsGrossLoans
CustomerDeposits Equity
NPLRatio
()
Pre-prov
ProfitsNet
Profits
State Banks
ICBC 5671 3705 5105 163 190 653 23CCB 3905 2226 3489 195 39 605 484ABC (NA) mdashBOC 427 2146 3342 205 51 578 209Quasi-State
BoCom 1145 639 1023 54 30 131 16CMB 587 376 513 22 29 82 32CITIC Industrial 515 306 429 20 60 52 03SPDB 456 311 397 14 24 62 20China Everbright mdashGuangdong Development 345 216 301 mdash mdash mdash 32
Industrial Bank 341 203 283 10 25 37 11Quase-Private
Bank of Shanghai 216 106 179 83 51 32 26Hua Xia 304 181 270 92 40 29 10Shenzhen Development 198 126 166 43 114 28 03Bank of Beijing 209 85 174 71 mdash 26 07
Sector total 19422 25319 129Three state-banks 2692 3979 188Second tier banks 2549 3733 148
ABC = Agriculture Bank of China BOC = Bank of China
BOCOM = Bank of Communications CCB = China Construction BankCMB = China Merchantrsquos Bank CNY = yuanICBC = Industrial and Commercial Bank of ChinaNPL = nonperforming loanROA = return on assets ROE = return on equityprov = provisioningPRC = Peoplersquos Republic of ChinaSPDB = Shanghai Pudong Development BankNote Loan and deposit market share for BOC and ICBC are for their domestic operations onlySources Company data Goldman Sachs research estimates
Returns on Assets Equity and Domestic Market Shares of Major China Banks 2004()
CNY (billion) ROA () ROE ()Deposit Mkt
Share ()Loan MktShare ()
Mortgage MktShare()
State Banks
ICBC 004 14 199 187 253CCB 130 254 138 115 217ABC (NA)BOC 051 102 101 89 152Quasi-State
BoCom 015 45 37 29 34CMB 060 161 20 19 29
CITIC Industrial 007 17 17 16 18SPDB 048 153 16 16 26
8132019 Government Banking and BRICs in the Recent Financial Crisis
httpslidepdfcomreaderfullgovernment-banking-and-brics-in-the-recent-financial-crisis 4857
983106983122983113983107 983111983151983158983141983154983150983149983141983150983156 983106983137983150983147983155 983137983150983140 983110983145983150983137983150983139983145983137983148 983123983156983137983156983141983139983154983137983142983156
48
China EverbrightGuangdong Development mdash mdash 12 11 mdashIndustrial Bank 037 126 11 10 10Quase-Private
Bank of Shanghai 129 360 07 05 14Hua Xia 038 116 11 09 07Shenzhen Development 017 75 07 06 08Bank of Beijing 037 108 07 04 07
Sector totalThree state-banks 438 391 622Second tier banks 144 127 154
ABC = Agriculture Bank of China BOC = Bank of China BOCOM = Bank of Communications CCB =China Construction Bank CMB = China Merchantrsquos Bank CNY = yuanICBC = Industrial and Commercial Bank of China mkt = market NPL = nonperforming loan ROA =return on asset ROE = return on equity prov = provisioning PRC =Peoplersquos Republic of China SPDB = Shanghai Pudong Development BankNote Loan and deposit market share for BOC and ICBC are for their domestic operations onlySources Company data Goldman Sachs research estimates
Further data from 2006-10 from the Peoples Bank of China suggests that the big5 state banks continue to outperform the next 12 largest joint stock commercial banksThe big five have launched sales of shares to capitalize while listing on capital marketsand adopting reporting of financial data along lines of international standards Thisappears to be similar to Banco do Brasil policies that retain majority of shares in federalgovernment control while capitalizing the bank through issues of stock
Comparing the Performance of Big 5 State Banks and Next 12 Joint Stock CommercialBanks in China
2006 2007 2008 2009 2010
Profit Margin Big 5 State Banks 3116 3143 2586 3026 3269
Next 12 JS Commercial Banks 2050 2791 1796 2159 2365
Returns Big 5 State Banks 507 606 860 691 675(risk adj) Next 12 JS Commercial Banks 459 570 1016 714 723
Op Risk Big 5 State Banks 5548 5539 5215 5319 5322Next 12 JS Commercial Banks 5886 5721 5725 5831 5947
Leverage Big 5 State Banks 1626 1482 1724 173 1734Next 12 JS Commercial Banks 2826 2251 2064 2048 1936
ROE Big 5 State Banks 1424 1557 1999 1925 2037Next 12 JS Commercial Banks 1564 2049 2156 1840 1967
Big 4 and 11 JSCBsSource Peoples Bank of China China Financial Stability Reports 2007-11
Performance indicators reported by the Peoples Bank of China for the big 5 statebanks and 12 next largest joint stock commercial banks also suggest that the largestgovernment banks in China retain significant competitive advantages ndash and may providepolicy alternatives Given the current shift of economic policy in China away fromindustry and export led growth to more sustainable domestic oriented growth and socialinclusion the role of state banks clearly comes to the fore
8132019 Government Banking and BRICs in the Recent Financial Crisis
httpslidepdfcomreaderfullgovernment-banking-and-brics-in-the-recent-financial-crisis 4957
983106983122983113983107 983111983151983158983141983154983150983149983141983150983156 983106983137983150983147983155 983137983150983140 983110983145983150983137983150983139983145983137983148 983123983156983137983156983141983139983154983137983142983156
49
Net Operating Income of Big 5 State Banks and Next 12 CommercialBanks 100 million RMB YuanBig 5 State Banks 2006 2007 2008 2009 2010
Balance Net interest income 349703 500456 556790 532206 720152Net fee amp commission inc 48524 103817 138464 175469 232491
Investment income 216089 283725 338865 324037 340440
Other business income (1807) (17054) 47548 33791 2186
Net operating income 612509 870944 1081667 1065503 1314943
Percent Net interest income 5709 5746 5148 4995 5477
Net fee amp commission inc 792 1192 1280 1646 1768
Investment income 3528 3258 3133 3041 2589
Other business income (030) (196) 440 318 166
Net operating income 10000 10000 10000 100 100
Next 12 Joint Stock CommercialBanks 2006 2007 2008 2009 2010
Net interest income 87253 132945 198965 191276 281588
Net fee amp commission inc 7850 16247 27319 30115 42023
Investment income 20959 32172 44864 50767 50500
Other business income 2306 4498 16359 10384 7400
Net operating income 118468 185861 287507 282542 381511
Percent Net interest income 7365 7153 6920 6769 7381
Net fee amp commission inc 671 874 950 1066 1101
Investment income 1769 1731 1560 1797 1324
Other business income 195 242 569 368 194Net operating income 10000 10000 10000 10000 10000
Source Peoples Bank of China China Financial Stability Reports 2007-11
Big 4 and 11 JSCBsBig 5 = ICBC ABC BOC CCB BOCOMNext 12 Joint Stock Commercial Banks = China CITIC Bank Everbright Bank Huaxia BankGuangdong Development Bank Shenzhen Development Bank China Merchants Bank Shanghai PudongDevelopment Bank Industrial Bank China Minsheng Banking Corporation Evergrowing Bank ChinaZheshang Bank Bohai Bank
In conclusion bank change in China also appears to confirm our findings from
Brazil ndash that state banks have realized competitive advantages and increased marketshares since liberalization while providing counter cyclical credit to ameliorateadjustment to crisis The modernization of the China Postal Savings Bank is ofparticular interest given its social mission downmarket focus and 40000 branchOffices throughout the country Expansion of card payment services through the postalbank system confirms the importance of the Brazilian federal savings bank (CaixaEconocircmica Federal Caixa) as agent for federal government social policy and agentresponsible for management of citizenship cards (12 million) and payment of familygrants This back to the future modernization of savings banks has proved essential forovercoming notorious levels of social exclusion and inequality in Brazil Althoughenglish language materials are unavailable on the China Postal Savings Bank thisinstitution clearly presents profound opportunities for comparable policies in China
8132019 Government Banking and BRICs in the Recent Financial Crisis
httpslidepdfcomreaderfullgovernment-banking-and-brics-in-the-recent-financial-crisis 5057
983106983122983113983107 983111983151983158983141983154983150983149983141983150983156 983106983137983150983147983155 983137983150983140 983110983145983150983137983150983139983145983137983148 983123983156983137983156983141983139983154983137983142983156
50
Reported offer of microfinance services for poverty reduction as part of nationaleconomic stimulous plan may point to developments in this direction
Given that state planning capacity has long been at the center of attention intheories of financial statecraft the role of Chinese state banks in redirecting policiesaccording to the 12th 5 Year plan for 2011-15 seems critical From 2000-5 the 10th 5
Year plan emphasized infrastructure and the attraction of investment and labor skillsThe 11th 5 Year plan (2006-10) raised concerns about sustainability rather than growthlevels while also seeking to spread improvements to balance development better servepeople and improve the quality of life continue to support Center and West provincesand revitalize Northeast provinces In comparison the 12th 5 Year plan calls for morebalanced lsquoinclusiversquo growth and structural adjustemts more than 4 trillion RMB($US600 billion) for targeted industries and interior regions a focus on new energynew materials and information and high technologies biology and new medicineenergy converstaion and environmental protection aerospace marine and advancedmanufacturing This implies fundamental shifts away from industry to services that hasbeen reported in macroeconomic data for 2010 If past studies emphasized directed
credit and industrial change the role of Chinese state banks in realizing transformationscertainly warrants study
Although the domestic flow of funds process of liberalization (or the lackthereof) and insertion of banking into Chinese political economy is beyond the scope ofthis paper our findings from Brazil appear to provide valuable hypotheses about ChinaThat is to say the big state banks and other government banks in China remaincommanding heights not in the Marxist sense of providing means to reach socialismbut immense institutions with profound presence throughout politics and markets in thecountry In this sense our findings from Brazil appear to approximate patterns ofchange in China more than Washington Consensus expectations about liberalization andprivatizations to free private and foreign banks Financial statecraft draws attention tothe capitalization of Chinese state banks through stock Sales and listings on capitalmarkets However like the Banco do Brasil (that reformers in the 1990s sought to shiftcontrol to the private sector only to increase federal government shareholding) theChinese experience surely involves unexpected consequences and patterns of changedifferent than a linear transition to the Berle amp Means paradigm of corporategovernance
Russia The New State Duopoly
ldquoThe rush of 2003-8 increased the market share of foreign banks to 285 from
52 However the state-owned banks received enormous help from the federal budget in the days of the crisis thereby strengthening their dominant
position on the Russian financial market says Sergey Aleksashenko the formerDeputy chairman of Russias Central Bank quotes Russia Profile Today one
must not harbor any illusion of a fair competition with them all the main cash
flows in Russia are controlled by state-owned banks httpwwwbarentsnovacomnode1031
Description of banking policy in Russia during the global financial crisis can beobtained from Bank of Russia annual reports and related publications The figure on the
following page summarizes the financial flows to and from the Bank of RussiaAlthough central bank policy is beyond the scope of this study the role of state banks in
8132019 Government Banking and BRICs in the Recent Financial Crisis
httpslidepdfcomreaderfullgovernment-banking-and-brics-in-the-recent-financial-crisis 5157
983106983122983113983107 983111983151983158983141983154983150983149983141983150983156 983106983137983150983147983155 983137983150983140 983110983145983150983137983150983139983145983137983148 983123983156983137983156983141983139983154983137983142983156
51
channeling counter-cyclical credits released by the Bank of Russia appear to confirm thecore argument that emerges from our studies of the Brazilian banking system Furtherdata on the following pages also suggest that state banks in Russia performed wellduring 2008-10 confirming on the basis of sparse data taken from Bank of Russiareports and documents that public banks have modernized provided counter-cyclical
credit to reverse credit crunch and economic downturn while realizing competitiveadvantages over private and foreign banks
8132019 Government Banking and BRICs in the Recent Financial Crisis
httpslidepdfcomreaderfullgovernment-banking-and-brics-in-the-recent-financial-crisis 5257
983106983122983113983107 983111983151983158983141983154983150983149983141983150983156 983106983137983150983147983155 983137983150983140 983110983145983150983137983150983139983145983137983148 983123983156983137983156983141983139983154983137983142983156
52
The following aggregate figures reported by the Bank of Russia suggest severaltrends of significance First Chart 32 suggests that household deposits shifted fromRuble deposits to foreign currency pegged (or indexed) during 2008 Second Chart 33illustrates the substantial increase of non-bank overdue debt during second semester
2008
Consequently the financial results and profitability of banks declinedsignificantly during 2008 The greater confidence in deposits with government banksfound abroad suggests that this may have been critical in Russia
Performance data deom 2008-10 provides a clearer picture one that is consistentwith our findings in Brazil State banks appear to have outperformed all other types of
banks except medium and small regional banks The following table reports the averagereturns on assets and returns on equity reported by the Bank of Russia 2008-10
Returns on Assets and Equity by Type of Bank in Russia 2008-9
Return on assets Return on equity 2008 2009 2010 2008 2009 2010
-------------------------------------------------------------------------------------------------------------------State Banks 22 08 24 157 46 148Foreign Banks 18 11 21 146 83 145Large private banks 13 03 11 106 28 84Medium-Small Banks Moscow 15 12 14 68 52 67
Medium-Small Regional Banks 21 12 15 131 65 98--------------------------------------------------------------------------------------------------------------------Source Bank of Russia Bank Supervision Reports 2009 and 2010
8132019 Government Banking and BRICs in the Recent Financial Crisis
httpslidepdfcomreaderfullgovernment-banking-and-brics-in-the-recent-financial-crisis 5357
983106983122983113983107 983111983151983158983141983154983150983149983141983150983156 983106983137983150983147983155 983137983150983140 983110983145983150983137983150983139983145983137983148 983123983156983137983156983141983139983154983137983142983156
53
Further data from the Bank of Russia on the capital adequacy of Banks during2009-10 suggest that foreign banks and large private banks remain less capitalizedagainst risks according to Basel II guidelines albeit at levels almost double thatrecommended by the Bank for International Settlements (80 risk weighted) Although
further analysis is needed this data is consistent from that reported in Brazil thatgovernment banks tend to more cautious and more prudent in terms of placing asidehigher levels of reserves and patrimony against possible losses
Capital Adequacy of Banks by Type of Bank in Russia 2009-10
2009 2010 2011---------------------------------------------------------------------------------------------------------State Banks 184 227 186Foreign Banks 155 196 195Large Private Banks 140 181 155
Medium-Small Banks Moscow 316 312 268Medium-Small Regional Banks 219 241 207Non-Bank Credit Institutions 372 1038 678---------------------------------------------------------------------------------------------------------Source Bank of Russia Bank Supervision Report (Moscow) 2009 p 43
Finally Bank of Russia bank supervision reports also suggest that state banksexpanded their market shares of assets and capital during the years following the globalfinancial crisis While large private banks and foreign banks lost market share of bankassets and bank capital in Russia state banks increased their significant market sharefrom 405 ndash 426 percent and 471-476 percent of assets and capital respectivelyUnfortunately data from previous years and for specific banking groups was notobtained However this data does appear to indicate that our findings of competitiveadvantages and policy alternatives
Number and Market Share by Type of Bank
N Banks Assets Capital---------------------------- ---------------------------- ----------------------------
Type of Bank 2009 2010 2011 2009 2010 2011 2009 2010 2011-------------------------------------------------------------------------------------------------------------------------------State 17 22 27 405 439 458 471 489 473
Foreign 101 106 108 187 183 180 172 169 191Large Private 136 139 131 346 333 305 276 287 269Med-Small Moscow 361 335 317 27 26 26 43 34 35Medi-Small Regional 443 412 372 28 28 27 36 31 29Other Credit Institutions 50 51 57 07 04 04 01 02 03Total 1108 1058 100 100 100 100 100 100-------------------------------------------------------------------------------------------------------------------------------Source Bank of Russia Bank Supervision Report 2009 amp 2010
In sum politics and financial statecraft have led to the realization of significantcompetitive advantage by Russian state banks Sperbank and Vneshtorgbank increasedtheir share of bank assets from 32 percent in 2005 to over 50 percent by 2011 through
mergers and acquisitions and aggressive displacement of foreign banks Whatever thepolitics data from the Bank of Russia suggests that monetary authorities released a
8132019 Government Banking and BRICs in the Recent Financial Crisis
httpslidepdfcomreaderfullgovernment-banking-and-brics-in-the-recent-financial-crisis 5457
983106983122983113983107 983111983151983158983141983154983150983149983141983150983156 983106983137983150983147983155 983137983150983140 983110983145983150983137983150983139983145983137983148 983123983156983137983156983141983139983154983137983142983156
54
series of counter cyclical credit injections during 2008-9 to domestic bankinginstitutions Moreover data suggests that state banks continue to perform at or ahead oflevels reported by regional private and foreign banks The large market share andimproved performance of state banks reported in recent data suggests although the datais sparse that government banks in Russia have also modernized realized competitive
advantages and provided policy alternatives against the impact of financial crisisabroadWe were unable to find evidence of policy making toward social inclusion at the
Bank of Russia or Russian state banks despite the historical trajectory of the Sberbankas a savings bank under communism The context also appears to differ considerably Asurvey of the Zircon Research Group reportedly found that only 15 percent of Russiansretain bank accounts because of mistrust in banks and government This combination ofrealist politics and the realization of competitive advantages by Russian state bankssuggests that theories of economic statecraft in the realist tradition may indeed explainthe domestic developments under study
Conclusion
This paper reports evidence about government bank modernization and financialstatecraft in BRIC countries designed to counter the effects of crisis and shape domesticgrowth Government banks in BRIC countries have contributed to the widely notedadjustment of these economies to global financial crisis and economic downturnContrary to the Washington Consensus that prevailed during much of the 1980s and1990s (that privatization and liberalization especially of banking would free marketforces and deepen domestic financial systems) a quite different process of bank changeappears to have ensued after financial liberalization in the BRICs
Instead of replacement of state banks with private banks government banksremain central agents of domestic credit and growth and have modernized ldquojust intimerdquo The capitalization and realization of competitive advantages by large governmentbanks during the 2000s meant that once the US financial panic spread across capitalmarkets broke highly leveraged private and produced runs on private bank depositspolicy makers in BRIC countries nonetheless retained counter cyclical policyalternatives through their more solid large state banks
These findings counter traditional foci on the private sector individualentrepreneurship and ideals of free markets linked to the political and social advancesrecorded around the world in the last decades We report an anomaly for theories offinancial repression and the Washington Consensus about the virtues of privatization
and liberalization Although largely blamed for reproducing underdevelopment in thepast BRIC government banks averted excesses of private banking that drove creditbubbles such as home mortgages and derivatives in the US And since liberalization ofbanking (we have not adequately discussed how much liberalization occurred in eachcountry) government banks have modernized to compete with private and foreignbanks Government banks have realized competitive advantages and provided policyalternatives These two arguments help explain why BRIC countries have farecomparatively well in the face of financial crisis in core countries
Financial statecraft is therefore at the center of BRIC counter cyclical capacitiesand state planning Brazil Russia India and China fared significantly better thanadvanced and many developing countries in terms of adjusting to credit crunches and
export shocks This is because government banks proved critical interbank credit toretain confidence in domestic banking systems These institutions also presented other
8132019 Government Banking and BRICs in the Recent Financial Crisis
httpslidepdfcomreaderfullgovernment-banking-and-brics-in-the-recent-financial-crisis 5557
983106983122983113983107 983111983151983158983141983154983150983149983141983150983156 983106983137983150983147983155 983137983150983140 983110983145983150983137983150983139983145983137983148 983123983156983137983156983141983139983154983137983142983156
55
policy alternatives for political and social forces Politics shaped adjustment andrecovery through state banks differently in BRIC countries Given the realities of statecentered political realism in Russia the redirection of state banks toward goals ofChinese Five Year Plans and the modernization of the State Bank of India amidst anamorphous federalism the experience of Brazil with democratization and public bank
modernization may stand out (Armijo 2009)Further analysis of savings banks and cooperative banks also will be requiredAs members of the World Savings Bank Institute (a global association of savingsbanks) the Caixa in Brazil SNI and NABARD in India and China Postal Savings Bankappear to have provided access to very large numbers of previously unbanked citizensThis returns to traditional ideas of social banking and the history of savings banks thatwere founded throughout Europe since the late 18 th century The upmarket strategy andexpansion into investment banking and international banking of the Russian Sberbankconstrasts with downmarket strategies of savings banks in Brazil India and China
The financial press has recently reported doubts about bad loans in Chinese statebanks and cast doubt on the financial results posted and reported in this paper
However current estimates of 2-5 percent bad loans in Chinese state banks pale incomparison to the US$1240 billion in bad loans shifted to asset managementcompanies in the mid 2000s before capitalization of these institutions through sale ofshares Critics of state banking in Brazil also point to past levels of bad loans (reaching30-40 percent) because of their capture during military government delayed transitionBut the cost of capitalization and transfer of bad loans from Brazilian state banks alsoremained below US$400 billion and is still contingent on liquidation of assetmanagement companies created in 2001 In any case these numbers are very smallcompared to GAO estimates of US$120 trillion in emergency infusions by USmonetary authorities to banks and financial institutions from 2007-11
These are anomalies for recent market-based banking theory and neo-liberalpolicy designs However they do not run counter to orthodoxy in economics andbanking theory Over the last decades economic reforms (fiscal financial monetaryand banking) have improved transparency and brought public policy and marketexpectations closer However expectations about deregulation and free marketequilibria in banking and finance have succumbed in the face of panic and the stillsobering consequences of crisis The materials presented herein are descriptive and willrequire more careful analysis However given the urgency of searching for alternativedevelopment models and different approaches to financial statecraft in BRIC countriesand beyond we have taken the liberty to present research in initial stages and toprovoke thought along the lines suggested by our kind conveners
8132019 Government Banking and BRICs in the Recent Financial Crisis
httpslidepdfcomreaderfullgovernment-banking-and-brics-in-the-recent-financial-crisis 5657
983106983122983113983107 983111983151983158983141983154983150983149983141983150983156 983106983137983150983147983155 983137983150983140 983110983145983150983137983150983139983145983137983148 983123983156983137983156983141983139983154983137983142983156
56
Appendix on Alternative Banking and Social Inclusion
This appendix describes how ideas about government banking led to further work onalternative banking and social inclusion with help from the Rockefeller FoundationBellagio Center In July 2011 we were able to convene a conference designed to gather
scholars alternative banking executives and representatives from savings andcooperative bank associations to rethink strategies for social inclusion in the globalsouth and attempt to launch a new policy agenda Given the search for alternativestrategies to counter crisis and the advances of stabilization transparency and bankingsupervision in developing and emerging economies we call for alternative bankingcommunities in the global north and south to work together and help shape a new policyagenda for social inclusion Because savings banks credit cooperatives and otheralternative banking and finance institutions have realized competitive advantages andemerged from crisis we can now think beyond We believe that new policies may helpdeveloping and emerging nations redirect large domestic institutions such as postal andsavings banks toward meeting the UN millennium goals to eliminate poverty by 2015
Plans include writing a green paper on Core Principles for Alternative Bankingand Social Inclusion convening events to promote these principles through institutionalsupporters and networks and seeking adoption of these principles at policy venues suchas the World Savings Bank Institute the International Association of CooperativeBanks the Bank for International Settlements the International Financial ReportingStandards foundation the ISO International Standards Organization the Charter forResponsible Business regional development banks and the World Bank We also planto submit an edited volume of scholarly contributions on alternative banking and socialinclusion by year-end 2012 Interested parties are welcome to participate
Institutional supporters and networks include
Institutional SupportersColumbia University School of International and Public Affairs New YorkInstitute for Money Technology and Financial Inclusion University of CaliforniaIrvineKingacutes College Department of Management LondonSatildeo Paulo Business School Getulio Vargas FoundationSecond University of Naples
Networks
Association of Emerging Market Business Schools Satildeo Paulo BrazilCommunity of European Management Schools BrusselsCritical Political Economy NetworkEuropean Association of Co-operative Banks BrusselsGlobal Public Policy Network LondonInternational Cooperative Banking Association BrusselsSocial Science Finance Network AmsterdamSociety for Advancement of Social Economics PhiladelphiaWorld Savings Bank Institute Brussels
8132019 Government Banking and BRICs in the Recent Financial Crisis
httpslidepdfcomreaderfullgovernment-banking-and-brics-in-the-recent-financial-crisis 5757
983106983122983113983107 983111983151983158983141983154983150983149983141983150983156 983106983137983150983147983155 983137983150983140 983110983145983150983137983150983139983145983137983148 983123983156983137983156983141983139983154983137983142983156
Core Principles for Alternative Banking and Social Inclusion
Commitment to End Capital StarvationPromote access to and use of banking and financial services by all through newtechnologies and distribution channels to capitalize assets among the poor
Commitment to Universalize Income Savings Credit and FinanceProvide basic income via ATM cards and mobile banking to reach the poor and opennew channels of access to income savings credit finance insurance and opportunities
Prudent Banking and Regulatory ComplianceAlternative banking seeks to work within regulations guidelines and best practicesrecommended by domestic monetary authorities and international regulatory institutionssuch as the Bank for International Settlement Basel II Capital Risk Guidelines
Corporate Social Responsibility Leadership
Integrate corporate social responsibility into down-market business strategies andinstitutions of representation and democratization
Transparency and AccountabilityPublish annual reports and balance sheets in accord with international best practices offinancial social and sustainability reporting
Leadership in Provision of New Banking Services and Products to the PoorUse competitive advantages in banking and institutional networks to channel moreeffectively capital income and finance to the poor
Generate Sustainable Income and Household Asset AccumulationUse branch offices and new banking technologies to accelerate progress toward UNmillennium goals to eliminate poverty
Universalize Financial EducationPromote financial education to encourage responsible banking and finance and avertpredatory lending and unethical practices
Adopt Cutting Edge Technology and Management Practices to Provide
Competitive Alternative to Private Commercial and Investment Banks
Incorporate electronic card and mobile banking services to better serve the poorContribute to Realization of Bellagio Principles for SustainabilityPromote alternative banking and business practices that contribute to environmentallysustainable income consumption and production as stated in Bellagio Principles forSustainability
Respect and Build on National and Regional DifferencesI d f i l d l l i b ki i i i d i i l
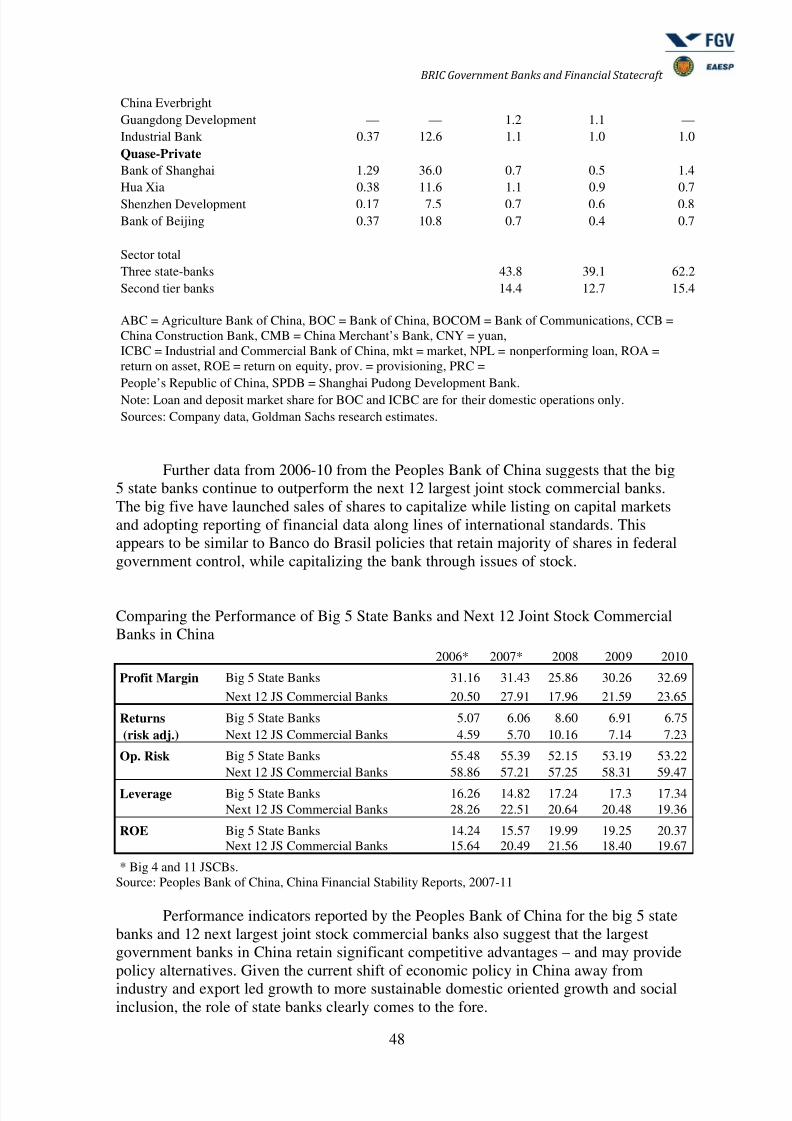
8132019 Government Banking and BRICs in the Recent Financial Crisis
httpslidepdfcomreaderfullgovernment-banking-and-brics-in-the-recent-financial-crisis 5257
983106983122983113983107 983111983151983158983141983154983150983149983141983150983156 983106983137983150983147983155 983137983150983140 983110983145983150983137983150983139983145983137983148 983123983156983137983156983141983139983154983137983142983156
52
The following aggregate figures reported by the Bank of Russia suggest severaltrends of significance First Chart 32 suggests that household deposits shifted fromRuble deposits to foreign currency pegged (or indexed) during 2008 Second Chart 33illustrates the substantial increase of non-bank overdue debt during second semester
2008
Consequently the financial results and profitability of banks declinedsignificantly during 2008 The greater confidence in deposits with government banksfound abroad suggests that this may have been critical in Russia
Performance data deom 2008-10 provides a clearer picture one that is consistentwith our findings in Brazil State banks appear to have outperformed all other types of
banks except medium and small regional banks The following table reports the averagereturns on assets and returns on equity reported by the Bank of Russia 2008-10
Returns on Assets and Equity by Type of Bank in Russia 2008-9
Return on assets Return on equity 2008 2009 2010 2008 2009 2010
-------------------------------------------------------------------------------------------------------------------State Banks 22 08 24 157 46 148Foreign Banks 18 11 21 146 83 145Large private banks 13 03 11 106 28 84Medium-Small Banks Moscow 15 12 14 68 52 67
Medium-Small Regional Banks 21 12 15 131 65 98--------------------------------------------------------------------------------------------------------------------Source Bank of Russia Bank Supervision Reports 2009 and 2010
8132019 Government Banking and BRICs in the Recent Financial Crisis
httpslidepdfcomreaderfullgovernment-banking-and-brics-in-the-recent-financial-crisis 5357
983106983122983113983107 983111983151983158983141983154983150983149983141983150983156 983106983137983150983147983155 983137983150983140 983110983145983150983137983150983139983145983137983148 983123983156983137983156983141983139983154983137983142983156
53
Further data from the Bank of Russia on the capital adequacy of Banks during2009-10 suggest that foreign banks and large private banks remain less capitalizedagainst risks according to Basel II guidelines albeit at levels almost double thatrecommended by the Bank for International Settlements (80 risk weighted) Although
further analysis is needed this data is consistent from that reported in Brazil thatgovernment banks tend to more cautious and more prudent in terms of placing asidehigher levels of reserves and patrimony against possible losses
Capital Adequacy of Banks by Type of Bank in Russia 2009-10
2009 2010 2011---------------------------------------------------------------------------------------------------------State Banks 184 227 186Foreign Banks 155 196 195Large Private Banks 140 181 155
Medium-Small Banks Moscow 316 312 268Medium-Small Regional Banks 219 241 207Non-Bank Credit Institutions 372 1038 678---------------------------------------------------------------------------------------------------------Source Bank of Russia Bank Supervision Report (Moscow) 2009 p 43
Finally Bank of Russia bank supervision reports also suggest that state banksexpanded their market shares of assets and capital during the years following the globalfinancial crisis While large private banks and foreign banks lost market share of bankassets and bank capital in Russia state banks increased their significant market sharefrom 405 ndash 426 percent and 471-476 percent of assets and capital respectivelyUnfortunately data from previous years and for specific banking groups was notobtained However this data does appear to indicate that our findings of competitiveadvantages and policy alternatives
Number and Market Share by Type of Bank
N Banks Assets Capital---------------------------- ---------------------------- ----------------------------
Type of Bank 2009 2010 2011 2009 2010 2011 2009 2010 2011-------------------------------------------------------------------------------------------------------------------------------State 17 22 27 405 439 458 471 489 473
Foreign 101 106 108 187 183 180 172 169 191Large Private 136 139 131 346 333 305 276 287 269Med-Small Moscow 361 335 317 27 26 26 43 34 35Medi-Small Regional 443 412 372 28 28 27 36 31 29Other Credit Institutions 50 51 57 07 04 04 01 02 03Total 1108 1058 100 100 100 100 100 100-------------------------------------------------------------------------------------------------------------------------------Source Bank of Russia Bank Supervision Report 2009 amp 2010
In sum politics and financial statecraft have led to the realization of significantcompetitive advantage by Russian state banks Sperbank and Vneshtorgbank increasedtheir share of bank assets from 32 percent in 2005 to over 50 percent by 2011 through
mergers and acquisitions and aggressive displacement of foreign banks Whatever thepolitics data from the Bank of Russia suggests that monetary authorities released a
8132019 Government Banking and BRICs in the Recent Financial Crisis
httpslidepdfcomreaderfullgovernment-banking-and-brics-in-the-recent-financial-crisis 5457
983106983122983113983107 983111983151983158983141983154983150983149983141983150983156 983106983137983150983147983155 983137983150983140 983110983145983150983137983150983139983145983137983148 983123983156983137983156983141983139983154983137983142983156
54
series of counter cyclical credit injections during 2008-9 to domestic bankinginstitutions Moreover data suggests that state banks continue to perform at or ahead oflevels reported by regional private and foreign banks The large market share andimproved performance of state banks reported in recent data suggests although the datais sparse that government banks in Russia have also modernized realized competitive
advantages and provided policy alternatives against the impact of financial crisisabroadWe were unable to find evidence of policy making toward social inclusion at the
Bank of Russia or Russian state banks despite the historical trajectory of the Sberbankas a savings bank under communism The context also appears to differ considerably Asurvey of the Zircon Research Group reportedly found that only 15 percent of Russiansretain bank accounts because of mistrust in banks and government This combination ofrealist politics and the realization of competitive advantages by Russian state bankssuggests that theories of economic statecraft in the realist tradition may indeed explainthe domestic developments under study
Conclusion
This paper reports evidence about government bank modernization and financialstatecraft in BRIC countries designed to counter the effects of crisis and shape domesticgrowth Government banks in BRIC countries have contributed to the widely notedadjustment of these economies to global financial crisis and economic downturnContrary to the Washington Consensus that prevailed during much of the 1980s and1990s (that privatization and liberalization especially of banking would free marketforces and deepen domestic financial systems) a quite different process of bank changeappears to have ensued after financial liberalization in the BRICs
Instead of replacement of state banks with private banks government banksremain central agents of domestic credit and growth and have modernized ldquojust intimerdquo The capitalization and realization of competitive advantages by large governmentbanks during the 2000s meant that once the US financial panic spread across capitalmarkets broke highly leveraged private and produced runs on private bank depositspolicy makers in BRIC countries nonetheless retained counter cyclical policyalternatives through their more solid large state banks
These findings counter traditional foci on the private sector individualentrepreneurship and ideals of free markets linked to the political and social advancesrecorded around the world in the last decades We report an anomaly for theories offinancial repression and the Washington Consensus about the virtues of privatization
and liberalization Although largely blamed for reproducing underdevelopment in thepast BRIC government banks averted excesses of private banking that drove creditbubbles such as home mortgages and derivatives in the US And since liberalization ofbanking (we have not adequately discussed how much liberalization occurred in eachcountry) government banks have modernized to compete with private and foreignbanks Government banks have realized competitive advantages and provided policyalternatives These two arguments help explain why BRIC countries have farecomparatively well in the face of financial crisis in core countries
Financial statecraft is therefore at the center of BRIC counter cyclical capacitiesand state planning Brazil Russia India and China fared significantly better thanadvanced and many developing countries in terms of adjusting to credit crunches and
export shocks This is because government banks proved critical interbank credit toretain confidence in domestic banking systems These institutions also presented other
8132019 Government Banking and BRICs in the Recent Financial Crisis
httpslidepdfcomreaderfullgovernment-banking-and-brics-in-the-recent-financial-crisis 5557
983106983122983113983107 983111983151983158983141983154983150983149983141983150983156 983106983137983150983147983155 983137983150983140 983110983145983150983137983150983139983145983137983148 983123983156983137983156983141983139983154983137983142983156
55
policy alternatives for political and social forces Politics shaped adjustment andrecovery through state banks differently in BRIC countries Given the realities of statecentered political realism in Russia the redirection of state banks toward goals ofChinese Five Year Plans and the modernization of the State Bank of India amidst anamorphous federalism the experience of Brazil with democratization and public bank
modernization may stand out (Armijo 2009)Further analysis of savings banks and cooperative banks also will be requiredAs members of the World Savings Bank Institute (a global association of savingsbanks) the Caixa in Brazil SNI and NABARD in India and China Postal Savings Bankappear to have provided access to very large numbers of previously unbanked citizensThis returns to traditional ideas of social banking and the history of savings banks thatwere founded throughout Europe since the late 18 th century The upmarket strategy andexpansion into investment banking and international banking of the Russian Sberbankconstrasts with downmarket strategies of savings banks in Brazil India and China
The financial press has recently reported doubts about bad loans in Chinese statebanks and cast doubt on the financial results posted and reported in this paper
However current estimates of 2-5 percent bad loans in Chinese state banks pale incomparison to the US$1240 billion in bad loans shifted to asset managementcompanies in the mid 2000s before capitalization of these institutions through sale ofshares Critics of state banking in Brazil also point to past levels of bad loans (reaching30-40 percent) because of their capture during military government delayed transitionBut the cost of capitalization and transfer of bad loans from Brazilian state banks alsoremained below US$400 billion and is still contingent on liquidation of assetmanagement companies created in 2001 In any case these numbers are very smallcompared to GAO estimates of US$120 trillion in emergency infusions by USmonetary authorities to banks and financial institutions from 2007-11
These are anomalies for recent market-based banking theory and neo-liberalpolicy designs However they do not run counter to orthodoxy in economics andbanking theory Over the last decades economic reforms (fiscal financial monetaryand banking) have improved transparency and brought public policy and marketexpectations closer However expectations about deregulation and free marketequilibria in banking and finance have succumbed in the face of panic and the stillsobering consequences of crisis The materials presented herein are descriptive and willrequire more careful analysis However given the urgency of searching for alternativedevelopment models and different approaches to financial statecraft in BRIC countriesand beyond we have taken the liberty to present research in initial stages and toprovoke thought along the lines suggested by our kind conveners
8132019 Government Banking and BRICs in the Recent Financial Crisis
httpslidepdfcomreaderfullgovernment-banking-and-brics-in-the-recent-financial-crisis 5657
983106983122983113983107 983111983151983158983141983154983150983149983141983150983156 983106983137983150983147983155 983137983150983140 983110983145983150983137983150983139983145983137983148 983123983156983137983156983141983139983154983137983142983156
56
Appendix on Alternative Banking and Social Inclusion
This appendix describes how ideas about government banking led to further work onalternative banking and social inclusion with help from the Rockefeller FoundationBellagio Center In July 2011 we were able to convene a conference designed to gather
scholars alternative banking executives and representatives from savings andcooperative bank associations to rethink strategies for social inclusion in the globalsouth and attempt to launch a new policy agenda Given the search for alternativestrategies to counter crisis and the advances of stabilization transparency and bankingsupervision in developing and emerging economies we call for alternative bankingcommunities in the global north and south to work together and help shape a new policyagenda for social inclusion Because savings banks credit cooperatives and otheralternative banking and finance institutions have realized competitive advantages andemerged from crisis we can now think beyond We believe that new policies may helpdeveloping and emerging nations redirect large domestic institutions such as postal andsavings banks toward meeting the UN millennium goals to eliminate poverty by 2015
Plans include writing a green paper on Core Principles for Alternative Bankingand Social Inclusion convening events to promote these principles through institutionalsupporters and networks and seeking adoption of these principles at policy venues suchas the World Savings Bank Institute the International Association of CooperativeBanks the Bank for International Settlements the International Financial ReportingStandards foundation the ISO International Standards Organization the Charter forResponsible Business regional development banks and the World Bank We also planto submit an edited volume of scholarly contributions on alternative banking and socialinclusion by year-end 2012 Interested parties are welcome to participate
Institutional supporters and networks include
Institutional SupportersColumbia University School of International and Public Affairs New YorkInstitute for Money Technology and Financial Inclusion University of CaliforniaIrvineKingacutes College Department of Management LondonSatildeo Paulo Business School Getulio Vargas FoundationSecond University of Naples
Networks
Association of Emerging Market Business Schools Satildeo Paulo BrazilCommunity of European Management Schools BrusselsCritical Political Economy NetworkEuropean Association of Co-operative Banks BrusselsGlobal Public Policy Network LondonInternational Cooperative Banking Association BrusselsSocial Science Finance Network AmsterdamSociety for Advancement of Social Economics PhiladelphiaWorld Savings Bank Institute Brussels
8132019 Government Banking and BRICs in the Recent Financial Crisis
httpslidepdfcomreaderfullgovernment-banking-and-brics-in-the-recent-financial-crisis 5757
983106983122983113983107 983111983151983158983141983154983150983149983141983150983156 983106983137983150983147983155 983137983150983140 983110983145983150983137983150983139983145983137983148 983123983156983137983156983141983139983154983137983142983156
Core Principles for Alternative Banking and Social Inclusion
Commitment to End Capital StarvationPromote access to and use of banking and financial services by all through newtechnologies and distribution channels to capitalize assets among the poor
Commitment to Universalize Income Savings Credit and FinanceProvide basic income via ATM cards and mobile banking to reach the poor and opennew channels of access to income savings credit finance insurance and opportunities
Prudent Banking and Regulatory ComplianceAlternative banking seeks to work within regulations guidelines and best practicesrecommended by domestic monetary authorities and international regulatory institutionssuch as the Bank for International Settlement Basel II Capital Risk Guidelines
Corporate Social Responsibility Leadership
Integrate corporate social responsibility into down-market business strategies andinstitutions of representation and democratization
Transparency and AccountabilityPublish annual reports and balance sheets in accord with international best practices offinancial social and sustainability reporting
Leadership in Provision of New Banking Services and Products to the PoorUse competitive advantages in banking and institutional networks to channel moreeffectively capital income and finance to the poor
Generate Sustainable Income and Household Asset AccumulationUse branch offices and new banking technologies to accelerate progress toward UNmillennium goals to eliminate poverty
Universalize Financial EducationPromote financial education to encourage responsible banking and finance and avertpredatory lending and unethical practices
Adopt Cutting Edge Technology and Management Practices to Provide
Competitive Alternative to Private Commercial and Investment Banks
Incorporate electronic card and mobile banking services to better serve the poorContribute to Realization of Bellagio Principles for SustainabilityPromote alternative banking and business practices that contribute to environmentallysustainable income consumption and production as stated in Bellagio Principles forSustainability
Respect and Build on National and Regional DifferencesI d f i l d l l i b ki i i i d i i l
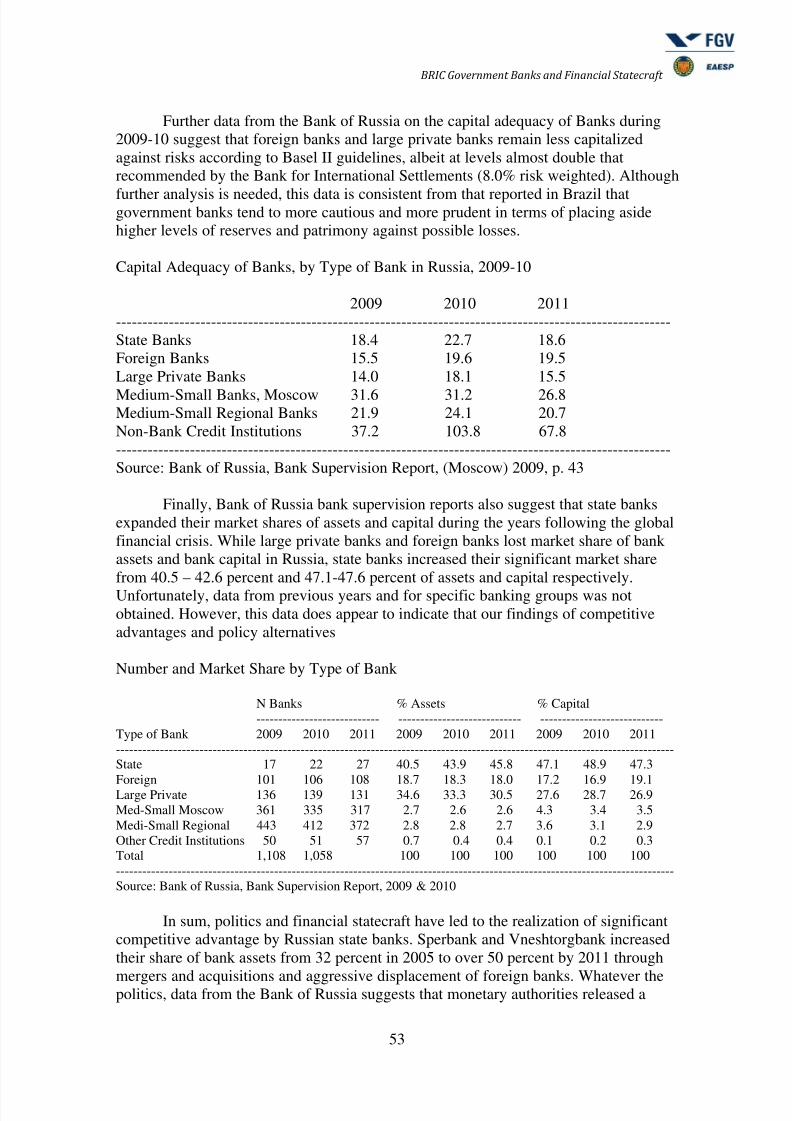
8132019 Government Banking and BRICs in the Recent Financial Crisis
httpslidepdfcomreaderfullgovernment-banking-and-brics-in-the-recent-financial-crisis 5357
983106983122983113983107 983111983151983158983141983154983150983149983141983150983156 983106983137983150983147983155 983137983150983140 983110983145983150983137983150983139983145983137983148 983123983156983137983156983141983139983154983137983142983156
53
Further data from the Bank of Russia on the capital adequacy of Banks during2009-10 suggest that foreign banks and large private banks remain less capitalizedagainst risks according to Basel II guidelines albeit at levels almost double thatrecommended by the Bank for International Settlements (80 risk weighted) Although
further analysis is needed this data is consistent from that reported in Brazil thatgovernment banks tend to more cautious and more prudent in terms of placing asidehigher levels of reserves and patrimony against possible losses
Capital Adequacy of Banks by Type of Bank in Russia 2009-10
2009 2010 2011---------------------------------------------------------------------------------------------------------State Banks 184 227 186Foreign Banks 155 196 195Large Private Banks 140 181 155
Medium-Small Banks Moscow 316 312 268Medium-Small Regional Banks 219 241 207Non-Bank Credit Institutions 372 1038 678---------------------------------------------------------------------------------------------------------Source Bank of Russia Bank Supervision Report (Moscow) 2009 p 43
Finally Bank of Russia bank supervision reports also suggest that state banksexpanded their market shares of assets and capital during the years following the globalfinancial crisis While large private banks and foreign banks lost market share of bankassets and bank capital in Russia state banks increased their significant market sharefrom 405 ndash 426 percent and 471-476 percent of assets and capital respectivelyUnfortunately data from previous years and for specific banking groups was notobtained However this data does appear to indicate that our findings of competitiveadvantages and policy alternatives
Number and Market Share by Type of Bank
N Banks Assets Capital---------------------------- ---------------------------- ----------------------------
Type of Bank 2009 2010 2011 2009 2010 2011 2009 2010 2011-------------------------------------------------------------------------------------------------------------------------------State 17 22 27 405 439 458 471 489 473
Foreign 101 106 108 187 183 180 172 169 191Large Private 136 139 131 346 333 305 276 287 269Med-Small Moscow 361 335 317 27 26 26 43 34 35Medi-Small Regional 443 412 372 28 28 27 36 31 29Other Credit Institutions 50 51 57 07 04 04 01 02 03Total 1108 1058 100 100 100 100 100 100-------------------------------------------------------------------------------------------------------------------------------Source Bank of Russia Bank Supervision Report 2009 amp 2010
In sum politics and financial statecraft have led to the realization of significantcompetitive advantage by Russian state banks Sperbank and Vneshtorgbank increasedtheir share of bank assets from 32 percent in 2005 to over 50 percent by 2011 through
mergers and acquisitions and aggressive displacement of foreign banks Whatever thepolitics data from the Bank of Russia suggests that monetary authorities released a
8132019 Government Banking and BRICs in the Recent Financial Crisis
httpslidepdfcomreaderfullgovernment-banking-and-brics-in-the-recent-financial-crisis 5457
983106983122983113983107 983111983151983158983141983154983150983149983141983150983156 983106983137983150983147983155 983137983150983140 983110983145983150983137983150983139983145983137983148 983123983156983137983156983141983139983154983137983142983156
54
series of counter cyclical credit injections during 2008-9 to domestic bankinginstitutions Moreover data suggests that state banks continue to perform at or ahead oflevels reported by regional private and foreign banks The large market share andimproved performance of state banks reported in recent data suggests although the datais sparse that government banks in Russia have also modernized realized competitive
advantages and provided policy alternatives against the impact of financial crisisabroadWe were unable to find evidence of policy making toward social inclusion at the
Bank of Russia or Russian state banks despite the historical trajectory of the Sberbankas a savings bank under communism The context also appears to differ considerably Asurvey of the Zircon Research Group reportedly found that only 15 percent of Russiansretain bank accounts because of mistrust in banks and government This combination ofrealist politics and the realization of competitive advantages by Russian state bankssuggests that theories of economic statecraft in the realist tradition may indeed explainthe domestic developments under study
Conclusion
This paper reports evidence about government bank modernization and financialstatecraft in BRIC countries designed to counter the effects of crisis and shape domesticgrowth Government banks in BRIC countries have contributed to the widely notedadjustment of these economies to global financial crisis and economic downturnContrary to the Washington Consensus that prevailed during much of the 1980s and1990s (that privatization and liberalization especially of banking would free marketforces and deepen domestic financial systems) a quite different process of bank changeappears to have ensued after financial liberalization in the BRICs
Instead of replacement of state banks with private banks government banksremain central agents of domestic credit and growth and have modernized ldquojust intimerdquo The capitalization and realization of competitive advantages by large governmentbanks during the 2000s meant that once the US financial panic spread across capitalmarkets broke highly leveraged private and produced runs on private bank depositspolicy makers in BRIC countries nonetheless retained counter cyclical policyalternatives through their more solid large state banks
These findings counter traditional foci on the private sector individualentrepreneurship and ideals of free markets linked to the political and social advancesrecorded around the world in the last decades We report an anomaly for theories offinancial repression and the Washington Consensus about the virtues of privatization
and liberalization Although largely blamed for reproducing underdevelopment in thepast BRIC government banks averted excesses of private banking that drove creditbubbles such as home mortgages and derivatives in the US And since liberalization ofbanking (we have not adequately discussed how much liberalization occurred in eachcountry) government banks have modernized to compete with private and foreignbanks Government banks have realized competitive advantages and provided policyalternatives These two arguments help explain why BRIC countries have farecomparatively well in the face of financial crisis in core countries
Financial statecraft is therefore at the center of BRIC counter cyclical capacitiesand state planning Brazil Russia India and China fared significantly better thanadvanced and many developing countries in terms of adjusting to credit crunches and
export shocks This is because government banks proved critical interbank credit toretain confidence in domestic banking systems These institutions also presented other
8132019 Government Banking and BRICs in the Recent Financial Crisis
httpslidepdfcomreaderfullgovernment-banking-and-brics-in-the-recent-financial-crisis 5557
983106983122983113983107 983111983151983158983141983154983150983149983141983150983156 983106983137983150983147983155 983137983150983140 983110983145983150983137983150983139983145983137983148 983123983156983137983156983141983139983154983137983142983156
55
policy alternatives for political and social forces Politics shaped adjustment andrecovery through state banks differently in BRIC countries Given the realities of statecentered political realism in Russia the redirection of state banks toward goals ofChinese Five Year Plans and the modernization of the State Bank of India amidst anamorphous federalism the experience of Brazil with democratization and public bank
modernization may stand out (Armijo 2009)Further analysis of savings banks and cooperative banks also will be requiredAs members of the World Savings Bank Institute (a global association of savingsbanks) the Caixa in Brazil SNI and NABARD in India and China Postal Savings Bankappear to have provided access to very large numbers of previously unbanked citizensThis returns to traditional ideas of social banking and the history of savings banks thatwere founded throughout Europe since the late 18 th century The upmarket strategy andexpansion into investment banking and international banking of the Russian Sberbankconstrasts with downmarket strategies of savings banks in Brazil India and China
The financial press has recently reported doubts about bad loans in Chinese statebanks and cast doubt on the financial results posted and reported in this paper
However current estimates of 2-5 percent bad loans in Chinese state banks pale incomparison to the US$1240 billion in bad loans shifted to asset managementcompanies in the mid 2000s before capitalization of these institutions through sale ofshares Critics of state banking in Brazil also point to past levels of bad loans (reaching30-40 percent) because of their capture during military government delayed transitionBut the cost of capitalization and transfer of bad loans from Brazilian state banks alsoremained below US$400 billion and is still contingent on liquidation of assetmanagement companies created in 2001 In any case these numbers are very smallcompared to GAO estimates of US$120 trillion in emergency infusions by USmonetary authorities to banks and financial institutions from 2007-11
These are anomalies for recent market-based banking theory and neo-liberalpolicy designs However they do not run counter to orthodoxy in economics andbanking theory Over the last decades economic reforms (fiscal financial monetaryand banking) have improved transparency and brought public policy and marketexpectations closer However expectations about deregulation and free marketequilibria in banking and finance have succumbed in the face of panic and the stillsobering consequences of crisis The materials presented herein are descriptive and willrequire more careful analysis However given the urgency of searching for alternativedevelopment models and different approaches to financial statecraft in BRIC countriesand beyond we have taken the liberty to present research in initial stages and toprovoke thought along the lines suggested by our kind conveners
8132019 Government Banking and BRICs in the Recent Financial Crisis
httpslidepdfcomreaderfullgovernment-banking-and-brics-in-the-recent-financial-crisis 5657
983106983122983113983107 983111983151983158983141983154983150983149983141983150983156 983106983137983150983147983155 983137983150983140 983110983145983150983137983150983139983145983137983148 983123983156983137983156983141983139983154983137983142983156
56
Appendix on Alternative Banking and Social Inclusion
This appendix describes how ideas about government banking led to further work onalternative banking and social inclusion with help from the Rockefeller FoundationBellagio Center In July 2011 we were able to convene a conference designed to gather
scholars alternative banking executives and representatives from savings andcooperative bank associations to rethink strategies for social inclusion in the globalsouth and attempt to launch a new policy agenda Given the search for alternativestrategies to counter crisis and the advances of stabilization transparency and bankingsupervision in developing and emerging economies we call for alternative bankingcommunities in the global north and south to work together and help shape a new policyagenda for social inclusion Because savings banks credit cooperatives and otheralternative banking and finance institutions have realized competitive advantages andemerged from crisis we can now think beyond We believe that new policies may helpdeveloping and emerging nations redirect large domestic institutions such as postal andsavings banks toward meeting the UN millennium goals to eliminate poverty by 2015
Plans include writing a green paper on Core Principles for Alternative Bankingand Social Inclusion convening events to promote these principles through institutionalsupporters and networks and seeking adoption of these principles at policy venues suchas the World Savings Bank Institute the International Association of CooperativeBanks the Bank for International Settlements the International Financial ReportingStandards foundation the ISO International Standards Organization the Charter forResponsible Business regional development banks and the World Bank We also planto submit an edited volume of scholarly contributions on alternative banking and socialinclusion by year-end 2012 Interested parties are welcome to participate
Institutional supporters and networks include
Institutional SupportersColumbia University School of International and Public Affairs New YorkInstitute for Money Technology and Financial Inclusion University of CaliforniaIrvineKingacutes College Department of Management LondonSatildeo Paulo Business School Getulio Vargas FoundationSecond University of Naples
Networks
Association of Emerging Market Business Schools Satildeo Paulo BrazilCommunity of European Management Schools BrusselsCritical Political Economy NetworkEuropean Association of Co-operative Banks BrusselsGlobal Public Policy Network LondonInternational Cooperative Banking Association BrusselsSocial Science Finance Network AmsterdamSociety for Advancement of Social Economics PhiladelphiaWorld Savings Bank Institute Brussels
8132019 Government Banking and BRICs in the Recent Financial Crisis
httpslidepdfcomreaderfullgovernment-banking-and-brics-in-the-recent-financial-crisis 5757
983106983122983113983107 983111983151983158983141983154983150983149983141983150983156 983106983137983150983147983155 983137983150983140 983110983145983150983137983150983139983145983137983148 983123983156983137983156983141983139983154983137983142983156
Core Principles for Alternative Banking and Social Inclusion
Commitment to End Capital StarvationPromote access to and use of banking and financial services by all through newtechnologies and distribution channels to capitalize assets among the poor
Commitment to Universalize Income Savings Credit and FinanceProvide basic income via ATM cards and mobile banking to reach the poor and opennew channels of access to income savings credit finance insurance and opportunities
Prudent Banking and Regulatory ComplianceAlternative banking seeks to work within regulations guidelines and best practicesrecommended by domestic monetary authorities and international regulatory institutionssuch as the Bank for International Settlement Basel II Capital Risk Guidelines
Corporate Social Responsibility Leadership
Integrate corporate social responsibility into down-market business strategies andinstitutions of representation and democratization
Transparency and AccountabilityPublish annual reports and balance sheets in accord with international best practices offinancial social and sustainability reporting
Leadership in Provision of New Banking Services and Products to the PoorUse competitive advantages in banking and institutional networks to channel moreeffectively capital income and finance to the poor
Generate Sustainable Income and Household Asset AccumulationUse branch offices and new banking technologies to accelerate progress toward UNmillennium goals to eliminate poverty
Universalize Financial EducationPromote financial education to encourage responsible banking and finance and avertpredatory lending and unethical practices
Adopt Cutting Edge Technology and Management Practices to Provide
Competitive Alternative to Private Commercial and Investment Banks
Incorporate electronic card and mobile banking services to better serve the poorContribute to Realization of Bellagio Principles for SustainabilityPromote alternative banking and business practices that contribute to environmentallysustainable income consumption and production as stated in Bellagio Principles forSustainability
Respect and Build on National and Regional DifferencesI d f i l d l l i b ki i i i d i i l
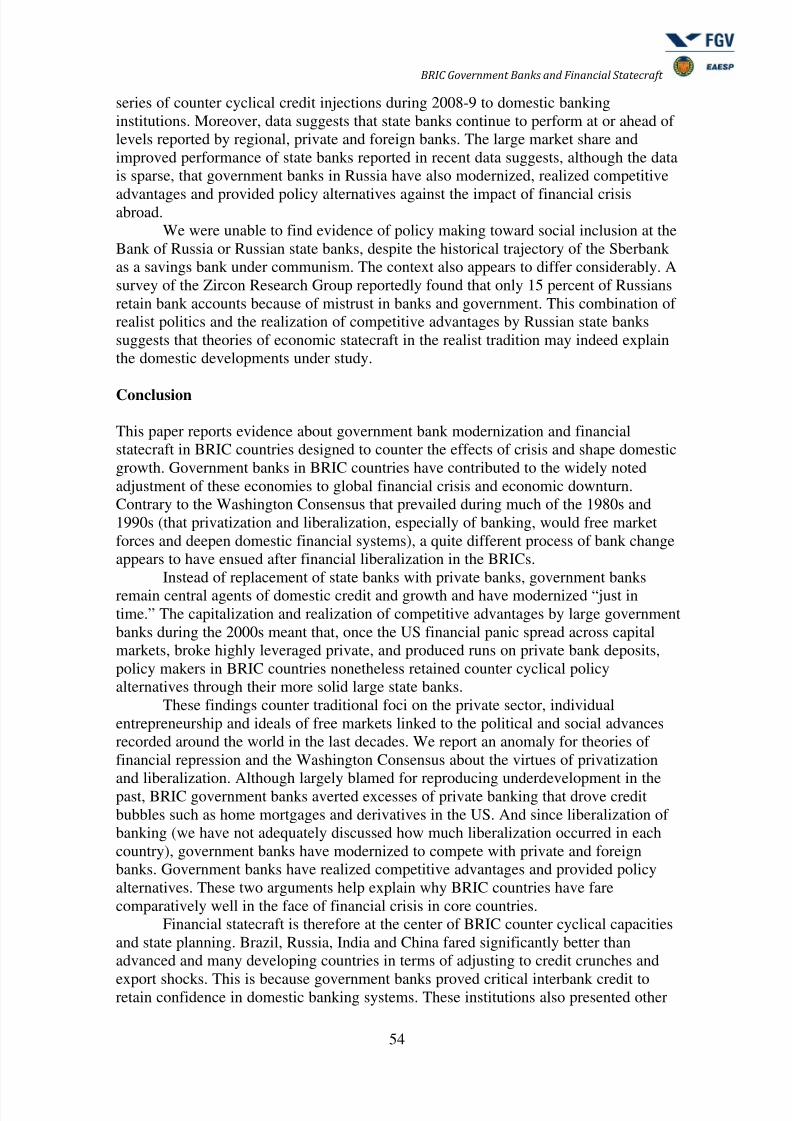
8132019 Government Banking and BRICs in the Recent Financial Crisis
httpslidepdfcomreaderfullgovernment-banking-and-brics-in-the-recent-financial-crisis 5757
983106983122983113983107 983111983151983158983141983154983150983149983141983150983156 983106983137983150983147983155 983137983150983140 983110983145983150983137983150983139983145983137983148 983123983156983137983156983141983139983154983137983142983156
Core Principles for Alternative Banking and Social Inclusion
Commitment to End Capital StarvationPromote access to and use of banking and financial services by all through newtechnologies and distribution channels to capitalize assets among the poor
Commitment to Universalize Income Savings Credit and FinanceProvide basic income via ATM cards and mobile banking to reach the poor and opennew channels of access to income savings credit finance insurance and opportunities
Prudent Banking and Regulatory ComplianceAlternative banking seeks to work within regulations guidelines and best practicesrecommended by domestic monetary authorities and international regulatory institutionssuch as the Bank for International Settlement Basel II Capital Risk Guidelines
Corporate Social Responsibility Leadership
Integrate corporate social responsibility into down-market business strategies andinstitutions of representation and democratization
Transparency and AccountabilityPublish annual reports and balance sheets in accord with international best practices offinancial social and sustainability reporting
Leadership in Provision of New Banking Services and Products to the PoorUse competitive advantages in banking and institutional networks to channel moreeffectively capital income and finance to the poor
Generate Sustainable Income and Household Asset AccumulationUse branch offices and new banking technologies to accelerate progress toward UNmillennium goals to eliminate poverty
Universalize Financial EducationPromote financial education to encourage responsible banking and finance and avertpredatory lending and unethical practices
Adopt Cutting Edge Technology and Management Practices to Provide
Competitive Alternative to Private Commercial and Investment Banks
Incorporate electronic card and mobile banking services to better serve the poorContribute to Realization of Bellagio Principles for SustainabilityPromote alternative banking and business practices that contribute to environmentallysustainable income consumption and production as stated in Bellagio Principles forSustainability
Respect and Build on National and Regional DifferencesI d f i l d l l i b ki i i i d i i l