Government as Borrower and Innovator of Last Resort · Government as Borrower and Innovator of Last...
37
1 Government as Borrower and Innovator of Last Resort Richard C. Koo Nomura Research Institute January 28, 2016 The advent of the Great Recession in 2008 demonstrated that the existence of borrowers cannot be taken for granted when the bursting of a debt-financed bubble leaves the balance sheets of a large section of the private sector underwater. History also shows that a lack of borrowers has traditionally been a bigger constraint on growth than a lack of lenders except during the early stages of industrialization. When there are no borrowers—whether because of balance sheet problems or a lack of worthwhile investment opportunities—the government may have to act as borrower of last resort and possibly even as innovator of last resort. Keynes’ “paradox of thrift” was the pre-industrial norm When macroeconomics was developing into an independent academic discipline starting in the 1940s, investment opportunities for businesses were plentiful as new “must-have” household appliances, ranging from washing machines to televisions, made their appearance. With plentiful demand for funds from the private sector, economists’ emphasis was very much on monetary policy and the concern that fiscal policy would crowd out private investment. The advent of Great Recessions in Japan in 1990 and in the West in 2008 demonstrated that when the broader private sector confronts daunting balance sheet problems following the bursting of a debt-financed bubble, it may not borrow money at any interest rate. As the value of assets purchased during the bubble with leveraged funds collapses, many borrowers fall into negative equity, forcing them to give up profit maximization for debt minimization as they put their financial houses in order. For businesses, negative equity or insolvency means potential loss of access to all forms of financing, including trade credits. In the worst case, that
Transcript of Government as Borrower and Innovator of Last Resort · Government as Borrower and Innovator of Last...

1
Government as Borrower and Innovator of Last Resort
Richard C. Koo
Nomura Research Institute
January 28, 2016
The advent of the Great Recession in 2008 demonstrated that the existence
of borrowers cannot be taken for granted when the bursting of a
debt-financed bubble leaves the balance sheets of a large section of the
private sector underwater. History also shows that a lack of borrowers has
traditionally been a bigger constraint on growth than a lack of lenders except
during the early stages of industrialization. When there are no
borrowers—whether because of balance sheet problems or a lack of
worthwhile investment opportunities—the government may have to act as
borrower of last resort and possibly even as innovator of last resort.
Keynes’ “paradox of thrift” was the pre-industrial norm
When macroeconomics was developing into an independent academic
discipline starting in the 1940s, investment opportunities for businesses
were plentiful as new “must-have” household appliances, ranging from
washing machines to televisions, made their appearance. With plentiful
demand for funds from the private sector, economists’ emphasis was very
much on monetary policy and the concern that fiscal policy would crowd out
private investment.
The advent of Great Recessions in Japan in 1990 and in the West in 2008
demonstrated that when the broader private sector confronts daunting
balance sheet problems following the bursting of a debt-financed bubble, it
may not borrow money at any interest rate. As the value of assets
purchased during the bubble with leveraged funds collapses, many
borrowers fall into negative equity, forcing them to give up profit
maximization for debt minimization as they put their financial houses in
order.
For businesses, negative equity or insolvency means potential loss of access
to all forms of financing, including trade credits. In the worst case, that

2
means everything will have to be settled with cash. Many financial
institutions such as banks are also prohibited from rolling over loans to
insolvent borrowers. For households, negative equity means savings they
thought they had for retirement or rainy days in the future are all gone.
Since these are very dangerous conditions to be in for both businesses and
households, they will put their highest priority on deleveraging regardless of
the level of interest rates until they feel safe enough with their financial
health.
Such debt minimization is the right and responsible thing to do at the level of
individual businesses and households. But when the private sector in
aggregate stops borrowing money despite zero interest rates, the economy
falls into a deflationary spiral because those saved funds with no borrowers
leak out of the economy’s income stream and become a deflationary gap.
This is because when someone is saving or paying down debt, someone else
must be borrowing and spending those funds to keep the national economy
going.
For example, if a person with an income of $1,000 decides to spend $900 and
save $100, the $900 that is spent becomes someone else’s income, which
means it is already circulating in the economy. The $100 that was saved
would usually be deposited with a bank or other financial institution to be
lent to someone else. When that person borrows and spends the $100, total
expenditures in the economy equal $900 plus $100, which is the same as the
original income of $1,000, and the economy moves forward.
During this process, it is assumed that the financial sector will make sure all
saved funds are borrowed and spent, with interest rates rising when there
are too many borrowers relative to savers and falling when there are too few.
This assumption of automaticity has enabled economists to ignore the
financial sector when creating their macroeconomic theories and models.
But if society collectively tries to save $100, or 10 percent of its income,
because it cannot find sufficient investment opportunities or has chosen to
repair its balance sheet, there will be no borrowers for the saved $100, and
total expenditures will drop to $900, which means the economy has
3
contracted 10 percent. That $900 is now someone else’s income. If that
person decides to save 10 percent while the rest of the society is still
repairing balance sheets, only $810 will be spent, shrinking the economy
even further in a process now known as a balance sheet recession. This
contractionary process will continue until people have finished repairing
their balance sheets or have become so poor that they cannot save any more,
in which case the income stream leakage from savings will end.
Keynes called this state of affairs, in which everyone wants to save but is
unable to do so because no one is borrowing, the paradox of thrift. Until 2008,
the economics profession considered this kind of contractionary equilibrium,
which is often called a depression, to be an exceptionally rare
occurrence—the only recent example was the Great Depression in the 1930s,
when the US lost 46 percent of its nominal GNP due to the process described
above. Although Japan fell into a serious balance sheet recession when its
bubble burst in 1990, its lessons were almost completely ignored by the
economics profession until 20081.
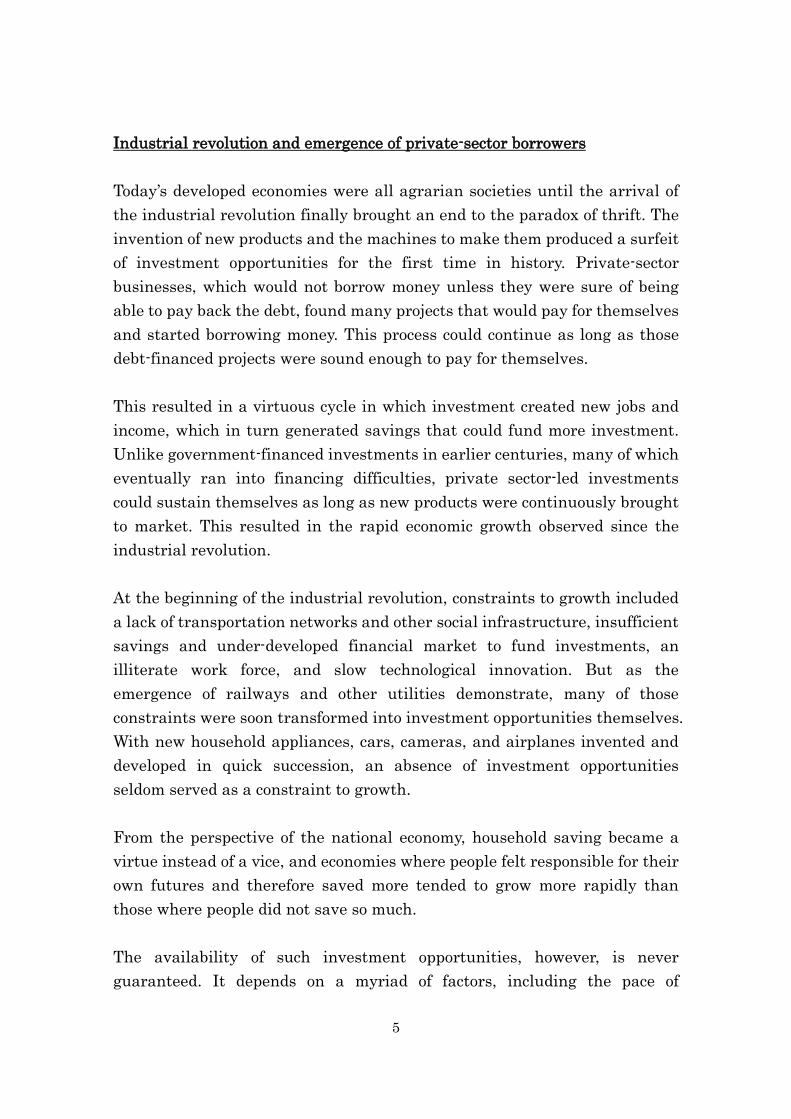
However, a look back in history suggests that such a state was much closer to
the norm for thousands of years before the industrial revolution. Economic
growth had been negligible for centuries before this technological revolution
(Exhibit 1). During this period of essentially zero growth, savers were
probably not in short supply because human beings were always worried
about an uncertain future. Preparing for old age and a rainy day is an
ingrained aspect of human nature. But if it is human to save, then the
centuries-long economic stagnation prior to the industrial revolution must
have been due to a lack of borrowers.
Since private sector would not borrow unless it can be sure that it can pay
back the debt, it is easy to see why the limited number of technological
innovation before the industrial revolution produced very few borrowers.
Because of this dearth of opportunities, the more people tried to save, the
1 One exception is the National Association of Business Economists,
Washington, D.C. which awarded its Abramson Award to my paper titled
“The Japanese Economy in Balance Sheet Recession” published in their
journal Business Economics in April 2001.
4
deeper the economy fell into the paradox of thrift. The result was a
permanent paradox of thrift in which people tried to save but their actions
and intentions kept the national economy in a depressed state. This state of
affairs lasted for centuries in both the East and the West.
Exhibit 1. Economic Growth Became Norm Only After Industrial Revolution
Powerful rulers sometimes borrowed the saved funds and used them to build
social infrastructure or monuments. On those occasions, the vicious cycle of
the paradox of thrift was suspended because the government borrowed the
saved funds and re-injected them into the income stream, generating rapid
economic growth. However, unless the project paid for itself, the government
would at some point get cold feet in the face of a mounting debt load and
discontinue its investment. The whole economy would then fall back into the
paradox of thrift and stagnate. Consequently, those regimes often did not
last as long as some of the monuments they created. And governments are
seldom good at selecting investment projects that pay for themselves.
Countries also tried to achieve economic growth by expanding their territory,
i.e., by acquiring more land, which was the key factor of production before
the industrial revolution. But that was basically a zero-sum proposition for
the global economy and also resulted in countless wars and deaths.
0
10000000
20000000
30000000
40000000
50000000
60000000
1
10
00
15
00
16
00
17
00
18
20
18
70
19
00
19
50
20
08
(1990 international $, million)
Source: Angus Maddison, "Historical Statistics of the World Economy: 1-2008 AD", http://www.ggdc.net/maddison/Historical_Statistics/vertical-file_02-2010.xls
Industrial Revolution1760's - 1830's
5
Industrial revolution and emergence of private-sector borrowers
Today’s developed economies were all agrarian societies until the arrival of
the industrial revolution finally brought an end to the paradox of thrift. The
invention of new products and the machines to make them produced a surfeit
of investment opportunities for the first time in history. Private-sector
businesses, which would not borrow money unless they were sure of being
able to pay back the debt, found many projects that would pay for themselves
and started borrowing money. This process could continue as long as those
debt-financed projects were sound enough to pay for themselves.
This resulted in a virtuous cycle in which investment created new jobs and
income, which in turn generated savings that could fund more investment.
Unlike government-financed investments in earlier centuries, many of which
eventually ran into financing difficulties, private sector-led investments
could sustain themselves as long as new products were continuously brought
to market. This resulted in the rapid economic growth observed since the
industrial revolution.
At the beginning of the industrial revolution, constraints to growth included
a lack of transportation networks and other social infrastructure, insufficient
savings and under-developed financial market to fund investments, an
illiterate work force, and slow technological innovation. But as the
emergence of railways and other utilities demonstrate, many of those
constraints were soon transformed into investment opportunities themselves.
With new household appliances, cars, cameras, and airplanes invented and
developed in quick succession, an absence of investment opportunities
seldom served as a constraint to growth.
From the perspective of the national economy, household saving became a
virtue instead of a vice, and economies where people felt responsible for their
own futures and therefore saved more tended to grow more rapidly than
those where people did not save so much.
The availability of such investment opportunities, however, is never
guaranteed. It depends on a myriad of factors, including the pace of
6
technological innovation and scientific breakthroughs, the ability of
businesspeople to find such opportunities and borrow money to exploit them,
the stage of economic development, the availability of financing at
reasonable interest rates, the protection afforded to intellectual property
rights, and the general state of the economy and world trade.
Four Possible Combinations of Borrowers and Lenders
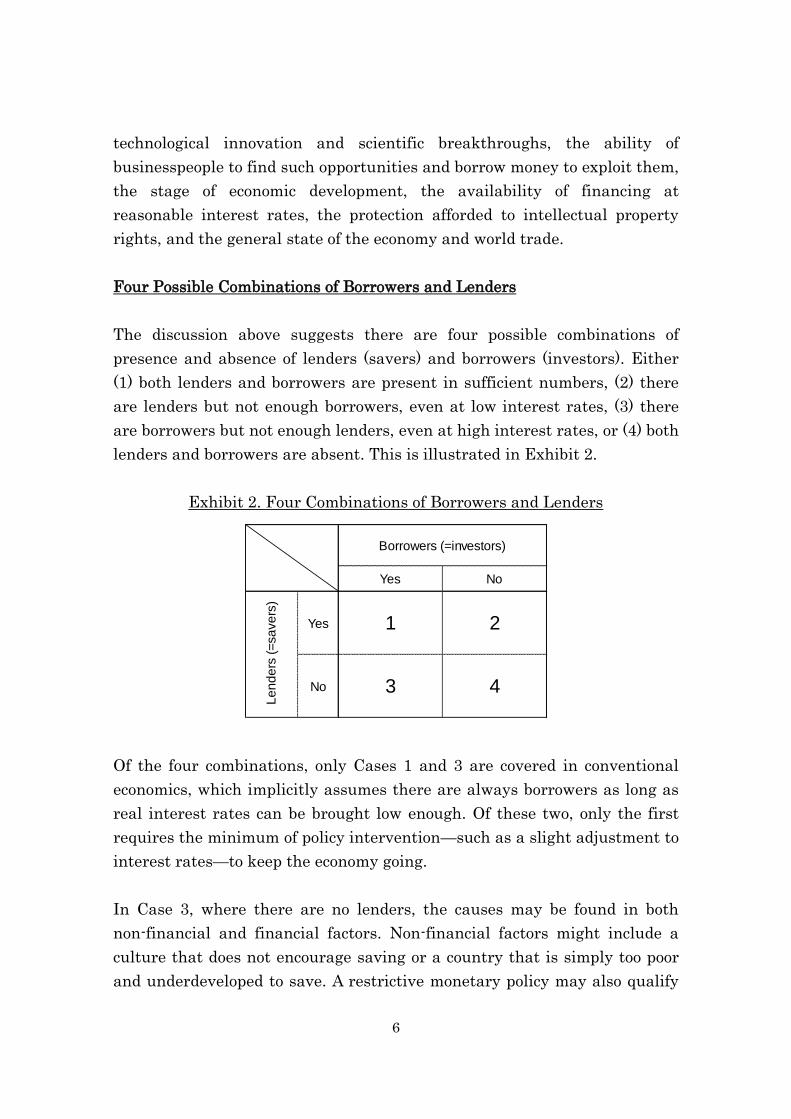
The discussion above suggests there are four possible combinations of
presence and absence of lenders (savers) and borrowers (investors). Either
(1) both lenders and borrowers are present in sufficient numbers, (2) there
are lenders but not enough borrowers, even at low interest rates, (3) there
are borrowers but not enough lenders, even at high interest rates, or (4) both
lenders and borrowers are absent. This is illustrated in Exhibit 2.
Exhibit 2. Four Combinations of Borrowers and Lenders
Of the four combinations, only Cases 1 and 3 are covered in conventional
economics, which implicitly assumes there are always borrowers as long as
real interest rates can be brought low enough. Of these two, only the first
requires the minimum of policy intervention—such as a slight adjustment to
interest rates—to keep the economy going.
In Case 3, where there are no lenders, the causes may be found in both
non-financial and financial factors. Non-financial factors might include a
culture that does not encourage saving or a country that is simply too poor
and underdeveloped to save. A restrictive monetary policy may also qualify
Yes No
Yes 1 2
No 3 4
Le
nd
ers
(=
sa
ve
rs)
Borrowers (=investors)

7
as a non-financial factor weighing on savers’ ability to lend. (If a paradox of
thrift leaves a country too poor to save, this would properly be classified as
Case 4 because it is actually caused by a lack of borrowers.)
Financial factors might include banks having too many non-performing
loans (NPLs), which depress their capital ratios and prevent them from
lending. This condition is typically known as a credit crunch. Systemic NPL
problems may prompt mutual distrust among banks and lead to a
dysfunctional interbank market, a state of affairs typically known as a
financial crisis. Over-regulation of financial institutions by the authorities
can lead to a similar outcome. An underdeveloped financial system may also
be a factor.
Cultural norms against savings, as well as income (and productivity) levels
that are too low for people to save anything, are developmental phenomena
typically found in pre-industrialized economies. These issues can take many
years to address.
Non-developmental causes of an absence of lenders however, all have
well-known remedies in the literature. For example, the government can
inject capital into the banks to restore their ability to lend, or it can relax
regulations preventing financial institutions from performing their role as
financial intermediaries. In the case of a dysfunctional interbank market,
the central bank can act as lender of last resort to ensure the clearing system
continues to operate. It can also relax monetary policy.
The conventional emphasis on monetary policy and concerns over the
crowding-out effect of fiscal policy are justified in Cases 1 and 3, where there
are borrowers but (for a variety of reasons) not enough lenders.
Problems stemming from lack of borrowers
The problem is with Cases 2 and 4, where there are not enough borrowers. If
the reason is that businesses cannot find attractive investment opportunities,
the government may have to do more to encourage scientific and
technological innovation. That may require measures reminiscent of
8
supply-side economics, such as tax incentives and deregulation. Although tax
incentives qualify as fiscal policy, these supply-side measures, which are
basically micro-economic measures, take a long time to produce results large
enough to have macroeconomic impact.
When US President Ronald Reagan lowered tax rates and drastically
deregulated the economy in 1980 in the first demonstration of supply-side
economics, people with ideas and drive took notice. They began pushing back
the technological frontiers of the IT industry, eventually enabling the US to
regain the lead it had lost to Japan in many high-tech fields.
This was a spectacular achievement, but the process took nearly 15 years.
Reagan’s ideas were implemented in the early 1980s, but it was not until the
Clinton era that those ideas actually bore fruit. During Reagan’s two terms
and the elder Bush’s one, the US economy continued to struggle.
President George H.W. Bush achieved monumental diplomatic successes
that included an end to the Cold War, the collapse of the Soviet Union, and
victory in the first Gulf War. Yet he lost his re-election campaign to a young
governor from Arkansas by the name of Bill Clinton who had only one
campaign slogan: “It’s the economy, stupid!” The fact that Bush lost this
election suggests the economy was still far from satisfactory in the eyes of
most Americans in 1992.
Once Clinton took over, however, the US economy began to do much better
even though only a few can remember the details of his economic policies.
The economy was doing so well by his second term that the Federal
government was running a budget surplus. And the surplus was growing so
fast that then-Fed Chairman Alan Greenspan worried out loud that a
shortage of Treasury bonds might make it difficult for the Fed to conduct
monetary policy. The conclusion to be drawn from this is that even though
supply-side reforms are essential in encouraging innovation, it takes many
years for them to produce macroeconomic results that ordinary citizens can
feel and appreciate.
Absence of borrowers due to balance sheet problems
9
When there are no borrowers because the bursting of a debt-financed bubble
has left their balance sheets underwater, the borrowers will not return until
their negative equity problems are resolved. This can take many years
depending on the size of the bubble. And the bubbles that burst in Japan in
1990 and in the Western economies in 2008 were very large indeed.
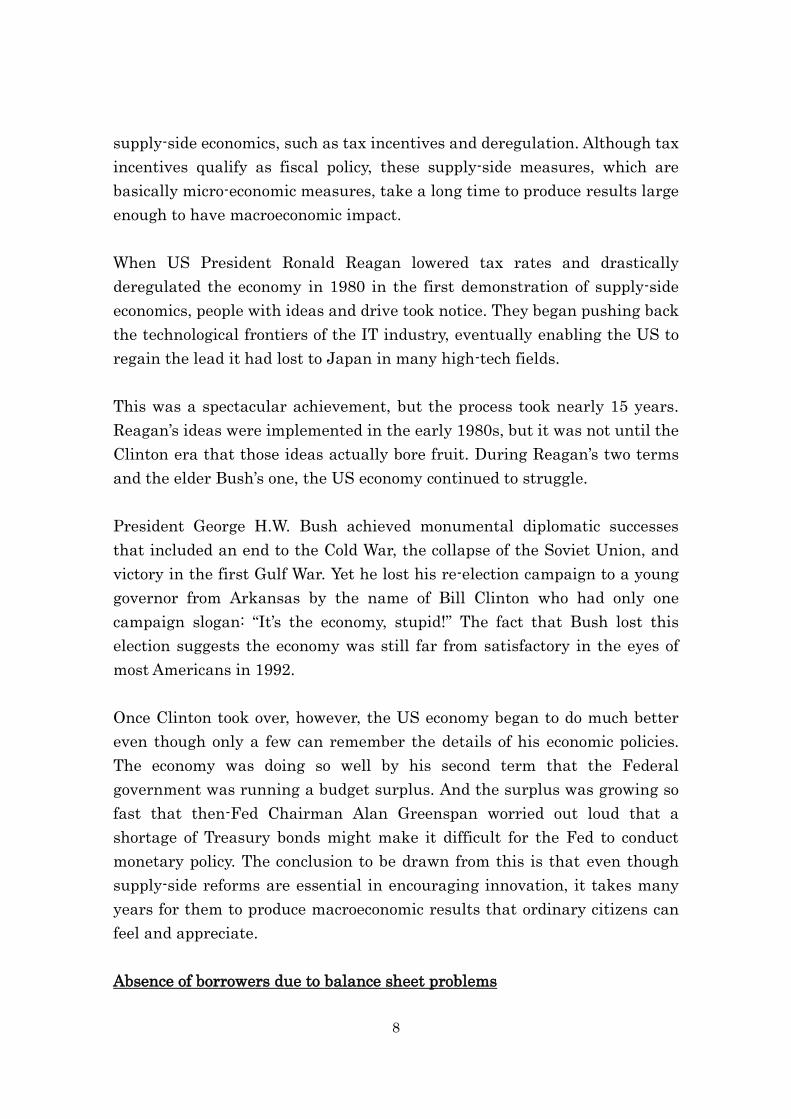
Exhibit 3 compares the US and Japanese bubbles that took place 15 years
apart. It shows that the two bubbles were remarkably similar both on the
way up and on the way down, implying that what the US experienced is
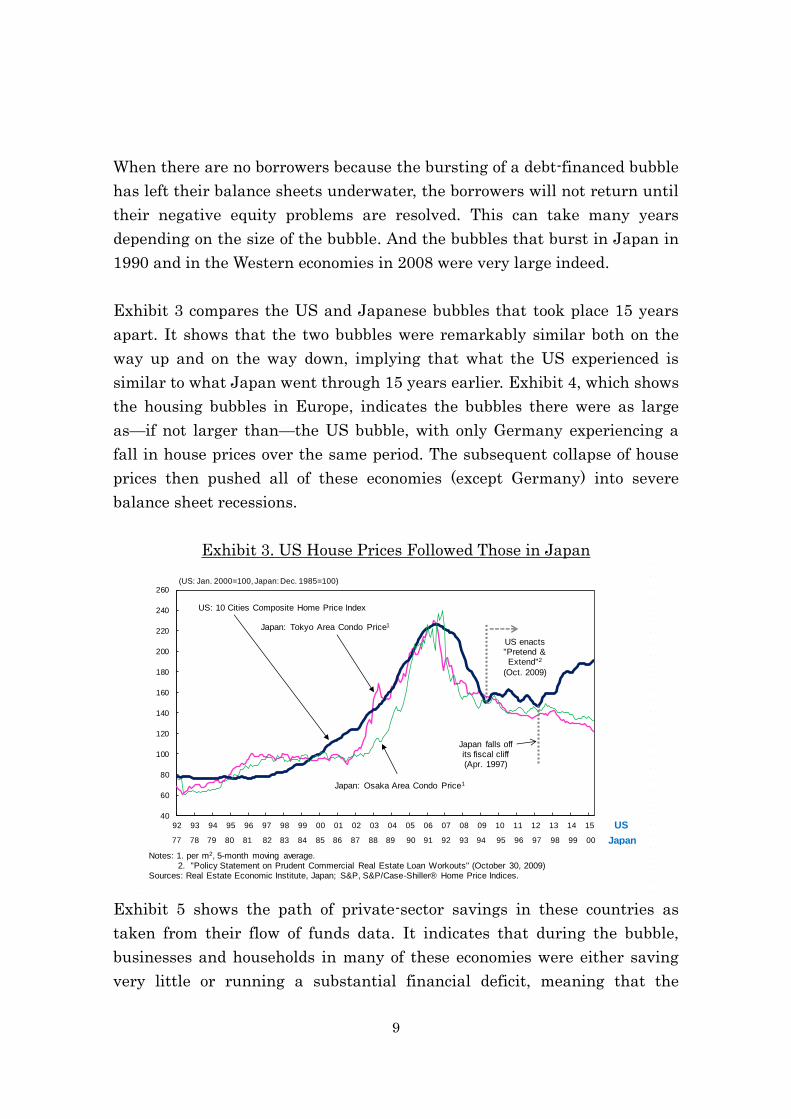
similar to what Japan went through 15 years earlier. Exhibit 4, which shows
the housing bubbles in Europe, indicates the bubbles there were as large
as—if not larger than—the US bubble, with only Germany experiencing a
fall in house prices over the same period. The subsequent collapse of house
prices then pushed all of these economies (except Germany) into severe
balance sheet recessions.
Exhibit 3. US House Prices Followed Those in Japan
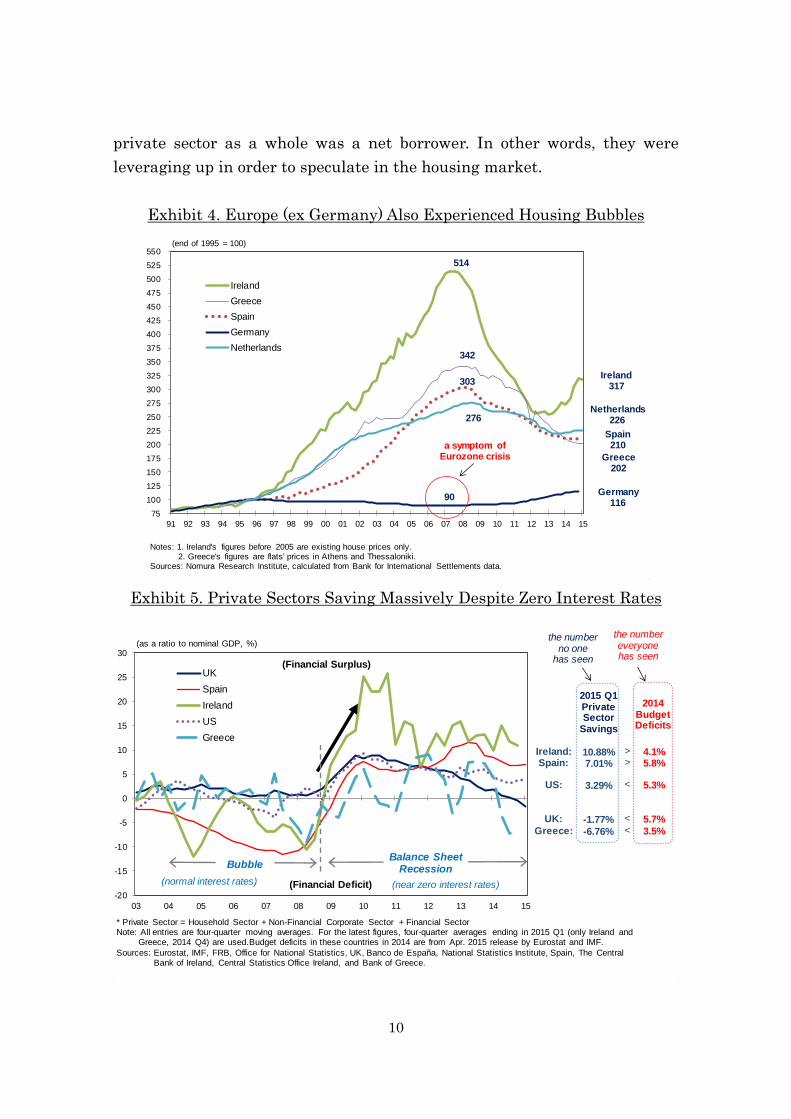
Exhibit 5 shows the path of private-sector savings in these countries as
taken from their flow of funds data. It indicates that during the bubble,
businesses and households in many of these economies were either saving
very little or running a substantial financial deficit, meaning that the
40
60
80
100
120
140
160
180
200
220
240
260
92 93 94 95 96 97 98 99 00 01 02 03 04 05 06 07 08 09 10 11 12 13 14 15
US: 10 Cities Composite Home Price Index
(US: Jan. 2000=100, Japan: Dec. 1985=100)
Notes: 1. per m2, 5-month moving average.2. "Policy Statement on Prudent Commercial Real Estate Loan Workouts" (October 30, 2009)
Sources: Real Estate Economic Institute, Japan; S&P, S&P/Case-Shiller® Home Price Indices.
Japan: Tokyo Area Condo Price1
77 78 79 80 81 82 83 84 85 86 87 88 89 90 91 92 93 94 95 96 97 98 99 00
Japan: Osaka Area Condo Price1
Japan falls off its fiscal cliff(Apr. 1997)
US enacts "Pretend & Extend"2
(Oct. 2009)
US
Japan
10
private sector as a whole was a net borrower. In other words, they were
leveraging up in order to speculate in the housing market.
Exhibit 4. Europe (ex Germany) Also Experienced Housing Bubbles
Exhibit 5. Private Sectors Saving Massively Despite Zero Interest Rates
75
100
125
150
175
200
225
250
275
300
325
350
375
400
425
450
475
500
525
550
91 92 93 94 95 96 97 98 99 00 01 02 03 04 05 06 07 08 09 10 11 12 13 14 15
Ireland
Greece
Spain
Germany
Netherlands
(end of 1995 = 100)
Notes: 1. Ireland's figures before 2005 are existing house prices only.2. Greece's figures are flats' prices in Athens and Thessaloniki.
Sources: Nomura Research Institute, calculated from Bank for International Settlements data.
90
303
342
514
a symptom of Eurozone crisis
276
Ireland317
Greece202
Spain210
Germany116
Netherlands226
Ireland:Spain:
US:
UK:
Greece:
4.1%5.8%
5.3%
5.7%
3.5%
-20
-15
-10
-5
0
5
10
15
20
25
30
03 04 05 06 07 08 09 10 11 12 13 14 15
UK
Spain
Ireland
US
Greece
Balance Sheet Recession
(as a ratio to nominal GDP, %)
(Financial Surplus)
(Financial Deficit)
Bubble
(normal interest rates) (near zero interest rates)
* Private Sector = Household Sector + Non-Financial Corporate Sector + Financial SectorNote: All entries are four-quarter moving averages. For the latest figures, four-quarter averages ending in 2015 Q1 (only Ireland and
Greece, 2014 Q4) are used.Budget deficits in these countries in 2014 are from Apr. 2015 release by Eurostat and IMF.
Sources: Eurostat, IMF, FRB, Office for National Statistics, UK, Banco de España, National Statistics Institute, Spain, The Central Bank of Ireland, Central Statistics Office Ireland, and Bank of Greece.
2015 Q1PrivateSector
Savings
10.88%7.01%
3.29%
-1.77%
-6.76%
2014 BudgetDeficits
>>
<
<
<
the number no one
has seen
the number everyone has seen

11
After the bubble burst, however, the private sectors in these economies
changed their behavior dramatically and began running massive financial
surpluses, even though interest rates were brought down to record low levels.
A large private-sector financial surplus at a time of zero interest rates is the
prime characteristic of an economy in a balance sheet recession, where the
private sector has been minimizing debt instead of maximizing profits.
Conventional economics, which assumes the private sector always seeks to
maximize profit, no longer applies in this case.
Monetary policy the first casualty when borrowers disappear
The first casualty of this shift has been monetary policy. Although seldom
mentioned explicitly in textbooks, the existence of borrowers capable of
responding to movements in interest rates is a necessary condition for
monetary policy to work. But this fundamental assumption is often violated
in the aftermath of a bubble as the private sector is forced to minimize debt
no matter how low interest rates go.
Exhibit 6. Huge Liquidity Injections Produced Minimal Increases in Money
Supply and Credit (I): US
50
100
150
200
250
300
350
400
450
500
Monetary Base
Money Supply (M2)
Loans and Leases in Bank Credit
(Aug. 2008 =100, seasonally adjusted)
0.5
1.5
2.5
3.5
07/1 07/7 08/1 08/7 09/1 09/7 10/1 10/7 11/1 11/7 12/1 12/7 13/1 13/7 14/1 14/7 15/1 15/7
(%, yoy) Consumer SpendingDeflator (core)
Note: Commercial bank loans and leases, adjustments for discontinuities made by Nomura Research Institute.Sources: Federal Reserve Board; US Department of Commerce
457
155
113
+1.24%
12
When the private sector is minimizing debt because borrowers who had
over-leveraged themselves during the bubble are forced to deleverage to fix
their balance sheets, the money multiplier turns negative at the margin,
causing the central bank to lose control over the money supply.
This is clear from Exhibit 6, which shows the US monetary base, money
supply, and bank credit extended to the private sector. According to
(outdated?) textbooks, the monetary base, money supply and credit should
have very similar growth rates, i.e., a 10 percent increase in the monetary
base should result in a 10 percent increase in both the money supply and
private sector credit. And such a textbook world did exist in the West until
2008 and in Japan until 1990 where the three monetary aggregates moved
together.
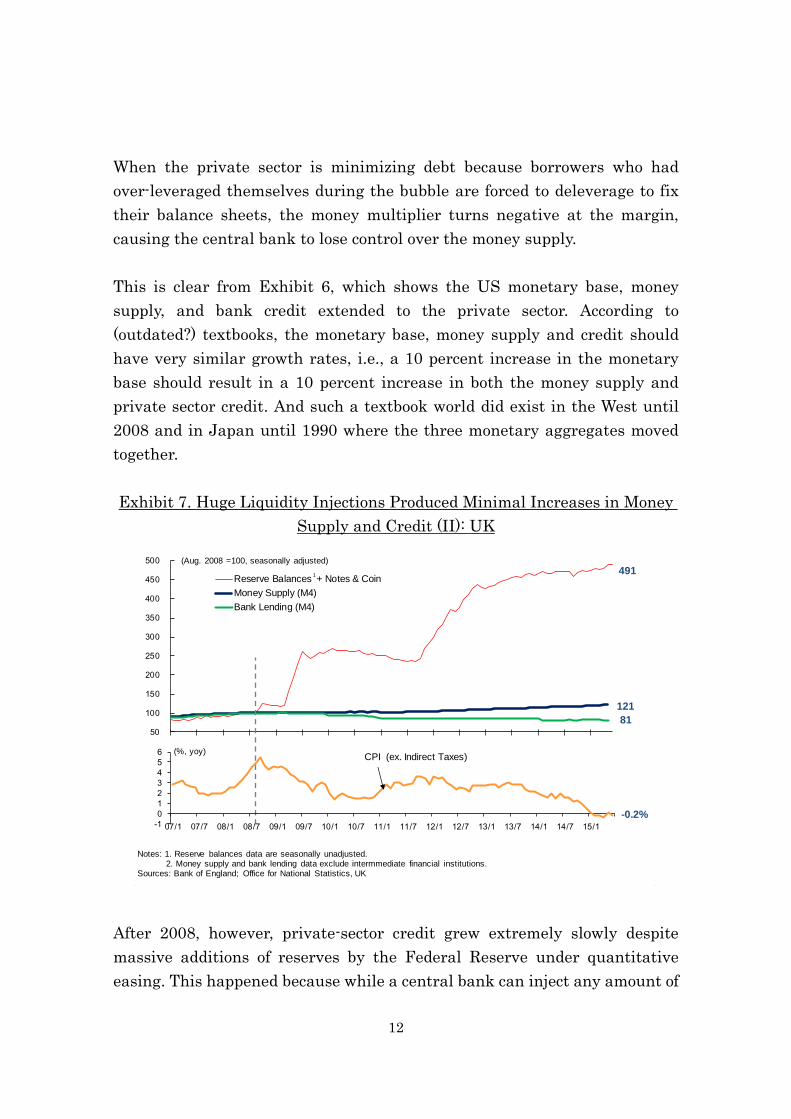
Exhibit 7. Huge Liquidity Injections Produced Minimal Increases in Money
Supply and Credit (II): UK
After 2008, however, private-sector credit grew extremely slowly despite
massive additions of reserves by the Federal Reserve under quantitative
easing. This happened because while a central bank can inject any amount of
50
100
150
200
250
300
350
400
450
500
Reserve Balances + Notes & Coin
Money Supply (M4)
Bank Lending (M4)
(Aug. 2008 =100, seasonally adjusted)
1
-1
0
1
2
3
4
5
6
07/1 07/7 08/1 08/7 09/1 09/7 10/1 10/7 11/1 11/7 12/1 12/7 13/1 13/7 14/1 14/7 15/1
CPI (ex. Indirect Taxes)(%, yoy)
Notes: 1. Reserve balances data are seasonally unadjusted. 2. Money supply and bank lending data exclude intermmediate financial institutions.
Sources: Bank of England; Office for National Statistics, UK
491
121
81
-0.2%

13
reserves into the banking system, the banks must actually lend money for
those reserves to enter the real economy. (Banks cannot give money away
because the funds belong to depositors.) But when the private sector in
aggregate is running a financial surplus, there are no borrowers and the
reserves cannot leave the banking system and enter the real economy. With
only a modest increase in money circulating in the real economy, a large part
of which was made possible by government borrowing, it is no wonder that
inflation failed to pick up as shown in the bottom of Exhibit 6.
Exhibit 8. Huge Liquidity Injections Produced Minimal Increases in Money
Supply and Credit (III): Eurozone
Exhibits 7, 8 and 9 show the same monetary aggregates for the UK,
Eurozone and Japan. The pattern is the same in all three cases, with growth
in the monetary base completely de-coupling from growth in the money
supply and credit. Indeed, credit in the UK has been shrinking since 2008.
This means most of the reserves central banks injected into the banking
system via quantitative easing never made it to the real economy, i.e., they
remain trapped in the financial system.
This also explains why inflation rates have remained so low. Some asset
80
90
100
110
120
130
140
150
160
170
180
190
200
Base Money
Money Supply (M3)
Credit to Euro Area Residents
(Aug. 2008 =100, seasonally adjusted)
0.4
0.8
1.2
1.6
2.0
2.4
07/1 07/7 08/1 08/7 09/1 09/7 10/1 10/7 11/1 11/7 12/1 12/7 13/1 13/7 14/1 14/7 15/1 15/7
(%, yoy)
CPI core
Note: Base money's figures are seasonally adjusted by Nomura Research Institute.Sources: European Central Bank; Eurostat
119
99
+0.9%
193

14
prices have increased because the funds injected by central banks and
deleveraged funds returning to financial institutions had nowhere else to go,
but the general level of prices remains low because an absence of borrowers
has kept those funds from entering the real economy.
Exhibit 9. Huge Liquidity Injections Produced Minimal Increases in Money
Supply and Credit (IV): Japan
FX market participants still assuming textbook world
Interestingly, even though quantitative easing has had minimal impact on
the actual supply of money and credit, those in the foreign exchange market
apparently assumed the textbook world was still in effect and pushed down
the value of currencies as soon as their issuing banks announced
quantitative easing programs. Thus when the Fed and the Bank of England
unveiled QE programs following Lehman’s collapse, both currencies fell 30 to
40 percent against the Japanese yen (Exhibit 10), effectively making Japan’s
currency the world’s strongest.
That helped both General Motors and Chrysler recover quickly while
0
100
200
300
400
500
600
700
800
900
Monetary Base
Money Supply (M2)
Bank Lending
QuantitativeEasing
(1990 Q1 = 100, seasonally adjusted)
Bubble Burst
Quantitative and Qualitative Easing
-3
-2
-1
0
1
2
3
4
85 86 87 88 89 90 91 92 93 94 95 96 97 98 99 00 01 02 03 04 05 06 07 08 09 10 11 12 13 14 15
(%, yoy)
CPI Core(ex. fresh food)
Notes: 1. Figures for bank lending are seasonally adjusted by Nomura Research Institute.2. Excluding the impact of consumption tax.
Source: Bank of Japan
Earthquake
842
194
+0.1% 2
1111

15
Japanese companies struggled under the crushing weight of the strong yen.
When Japan’s central bank announced its own QE program in late 2012, the
yen fell 30 to 40 percent against the dollar and the pound, completely
neutralizing the advantage that US and UK companies had been enjoying.
Exhibit 10. QE Has Large Beggar-thy-Neighbor or Zero-Sum Component
In all of these cases, however, differences in money supply growth were
nowhere near those that are necessary to justify the observed changes in
exchange rates. Indeed money supply growth failed to accelerate in any of
these countries after the QE. In other words, QE is basically a zero-sum,
beggar-thy-neighbor policy with no real benefit for the global economy.
When the high cost of winding down QE is taken into consideration, it is not
at all clear whether the whole exercise will have been worth the trouble2.
Japanese and US governments as borrowers of last resort
When balance sheet problems have forced the private sector to minimize
debt, the correct way to avoid a deflationary spiral is for the government to
2 For further discussion on this topic, see Koo, Richard. The Escape from Balance Sheet Recession and the QE Trap: A Hazardous Road for the World Economy: John Wiley and Sons, 2014, Chapter 2.
50
60
70
80
90
100
110
08/06 09/01 09/08 10/03 10/10 11/05 11/12
Aug. 20081
(Aug. 2008 = 100, weekly)
yen per US$
stronger yen
yen per UK£
historical lows against the yen
50
60
70
80
90
100
110
12/09 13/02 13/07 13/12 14/05 14/10 15/03
Nov. 20122
(Nov. 2012 = 100, weekly)
US$ per yenweaker yen
UK£ per yen
Notes: 1. One month before the Lehman Shock2. One month before the start of Abenomics
Source: Nomura Research Institute, based on the data from Nikkei
2008 US and UK QE brought US$ and UK£ down ~35% against yen
2013 Japanese QE brought yen down
~35% against US$ and UK£

16
act as borrower of last resort and borrow and spend the excess savings of the
private sector (the $100 amount in the example presented above). By doing
so, it can prevent GDP and the money multiplier from shrinking. And by
supporting GDP, the government ensures that the private sector has enough
income to pay down its debts.
Japan basically followed this path until 1997 and succeeded in keeping GDP
at or above bubble-peak levels in spite of an 87 percent fall in commercial
real estate prices nationwide. This was an amazing achievement in view of
the fact that the country lost national wealth amounting to 1,500 trillion yen,
or three times its 1989 GDP, during this period. As a percentage of GDP this
loss of wealth was three times greater than the one the US sustained during
the Great Depression when the country lost 46 percent of its nominal GNP.
Exhibit 11. Japan’s Fall from Fiscal Cliff in 1997 and 2001 Weakened
Economy, Reduced Tax Revenue, and Increased Deficit
Once the private sector finishes repairing its balance sheet and is ready to
borrow again, the government should start fixing its balance sheet, but it has
to be in that order. Any attempt to reduce budget deficits before the private
sector is ready to borrow will only revive the deflationary spiral and defeat
the original purpose of shrinking the deficit.
0
10
20
30
40
50
60
70
80
90 91 92 93 94 95 96 97 98 99 00 01 02 03 04 05 06 07 08 09 10 11 12 13 14 15
Tax Revenue
Budget Deficit
Hashimotofiscal
reform
Koizumifiscal
reform
(Yen tril.) (Yen tril.)
(FY)
Global Financial
Crisis
*
Obuchi-Morifiscal
stimulus
Earthquake
"Abenomics"
Source: Ministry of Finance, JapanNotes: Latest figures(*) are estimated by MOF. From FY2011, figures include reconstruction taxes and bonds.
unnecessaryincrease in
deficit:¥103.3 tril.

17
That was exactly what happened to Japan in 1997 when the country was
persuaded to reduce its deficit by the IMF and OECD, two organizations that
understood nothing of balance sheet recessions at that time. The result was
a complete collapse of the economy and the banking system that led to a 72
percent increase in the deficit in spite of higher taxes and lower spending.
This mistake lengthened the recession by at least five years, and it took
Japan nearly ten years to bring the deficit back to pre-1997 levels, as shown
in Exhibit 11.
US policy makers from Ben Bernanke to Larry Summers recognized in the
first two years of the GFC that they were facing a balance sheet recession,
the same sickness that had afflicted Japan. This was amply demonstrated
when Larry Summers, then the NEC chairman in the Obama administration
indicated in July 2009 that fiscal stimulus must have the “three S’s”: it must
be sufficient, sustained and speedy 3 . It must be sufficient to fill the
deflationary gap and stabilize the economy. It must be sustained until the
private sector has finished its balance sheet repairs. And it must be
implemented speedily to pre-empt a deflationary spiral. Doing any less risks
creating a deflationary spiral when the private sector in aggregate is not
borrowing.
U.S. policy makers also issued strong warnings against premature fiscal
consolidation using the phrase “fiscal cliff,” which in turn allowed the US to
avoid the Japanese mistakes of 1997. Although the US came very close to
falling off the fiscal cliff on a number of occasions, including the debt ceiling
debate, sequester and the government shutdown, it ultimately managed to
avoid that outcome. The private sector therefore had the income needed to
pay down debt, to the extent that some US households are now starting to
borrow again. The US success in avoiding Japan’s mistakes was why US
house prices diverged from the path of Japanese house prices after 1997, as
shown in Exhibit 3.
3 Summers, Lawrence H., (2009), “Rescuing and Rebuilding the US Economy: A
Progress Report.” Prepared remarks at the Peterson Institute for International
Economics, Washington D.C., July 17, 2009.
http://www.piie.com/publications/papers/paper.cfm?ResearchID=1264
18
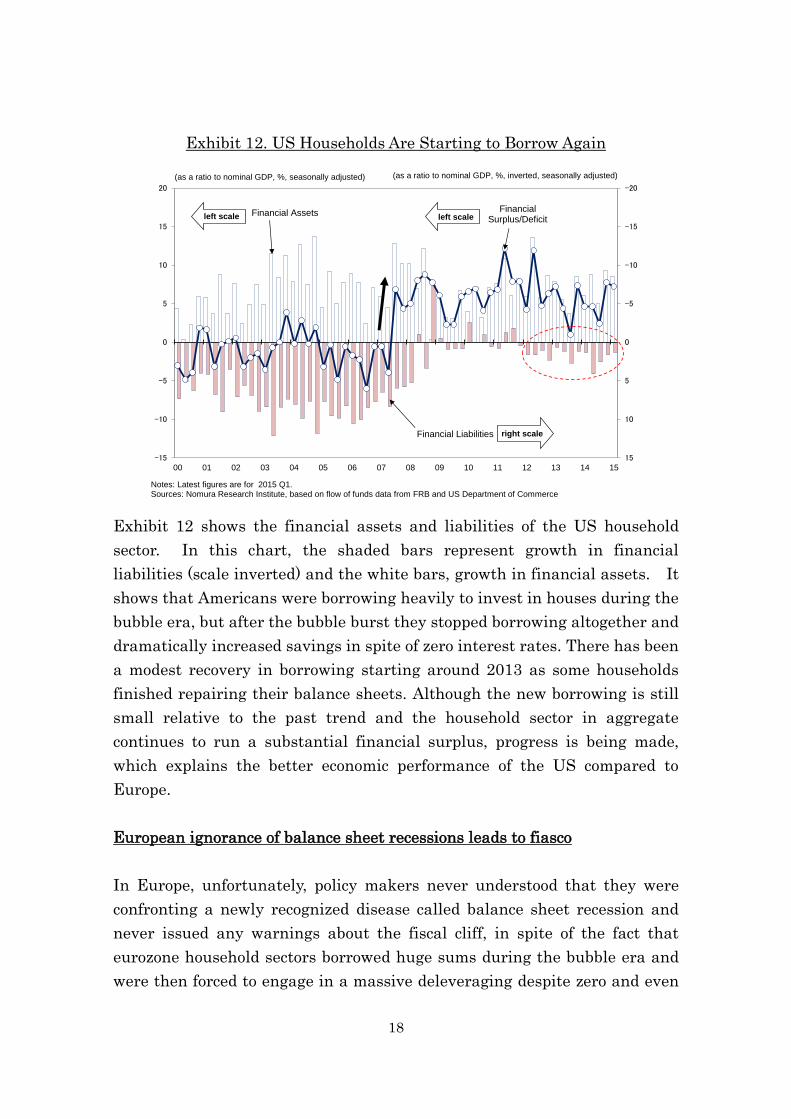
Exhibit 12. US Households Are Starting to Borrow Again
Exhibit 12 shows the financial assets and liabilities of the US household
sector. In this chart, the shaded bars represent growth in financial
liabilities (scale inverted) and the white bars, growth in financial assets. It
shows that Americans were borrowing heavily to invest in houses during the
bubble era, but after the bubble burst they stopped borrowing altogether and
dramatically increased savings in spite of zero interest rates. There has been
a modest recovery in borrowing starting around 2013 as some households
finished repairing their balance sheets. Although the new borrowing is still
small relative to the past trend and the household sector in aggregate
continues to run a substantial financial surplus, progress is being made,
which explains the better economic performance of the US compared to
Europe.
European ignorance of balance sheet recessions leads to fiasco
In Europe, unfortunately, policy makers never understood that they were
confronting a newly recognized disease called balance sheet recession and
never issued any warnings about the fiscal cliff, in spite of the fact that
eurozone household sectors borrowed huge sums during the bubble era and
were then forced to engage in a massive deleveraging despite zero and even
-20
-15
-10
-5
0
5
10
15-15
-10
-5
0
5
10
15
20
00 01 02 03 04 05 06 07 08 09 10 11 12 13 14 15
(as a ratio to nominal GDP, %, seasonally adjusted) (as a ratio to nominal GDP, %, inverted, seasonally adjusted)
Financial Assets
Financial Liabilities right scale
left scaleFinancial
Surplus/Deficitleft scale
Notes: Latest figures are for 2015 Q1.Sources: Nomura Research Institute, based on flow of funds data from FRB and US Department of Commerce

19
negative interest rates. Exhibits 13, 14 and 15 show the household sectors
of Spain, Ireland and Greece, the three countries where house price
increases were particularly pronounced. In all three countries, the shaded
bars are mostly above the zero line after 2008, indicating that households in
these countries are paying down debt at a time of zero interest rates.
Unfortunately, when the common currency was being designed in the 90s,
nobody outside Japan knew anything about balance sheet recessions, and
the Maastricht Treaty ended up making no provision for this type of
recession. In particular, the treaty prohibits member governments from
running sustained budget deficits of more than three percent of GDP
regardless of the size of private sector savings. This means that even if the
private sector is saving 7 percent of GDP, the government can borrow only 3
percent of GDP, leaving the remaining 4 percent of GDP as un-invested
savings to start the deflationary spiral.
Exhibit 13. Spanish Households Increased Borrowings after Dotcom Bubble,
But Are Now Deleveraging
The Spanish private sector, for example, was saving 7.0 percent of GDP in
the 12 months that ended in the 1st quarter 2015 as shown in Exhibit 5.
That was over six years after the bursting of the bubble in 2008. For the
-20
-16
-12
-8
-4
0
4
8
12
16-16
-12
-8
-4
0
4
8
12
16
20
95 96 97 98 99 00 01 02 03 04 05 06 07 08 09 10 11 12 13 14 15
Notes: Seasonal adjustments by Nomura Research Institute. Latest figures are for 2015 Q1.Sources: Nomura Research Institute, based on flow of funds data from Banco de España and National Statistics Institute, Spain
right scale
left scale
left scale
FinancialAssets Financial
Surplus/Deficit
Financial Liabilities
(as a ratio to nominal GDP, %, seasonally adjusted) (as a ratio to nominal GDP, %, inverted, seasonally adjusted)
Collapse of the Dotcom Bubble
20
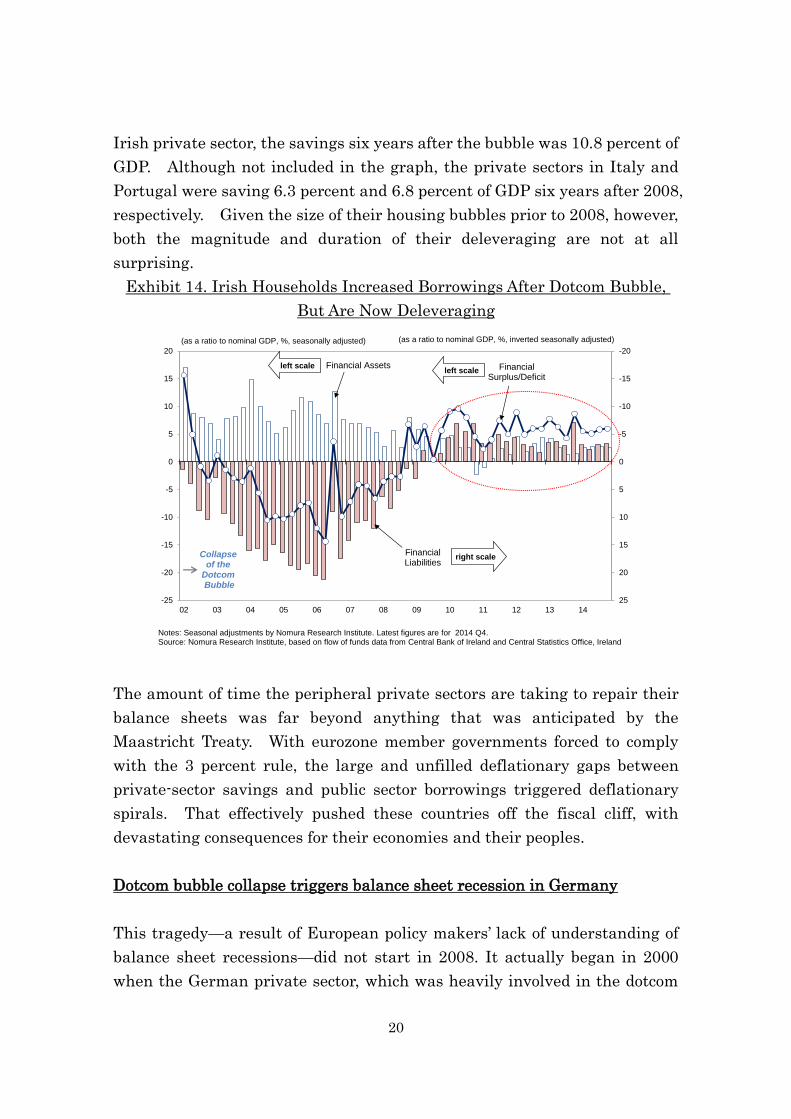
Irish private sector, the savings six years after the bubble was 10.8 percent of
GDP. Although not included in the graph, the private sectors in Italy and
Portugal were saving 6.3 percent and 6.8 percent of GDP six years after 2008,
respectively. Given the size of their housing bubbles prior to 2008, however,
both the magnitude and duration of their deleveraging are not at all
surprising.
Exhibit 14. Irish Households Increased Borrowings After Dotcom Bubble,
But Are Now Deleveraging
The amount of time the peripheral private sectors are taking to repair their
balance sheets was far beyond anything that was anticipated by the
Maastricht Treaty. With eurozone member governments forced to comply
with the 3 percent rule, the large and unfilled deflationary gaps between
private-sector savings and public sector borrowings triggered deflationary
spirals. That effectively pushed these countries off the fiscal cliff, with
devastating consequences for their economies and their peoples.
Dotcom bubble collapse triggers balance sheet recession in Germany
This tragedy—a result of European policy makers’ lack of understanding of
balance sheet recessions—did not start in 2008. It actually began in 2000
when the German private sector, which was heavily involved in the dotcom
-20
-15
-10
-5
0
5
10
15
20
25-25
-20
-15
-10
-5
0
5
10
15
20
02 03 04 05 06 07 08 09 10 11 12 13 14
right scale
left scaleleft scale
Financial Assets Financial Surplus/Deficit
Financial Liabilities
(as a ratio to nominal GDP, %, seasonally adjusted)
Notes: Seasonal adjustments by Nomura Research Institute. Latest figures are for 2014 Q4.Source: Nomura Research Institute, based on flow of funds data from Central Bank of Ireland and Central Statistics Office, Ireland
(as a ratio to nominal GDP, %, inverted seasonally adjusted)
Collapse of the
DotcomBubble

21
bubble, stopped borrowing money altogether after the bubble burst.
Exhibit 15. Greek Households Drawing Down Savings to Survive
Exhibit 16. German Households Stopped Borrowing Altogether After Dotcom
Bubble
-30
-25
-20
-15
-10
-5
0
5
10
15
20-20
-15
-10
-5
0
5
10
15
20
25
30
03 04 05 06 07 08 09 10 11 12 13 14
right scale
left scale left scaleFinancial Assets Financial Surplus/Deficit
Financial Liabilities
(as a ratio to nominal GDP, %, seasonally adjusted) (as a ratio to nominal GDP, %, inverted, seasonally adjusted)
Notes: Seasonal adjustments by Nomura Research Institute. Latest figures are for 2014 Q4.Sources: Nomura Research Institute, based on flow of funds data from Bank of Greece and Hellenic Statistical Authority, Greece
-12
-10
-8
-6
-4
-2
0
2
4
6
8-8
-6
-4
-2
0
2
4
6
8
10
12
91 92 93 94 95 96 97 98 99 00 01 02 03 04 05 06 07 08 09 10 11 12 13 14 15
right scale
left scale left scaleFinancial Assets Financial
Surplus/Deficit
Financial Liabilities
(as a ratio to nominal GDP, %, seasonally adjusted)
Note: Seasonal adjustments by Nomura Research Institute. Latest figures are for 2015 Q1.Sources: Nomura Research Institute, based on flow of funds data from Bundesbank and Eurostat
(as a ratio to nominal GDP, %, inverted, seasonally adjusted)
Collapse of the Dotcom
Bubble
The reason for German house prices falling

22
Exhibit 17. Neuer Markt Collapse in 2001 Pushed Germany Into Balance
Sheet Recession
Exhibit 16 shows that until 2000, German households were large net savers
but were also borrowing money to buy houses and so forth. But after the
spectacular rise and the subsequent 97 percent fall in the Neuer Markt, the
German equivalent of Nasdaq (Exhibit 17), borrowing disappeared
altogether. German households are still not borrowing much today, fully 15
years after the collapse of the dotcom bubble. Although there is no evidence
to suggest that German households were heavily leveraged during the
dotcom bubble, the losses they incurred nonetheless prompted them to stop
borrowing and rebuild savings. This explains why German house prices fell
and remained stagnant until 2011, as shown in Exhibit 4.
Even though German private-sector savings reached as much as 10 percent
of GDP in the wake of dotcom bubble collapse, the Maastricht Treaty kept
the German government from borrowing more than 3 percent of GDP,
creating a large deflationary gap. The resultant weakness in the post-2000
German economy then prompted the European Central Bank (ECB) to bring
interest rates down to a post-war low of 2 percent. As neither households
nor businesses in Germany were borrowing money, the ECB’s lower interest
0
1000
2000
3000
4000
5000
6000
7000
8000
9000
10000
1998 1999 2000 2001 2002 2003 2004 2005 2006 2007 2008 2009 2010 2011 2012 2013 2014 2015
(Dec. 31, 1997 = 1000)
Source: Bloomberg As of Jul. 23, 2015
TecDAX
9694.07
306.32
-97%
1816.23

23
rates had no impact on the country's economy. In fact, the German economy
continued to lose momentum, prompting many to call the country the “sick
man of Europe” because of its failure to respond to monetary easing.
Exhibit 18. Germany-Eurozone Competitiveness Gap Has Both Macro
(50.2%) and Micro (49.8%) Roots
While the German economy and money supply growth stagnated, the
peripheral economies that had sidestepped the dotcom bubble and therefore
enjoyed clean balance sheets responded enthusiastically to the lowest
interest rates in generations by borrowing and investing in real estate. With
strong demand for funds, the money supply grew rapidly, pushing wages and
prices in those countries higher. In contrast, anemic demand for funds in
Germany led to low money supply growth and stagnant wages and prices
(Exhibit 18), making Germany highly competitive relative to the rest of the
eurozone and enabling it to export its way out of the balance sheet recession
(Exhibit 19).
When the housing bubble burst in 2008, the private sectors of the peripheral
countries all had to deleverage while the Germans continued to pay down
debt, plunging the entire eurozone into a massive balance sheet recession.
90
100
110
120
130
140
150
160
170
180
190
200
210
220
230
240
250
00 01 02 03 04 05 06 07 08 09 10 11 12 13 14 15
Hypothetical Eurozone ULC (ex. Germany) if its M3 growth was the same as in
Germany*
Eurozone ULC (ex. Germany)
129.9
German ULCGerman M3
115.2
156.0
100.6
(1Q 2000 = 100, Seasonally Adjusted)
50.2%: Macro-Monetary Effect
49.8%: German Labor Reform Effect
(ULC = Unit Labor Cost)
Eurozone M3 (ex. Germany)
217.0
MonetarySource of
Competitiveness Gap
Note: * Parameters obtained from the regression result on Eurozone ULC (ex. Germany) on Eurozone M3 (ex. Germany),log(Eurozone ULC (ex.Germany)) = 3.155506 + log(Eurozone M3 (ex.Germany)) x 0.318227, applied to German M3data indexed to 1Q 2000 = 100.
Sources: Nomura Research Institute, based on ECB, Eurostat and Deutsche Bundesbank data

24
Exhibit 19. Germany Recovered from Post-Dotcom Recession by Exporting to
Other Eurozone Countries
Exhibit 20. Greece’s Nominal GDP Falls Far Below IMF Forecasts
Greece was already in a balance sheet recession when revelations about the
manipulation of deficit data in late 2009 threw the country into a massive
fiscal crisis. To make the matter worse, the IMF, which came up with a
“rescue” package for the country in 2010 had no understanding of balance
-6000
-4000
-2000
0
2000
4000
6000
8000
10000
12000
95 96 97 98 99 00 01 02 03 04 05 06 07 08 09 10 11 12 13 14 15
Source: Deutsche Bundesbank
(€mn, seasonally adjusted)
Eurozone
Asia
US
German Balance of Trade
driven by Eurozone housing bubble
driven by weaker Euro
150
170
190
210
230
250
270
2006 2007 2008 2009 2010 2011 2012 2013 2014 2015
Source: Nomura Research Institute, based on Hellenic Statistical Authority, Greece; IMF, "IMF Executive Board Approves €30 Billion Stand-By Arrangement for Greece" on May 9, 2010
(EUR bn)
IMF forecastsas of May 2010
Greek nominal GDP(actual)
-26%

25
sheet recessions at that time. In contrast to the mild contraction forecasted
by the IMF, the austerity program imposed by the troika (the EU, ECB and
IMF) in the midst of balance sheet recession ended up shrinking the Greek
GDP by 26 percent as indicated in Exhibit 20. With 26 percent less income,
businesses and households are forced to draw down savings in order to
survive. This is indicated by the white bars below zero in Exhibit 15. A
country whose private sector must dis-save simply to stay alive naturally
cannot pay back its foreign creditors.
The huge gap that developed between the IMF's forecasts of Greek GDP and
the actual performance also led to massive distrust of the troika among a
suffering Greek public, further complicating an already difficult situation.
Japanese “structural reform” blunder repeated in Europe
The European policy makers also repeated the Japanese error of mistaking
structural problems for balance sheet problems. Both Hashimoto
administration (1996-98) and Koizumi administration (2001-2006) in Japan
thought the economic stagnation was a result of structural problems within
the Japanese economy and embarked on ambitious programs of reforms
while refusing to put in fiscal stimulus. This was an understandable
mistake to the extent that balance sheet problems were never taught in
economics while structural issues have been popularized since 1980 by
President Reagan in his supply-side reforms.
Although all economies suffer from structural rigidities of one type or
another, they cannot explain the sudden loss of momentum and prolonged
stagnation these economies suffered in the wake of the bubble collapse.
More importantly, structural remedies are no substitute for fiscal remedies
in balance sheet recessions because the former can easily take a decade or
more to produce macroeconomic impact as mentioned in page 9 whereas
balance sheet problems can trigger the $1000-$900-$810-$730 deflationary
spirals almost from the day one.
All reform efforts put in by Prime Ministers Hashimoto and Koizumi in
Japan and Chancellor Gerhard Schroeder in post-dotcom Germany as well as

26
by peripheral governments in the post-2008 eurozone are not without merit.
But they all failed to produce the recovery these leaders promised because
their economies were suffering from a completely different disease. Until
European leaders recognize that perhaps 70 to 80 percent of their problems
are balance sheet-driven and only about 20 to 30 percent are structural in
nature, it is difficult to see how European economies would return to
anything resembling normalcy anytime soon. Interestingly, the US led by
the Obama administration is the only country in balance sheet recession that
managed to avoid the “structural reform trap” that afflicted both Japan and
Europe.
The German government’s inability to use fiscal policy to fight its balance
sheet recession after 2000 and peripheral governments’ inability to use fiscal
policy to address their balance sheet recessions after 2008 caused Europe’s
on-going tragedy. A significant part of the competitiveness gap between
Germany and the rest of eurozone was also due to inappropriate Maastricht
restrictions on German fiscal policy that forced the ECB to ease monetary
policy, which in turn created housing bubbles as well as higher wages and
prices in peripheral countries.
Europe is likely to stagnate until policy makers in the core countries realize
they are facing a highly unusual kind of recession that occurs only after a
bubble bursts and that was not discussed in university economics courses.
In particular, the Maastricht Treaty must be revised to enable it to deal with
both ordinary downturns and balance sheet recessions. In countries where
the private sector is saving more than 3 percent of GDP in spite of zero
interest rates, the government should be allowed—if not required—to borrow
and spend those excess savings to stabilize its economy. Such a provision is
also needed to prevent countries in balance sheet recessions from causing
distortions in ECB monetary policy.
Deficits easily financed during balance sheet recessions except in eurozone
It should be noted that, except in the eurozone, there is no reason for
governments in balance sheet recessions to face financing problems. This is
because the amount the government must borrow and spend to stabilize the

27
economy is exactly equal to the excess (i.e., unborrowed) savings of the
private sector. From the perspective of fund managers entrusted with those
savings, increased government borrowing is a welcome development because
there are no borrowers in the private sector. Those fund managers who are
not allowed to take on too much foreign exchange risk or principle risk will
rush to purchase government bonds during this type of recessions, pushing
bond yields down to levels that would be unthinkable under ordinary
conditions.
Exhibit 21. Peripheral Eurozone Bond Yields Jumped Because of
Destabilizing Capital Flows
This happened first in Japan after 1990 and spread to other countries in
balance sheet recessions after 2008 including small and open economies such
as Denmark and Sweden (Exhibit 21). These ultra-low government bond
yields are the market’s way of telling the government it needs to act as the
borrower of last resort to support the economy and the money supply. If the
government heeds the market's message and increases its fiscal stimulus,
both GDP and money multiplier will be supported to speed up the economic
recovery. If the government refuses to heed the market's message, both
GDP and money multiplier will suffer, with terrible consequences for the
economy and its people. In this sense, ultra-low government bond yields
0
2
4
6
8
10
12
14
16
18
20
2007 2008 2009 2010 2011 2012 2013 2014 2015
Japan
US
Spain
Portugal
Italy
Denmark
Sweden
(%)
Note: As of Jul. 23, 2015.Source: Bloomberg
Eurozone crisis

28
seen during this type of recessions are the key manifestations of the
self-corrective mechanism of economies in balance sheet recessions.
In the eurozone, however, fund managers can choose from 19 government
bond markets that are all denominated in the same currency. As a result,
peripheral countries’ excess private-sector savings often ended up in German
government bonds, pushing up the yields of peripheral government bonds
while lowering yields on Bunds. Foreign exchange risk which ring-fenced
government bond markets and allowed self-corrective mechanism to work in
all economies suffering from balance sheet recessions outside the eurozone
could not ring-fence government bond markets in the eurozone.
This intra-zone capital flight that is unique to the eurozone effectively
robbed the peripheral countries of the fiscal space they would have had if
they had stayed outside the eurozone. If Spain or Ireland stayed outside
the eurozone, their government bond yields would have come down to those
ridiculous levels seen elsewhere because their private sector savings have
been so large. Low government bond yields, in turn, would have given those
countries plenty of fiscal space to fight their balance sheet recessions.
To fix this problem of destabilizing capital flight between government bond
markets, incentives might have to be introduced to encourage the excess
savings of peripheral countries to stay in their own government bond marks
so that self-corrective mechanisms of those economies would work properly.
Unfortunately, European policy makers who still have no understanding of
balance sheet recessions naturally have no appreciation of the economy's
self-corrective mechanism against such a recession. They have also failed
to notice that private sector savings of peripheral countries are dangerously
large relative to their government deficits.
Based on this ignorance, they are trying to limit domestic financial
institutions from holding their own government bonds for the fear of
so-called "diabolic loop." If they succeed in their proposals, the
self-corrective mechanism of individual countries will be made inoperable
and the EU will be forced to come up with a mechanism to recycle Spanish

29
savings in Germany back to Spain, and Irish savings in Netherlands back to
Ireland. But such a task will be politically far more difficult than simply
giving some incentives for domestic institutions to hold domestic government
bonds (for example by giving lower risk weights for holdings of own
government bonds). Indeed if such incentives existed from the beginning of
euro, peripheral government bond crisis might have never happened since
there are more than sufficient private sector savings to finance deficit in all
post-2008 peripheral countries except Greece.
Exhibit 22. US Interest Rates Needed Thirty Years to Recover to Average
Level of 1920s
Debt aversion must be overcome
When countries finally emerge from their balance sheet recessions, they will
be saddled with huge public debt because they had to use fiscal stimulus to
fight the recession. The natural tendency of policy makers and orthodox
commentators faced with a large national debt is to raise taxes wherever
possible. But such wonton tax hikes may discourage businesses from
investing aggressively in new innovations, thus prolonging the period of
subpar economic growth.
0
1
2
3
4
5
6
7
8
9
19 20 21 22 23 24 25 26 27 28 29 30 31 32 33 34 35 36 37 38 39 40 41 42 43 44 45 46 47 48 49 50 51 52 53 54 55 56 57 58 59 60
US government bond yields
Prime BA, 90days
US government bond yields 1920-29 average (4.09%, June 1959)
Prime BA, 90days 1920-29 average (4.13%, September 1959)
Oct '29 NY Stock Market Crash
Jun '50 KoreanWar
Dec '41 Pearl Harbor Attack
(%)
'33~New Deal
Source: FRB, Banking and Monetary Statistics 1914-1970 Vol.1, pp.450-451 and 468-471, Vol.2, pp.674-676 and 720-727
30
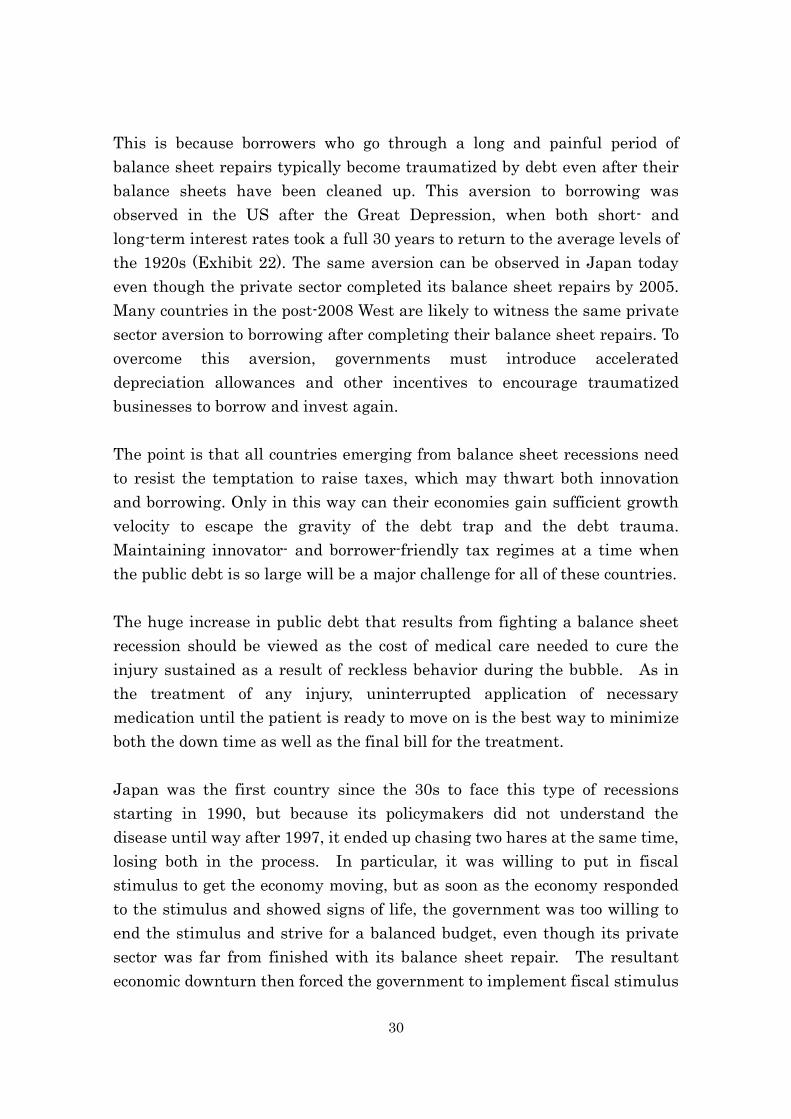
This is because borrowers who go through a long and painful period of
balance sheet repairs typically become traumatized by debt even after their
balance sheets have been cleaned up. This aversion to borrowing was
observed in the US after the Great Depression, when both short- and
long-term interest rates took a full 30 years to return to the average levels of
the 1920s (Exhibit 22). The same aversion can be observed in Japan today
even though the private sector completed its balance sheet repairs by 2005.
Many countries in the post-2008 West are likely to witness the same private
sector aversion to borrowing after completing their balance sheet repairs. To
overcome this aversion, governments must introduce accelerated
depreciation allowances and other incentives to encourage traumatized
businesses to borrow and invest again.
The point is that all countries emerging from balance sheet recessions need
to resist the temptation to raise taxes, which may thwart both innovation
and borrowing. Only in this way can their economies gain sufficient growth
velocity to escape the gravity of the debt trap and the debt trauma.
Maintaining innovator- and borrower-friendly tax regimes at a time when
the public debt is so large will be a major challenge for all of these countries.
The huge increase in public debt that results from fighting a balance sheet
recession should be viewed as the cost of medical care needed to cure the
injury sustained as a result of reckless behavior during the bubble. As in
the treatment of any injury, uninterrupted application of necessary
medication until the patient is ready to move on is the best way to minimize
both the down time as well as the final bill for the treatment.
Japan was the first country since the 30s to face this type of recessions
starting in 1990, but because its policymakers did not understand the
disease until way after 1997, it ended up chasing two hares at the same time,
losing both in the process. In particular, it was willing to put in fiscal
stimulus to get the economy moving, but as soon as the economy responded
to the stimulus and showed signs of life, the government was too willing to
end the stimulus and strive for a balanced budget, even though its private
sector was far from finished with its balance sheet repair. The resultant
economic downturn then forced the government to implement fiscal stimulus

31
again, only to repeat the same mistake over and over again.
The net result was an on-again, off-again treatment which is the worst type
of treatment for any injury or disease. The government also lost precious
time dealing with structural issues when the problem was with balance
sheets. Even though Japanese GDP never fell below the peak of the bubble
and its unemployment rate never rose higher than 5.5 percent during the
last 25 years thanks to government's fiscal actions, the net result was a
hugely lengthened recession and a massive build-up of public debt.
The Obama administration in the US, which understood the lessons from
Japan, strived to avoid the Japanese mistake of 1997 by issuing strong
warnings on premature fiscal consolidation via the term "fiscal cliff."
Indeed the US is the only country that managed to avoid Japan-like
double-dip recessions and policy diversion to less urgent structural issues.
As a result, its private sector balance sheets have improved significantly, and
its public sector deficit has shrunk to a quarter of post-GFC peak.
The Europeans who completely ignored the Japanese lesson and went
straight for fiscal consolidation thanks to the defective Maastricht treaty
ended up with huge losses of output and employment, with unemployment
rates reaching many times higher than those observed in Japan. The
inability of center-left and center-right parties to question the wisdom of
fiscal straightjacket imposed by the Treaty is also forcing many desperate
voters to seek help elsewhere, a dangerous sign in any democracy.
The above experiences of Japan, the US and the Eurozone suggest that even
though smaller deficits are more desirable than bigger deficits, there really
is no choice when it comes to fighting balance sheet recessions. Although
commentators who never understood balance sheet recessions will continue
to bash large deficits, uninterrupted application of sufficient fiscal stimulus
until private sector financial health is restored is the fastest and lowest-cost
treatment to overcome this economic malaise. Any attempt to save on
medical care when it is needed only prolong the suffering of the people while
increasing the final bill for the treatment.
32
Conclusion
Most conventional debate on economic growth assumes that there are always
borrowers and that those borrowers will step forward if only the central bank
lowers real interest rates far enough. This kind of thinking prompted Paul
Krugman, a Nobel laureate, to propose a 4 percent inflation target when the
original 2 percent target failed to produce the expected results4. Although
he was also a strong advocate of fiscal stimulus after 2008, his reliance on
monetary policy assumes that there are always investment opportunities
worth borrowing for, and that there are always borrowers with clean balance
sheets. Because of these two assumptions, it is assumed that constraints on
growth are chiefly on the lenders’ side. Economists have therefore
emphasized the use of monetary easing to remove possible constraints for
lenders while remaining cautious about excessive fiscal stimulus to avoid
crowding out private-sector investments.
These assumptions held reasonably well in the postwar era. But by
assuming there are always borrowers, economists have assumed away the
most critical challenges to economic growth, i.e., the questions of whether
there are sufficient investment opportunities and whether there are enough
businesspeople who are able and willing to take the risks entailed in those
investments.
Instead, they simply assumed a rate of long-term potential growth based on
the trend growth of capital and labor and argued that policy makers should
strive to bring the economy back to that growth path. They also assumed
rates of long-term productivity growth and technological innovation without
specifying how they were derived. But such potential growth rates mean
absolutely nothing when businesspeople on the ground are either unable
(because of balance sheet concerns) or unwilling (because of a lack of
investment opportunities) to borrow money and invest it. This also
suggests that conventional economics has no valid theory of economic
growth.
4 Robb, Greg, (2015). “Krugman: ‘Meh’ is grade Fed gets on QE,” Market Watch.
Published on Nov 9, 2015.
http://www.marketwatch.com/story/krugman-meh-is-grade-fed-gets-on-qe-2015-11-09
33
The advent of the balance sheet recession in Japan in 1990 and in Western
economies starting in 2008 has finally awakened some economists to the
possibility that borrowers can disappear when faced with daunting balance
sheet challenges, even at zero interest rates. Policy makers who understood
this, such as former Fed Chair Ben Bernanke and current Chair Janet Yellen,
issued strong warnings about the fiscal cliff to ensure that the government
served as “borrower of last resort” to keep the economy and money supply
from shrinking. Japanese Finance Minister Taro Aso also recognized this
danger and made a point of making fiscal stimulus the second “arrow” of
Abenomics. Their actions helped the post-2008 Japanese and US economies
in no small way.
In contrast, the utter failure of European policy makers to understand the
danger of balance sheet recessions led to extended suffering of its peoples
many of whom are beginning to lose hope in their center-left or center right
governments. However, if the Europeans accept two modifications to
Maastricht, not only their economies will recover, but their single currency
can also look forward to a long and bright future. They are (1) allow
member governments to borrow more than 3 percent of GDP when their
private sectors are saving more than 3 percent of GDP at zero interest rates,
and (2) introduce preferential risk weights for financial institutions holding
their own government bonds.
These two minor modifications will make the Treaty amenable to both
ordinary and balance sheet recessions by providing plenty of fiscal space to
member countries so that their self-corrective mechanism will work properly
to bring recovery to their economies. Since the proposed differentiated risk
weights apply only to holdings of domestic verses foreign government bonds,
they will not affect the efficient allocation of resources in the private sectors
of 19 countries made possible by the single currency.
Within economics circles, there is still not enough appreciation of the fact
that, apart from the early stages of industrialization, where there are plenty
of low-hanging investment opportunities, shortages of borrowers have
always had far more serious consequences than shortages of lenders. There
34
is also no reason to believe that there will be sufficient borrowers in the
future. This means tax regimes that were appropriate in earlier years when
there were numerous attractive investment opportunities may no longer be
optimal when those opportunities are exhausted and the country is at the
forefront of technology.
This may be particularly relevant in advanced countries where worthwhile
investment opportunities are much more difficult to find than in emerging
economies. In this case, the government must consciously direct fiscal
spending toward the development of cutting-edge technology—in effect
serving as the innovator of last resort.
Finally, there is a possibility that borrowers are absent because many of
them have balance sheet problems and those who do not have balance sheet
problems cannot find innovations to invest in. In that case, government must
act as both innovator and borrower of last resort by directing sustained and
sufficient fiscal stimulus toward the development of cutting-edge technology.
Here it is hoped that modern governments are better than emperors and
kings of the past at selecting projects that will ultimately pay for themselves.
Instead of assuming away the key challenges of economic growth and hiding
behind assumptions about the potential growth rate, it is time for the
economics profession to face this problem head-on. Availability of borrowers
should never be taken for granted.
35
References
Banca d' Italia. Financial Accounts.
Banco de España. Financial Accounts of the Spanish Economy.
Banco de Portugal. Financial Accounts.
Bank for International Settlements. (2014). 84th Annual Report.
http://www.bis.org/publ/arpdf/ar2014e.htm
_________. Residential Property Price Statistics.
Bank of England. M4 and M4 lending excluding intermediate OFCs.
_________. Notes and Coin and Reserves Balances.
Bank of Greece. Financial Accounts.
_________. Monetary Aggregates.
Bank of Japan. Deposits, Vault Cash, and Loans and Bills Discounted.
_________. Flow of Funds.
_________. Loans and Bills Discounted by Sector.
_________. Monetary Base.
_________. Money Stock.
_________. Reserves.
Board of Governors of the Federal Reserve System. (1976). Banking & Monetary
Statistics, 1914-1970. 2 vols. Washington D.C.
_________. Aggregate Reserves of Depository Institutions and the Monetary Base.
_________. Assets and Liabilities of Commercial Banks in the United States.
_________. Financial Accounts of the Unites States.
_________. Money Stock Measures.
Cabinet Office, Japan. Annual Report on National Accounts.
_________. Quarterly Estimates of GDP.
Central Bank of Ireland. Quarterly Financial Accounts.
Central Statistics Office, Ireland. Quarterly National Accounts.
Deutsche Bundesbank. Financial Account.
_________. Monetary Aggregates.
_________. Trade in Goods with Non-Residents.
European Central Bank. (2012). Mario Draghi’s Interview with Le Monde. Published
July 21. http://www.ecb.europa.eu/press/inter/date/2012/html/sp120721.en.html
_________. Minimum Reserves and Liquidity.
_________. Monetary Developments in the Euro Area.
_________. Unit Labour Costs.
Eurostat. (2014). “Provision of deficit and debt data for 2013 - first notification.” April 23.

36
http://epp.eurostat.ec.europa.eu/cache/ITY_PUBLIC/2-23042014-AP/EN/2-2304201
4-AP-EN.PDF
_________. Harmonised Indices of Consumer Prices.
Hellenic Statistical Authority. Quarterly National Accounts.
International Monetary Fund. (2010). “IMF Executive Board Approves €30 Billion
Stand-By Arrangement for Greece,” Press Release No. 10/187, on May 9, 2010.
https://www.imf.org/external/np/sec/pr/2010/pr10187.htm
_________. (2013a). Global Financial Stability Report: Old Risks, New Challenges. April.
_________. (2013b). “Unconventional Monetary Policies – Recent Experience and
Prospects.” 27. https://www.imf.org/external/np/pp/eng/2013/041813a.pdf
_________. (2013c). “Unconventional Monetary Policies – Recent Experience and
Prospects—Background Paper.”
http://www.imf.org/external/np/pp/eng/2013/041813.pdf
Italian National Institute of Statistics. Quarterly National Accounts.
Japan Real Estate Institute. Urban Land Price Index.
Koo, Richard. (2001). “The Japanese Economy in Balance Sheet Recession.” Business
Economics, National Association of Business Economists, Washington, D.C., April
2001.
_________. (2003). Balance Sheet Recession: Japan’s Struggle with Uncharted
Economics and its Global Implications. John Wiley & Sons: Singapore.
_________. (2008). The Holy Grail of Macro Economics: Lessons from Japan’s Great
Recession. John Wiley & Sons: Singapore.
_________. (2014). The Escape from Balance Sheet Recession and the QE Trap: A
Hazardous Road for the World Economy. John Wiley & Sons: Singapore.
_________ and Shigeru Fujita (1997), “Zaisei-saiken no Jiki wa Shijo ni Kike:
Zaisei-saiken ka Keiki-kaifuku ka (Listen to the Bond Market for the Timing of
Fiscal Reform).” In Shukan Toyo Keizai, February 8: 52-59.
Krugman, Paul (1998). “It’s Baaack: Japan’s Slump and the Return of the Liquidity
Trap.” Brookings Papers on Economic Activities 2. 137-205.
Maddison, Angus, "Historical Statistics of the World Economy: 1-2008 AD",
http://www.ggdc.net/maddison/Historical_Statistics/vertical-file_02-2010.xls
Ministry of Finance, Japan. Budget.
Ministry of Internal Affairs and Communications, Japan. Consumer Price Index.
National Statistics Institute, Spain. Quarterly Spanish National Accounts.
Office for National Statistics, UK. Consumer Price Inflation.
_________. United Kingdom Economic Accounts.

37
Real Estate Economic Institute, Japan. Kinki-Ken no Manshon Hanbai Doko (Report on
the sales of the condominiums in Kansai Area, Japanese only).
_________. Shuto-Ken no Manshon Hanbai Doko (Report on the sales of the
condominiums in Tokyo Metropolitan Area, Japanese only).
Robb, Greg, (2015). “Krugman: ‘Meh’ is grade Fed gets on QE,” Market Watch.
Published on Nov 9, 2015.
http://www.marketwatch.com/story/krugman-meh-is-grade-fed-gets-on-qe-2015-11-
09
Statistics Portugal. Portuguese National Accounts.
Summers, Lawrence H., (2009), “Rescuing and Rebuilding the US Economy: A Progress
Report.” Prepared remarks at the Peterson Institute for International Economics,
Washington D.C., July 17, 2009.
http://www.piie.com/publications/papers/paper.cfm?ResearchID=1264
S&P Dow Jones Indices. S&P/Case-Shiller Home Price Indices.
The Economist. (2005). “The global housing boom: In come the waves,” June 16.
http://www.economist.com/node/4079027
US Department of Commerce. Gross Domestic Product (GDP).