Gorundworks Stormwater Training Day 1
69
Day 1 Environmental Technical Training Program 2014
-
Upload
michael-clark -
Category
Environment
-
view
46 -
download
2
Transcript of Gorundworks Stormwater Training Day 1

Day 1
Environmental Technical Training Program 2014

Course Overview – First Day Introduction to Stormwater (90 min)
Hydrologic Cycle
Terminology
Soils
Pre and Post Construction
Rational Method
Group Problem (30 min)
Water Quality
Field Visit

Course Overview – Second Day Best Management Practices(90 min)
Hyrdologic Cycle
Soils
Design Concepts
Pre vs. Post Conditions
Group Problem (30 min)
Best Management Practices (90 min) Infiltration
Group Problem (30 min)
Field Visit


Hydrologic Cycle
The Hydrologic Cycle is the continuous process of water moving within the earth’s atmosphere, on the earth’s surface, and within the earth’s subsurface.
Atmosphere – Water Vapor. Reaches earth’s surface thru precipitation (rain, snow,
hail, and fog). Enters the earth’s subsurface thru infiltration.

Hydrologic Cycle
Ref: MA DEP Hydrologic Handbook for Conservation Commissioners, 2002

Stormwater and theHydrologic Cycle
Concerns
Surface Runoff – Water from precipitation that flows over the ground surface.
Groundwater Recharge – The water that infiltrates into the ground.

Stormwater andthe Hydrologic Cycle
Runoff
Increased volume changes wetland ecosystems.
Increase flooding.
Increased erosion.
Recharge
Decreased groundwater available for surface water.
Decreased water available for drinking water.

Terminology (The language of stormwater) Stormwater – Stormwater is the water that runs off surfaces
such as rooftops, paved streets, highways, and parking lots. It can also come from hard grassy surfaces like lawns, play fields, and from graveled roads and parking lots.
Non-Point Source Pollution: Pollutants from many diffuse sources. Nonpoint-source pollution is caused by rainfall or snowmelt moving over and through the ground. As the runoff moves, it picks up and carries away natural and human-made pollutants, finally depositing them into lakes, rivers, wetlands, coastal waters, and even underground sources of drinking water.

Terminology (The language of stormwater) Runoff - Water from precipitation that flows over the
ground surface. Recharge -The water that infiltrates into the ground. Stormwater – Best Management Practices (BMPs) - Activities or
structural improvements that help reduce the quantity and improve the quality of stormwater runoff.
Impervious Surface or Cover: The characteristic of a material which prevents the infiltration of liquid through it. This may apply to roads, streets, parking lots, rooftops and sidewalks.

Terminology (The language of stormwater)
Watershed: Geographical area that drains to a specified point on a water course, usually a confluence of streams or rivers, can also be known as drainage area, catchments, or a river basin.
Detention - Release of surface and storm water runoff from the site at a slower rate than it is collected by the drainage facility system, the difference being held in temporary storage.
Drainage - The collection, conveyance, containment, and/or discharge of surface and storm water runoff.

SOILS

SOILS

SOILSFour hydrologic groups are used. In the definitions to follow, the infiltration rate is the rate at which water enters the soil at the surface and which is controlled by surface conditions. The hydrologic soil groups, as defined by NRCS are:
A. (Low runoff potential) Soils having high infiltration rates even when thoroughly wetted and consisting chiefly of deep, well to excessively drained sands or gravels.
B. Soils having moderate infiltration rates when thoroughly wetted and consisting chiefly of moderately deep to deep, moderately well-to-well drained soils with moderately fine to moderately coarse textures.
C. Soils having slow infiltration rates when thoroughly wetted and consisting chiefly of soils with a layer that impedes downward movement of water, or soils with moderately fine to fine texture.
D. (High runoff potential) Soils having very slow infiltration rates when thoroughly wetted and consisting chiefly of clay soils with a high swelling potential, soils with a permanent high water table, soils with a clay pan or clay layer at or near the surface, and shallow soils over nearly impervious material.

SOILS
Hydrologic Soil Group Infiltration (Inches/Hour)
A Exceeds 5.7
B 5.7 to 1.4
C 1.4 to 0.14
D Less than 0.14

Infiltration Rates – Rule of thumb Class A Soils – 5 to 8 in/hour: Sand, Loamy Sand,
Sandy Loam (well to excessively drained)
Class B Soils – 1 to 2 in/hour: silt loam, loam (moderately to well drained)
Class C Soils – 0.1 to 0.5 in/hour: Sandy clay loams (slow infiltration)
Class D Soils – no infiltration.

SOILS
Ref: MA DEP Hydrologic Handbook for Conservation Commissioners, 2002

Soil SurveyNRCS Soils Map
http://websoilsurvey.nrcs.usda.gov/app/

Cohasset, MA

Cohasset MA


Pre and Post Development

Pre and Post Development

A 100-year storm refers to rainfall totals that have a one percent probability of occurring at that location in that year. Encountering a "100-year storm" on one day does not decrease the chance of a second 100-year storm occurring in that same year or any year to follow. In other words, there is a 1 in 100 or 1% chance that a storm will reach this intensity in any given year. Likewise, a 50-year rainfall event has a 1 in 50 or 2% chance of occurring in a year. In addition, each locality has its own criteria for how much rain must fall within 24 hours to classify as a particular rain event. See chart below for other rainfall events.
What is a 100-year storm?

What is a 100-year storm?Storm Intervals and Probabilities
OccurrenceInterval (years)
Probability inAny Year
Percent Chancein Any Year
100 1 in 100 1%
50 1 in 50 2%
25 1 in 25 4%
10 1 in 10 10%
5 1 in 5 20%
2 1 in 2 50%

ESTIMATING RUNOFF QUANTITIES
Runoff = Rainfall – Interception – Infiltration – Depression Storageor simplified
Runoff = Rainfall - Infiltration

ESTIMATING RUNOFF QUANTITIESVolume
A parking lot has an area equal to a football field. It is 360 feet long by 160Feet wide. An inch of rain falls on the parking lot of a course of an hour. a.) What is the volume in cubic feet?b.) What is the volume in acre-feet?c.) What is the volume in gallons?
a.) Volume = (360-feet)(160-feet)(1-inch) (1-foot/12-inches)Volume = 4,800 cubic feet = a cube with 17 foot sides
b.) Volume = (4,800 cubic feet)(1 acre/43,560 square feet) = 0.11 acre-feet
c.) Volume = (4,800 cubic feet)(7.48 gallons/cubic foot) = 36,000 gallons Three to Four large tankers.

RUNOFF RATE
The runoff rate is the volume of runoff from a watershed over a period if time. Usually measured as cubic feet per second.
Depends on:
Ground surface roughness
Slope
Distance of travel
Higher rates increase flooding and erosion.

Finding Runoff Rates
One way is the Rational Method. Watersheds less than 20 acres. Used to size pipes. Other methods are available.
We will review the Rational Method to for the purposes of determining what information is important.

Rational Method
Rational formula is:
q = C ∙ i ∙ A
q = Peak rate of runoff – cubic feet per second
C = Runoff coefficient
i = Rainfall intensity
A = Watershed area in acres

Rational Method
Determine Runoff coefficient.
Parking Lot – Use asphalt streets 0.7 to 0.95. Use 0.85.
Sandy soils - .05 to 0.10
Use 0.10.

Rational Method
Intensity – Duration – FrequencyCurve
Pick a duration, and a frequency,then determine amount of rain in that time period.

Rational Method
Intensity – Duration – FrequencyCurve
Pick a duration, and a frequency,then determine amount of rain in that time period.
Duration– 1 hour.

Rational Method
Intensity – Duration – FrequencyCurve
Pick a duration, and a frequency,then determine amount of rain in that time period.
Duration– 1 hour.Frequency – 2 years

Rational Method
Intensity – Duration – FrequencyCurve
Pick a duration, and a frequency,then determine amount of rain in that time period.
Duration– 1 hour.Frequency – 2 yearsIntensity – 1.2 Inches per hour
i = 1.2 in/hr

Runoff Curve Numbers
Runoff curve numbers for theNRCS Methods.


ProblemSite is 2 acres. The difference in elevation across site is 5 feet. The length of the site is 400 feet. The soil is sand.
It is currently a grassed area. It will all be paved as a parking lot.
Determine slope = difference in slope/length

ProblemSite is 2 acres. The difference in elevation across site is 5 feet. The length of the site is 400 feet. The soil is sand.
It is currently a grassed area. It will all be paved as a parking lot.
Determine slope = difference in slope/length
= 5 feet/400 feet

ProblemSite is 2 acres. The difference in elevation across site is 5 feet. The length of the site is 400 feet. The soil is sand.
It is currently a grassed area. It will all be paved as a parking lot.
Determine slope = difference in slope/length
= 5 feet/400 feet
= 0.012 feet/foot or 1.2 %

ProblemSite is 2 acres. The difference in elevation across site is 5 feet. The length of the site is 400 feet. The soil is sand.
It is currently a grassed area. It will all be paved as a parking lot.
Slope = 1.2%

Rational Method
Determine Runoff coefficient.
Parking Lot – Use asphalt streets 0.7 to 0.95. Use 0.85.
Sandy soils, flat - .05 to 0.10
Use 0.10.

ProblemSite is 2 acres. The difference in elevation across site is 5 feet. The length of the site is 400 feet. The soil is sand.
It is currently a grassed area. It will all be paved as a parking lot.
Slope = 1.2%
CExisting = 0.1 CProposed = 0.85
Area = 2 acres
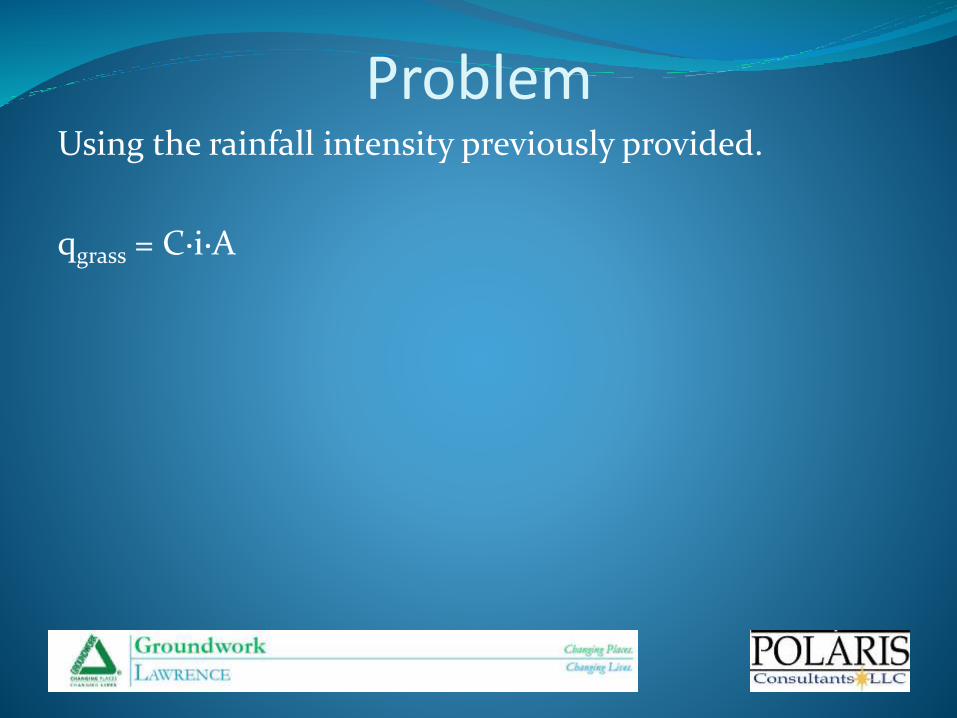
ProblemUsing the rainfall intensity previously provided.
qgrass = C∙i∙A

ProblemUsing the rainfall intensity previously provided.
qgrass = C∙i∙A = 0.10

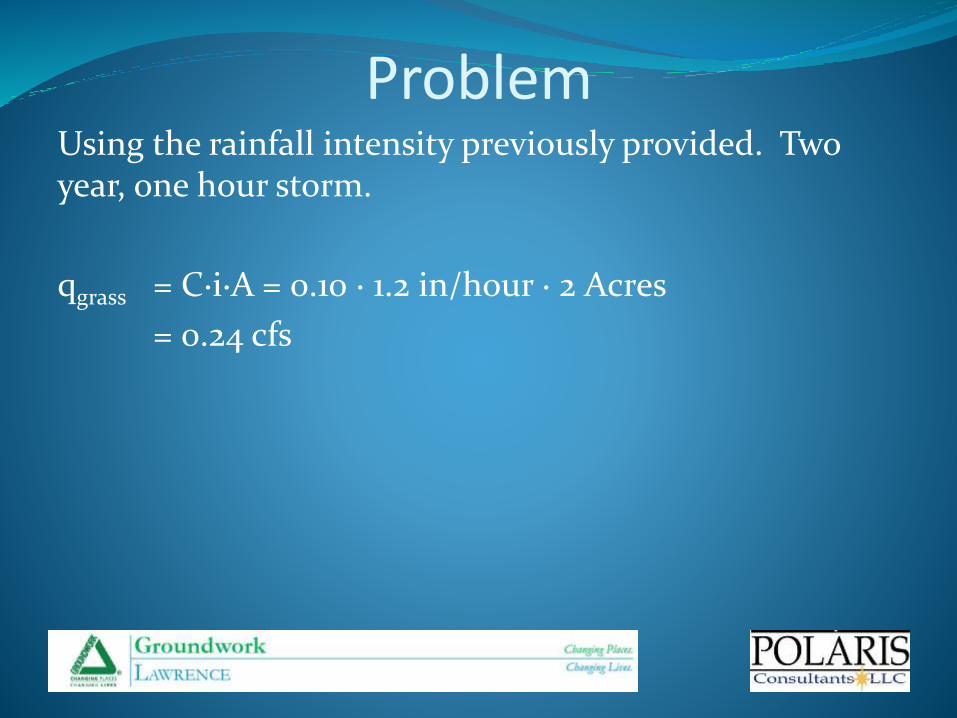
ProblemUsing the rainfall intensity previously provided. Two year, one hour storm.
qgrass = C∙i∙A = 0.10 ∙ 1.2 in/hour ∙

ProblemUsing the rainfall intensity previously provided. Two year, one hour storm.
qgrass = C∙i∙A = 0.10 ∙ 1.2 in/hour ∙ 2 Acres
ProblemUsing the rainfall intensity previously provided. Two year, one hour storm.
qgrass = C∙i∙A = 0.10 ∙ 1.2 in/hour ∙ 2 Acres
= 0.24 cfs

ProblemUsing the rainfall intensity previously provided. Two year, one hour storm.
qgrass = C∙i∙A = 0.10 ∙ 1.2 in/hour ∙ 2 Acres
= 0.24 cfs
qparking lot = C∙i∙A = 0.85 ∙ 1.2 in/hour ∙ 2 Acres
= 2.04 cfs
8.5 times more runoff

WATER QUALITYWater is essential to human life and to the health of theenvironment. As a valuable natural resource, itcomprises marine, estuarine, freshwater (river and lakes)and groundwater environments, across coastal andinland areas. Water has two dimensions that are closelylinked - quantity and quality. Water quality is commonlydefined by its physical, chemical, biological andaesthetic (appearance and smell) characteristics. Ahealthy environment is one in which the water qualitysupports a rich and varied community of organisms andprotects public health. Water quality in a body of waterinfluences the way in which communities use the water.

More specifically, the water may be used by the communityfor:
1. supplying drinking water
2. recreation (swimming, boating)
3. irrigating crops and watering stock
4. industrial processes
5. navigation and shipping
6. production of edible fish, shellfish and crustaceans
7. protection of aquatic ecosystems
8. wildlife habitats
9. scientific study and education
WATER QUALITY

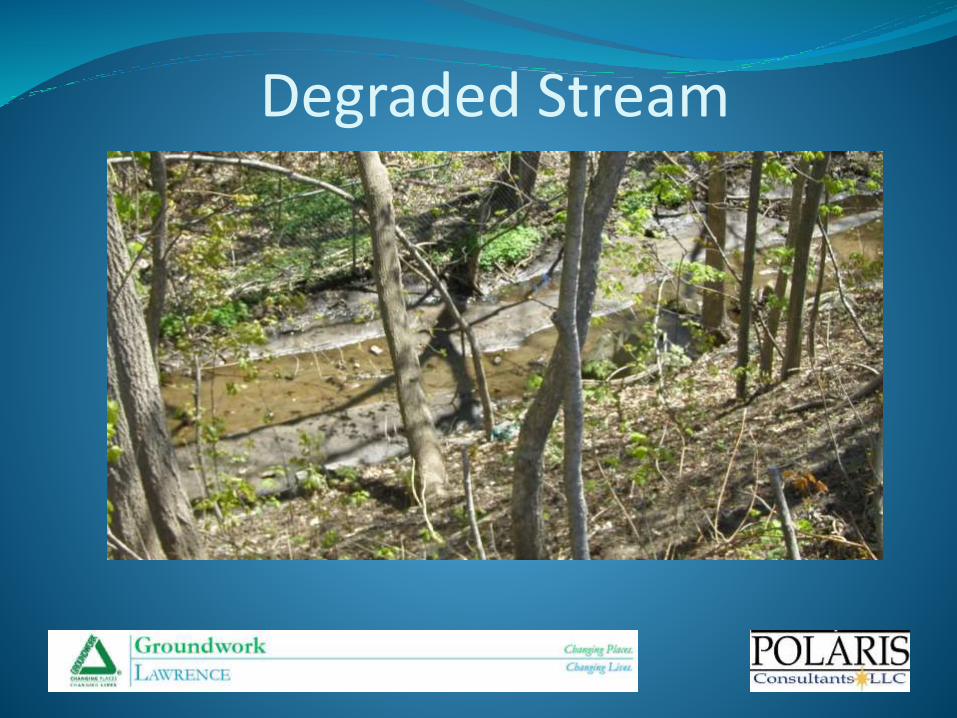
Degraded Stream

Stormwater Pollutants
Oils and Greases
Metals
Sediments
Oxygen-Demanding Substances
Nutrients
Toxic Organic Compounds
Fecal Coliform Bacteria
pH
High Tempature

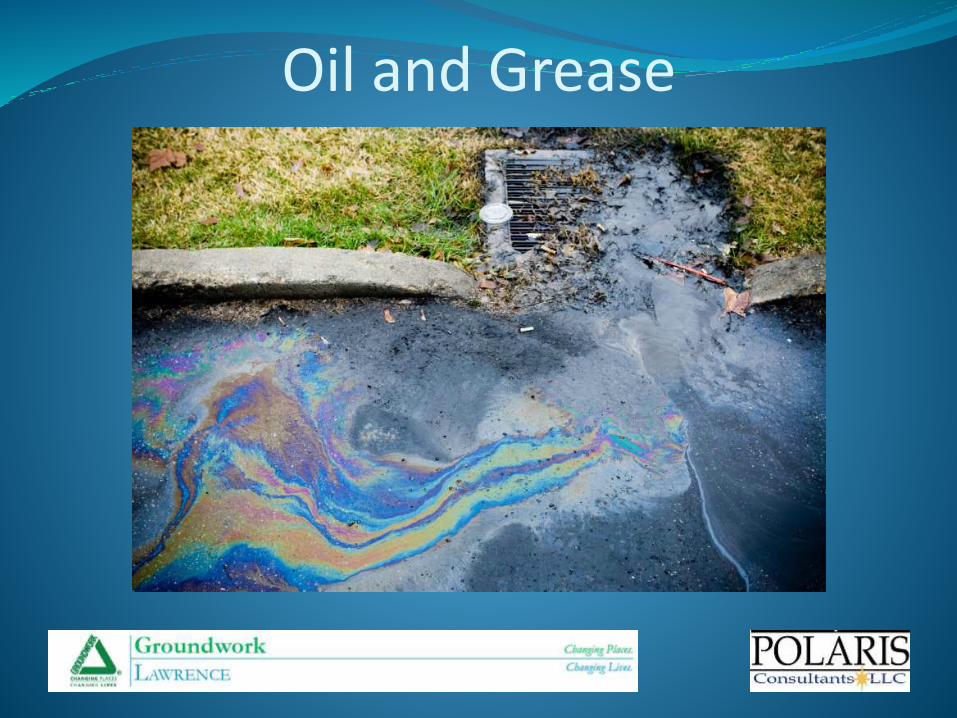
Oils and greases are a common component of stormwater runoff pollutants, primarily because there are so many common sources: streets and highways, parking lots, food waste storage areas, heavy equipment and machinery storage areas, and areas where pesticides have been applied. The familiar sight of a rainbow-colored puddle or trickling stream in parking lots, driveways, and street gutters is a reminder of the presence of oils and greases in stormwater runoff. Oils and greases can be petroleum-based or food-related (such as cooking oils). No type of oil or grease belongs in surface water. Oil and grease are known to be toxic to aquatic organisms at relatively low concentrations; they can coat fish gills, prevent oxygen from entering the water, and clog drainage facilities (leading to increased maintenance costs and potential flooding problems)
Oil and Grease
Oil and Grease

MetalsMany heavy metals, including lead, copper, zinc and cadmium, are commonly found in urban runoff. Metals can contaminate surface and ground waters and concentrate in bottom sediments, presenting health problems for fish and animals that eat from the bottom. Reproductive cycles of bottom-dwelling species can be severely reduced, and fish inhabiting such metal-contaminated locations often exhibit lesions and tumors. Metals can also contaminate drinking water supplies. Industrial areas, scrap yards, paints, pesticides, and fallout from automobile emissions are typical sources of heavy metals in runoff.

Metals
Copper and other common heavy metal dust are produced during normal automobile use. These fine particulates settled onto paved surfaces and add to the vehicular impact.

SedimentsSediment - often originating as topsoil, sand, and clay - is the most common pollutant in stormwater runoff by volume and weight. Sediments readily wash off paved surfaces and exposed earth during storms. Sediment may seem harmless enough, but it poses serious problems in the water. Excess sediment concentrations turn stream and lake water cloudy, making it less suitable for recreation, fish life, and plant growth. Sediment is of particular concern in fish bearing streams where it can smother trout and salmon eggs, destroy habitat for insects (a food source for fish), and cover prime spawning areas. Uncontrolled sediment can also clog storm drains, leading to increased private and public maintenance costs and flooding problems. Sediment is also of concern because many other pollutants including oils, metals, bacteria, and nutrients tend to attach to soil particles. Therefore when sediments enter water they usually carry other pollutants with them. Cleared construction sites and exposed earth are generally the greatest contributors of soil particles in surface waters. Other sources include erosion from agricultural lands, application of sand and salts to icy roads, fallout from pressure washing and sandblasting operations, dirt from equipment and vehicles, and dirt and grit from parking lots, driveways, and sidewalks

Sediments

Nutrients
Nutrients such as phosphorus and nitrogen are needed by plants to grow, but high levels can be harmful to water quality. Excess nutrient levels can over-stimulate the growth of algae and other aquatic plants, resulting in unpleasant odors, unsightly surface scums, and lowered dissolved oxygen levels from plant decay. Nutrients are most likely to pose a problem in slow moving water such as lakes or sluggish streams. Some forms of algae are toxic to fish and other aquatic organisms and may even cause death in animals that drink affected water. Algae can also cause taste and odors problems in drinking waters, foul-smelling odor in ponds and lakes, and problems with clogged water intakes, drains, and pipes. Heavy loading of nutrients into slow-moving waters can adversely affect many beneficial uses of the water. Forms of nitrogen (ammonium), in combination with pH and temperature variations, can cause water quality problems and be toxic to fish. This process consumes large amounts of oxygen in the water and subsequently stresses or kills fish and other aquatic organisms when oxygen levels are reduced. Ammonia toxicity, due to nitrogen in its ammonium form, can harm fish and other aquatic organisms.Fertilizers, animal wastes, failing septic systems, detergents, road deicing salts, automobile emissions, and organic matter such as lawn clippings and leaves are all contributors to excessive nutrient levels in urban and agricultural stormwater runoff.

Nutrients

Toxic Organic Compounds
Pesticides and PCBs are toxic organic compounds that are particularly dangerous in the aquatic environment. Excessive application of insecticides, herbicides, fungicides, and rodenticides, or application of any of these shortly before a storm, can result in toxic pesticide chemicals being carried from agricultural lands, construction sites, parks, golf courses, and residential lawns to receiving waters. Many pesticide compounds are extremely toxic to aquatic organisms and can cause fish kills. PCBs are a similar class of toxic organic compounds. They can contaminate stormwater through leaking electrical transformers. PCBs can settle in sediments of receiving waters and, like pesticide compounds, present a serious toxic threat to aquatic organisms that come in contact with them. Many other toxic organic compounds can also affect receiving waters. These toxic compounds include phenols, glycol ethers, esters, nitrosamines, and other nitrogen compounds. Common sources of these compounds include wood preservatives, antifreeze, dry cleaning chemicals, cleansers, and a variety of other chemical products. Like pesticides and PCBs these other toxic organic compounds can be lethal to aquatic organisms.

Toxic Organic Compounds

Fecal Coliform Bacteria
Fecal coliform bacteria in water may indicate the presence of pathogenic (disease-causing) bacteria and viruses. Pet and other animal wastes, failing septic systems, livestock waste in agricultural areas and on hobby farms, and fertilizers can all contribute fecal coliform bacteria. This can be a problem for treatment of drinking water and can limit recreational use of a water body. Bacterial contamination has led to closures of numerous shellfish harvesting areas and public swimming beaches in Puget Sound.

Fecal Coliform Bacteria

High Temperature
Rainfall falling on roofs and pavementsWhich have been heated by the sun willbe heated by these surfaces. The hightemperatures of this runoff can belethal to fish and other creatures/.

The ProblemConventional Development Smart Development
Reduce land clearing and grading costs
Reduced infrastructure costs
Protect regional water quality
Reduce stormwater runoff
The
Solution
Impacts on open space