Gordonvale State School Queensland State School Reporting ...€¦ · Gordonvale State School...
17
Gordonvale State School Queensland State School Reporting 2014 School Annual Report Postal address PO Box 103 Gordonvale 4865 Phone (07) 4043 3666 Fax (07) 4043 3600 Email [email protected] Webpages Additional reporting information pertaining to Queensland state schools is located on the My School website and the Queensland Government data website. Contact person Lloyd Perkins Principal’s foreword Introduction Gordonvale State School is committed to our school vision which is focussed on creating active and informed citizens for the 21st century. Our vision identifies five key areas for building the citizenship skills of our students. These areas are Positive Identity and Relationships; Thinking, Reasoning and Communicating; Creativity; Citizenship and Democratic Processes and Sustainability. These fundamental principles and values are encapsulated in the Five Citizens Roles: Healthy Citizen; Creative Citizen; Eco Citizen; Informed Citizen and Democratic Citizen. In order to achieve our vision we are growing a culture based upon a positive caring environment; high standards of work, behaviour and uniform; innovative and individualised learning pathways and high levels of student support. The 2014 School Annual Report highlights important measures of school improvement and includes comment to qualify performance data in each of the above listed 5 key areas of our vision. The common measures applied in this report match the Department of Education’s Strategic Plan and are consistent with that reported in all state schools. Student NAPLAN results and school Financial information are located at the Australian Curriculum and Reporting Authority’s (ACARA) Website, MySchool. If you read this report electronically, click on the highlighted links to quickly access MySchool. I trust you will find reading about our school’s progress towards it’s improvement goals and reviewing the results detailed in this Annual report both informative and enjoyable. We are proud of what we are achieving at Gordonvale State School.
Transcript of Gordonvale State School Queensland State School Reporting ...€¦ · Gordonvale State School...

Gordonvale State School
Queensland State School Reporting
2014 School Annual Report
Postal address PO Box 103 Gordonvale 4865
Phone (07) 4043 3666
Fax (07) 4043 3600
Email [email protected]
Webpages
Additional reporting information pertaining to Queensland
state schools is located on the My School website and the
Queensland Government data website.
Contact person Lloyd Perkins
Principal’s foreword
Introduction
Gordonvale State School is committed to our school vision which is focussed on creating active and
informed citizens for the 21st century. Our vision identifies five key areas for building the citizenship
skills of our students. These areas are Positive Identity and Relationships; Thinking, Reasoning and
Communicating; Creativity; Citizenship and Democratic Processes and Sustainability.
These fundamental principles and values are encapsulated in the Five Citizens Roles: Healthy Citizen;
Creative Citizen; Eco Citizen; Informed Citizen and Democratic Citizen. In order to achieve our vision
we are growing a culture based upon a positive caring environment; high standards of work, behaviour
and uniform; innovative and individualised learning pathways and high levels of student support.
The 2014 School Annual Report highlights important measures of school improvement and includes
comment to qualify performance data in each of the above listed 5 key areas of our vision. The common
measures applied in this report match the Department of Education’s Strategic Plan and are consistent
with that reported in all state schools. Student NAPLAN results and school Financial information are
located at the Australian Curriculum and Reporting Authority’s (ACARA) Website, MySchool. If you read
this report electronically, click on the highlighted links to quickly access MySchool.
I trust you will find reading about our school’s progress towards it’s improvement goals and reviewing
the results detailed in this Annual report both informative and enjoyable. We are proud of what we are
achieving at Gordonvale State School.

School progress towards its goals in 2014
The 2014 Annual Implementation Plan identified 6 areas for focused work.
Improving teaching
Refining and embedding data based decision making
Refining and embedding planning and accountability systems at all leadership levels
Connecting parents and caregivers with their children’s learning
Aligning school policies and practices with the ‘Disabilities Standards for Education’
requirements
School Wide Positive Behaviour System
Improving teaching
Four strategies were further developed in 2014 to improve the quality of teaching in our school.
a. Explicit teaching practices in all classrooms
b. The teaching of reading, writing and numeracy
c. Teachers refining and embedding the C2C curriculum and foundation learning programs
d. Leaders coaching and supervising teachers
During 2014 a significant piece of improvement work at Gordonvale State School has been the
continued refinement of the Explicit Teaching and Consolidation pedagogies. This consistent
pedagogical platform across the school is a key strategy for improving learning outcomes for students
and is described in our Pedagogical Framework. By the end of 2014 all teachers had commenced
implementing these pedagogies in their classrooms in English and Mathematics. All teachers had
access to published models for both pedagogies including standards of practice, as part of the
published Pedagogical Framework. All teachers had participated in professional development to
understand the framework and how it is implemented.
Staff turnover, changes of year level taught and a commitment to high quality teaching prompted our
focus for the 2015 Annual Implementation Plan to continue this strategy as significant work.
School programs continued to focus on the systematic teaching of Reading, Writing and Numeracy. In
Prep – Year 3, teachers implemented a structured program of instruction that was supported with skilled
teachers aides and additional teachers. A greater focus on practicing reading complemented the skills
teaching focus of the program. Reach the Peak, a literacy skill recovery program, was delivered each
term to students whose performance was below benchmark.
The Great Results Guarantee provided resources that enabled the establishment of the OLEY (Oral
Language Early Years) program in the Prep year. A rigorous implementation plan set the program up to
successfully increase children’s skills and the evaluation plan delivered the data to conclude the aim
was achieved. The program, and its complement, POLLEY will run again in 2015.
All teachers refined and embedded the C2C curriculum and foundation learning programs. All teachers
implemented the Australian English, Mathematics, Science and History curriculum via these resources.
The C2C is derived from the Australian Curriculum. We continued to deliver foundational learning
programs – Spelling Mastery, EMMS and JEMMS. These programs support learning at appropriate
Australian Curriculum levels. Teachers were supported in this work by the Head of Curriculum.
The teaching of reading, writing and numeracy continue to be our core business and as such are a
focus for continuous improvement. The 2015 AIP includes specific work in Numeracy, lead by the

Master Teacher, a refocus on comprehension including a framework for skills teaching and professional
development for teachers to sharpen the feedback to assist students improve the quality of their writing.
All teachers were visited and formally observed at least 4 times in the year, some more often. All
teachers received written feedback about their work from supervisors. Selected teachers participated in
the regional Explicit Teaching Coaching program. We also commenced a peer coaching program within
the school.
Developing the skills and knowledge of our teachers is an investment in improving student learning
outcomes. The Coaching process is proven to yield quality results and supervision is critical to ensure
programs and practices are in place. This strategy continues in 2015, underpinning much of the work
within the AIP.
Refining and embedding data based decision making
a. Using data to set school benchmarks, targets and short term individual student goals
b. Measuring and monitoring school and student improvement
Throughout 2014, teachers used student learning data to inform learning programs and to compile
written reports on student progress twice in the year. In prep – year 2, key literacy indicators : phonic
knowledge, sight words recognition, reading level, were checked and reviewed weekly. Reach the
Peak measured student learning at commencement, the fifth week and the final (10th) week of the
program. This information was reported to parents at each stage. Student learning data was also
collected through schoolwide systems. This data assisted decision making regarding literacy and
numeracy programs across the school. All students new to the school were benchmarked for spelling
performance to influence Spelling mastery group placement.
NAPLAN results were reviewed to inform the 2015 AIP. A comprehensive review of the reading
program as part of the school’s Internal review, drew on student learning data to form conclusions and
make recommendations for 2015. Additional school performance indicator data was made available
through the performance Management branch in Central Office. These “Headline” indicators have been
used to inform the 2015 AIP.
External auditors completed a Teaching Learning and Discipline Audit early in the 2014 year, providing
feedback about school improvement described as commendations, affirmations and recommendations.,
influencing our 2015 AIP. Both audits identified our school as high performing, third position on a four
point scale. The reports are available on our website.
Refining and embedding planning and accountability systems at all leadership levels
Staff reporting relationships were clarified and documented in the school’s Organisational Chart. All
(classified officers) school leaders developed Specific Role Descriptions and Annual Action Plans to
plan, prepare, and account for actions against their areas of responsibility. Work progress reviews
were planned as part of the process, but were not implemented.
The Performance Development Process was implemented to stage 2 for all classroom teaching staff.
School leaders prepared school planning documentation, Annual Implementation Plan and School
Improvement Plan and lead an internal school review in term 4. The results of the review were used
to shape the 2015 AIP.
The 2015 AIP will continue with elements of this strategy to refine the school management systems
currently in place. Work will focus on the development of SRD and AAP for all school leaders, the

development of the leadership team using Team membership and Team leadership tools and the
development of work progress reviews.
Connecting parents and caregivers with their children’s learning
Teachers met all reporting requirements and continued class newsletters as a strategy to increase
communication. The use of the P&C Facebook page and School App for advertising of events
increased. The electronic distribution of the newsletter “SCHOME” occurred fortnightly throughout the
year. The Principal met weekly with the P&C president and attended all P&C meetings, delivering a
written report and account of the school’s financial position by providing the Budget Overview Report.
Weekly meetings with the Parents and Community Engagement team supported the attendance system
while in semester 1, weekly meetings with the Circles of Care program coordinator supported broader
parent engagement. A Fathers and kids breakfast was hosted to coincide with national Closing The
Gap day, drawing 23 dads and their children. We connected with Dr George Otero, an international
consultant to Education Queensland in the field of engaging parents in schools and their children’s
education.
In 2015 we’ll continue this important strategy and partner with Dr George Otero build relational learning
and relational leadership principles into our practice. With an Early Years Centre to be built on site,
2015 will see an opportunity to focus on building practices and strategies that support transition.
Aligning school policies and practices with the ‘Disabilities Standards for Education’
requirements
In 2014 we merged the complementary work of our Special
Education team with the work of our Learning Support team
to reduce duplication, improve access to resources and to
proved better collegial support for teachers. This change
brought teachers, guidance officer, school chaplain and
school leaders work together. We audited our school
practices to check how inclusive of people with a disability
they are. This work was mostly complete by the end of the
year and is planned to lead to the development of improved
practices in 2015. For example, ensuring that at enrolment,
all electronic student records are available for perusal.
We moved from a system of allocating the additional
resources of the special education program only to those
students with verified disabilities, to including other children
whose characteristics fall within the definition of disability
under the act.
In 2015 we’ll use newly available staffing resources to add a
behaviour management position to the team. The 2015 AIP
includes strategies to increase the level of personalisation of learning for students, especially those with
a disability or learning difficulty.
School Wide Positive Behaviour System
Throughout 2014, the SWPB system was supported by a representative team of staff. Their work was
planned and published in the annual Action Plan. The team held fortnightly meetings to monitor and
review activity and to include new work a sit emerged. The Discipline Audit, early in the year,

highlighted the effectiveness of this team approach. Annual review of the plan included surveys of
students and community and data analysis using the information stored electronically in our school
database.
The development of a culture that supports learning is vital in our school. To this end, the SWPBS
strategy will remain an important aspect of school improvement in 2015. The SWPBS team will
continue to develop an annual Action Plan and monitor effectiveness of work using the annual
surveys.
Student enrolments have increased and learning results continued to improve in 2014. Some of the
results and endeavours from 2014 are included in this report. This annual report includes commentary
about our commitments for 2015.
Gordonvale State School continues to be recognised as a school promoting sustainability. Our many
awards at a state and national level attest to this. One of the greatest attributes of Gordonvale State
School is our integration with our local community. We are proud to have been providing an excellent
academic service for over 100 years.
Future outlook
In 2015, we’ve returned to creating a 3 year strategic plan from which our annual plan is drawn. The
plan identifies the following priorities :
Improving Teaching
o Reading
o Writing
o Numeracy
o Science
Student Attendance
Closing the gap between attendance and outcomes for indigenous and non- indigenous
students
Student achievement
Connecting parents and Caregivers to their children’ learning
Transition Student Behaviour
The critical improvement work of the Annual implementation Plan is :
Improving Teaching
We want to develop the capacity of every teacher in our school to deliver our signature pedagogies,
Explicit Teaching and Consolidation, to a level of performance beyond competence. To do this we’ll
invest in supervision, coaching and professional development. We want the best teachers for
Gordonvale students.
Reading
Quality classroom teaching of the Big 6 skills of reading using evidence based programs.
Building staff capacity to implement consistent curriculum and pedagogy (Explicit Teaching,
Consolidation) to meet the learning needs of all students.

Writing
Quality classroom teaching of writing focusing on language features. Teaching the skills for
writing in specific structured lessons that are a component of the English program.
Building staff capacity to implement consistent curriculum and pedagogy (Explicit Teaching,
Consolidation) to meet the learning needs of all students.
Numeracy
Develop a whole school numeracy plan.
Collect, manage and interpret data to set school benchmarks, targets and short term individual
student goals.
Student Achievement
We want to see a high rate of student success in the key areas of English, Mathematics and
Science. In 2015 we’ll continue to critically analyse our student achievement data to identify
patterns and trends that will help us target work towards lifting the rate of children achieving a
C standard or better in English, Mathematics and Science to greater than 75%.
Include rating Effort in the Standards of Practice in the Pedagogical Framework.
Connecting Parents and Caregivers to their children's learning
Connecting parents and caregivers with their children’s learning is crucial if our students are to take
advantage of their parent’s skills, talents and knowledge. In 2015 we’ll work to help parents learn more
about what we do so that they may be more informed, more supportive and more understanding of how
things they do at home impact positively on learning in school.
Increase parent knowledge of the alignment of family and school routines and values.
Transition
The quality of the links that we have with Early Childhood Education and Care providers can influence
the ongoing success of our youngest school children. Throughout 2015 we want to better understand
our incoming students, prior to them getting here and have made connections with their parents that
enable communication.
Build Kindy connections to Prep.

Our school at a glance
School Profile
Coeducational or single sex: Coeducational
Year levels offered in 2014: Prep Year - Year 6
Total student enrolments for this school:
Total Girls Boys
Enrolment Continuity
(Feb – Nov)
2012 606 300 306 88%
2013 608 290 318 92%
2014 603 286 317 90%
Student counts are based on the Census (August) enrolment collection.
Characteristics of the student body:
The student body is a mixture of local children whose families have attended the school for several
generations, and children who have recently settled in the town due to new housing developments on
the western side of the Bruce Highway. The school caters for students from across the Mulgrave District
including the Yarrabah Aboriginal Community, Aloomba, Goldsborough Valley, Little Mulgrave Valley,
East Trinity, Edmonton, Bentley Park and White Rock.
An enrolment management plan was enacted in late 2014, restricting 2015 enrolment eligibility to those
within the catchment. Over time this will all but eliminate Hambledon, Bentley Park, Whiterock as
significant contributors to enrolment. The majority of students are Caucasian and 30% of students are
Indigenous. The school caters for an increasing number of students with special needs and they are
included into mainstream classes. Most students attend Gordonvale State High School for secondary
schooling.
Average class sizes
Phase
Average Class Size
2012 2013 2014
Prep – Year 3 22 21 21
Year 4 – Year 7 Primary 25 27 26
Year 7 Secondary – Year 10
Year 11 – Year 12
School Disciplinary Absences
Disciplinary Absences
Count of Incidents
2012 2013 2014*

# Exclusion is an abbreviated title which reflects suspensions with recommendations for exclusion, which may result in an exclusion or be set aside
through an appeals process.
* Caution should be used when comparing 2014 data with previous years SDA data as amendments to the disciplinary provisions in the Education
(General Provisions) Act 2006, passed in late 2013, created a time series break.
Curriculum offerings
Our distinctive curriculum offerings
We offer a Literacy catch up program to our students in Prep to year 3. Reach the Peak is run in 10
week blocks, 4 afternoons a week. Parents are offered and must agree to placement of their child in the
program. Personalised learning plans are created for each student and published for parents. They are
monitored and reported on 3 times over the course of the program.
Extra curricula activities
Student Leadership - Gordonvale State School has a strong and vibrant school leadership structure.
School Captains are elected by Years 4-5 students at the end of the year after candidates have been
short listed following an interview with school leaders. The school is represented by School Captains,
House Captains and Vice Captains.
Excelsior Program: The Whole Community Approach to Sustainability - Our Excelsior Program is
a curriculum initiative that provides the opportunity for students in Years 4 – 6 who are working at a very
high academic level to be further extended and challenged. These students also display excellent
behaviour and work ethic in the classroom. Embedded in the Key Learning Areas the underlying
concept of the Excelsior Program is sustainability, with students working across the four areas of
energy, waste, water and biodiversity.
Junior Landcare- In partnership with Mulgrave Landcare, this program is centred on the permaculture
garden and is a very popular choice for Junior students. Students learn about sustainability through
permaculture and the food generated is used in the school tuckshop.
Sport - Gordonvale is part of the Mulgrave District Sports area. Through Mulgrave Sport students
participate in Gala Days and teams representing Mulgrave at Peninsula trials. Gordonvale State School
has a strong sporting tradition and has produced many students who have represented Peninsula
region and Queensland.
How Information and Communication Technologies are used to assist learning
The Smart Classrooms strategy outlines the integration of information communication technology with
teaching and learning. All Prep to year 6 classrooms are fitted with an interactive whiteboard connected
to the school network. All students interact with lesson material via these devices.
Teachers P-6 use resources available in the computer labs or classrooms to engage individuals in
completing individualised drill and practice, research, creative tasks and publishing. All students have
access to 24/7 online learning and practice through ABC Reading Eggs, Mathletics, and Study Ladder.
Short Suspensions - 1 to 5 days 43 30 64
Long Suspensions - 6 to 20 days 0 0 0
Exclusions# 0 0 0
Cancellations of Enrolment 0 0 0

Social Climate
Gordonvale State School is developing a culture based upon a positive caring environment, high
expectations for teaching and learning, and behaviour, innovative and individual learning pathways and
high levels of student support.
The Responsible Behaviour Plan for Students establishes the direction of our work in creating a safe
supportive environment, conducive to learning. We enact this using The School Wide Positive
Behaviour System, which in 2014 was in it’s the third year of implementation. The system comprises 6
key features including teaching expectations, encouraging positive behaviour and responding to
undesirable behaviour.
To teach expectations, teachers use an extensive library of lessons including video, to make clear what
is expected, how to do this and what it looks and sounds like. During 2014 lessons were revised and
new ones created to meet the needs of students. Teaching expectations targeted every child in 2014.
To encourage expected behaviour we continued to use a free and frequent reward system to
acknowledge positive behaviour. “Gotchas” were collected and added to Gotcha Cards by student
during class and play time and the completed card traded in for simple rewards. Once a term a random
draw from all the traded cards provides a major prize for a child in prep – year 3 and a child in year 4-6.
Every child participated in the Gotcha system in 2014. The established AA, AAA and Bronze, Silver,
Gold award system also recognised students across the year levels who’d demonstrated outstanding
and consistent behaviour each semester.
Discouraging undesirable behaviour focuses on identification of the purpose of the behaviour,
correction - reteaching for more a desirable behaviour alternative, restitution and where required,
disciplinary consequences. Many students participated in correction for minor breaches of our code of
conduct. For example, talking too often in class or being tardy. A small number of students were
engaged in more serious correction, restitution and disciplinary consequences for major breeches of the
code, for example fighting or behaving grossly disrespectfully.
Pastoral care programs featured strongly in 2014 with the Student Support Team monitoring individual
student cases. Uniting Care partnered with our school locating an outreach worker a day a week in our
school to offer their Circles of Care program for families. This was enhanced during the year with the
addition of a program manager.
We continued to offer a school Chaplaincy program 2 days a week and included 10 boys in the SU
Connect outdoor adventure based counselling program. The Boost Academy partnered with us to
deliver a breakfast club one day a week and a program for boys, Fusion, run for 8 weeks after school
with another 10 boys.
Selected, trained year 6 students participated in a peer mentoring program to support younger children
in the playground and we engaged our sports captains in supporting junior school play by distributing
equipment and offering guidance during play times.
Parent, student and staff satisfaction with the school
Gordonvale State School caters for a diversity of learners from an equally broad range of families,
each with their own values and beliefs. Within the school community there are parents highly satisfied,
engaged and promoting the virtues of our school. There are also those who are not. This parallels
their children’s experiences, academically and socially. Generally parents are satisfied that their
children are learning, safe and enjoying school. Parents and students are generally satisfied with the
range of opportunities to participate in academic, sporting, cultural and social aspects of school.
Staff are dedicated to their work here. Working with such diversity is professionally challenging and staff
rise to this. Staff feel supported (resources, assistance, professional development) in their roles here.

Performance measure
Percentage of parent/caregivers who agree# that: 2012 2013 2014
their child is getting a good education at school (S2016) 100% 94% 95%
this is a good school (S2035) 100% 94% 95%
their child likes being at this school* (S2001) 100% 94% 95%
their child feels safe at this school* (S2002) 100% 91% 100%
their child's learning needs are being met at this school* (S2003) 100% 81% 100%
their child is making good progress at this school* (S2004) 100% 78% 95%
teachers at this school expect their child to do his or her best* (S2005) 100% 97% 100%
teachers at this school provide their child with useful feedback about his or her
school work* (S2006) 100% 81% 100%
teachers at this school motivate their child to learn* (S2007) 100% 81% 95%
teachers at this school treat students fairly* (S2008) 95% 91% 90%
they can talk to their child's teachers about their concerns* (S2009) 100% 94% 100%
this school works with them to support their child's learning* (S2010) 100% 91% 95%
this school takes parents' opinions seriously* (S2011) 100% 90% 90%
student behaviour is well managed at this school* (S2012) 100% 84% 86%
this school looks for ways to improve* (S2013) 100% 94% 100%
this school is well maintained* (S2014) 100% 84% 76%
Performance measure
Percentage of students who agree# that: 2012 2013 2014
they are getting a good education at school (S2048) 97% 94% 96%
they like being at their school* (S2036) 92% 95% 96%
they feel safe at their school* (S2037) 80% 87% 96%
their teachers motivate them to learn* (S2038) 93% 98% 99%
their teachers expect them to do their best* (S2039) 97% 98% 99%
their teachers provide them with useful feedback about their school work* (S2040) 89% 95% 96%
teachers treat students fairly at their school* (S2041) 84% 95% 91%
they can talk to their teachers about their concerns* (S2042) 79% 87% 91%
their school takes students' opinions seriously* (S2043) 84% 84% 85%
student behaviour is well managed at their school* (S2044) 65% 82% 83%
their school looks for ways to improve* (S2045) 92% 96% 99%
their school is well maintained* (S2046) 88% 92% 95%
their school gives them opportunities to do interesting things* (S2047) 90% 94% 91%
Performance measure

Percentage of school staff who agree# that: 2012 2013 2014
they enjoy working at their school (S2069) 97% 100%
they feel that their school is a safe place in which to work (S2070) 98% 100%
they receive useful feedback about their work at their school (S2071) 92% 86%
students are encouraged to do their best at their school (S2072) 98% 97%
students are treated fairly at their school (S2073) 97% 94%
student behaviour is well managed at their school (S2074) 95% 86%
staff are well supported at their school (S2075) 90% 86%
their school takes staff opinions seriously (S2076) 90% 91%
their school looks for ways to improve (S2077) 97% 100%
their school is well maintained (S2078) 95% 89%
their school gives them opportunities to do interesting things (S2079) 90% 94%
* Nationally agreed student and parent/caregiver items were incorporated in the School Opinion Survey in 2012.
# ‘Agree’ represents the percentage of respondents who Somewhat Agree, Agree or Strongly Agree with the statement. Due to a major
redevelopment of the surveys (parent/caregiver and student in 2012; staff in 2013), comparisons with results from previous years are not
recommended.
DW = Data withheld to ensure confidentiality.
Involving parents in their child’s education
Gordonvale State School has a strong tradition of parental support for the school. The Parents and
Citizens Association met on the third Tuesday of each month until a change in March that saw meetings
move to Wednesday after school. In 2014 the P&C raised considerable funds for the school via the
Tuckshop, Stalls, and fundraising events.
Many parents volunteer for sporting, academic and social events or programs. Parents are valued
volunteers in our reading programs, camps, excursions, sporting events and instrumental music. The
Excelsior Program matches students with mentors (often parents) as students work in projects that
concentrate on aspects of Environmental Sustainability. Excelsior has formally partnered with two
parents through the Scientists in Schools program.
At the beginning of each semester parents are encouraged to attend cohort parent information sessions
that outline what is to be studied during the course of the semester. Parents attend end of semester
presentations as well as musical and choir events. Formal Parent/Teacher Interviews are held twice a
year; however parents are encouraged to make appointments to see teachers during the school year.
In partnership with Hambledon House, throughout 2014 a playgroup continued to operate out of the
Prep area on Tuesday mornings.
Our school enjoys the support of community organisations whose charter is to engage parents with their
children’s education. PACE (Parent and Community Engagement) officers funded through the Cairns
Early Years Centre and a Circles of Care program coordinator funded by Mission Australia work in the
school each week.
Reducing the school’s environmental footprint
To reduce water usage we have installed of auto shut off taps in the amenities block, reduced sprinkling
cycles, installed of a rain water tank to service the permaculture garden and the toilets in our hall are
serviced by rainwater. All bubblers in the school automatically shut off when released as well as taps in
hand basins. We have removed all garden tap handles and fitted vandal proof taps to prevent water
wastage after hours. Cleaners use blowers 4 out of 5 days a week to keep concrete surfaces clean,
only hosing once a week.
Electricity usage is constantly affected by the increased use of ICTs in classrooms. Data Projectors are
turned off when not in use, as are fans and lights. However, air conditioning is responsible for a
significant part of our electricity use, despite a rigorously applied term 2 and 3 ban on use. During
school holiday “dormant” periods, we still consume considerable levels of electricity to sustain computer
networks, security systems including lighting and tuckshop refrigeration.
Environmental footprint indicators
Years Electricity
kWh Water kL
2011-2012 271,051 5,695
2012-2013 283,269 2,843
2013-2014 308,540 3,448
The consumption data is compiled from sources including ERM, Ergon reports and utilities data entered into OneSchool by each
school. The data provides an indication of the consumption trend in each of the utility categories which impact on the school’s
environmental footprint.
Our staff profile
Staff composition, including Indigenous staff
2014 Workforce Composition Teaching Staff* Non-teaching
Staff Indigenous Staff
Headcounts 38 29 5
Full-time equivalents 34 19 <5
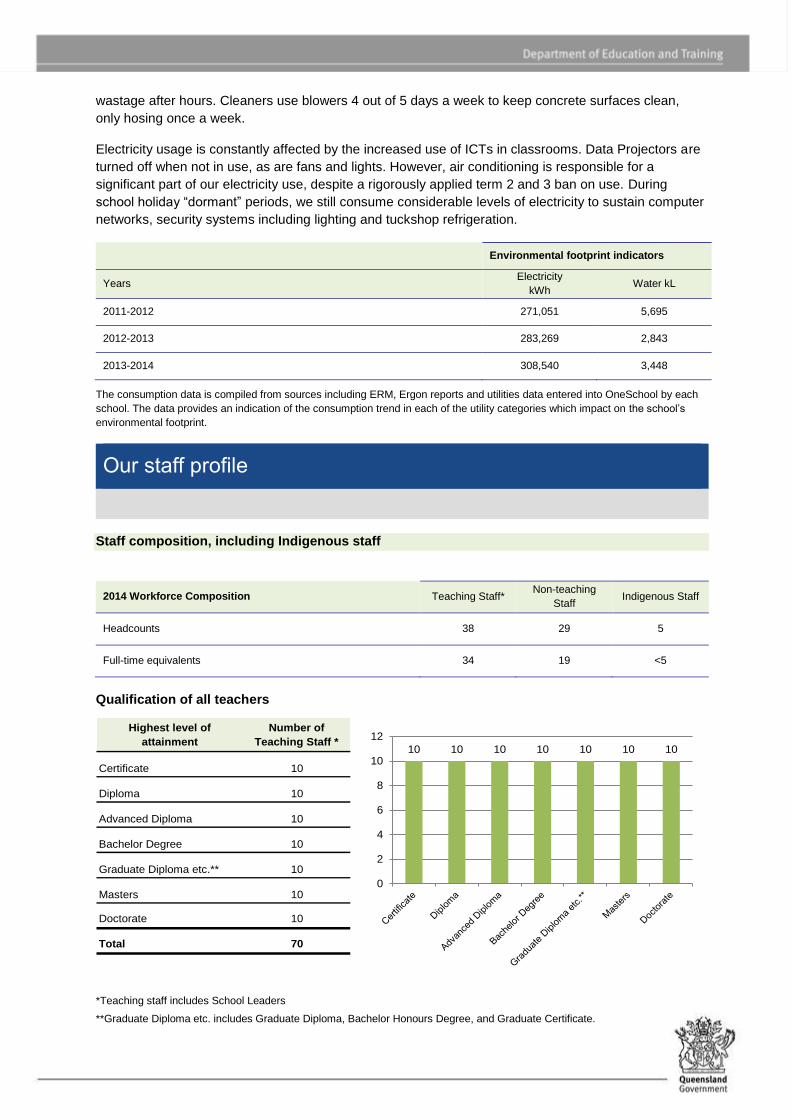
Qualification of all teachers
Highest level of
attainment
Number of
Teaching Staff *
Certificate 10
Diploma 10
Advanced Diploma 10
Bachelor Degree 10
Graduate Diploma etc.** 10
Masters 10
Doctorate 10
Total 70
10 10 10 10 10 10 10
0
2
4
6
8
10
12
*Teaching staff includes School Leaders
**Graduate Diploma etc. includes Graduate Diploma, Bachelor Honours Degree, and Graduate Certificate.

Expenditure on and teacher participation in professional development
We spent $17942 or 21%of the 2014 General grant on Professional Development activities, engaging
100% of teachers.
The major professional development initiatives in 2014 were:
Explicit Teaching – Training, coaching, co-coaching
Consolidation – Training, coaching
Reading Teaching and Early Literacy – training, coaching
Inclusion (responding to Disability Standards for Education)
Administration, management and school officer training
Developing teacher knowledge of and skill in using Explicit Instruction as their most frequent pedagogy
remained a priority in 2014. The comprehensive Regional model describing the pedagogy was adopted
with coaches and supervisors providing performance feedback against it. All school leaders responsible
for supervision, as well as the HoC participated in co-coaching to develop their skills. Four staff
meetings were dedicated to aspect of Explicit Instruction as well as a focus on the January Pupil Free
days. An extensive suit of vignettes focusing on particular aspects of the pedagogy was made available
online to all staff.
Consolidation is another high yield pedagogy that we have included in our Pedagogical Framework.
Teachers participated in 4 staff meetings focussing on the method and a Pupil Free day session in
January delivered by school and regional staff. An extensive suit of vignettes focusing on particular
aspects of the pedagogy was made available online to all staff.
Teaching reading and early literacy continued in 2014 as a focus for professional development. Four
staff meetings attended to aspects of teaching reading and cohorts of teachers spent a further 4
afternoon meetings working with the topic. Sessions were delivered by school and regional staff.
The development of differentiated teaching, firstly by adjusting curriculum planning, was a focus for all
teachers in 2014. A limited number of teachers participated in a project to develop planning models,
and expertise that can be shared with others. This project was funded by the More Support for Students
with Disabilities program.
Teachers aides completed training in understanding the impact on learning of autism and dyslexia
through online courses.
All staff participated in the mandated annual training – Student protection, Code of Conduct, Fire safety,
Evacuation and Lockdown, Asbestos.
Administrative staff, Schools officer and Cleaning team completed rounds of training in their areas twice,
during school holiday periods. Our School’s officer participated in the Janitor and Goroundsman’s
association network meetings each term. These meetings covered various aspects of workplace health
and safety, work practices and understanding regulations and legislation.
Average staff attendance 2012 2013 2014
Staff attendance for permanent and temporary staff and school leaders. 96% 97% 96%
Proportion of staff retained from the previous school year
From the end of the previous school year, 97% of staff was retained by the school for the entire 2014
school year.
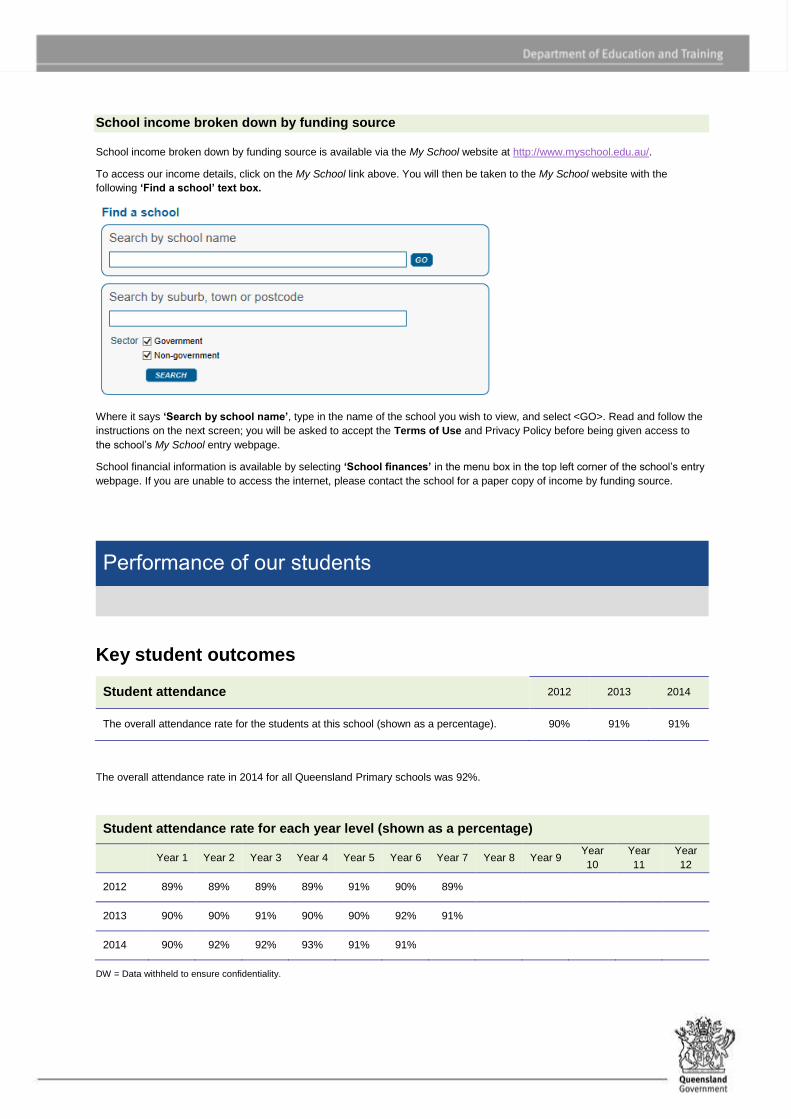
School income broken down by funding source
School income broken down by funding source is available via the My School website at http://www.myschool.edu.au/.
To access our income details, click on the My School link above. You will then be taken to the My School website with the
following ‘Find a school’ text box.
Where it says ‘Search by school name’, type in the name of the school you wish to view, and select <GO>. Read and follow the
instructions on the next screen; you will be asked to accept the Terms of Use and Privacy Policy before being given access to
the school’s My School entry webpage.
School financial information is available by selecting ‘School finances’ in the menu box in the top left corner of the school’s entry
webpage. If you are unable to access the internet, please contact the school for a paper copy of income by funding source.
Performance of our students
Key student outcomes
Student attendance 2012 2013 2014
The overall attendance rate for the students at this school (shown as a percentage). 90% 91% 91%
The overall attendance rate in 2014 for all Queensland Primary schools was 92%.
Student attendance rate for each year level (shown as a percentage)
Year 1 Year 2 Year 3 Year 4 Year 5 Year 6 Year 7 Year 8 Year 9 Year
10 Year
11 Year
12
2012 89% 89% 89% 89% 91% 90% 89%
2013 90% 90% 91% 90% 90% 92% 91%
2014 90% 92% 92% 93% 91% 91%
DW = Data withheld to ensure confidentiality.
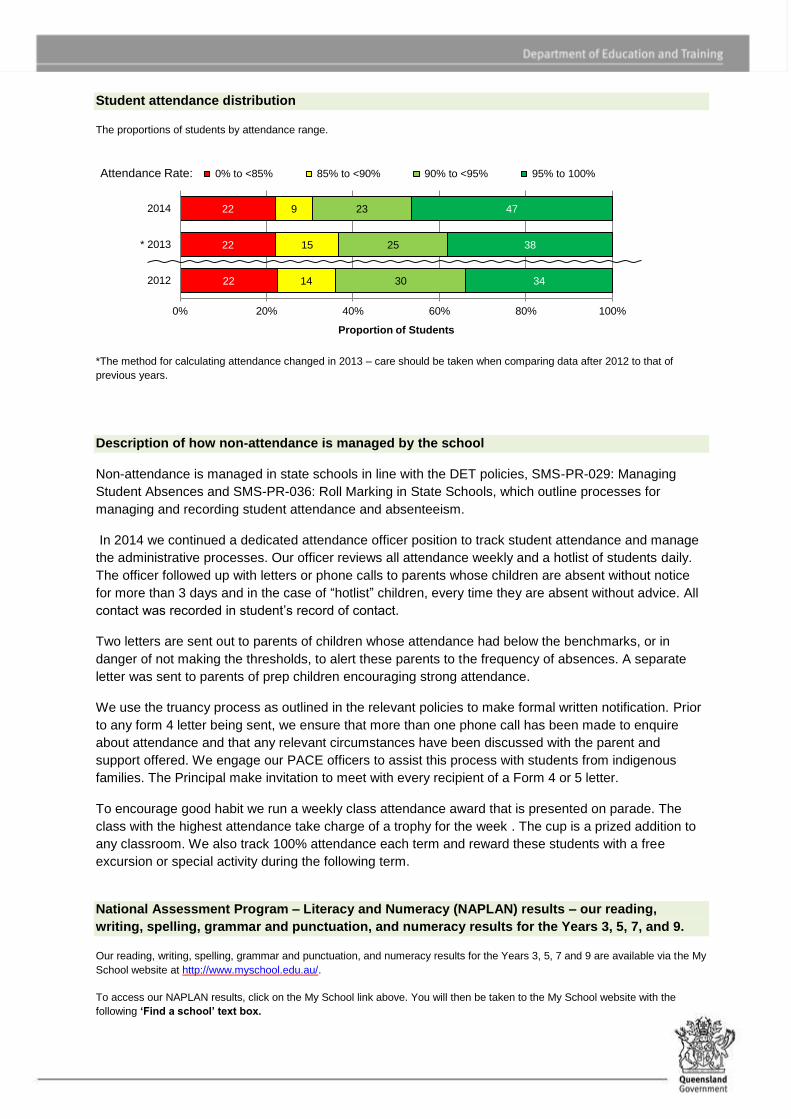
Student attendance distribution
The proportions of students by attendance range.
*The method for calculating attendance changed in 2013 – care should be taken when comparing data after 2012 to that of
previous years.
Description of how non-attendance is managed by the school
Non-attendance is managed in state schools in line with the DET policies, SMS-PR-029: Managing
Student Absences and SMS-PR-036: Roll Marking in State Schools, which outline processes for
managing and recording student attendance and absenteeism.
In 2014 we continued a dedicated attendance officer position to track student attendance and manage
the administrative processes. Our officer reviews all attendance weekly and a hotlist of students daily.
The officer followed up with letters or phone calls to parents whose children are absent without notice
for more than 3 days and in the case of “hotlist” children, every time they are absent without advice. All
contact was recorded in student’s record of contact.
Two letters are sent out to parents of children whose attendance had below the benchmarks, or in
danger of not making the thresholds, to alert these parents to the frequency of absences. A separate
letter was sent to parents of prep children encouraging strong attendance.
We use the truancy process as outlined in the relevant policies to make formal written notification. Prior
to any form 4 letter being sent, we ensure that more than one phone call has been made to enquire
about attendance and that any relevant circumstances have been discussed with the parent and
support offered. We engage our PACE officers to assist this process with students from indigenous
families. The Principal make invitation to meet with every recipient of a Form 4 or 5 letter.
To encourage good habit we run a weekly class attendance award that is presented on parade. The
class with the highest attendance take charge of a trophy for the week . The cup is a prized addition to
any classroom. We also track 100% attendance each term and reward these students with a free
excursion or special activity during the following term.
National Assessment Program – Literacy and Numeracy (NAPLAN) results – our reading,
writing, spelling, grammar and punctuation, and numeracy results for the Years 3, 5, 7, and 9.
Our reading, writing, spelling, grammar and punctuation, and numeracy results for the Years 3, 5, 7 and 9 are available via the My
School website at http://www.myschool.edu.au/.
To access our NAPLAN results, click on the My School link above. You will then be taken to the My School website with the
following ‘Find a school’ text box.
22
22
22
14
15
9
30
25
23
34
38
47
0% 20% 40% 60% 80% 100%
2012
* 2013
2014
Proportion of Students
Attendance Rate: 0% to <85% 85% to <90% 90% to <95% 95% to 100%

Where it says ‘Search by school name’, type in the name of the school whose NAPLAN results you wish to view, and select
<GO>.
Read and follow the instructions on the next screen; you will be asked to accept the Terms of Use and Privacy Policy before
being able to access NAPLAN data. If you are unable to access the internet, please contact the school for a paper copy of our
school’s NAPLAN results.
Achievement – Closing the Gap
In year 3, we are closing the gap in reading, writing and numeracy at a faster rate than in year 5. This
is not dissimilar to the state or regional patterns of achievement. Reading stands out as the area of
greatest improvement, particularly in our year 3 results, which shine. It is pleasing to note that overall
in the past 7 years, mean scale score averages have improved for both indigenous and non-
indigenous students in the three academic measures.
Attendance
The attendance rate for indigenous students declined from 87% in 2013 to 85.6% in 2014. At the
same time, the rate for non-indigenous students increased from 92.2% to 93.7%. These changes
resulted in an increased gap in 2014, 8.1%, up from 5.2% in 2013.
Reading
Year 3 recorded the third consecutive year of reducing the gap, increasing the indigenous mean and
increasing the non-indigenous mean scale score in reading. The 2014 gap is the lowest in the last 7
years at 38 mean scale score points. This gap is 45% smaller than the Queensland and 53% smaller
than the Far Northern region gap.
Year 5 recorded almost the same gap as in 2013, just 2 mean scale score points greater, 57
compared to 55 mean scale score points, as the mean for both indigenous and non-indigenous
students fell in parallel. The gap is 18% smaller than the Qld average and 35%smaller than the Far
North region average.
Writing
2014 was the third consecutive year of increase in the indigenous and non-indigenous means for
writing. The gap of 27 mean scale score points is the smallest recorded in 7 years and is 52% lower
than the Qld and 58% lower than the Far North Region gap.

The Year 5 indigenous mean dropped in 2014 while the non-indigenous mean remained stable. The
gap increased over 2013 by 23 mean scale score points, to 66. The 2014 gap is 117% of the Qld gap
and 103% of the Regional gap.
Numeracy
Year 3 recorded he third consecutive year of improvement in both indigenous and non-indigenous
mean. At 56 mean scale score points, the gap is 5% smaller than the Qld gap and 245 smaller than
the regional gap. Its; the 4th smallest gap recorded in our school in 7 years.
The year 5 gap of 72 mean scale score points is the smallest in the last 3 years, with the non-
indigenous mean also being the lowest in three years. The gap is 118% of the Qld gap and 7%
smaller than the Far North regional gap.