Google Technical Report provos-2008a DRAFTresearch.google.com/archive/provos-2008a.pdf · DRAFT...
22
DRAFT Google Technical Report provos-2008a All Your iFRAMEs Point to Us Niels Provos Panayiotis Mavrommatis Moheeb Abu Rajab Fabian Monrose Abstract As the web continues to play an ever increasing role in information exchange, so too is it becoming the prevailing platform for infecting vulnerable hosts. In this paper, we provide a detailed study of the pervasiveness of so-called drive-by downloads on the Internet. Drive-by downloads are caused by URLs that attempt to exploit their visitors and cause malware to be installed and run automatically. Our analysis of billions of URLs over a 10 month period shows that a non-trivial amount, of over 3 million malicious URLs, initiate drive-by downloads. An even more troubling finding is that approximately 1.3% of the incoming search queries to Google’s search engine returned at least one URL labeled as malicious in the results page. We also explore several aspects of the drive-by downloads problem. We study the relationship between the user browsing habits and exposure to malware, the different techniques used to lure the user into the malware distribution networks, and the different properties of these networks. February 4th, 2008 Google Inc. 1600 Amphitheatre Parkway Mountain View, CA 94043
-
Upload
nguyennhan -
Category
Documents
-
view
217 -
download
3
Transcript of Google Technical Report provos-2008a DRAFTresearch.google.com/archive/provos-2008a.pdf · DRAFT...
DR
AFT
Google Technical Report provos-2008a
All Your iFRAMEs Point to Us
Niels Provos Panayiotis Mavrommatis Moheeb Abu Rajab Fabian Monrose
Abstract
As the web continues to play an ever increasing role in information exchange, so too is itbecoming the prevailing platform for infecting vulnerable hosts. In this paper, we provide adetailed study of the pervasiveness of so-called drive-by downloads on the Internet. Drive-bydownloads are caused by URLs that attempt to exploit their visitors and cause malware to beinstalled and run automatically. Our analysis of billions of URLs over a 10 month period showsthat a non-trivial amount, of over 3 million malicious URLs, initiate drive-by downloads. An evenmore troubling finding is that approximately 1.3% of the incoming search queries to Google’ssearch engine returned at least one URL labeled as malicious in the results page. We also exploreseveral aspects of the drive-by downloads problem. We study the relationship between the userbrowsing habits and exposure to malware, the different techniques used to lure the user into themalware distribution networks, and the different properties of these networks.
February 4th, 2008
Google Inc.1600 Amphitheatre Parkway
Mountain View, CA 94043

DR
AFT
DR
AFT
All Your iFRAMEs Point to Us
Niels Provos∗ Panayiotis Mavrommatis∗ Moheeb Abu Rajab† Fabian Monrose†
1 Introduction
It should come as no surprise that our increasing reliance on the Internet for many facets of ourdaily lives (e.g., commerce, communication, entertainment, etc.) makes the Internet an attrac-tive target for a host of illicit activities. Indeed, over the past several years, Internet serviceshave witnessed major disruptions from attacks, and the network itself is continually plagued withmalfeasance [12]. While the monetary gains from the myriad of illicit behaviors being perpetratedtoday (e.g., phishing, spam) is just barely being understood [9], it is clear that there is a generalshift in tactics—wide-scale attacks aimed at overwhelming computing resources are becoming lessprevalent, and instead, traditional scanning attacks are being replaced by other mechanisms. Chiefamong these is the exploitation of the web, and the services built upon it, to distribute malware.
This change in the playing field is particularly alarming, as unlike traditional scanning attacksthat use push-based infection to increase their population, web-based malware infection follows apull-based model. For the most part, the techniques in use today for delivering web-malware canbe divided into two main categories. In the first case, attackers use various social engineering tech-niques to entice the visitors of a website to download and run malware. The second, more deviouscase, involves the underhanded tactic of targeting various browser vulnerabilities to automaticallydownload and run—i.e., unknowingly to the visitor—the binary upon visiting a website. Whenpopular websites are exploited, the potential victim base from these so-called drive-by downloadscan be far greater than other forms of exploitation because traditional defenses (e.g., firewalls, dy-namic addressing, proxies) pose no barrier to infection. While social engineering may, in general, bean important malware spreading vector, in this work we restrict our focus and analysis to malwaredelivered via drive-by downloads.
Recently, Provos et al. [17] provided insights on this new phenomenon, and presented a cursoryoverview of web-based malware. Specifically, they described a number of server- and client-sideexploitation techniques that are used to spread malware, and elucidated the mechanisms by whicha successful exploitation chain can start and continue to the automatic installation of malware. Inthis paper, we present a detailed analysis of the malware serving infrastructure on the web using alarge corpus of malicious URLs collected over a period of ten months. Using this data, we estimatethe global prevalence of drive-by downloads, and identify several trends for different aspects of theweb malware problem. Our results reveal an alarming contribution of Chinese-based web sites tothe web malware problem– overall, 67% of the malware distribution servers and 64% of the websites that link to them are located in China. These results raise serious question about the securitypractices employed by web site administrators.
∗Google Inc., e-mail:{niels, panayiotis}@google.com†Computer Science Department, Johns Hopkins University, e-mail:{moheeb, fabian}@cs.jhu.edu
DR
AFT
Additionally, we study several properties of the malware serving infrastructure, and show that(for the most part) the malware serving networks are composed of tree-like structures with strongfan-in edges leading to the main malware distribution sites. These distribution sites normallydeliver the malware to the victim after a number of indirection steps traversing a path on thedistribution network tree. More interestingly, we show that several malware distribution networkshave linkages that can be attributed to various relationships.
In general, the edges of these malware distribution networks represent the hop-points used to lureusers to the malware distribution site. By investigating these edges, we reveal a number of causalrelationships that eventually lead to browser exploitation. More troubling, we show that drive-bydownloads are being induced by mechanisms beyond the conventional techniques of controllingthe content of compromised websites. In particular, our results reveal that ad serving networksare increasingly being used as hops in the malware serving chain. We attribute this increase tosyndication, a common practice which allows advertisers to rent out part of their advertising spaceto other parties. These findings are problematic as they show that even protected web-servers canbe used as vehicles for transferring malware. Additionally, we also show that contrary to commonwisdom, the practice of following “safe browsing” habits (i.e., avoiding gray content) by itself isnot an effective safeguard against exploitation.
The remainder of this paper is organized as follows. In Section 2, we provide backgroundinformation on how vulnerable computer systems can be compromised solely by visiting a maliciousweb page. Section 3 gives an overview of our data collection infrastructure and in Section 4we discuss the prevalence of malicious web sites on the Internet. In Section 5, we explore themechanisms used to inject malicious content into web pages. We analyze several aspects of the webmalware distribution networks in Section 6. In Section 7 we provide an overview of the impact ofthe installed malware on the infected system. Section 8 presents related work. Finally, we concludein Section 9.
2 Background
Unfortunately, there are a number of existing exploitation strategies for installing malware on auser’s computer. One common technique for doing so is by remotely exploiting vulnerable networkservices. However, lately, this attack strategy has become less successful (and presumably, lessprofitable). Arguably, the proliferation of technologies such as Network Address Translators (NATs)and Firewalls make it difficult to remotely connect and exploit services running on users’ computers.This, in turn, has lead attackers to seek other avenues of exploitation. An equally potent alternativeis to simply lure web users to connect to (compromised) malicious servers that subsequently deliverexploits targeting vulnerabilities of web browsers or their plugins.
Adversaries use a number of techniques to inject content under their control into benign websites.In many cases, adversaries exploit web servers via vulnerable scripting applications. Typically, thesevulnerabilities (e.g., in phpBB2 or InvisionBoard) allow an adversary to gain direct access to theunderlying operating system. That access can often be escalated to super-user privileges which inturn can be used to compromise any web server running on the compromised host. In general,upon successful exploitation of a web server the adversary injects new content to the compromisedwebsite. In most cases, the injected content is a link that redirects the visitors of these websitesto a URL that hosts a script crafted to exploit the browser. To avoid visual detection by websiteowners, adversaries normally use invisible HTML components (e.g., zero pixel IFRAMEs) to hide the
DR
AFT
Victim machine
(5) Automatically install and run the Malware
Landing Site
(4) Download the Malware executable
(3) Redirect to get the exploit
(2) Redirect to get the exploit(1) Client visits the landing site
Malware Distribution Site
Hop Point������
������
������
������
����
������
������
nre
dire
ctio
nste
ps
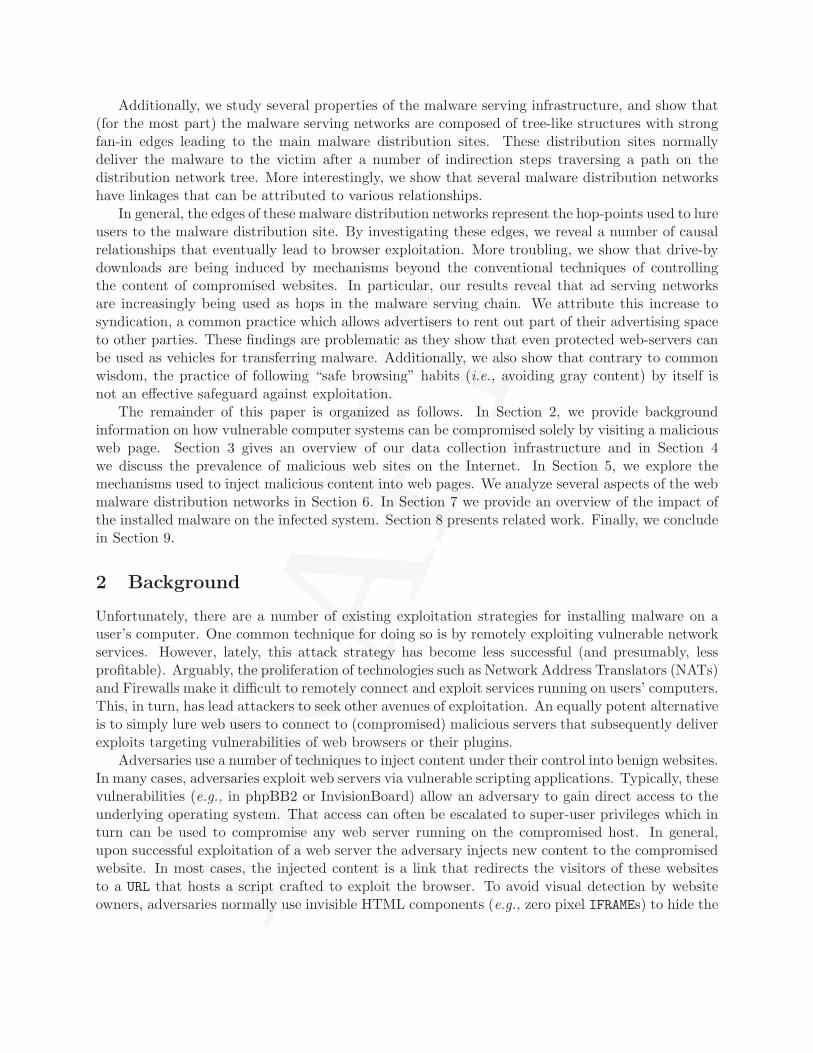
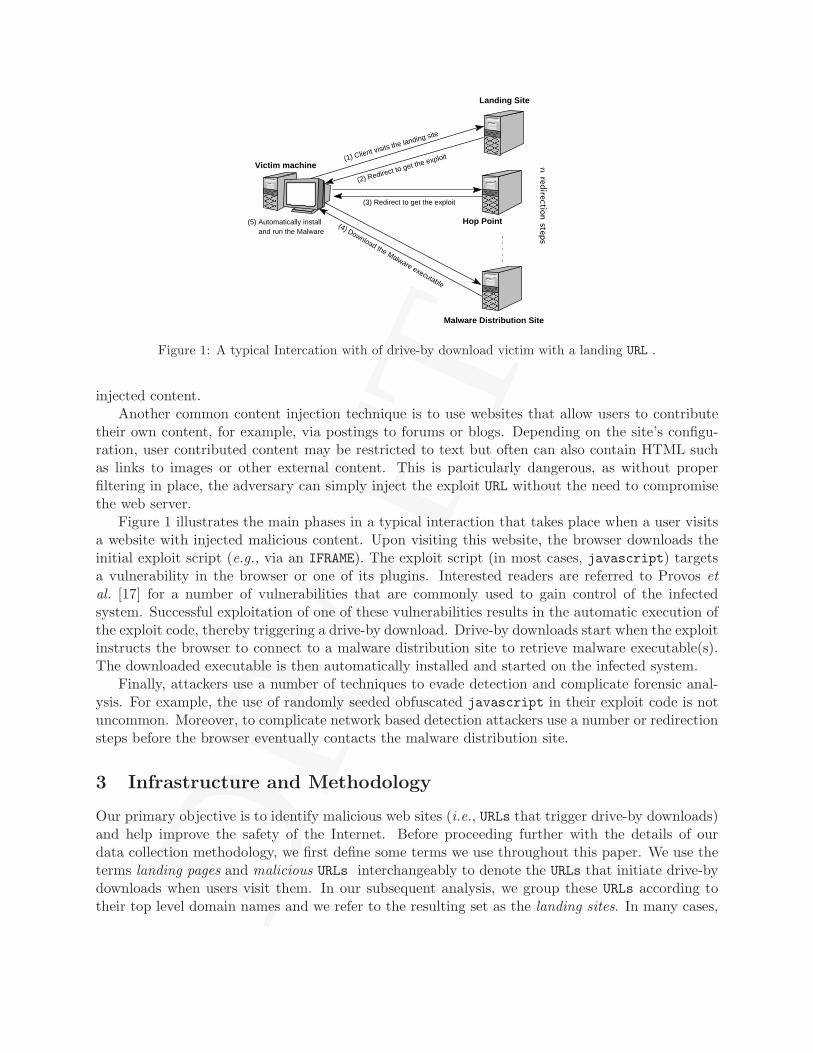
Figure 1: A typical Intercation with of drive-by download victim with a landing URL .
injected content.Another common content injection technique is to use websites that allow users to contribute
their own content, for example, via postings to forums or blogs. Depending on the site’s configu-ration, user contributed content may be restricted to text but often can also contain HTML suchas links to images or other external content. This is particularly dangerous, as without properfiltering in place, the adversary can simply inject the exploit URL without the need to compromisethe web server.
Figure 1 illustrates the main phases in a typical interaction that takes place when a user visitsa website with injected malicious content. Upon visiting this website, the browser downloads theinitial exploit script (e.g., via an IFRAME). The exploit script (in most cases, javascript) targetsa vulnerability in the browser or one of its plugins. Interested readers are referred to Provos etal. [17] for a number of vulnerabilities that are commonly used to gain control of the infectedsystem. Successful exploitation of one of these vulnerabilities results in the automatic execution ofthe exploit code, thereby triggering a drive-by download. Drive-by downloads start when the exploitinstructs the browser to connect to a malware distribution site to retrieve malware executable(s).The downloaded executable is then automatically installed and started on the infected system.
Finally, attackers use a number of techniques to evade detection and complicate forensic anal-ysis. For example, the use of randomly seeded obfuscated javascript in their exploit code is notuncommon. Moreover, to complicate network based detection attackers use a number or redirectionsteps before the browser eventually contacts the malware distribution site.
3 Infrastructure and Methodology
Our primary objective is to identify malicious web sites (i.e., URLs that trigger drive-by downloads)and help improve the safety of the Internet. Before proceeding further with the details of ourdata collection methodology, we first define some terms we use throughout this paper. We use theterms landing pages and malicious URLs interchangeably to denote the URLs that initiate drive-bydownloads when users visit them. In our subsequent analysis, we group these URLs according totheir top level domain names and we refer to the resulting set as the landing sites. In many cases,
DR
AFT
the malicious payload is not hosted on the landing site, but instead loaded via an IFRAME or aSCRIPT from a remote site. We call the remote site that hosts malicious payloads a distributionsite. In what follows, we detail the different components of our data collection infrastructure.
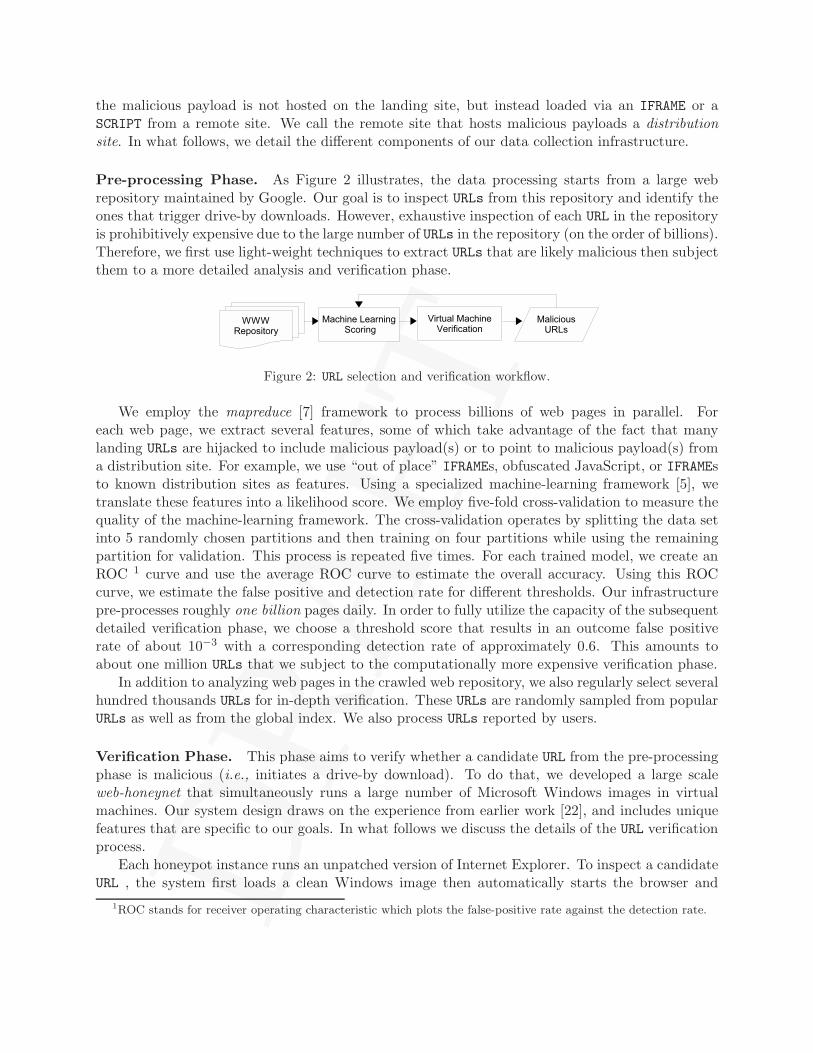
Pre-processing Phase. As Figure 2 illustrates, the data processing starts from a large webrepository maintained by Google. Our goal is to inspect URLs from this repository and identify theones that trigger drive-by downloads. However, exhaustive inspection of each URL in the repositoryis prohibitively expensive due to the large number of URLs in the repository (on the order of billions).Therefore, we first use light-weight techniques to extract URLs that are likely malicious then subjectthem to a more detailed analysis and verification phase.
Figure 2: URL selection and verification workflow.
We employ the mapreduce [7] framework to process billions of web pages in parallel. Foreach web page, we extract several features, some of which take advantage of the fact that manylanding URLs are hijacked to include malicious payload(s) or to point to malicious payload(s) froma distribution site. For example, we use “out of place” IFRAMEs, obfuscated JavaScript, or IFRAMEsto known distribution sites as features. Using a specialized machine-learning framework [5], wetranslate these features into a likelihood score. We employ five-fold cross-validation to measure thequality of the machine-learning framework. The cross-validation operates by splitting the data setinto 5 randomly chosen partitions and then training on four partitions while using the remainingpartition for validation. This process is repeated five times. For each trained model, we create anROC 1 curve and use the average ROC curve to estimate the overall accuracy. Using this ROCcurve, we estimate the false positive and detection rate for different thresholds. Our infrastructurepre-processes roughly one billion pages daily. In order to fully utilize the capacity of the subsequentdetailed verification phase, we choose a threshold score that results in an outcome false positiverate of about 10−3 with a corresponding detection rate of approximately 0.6. This amounts toabout one million URLs that we subject to the computationally more expensive verification phase.
In addition to analyzing web pages in the crawled web repository, we also regularly select severalhundred thousands URLs for in-depth verification. These URLs are randomly sampled from popularURLs as well as from the global index. We also process URLs reported by users.
Verification Phase. This phase aims to verify whether a candidate URL from the pre-processingphase is malicious (i.e., initiates a drive-by download). To do that, we developed a large scaleweb-honeynet that simultaneously runs a large number of Microsoft Windows images in virtualmachines. Our system design draws on the experience from earlier work [22], and includes uniquefeatures that are specific to our goals. In what follows we discuss the details of the URL verificationprocess.
Each honeypot instance runs an unpatched version of Internet Explorer. To inspect a candidateURL , the system first loads a clean Windows image then automatically starts the browser and
1ROC stands for receiver operating characteristic which plots the false-positive rate against the detection rate.
DR
AFT
instructs it to visit the candidate URL . We detect malicious URLs using a combination of executionbased heuristics and results from anti-virus engines. Specifically, for each visited URL we run thevirtual machine for approximately two minutes and monitor the system behavior for abnormalstate changes including file system changes, newly created processes and changes to the system’sregistry. Additionally, we subject the HTTP responses to virus scans using multiple anti-virusengines. To detect malicious URLs , we develop scoring heuristics used to determines the likelihoodthat a URL is malicious. We determine a URL score based on a combined measure of the differentstate changes resulting from visiting the URL . Our heuristics score URLs based on the number ofcreated processes, the number of observed registry changes and the number of file system changesresulting from visiting the URL .
To limit false positives, we choose a conservative decision criteria that uses an empirically derivedthreshold to mark a URL as malicious. This threshold is set such that it will be met if we detectchanges in the system state, including the file system as well as creation of new processes. A visitedURL is marked as malicious if it meets the threshold and one of the incoming HTTP responses ismarked as malicious by at least one anti-virus scanner. Our extensive evaluation shows that thiscriteria introduces negligible false positives. Finally, a URL that meets the threshold requirementbut has no incoming payload flagged by any of the anti-virus engines, is marked as suspicious.
On average, the detailed verification stage processes about one million URLs daily, of whichroughly 25, 000 new URLs are flagged as malicious. The verification system records all the networkinteractions as well as the state changes. In what follows, we describe how we process the net-work traces associated with the detected malicious URLs to shed light on the malware distributioninfrastructure.
Constructing the Malware Distribution Networks. To understand the properties of the webmalware serving infrastructure on the Internet, we analyze the recorded network traces associatedwith the detected malicious URLs to construct the malware distribution networks. We define adistribution network as the set of malware delivery trees from all the landing sites that lead to aparticular malware distribution site. A malware delivery tree consists of the landing site, as the leafnode, and all nodes (i.e., web sites) that the browser visits until it contacts the malware distributionsite (the root of the tree). To construct the delivery trees we extract the edges connecting thesenodes by inspecting the Referer header from the recorded successive HTTP requests the browsermakes after visiting the landing page. However, in many cases the Referer headers are not sufficientto extract the full chain. For example, when the browser redirection results from an external scriptthe Referrer, in this case, points to the base page and not the external script file. Additionally,in many cases the Referer header is not set (e.g., because the requests are made from within abrowser plugin or newly-downloaded malware).
To connect the missing causality links, we interpret the HTML and JavaScript content of thepages fetched by the browser and extract all the URLs from the fetched pages. Then, to identifycausal edges we look for any URLs that match any of the HTTP fetches that were subsequentlyvisited by the browser. In some cases, URLs contain randomly generated strings, so some requestscannot be matched exactly. In these cases, we apply heuristics based on edit distance to identifythe most probable parent of the URL . Finally, for each malware distribution site, we construct itsassociated distribution network by combining the different malware delivery trees from all landingpages that lead to that site.
DR
AFT
Our infrastructure has been live for more than one year, continuously monitoring the web anddetecting malicious URLs . In what follows, we report our findings based on analyzing data collectedduring that time period. Again, recall that we focus here on the pervasiveness of malicious activity(perpetrated by drive-by downloads) that is induced simply by visiting a landing page, thereafterrequiring no additional interaction on the client’s part (e.g., clicking on embedded links). Finally,we note that due to the large scale of our data collection and some infrastructural constraints,a number longitudinal aspects of the web malware problem (e.g., the lifetime of the differentmalware distribution networks) are beyond the scope of this paper and are a subject of our futureinvestigation.
4 On the Prevalence of Drive-by Downloads
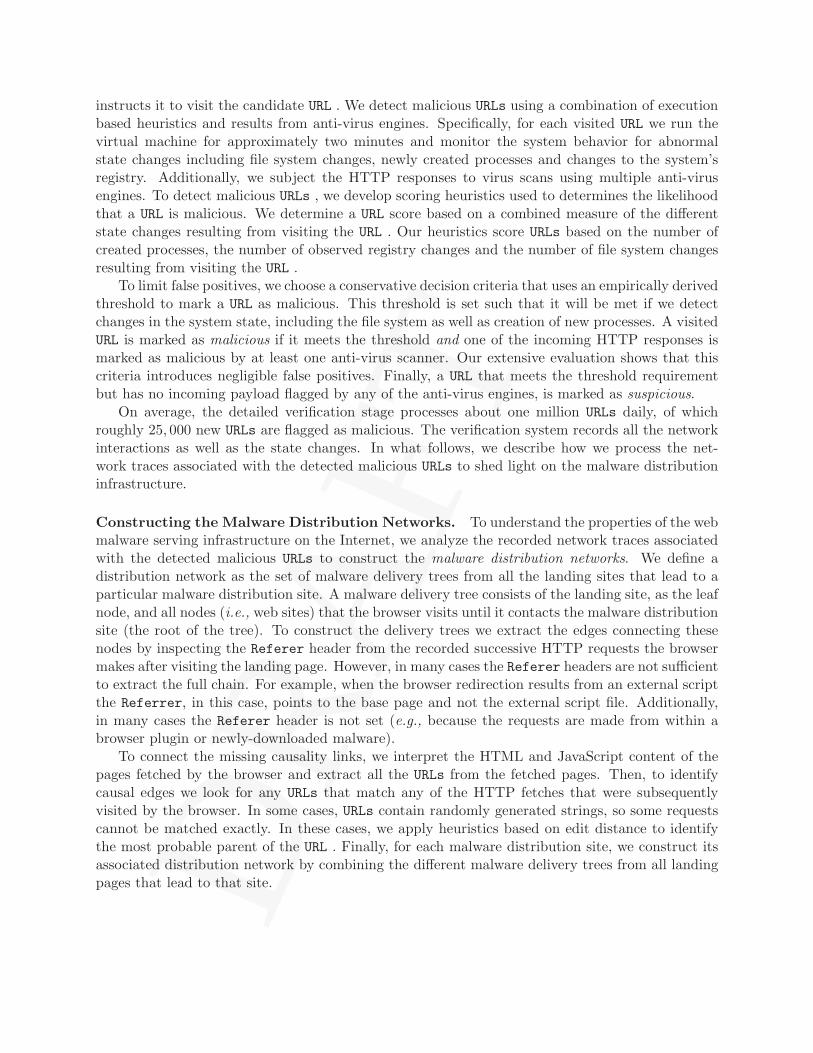
We provide an estimate of the prevalence of web-malware based on data collected over a periodof ten months (Jan 2007 - Oct 2007). During that period, we subjected over 60 million URLs forin-depth processing through our verification system. Overall, we detected more than 3 millionmalicious URLs hosted on more than 180 thousand landing sites. Overall, we observed more than9 thousand different distribution sites. The findings are summarized in Table 1. Overall, theseresults show the scope of the problem, but do not necessarily reflect the exposure of end-users todrive-by downloads. In what follows, we attempt to address this question by estimating the overallimpact of the malicious web sites.
Data collection period Jan - Oct 2007Total URLs checked in-depth 66, 534, 330Total suspicious landing URLs 3, 385, 889Total malicious landing URLs 3, 417, 590Total malicious landing sites 181, 699Total distribution sites 9, 340
Table 1: Summary of Collected Data.
Apr-2007 May-2007 Jun-2007 Jul-2007 Aug-2007Sep-2007 Oct-2007 Nov-2007Dec-2007Dec-2007 Jan-2008
Date
0
0.2
0.4
0.6
0.8
1
1.2
1.4
1.6
Rat
io (
%)
Figure 3: Fraction of search queries that resulted in atleast one malicious URL . (7-day running avg.)
4.1 Impact on the end-user
To study the potential impact of malicious web sites on the end-users, we first examine the fractionof incoming search queries to Google’s search engine that return at least one URL labeled as maliciousin the results page. Figure 3 provides a running average of this fraction. The graph shows anincreasing trend in the search queries that return at least one malicious result, with an averageapproaching 1.3% of the overall incoming search queries. This finding is troubling as it shows that

DR
AFT
a significant fraction of search queries return results that may expose the end-user to exploitationattempts.
To further understand the importance of this finding, we inspect the prevalence of malicioussites among the links that appear most often in Google search results. From the top one millionURLs appearing in the search engine results, about 6, 000 belong to sites that have been verified asmalicious at some point during our data collection. Upon closer inspection, we found that thesesites appear at uniformly distributed ranks within the top million web sites—with the most popularlanding page having a rank of 1, 588. These results further highlight the significance of the webmalware threat as they show the extent of the malware problem; in essence, about 0.6% of the topmillion URLs that appeared most frequently in Google’s search results led to exposure to maliciousactivity at some point.
4.2 Geographic locality
One noteworthy result is the geographic locality of web based malware. Tables 2 and 3 showthe geographic breakdown of IP addresses of the malware distribution sites and the landing sites,respectively. The results show that a significant number of Chinese-based sites contribute to thedrive-by problem. Overall, 67% of the malware distribution sites and 64.6% of the landing sites arehosted in China. These findings provide more evidence [11] of poor security practices by web siteadministrators (e.g., running out-dated and unpatched versions of the web server software).
Finally, we examined the geographic locality of the web-malware distribution networks as awhole (i.e., the correlation between the location of a distribution site and the landing sites point-ing to it). Interestingly, the malware distribution networks are highly localized within commongeographical boundaries. Upon closer investigation, we see that this locality varies across differ-ent countries, and is most evident in China, with 96% of the landing sites pointing to malwaredistribution servers hosted in China.
Malware Dist. site % of allhosting country distribution sites
China 67.0%United States 15.0%Russia 4.0%Malaysia 2.2%Korea 2.0%Panama 1.1%Germany 1.0%Hong Kong 0.8%Turkey 0.7%France 0.7%Other 5.7%
Table 2: Hosting countries for the distribution sites.
Landing site % of allhosting country landing sites
China 64.4%United States 15.6%Russia 5.6%Korea 2.0%Germany 2.0%Czech Republic 0.9%Ukraine 0.8%Taiwan 0.8%Poland 0.7%Canada 0.6%Other 6.5%
Table 3: Hosting countries for the landing sites.
4.3 Impact of browsing habits
To examine the potential impact of users’ browsing habits on their exposure to web exploitation,where possible, we map the set of detected landing URLs to the DMOZ functional categories [1]2. We
2This mapping is readily available at Google.
DR
AFT
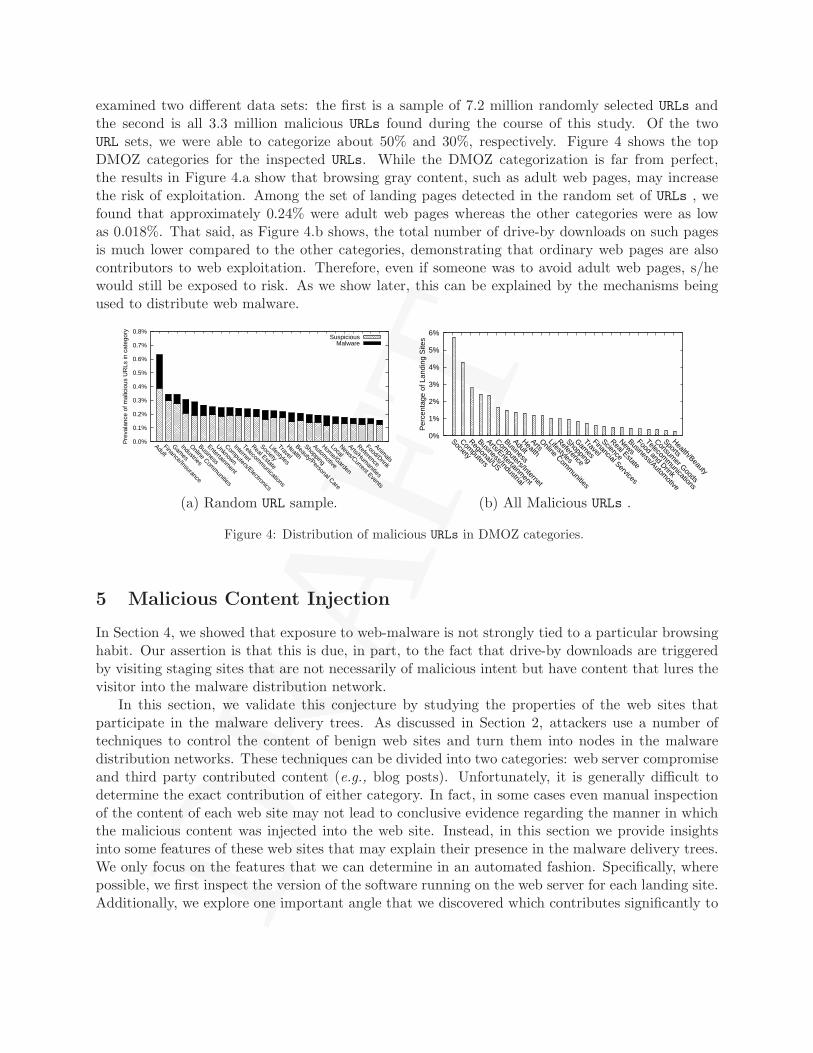
examined two different data sets: the first is a sample of 7.2 million randomly selected URLs andthe second is all 3.3 million malicious URLs found during the course of this study. Of the twoURL sets, we were able to categorize about 50% and 30%, respectively. Figure 4 shows the topDMOZ categories for the inspected URLs. While the DMOZ categorization is far from perfect,the results in Figure 4.a show that browsing gray content, such as adult web pages, may increasethe risk of exploitation. Among the set of landing pages detected in the random set of URLs , wefound that approximately 0.24% were adult web pages whereas the other categories were as lowas 0.018%. That said, as Figure 4.b shows, the total number of drive-by downloads on such pagesis much lower compared to the other categories, demonstrating that ordinary web pages are alsocontributors to web exploitation. Therefore, even if someone was to avoid adult web pages, s/hewould still be exposed to risk. As we show later, this can be explained by the mechanisms beingused to distribute web malware.
0.0%
0.1%
0.2%
0.3%
0.4%
0.5%
0.6%
0.7%
0.8%
AdultFinance/Insurance
Games
Industries
Online Comm
unities
Business
Entertainment
Unknown
Computers/Electronics
Internet
Telecomm
unications
Real Estate
Society
Lifestyles
Travel
Health
Beauty/Personal Care
Shopping
Automotive
Home/Garden
Local
News/Current Events
Arts/Humanities
Reference
Food/Drink
Animals
Pre
vala
nce
of m
alic
ious
UR
Ls in
cat
egor
y
SuspiciousMalware
0%
1%
2%
3%
4%
5%
6%
Society
Computers
Regional/US
Business/Industrial
Arts/Entertainment
Computers/Internet
Business
AdultHealth
ArtsOnline Com
munities
Lifestyles
Reference
Shopping
Games
Travel
Financial Services
Science
Real Estate
NewsBusiness/Autom
otive
Food and Drink
Telecomm
unications
Consumer Goods
Sports
Health/Beauty
Per
cent
age
of L
andi
ng S
ites
(a) Random URL sample. (b) All Malicious URLs .
Figure 4: Distribution of malicious URLs in DMOZ categories.
5 Malicious Content Injection
In Section 4, we showed that exposure to web-malware is not strongly tied to a particular browsinghabit. Our assertion is that this is due, in part, to the fact that drive-by downloads are triggeredby visiting staging sites that are not necessarily of malicious intent but have content that lures thevisitor into the malware distribution network.
In this section, we validate this conjecture by studying the properties of the web sites thatparticipate in the malware delivery trees. As discussed in Section 2, attackers use a number oftechniques to control the content of benign web sites and turn them into nodes in the malwaredistribution networks. These techniques can be divided into two categories: web server compromiseand third party contributed content (e.g., blog posts). Unfortunately, it is generally difficult todetermine the exact contribution of either category. In fact, in some cases even manual inspectionof the content of each web site may not lead to conclusive evidence regarding the manner in whichthe malicious content was injected into the web site. Instead, in this section we provide insightsinto some features of these web sites that may explain their presence in the malware delivery trees.We only focus on the features that we can determine in an automated fashion. Specifically, wherepossible, we first inspect the version of the software running on the web server for each landing site.Additionally, we explore one important angle that we discovered which contributes significantly to
DR
AFT
the distribution of web malware—namely, drive-by downloads via Ads.
5.1 Web Server Software
We first begin by examining (where possible) the software running on the web-servers for all thelanding sites that lead to the malware distribution sites. Specifically, we collected all the “Server”and “X-Powered-By” header tokens from each landing page (see Table 4). Not surprisingly, ofthose servers that reported this information, a significant fraction were running outdated versionsof software with well known vulnerabilities 3. For example, 38.1% of the Apache servers and 39.9%of servers with PHP scripting support reported a version with security vulnerabilities. Overall,these results reflect the weak security practices applied by the web site administrators. Clearly,running unpatched software with known vulnerabilities increases the risk of content control viaserver exploitation.
Server Software Servers Unknown version Up-to-date Old version
Apache 55,088 14,569 (26.45%) 19,527 (35.45%) 20,992 (38.1%)Microsoft IIS 113,905 n/a n/a n/a
Unknown 12,706 n/a n/a n/a
Scripting Software
PHP 27,873 2,361 (8.5%) 14,379 (51.6%) 11,133 (39.9%)
Table 4: Server version for landing sites. In the case of Microsoft IIS, we could not verify their version.
5.2 Drive-by Downloads via Ads
Today, the majority of Web advertisements are distributed in the form of third party content tothe advertising web site. This practice is somewhat worrisome, as a web page is only as secure asit’s weakest component. In particular, even if the web page itself does not contain any exploits,insecure Ad content poses a risk to advertising web sites. With the increasing use of Ad syndication(which allows an advertiser to sell advertising space to other advertising companies that in turn canyet again syndicate their content to other parties), the chances that insecure content gets insertedsomewhere along the chain quickly escalates. Far too often, this can lead to web pages runningadvertisements to untrusted content. This, in itself, represents an attractive avenue for distributingmalware, as it provides the adversary with a way to inject content to web sites with large visitorbase without having to compromise any web server.
To assess the extent of this behavior, we estimate the overall contribution of Ads to drive-bydownloads. To do so, we construct the malware delivery trees from all detected malicious URLs fol-lowing the methodology described in Section 3. For each tree, we examine every intermediary nodefor membership in a set of 2, 000 well known advertising networks. If any of the nodes qualify,we count the landing site as being infectious via Ads. Moreover, to highlight the impact of themalware delivered via Ads relative to the other mechanisms, we weight the landing sites associatedwith Ads based on the frequency of their appearance in Google search results compared to that
3We consider a version as outdated if it is older than the latest corresponding version released by January, 2007(the start date for our data collection).
DR
AFT
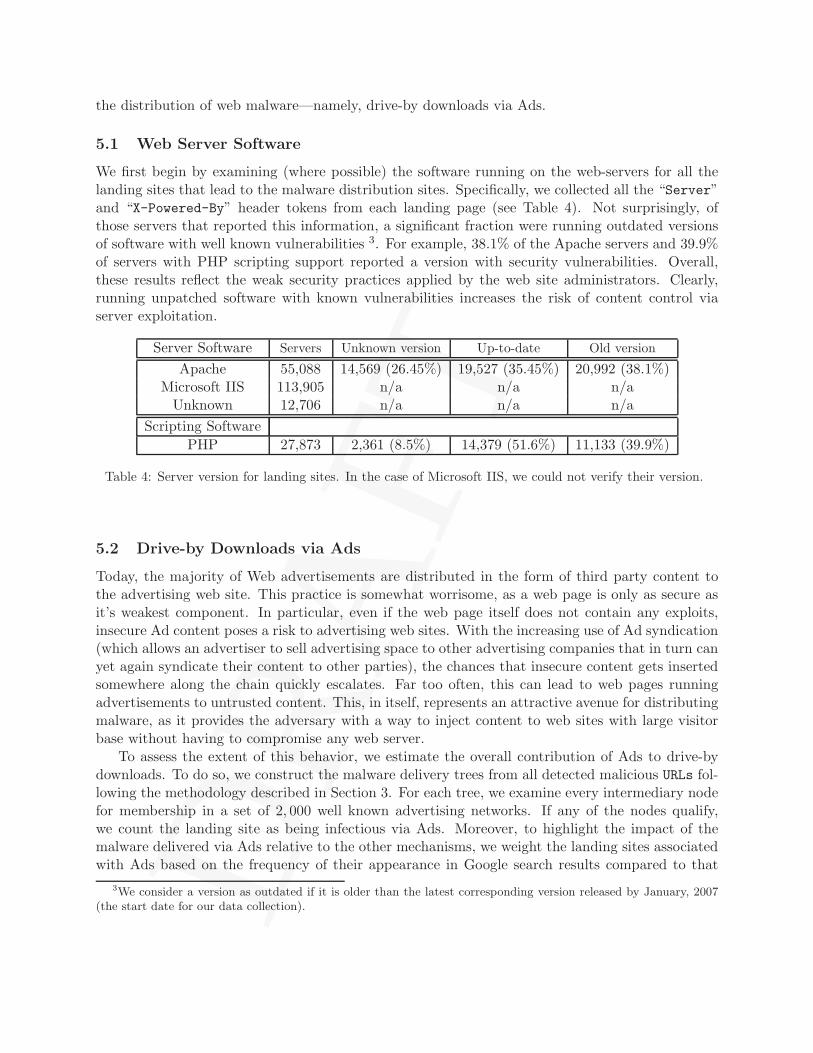
of all landing sites. Figure 5 shows the percentage of landing sites belonging to Ad networks. Onaverage, 2% of the landing sites were delivering malware via advertisements. More importantly, theoverall weighted share for those sites was substantial—on average, 12% of the overall search resultsthat returned landing pages were associated with malicious content due to unsafe Ads. This resultcan be explained by the fact that Ads normally target popular web sites, and so have a much widerreach. Consequently, even a small fraction of malicious Ads can have a major impact (comparedto the other delivery mechanisms).
Another interesting aspect of the results shown in Figure 5 is that Ad-delivered drive-by down-loads seem to appear in sudden short-lived spikes. This is likely due to the fact that Ads appearingon several advertising web sites are centrally controlled, and therefore allow the malicious contentto appear on thousands of web sites sites almost instantaneously. Similarity, once detected, theseAds are removed simultaneously, and so disappear as quickly as they appeared. For this reason,we notice that drive-by downloads delivered by other content injection techniques (e.g., individualweb servers compromise) have more lasting effect compared to Ad delivered malware, as each website must be secured independently.
03-2007 04-2007 05-2007 06-2007 07-2007 08-2007 09-2007 10-2007 11-2007Week analyzed
0
5
10
15
20
25
30
35
40
45
50
55
60
Per
cent
age
of m
alw
are
infe
ctio
ns v
ia a
dver
tisin
g Weighted by frequency of appearanceWeighted by unique landing sites
Figure 5: Percentage of landing sites potentiallyinfecting visitors via malicious advertisements,and their relative share in the search results.
0 2 4 6 8 10 12 14 16 18 20Number of redirection steps
0
0.2
0.4
0.6
0.8
1
CD
F
No AdsAds
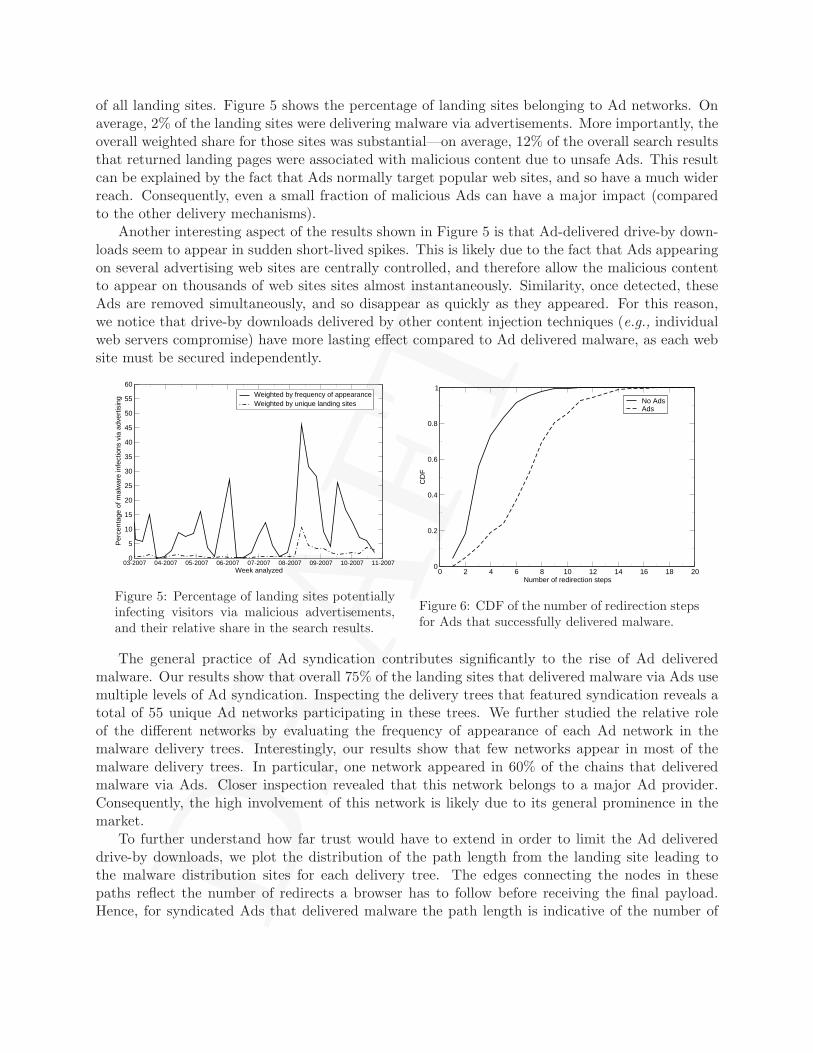
Figure 6: CDF of the number of redirection stepsfor Ads that successfully delivered malware.
The general practice of Ad syndication contributes significantly to the rise of Ad deliveredmalware. Our results show that overall 75% of the landing sites that delivered malware via Ads usemultiple levels of Ad syndication. Inspecting the delivery trees that featured syndication reveals atotal of 55 unique Ad networks participating in these trees. We further studied the relative roleof the different networks by evaluating the frequency of appearance of each Ad network in themalware delivery trees. Interestingly, our results show that few networks appear in most of themalware delivery trees. In particular, one network appeared in 60% of the chains that deliveredmalware via Ads. Closer inspection revealed that this network belongs to a major Ad provider.Consequently, the high involvement of this network is likely due to its general prominence in themarket.
To further understand how far trust would have to extend in order to limit the Ad delivereddrive-by downloads, we plot the distribution of the path length from the landing site leading tothe malware distribution sites for each delivery tree. The edges connecting the nodes in thesepaths reflect the number of redirects a browser has to follow before receiving the final payload.Hence, for syndicated Ads that delivered malware the path length is indicative of the number of
DR
AFT
syndication steps before reaching the final Ad; in our case, the malware payload. Figure 6 showsthe distribution of the number of redirects for syndicated Ads that delivered malware relative tothe other malicious landing URLs . The results are quite telling: malware delivered via Ads exhibitslonger delivery chains, in 50% percent of all cases, more than 6 redirection steps were requiredbefore receiving the malware payload. Clearly, it is increasingly difficult to maintain trust alongsuch long delivery chains.
Finally we further elucidate this problem via an interesting example from our data corpus.The landing page in our example refers to a Dutch radio station’s web site. The radio station inquestion was showing a banner advertisement from a German advertising site. Using JavaScript,that advertiser redirected to a prominent advertiser in the US, which in turn redirected to yetanother advertiser in the Netherlands. That advertiser redirected to another advertisement (alsoin the Netherlands) that contained obfuscated JavaScript, which when un-obfuscated, pointed toyet another JavaScript hosted in Austria. The final JavaScript was encrypted and redirected thebrowser via multiple IFRAMEs to adxtnet.net, an exploit site hosted in Austria. This resulted inthe automatic installation of multiple Trojan Downloaders. While it is unlikely that the initialadvertising companies were aware of the malware installations, each redirection gave another partycontrol over the content on the original web page—with predictable consequences.
6 Properties of the Malware Distribution Infrastructure
In this section, we explore various properties of the hosting infrastructure for web malware. Inparticular, we explore the size of of the malware distribution networks, and examine the distributionof binaries hosted across sites. We expand on each in turn.
6.1 Size of the Malware Distribution Networks
Recall that a malware distribution network constitutes all the landing sites that point to a sin-gle malware distribution site. Using the methodology described in Section 3, we identified thedistribution networks associated with each malware distribution site.
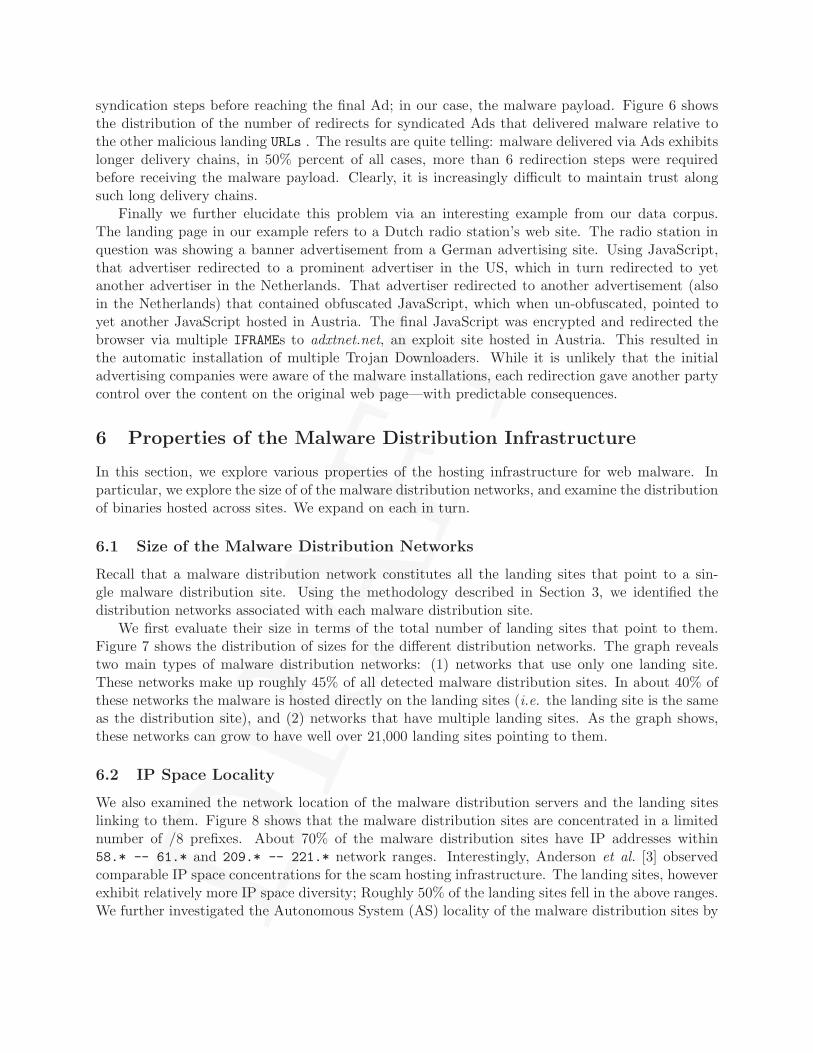
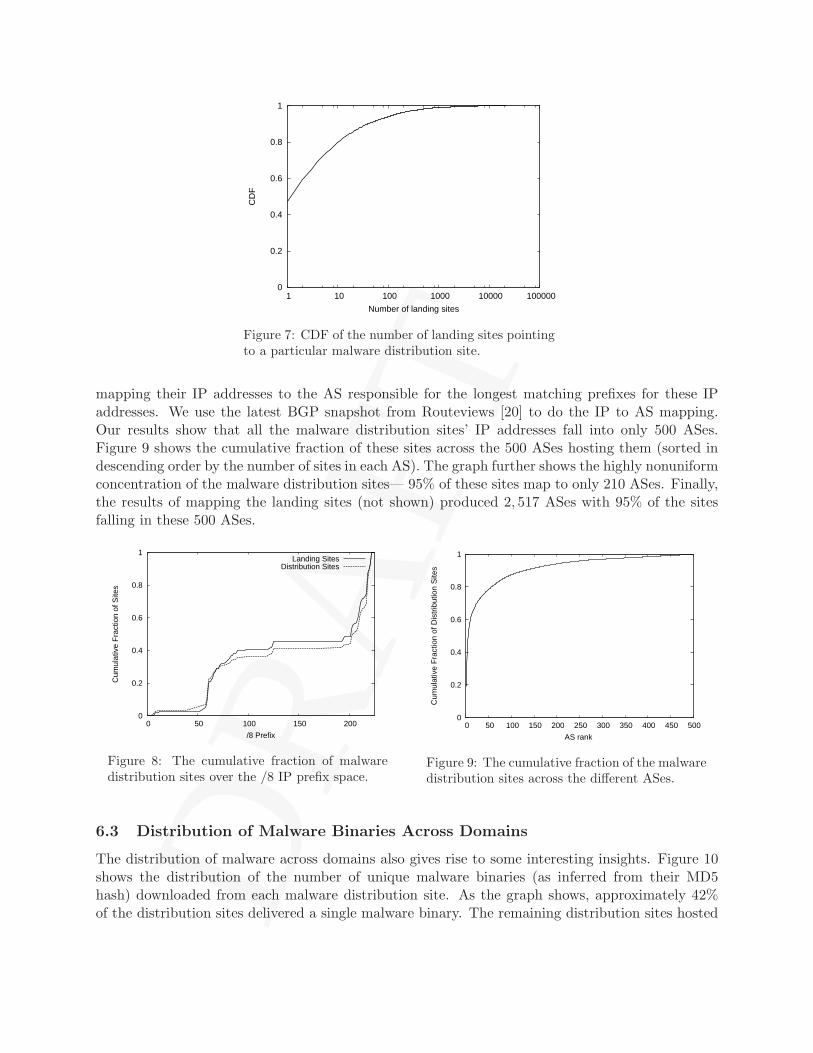
We first evaluate their size in terms of the total number of landing sites that point to them.Figure 7 shows the distribution of sizes for the different distribution networks. The graph revealstwo main types of malware distribution networks: (1) networks that use only one landing site.These networks make up roughly 45% of all detected malware distribution sites. In about 40% ofthese networks the malware is hosted directly on the landing sites (i.e. the landing site is the sameas the distribution site), and (2) networks that have multiple landing sites. As the graph shows,these networks can grow to have well over 21,000 landing sites pointing to them.
6.2 IP Space Locality
We also examined the network location of the malware distribution servers and the landing siteslinking to them. Figure 8 shows that the malware distribution sites are concentrated in a limitednumber of /8 prefixes. About 70% of the malware distribution sites have IP addresses within58.* -- 61.* and 209.* -- 221.* network ranges. Interestingly, Anderson et al. [3] observedcomparable IP space concentrations for the scam hosting infrastructure. The landing sites, howeverexhibit relatively more IP space diversity; Roughly 50% of the landing sites fell in the above ranges.We further investigated the Autonomous System (AS) locality of the malware distribution sites by
DR
AFT
0
0.2
0.4
0.6
0.8
1
1 10 100 1000 10000 100000
CD
F
Number of landing sites
Figure 7: CDF of the number of landing sites pointingto a particular malware distribution site.
mapping their IP addresses to the AS responsible for the longest matching prefixes for these IPaddresses. We use the latest BGP snapshot from Routeviews [20] to do the IP to AS mapping.Our results show that all the malware distribution sites’ IP addresses fall into only 500 ASes.Figure 9 shows the cumulative fraction of these sites across the 500 ASes hosting them (sorted indescending order by the number of sites in each AS). The graph further shows the highly nonuniformconcentration of the malware distribution sites— 95% of these sites map to only 210 ASes. Finally,the results of mapping the landing sites (not shown) produced 2, 517 ASes with 95% of the sitesfalling in these 500 ASes.
0
0.2
0.4
0.6
0.8
1
0 50 100 150 200
Cum
ulat
ive
Fra
ctio
n of
Site
s
/8 Prefix
Landing SitesDistribution Sites
Figure 8: The cumulative fraction of malwaredistribution sites over the /8 IP prefix space.
0
0.2
0.4
0.6
0.8
1
0 50 100 150 200 250 300 350 400 450 500
Cum
ulat
ive
Fra
ctio
n of
Dis
trib
utio
n S
ites
AS rank
Figure 9: The cumulative fraction of the malwaredistribution sites across the different ASes.
6.3 Distribution of Malware Binaries Across Domains
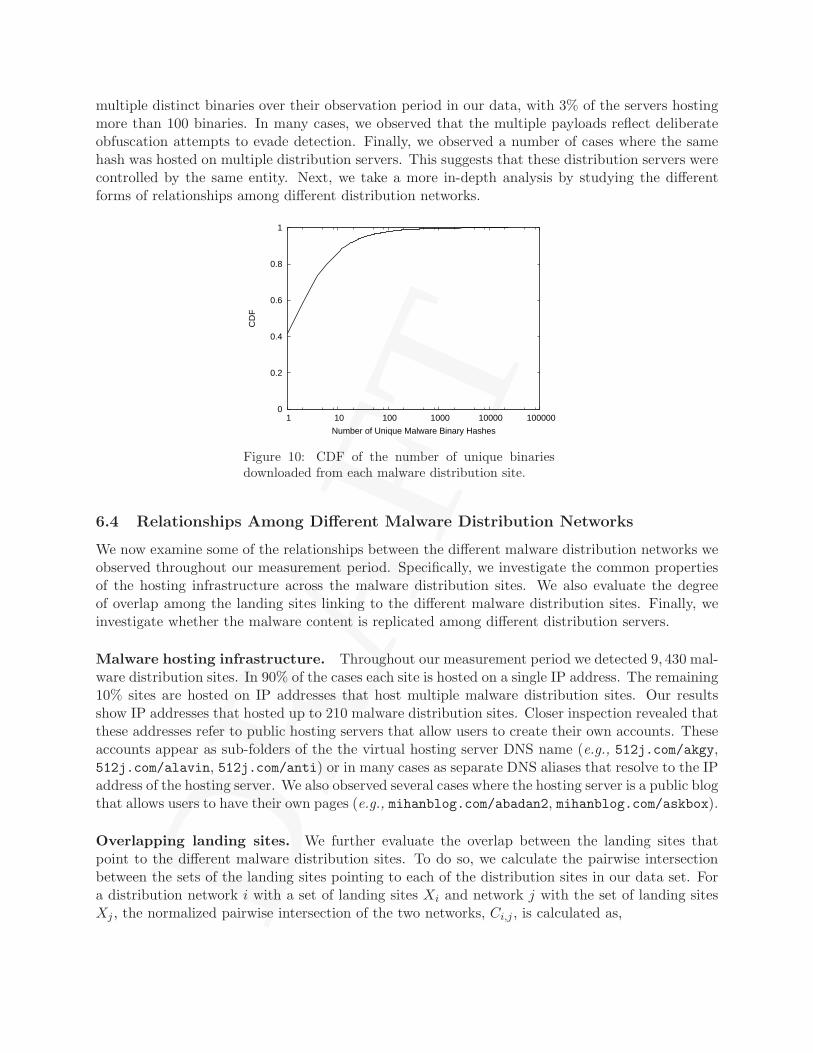
The distribution of malware across domains also gives rise to some interesting insights. Figure 10shows the distribution of the number of unique malware binaries (as inferred from their MD5hash) downloaded from each malware distribution site. As the graph shows, approximately 42%of the distribution sites delivered a single malware binary. The remaining distribution sites hosted
DR
AFT
multiple distinct binaries over their observation period in our data, with 3% of the servers hostingmore than 100 binaries. In many cases, we observed that the multiple payloads reflect deliberateobfuscation attempts to evade detection. Finally, we observed a number of cases where the samehash was hosted on multiple distribution servers. This suggests that these distribution servers werecontrolled by the same entity. Next, we take a more in-depth analysis by studying the differentforms of relationships among different distribution networks.
0
0.2
0.4
0.6
0.8
1
1 10 100 1000 10000 100000
CD
F
Number of Unique Malware Binary Hashes
Figure 10: CDF of the number of unique binariesdownloaded from each malware distribution site.
6.4 Relationships Among Different Malware Distribution Networks
We now examine some of the relationships between the different malware distribution networks weobserved throughout our measurement period. Specifically, we investigate the common propertiesof the hosting infrastructure across the malware distribution sites. We also evaluate the degreeof overlap among the landing sites linking to the different malware distribution sites. Finally, weinvestigate whether the malware content is replicated among different distribution servers.
Malware hosting infrastructure. Throughout our measurement period we detected 9, 430 mal-ware distribution sites. In 90% of the cases each site is hosted on a single IP address. The remaining10% sites are hosted on IP addresses that host multiple malware distribution sites. Our resultsshow IP addresses that hosted up to 210 malware distribution sites. Closer inspection revealed thatthese addresses refer to public hosting servers that allow users to create their own accounts. Theseaccounts appear as sub-folders of the the virtual hosting server DNS name (e.g., 512j.com/akgy,512j.com/alavin, 512j.com/anti) or in many cases as separate DNS aliases that resolve to the IPaddress of the hosting server. We also observed several cases where the hosting server is a public blogthat allows users to have their own pages (e.g., mihanblog.com/abadan2, mihanblog.com/askbox).
Overlapping landing sites. We further evaluate the overlap between the landing sites thatpoint to the different malware distribution sites. To do so, we calculate the pairwise intersectionbetween the sets of the landing sites pointing to each of the distribution sites in our data set. Fora distribution network i with a set of landing sites Xi and network j with the set of landing sitesXj , the normalized pairwise intersection of the two networks, Ci,j , is calculated as,
DR
AFT
Ci,j =|Xi ∩ Xj|
|Xi|(1)
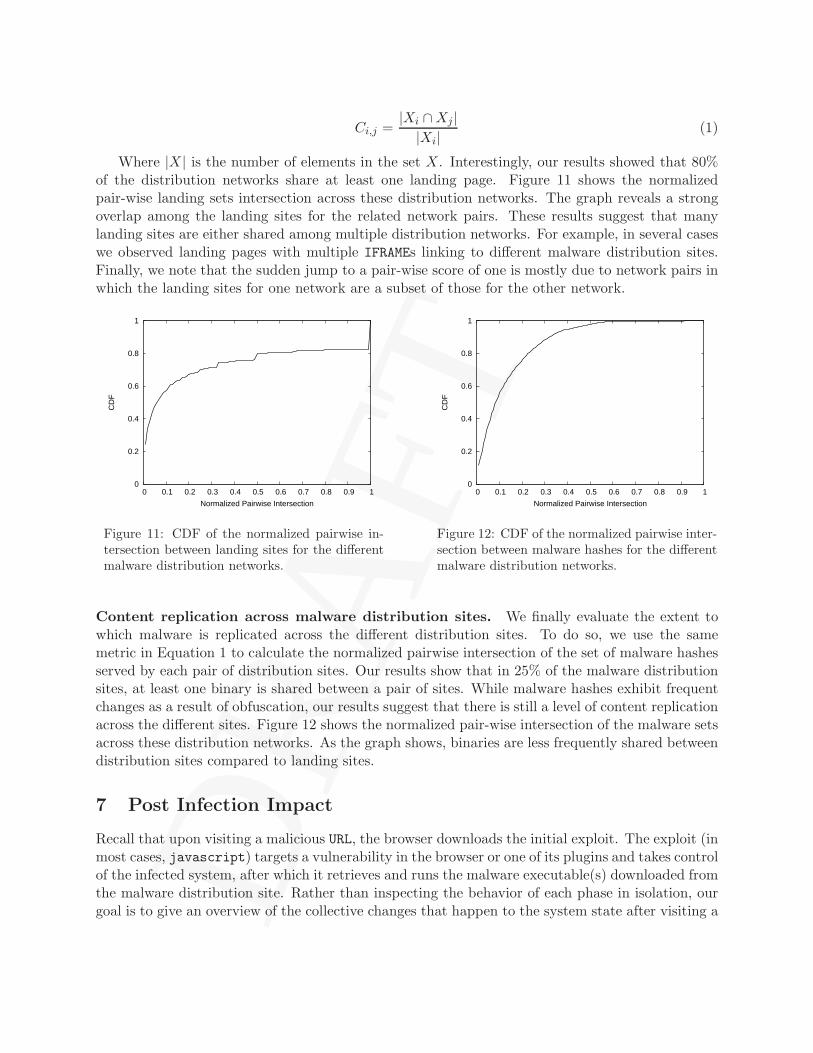
Where |X | is the number of elements in the set X. Interestingly, our results showed that 80%of the distribution networks share at least one landing page. Figure 11 shows the normalizedpair-wise landing sets intersection across these distribution networks. The graph reveals a strongoverlap among the landing sites for the related network pairs. These results suggest that manylanding sites are either shared among multiple distribution networks. For example, in several caseswe observed landing pages with multiple IFRAMEs linking to different malware distribution sites.Finally, we note that the sudden jump to a pair-wise score of one is mostly due to network pairs inwhich the landing sites for one network are a subset of those for the other network.
0
0.2
0.4
0.6
0.8
1
0 0.1 0.2 0.3 0.4 0.5 0.6 0.7 0.8 0.9 1
CD
F
Normalized Pairwise Intersection
Figure 11: CDF of the normalized pairwise in-tersection between landing sites for the differentmalware distribution networks.
0
0.2
0.4
0.6
0.8
1
0 0.1 0.2 0.3 0.4 0.5 0.6 0.7 0.8 0.9 1
CD
F
Normalized Pairwise Intersection
Figure 12: CDF of the normalized pairwise inter-section between malware hashes for the differentmalware distribution networks.
Content replication across malware distribution sites. We finally evaluate the extent towhich malware is replicated across the different distribution sites. To do so, we use the samemetric in Equation 1 to calculate the normalized pairwise intersection of the set of malware hashesserved by each pair of distribution sites. Our results show that in 25% of the malware distributionsites, at least one binary is shared between a pair of sites. While malware hashes exhibit frequentchanges as a result of obfuscation, our results suggest that there is still a level of content replicationacross the different sites. Figure 12 shows the normalized pair-wise intersection of the malware setsacross these distribution networks. As the graph shows, binaries are less frequently shared betweendistribution sites compared to landing sites.
7 Post Infection Impact
Recall that upon visiting a malicious URL, the browser downloads the initial exploit. The exploit (inmost cases, javascript) targets a vulnerability in the browser or one of its plugins and takes controlof the infected system, after which it retrieves and runs the malware executable(s) downloaded fromthe malware distribution site. Rather than inspecting the behavior of each phase in isolation, ourgoal is to give an overview of the collective changes that happen to the system state after visiting a
DR
AFT
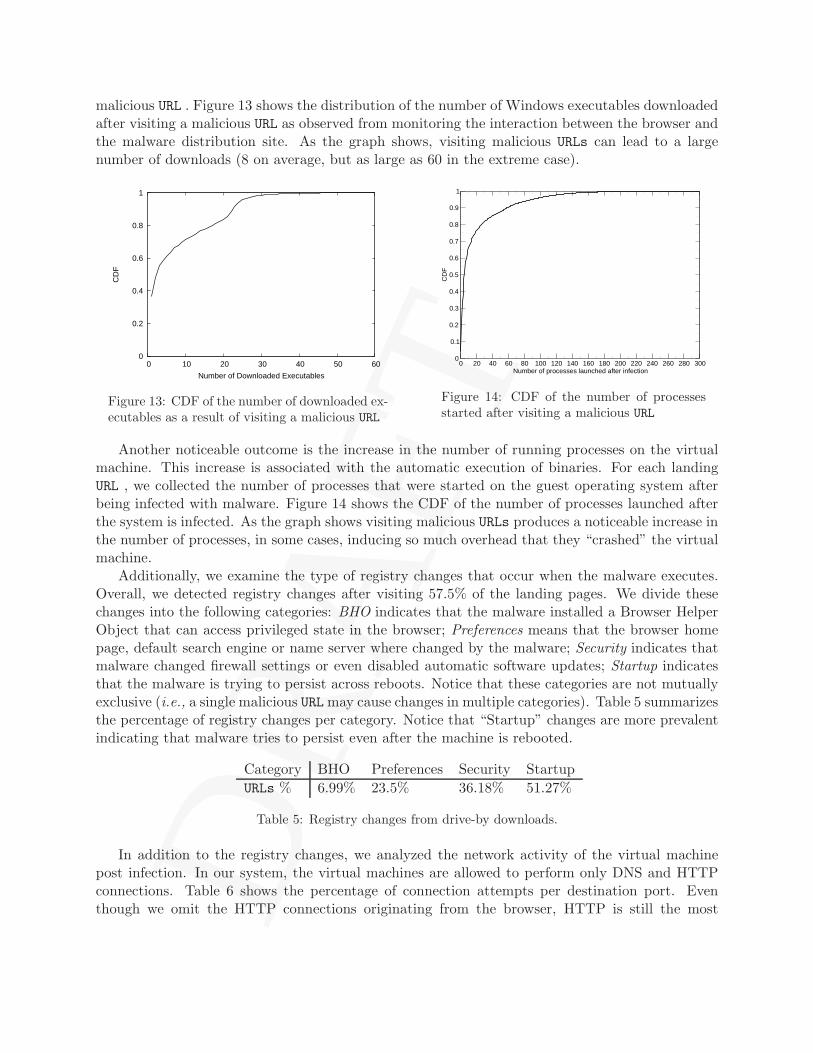
malicious URL . Figure 13 shows the distribution of the number of Windows executables downloadedafter visiting a malicious URL as observed from monitoring the interaction between the browser andthe malware distribution site. As the graph shows, visiting malicious URLs can lead to a largenumber of downloads (8 on average, but as large as 60 in the extreme case).
0
0.2
0.4
0.6
0.8
1
0 10 20 30 40 50 60
CD
F
Number of Downloaded Executables
Figure 13: CDF of the number of downloaded ex-ecutables as a result of visiting a malicious URL
0 20 40 60 80 100 120 140 160 180 200 220 240 260 280 300Number of processes launched after infection
0
0.1
0.2
0.3
0.4
0.5
0.6
0.7
0.8
0.9
1
CD
F
Figure 14: CDF of the number of processesstarted after visiting a malicious URL
Another noticeable outcome is the increase in the number of running processes on the virtualmachine. This increase is associated with the automatic execution of binaries. For each landingURL , we collected the number of processes that were started on the guest operating system afterbeing infected with malware. Figure 14 shows the CDF of the number of processes launched afterthe system is infected. As the graph shows visiting malicious URLs produces a noticeable increase inthe number of processes, in some cases, inducing so much overhead that they “crashed” the virtualmachine.
Additionally, we examine the type of registry changes that occur when the malware executes.Overall, we detected registry changes after visiting 57.5% of the landing pages. We divide thesechanges into the following categories: BHO indicates that the malware installed a Browser HelperObject that can access privileged state in the browser; Preferences means that the browser homepage, default search engine or name server where changed by the malware; Security indicates thatmalware changed firewall settings or even disabled automatic software updates; Startup indicatesthat the malware is trying to persist across reboots. Notice that these categories are not mutuallyexclusive (i.e., a single malicious URL may cause changes in multiple categories). Table 5 summarizesthe percentage of registry changes per category. Notice that “Startup” changes are more prevalentindicating that malware tries to persist even after the machine is rebooted.
Category BHO Preferences Security Startup
URLs % 6.99% 23.5% 36.18% 51.27%
Table 5: Registry changes from drive-by downloads.
In addition to the registry changes, we analyzed the network activity of the virtual machinepost infection. In our system, the virtual machines are allowed to perform only DNS and HTTPconnections. Table 6 shows the percentage of connection attempts per destination port. Eventhough we omit the HTTP connections originating from the browser, HTTP is still the most
DR
AFT
prevalent port for malicious activity post-infection. This is due to “downloader” binaries that fetch,in some cases, up to 60 binaries over HTTP. We also observe a significant percentage of connectionattempts to typical IRC ports, accounting for more than 50% of all non-HTTP connections. Asa number of earlier studies have already shown (e.g., [4, 16, 6, 18, 19, 10]), the IRC connectionattempts are most likely for unwillingly (to the owner) adding the compromised machine to an IRCbotnet, confirming the earlier conjecture by Provos et al. [17] regarding the connection betweenweb malware and botnets.
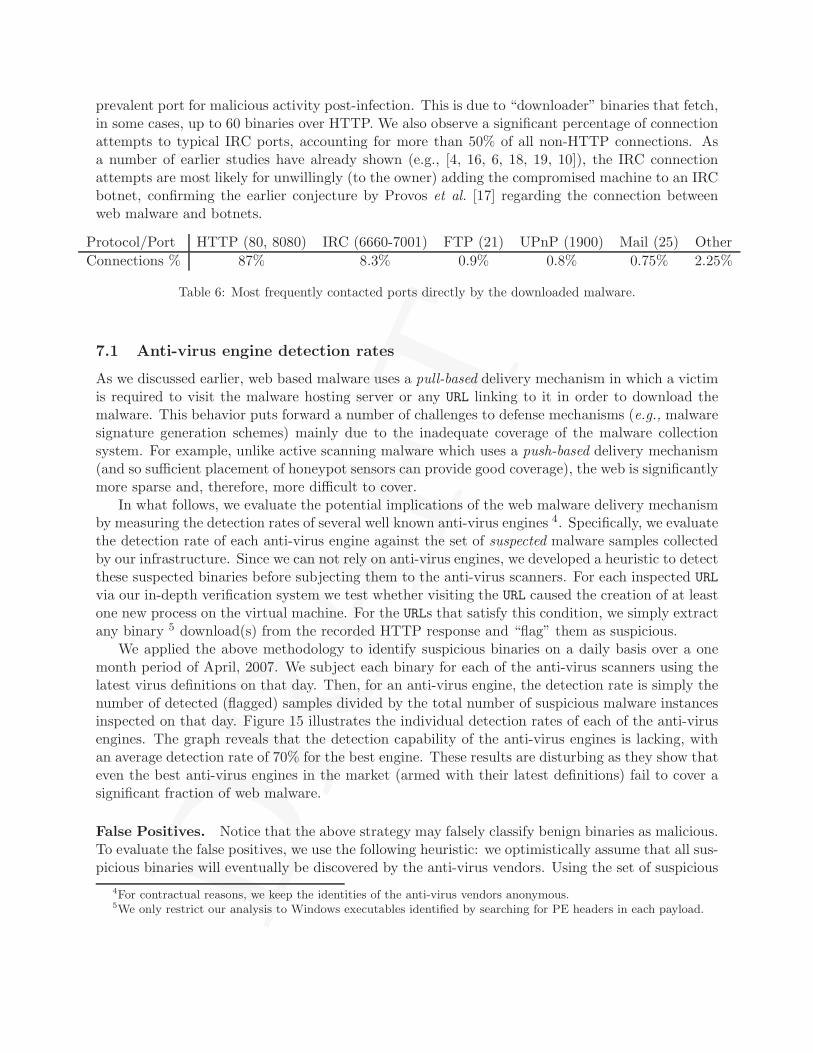
Protocol/Port HTTP (80, 8080) IRC (6660-7001) FTP (21) UPnP (1900) Mail (25) Other
Connections % 87% 8.3% 0.9% 0.8% 0.75% 2.25%
Table 6: Most frequently contacted ports directly by the downloaded malware.
7.1 Anti-virus engine detection rates
As we discussed earlier, web based malware uses a pull-based delivery mechanism in which a victimis required to visit the malware hosting server or any URL linking to it in order to download themalware. This behavior puts forward a number of challenges to defense mechanisms (e.g., malwaresignature generation schemes) mainly due to the inadequate coverage of the malware collectionsystem. For example, unlike active scanning malware which uses a push-based delivery mechanism(and so sufficient placement of honeypot sensors can provide good coverage), the web is significantlymore sparse and, therefore, more difficult to cover.
In what follows, we evaluate the potential implications of the web malware delivery mechanismby measuring the detection rates of several well known anti-virus engines 4. Specifically, we evaluatethe detection rate of each anti-virus engine against the set of suspected malware samples collectedby our infrastructure. Since we can not rely on anti-virus engines, we developed a heuristic to detectthese suspected binaries before subjecting them to the anti-virus scanners. For each inspected URL
via our in-depth verification system we test whether visiting the URL caused the creation of at leastone new process on the virtual machine. For the URLs that satisfy this condition, we simply extractany binary 5 download(s) from the recorded HTTP response and “flag” them as suspicious.
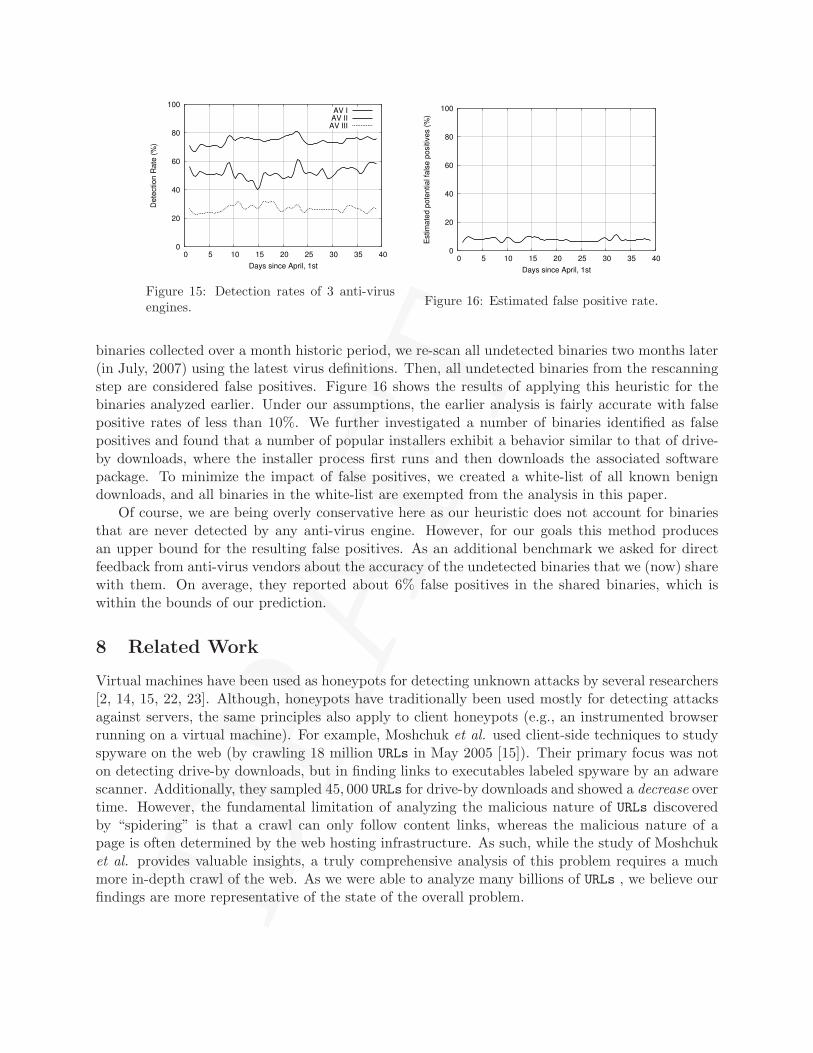
We applied the above methodology to identify suspicious binaries on a daily basis over a onemonth period of April, 2007. We subject each binary for each of the anti-virus scanners using thelatest virus definitions on that day. Then, for an anti-virus engine, the detection rate is simply thenumber of detected (flagged) samples divided by the total number of suspicious malware instancesinspected on that day. Figure 15 illustrates the individual detection rates of each of the anti-virusengines. The graph reveals that the detection capability of the anti-virus engines is lacking, withan average detection rate of 70% for the best engine. These results are disturbing as they show thateven the best anti-virus engines in the market (armed with their latest definitions) fail to cover asignificant fraction of web malware.
False Positives. Notice that the above strategy may falsely classify benign binaries as malicious.To evaluate the false positives, we use the following heuristic: we optimistically assume that all sus-picious binaries will eventually be discovered by the anti-virus vendors. Using the set of suspicious
4For contractual reasons, we keep the identities of the anti-virus vendors anonymous.5We only restrict our analysis to Windows executables identified by searching for PE headers in each payload.
DR
AFT
0
20
40
60
80
100
0 5 10 15 20 25 30 35 40
De
tectio
n R
ate
(%
)
Days since April, 1st
AV IAV IIAV III
Figure 15: Detection rates of 3 anti-virusengines.
0
20
40
60
80
100
0 5 10 15 20 25 30 35 40
Estim
ate
d p
ote
ntia
l fa
lse
po
sitiv
es (
%)
Days since April, 1st
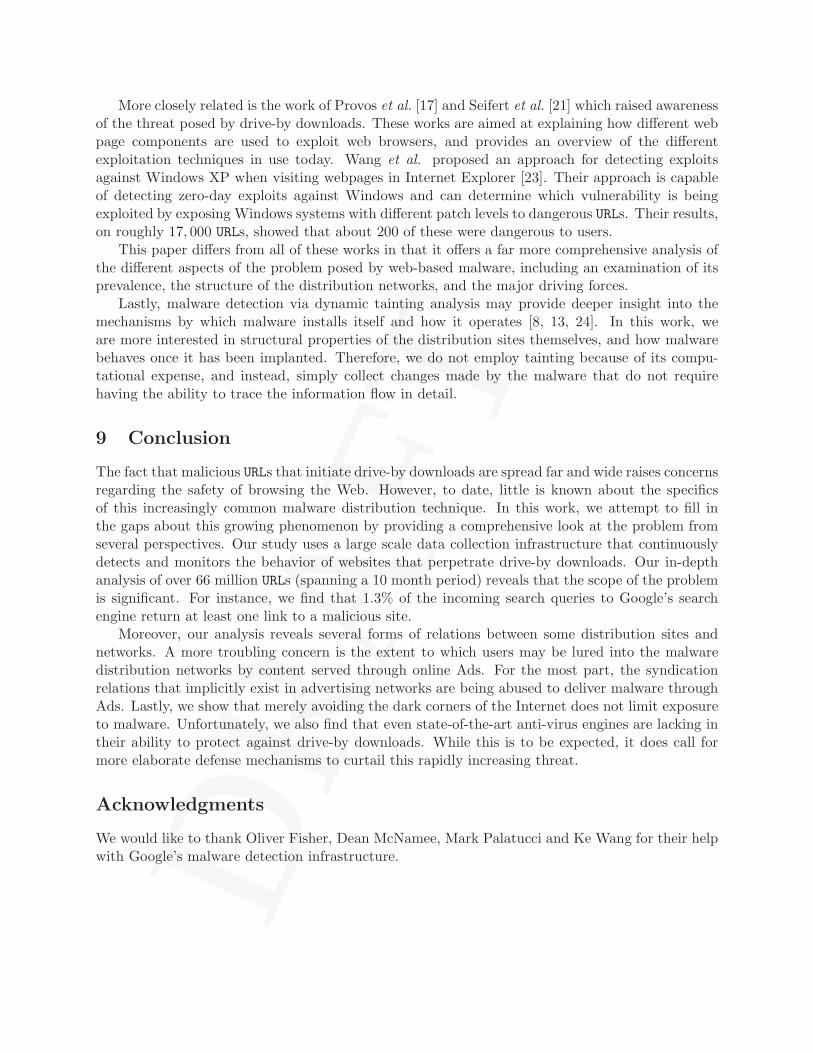
Figure 16: Estimated false positive rate.
binaries collected over a month historic period, we re-scan all undetected binaries two months later(in July, 2007) using the latest virus definitions. Then, all undetected binaries from the rescanningstep are considered false positives. Figure 16 shows the results of applying this heuristic for thebinaries analyzed earlier. Under our assumptions, the earlier analysis is fairly accurate with falsepositive rates of less than 10%. We further investigated a number of binaries identified as falsepositives and found that a number of popular installers exhibit a behavior similar to that of drive-by downloads, where the installer process first runs and then downloads the associated softwarepackage. To minimize the impact of false positives, we created a white-list of all known benigndownloads, and all binaries in the white-list are exempted from the analysis in this paper.
Of course, we are being overly conservative here as our heuristic does not account for binariesthat are never detected by any anti-virus engine. However, for our goals this method producesan upper bound for the resulting false positives. As an additional benchmark we asked for directfeedback from anti-virus vendors about the accuracy of the undetected binaries that we (now) sharewith them. On average, they reported about 6% false positives in the shared binaries, which iswithin the bounds of our prediction.
8 Related Work
Virtual machines have been used as honeypots for detecting unknown attacks by several researchers[2, 14, 15, 22, 23]. Although, honeypots have traditionally been used mostly for detecting attacksagainst servers, the same principles also apply to client honeypots (e.g., an instrumented browserrunning on a virtual machine). For example, Moshchuk et al. used client-side techniques to studyspyware on the web (by crawling 18 million URLs in May 2005 [15]). Their primary focus was noton detecting drive-by downloads, but in finding links to executables labeled spyware by an adwarescanner. Additionally, they sampled 45, 000 URLs for drive-by downloads and showed a decrease overtime. However, the fundamental limitation of analyzing the malicious nature of URLs discoveredby “spidering” is that a crawl can only follow content links, whereas the malicious nature of apage is often determined by the web hosting infrastructure. As such, while the study of Moshchuket al. provides valuable insights, a truly comprehensive analysis of this problem requires a muchmore in-depth crawl of the web. As we were able to analyze many billions of URLs , we believe ourfindings are more representative of the state of the overall problem.
DR
AFT
More closely related is the work of Provos et al. [17] and Seifert et al. [21] which raised awarenessof the threat posed by drive-by downloads. These works are aimed at explaining how different webpage components are used to exploit web browsers, and provides an overview of the differentexploitation techniques in use today. Wang et al. proposed an approach for detecting exploitsagainst Windows XP when visiting webpages in Internet Explorer [23]. Their approach is capableof detecting zero-day exploits against Windows and can determine which vulnerability is beingexploited by exposing Windows systems with different patch levels to dangerous URLs. Their results,on roughly 17, 000 URLs, showed that about 200 of these were dangerous to users.
This paper differs from all of these works in that it offers a far more comprehensive analysis ofthe different aspects of the problem posed by web-based malware, including an examination of itsprevalence, the structure of the distribution networks, and the major driving forces.
Lastly, malware detection via dynamic tainting analysis may provide deeper insight into themechanisms by which malware installs itself and how it operates [8, 13, 24]. In this work, weare more interested in structural properties of the distribution sites themselves, and how malwarebehaves once it has been implanted. Therefore, we do not employ tainting because of its compu-tational expense, and instead, simply collect changes made by the malware that do not requirehaving the ability to trace the information flow in detail.
9 Conclusion
The fact that malicious URLs that initiate drive-by downloads are spread far and wide raises concernsregarding the safety of browsing the Web. However, to date, little is known about the specificsof this increasingly common malware distribution technique. In this work, we attempt to fill inthe gaps about this growing phenomenon by providing a comprehensive look at the problem fromseveral perspectives. Our study uses a large scale data collection infrastructure that continuouslydetects and monitors the behavior of websites that perpetrate drive-by downloads. Our in-depthanalysis of over 66 million URLs (spanning a 10 month period) reveals that the scope of the problemis significant. For instance, we find that 1.3% of the incoming search queries to Google’s searchengine return at least one link to a malicious site.
Moreover, our analysis reveals several forms of relations between some distribution sites andnetworks. A more troubling concern is the extent to which users may be lured into the malwaredistribution networks by content served through online Ads. For the most part, the syndicationrelations that implicitly exist in advertising networks are being abused to deliver malware throughAds. Lastly, we show that merely avoiding the dark corners of the Internet does not limit exposureto malware. Unfortunately, we also find that even state-of-the-art anti-virus engines are lacking intheir ability to protect against drive-by downloads. While this is to be expected, it does call formore elaborate defense mechanisms to curtail this rapidly increasing threat.
Acknowledgments
We would like to thank Oliver Fisher, Dean McNamee, Mark Palatucci and Ke Wang for their helpwith Google’s malware detection infrastructure.
DR
AFT
References
[1] The open directory project. See http://www.news.com/2100-1023-877568.html.
[2] K. G. Anagnostakis, S. Sidiroglou, P. Akritidis, K. Xinidis, E. Markatos, and A. D. Keromytis.Detecting Targeted Attacks Using Shadow Honeypots. August 2005.
[3] David S. Anderson, Chris Fleizach, Stefan Savage, and Geoffrey M. Voelker. Spamscatter:Characterizing Internet Scam Hosting Infrastructure. In Proceedings of the USENIX SecuritySymposium, August 2007.
[4] Paul Barford and Vinod Yagneswaran. An Inside Look at Botnets. Advances in InformationSecurity. Springer, 2007.
[5] Jermey Bem, Georges Harik, Joshua Levenberg, Noam Shazeer, and Simon Tong. Large scalemachine learning and methods. US Patent: 7222127.
[6] Evan Cooke, Farnam Jahanian, and Danny McPherson. The Zombie Roundup: Understanding,Detecting, and Disturbing Botnets. In Proceedings of the first Workshop on Steps to ReducingUnwanted Traffic on the Internet, July 2005.
[7] Jeffrey Dean and Sanjay Ghemawat. Mapreduce: Simplified data processing on large clusters.In Proceedings of the Sixth Symposium on Operating System Design and Implementation, pages137–150, Dec 2004.
[8] Manuel Egele, Christopher Kruegel, Engin Kirda, Heng Yin, and Dawn Song. Dynamic Spy-ware Analysis. In Proceedings of the USENIX Annual Technical Conference, June 2007.
[9] Jason Franklin, Vern Paxson, Adrian Perrig, and Stefan Savage. An Inquiry into the Natureand Causes of the Wealth of Internet Miscreants. In Proceedings of the ACM Conference onComputer and Communications Security (CCS), October 2007.
[10] Guofei Gu, Phillip Porras, Vinod Yegneswaran, Martin Fong, and Wenke Lee. BotHunter:Detecting Malware Infection through IDS-driven Dialog Correlation. In Proceedings of the16th USENIX Security Symposium, pages 167–182, 2007.
[11] Nagendra Modadugu. Web Server Software and Malware, June 2007. See http:
//googleonlinesecurity.blogspot.com/2007/06/web-server-software-and-malware.
html.
[12] David Moore, Geoffrey M. Voelker, and Stefan Savage. Inferring Internet Denial of ServiceActivity. In Proceedings of 10th USENIX Security Symposium, August 2001.
[13] A. Moser, C. Kruegel, and E. Kirda. Exploring Multiple Execution Paths for Malware Analysis.In Proceedings of the 2007 IEEE Symposium on Security and Privacy, May 2007.
[14] A. Moshchuk, T. Bragin, D. Deville, S.D. Gribble, and H.M. Levy. SpyProxy: Execution-basedDetection of Malicious Web Content. August 2007.
[15] Alexander Moshchuk, Tanya Bragin, Steven Gribble, and Henry Levy. A crawler-based studyof spyware in the web. In Proceedings of Network and Distributed Systems Security Symposium,2006.
DR
AFT
[16] Honeynet Project and Research Alliance. Know your enemy: Tracking Botnets, March 2005.See http://www.honeynet.org/papers/bots/.
[17] Niels Provos, Dean McNamee, Panayiotis Mavrommatis, Ke Wang, and Nagendra Modadugu.The Ghost in the Browser: Analysis of Web-based Malware. In Proceedings of the first USENIXworkshop on hot topics in Botnets (HotBots’07)., April 2007.
[18] Moheeb Abu Rajab, Jay Zarfoss, Fabian Monrose, and Andreas Terzis. A MultifacetedApproach to Understanding the Botnet Phenomenon. In Proceedings of ACM SIG-COMM/USENIX Internet Measurement Conference (IMC), pages 41–52, Oct., 2006.
[19] Anirudh Ramachandran, Nick Feamster, and David Dagon. Revealing Botnet Membershipusing DNSBL Counter-Intelligence. In Proceedings of the 2nd Workshop on Steps to ReducingUnwanted Traffic on the Internet (SRUTI), July 2006.
[20] The Route Views Project. http://www.antc.uoregon.edu/route-views/.
[21] Christian Seifert, Ramon Steenson, Thorsten Holz, Yuan Bing, and Michael A. Davis. KnowYour Enemy: Malicious Web Servers. http://www.honeynet.org/papers/mws/, August 2007.
[22] Yi-Min Wang, Doug Beck, Xuxian Jiang, Roussi Roussev, Chad Verbowski, Shuo Chen, andSam King. Automated web patrol with strider honeymonkeys. In Proceedings of Network andDistributed Systems Security Symposium, pages 35–49, 2006.
[23] Yi-Min Wang, Yuan Niu, Hao Chen, Doug Beck, Xuxian Jiang, Roussi Roussev, Chad Ver-bowski, Shuo Chen, and Sam King. Strider honeymonkeys: Active, client-side honeypots forfinding malicious websites. 2007. See http://research.microsoft.com/users/shuochen/
HM.PDF.
[24] H. Yin, D. Song, M. Egele, C. Kruegel, and E. Kirda. Panorama: Capturing System-wideInformation Flow for Malware Detection and Analysis. In Proceedings of the 14th ACM Con-ference of Computer and Communication Security, October 2007.