Goods Movement Plan Exec Summ · PDF fileii San Francisco Bay Area Regional Goods Movement...
20
Executive Summary i San Francisco Bay Area Goods Movement Plan Executive Summary MARCH 2016
Transcript of Goods Movement Plan Exec Summ · PDF fileii San Francisco Bay Area Regional Goods Movement...

Executive Summary i
San Francisco Bay Area Goods Movement Plan
Executive SummaryMARCH 2016

ii San Francisco Bay Area Regional Goods Movement Plan
COMMISSIONERSDave Cortese, ChairSanta Clara County
Jake Mackenzie, Vice ChairSonoma County and Cities
Alicia C. AguirreCities of San Mateo County
Tom AzumbradoU.S. Department of Housing and Urban Development
Jason Baker Cities of Santa Clara County
Tom BatesCities of Alameda County
David CamposCity and County of San Francisco
Dorene M. GiacopiniU.S. Department of Transportation
Federal D. GloverContra Costa County
Scott HaggertyAlameda County
Anne W. HalstedSan Francisco Bay Conservation and Development Commission
Steve KinseyMarin County and Cities
Sam LiccardoSan Jose Mayor’s Appointee
Mark LuceNapa County and Cities
Julie PierceAssociation of Bay Area Governments
Bijan SartipiCalifornia State Transportation Agency
Libby SchaafOakland Mayor’s Appointee
James P. SperingSolano County and Cities
Adrienne J. TissierSan Mateo County
Scott WienerSan Francisco Mayor’s Appointee
Amy Rein WorthCities of Contra Costa County
View the complete San Francisco Bay Area Goods Movement Plan at:
http://mtc.ca.gov/our-work/plans-projects/economic-vitality/regional-goods-movement-planCover photo: ©iStock

Executive Summary 1
Goods movement has always played a central role in the economy of the San Francisco Bay Area.
The regional goods movement infrastructure includes the nation’s fifth-largest container port (the Port of Oakland) and several specialized seaports; two of the most active air cargo airports in the Western U.S. (San Francisco International Airport and Oakland International Airport); major rail lines and rail terminals; and highways that carry some of the highest volumes of trucks in California. This infrastructure also is of critical importance to the Northern California megaregion. But as the Bay Area’s economy and planning priorities have evolved, we must reconsider goods movement’s role in the regional transportation system. Some of the changes the region has experienced that will influence our approach to goods movement include:
• Changes in industry mix and downward pressure on middle-wage jobs. The economy
has shifted away from the manufacturing
and warehouse/distribution industries that
dominated the goods movement picture in the
last century, and has moved toward technology
and knowledge-based industries. This change
in the economy has reduced opportunities for
workers in middle-wage occupations with low
educational barriers to entry.
• Changes in land use development patterns and the location of goods distribution facilities. In
recent years there has been a growing focus on
planning for compact development in Priority
Development Areas adjacent to transit. This can
create redevelopment pressure in older industrial
centers, leading to conflicts between goods
movement and passenger transportation modes
on congested roadways and rail lines. As land
values have risen, much of the region’s distribution
network for consumer goods has moved to
the northern San Joaquin Valley and northern
Nevada. This is exacerbating congestion and safety
conditions on the region’s inter-regional highways.
• Urgency to address environmental justice issues while reducing greenhouse gas emissions. Along with the region’s concern
over housing affordability comes an overarching
concern about equity in land use and
transportation decisions. The region’s major
goods movement corridors and facilities
Por
t of
Oak
land

2 San Francisco Bay Area Regional Goods Movement Plan
tend to be concentrated in close proximity
to communities where environmental justice
concerns are significant, and continued
investment in goods movement in these
corridors must minimize impacts on these
communities. At a broader level, the region
continues to pursue strategies to address climate
change and environmental sustainability goals
as a core component of its transportation plans.
This will require new approaches and new
technologies for goods movement.
In response to these challenges, MTC has developed the San Francisco Bay Area Goods Movement Plan to outline a long-range strategy for moving goods effectively within, to, from and through the Bay Area by roads, rail, air and water. The plan provides specific strategies — projects, programs and policies — focused on goods
movement that will ultimately inform the upcoming, long-range Plan Bay Area 2040, the regional transportation plan and sustainable communities strategy.
Goods Movement and the Bay Area EconomyA significant share of the Bay Area economy is associated with goods movement-dependent industries. Many of the goods movement jobs in the transportation, warehousing and logistics fields compose a significant share of so-called “industries of opportunity” — industries that provide a high percentage of living-wage jobs, low educational barriers to entry, and job security for a range of positions. In addition, many of these occupations are expected to be in high demand and located in areas near high-quality transit. The average hourly wages for some of these goods movement occupations are near to or above the median hourly wages for all occupations. These are good jobs that will help drive regional economic growth.
Priority Goods Movement Opportunities for the Bay AreaIn order to address the needs, deficiencies and gaps in the Bay Area’s goods movement system, a wide variety of strategies — projects, programs and policies — were proposed and evaluated using the performance measures developed for this plan. Highly rated strategies were then combined into “opportunity packages” to articulate the core priorities of the plan and show how different strategies can be coordinated during implementation.
A key element of the opportunity packages is the concept of the “balanced portfolio.” Each strategy was evaluated against the performance measures developed for the plan and only highly rated strategies are included in the final packages. However, a strategy may have a very high rating
Pet
er B
eele
r
Executive Summary 3
on one performance measure but a lower rating on another performance measure. The goal of assembling the strategies in packages is to ensure that the package as a whole performs well against all of the performance measures.
• Opportunity Package 1: Building Sustainable Global Competitiveness — This opportunity
package (see page 12) builds on the unique
combination of assets around the Port of
Oakland, Oakland International Airport, and
the redevelopment of the Oakland Army Base.
It recommends investments to transform this
complex into a world-class logistics hub. The
investment approach emphasizes improvements
that will support the types of logistics activity
most likely to create middle-wage jobs, and
couples job training and workforce development
to ensure that local residents can benefit from
this activity.
A critical element of the infrastructure
investments involves improved rail connections
(see graphic on page 8), which have the
potential to remove over a thousand trucks per
day from the most congested freight highway
corridors. These rail improvements also will
bring benefits to the region’s niche ports that
have opportunities to expand their markets for
importing/exporting automobiles, bulk mineral
products, and construction products and
equipment. More efficient rail/port connections
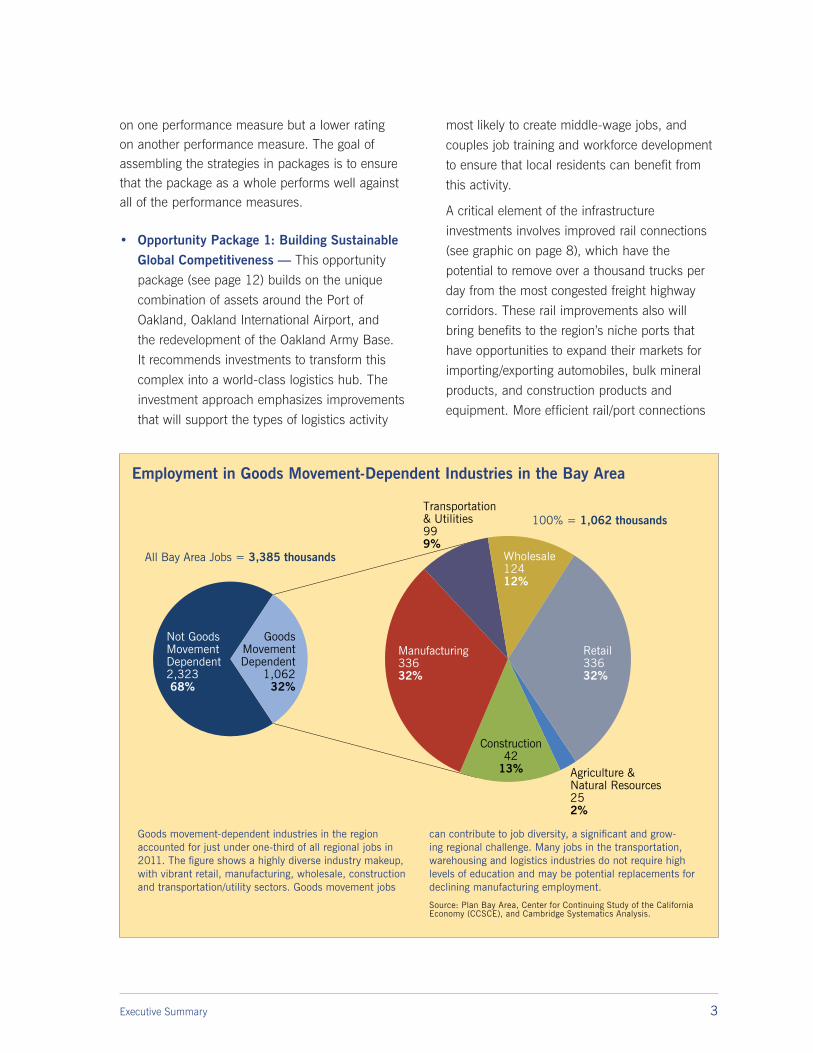
Employment in Goods Movement-Dependent Industries in the Bay Area
Not GoodsMovementDependent2,323 68%
Agriculture & Natural Resources252%
Construction42
13%
Manufacturing33632%
Transportation & Utilities99 9%
Wholesale12412%
Retail33632%
GoodsMovementDependent
1,06232%
All Bay Area Jobs = 3,385 thousands
100% = 1,062 thousands
Goods movement-dependent industries in the region accounted for just under one-third of all regional jobs in 2011. The figure shows a highly diverse industry makeup, with vibrant retail, manufacturing, wholesale, construction and transportation/utility sectors. Goods movement jobs
can contribute to job diversity, a significant and grow-ing regional challenge. Many jobs in the transportation, warehousing and logistics industries do not require high levels of education and may be potential replacements for declining manufacturing employment. Source: Plan Bay Area, Center for Continuing Study of the California Economy (CCSCE), and Cambridge Systematics Analysis.

4 San Francisco Bay Area Regional Goods Movement Plan
also will relieve congestion on the highway
system. Technology and operational strategies
also are included to reduce impacts of goods
movement activity on the health, safety and
quality of life in neighboring communities.
• Opportunity Package 2: Smart Deliveries and Operations — Many segments of the Bay
Area’s surface transportation system are largely
built out, with limited opportunities to build new
capacity through added lanes or new corridors.
These conditions give the region a clear
incentive to support maximum use of Intelligent
Transportation Systems (ITS), connected
vehicles, and other technology solutions to more
effi ciently use existing roadway capacity. This
opportunity can be broadened to encompass
new technologies and operating practices that
will lead to a more sustainable freight system,
help manage local traffi c and reduce confl icts.
Elements of this opportunity package (see
page 13) will take advantage of the innovation
economy and technology sectors in the Bay
Area, making them an integral provider of the
systems that will be needed to advance the
strategies included in this package. This package
also includes more effi cient use of the existing
system through innovative logistics practices,
including incentives to building owners to
encourage off-peak deliveries and extended gate
hours at the region’s ports.
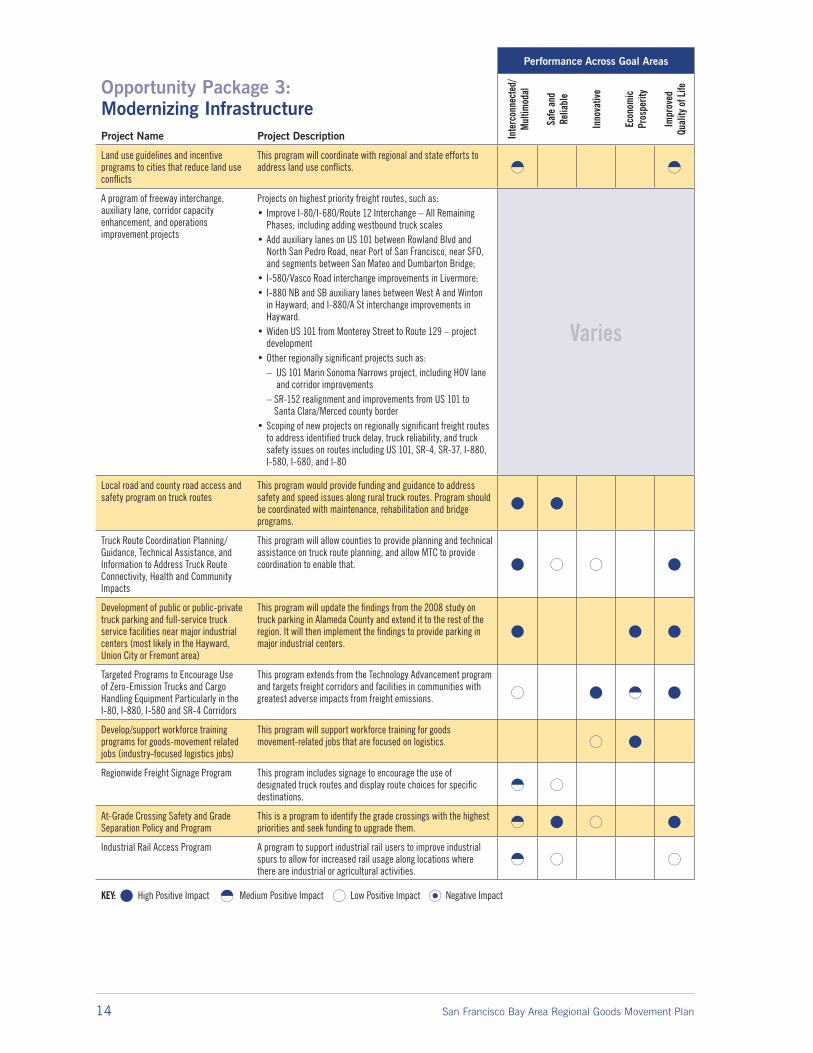
• Opportunity Package 3: Modernizing Infrastructure — The continued growth in
traffi c is putting additional pressure on goods
movement infrastructure which supports a mix
of traditional as well as emerging industries. The
region’s seaports and airports continue to play
an important role for businesses and consumers
throughout Northern California and neighboring
states. This opportunity package (see page
14) focuses on modernizing the road network
in industrial corridors; improving safe access
to industrial corridors and facilities; reducing
land use confl icts along freight corridors;
and improving last-mile truck routes and rail
connections to existing and emerging industries.
When making investments in these systems,
Pet
er B
eele
r

Executive Summary 5
NOTE: Major truck routes have 2011 Truck (3+ axles) Average Annual Daily Truck volume (AADT)>3000*Class 1 Rail = Union Paci�c or Burlington Northern Santa Fe ownership or operationMTC Graphics.pb — 2.29.20160
0
10 20 30
10 20 30 40
Miles
Kilometers
NOTE: Major truck routes have 2011 Truck (3+ axles) Average Annual Daily Truck volume (AADT)>3000*Class 1 Rail = Union Paci�c or Burlington Northern Santa Fe ownership or operation
LegendFACILITIES
Marine PortIntermodal FacilityOil Tanker TerminalMajor Airport
TRUCKS/RAIL
Major Truck RouteOther Truck RouteClass I Rail*Other Rail
2010 POPULATION
> 350,00050,000–350,000<50,000
OaklandSunnyvale
San Anselmo
SantaClara
SanMateo
Alameda
ContraCosta
Marin
Sonoma
Napa
Solano
128
104
12
5
58033
33
120
4
12
99
5
88995
85
128
101
1
116
128
12
505
12
152
237
29
580
1
80
113
84
29
37
25156
152
152
101
680
87
82
859
280
35
84
35
35
1
1
82
380
280
35 280
121
128
128
29
29
12
12
680
80
80
131
37
121116
12
101
101
101
4
44
242
78080
262
84
84
680
92
92
238
238
18561
880
238
13
123
80
80
580
580
580
84
193
45
29
160
5
26
101
24
680
101
101
16
80
65
99
99 70
5
113
113
5
16
16
53
29
175101128
132
280
17
101
101
880
17
17
9
236
1
1
160
84
5
99
205
580
1
130
221
Dublin
Emeryville
Los Gatos
Danville
San Carlos
Gilroy
SanPablo
Belmont
Colma
Sebastopol
Campbell
Burlingame
Woodside
Fairfax
Windsor
LosAltos
Hillsborough
Morgan Hill
Pacifica
Atherton
Mill Valley
San Bruno
American Canyon
San Anselmo
Clayton
Calistoga
Yountville
Sausalito
Monte Sereno
Suisun City
Newark
Belvedere
PortolaValley
Larkspur
Cotati
Millbrae
Sonoma
Saratoga
Orinda
Oakley
Lafayette
Rohnert Park
CorteMadera
Ross
Piedmont
Benicia
FosterCity
Albany
Hercules
Tiburon
Healdsburg
Pleasant Hill
Moraga
Dixon
EastPalo Alto
Half MoonBay
RioVista
Brisbane
Cloverdale
MenloPark
Los Altos Hills
Pinole
Martinez
Cupertino
Pittsburg
SanRamon
Sunnyvale
Milpitas
Brentwood
Redwood City
LivermoreSouthSan Francisco
PleasantonSan Leandro
Vallejo
Concord
Napa
SanMateo
Hayward
SantaClara
UnionCity
Novato
Antioch
Vacaville
Walnut Creek
SantaRosa
Berkeley
Alameda
SanRafael
Petaluma
Fremont
Fair�eld
DalyCity
SanFrancisco
San Jose
Richmond
OaklandOakland
PaloAlto
MountainView
Bay Area Global Gateways and Connecting Corridors
The Bay Area goods movement system consists of a series of interconnected infrastructure components including highways, rail lines and rail terminals, airports, ports and warehouse and distribution facilities. This map identifi es the Bay Area’s “global gateways” and connecting corridors, including marine ports, intermodal facilities, airports, highway corridors, and rail cor-ridors.
Source: Caltrans District 4 Geographic Information System (GIS), July 2013.

6 San Francisco Bay Area Regional Goods Movement Plan
SOURCE: Caltrans (2014 average annual daily truck volumes)MTC Graphics.pb — 2.29.2016
0
0
10 20 30
10 20 30 40
Miles
Kilometers
SOURCE: Caltrans (2014 average annual daily truck volumes)MTC Graphics.pb — 2.29.2016
LegendTRUCK VOLUMES
0–2,500
2,501–5,000
5,001–10,000
10,001–15,000
15,001–17,500
ROADWAYS
InterstatesUS HighwaysState RoutesOther Roads
2010 POPULATION
> 350,000
50,000–350,000
<50,000
OaklandSunnyvale
San Anselmo
DailyTruckVolumes
128
104
12
5
58033
33
120
4
12
99
5
88995
85
128
101
1
116
128
12
505
12
152
237
29
580
1
80
113
84
37
25156
152
152
101
680
87
82
859
280
35
84
35
35
1
1
82
380
280
35 280
121
128
128
29
29
12
12
680
80
80
131
37
121116
12
101
101
101
1
4
44
242
780
84
84
680
92
92
238
238
18561
880
238
13
123
80
80
580
580
580
84
193
45
29
160
5
26
101
24
680
101
101
16
50
80
65
99
99 70
5
113
113
5
16
16
53
29
175101128
132
280
17
101
101
880
17
17
9
236
1
1
160
84
5
99
205
580
1
130
221
262
SantaClara
SanMateo
Alameda
ContraCosta
Marin
Sonoma
Napa
Solano
Dublin
Emeryville
Los Gatos
Danville
San Carlos
Gilroy
SanPablo
Belmont
Colma
Sebastopol
Campbell
Burlingame
Woodside
Fairfax
Windsor
LosAltos
Hillsborough
Morgan Hill
Pacifica
Atherton
Mill Valley
San Bruno
American Canyon
San Anselmo
Clayton
Calistoga
Yountville
Sausalito
Monte Sereno
Suisun City
Newark
Belvedere
PortolaValley
Larkspur
Cotati
Millbrae
Sonoma
Saratoga
Orinda
Oakley
Lafayette
Rohnert Park
CorteMadera
Ross
Piedmont
Benicia
FosterCity
Albany
Hercules
Tiburon
Healdsburg
Pleasant Hill
Moraga
Dixon
EastPalo Alto
Half MoonBay
RioVista
Brisbane
Cloverdale
MenloPark
Los Altos Hills
Pinole
Martinez
Cupertino
Pittsburg
SanRamon
Sunnyvale
Milpitas
Brentwood
Redwood City
Livermore
PaloAlto
SouthSan Francisco
PleasantonSan Leandro
Vallejo
Concord
Napa
SanMateo
Hayward
SantaClara
UnionCity
Novato
Antioch
Vacaville
Walnut Creek
SantaRosa
Berkeley
Alameda
SanRafael
Petaluma
Fremont
Fair�eld
DalyCity
SanFrancisco
San Jose
Richmond
MountainView
OaklandOakland
Sacramento
0
0
10 20 30
10 20 30 40
Miles
Kilometers
LegendPERCENT OF TOTAL VEHICLES
0.01% - 1.50%
1.51% - 3.00%
3.01% - 5.00%
5.01% - 8.50%
8.51% - 14.50%
ROADWAYS
InterstatesUS HighwaysState RoutesOther Roads
2010 POPULATION
> 350,000
50,000–350,000
<50,000
OaklandSunnyvale
San Anselmo
DailyTruckVolumes As a Percent Of All Vehicles
SOURCE: Caltrans (2014 average annual daily truck volumes)MTC Graphics.pb — 2.29.2016
128
104
12
5
58033
33
120
4
12
99
5
88995
85
128
101
1
116
128
12
505
12
152
237
29
580
1
80
113
84
37
25 156
152
152
101
680
87
82
859
280
35
84
35
35
1
1
82
380
280
35 280
121
128
128
29
29
12
12
680
80
80
131
37
121116
12
101
101
101
1
4
44
780
262
84
84
680
92
92
238
238
18561
238
13
123
80
80
580
580
580
84
193
45
29
160
5
26
101
24
680
101
101
16
80
65
99
99 70
5
113
113
5
16
16
53
29
175101128
132
280
17
101
101
880
17
17
9
236
1
1
160
84
5
99
205
580
1
130
221
242
50
SantaClara
SanMateo
Alameda
ContraCosta
Marin
Sonoma
Napa
Solano
Dublin
Emeryville
Los Gatos
Danville
San Carlos
Gilroy
SanPablo
Belmont
Colma
Sebastopol
Campbell
Burlingame
Woodside
Fairfax
Windsor
LosAltos
Hillsborough
Morgan Hill
Pacifica
Atherton
Mill Valley
San Bruno
American Canyon
San Anselmo
Clayton
Calistoga
Yountville
Sausalito
Monte Sereno
Suisun City
Newark
Belvedere
PortolaValley
Larkspur
Cotati
Millbrae
Sonoma
Saratoga
Orinda
Oakley
Lafayette
Rohnert Park
CorteMadera
Ross
Piedmont
Benicia
FosterCity
Albany
Hercules
Tiburon
Healdsburg
Pleasant Hill
Moraga
Dixon
EastPalo Alto
Half MoonBay
RioVista
Brisbane
Cloverdale
MenloPark
Los Altos Hills
Pinole
Martinez
Cupertino
Pittsburg
SanRamon
Sunnyvale
Milpitas
Brentwood
Redwood City
LivermoreSouthSan Francisco
PleasantonSan Leandro
Vallejo
Concord
Napa
SanMateo
Hayward
SantaClara
UnionCity
Novato
Antioch
Vacaville
Walnut Creek
SantaRosa
Berkeley
Alameda
SanRafael
Petaluma
Fremont
Fair�eld
DalyCity
SanFrancisco
San Jose
Richmond
OaklandOakland
SacramentoSacramento
PaloAlto
MountainView

Executive Summary 7
SOURCE: Caltrans (2014 average annual daily truck volumes)MTC Graphics.pb — 2.29.2016
0
0
10 20 30
10 20 30 40
Miles
Kilometers
LegendTRUCK VOLUMES
0–2,500
2,501–5,000
5,001–10,000
10,001–15,000
15,001–17,500
ROADWAYS
InterstatesUS HighwaysState RoutesOther Roads
2010 POPULATION
> 350,000
50,000–350,000
<50,000
OaklandSunnyvale
San Anselmo
DailyTruckVolumes
128
104
12
5
58033
33
120
4
12
99
5
88995
85
128
101
1
116
128
12
505
12
152
237
29
580
1
80
113
84
37
25156
152
152
101
680
87
82
859
280
35
84
35
35
1
1
82
380
280
35 280
121
128
128
29
29
12
12
680
80
80
131
37
121116
12
101
101
101
1
4
44
242
780
84
84
680
92
92
238
238
18561
880
238
13
123
80
80
580
580
580
84
193
45
29
160
5
26
101
24
680
101
101
16
50
80
65
99
99 70
5
113
113
5
16
16
53
29
175101128
132
280
17
101
101
880
17
17
9
236
1
1
160
84
5
99
205
580
1
130
221
262
SantaClara
SanMateo
Alameda
ContraCosta
Marin
Sonoma
Napa
Solano
Dublin
Emeryville
Los Gatos
Danville
San Carlos
Gilroy
SanPablo
Belmont
Colma
Sebastopol
Campbell
Burlingame
Woodside
Fairfax
Windsor
LosAltos
Hillsborough
Morgan Hill
Pacifica
Atherton
Mill Valley
San Bruno
American Canyon
San Anselmo
Clayton
Calistoga
Yountville
Sausalito
Monte Sereno
Suisun City
Newark
Belvedere
PortolaValley
Larkspur
Cotati
Millbrae
Sonoma
Saratoga
Orinda
Oakley
Lafayette
Rohnert Park
CorteMadera
Ross
Piedmont
Benicia
FosterCity
Albany
Hercules
Tiburon
Healdsburg
Pleasant Hill
Moraga
Dixon
EastPalo Alto
Half MoonBay
RioVista
Brisbane
Cloverdale
MenloPark
Los Altos Hills
Pinole
Martinez
Cupertino
Pittsburg
SanRamon
Sunnyvale
Milpitas
Brentwood
Redwood City
Livermore
PaloAlto
SouthSan Francisco
PleasantonSan Leandro
Vallejo
Concord
Napa
SanMateo
Hayward
SantaClara
UnionCity
Novato
Antioch
Vacaville
Walnut Creek
SantaRosa
Berkeley
Alameda
SanRafael
Petaluma
Fremont
Fair�eld
DalyCity
SanFrancisco
San Jose
Richmond
MountainView
OaklandOakland
Sacramento
0
0
10 20 30
10 20 30 40
Miles
Kilometers
LegendPERCENT OF TOTAL VEHICLES
0.01% - 1.50%
1.51% - 3.00%
3.01% - 5.00%
5.01% - 8.50%
8.51% - 14.50%
ROADWAYS
InterstatesUS HighwaysState RoutesOther Roads
2010 POPULATION
> 350,000
50,000–350,000
<50,000
OaklandSunnyvale
San Anselmo
DailyTruckVolumes As a Percent Of All Vehicles
SOURCE: Caltrans (2014 average annual daily truck volumes)MTC Graphics.pb — 2.29.2016
128
104
12
5
58033
33
120
4
12
99
5
88995
85
128
101
1
116
128
12
505
12
152
237
29
580
1
80
113
84
37
25 156
152
152
101
680
87
82
859
280
35
84
35
35
1
1
82
380
280
35 280
121
128
128
29
29
12
12
680
80
80
131
37
121116
12
101
101
101
1
4
44
780
262
84
84
680
92
92
238
238
18561
238
13
123
80
80
580
580
580
84
193
45
29
160
5
26
101
24
680
101
101
16
80
65
99
99 70
5
113
113
5
16
16
53
29
175101128
132
280
17
101
101
880
17
17
9
236
1
1
160
84
5
99
205
580
1
130
221
242
50
SantaClara
SanMateo
Alameda
ContraCosta
Marin
Sonoma
Napa
Solano
Dublin
Emeryville
Los Gatos
Danville
San Carlos
Gilroy
SanPablo
Belmont
Colma
Sebastopol
Campbell
Burlingame
Woodside
Fairfax
Windsor
LosAltos
Hillsborough
Morgan Hill
Pacifica
Atherton
Mill Valley
San Bruno
American Canyon
San Anselmo
Clayton
Calistoga
Yountville
Sausalito
Monte Sereno
Suisun City
Newark
Belvedere
PortolaValley
Larkspur
Cotati
Millbrae
Sonoma
Saratoga
Orinda
Oakley
Lafayette
Rohnert Park
CorteMadera
Ross
Piedmont
Benicia
FosterCity
Albany
Hercules
Tiburon
Healdsburg
Pleasant Hill
Moraga
Dixon
EastPalo Alto
Half MoonBay
RioVista
Brisbane
Cloverdale
MenloPark
Los Altos Hills
Pinole
Martinez
Cupertino
Pittsburg
SanRamon
Sunnyvale
Milpitas
Brentwood
Redwood City
LivermoreSouthSan Francisco
PleasantonSan Leandro
Vallejo
Concord
Napa
SanMateo
Hayward
SantaClara
UnionCity
Novato
Antioch
Vacaville
Walnut Creek
SantaRosa
Berkeley
Alameda
SanRafael
Petaluma
Fremont
Fair�eld
DalyCity
SanFrancisco
San Jose
Richmond
OaklandOakland
SacramentoSacramento
PaloAlto
MountainView

8 San Francisco Bay Area Regional Goods Movement Plan
the region will have limited resources and must
invest strategically with an understanding of how
demand patterns will continue to change, and
where public and private investments can be
leveraged to achieve the greatest public benefits.
Moving ForwardImplementation of the San Francisco Bay Area Goods Movement Plan will require that the region address a number of wider policy and governance issues, including institutional arrangements, public-private collaborations, and coordination around funding opportunities to deliver new projects and programs. Much of the goods movement system is
owned and operated by the private sector, including railroads, trucking companies, logistics service providers, shippers and technology companies. The public sector has limited control over the actions of these firms and can only accomplish public goals by working in partnership.
Coordinate Rail InvestmentsThe Metropolitan Transportation Commission and its regional partners should work to coordinate rail investments with the private railroads. For example, the mainline capacity improvements on the Niles and Oakland Subdivisions would typically be made by Union Pacific with their own funds to serve their
Inland Port Intermodal Import
Transload ImportToday
Transload ImportSustainable Global Competitiveness
Asia Oakland
Port Terminal
Port Terminal TerminalTransloadWarehouse
Terminal
Chicago
Asia Oakland ChicagoCentralValley
Asia Oakland Chicago
Value-added Services
Value-added Services
Port Outer HarborIntermodalTerminal
TransloadWarehouse
Strategic improvements to the freight rail system to and from the Port of Oakland and adjacent logistics facilities will improve access, reduce highway congestion, and increase the region’s competitiveness as a logistics hub. Historically, very little domestic intermodal rail traffic has originated or terminated at rail inter-modal terminals in the Bay Area. Instead, most of this traffic is loaded or unloaded at intermodal terminals in the Central Valley with truck trips to make the final move to/from the Bay Area.
By expanding intermodal terminal capacity at the Oakland Army Base and working with the Class I railroads to change operating practices and encourage greater use of this capacity for domestic intermodal operations, the region could reduce truck traffic on congested I-580 and potentially reduce emissions through the use of the more fuel-efficient (per ton-mile) rail mode in place of truck-ing. This will require working with the railroads to identify ways to deploy the cleanest available locomotive technologies.
Goods Movement Plan Rail Strategy

Executive Summary 9
customers as markets develop. The public sector may become involved in these types of projects if capacity is needed to serve passenger rail demand. (See the table below for the 2020 forecast level of service for Bay Area rail lines. Note that for 10 of 12 rail lines, the level of service is forecast to be “D” or lower.) In this case, the public benefits would also include changes in operating practices by Union Pacific to reduce truck traffic and adopt the use of low emission locomotive technology. Since these benefits are directly associated with how the UP runs its commercial operations, negotiating the deals requires a thoughtful, deliberative approach.
Develop Funding StrategySecuring federal, state, regional or local funds for goods movement projects has historically been a challenge, and the projects and programs included
in the San Francisco Bay Area Goods Movement Plan face a significant funding gap. Indeed, $3.2 billion in near-term funding is needed to support the plan’s three opportunity packages, with port and rail projects facing the greatest funding gaps (see chart on page 11).
The last major statewide freight investment program — the Trade Corridors and Investment Fund (TCIF) — was approved by voters in November 2006 as part of the Proposition 1B bond package. MTC should continue to lobby the state Legislature to provide regular funding for the Trade Corridor Improvement Fund. MTC also should pursue the existing programs within the state’s Cap and Trade framework to support zero and near-zero emission technology implementation, as well as advocate for the designation of a goods movement-focused
2020 Forecast Level of Service (LOS) for Bay Area Rail Lines
Subdivision From: To:Daily Freight
Trains
Daily Passenger
TrainsTotal Daily
TrainsAverage Capacity
Volume/Capacity
Ratio LOS
UP Coast San Jose Newark 10 32 42 30 140.0% F
UP Coast Newark Oakland 8 2 10 18 55.5% C
UP Coast Gilroy San Jose 4 8 12 30 73.3% D
Caltrain Peninsula
San Jose San Francisco 6 114 120 100 120.0% F
UP Martinez Sacramento Martinez 22 34 56 75 74.7% D
UP Martinez Martinez Richmond 22 44 66 75 88.0% E
UP Martinez Richmond Emeryville 30 44 74 75 98.7% E
UP Martinez Emeryville Oakland 30 42 72 75 96.0% E
UP Niles Niles Oakland 2 24 26 30 86.7% E
UP Oakland Niles Stockton 11 12 23 30 76.7% D
UP Tracy Martinez Port Chicago 4 8 12 30 40.0% B
BNSF Stockton
Stockton Port Chicago 12 10 22 30 73.3% D
By 2020, the planned future growth in train volumes for freight and passenger services will pose challenges to the performance of the overall network. Planners often use “level of service (LOS)” letter grades to describe volume and capacity conditions on cor-ridors. For example, a volume/capacity ratio over 100 percent yields a LOS of “F”. Most notably, the Martinez Subdivision — the northern route out of the Port of Oakland and carrying the highest volumes— will degrade to LOS E. The San Francisco Bay Area Goods Movement Plan recommends expanded rail service on the
Niles and Oakland Subdivisions (the southern route) and not on the Martinez route. In fact, this is a business decision Union Pacific is already making; considering the right-of-way constraints on the Martinez Subdivision especially between Oakland and Emeryville, adding more capacity would have serious impacts on these com-munities, making this a less desirable option than re-routing some of the growth in intermodal traffic to the southern route.
Source: AECOM and Cambridge Systematics calculations.

10 San Francisco Bay Area Regional Goods Movement Plan
program for the 40 percent portion of the Cap and Trade funding that remains unallocated.
In late 2015, President Obama signed H.R. 22, the FAST Act (Fixing America’s Surface Transportation Act), establishing funding levels and federal policy for our nation’s highways and public transit systems for fiscal years (FY) 2016 through FY 2020. The
FAST Act establishes the first-ever federal highway program focused on freight — the National Highway Freight Program — to support investments in the primary highway freight system, critical urban and rural corridors, and other portions of the Interstate system. California expects to receive approximately $582 million in NHFP funds over the five years. The FAST Act also establishes a new competitive
West Oakland and Port DevelopmentThe proximity of the West Oakland neighborhood to the Port of Oakland and the former Oakland Army Base has created challenges for the neighborhood. Because the port is such an important goods movement facility for the region, a case study was conducted to identify more clearly the major issues related to port operations that impact West Oakland. The specific challenges and how we are addressing them in the plan are discussed below.
• Air pollution — Diesel particulate matter (DPM) levels in West Oakland were three times higher than the average for the Bay Area in 2005, contributing to high cancer risk. Fortunately, air quality has been significantly improved with 70 percent reductions in diesel particulate matter between 2005 and 2012 through shore power infrastructure, “no idling” policies on port roadways, cleaner truck and locomotive technology, and cleaner fuels. Improving the locomotive fleet is key to continuing improvements as rail is expected to account for the largest growth in future freight volumes. The San Francisco Bay Area Goods Movement Plan contains strategies that will continue to address this issue by introducing zero and near-zero truck technology, and providing for a rail and terminal emission reduction program.
• Roadway surface degradation — Pavement condition is critical to quality truck access, but many of the access roads are in poor condition, including Maritime Street north of 7th Street, West Grand Avenue east of Mandela Parkway, and many of the streets around the Grand/Mandela intersection where the highest concentration of truck-intensive businesses exist. A program of local street projects to improve truck route access is recommended as part of this plan to address issues on local roads.
• Truck-related traffic accidents due to modal conflicts — Hot spots of crashes include the I-880 interchange with I-980, I-80 on approach to the Bay Bridge, the 7th Street/Maritime Street intersection, the West Grand Avenue/Maritime Street intersection, and ramps to I-880. Limited sight lines, blocked lanes, and signal timing cause potential conflicts between trucks/autos and trains at the rail crossing near 7th Street/Maritime Street. Projects included in the plan, such as the 7th Street grade separation, the Adeline bridge improvements, and various interchange improvements on I-880 are all designed to address these issues and improve traffic operations on the approach to marine terminals.
• Traffic violation and enforcement issues — Local signage is often faded and unreadable, contributing to trucks violating local traffic rules regarding turning, stopping and parking. The plan includes a program to improve freight signage on key truck routes.
Other key issues to be addressed at the port are:
• Operational inefficiencies — Turn-about times of trucks entering the port average between one to two hours and can range up to six hours. Trucks can expect only two turns through each day, as opposed to three turns a decade ago. Strategies such as extended gate hours at the port and the Freight ITS (Freight Advanced Traveler Information Systems (FRATIS) project will all contribute to improved terminal efficiency.
• Lack of overnight truck parking facilities — Trucks arriving after the 4:30 p.m. cutoff park in the median of roadways outside the port overnight, adding risk and liability to truckers and cargo owners. The port is working to provide more overnight parking and the rail strategy included in the plan could help reduce the number of truck drivers looking for overnight parking.

Executive Summary 11
program — the Nationally Significant Freight and Highway Projects Program — for projects of national or regional significance. Nationally, the program will receive $800 million in FY 2016, growing to $1 billion by FY 2020.
Strengthen PartnershipsWhether future goods movement funding emerges at the federal or state levels, the Bay Area and the wider Northern California megaregion must be well positioned to capitalize on these opportunities. The Northern California Trade Coalition (NCTC) has served in the past as a forum to prioritize the megaregion’s goods movement projects for statewide funding opportunities. Key stakeholders have included MTC, Sacramento Council of Governments (SACOG), San Joaquin Council of
Governments (SJCOG), and the Ports. MTC can take the lead to convene stakeholders from the Bay Area and the wider megaregion to establish a focal point for Northern California goods movement policy, advocacy and funding strategy. ■
Ern
est
Lehm
ann
The FAST Corridor — A Model Rail Strategy Implementation Agreement
The Freight Action Strategy for the Everett-Seattle-Tacoma Corridor (FAST Corridor) is a partnership of 26 local cities, counties, ports, regional, state and federal agencies, and railroad and trucking interests who came together in 1998 to solve some of the Puget Sound region’s most pressing problems. The FAST Corridor program included a large number of grade separation, truck access, and freight ITS projects in a multijurisdictional corridor. The participants signed an MOU that specified the goals of their partnership, created an initial list of projects, created a process for introducing new projects, specified general cost-sharing principles, and stated the intent of each party to deliver the projects within their jurisdiction as funding became available.
This approach proved to be very flexible, shifting funding and funding responsibility around for specific projects as existing funding sources were curtailed or new funding sources became available. It also gave all partners a degree of certainty that all of the projects would eventually be delivered and the package would be completed. The fact that it also included private partners makes it a particularly relevant example. Since the inception of the program, the partners have been able to assemble more than $650 million of public and private funds to complete 20 of the 26 projects originally identified.
Preliminary Cost Estimate of Goods Movement “Opportunity Packages”(Millions of dollars)
Category Total Cost Programmed Funding Funding Shortfall
Sustainable Global Competitiveness $ 2,507 $284 $2,222
Smart Deliveries and Operations 408 13 394
Modernizing Infrastructure 899 277 622
Total $3,814 $575 $3,239
Note: Amounts may not sum to total due to rounding.

12 San Francisco Bay Area Regional Goods Movement Plan
Performance Across Goal Areas
Opportunity Package 1: Building Sustainable Global CompetitivenessProject Name Project Description In
terc
onne
cted
/M
ultim
odal
Safe
and
Re
liabl
e
Inno
vativ
e
Econ
omic
Pr
ospe
rity
Impr
oved
Qu
ality
of L
ife
7th Street Grade Separation Projects (East and West)
These projects will grade separate 7th Street to eliminate the at-grade railroad crossings, which cause significant traffic backup throughout the port area.
4
9 9
Oakland Army Base Phase 2 improvements (Port Development)
This project includes building of new warehouses, upgrade of utility infrastructure, access road, gates and intersection improvements at Maritime Street and 14th Street.
4 4 (a
Oakland Army Base Phase 2 Intermodal Rail Improvements
This project will increase yard trackage to provide annual capacity of 900,000 TEU. 4 4 (a
Truck Services (including truck parking) at Oakland Army Base
This project will include additional parking beyond those mentioned as part of the Army Base Phase 2 project. It will only be implemented after reassessment.
9
4 4
Replace Adeline Overpass at 3rd Street in Oakland to Accommodate Overweight Trucks
This project will reconstruct the Adeline Street bridge to upgrade it to current seismic standards, reduce its grade to allow for better truck operations, and provide a separate bicycle path.
9
0
ITS Improvements to Address Queuing at Interchanges Along I-880 and on Local Streets to Port of Oakland
This includes freeway reduction strategies around I-880 near the Port of Oakland along local streets to reduce queuing. 4 4 0
Airport Perimeter Dike (OAK) This project provides flood and shoreline protection to the airport's main passenger and cargo runway, parts of which are below sea level.
4 4
9 9
Rail Quiet Zone Program This program will assess the suitability of locations, prioritize locations, design and address implementation of quiet zones.
9
0 4
An Initial Demonstration Followed by Targeted Incentives to Promote Adoption of Zero and Near-Zero Emissions Truck Technology for Port Drayage
The program will conduct feasible applications of zero-emission trucks with an intent to identify incentives for market development. 0 4
9
4
Rail and Terminal Emission Reduction Program
This program will assess rail and terminal emissions, including potential voluntary adoption of Tier 4 standards for locomotives by railroads, as well as incentives for using low-emission switching locomotives.
9
4
Freight Corridors Community and Impact Reduction Initiative
This new program would help to fund impact reduction in neighborhoods immediately adjacent to freight facilities, where buffers and freight hub relocation are not possible.
9
4
Develop/Support Workforce Training Programs for Goods-Movement-Related Jobs (especially transloading and logistics jobs)
This program will support workforce training for goods movement-related jobs in logistics and transloading, especially for residents of areas most affected by goods movement projects. 0 4
A Program of Rail Crossing Improvements
This includes the following projects:• Berkeley Railroad Crossing Improvements;• Grade Separation over Decoto;• High St/Davis St/Hesperian Blvd Grade Separation; and• Tennyson Rd grade separation.
Varies
A Program of Track Additions, Sidings and New Connections
This program includes the following projects:
Hayward Double Track (Elmhurst to Industrial Parkway 2nd Track)
This project involves adding a second track on Niles Subdivision between Elmhurst and Industrial Parkway 0 (b
Niles Junction Bypass This involves building a new rail bridge over Alameda Creek in Niles Junction to allow movement from Oakland Subdivision at mouth of Niles Canyon to Niles Subdivision.
9 (c
Improvement on the Oakland Subdivision East of Niles Junction
This program involves improvements on the Oakland Subdivision pending approval of ACEforward projects. Unknown
KEY: 4 High Positive Impact
9
Medium Positive Impact 0 Low Positive Impact ( Negative Impacta This project was included in the Oakland Army Base 2002 EIR and the 2012 EIR Addendum and mitigation measures were identified for air quality and traffic-related impacts
on neighboring communities. These mitigation measures are currently being implemented by the Port of Oakland and the city of Oakland’s developer. In some cases mitigation measures are only necessary when construction activities or port/logistics activities grow to certain levels and the measures will be implemented as necessary in the future.
b This project would not be subject to a CEQA environmental review because federal law exempts private railroad projects from environmental reviews if they are conducted entirely within the railroad’s existing right-of-way. Impacts associated with increased rail traffic on this line will be reduced through the adoption of the rail crossing improvement and rail quiet zone programs included in this package.
c This project will require an EIR because it is a new bridge over Alameda Creek outside existing right-of-way to address potential impacts on the creek. During this review, any necessary measures needed to mitigate impacts on surrounding communities will be identified.

Executive Summary 13
Performance Across Goal Areas
Opportunity Package 2: Smart Deliveries and OperationsProject Name Project Description In
terc
onne
cted
/M
ultim
odal
Safe
and
Re
liabl
e
Inno
vativ
e
Econ
omic
Pr
ospe
rity
Impr
oved
Qu
ality
of L
ife
Off-Peak and Novel Delivery Policy Guidance and Demonstration Program
This program is built to demonstrate off-peak delivery policy and incentives building on New York City research and results of FHWA off-peak delivery demonstration.
4
9
4
9
Port of Oakland ITS including FRATIS This ITS project will leverage the existing communications infrastructure to implement various projects in a phased deployment, appointment-based arrival system.
4 4 4
Oakland Airport Area ITS Project ITS at OAK will include design and implementation of ITS along 98th Ave and Hegenberger Rd from I-880 to OAK. 0 0 4
9
Freight Guidelines for Complete Streets Initiative
This program will develop policy, funding and recommended guidelines design of especially complicated projects in urban centers.
9
0 0
I-880, I-580 and US 101 Integrated Corridor Management (ICM) Project
This will be similar to the I-80 ICM project and will design and implement Adaptive Ramp Metering (ARM) and Active Traffic Management (ATM) strategies to reduce congestion and provide incident management capabilities.
9
4 4
9
Arterial Smart Corridor Program This is a new program to identify focused truck corridor ITS projects along arterials. ITS applications will be coordinated with existing and other planned local and regional programs.
4
9
4 0
Strategies to Improve Port Operations Including Night Gates and Weekend Operations
This program includes adding more shifts, automation of terminal operations, and/or other gate management practices while mitigating any potential community impacts.
4
9 9
Clean Truck Policy & Program Collaborative (Joint Working Group with Regulatory Agencies, Freight Industry Representatives and Public Agencies)
This program will include potential local or state policy, such as fleet emission standards, emission trading programs, and other incentives to encourage adoption of clean truck technologies and alternative fuels.
0
9
4
Near-Zero and Zero-Emission Goods Movement Technology Advancement Program
This is a program to fund and demonstrate Near-Zero and Zero-Emission goods movement technologies. Program could include incentives for engine retrofits to low emission and ZEV technology.
0 4
9
4
KEY: 4 High Positive Impact
9
Medium Positive Impact 0 Low Positive Impact ( Negative Impact
Bill
Hal
l
14 San Francisco Bay Area Regional Goods Movement Plan
Performance Across Goal Areas
Opportunity Package 3: Modernizing InfrastructureProject Name Project Description In
terc
onne
cted
/M
ultim
odal
Safe
and
Re
liabl
e
Inno
vativ
e
Econ
omic
Pr
ospe
rity
Impr
oved
Qu
ality
of L
ife
Land use guidelines and incentive programs to cities that reduce land use conflicts
This program will coordinate with regional and state efforts to address land use conflicts.
9 9
A program of freeway interchange, auxiliary lane, corridor capacity enhancement, and operations improvement projects
Projects on highest priority freight routes, such as:• Improve I-80/I-680/Route 12 Interchange – All Remaining
Phases; including adding westbound truck scales• Add auxiliary lanes on US 101 between Rowland Blvd and
North San Pedro Road, near Port of San Francisco, near SFO, and segments between San Mateo and Dumbarton Bridge;
• I-580/Vasco Road interchange improvements in Livermore;• I-880 NB and SB auxiliary lanes between West A and Winton
in Hayward; and I-880/A St interchange improvements in Hayward.
• Widen US 101 from Monterey Street to Route 129 – project development
• Other regionally significant projects such as:– US 101 Marin Sonoma Narrows project, including HOV lane
and corridor improvements– SR-152 realignment and improvements from US 101 to
Santa Clara/Merced county border• Scoping of new projects on regionally significant freight routes
to address identified truck delay, truck reliability, and truck safety issues on routes including US 101, SR-4, SR-37, I-880, I-580, I-680, and I-80
Varies
Local road and county road access and safety program on truck routes
This program would provide funding and guidance to address safety and speed issues along rural truck routes. Program should be coordinated with maintenance, rehabilitation and bridge programs.
4 4
Truck Route Coordination Planning/Guidance, Technical Assistance, and Information to Address Truck Route Connectivity, Health and Community Impacts
This program will allow counties to provide planning and technical assistance on truck route planning, and allow MTC to provide coordination to enable that. 4 0 0 4
Development of public or public-private truck parking and full-service truck service facilities near major industrial centers (most likely in the Hayward, Union City or Fremont area)
This program will update the findings from the 2008 study on truck parking in Alameda County and extend it to the rest of the region. It will then implement the findings to provide parking in major industrial centers.
4 4 4
Targeted Programs to Encourage Use of Zero-Emission Trucks and Cargo Handling Equipment Particularly in the I-80, I-880, I-580 and SR-4 Corridors
This program extends from the Technology Advancement program and targets freight corridors and facilities in communities with greatest adverse impacts from freight emissions. 0 4
9
4
Develop/support workforce training programs for goods-movement related jobs (industry-focused logistics jobs)
This program will support workforce training for goods movement-related jobs that are focused on logistics. 0 4
Regionwide Freight Signage Program This program includes signage to encourage the use of designated truck routes and display route choices for specific destinations.
9
0
At-Grade Crossing Safety and Grade Separation Policy and Program
This is a program to identify the grade crossings with the highest priorities and seek funding to upgrade them.
9
4 0 4
Industrial Rail Access Program A program to support industrial rail users to improve industrial spurs to allow for increased rail usage along locations where there are industrial or agricultural activities.
9
0 0
KEY: 4 High Positive Impact
9
Medium Positive Impact 0 Low Positive Impact ( Negative Impact

Executive Summary 15©Noah Berger

16 San Francisco Bay Area Regional Goods Movement Plan
Notes

Executive Summary 17
MTC EXECUTIVE STAFFSteve HemingerExecutive Director
Alix A. BockelmanDeputy Executive Director, Policy
Andrew B. FremierDeputy Executive Director, Operations
PROJECT STAFFKen Kirkey Director, Planning
Matt Maloney Principal, Major Projects

18 San Francisco Bay Area Regional Goods Movement Plan
M E T R O P O L I T A N T R A N S P O R T A T I O N C O M M I S S I O N
Joseph P. Bort MetroCenter
101 Eighth Street
Oakland, California 94607-4700
510.817.5700 tel
510.817.5848 fax
510.817.5769 tty/tdd
www.mtc.ca.gov