goodness of fit - MadAsMaths · GOODNESS OF FIT . Created by T. Madas Created by T. Madas DISCRETE...
21
Created by T. Madas Created by T. Madas GOODNESS OF FIT
Transcript of goodness of fit - MadAsMaths · GOODNESS OF FIT . Created by T. Madas Created by T. Madas DISCRETE...

Created by T. Madas
Created by T. Madas
GOODNESS
OF FIT

Created by T. Madas
Created by T. Madas
DISCRETE
DATA

Created by T. Madas
Created by T. Madas
Question 1
The number of car immobilizations, carried out by a security company patrolling a car
park, over a period of eighty days is summarized in the table below.
No of Immobilizations No of Days
0 10
1 20
2 21
3 15
4 8
5 6
6+ 0
Use a 2χ test, at 5% level of significance, to investigate whether the above data can
be modelled by a Poisson distribution with a mean of 2 immobilizations per day.
excellent fit, 0.809 9.488<
Created by T. Madas
Created by T. Madas
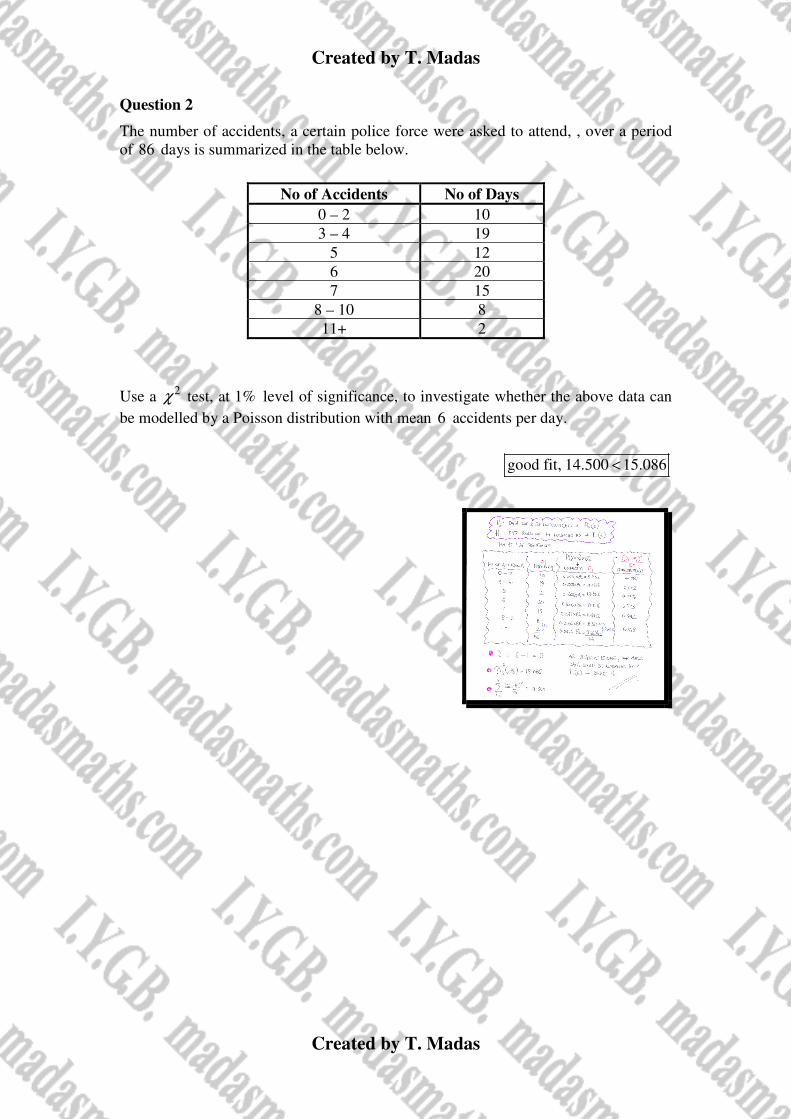
Question 2
The number of accidents, a certain police force were asked to attend, , over a period
of 86 days is summarized in the table below.
No of Accidents No of Days
0 – 2 10
3 – 4 19
5 12
6 20
7 15
8 – 10 8
11+ 2
Use a 2χ test, at 1% level of significance, to investigate whether the above data can
be modelled by a Poisson distribution with mean 6 accidents per day.
good fit, 14.500 15.086<
Created by T. Madas
Created by T. Madas
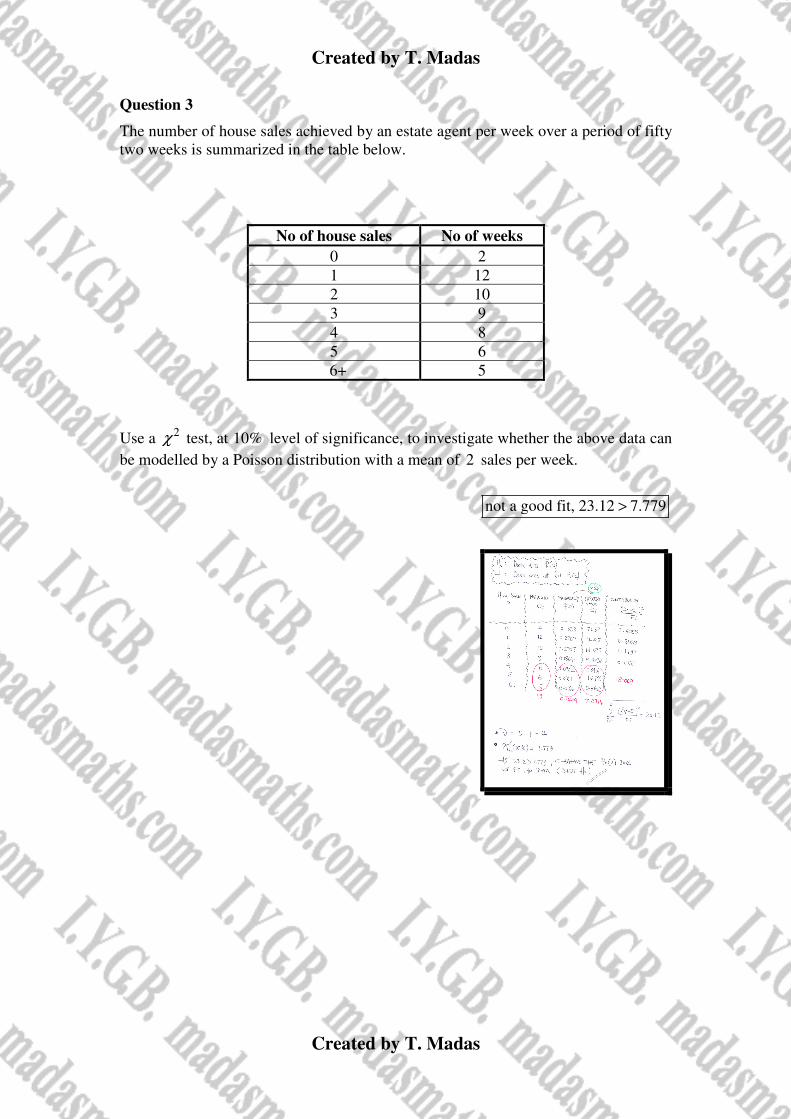
Question 3
The number of house sales achieved by an estate agent per week over a period of fifty
two weeks is summarized in the table below.
No of house sales No of weeks
0 2
1 12
2 10
3 9
4 8
5 6
6+ 5
Use a 2χ test, at 10% level of significance, to investigate whether the above data can
be modelled by a Poisson distribution with a mean of 2 sales per week.
not a good fit, 23.12 7.779>

Created by T. Madas
Created by T. Madas
Question 4
The number of shoplifting incidents, dealt by the security company patrolling a
shopping centre, over a period of seventy days is summarized in the table below.
No of Incidents No of Days
0 13
1 19
2 16
3 10
4 5
5 4
6 3
Use a 2χ test, at 10% level of significance, to investigate whether the above data can
be modelled by a Poisson distribution with parameter λ , where λ is the number of
shoplifting incidents per day.
good fit, 2.653 6.251<

Created by T. Madas
Created by T. Madas
Question 5
The admissions due to accidents, dealt by the Accident and Emergency Department of
a hospital over a period of 100 hours, is summarized in the table below.
No of Accidents No of Hourly Periods
0 – 1 5
2 – 3 18
4 16
5 20
6 14
7 14
8 – 11 13
12+ 0
Use a 2χ test, at 10% level of significance, to investigate whether the above data can
be modelled by a Poisson distribution with mean λ , where λ is the mean number of
accident admissions per hour.
excellent fit, 1.593 7.779<

Created by T. Madas
Created by T. Madas
Question 6 (***)
The discrete variable X is thought to have distribution ( )B 5,0.2 .
Some actual observations of X are summarized in the table below.
X Frequency
0 15
1 36
2 17
3 10
4 1
5 1
Use a 2χ test, at 5% level of significance, to investigate whether the above data can
be modelled by ( )B 5,0.2 .
FS1-N , not a good fit, 8.148 5.991>

Created by T. Madas
Created by T. Madas
Question 7
Peter’s tutor feels he is late in 15% of the daily school registrations, which occur
twice daily, i.e. 10 in total in a five day week.
The actual data is summarized in the table below
Late Registrations in a Week No of Weeks
0 5
1 12
2 9
3 6
4 3
Use a 2χ test, at 1% level of significance, to investigate whether the above data can
be modelled by a Binomial distribution, as claimed by Peter’s tutor.
very good fit, 1.730 11.345<

Created by T. Madas
Created by T. Madas
Question 8
There are 7 periods in Lilith’s school. The number of late arrivals to her lessons for a
random sample of 50 days is summarized in the table below.
Late Arrivals in a Day No of Days
0 8
1 14
2 14
3 7
4 4
5 3
Use a 2χ test, at 5% level of significance, to investigate whether the above data can
be modelled by a Binomial distribution.
good fit, 1.282 5.991<

Created by T. Madas
Created by T. Madas
Question 9
The table summarizes the results obtained by a spinner numbered with the positive
integers from 1 to 8 .
Number 1 2 3 4 5 6 7 8
Frequency 16 9 9 12 8 17 16 13
Use a 2χ test, at 10% level of significance, to investigate whether the above data can
be modelled by a Discrete Uniform distribution.
good fit, 7.2 12.017<

Created by T. Madas
Created by T. Madas
Question 10
A scientist believes that the proportion of people in Britain whose hair colour is
brown, blonde, black or red, is in the ratio 4 : 3 : 2 :1 .
A random sample is taken and their hair colour is recorded.
• 181 had brown hair.
• 167 had blonde hair.
• 113 had black hair.
• 39 had red hair.
Test the scientist’s claim at the 10% level of significance.
claim not justified, 7.842 6.251<

Created by T. Madas
Created by T. Madas
Question 11
A spinner numbered 1, 2 , 3 and 4 is spun 100 times and the results are summarized
in the table below
Number Frequency
1 15
2 19
3 31
4 35
Dr Pepper claims that the probability distribution of number shown on the spinner is
given by the following table.
Use a 2χ test, at 5% level of significance, to investigate Dr Pepper’s claim.
good fit, 3.208 7.815<
probability
number 1
310
2 3 4
15
25
110

Created by T. Madas
Created by T. Madas
Question 12
An investigation was carried out to determine the effectiveness of four different blood
pressure lowering medications.
Each of the 100 patients who took part in the investigation was given one of the four
available medications A , B , C or D .
• 10 of the 17 patients that were given medication A had a positive response.
• 16 of the 26 patients that were given medication B had a positive response.
• 15 of the 28 patients that were given medication C had a positive response.
• 11 of the 29 patients that were given medication D had a positive response.
The following claims are made.
a) Claim 1
Each patient was randomly given one of the four medications.
b) Claim 2
The patient’s response is independent of the medication that was given.
Test each of these claims at the 10% level of significance.
claim 1 justified, 3.6 6.251< , claim 2 justified, 3.592 6.251<

Created by T. Madas
Created by T. Madas
CONTINUOUS
DATA

Created by T. Madas
Created by T. Madas
Question 1
The times taken to complete a four mile charity run for a group of people is
summarized in the table below.
Time (nearest minute) No of Runners
– 15 0
15 – 19 11
20 – 24 30
25 – 29 47
30 – 34 35
35 – 39 9
40 + 1
Use a 2χ test, at 5% level of significance, to investigate whether the above data can
be modelled by a Normal distribution with mean of 27 minutes and standard
deviation 154
minutes.
excellent fit, 0.580 9.488<

Created by T. Madas
Created by T. Madas
Question 2
The time that a group of people could hold the breath, rounded to the nearest second,
is summarized in the table below.
Time (nearest second) No of People
– 10 4
11 – 15 6
16 – 20 24
21 – 25 37
26 – 30 35
31 – 35 13
36 + 1
Use a 2χ test, at 5% level of significance, to investigate whether the above data can
be modelled by a Normal distribution with mean of 23 seconds and standard
deviation 5 seconds.
good fit, 8.808 9.488<

Created by T. Madas
Created by T. Madas
Question 3
The time spent waiting by 104 callers, before their call is answered by a local hospital,
is summarized in the table below.
Waiting Time (t) No of Callers
10 < t ≤ 30 5
30 < t ≤ 50 9
50 < t ≤ 70 22
70 < t ≤ 90 31
90 < t ≤ 110 24
110 < t ≤ 130 7
130 < t ≤ 150 6
Use a 2χ test, at 5% level of significance, to investigate whether the above data can
be modelled by a Normal distribution with mean of 80 seconds and standard
deviation 18 seconds.
not a good fit, 6.502 5.991>

Created by T. Madas
Created by T. Madas
Question 4
The length of certain type of fresh water eel is investigated by a marine biologist.
The lengths of 100 such eels are summarized in the table below.
Length l (cm) No of Eels
10 ≤ l < 15 9
15 ≤ l < 20 12
20 ≤ l < 22 17
22 ≤ l < 25 44
25 ≤ l < 30 17
30 ≤ l < 35 1
Use a 2χ test, at 1% level of significance, to investigate whether the above data can
be modelled by a Normal distribution.
not a good fit, 17.573 6.635>

Created by T. Madas
Created by T. Madas
Question 5
A flock of seagulls have nests on a rock face, and when they leave their nests the
direction d they headed were recorded as a bearing, using certain landscape features.
Bearing d (degrees) No of seagulls
0 ≤ d < 45 52
45 ≤ d < 110 50
110 ≤ d < 148 28
148 ≤ d < 195 61
195 ≤ d < 233 31
233 ≤ d < 300 18
a) Show, by using a 2χ test at 0.5% level of significance, that seagulls have a
preferred direction when flying off their nests.
b) State with justification which are, and which are not, the preferred directions
of these seagulls.
preferred: 0 45 & 148 195
not preferred: 233 300
d d
d
° ≤ < ° ° ≤ < °
° ≤ < °

Created by T. Madas
Created by T. Madas
Question 6
It is suggested that the daily takings in a shop X , in thousands of £ , can be modelled
by the probability density function
( )( )1 2 1 0 5
30
0 otherwise
x xf x
+ ≤ <=
a) Show that according to this model, ( ) ( )1P 1 115
a X a a≤ < + = + .
The takings in 120 randomly selected days are summarized in the table below.
Takings x (£ 000) No of days
0 ≤ x < 1 14
1 ≤ x < 2 12
2 ≤ x < 3 27
3 ≤ x < 4 38
4 ≤ x < 5 29
b) Use a 2χ test, at 5% level of significance, to investigate whether the daily
takings in this shop could be modelled by the probability density function of
part (a).
not a good fit, 10.025 9.488>