Goodna Special School (3034) Queensland State School ... · students have opportunities to learn...
13
T DEPARTMENT OF EDUCATION, TRAINING AND EMPLOYMENT Goodna Special School (3034) Queensland State School Reporting 2012 School Annual Report YPEOVER TO INSERT SCHOOL NAME Postal address PO Box 281 Goodna 4300 Phone (07) 3381 4222 Fax (07) 3381 4200 Email [email protected] Webpages Additional reporting information pertaining to Queensland state schools is located on the My School website and the Queensland Government data website. Contact Person Principal – Michael Brett Principal’s foreword Introduction This School Annual Report provides a concise picture of the school’s performance during the 2012 school year. It details progress towards the agreed goals documented in the Annual Implementation Plan and it outlines the areas for improvement for 2013. It provides a snapshot of the student body, our curriculum offerings, the use of Information and Communication Technology, the school climate, and the involvement of parents in their children’s education. It also provides information about the levels of satisfaction of parents, students and members of staff, and provides a profile of our staff. This School Annual Report also provides details about the performance of our students including their attendance, their achievements and their attainment of qualifications. School progress towards its goals in 2012 Improved the level of engagement and participation of parents/caregivers and the broader community in the school’s learning agenda Developed and delivered a range of programs and events aimed at promoting healthy lifestyles for our students, their families, staff members and other members of our school community Implemented the Australian Curriculum, with particular emphasis on improved student achievement in Communication, Literacy and Numeracy Implemented differentiated teaching of communication skills based on data from the On-line Communication Matrix (non- verbal students) and the First Steps in Speaking and Listening Map of Development (verbal students) Implemented differentiated teaching of reading across the school based on data from the PM Benchmarks Implemented differentiated teaching of numeracy across the school based on data from the Waddington Diagnostic Mathematics Diagnostic Tests Mapped student progress against the Content Descriptors of the Australian Curriculum Implemented school programs to enhance understanding of Aboriginal and Torres Strait Islander Perspectives and strategies to develop links with the Pacific Islander and Indigenous Communities Developed a whole-school Curriculum Plan that details whole-school curriculum initiatives in Communication, Literacy and Numeracy, as well as the pedagogical practices that are distinctive to each Juncture • Achieved improved school performance in supporting the positive behaviour of all students through the implementation of
Transcript of Goodna Special School (3034) Queensland State School ... · students have opportunities to learn...

T
DEPARTMENT OF EDUCATION, TRAINING AND EMPLOYMENT
Goodna Special School (3034)
Queensland State School Reporting
2012 School Annual Report
YPEOVER TO INSERT SCHOOL NAME
Postal address PO Box 281 Goodna 4300
Phone (07) 3381 4222
Fax (07) 3381 4200
Email [email protected]
Webpages Additional reporting information pertaining to Queensland state schools is located on the My School website and the Queensland Government data website.
Contact Person Principal – Michael Brett
Principal’s foreword
Introduction
This School Annual Report provides a concise picture of the school’s performance during the 2012 school year. It details progress towards the agreed goals documented in the Annual Implementation Plan and it outlines the areas for improvement for 2013. It provides a snapshot of the student body, our curriculum offerings, the use of Information and Communication Technology, the school climate, and the involvement of parents in their children’s education. It also provides information about the levels of satisfaction of parents, students and members of staff, and provides a profile of our staff.
This School Annual Report also provides details about the performance of our students including their attendance, their achievements and their attainment of qualifications.
School progress towards its goals in 2012
Improved the level of engagement and participation of parents/caregivers and the broader community in the school’s learning agenda
Developed and delivered a range of programs and events aimed at promoting healthy lifestyles for our students, their families, staff members and other members of our school community
Implemented the Australian Curriculum, with particular emphasis on improved student achievement in Communication, Literacy and Numeracy
Implemented differentiated teaching of communication skills based on data from the On-line Communication Matrix (non-verbal students) and the First Steps in Speaking and Listening Map of Development (verbal students)
Implemented differentiated teaching of reading across the school based on data from the PM Benchmarks
Implemented differentiated teaching of numeracy across the school based on data from the Waddington Diagnostic Mathematics Diagnostic Tests
Mapped student progress against the Content Descriptors of the Australian Curriculum
Implemented school programs to enhance understanding of Aboriginal and Torres Strait Islander Perspectives and strategies to develop links with the Pacific Islander and Indigenous Communities
Developed a whole-school Curriculum Plan that details whole-school curriculum initiatives in Communication, Literacy and Numeracy, as well as the pedagogical practices that are distinctive to each Juncture
• Achieved improved school performance in supporting the positive behaviour of all students through the implementation of

DEPARTMENT OF EDUCATION, TRAINING AND EMPLOYMENT
Queensland State School Reporting
2012 School Annual Report
School-wide Positive Behaviour Support
• Promoted the effective use of feedback and self-reflection on teaching practices through peer feedback and the use of self- reflection tools
• Developed the leadership capabilities of the school’s emerging and aspiring leaders through a coaching program for the DP, HOC, and the Juncture leaders provided by the Principal
• The Principal, DP, HOC and the Juncture Leaders provided feedback to teachers on classroom management and effective instructional practices with emphasis on the ESCM, SWPBS and the Professional Standards for Teachers
• We were not able to upgrade the school’s facilities to include a new car park and a three-bay bus garage
• We were not able to recruit a suitable person for the role of Chaplain
Future outlook
• Improve the school’s performance in all areas of the Teaching and Learning Audit
• Conduct the Quadrennial School Review to develop the school’s future Strategic Plan
• Develop a Whole School Curriculum Plan
• Implement the Australian Curriculum through delivery of C2C Units in English, Mathematics, Science and History
• Differentiate curriculum for students operating prior to Prep using the ACARA General Capabilities
• Implement the Literacy and Communication Plans
• Develop the Numeracy Plan
• Review Senior Schooling Curriculum in partnership with other SECC schools
• Embed the analysis and discussion of data to promote targeted teaching and recognisable growth in student learning
• Track student achievement on the PM Benchmarks, Waddington, Communication Matrix and First Steps in Speaking and Listening
• Develop the school’s Pedagogical Framework
• Develop and implement a whole school pedagogical assessment and data collection framework
• Articulate the distinctive features of the pedagogy relevant to each Juncture
• Clearly define the roles and responsibilities of all members of the school’s leadership team and clearly articulate this information to staff members and the school community
• Align Individual Development Plans and the school’s Professional Development Plan with the school’s Explicit Improvement Agenda, the Professional Standards for Teachers and the Leadership Capability Framework
• Maintain coaching programs for members of the school leadership team and for aspiring leaders
• Embed self-reflection, collegial feedback and Instructional Leadership into the school’s culture
• Implement formal and comprehensive induction of all new staff members
• Develop a wide range of strategies to promote excellent communication among staff members and to heighten the awareness and knowledge of all staff members about issues impacting on the school
• Implement Tier 2 of School-wide Positive Behaviour Support (SWPBS) across the school
• Implement data collection on Behaviour Zone
• Implement the new Responsible Behaviour Plan
• Consolidate the explicit teaching of programs related to personal development, resilience, problem-solving and other strategies that promote positive relationships and inter-personal skills for our students
• Initiate formal complex case management for students at high risk through a team approach
• Initiate a Chaplaincy Program to complement GIFS and other wellbeing programs
• Develop and deliver a series of workshops and other activities to support families and build the skills, knowledge and confidence of caregivers
• Develop a wide range of communication strategies to engage with members of the school community
• Review Asset Replacement Register and develop a prioritised Asset Replacement Plan aligned to the financial provision in the Budget
• Construct a new car park and bus shed
• Develop a rainforest environment and bike track in the corner of the school grounds behind I Block

Our school at a glance
School Profile
Coeducational or single sex: Coeducational
Year levels offered in 2012: Prep to Year 12 equivalent
Total student enrolments for this school:
Total Girls Boys
Enrolment Continuity
(Feb – Nov)
2010 108 26 82 97%
2011 117 30 87 95%
2012 117 31 86 92%
Student counts are based on the Census (August) enrolment collection.
Characteristics of the student body:
The students come to the school mainly from the suburbs of Goodna, Riverview, Collingwood Park, Redbank Plains, Bellbird Park, Carole Park and Springfield. A small number of students come to the school from localities outside of the schools catchment area. All of the students at the school have a verified Intellectual Impairment. Approximately 25% of the students have also been verified with a disability related to Autism Spectrum Disorder. There are a small number of students who also have additional disabilities related to Physical Impairment, Hearing Impairment and Vision Impairment. Approximately 70% of the students are male. Approximately 10% of the students are in the care of DoCS or in kinship care arrangements. Approximately 10% of students come from an indigenous background and approximately 15% come from Pacific Islander backgrounds.
Average Class sizes
Phase
Average Class Size
2010 2011 2012
Prep – Year 3 na na na
Year 4 – Year 10 na na na
Year 11 – Year 12 na na na
School Disciplinary Absences
Disciplinary Absences
Count of Incidents
2010 2011 2012
Short Suspensions - 1 to 5 days 57 36 20
Long Suspensions - 6 to 20 days 0 0 0
Exclusions 0 0 0
Cancellations of Enrolment 0 0 0

Our school at a glance
Curriculum offerings
Our distinctive curriculum offerings
The school uses a range of innovative methodologies to teach literacy and numeracy. These strategies are high motivational and use real-life and life-like activities. Specific strategies include the use of the PODD, ALS, and other visual supports; Social Stories; integrated therapy programs; and increasing use of interactive whiteboards and assistive technology
Other innovative programs include a market program, horse-riding, line dancing, gardening, car washing, girls club, bicycle repair and maintenance, and a range of life skills programs
Most students have the opportunity to participate in Manual Arts, Visual Arts, Personal Development, Physical Education and Home Economics classes.
Programs are implemented using a cross-curricular approach with academic skills often taught through real-life activities.
Computers are used to assist learning in most areas of the curriculum. Computers are available to students in their classrooms and in the computer mini-lab for group activities.
In the Senior School, students are given opportunities to participate in a range of authentic, real-life and life-like activities designed to prepare them for the worlds of work and leisure. Students are offered a range of work preparation activities such as ‘Coffee Shop’; ‘Healthy Lunches’; Recycling; out-work for local manufacturers; phone book and paper delivery; Work Experience and TAFE Courses. The Camp program provides opportunities for life skills to be practiced in a real-life situation.
Extra curricula activities
Many activities that are often seen as extra-curricular in other schools are part of the curriculum at Goodna Special School. The students have opportunities to learn life and leisure skills through programs such as fishing, camping, tenpin bowling, indoor soccer, touch football, grooming, food preparation, shopping and working in the community garden.
Interschool sporting events include swimming and athletics carnivals, touch football, indoor soccer, indoor cricket, special schools fishing competition and lawn bowls. There was a high level of participation and good sportsmanship displayed in all of these events.
Students engage in leisure activities that are meaningful to them and that are available in the local community. Factors such as cost, local availability, access by public transport, interest and life skills to be learnt are taken into account when choosing these activities
How Information and Communication Technologies are used to assist learning
Computers with internet access are available to students in all classrooms and they are used on a daily basis by students for all aspects of their school programs
During 2012, computers were used for gathering and keeping data through development of digital portfolios and moderation of Assessment Tasks.
A Computer Mini-lab is available to classes so that all students can work on computers and access the internet in a group situation.
The number of computers in the school increased during 2011 in line with increased enrolments so that the student: computer ratio has been maintained below 3:1
The school maintained an upgrading rotation of computers to ensure that students and staff have access to the most up-to-date technology
Social climate
All class programs focus on the development of appropriate social skills and on maintaining healthy relationships with others
The Goodna Integrated Family Support (GIFS) is integral to the way that the school supports our school community. A full time Family Support Officer works within the school community to support families that request assistance

Our school at a glance
The school’s Code of Responsible School Behaviour provides a framework for recognition and reward of positive behaviour and a structure for managing inappropriate or unacceptable behaviour
The school implemented Tier 1 of the School Wide Positive Behaviour Support program
The school achieved good practice compliance levels in the 2012 Workplace Health and Safety Audit
Parent, student and staff satisfaction with the school
Overall, parents, students and teachers are very satisfied with the performance of the school in most areas. Their levels of satisfaction are above the State Mean in all Performance Areas
Performance measure (Nationally agreed items shown*)
Percentage of parents/caregivers who agree that: 2012#
their child is getting a good education at school 92.6%
this is a good school 100.0%
their child likes being at this school* 100.0%
their child feels safe at this school* 100.0%
their child's learning needs are being met at this school* 96.4%
their child is making good progress at this school* 89.3%
teachers at this school expect their child to do his or her best* 96.3%
teachers at this school provide their child with useful feedback about his or her school work* 92.6%
teachers at this school motivate their child to learn* 96.3%
teachers at this school treat students fairly* 100.0%
they can talk to their child's teachers about their concerns* 100.0%
this school works with them to support their child's learning* 96.3%
this school takes parents' opinions seriously* 96.4%
student behaviour is well managed at this school* 100.0%
this school looks for ways to improve* 100.0%
this school is well maintained* 100.0%

Our school at a glance
Performance measure (Nationally agreed items shown*)
Percentage of students who agree that: 2012#
they are getting a good education at school 100.0%
they like being at their school* 93.3%
they feel safe at their school* 86.7%
their teachers motivate them to learn* 100.0%
their teachers expect them to do their best* 100.0%
their teachers provide them with useful feedback about their school work* 100.0%
teachers treat students fairly at their school* 100.0%
they can talk to their teachers about their concerns* 93.3%
their school takes students' opinions seriously* 100.0%
student behaviour is well managed at their school* 100.0%
their school looks for ways to improve* 100.0%
their school is well maintained* 100.0%
their school gives them opportunities to do interesting things* 100.0%
Performance measure (Nationally agreed items shown*)
Percentage of school staff who agree: 2012#
that they have good access to quality professional development 92.2%
with the individual staff morale items 92.2%
* Nationally agreed student and parent/caregiver items were incorporated in the School Opinion Survey in 2012.
# Percentage of respondents who Somewhat Agree, Agree or Strongly Agree with the statement. Due to changes to the School Opinion Surveys in 2012,
comparisons with results for previous years are not recommended.
DW = Data withheld to ensure confidentiality.

Our school at a glance
Involving parents in their child’s education
Parents are involved within the school in a wide range of ways and the school fosters an open-door policy for parents to access class teachers, school leaders and administration staff.
Twice each year, parents or caregivers meet with their child’s teacher and other relevant school staff members to review the student’s Individual Support Plan (ISP) and to determine the student’s curriculum access goals for the next six-month period.
The ISP for each student is future-oriented and deals with their ability to access the curriculum. ISPs are planned with parents and often deal with issues of the student’s ability to communicate, to stay on task, to follow directions, to work collaboratively and to participate in groups in a socially acceptable manner.
Parents are also invited to participate in the Educational Adjustment Profile (EAP) process.
Regular contact is kept between families and school through communication books, phone calls, meetings, personal contacts and via email, Facebook, Twitter and the school’s website.
Parents or caregivers are sent a School Newsletter each week and these newsletters are posted on the school’s website. Special colour editions of the School Newsletter are produced at the end of each Term and at the time of other special events
Parents are invited to participate on school committees and to attend school events and celebrations.
Attendance levels of parents at P and C meetings were maintained during 2012.
The School Fair at the end of the 2012 was extremely well attended and was a major fundraising activity for the P and C Committee.
The parents at the school support each other through a very successful ‘My Time’ Group
Reducing the school’s environmental footprint
Data is sourced from school's annual utilities return and is reliant on the accuracy of these returns.
The school reduced its environmental footprint by raising staff awareness about the need to reduce electricity and water consumption; by installing solar panels and water tanks; and by making modifications to toilets and other school buildings and infrastructure to promote efficient use of resources.
Environmental footprint indicators
Electricity kWh
Water kL
2009-2010 70,640 697
2010-2011 88,048 676
2011-2012 79,512 1,142

Our staff profile
Staff composition, including Indigenous staff
2012 Workforce Composition
Teaching Staff
Non-teaching Staff
Indigenous Staff
Headcounts 28 35 <5
Full-time equivalents 26.2 20.5 <5
Qualifications of all teachers
Highest level of
attainment
Number of
classroom
teachers and
school leaders
at the school
Doctorate 1
Masters 0
Bachelor degree 25
Diploma 5
Certificate 10
0
5
10
15
20
25
1 0
25
510
Doctorate Masters
Bachelor degree Diploma
Certificate
Expenditure on and teacher participation in professional development
The total funds expended on teacher professional development in 2012 were $42271
The major professional development initiatives are as follows:
The major professional development initiatives are as follows:
Membership of the Special Education Curriculum Cluster
Funding of salaries for teacher release for PD activities
Course registration fees
The proportion of the teaching staff involved in professional development activities during 2012 was 100%.

Our staff profile
Average staff attendance 2010 2011 2012
Staff attendance for permanent and temporary staff and school leaders. 96.4% 96.7% 95.7%
Proportion of staff retained from the previous school year
From the end of the previous school year, 95.4% of staff was retained by the school for the entire 2012 school year.
School income broken down by funding source
School income broken down by funding source is available via the My School website at http://www.myschool.edu.au/.
To access our income details, click on the My School link above. You will then be taken to the My School website with the following ‘Find a school’ text box.
Where it says ‘Search by school name’, type in the name of the school you wish to view, and select <GO>. Read and follow the instructions on the next screen; you will be asked to accept the Terms of Use and Privacy Policy before being given access to the school’s My School entry web page.
School financial information is available by selecting ‘School finances’ in the menu box in the top left corner of the school’s entry web page. If you are unable to access the internet, please contact the school for a paper copy of income by funding source.

Performance of our students
Key student outcomes
e
Student attendance 2010 2011 2012
The overall attendance rate for the students at this school (shown as a percentage). 92% 90% 92%
The overall attendance rate in 2012 for all Queensland state Special schools was 90%.
Student attendance rate for each year level (shown as a percentage)
Year 1
Year 2
Year 3
Year 4
Year 5
Year 6
Year 7
Year 8
Year 9
Year 10
Year 11
Year 12
2010 na na na na na na na na na na na na
2011 na na na na na na na na na na na na
2012 na na na na na na na na na na na na
DW = Data withheld to ensure confidentiality.
Student Attendance Distribution
The proportions of students by attendance range.
19
21
14
7
14
17
22
25
18
53
41
51
0% 20% 40% 60% 80% 100%
2010
2011
2012
Proportion of Students
0% to <85% 85% to <90% 90% to <95% 95% to 100%Attendance:
Description of how non-attendance is managed by the school
Non-attendance is managed in state schools in line with the DET policies, SMS-PR-029: Managing Student Absences and SMS-PR-036: Roll Marking in State Schools, which outline processes for managing and recording student attendance and absenteeism.
At Goodna Special School, Class Rolls are marked each day showing student attendance at morning and afternoon sessions. The Rolls are checked and entered onto OneSchool every 4 weeks and at the end of each Term. Parents/caregivers are requested to contact the school to explain why there children are absent from school on any given day. This can be done by telephone or via the school bus supervisors. If absences are unexplained, the school administration contacts parents/caregivers to obtain an explanation.
National Assessment Program – Literacy and Numeracy (NAPLAN) results – our reading, writing, spelling, grammar and punctuation, and numeracy results for the Years 3, 5, 7 and 9.
Our reading, writing, spelling, grammar and punctuation, and numeracy results for the Years 3, 5, 7 and 9 are available via the My School website at http://www.myschool.edu.au/.

Performance of our students
To access our NAPLAN results, click on the My School link above. You will then be taken to the My School website with the following ‘Find a school’ text box.
Where it says ‘Search by school name’, type in the name of the school whose NAPLAN results you wish to view, and select <GO>.
Read and follow the instructions on the next screen; you will be asked to accept the Terms of Use and Privacy Policy before being able to access NAPLAN data.
If you are unable to access the internet, please contact the school for a paper copy of our school’s NAPLAN results.
Achievement – Closing the Gap
The attendance rate of indigenous students at this school during 2012 was slightly higher than that of the non-indigenous students. This has steadily improved over the last five school years. The apparent retention rate for Year 10 to Year 12 for both indigenous and non-indigenous students is 100%. As students at this school are exempt from the NAPLAN Tests, there is no comparative data on the achievement of indigenous and non-indigenous students.
Apparent retention rates Year 10 to Year 12 2010 2011 2012
Year 12 student enrolment as a percentage of the Year 10 student cohort. 100% 100% 100%
Outcomes for our Year 12 cohorts 2010 2011 2012
Number of students receiving a Senior Statement. 7 6 11
Number of students awarded a Queensland Certificate Individual Achievement. 7 6 11
Number of students receiving an Overall Position (OP). 0 0 0
Number of students who are completing/continuing a School-based Apprenticeship or Traineeship (SAT).
0 0 0
Number of students awarded one or more Vocational Educational Training (VET) qualifications
(incl. SAT). 0 2 11
Number of students awarded an Australian Qualification Framework Certificate II or above. 0 0 1
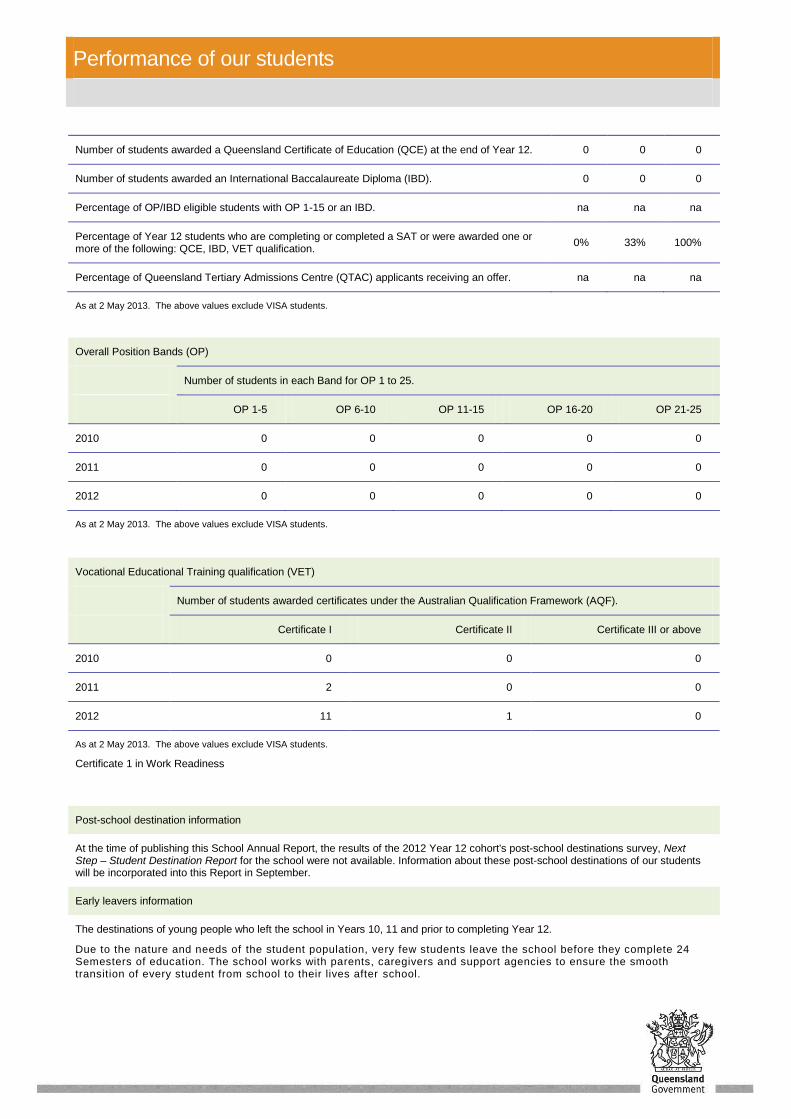
Performance of our students
Number of students awarded a Queensland Certificate of Education (QCE) at the end of Year 12. 0 0 0
Number of students awarded an International Baccalaureate Diploma (IBD). 0 0 0
Percentage of OP/IBD eligible students with OP 1-15 or an IBD. na na na
Percentage of Year 12 students who are completing or completed a SAT or were awarded one or more of the following: QCE, IBD, VET qualification.
0% 33% 100%
Percentage of Queensland Tertiary Admissions Centre (QTAC) applicants receiving an offer. na na na
As at 2 May 2013. The above values exclude VISA students.
Overall Position Bands (OP)
Number of students in each Band for OP 1 to 25.
OP 1-5 OP 6-10 OP 11-15 OP 16-20 OP 21-25
2010 0 0 0 0 0
2011 0 0 0 0 0
2012 0 0 0 0 0
As at 2 May 2013. The above values exclude VISA students.
Vocational Educational Training qualification (VET)
Number of students awarded certificates under the Australian Qualification Framework (AQF).
Certificate I Certificate II Certificate III or above
2010 0 0 0
2011 2 0 0
2012 11 1 0
As at 2 May 2013. The above values exclude VISA students.
Certificate 1 in Work Readiness
Post-school destination information
At the time of publishing this School Annual Report, the results of the 2012 Year 12 cohort's post-school destinations survey, Next Step – Student Destination Report for the school were not available. Information about these post-school destinations of our students will be incorporated into this Report in September.
Early leavers information
The destinations of young people who left the school in Years 10, 11 and prior to completing Year 12.
Due to the nature and needs of the student population, very few students leave the school before they complete 24 Semesters of education. The school works with parents, caregivers and support agencies to ensure the smooth transition of every student from school to their lives after school.

Performance of our students