CHEMICAL REACTIONS & REACTIONS &BALANCINGEQUATIONSChemistry.
GOOD OR BAD ENERGY? - MARKET REACTIONS TO ELECTRIC UTILITIES’ STRATEGIC INVESTMENTS:
AN EVENT STUDY(NCE WP3.5)
Aino KuitunenIda KorpivaaraSamuli Patala
Kaisu PuumalainenAnne Jalkala
LUT School of Business and Management
October 2015
Status of our team’s research• Main objective
Understanding the decision-making behind strategic energy investments
• Legitimacy under institutional change: Justifications of energy investments (Samuli Patala, Ida Korpivaara, Anne Jalkala, Aino Kuitunen)
– presented the paper at EGOS 2015 conference in June• Positive feedback
– Status now: finalization, will be sent to Organization Studies (JUFO 3)
• Good or bad energy? - Market reactions to electric utilities’ strategic investments– Event study based on the same data– Accepted to Global Cleaner production and sustainable consumption -conference
• November 1 -4th, Sitges, Barcelona– Full paper aiming to one of the special issues of Journal of Cleaner Production (JUFO 2)
RESEARCH QUESTION
DO STOCK MARKETS REACT TO CARBON RISK OF NEW CAPACITY INVESTMENTS?
Research question
DO STOCK MARKETS REACT TO CARBON RISK OF NEW CAPACITY INVESTMENTS?

Carbon risk and energyinvestments
• Carbon risk: risk exposure of an asset caused by estimated changes of carbon usage
• IEA: no more than 1/3 of proven fossil fuel reserves can be consumed prior to 2050 to achieve 2 C target
• Is carbon risk affecting new capacity investments in the energy sector?
• Can be measured as the relative performance change from the status quo to thepredicted carbon exposure (Hoffman & Busch, 2009)

How do investors react to investments?
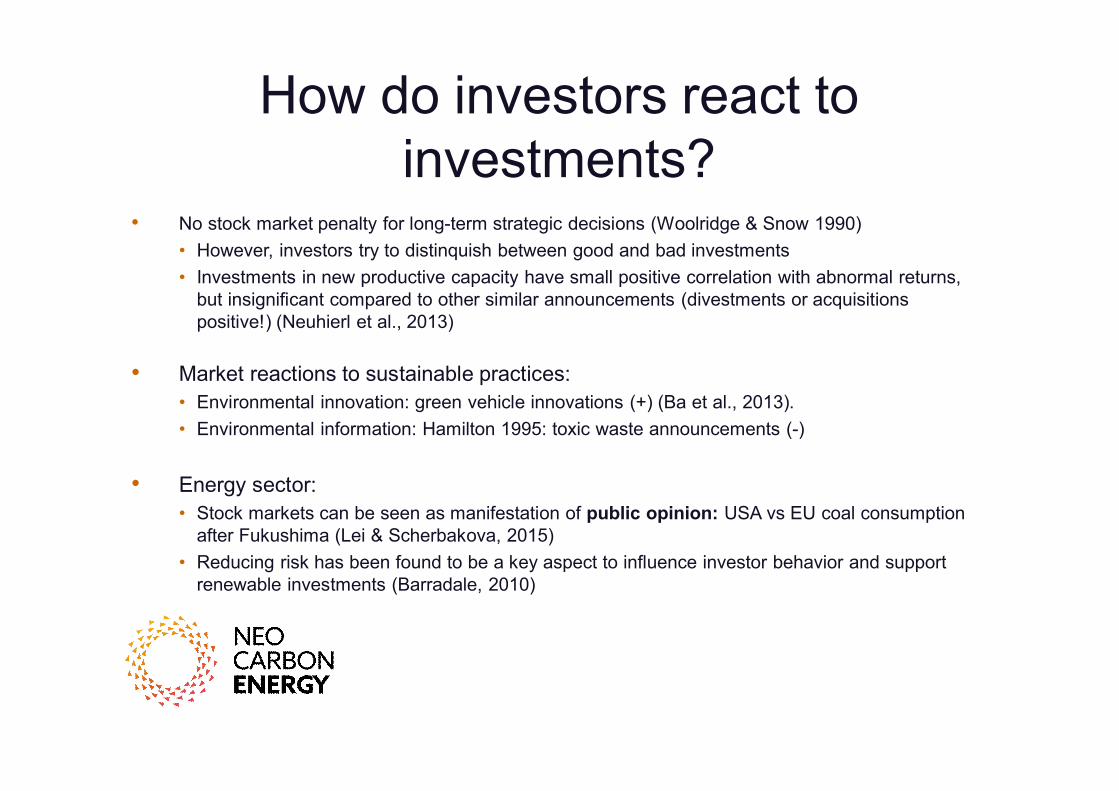
• No stock market penalty for long-term strategic decisions (Woolridge & Snow 1990)• However, investors try to distinquish between good and bad investments• Investments in new productive capacity have small positive correlation with abnormal returns,
but insignificant compared to other similar announcements (divestments or acquisitions positive!) (Neuhierl et al., 2013)
• Market reactions to sustainable practices:• Environmental innovation: green vehicle innovations (+) (Ba et al., 2013).• Environmental information: Hamilton 1995: toxic waste announcements (-)
• Energy sector:• Stock markets can be seen as manifestation of public opinion: USA vs EU coal consumption
after Fukushima (Lei & Scherbakova, 2015)• Reducing risk has been found to be a key aspect to influence investor behavior and support
renewable investments (Barradale, 2010)
Event study
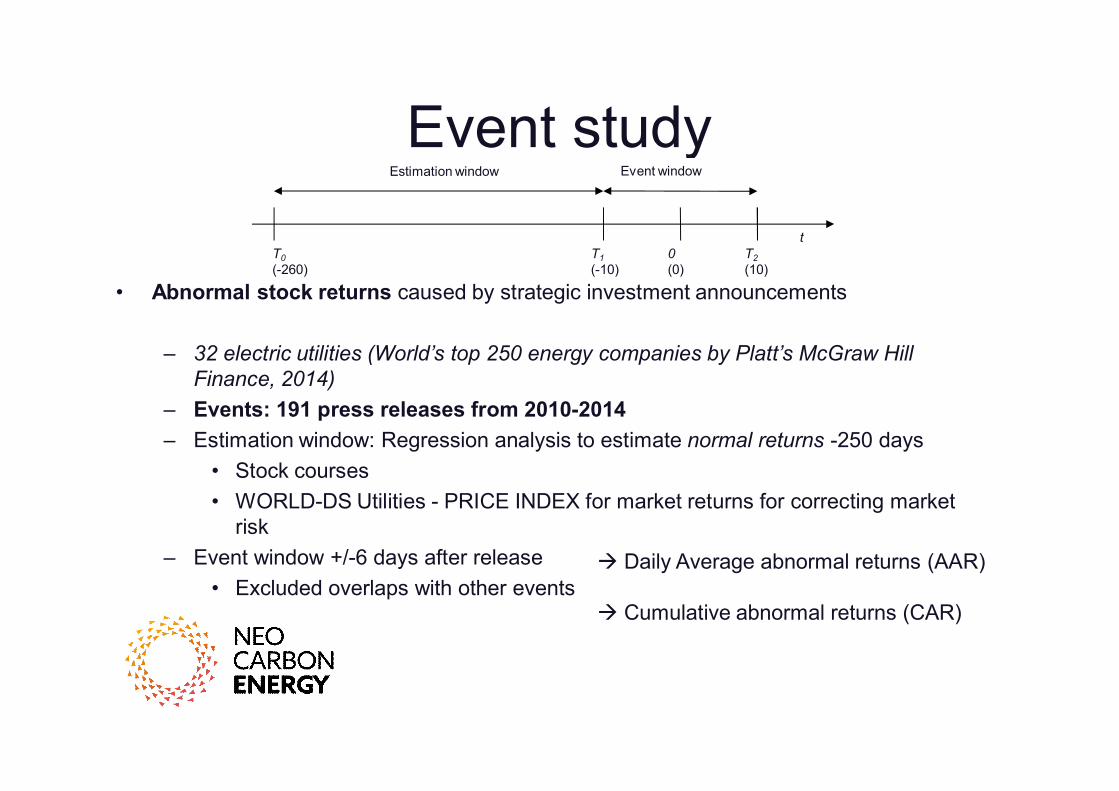
• Abnormal stock returns caused by strategic investment announcements
– 32 electric utilities (World’s top 250 energy companies by Platt’s McGraw Hill Finance, 2014)
– Events: 191 press releases from 2010-2014– Estimation window: Regression analysis to estimate normal returns -250 days
• Stock courses• WORLD-DS Utilities - PRICE INDEX for market returns for correcting market
risk– Event window +/-6 days after release
• Excluded overlaps with other events
t
Event windowEstimation window
T0(-260)
T1(-10)
0(0)
T2(10)
Daily Average abnormal returns (AAR)
Cumulative abnormal returns (CAR)

Previous event studies in energy context
• Scholtens & Boersen 2011: • market reactions to energy accidents• no significant reactions (except Tschernobyl)
• Lei & Scherbakova (2015): • Climate opinions through investment behavior• Fukushima accident made EU invest in RE and US in coal
Footer

Strategic investment data
0
10
20
30
40
50
60
70
80
Utilized energy sources
Fr %
Carbon risk class Frequency %
Low (wind, wave) 76 40,0Lower medium (hydro,pv,solar(th)) 61 32,1
Medium (nuclear,biomass) 18 9,5
High (coal, gas, oil) 35 18,4

Results: The daily average abnormal returns (AAR)

AAR: Effect of investment type
Greenfield N=126 Acquisition N=34 Brownfield N=31 Total N=191 Oneway ANOVA
Mean S.D. Mean S.D. Mean S.D. Mean S.D. F p-3 ,0004 ,01164 -,0001 ,00555 ,0020 ,01181 ,0006 ,01081 ,350 ,705
-2 ,0006 ,01195 ,0027 ,01363 -,0064 ,01388 -,0002 ,01284 4,915 ,008
-1 ,0012 ,01244 -,0011 ,00858 -,0019 ,01143 ,0003 ,01171 1,207 ,301
Event day -,0017 ,01231 -,0013 ,00895 ,0041 ,01145 -,0007 ,01178 3,140 ,046
1 ,0006 ,01492 -,0007 ,00971 -,0027 ,01216 -,0001 ,01370 ,779 ,461
2 -,0003 ,01330 -,0011 ,01163 -,0051 ,02118 -,0012 ,01462 1,355 ,260
3 -,0024 ,01379 -,0012 ,01136 -,0031 ,01783 -,0023 ,01407 ,150 ,861
4 ,0003 ,01425 ,0026 ,00860 -,0055 ,01242 -,0002 ,01330 3,343 ,037
5 -,0003 ,01182 ,0015 ,00957 -,0022 ,01322 -,0003 ,01169 ,792 ,455
6 ,0002 ,01264 ,0011 ,01023 ,0016 ,01078 ,0006 ,01191 ,202 ,817
Footer

AAR: Effect of target country
USA&CAN N=61 EUR N=79 BRICS N=24 Other N=27 Oneway ANOVAMean S.D. Mean S.D. Mean S.D. Mean S.D. F p
-3 -,0008 ,00873 ,0003 ,01051 ,0047 ,00965 ,0009 ,01562 1,548 ,204
-2 -,0006 ,01148 ,0008 ,01367 -,0040 ,00964 ,0012 ,01546 1,012 ,389
-1 ,0016 ,00892 -,0025 ,01280 ,0018 ,01007 ,0041 ,01387 2,857 ,038
Event day -,0011 ,00924 -,0012 ,01327 ,0007 ,01079 ,0004 ,01348 ,279 ,841
1 ,0000 ,00799 ,0013 ,01391 ,0018 ,01472 -,0064 ,02005 2,397 ,070
2 -,0022 ,01145 -,0026 ,01680 ,0038 ,01269 ,0006 ,01534 1,404 ,243
3 -,0007 ,01170 -,0043 ,01692 ,0009 ,01031 -,0029 ,01228 1,237 ,298
4 -,0015 ,00919 ,0001 ,01375 ,0028 ,01913 -,0009 ,01390 ,645 ,587
5 -,0001 ,00845 -,0013 ,01396 -,0014 ,01047 ,0031 ,01162 1,010 ,389
6 ,0009 ,01151 -,0004 ,01271 ,0004 ,00941 ,0028 ,01265 ,509 ,677
Footer

AAR: Effect of energy source by carbon risk class
low (wind) N=76
lower medium (hydro,pv, solar
thermal) N=61
medium (nuclear,biomass) N=18
high(coal, gas, oil) N=35 Oneway ANOVA
Mean S.D. Mean S.D. Mean S.D. Mean S.D. F p-3 -,0005 ,00925 ,0014 ,01436 ,0008 ,00811 ,0010 ,00778 ,357 ,784
-2 ,0018 ,01362 -,0014 ,01388 ,0005 ,01051 -,0022 ,00968 1,110 ,346
-1 -,0007 ,01213 ,0027 ,01295 -,0032 ,00875 ,0000 ,00939 1,560 ,201
Event day -,0020 ,01284 -,0002 ,01085 ,0021 ,01087 -,0003 ,01170 ,698 ,555
1 ,0015 ,01256 -,0011 ,01554 ,0021 ,00999 -,0036 ,01400 1,361 ,256
2 -,0018 ,01413 -,0013 ,01710 -,0040 ,00893 ,0017 ,01354 ,707 ,549
3 -,0023 ,01563 -,0015 ,01209 -,0052 ,01926 -,0016 ,00997 ,343 ,794
4 ,0003 ,01564 -,0007 ,01167 -,0003 ,01217 ,0009 ,00889 ,135 ,939
5 -,0006 ,01015 ,0012 ,01176 -,0054 ,01476 ,0015 ,01044 1,916 ,128
6 ,0016 ,01093 ,0017 ,01054 -,0059 ,01778 ,0002 ,01202 2,208 ,089
Footer

Some significant results• Technologies
• day +6 RE (+), NON-RE (-)
• day +6 low carbon risk class (+), middle (eg. nuclear) (-), high risk (neutral)
• Location
• day -3, +2 Developing countries (+), developed (-)
• day -1 EU (+), others (-)
• Investment type
• day -2, +4 brownfield (-), acquisition (+)
• day 0 brownfield (+), other types (-)
• day +3 negative for all

Conclusions / discussion• No consistency in:
• Reactions• Differences between comparison groups
Is this related to markets or method+data?
Limitations
• Sample size• Subgroup comparability?
• Methodological critique• Event study + Uncertainty
• Portfolio aspect• Time period
More analysis:
• Attention to error term and volatility• Lenghth of estimation window?• More detailed company data• Carbon risk discussion?
• Can we see a difference if we include year2015?
References• Asset Owners Disclosure Project (AODP). (2015). World’s Largest Investors Continue to Gamble on Climate Risk. Media Release 27.4.2015.• Ba, S., Lisic, L.L., Liu, Q., and Stallaert, J. (2013). Stock Market Reaction to Green Vehicle Innovation. Production & Operations Management 22, 976–990. • Barradale, M.J. (2010). Impact of public policy uncertainty on renewable energy investment: Wind power and the production tax credit. Energy Policy 38, 7698–7709.• Bloomberg New Energy Finance 2014. “Global Trends in Renewable Energy Investment 2015”• Bürer, M.J., and Wüstenhagen, R. (2009). Which renewable energy policy is a venture capitalist’s best friend? Empirical evidence from a survey of international cleantech
investors. Energy Policy 37, 4997–5006.• Carbon Tracker Initiative. 2014. Unburnable Carbon – Are the world’s financial markets carrying a carbon bubble? Available at: http://www.carbontracker.org/wp-
content/uploads/2014/09/Unburnable-Carbon-Full-rev2-1.pdf• Ceres. (2015). Carbon Asset Risk. Online. Available at: http://www.ceres.org/issues/carbon-asset-risk [Accessed 13.9.2015].• Clark, Pilita. (2014). Bank of England to examine financial risks linked to fossil fuels. Financial Times 30.11.2014.• Financial Times. (2015). Marriage, M. (2015). Investors’ climate change ‘gamble’ exposed. Financial Times, 26.4.2015.• Financial Times. (2015b). Grene, S. (2015). Investment consultants told to ‘man up’ on stranded assets. Financial Times 22.3.2015.• Hoffmann, V.H. & Busch, T. (2009). Corporate Carbon Performance Indicators. Carbon Intensity, Dependency, Exposure and Risk. Journal of Industrial Ecology, 12 (4),
505-520.• IEA (International Energy Agency). (2012). World Energy Outlook 2012. IEA 12.11.2012.• IEA (2014a). “Energy Technology Perspectives. Harnessing Electricity’s potential.”• IEA (2014b). “World Energy Investment Outlook. Special Report.”• Lei, Z. & Shcherbakova, A. V., 2015. Revealing climate change opinions through investment behavior: Evidence from Fukushima. Journal of Environmental Economics
and Management, 70, pp.92–108. • Neuhierl, A., Scherbina, A., and Schlusche, B. (2013). Market Reaction to Corporate Press Releases. Journal of Financial & Quantitative Analysis 48, 1207–1240. • Platts McGraw Hill Finance Group, 2014. Platts Top 250 Global Energy Company Rankings 2014. Online. Available at: http://top250.platts.com/Top250Rankings
[Accessed 7.1.2015] • Scholtens, B., and A. Boersen. 2011. “Stocks and Energy Shocks: The Impact of Energy Accidents on Stock Market Value.” Energy 36 (3). Elsevier Ltd: 1698–1702. • Woolridge, J, and C. Snow. 1990. “Stock Market Reaction to Strategic Investment Decisions.” Strategic Management Journal 11 (5): 353–63.

THANK YOU FOR YOUR ATTENTION!
COMMENTS ORQUESTIONS?