Good morning and thank you for joining us today. Welcome ... · PDF fileGood morning and thank...
48
1
Transcript of Good morning and thank you for joining us today. Welcome ... · PDF fileGood morning and thank...

1

2
Good morning and thank you for joining us today. Welcome to the 2014 BP Upstreaminvestor day.We are pleased to have you here with us.

3
Before I begin I need to draw your attention to our cautionary statement. During today’spresentation, we will make forward-looking statements that refer to our estimates, plansand expectations. Actual results and outcomes could differ materially due to factors thatwe note on this slide and in our UK and SEC filings. Please refer to our Annual Report,Stock Exchange Announcement and SEC filings for more details. These documents areavailable on our website.

4
You will find evacuation guidelines within the safety briefing materials which are includedwith the hand-outs on your seat. We’re not planning to test the alarm system today, so ifyou hear it, please proceed as advised by these instructions.
Today will be focused on our Upstream business and therefore we will not cover ourbusiness in Russia or the Downstream in any detail.
I’ll start with an overview of our portfolio and value drivers. This is followed by four break-outs to give you a deeper look at the execution progress we have made and the futureopportunities that we have in front of us. The breakout sessions will focus on:
– Resource progression;– Execution in the base assets;– Our major projects; and– Our gas strategy
We will come back together mid-afternoon for a wrap-up and final questions.
I would also like to add that outside in the catering areas we have some stands,accompanied by our subject matter experts, showcasing a few of our key upstreamtechnologies. I hope you’ll take the opportunity to view the displays and find out a littlemore about them from the team.
Now I’d like to introduce my Upstream leadership team who are here with me today.
Tony Brock, Head of Safety & Operational Risk;
Simon Drysdale, Head of Human Resources;
James Dupree, Chief Operating Officer, Reservoir Development &Technology;

Richard Herbert, COO, Exploration;
Andy Hopwood, COO, Strategy & Regions;
Bernard Looney, COO, Production;
Steve Riney, CFO for the Upstream;
Neil Shaw, COO, Projects; and
Dave Lawler, new CEO of our Lower 48 business.
4

5
So let me outline the agenda for this session.
First I will start with an overview of the macro environment which is on everyone’s mindsand I will try to put the recent developments in oil price into context for what we are goingto cover today.
Second, I’ll outline our Upstream strategy and the characteristics of our portfolio beforefocusing on the key drivers of our Upstream value proposition through four differentlenses. Those lenses are:
– What we are doing to manage our base business – that’s mainly about execution;– Our project pipeline – where I will give you some more insight into the depth and
quality of our project set;– The resource base and exploration portfolio that underpin our long-term value
proposition; and– The cost efficiency efforts that are underway in the Upstream.
Third, I will highlight our gas strategy and show you the distinctive production and tradinggrowth engine that we have created in BP.
And, finally, our new CEO of the US Lower 48 business, David Lawler, will describe for youthe progress we have made in restructuring that business and his views on its future.
We have been listening closely to your feedback and have noted that, aside from thecurrent market volatility, there are a number of questions on your mind. Some are sectorrelated and some unique to BP. We will aim to address these throughout the day and wehope to bring you more clarity on some key questions such as:

– What is our base decline rate?– Does BP have the right balance of deepwater, gas and
unconventionals?– Is our project pipeline strong enough beyond 2018?– Can we deliver cost and capital efficiency improvements?– Can we continue to progress and replace reserves?– Can we continue to grow underlying production and operating cash
flow?– And, how does the current environment affect our business?
5

So starting with the environment. Since we last met in March, oil prices have fallen sharplywhile gas prices continue to reflect local supply and demand dynamics.
Brent has averaged around $80 per barrel in the fourth quarter to date and currently sitsbelow $70 per barrel.
Market fundamentals are driving this trend.
– Global supply has increased, mainly due to a couple of factors: the return of shut-inproduction in a number of locations - such as Libya - and continued production growthin the United States, where inventory storage also remains relatively high;
– In conjunction with this increase in supply we continue to see weaker demandglobally; and
– OPEC’s recent decision not to cut production has also left the market more vulnerableto these natural forces of supply and demand.
However, price volatility is inherent in our industry, as is evident from the chart. In fact, thelast four years has been a remarkably stable period by historical standards for oil prices.
7
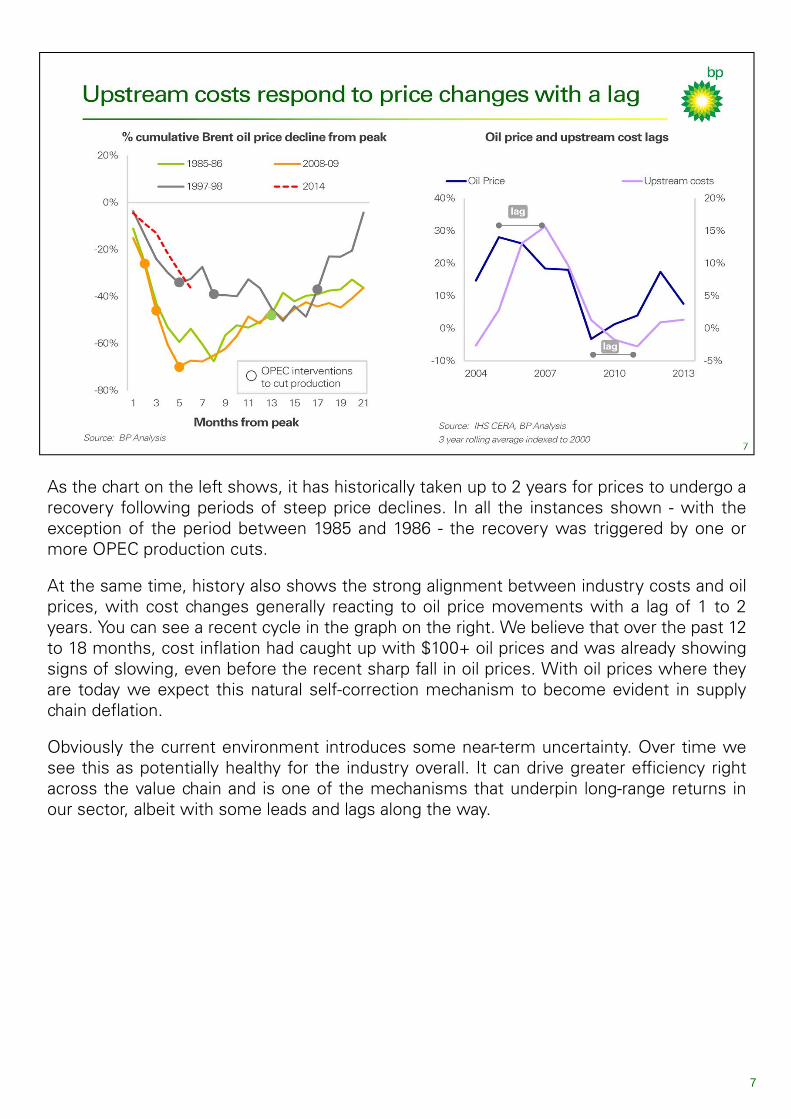
As the chart on the left shows, it has historically taken up to 2 years for prices to undergo arecovery following periods of steep price declines. In all the instances shown - with theexception of the period between 1985 and 1986 - the recovery was triggered by one ormore OPEC production cuts.
At the same time, history also shows the strong alignment between industry costs and oilprices, with cost changes generally reacting to oil price movements with a lag of 1 to 2years. You can see a recent cycle in the graph on the right. We believe that over the past 12to 18 months, cost inflation had caught up with $100+ oil prices and was already showingsigns of slowing, even before the recent sharp fall in oil prices. With oil prices where theyare today we expect this natural self-correction mechanism to become evident in supplychain deflation.
Obviously the current environment introduces some near-term uncertainty. Over time wesee this as potentially healthy for the industry overall. It can drive greater efficiency rightacross the value chain and is one of the mechanisms that underpin long-range returns inour sector, albeit with some leads and lags along the way.

BP has a good track record of managing through these cycles and we believe we haveenough flexibility to withstand a period of low oil prices. I would highlight a few things.
First, at the highest level, BP is an integrated business. Lower prices should benefit ourDownstream business and provide some natural offsets.
In the Upstream, we sanction projects at $80 per barrel at which level we expect a projectto generate competitive returns. We also test each project at $60 per barrel to understandthe resilience of our portfolio at a range of prices. We have a portfolio with around onethird of production coming from Production Sharing Agreements and we also have anumber of high-quality domestic gas projects - these sort of investments are typically lesssensitive to oil price movements.
We enter this period with a very strong balance sheet. Gearing is historically low at around15% and cash balances are strong. This ensures we have the time and flexibility to makethe right decisions for the group.
We will look very closely at every dollar of capital spend. This is relative to the group’sorganic capital frame of $24-26 billion of capital expenditure per annum between 2015 and2018 that we showed you in March – of which $20-22 billion relates to the Upstream. Wewill look to pare back or re-phase spend where we can do so without compromising safetyor the future growth of the group. In October we told you this could make a difference of$1-2 billion in 2015 across the group. Of course, given the recent position taken by OPECand with oil prices where they are today, we will continue to review this further and willupdate guidance for 2015 with our fourth quarter results in February as appropriate. A lotdepends on the pace of deflation and the benefits of balancing timing investments andopportunities to leverage the deflationary curve.
In addition to industry price deflation, BP will also benefit from the greater focus on

streamlining activity that we began some 18 months ago in response toresizing the group. As you have seen from today’s press announcement, aspart of the group’s ongoing programme to simplify across Upstream,Downstream and corporate functions, we expect the group to incur about$1 billion of non-operating restructuring charges over the next five quarters,including the current quarter. In the Upstream we are in action to aligntoday’s cost base with our smaller footprint and reduced activity levels, aswell as to drive further efficiencies into our processes. We will explainsome specifics of our Upstream cost efficiency agenda throughout the day.
8

9
In March of this year we re-iterated our group proposition to you based on a $100 perbarrel real oil price assumption out to 2018. We clearly expect to see an impact from loweroil prices over this timeframe. And as just illustrated, if these levels are sustained, we alsoexpect industry margin structures to reconfigure to the changing macro conditions.
So the numbers may turn out to be different but we nonetheless see the fundamentalprinciples of our proposition as unchanged and designed to drive competitive returns wellbeyond 2018.
It starts with value over volume, which means investing in high-quality activities which playto our strengths, divesting assets which are not core to our strategy and finding alternativeways to create long-term value through portfolio realignment. In the BP group, further tothe $38 billion of divestments completed recently we are progressing towards divesting anadditional $10 billion of assets by the end of 2015.
We aim to grow sustainable free cash flow over time. We plan to do this by deliveringmaterial growth in underlying operating cash flow from our business operations, whilereinvesting, in a very disciplined way, into only the best opportunities within our definedcapital limits.
We will look to support growth in distributions to shareholders through a progressivedividend policy and use surplus cash, beyond capital and dividend payments, primarily toenhance distributions through buybacks. As noted on our October call, our first prioritywithin the financial framework will always be the dividend. During this period of volatilitywe will judge the use of cash for discretionary re-investment and other forms ofdistribution on an ongoing basis.
Today is all about looking at the Upstream and how we support these overall objectives forthe group. We are going to show you the depth of our set of opportunities out to 2020 and

beyond. Our strategy is long range which we believe is the only way tomanage this business.
Notwithstanding near term oil price impacts, the outlook we will show youis based on real $100 per barrel oil and $5 per million BTU Henry Hubprices. This allows the most effective like-for-like comparison of theunderlying business and capital structure against a 2014 baseline. So wewould ask you for today to look through the near-term, and we expect to beable to give you more short-term guidance in February.
9

10
Let’s take a look at our recent scorecard. We are proud of the track record of delivery weare building. The group is on track to deliver the $30-31 billion of operating cash flowplanned for 2014. This will mark the delivery of our 10-point plan. Relative to 2013, itreflects enhanced performance in our base assets and a higher contribution from majorprojects in the Upstream, the progressive ramp-up of the Whiting refinery and somereversal of the working capital builds seen in 2012 and 2013.
Specifically for the Upstream we are on track to achieve the series of 10-point planmilestones we defined four years ago:
- We have improved the safety and reliability of our operations. For example we havearound 50% fewer losses of primary containment compared to 2009 and we havedelivered a number of key turnaround programmes;
- We have roughly doubled exploration drilling activity and are now drilling 15-20exploration wells per annum – and this has been accompanied by some significantdiscoveries;
- Gulf of Mexico production continues to recover and - on an underlying basis – it is 54thousand barrels of oil equivalent per day higher in 2014 than in 2013 net to BP;
- We expect to have delivered 15 major project start-ups between 2012 and the end of2014;
- Operating cash margins of the projects brought online in this period are more thandouble the 2011 segment average;
- We are maintaining capital discipline with higher levels of re-investment; and
- We have completed around $32 billion of divestments in the Upstream creating asimpler and more focused portfolio.

11
Looking forward our Upstream strategy remains the same.
First and foremost improving safety and making operations more reliable, which in itselfdelivers value
We focus on value over volume - we have a more focused footprint and will continue ourportfolio management activities. We aim to deliver value through the efficient execution ofour base activities, a quality set of major projects and by leveraging our access andexploration expertise
At the same time we maintain a very disciplined investment approach into three distinctiveengines for growth:
– First, deepwater;
– Second, gas value chains; and
– Thirdly, giant fields.
We maintain a balanced portfolio of opportunities;
And finally, we drive the efficient execution of our activities through our functionaloperating model. This model aims to deliver competitive operating cash growth through acombination of growth in underlying volumes, the improvement of margin quality andstrong cost discipline.

12
Before we turn to our growth plans, I want to use a couple of slides to remind you aboutour existing portfolio. Our Upstream portfolio is well balanced and plays to our strengths.
A snapshot of our expected operating cash flow in 2020 reflects a balance in ourinvestment biases of giant fields, deepwater and gas value chains.
45% of our cash flow is expected to be generated by gas value chains in 2020, an increaseof 10% from today. Our gas portfolio is material, very competitive and appropriatelybalanced between LNG and domestic or pipeline gas. More on this later in thepresentation
Our four key geographic regions of Angola, the Gulf of Mexico, Azerbaijan and the NorthSea continue to play an important role throughout this period and are expected to generatearound half of our operating cash in 2020.
Finally, over 75% of our production and operating cash in 2020 is expected to come fromour existing fields or major projects to which we have already committed and which areprogressing well.

13
We also have a well diversified portfolio. As the map on the slide shows, we have anumber of important incumbent positions, with production coming from 14 differentprovinces around the world.
This provides diversity of exposure to fiscal and political risk and opportunities. It alsoallows a balance between historic basins in which we have built up a skilled workforce andstrong local relationships as well as new provinces with opportunities to connect untappedresources to major growth markets. We see opportunities to use knowledge from ourexisting incumbent positions to develop such new resources - examples include ourinvestments in India and Oman.
Margins and cash flows are also balanced and not dependant on one or two regions,markets or fiscal regimes to deliver our plan.

14
Turning now to our growth story. Growth in operating cash flow has three primary drivers:volume growth, margin growth and cost efficiency.
First we see underlying volume growth through a combination of base management andproject growth
– The base business is the ongoing operation of our existing assets where our focus ison mitigating base decline through reservoir management, improvements in operatingefficiency and increasing by drilling activity. Through these management efforts we aimto maintain a base decline at a compound annual rate of 3-5% through to 2018
– At the same time we are transitioning into a phase of significant project growththrough greenfield, tieback, expansion and optimisation opportunities.
Taken together on an underlying basis - and based on the projects in our pipeline that wecan see today - we expect total production to continue to grow moderately into the earlypart of the next decade. Growth is then sustained over the longer term by the significantpotential for resource progression and exploration we will show you later today.
The second driver is margin quality expansion. We are increasing the production in ourhigh-margin areas through base management and new project additions which have apositive impact on the segment margin mix. The operating cash margin for the next waveof projects is over 35% higher than the 2014 segment average operating cash margin,

based on our planning assumptions.
The third driver is a focus on cost efficiency. We are in action to embed aseries of interventions to align our cost base more closely with the extentof our current and future operations, and therefore to become moreefficient and competitive.
14
15
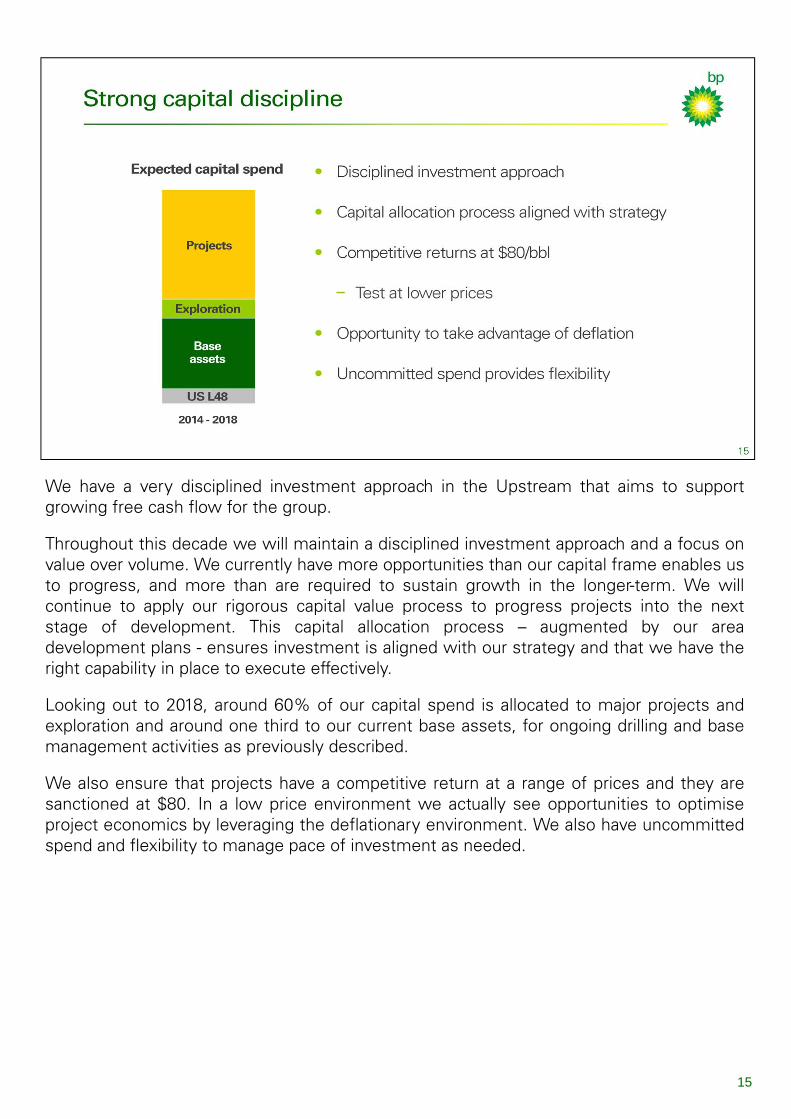
We have a very disciplined investment approach in the Upstream that aims to supportgrowing free cash flow for the group.
Throughout this decade we will maintain a disciplined investment approach and a focus onvalue over volume. We currently have more opportunities than our capital frame enables usto progress, and more than are required to sustain growth in the longer-term. We willcontinue to apply our rigorous capital value process to progress projects into the nextstage of development. This capital allocation process – augmented by our areadevelopment plans - ensures investment is aligned with our strategy and that we have theright capability in place to execute effectively.
Looking out to 2018, around 60% of our capital spend is allocated to major projects andexploration and around one third to our current base assets, for ongoing drilling and basemanagement activities as previously described.
We also ensure that projects have a competitive return at a range of prices and they aresanctioned at $80. In a low price environment we actually see opportunities to optimiseproject economics by leveraging the deflationary environment. We also have uncommittedspend and flexibility to manage pace of investment as needed.
15

In the Upstream for the near-term:
– We will continue to invest in our existing base and our projects underconstruction;
– We will tighten levels of exploration and other discretionary spend; and– We will work deflationary momentum on projects and other activities
that are yet to be contracted.
Over the medium-term we do expect the natural self-correction of theindustry to be evident and therefore see no need at this point tosignificantly alter the activity set underpinning our long-term growth.
As I mentioned before, we will manage this within the capital frame of thegroup and keep you updated as we move forward and as market conditionsevolve.
15

16
We are focused on driving the systematic delivery of safer and more reliable operations,and this focus is delivering results. Our underlying business is becoming safer and morereliable. Tier 1 Process Safety Events (PSEs) represent the most serious events in theoperation of our wells and plants. As this slide shows, we have reduced the number ofthese events in our base operations from 23 in 2010 to only two in 2014 to date.
Safety and reliability are intrinsically linked. Our investments in the integrity of our assetshave also delivered significant improvements in BP-operated plant efficiency. This hasincreased significantly - from around 81% in 2012 to 89% in 2014. This has been achievedthrough improvements in both planned and unplanned deferrals which cause productionslippage through downtime. Unplanned deferrals, which also include breakdowns, havebeen reduced with the application of systematic ‘root cause failure analysis’, vulnerabilitymitigation, and improving integration across functions. Planned deferrals, which includeturnarounds [or TAR’s], have been improved with enhanced planning and execution.
Turnarounds have reduced by 50% since 2011. During this period, turnaround executionhas improved markedly, and we expect to deliver 88% of our turnarounds on schedule in2014.
Although we have made great progress improving the reliability of our assets, we arestriving to continue year-on-year improvements with the potential for further significantgains

In addition to ensuring safe, reliable and efficient operations, reservoir management andwells execution are two further lenses we use to manage our base assets.
Good reservoir management ensures optimisation of both recovery and value. Gas andwater flooding are methods that we use to improve reservoir sweep and increaseproduction, using a combination of advanced surveillance and completion technologies.This is a key focus for BP, as approximately 80% of our Upstream oil production issupported by water flood or gas injection. In our key regions, we have increased waterinjection since 2011, delivering around 25 million barrels of incremental production overthat time period.
We are also using enhanced oil recovery (or EOR) technology to increase the recoveryfactors of our assets. We have developed industry-leading technologies such as LoSal®EOR – which is being deployed on Clair Ridge – and we operate one of the largest gasEOR schemes in the world at Prudhoe Bay in Alaska. These technologies alter theproperties of the fluid we inject, allowing us to tailor it to maximise recovery, releasing oiltrapped within the reservoir.
The ability to effectively identify, plan and drill new wells in our existing fields is equallyimportant in delivery from the base and our world class seismic capability allows us toplace wells in the right locations.
Managing existing wells is just as important. We maintain these through timely wellinterventions to either restore or enhance production. This reduces deferred productionand increases our wells efficiency by ensuring wells remain online.
17

Our efforts in this area have increased production from new well deliveryand well work and this figure is now the highest since 2009. Finally non-productive time is also trending down, helping to accelerate delivery ofproduction.
Looking forward, we have a number of high-return new well delivery andwellwork opportunities in regions such as the Gulf of Mexico, Azerbaijan,the North Sea, Alaska and Trinidad. Typical sanctioned new well activity isexpected to deliver returns of over 25% based on an oil price of $80 perbarrel.
17

1818
So to summarise the strategy for our base assets:
– Our base assets are becoming safer and more reliable
– We are improving plant efficiency of our major assets – an 8% improvement since2010
– We focus on maximising recovery and value from our reservoirs
– In 2014, we achieved the highest production from new well delivery since 2009
– We have a quality suite of new well options - delivering over 25% rate of return at $80per barrel
– And through these management efforts we aim to maintain base production decline ata compound annual rate of 3-5% through to 2018
19
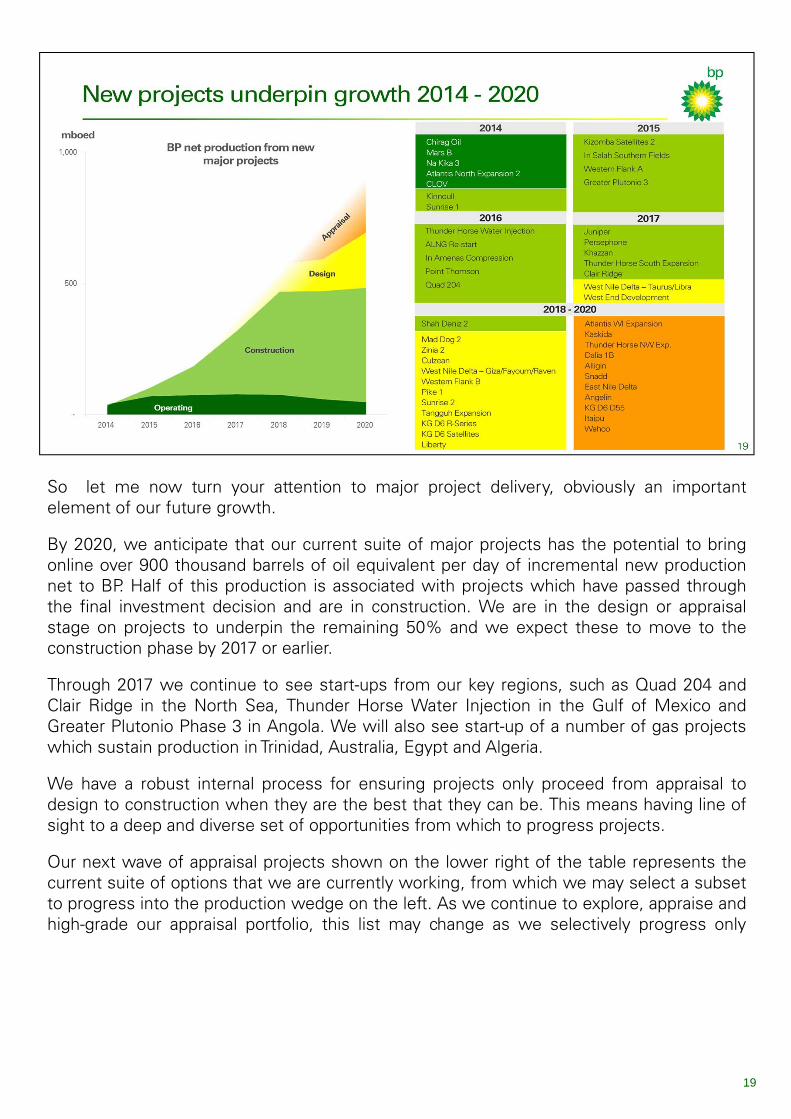
So let me now turn your attention to major project delivery, obviously an importantelement of our future growth.
By 2020, we anticipate that our current suite of major projects has the potential to bringonline over 900 thousand barrels of oil equivalent per day of incremental new productionnet to BP. Half of this production is associated with projects which have passed throughthe final investment decision and are in construction. We are in the design or appraisalstage on projects to underpin the remaining 50% and we expect these to move to theconstruction phase by 2017 or earlier.
Through 2017 we continue to see start-ups from our key regions, such as Quad 204 andClair Ridge in the North Sea, Thunder Horse Water Injection in the Gulf of Mexico andGreater Plutonio Phase 3 in Angola. We will also see start-up of a number of gas projectswhich sustain production in Trinidad, Australia, Egypt and Algeria.
We have a robust internal process for ensuring projects only proceed from appraisal todesign to construction when they are the best that they can be. This means having line ofsight to a deep and diverse set of opportunities from which to progress projects.
Our next wave of appraisal projects shown on the lower right of the table represents thecurrent suite of options that we are currently working, from which we may select a subsetto progress into the production wedge on the left. As we continue to explore, appraise andhigh-grade our appraisal portfolio, this list may change as we selectively progress only

those projects that best fit our portfolio. Those that are not progressed inthis timeframe may continue to be optimised for later development or maybe monetised through divestment if they provide a better fit for someoneelse’s portfolio. Around half of the combined expected production in 2020from the start-ups shown on the slide will be under Production SharingAgreements which are - by their nature - less sensitive to price downside.
19
20
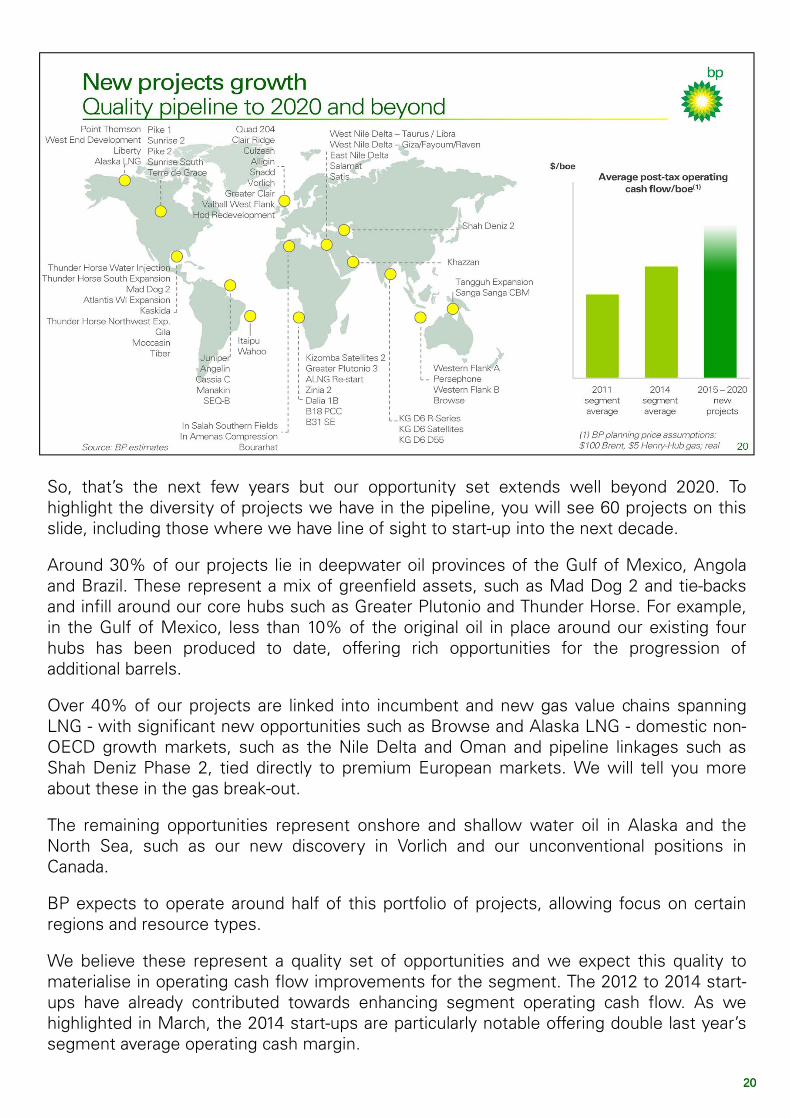
So, that’s the next few years but our opportunity set extends well beyond 2020. Tohighlight the diversity of projects we have in the pipeline, you will see 60 projects on thisslide, including those where we have line of sight to start-up into the next decade.
Around 30% of our projects lie in deepwater oil provinces of the Gulf of Mexico, Angolaand Brazil. These represent a mix of greenfield assets, such as Mad Dog 2 and tie-backsand infill around our core hubs such as Greater Plutonio and Thunder Horse. For example,in the Gulf of Mexico, less than 10% of the original oil in place around our existing fourhubs has been produced to date, offering rich opportunities for the progression ofadditional barrels.
Over 40% of our projects are linked into incumbent and new gas value chains spanningLNG - with significant new opportunities such as Browse and Alaska LNG - domestic non-OECD growth markets, such as the Nile Delta and Oman and pipeline linkages such asShah Deniz Phase 2, tied directly to premium European markets. We will tell you moreabout these in the gas break-out.
The remaining opportunities represent onshore and shallow water oil in Alaska and theNorth Sea, such as our new discovery in Vorlich and our unconventional positions inCanada.
BP expects to operate around half of this portfolio of projects, allowing focus on certainregions and resource types.
We believe these represent a quality set of opportunities and we expect this quality tomaterialise in operating cash flow improvements for the segment. The 2012 to 2014 start-ups have already contributed towards enhancing segment operating cash flow. As wehighlighted in March, the 2014 start-ups are particularly notable offering double last year’ssegment average operating cash margin.
20

Looking further forward, we expect our 2015 to 2020 project start-ups tocontinue to contribute to enhanced segment operating cash margins. Thisproject set, which includes our next suite of large gas projects isanticipated to return average margins over 35% higher than the currentsegment average, using our planning assumptions.
20

2121
So to summarise our major projects story:
New projects out to 2020 expected to deliver:
– Over 2 million barrels of oil equivalent per day of new gross production;
– That’s over 900 thousand barrels per day of BP net production; at
– Higher average operating cash margins.
50% of 2020 new project production is already under construction; and
Balanced portfolio of opportunities capable of extending growth beyond 2020.

The growth profile established by new major projects can be further sustained in the long-term through exploration, continued progression of resources in BP’s portfolio and growthin giant field reserves.
We have reloaded our exploration pipeline over recent years through significant access tonew opportunities. This is now yielding results - BP was one of the top IOC explorers in2013, and that success has continued into 2014 with further discoveries in Angola, Brazil,Egypt, the North Sea and the Gulf of Mexico. By the end of this month, we expect to havedrilled 18 exploration wells. We plan to test 15 to 20 new plays between 2014 and 2018,while continuing to optimise our drilling programme to focus on the highest valueprospects.
Total resources at the end of 2013 were over 44 billion barrels of oil equivalent with aproved reserves-to-production ratio of over 13 years. This represents growth of around 4%in our resources over the last four years, despite impacts from the divestmentprogrammes.
A significant proportion of this growth has been delivered by unconventionals, which nowrepresent 38% of our total resource base. For example, in the US Lower 48, we haverestructured and de-risked our portfolio by divesting mature assets and processing plants.In Oman, we sanctioned our Khazzan project last year – the first phase in the developmentof one of the region’s largest unconventional gas accumulations. We have considerableupside potential in the Khazzan area, which we are appraising to identify potential futureexpansions of the project. In Canada, we have built a significant and competitive oil sandsposition, with the potential for long, stable cash flows that are leveraged to oil price andtechnology.
A key element of our giant field strategy is to use our subsurface expertise and technologyto extend the life of our largest assets, and we continue to deliver further stages ofdevelopment at large fields such as Atlantis and Na Kika in the Gulf of Mexico and PSVM inAngola.
2222

So what does this mean for the future?
Our exploration and appraisal programmes today give us line of sight to long-termproduction growth. Our investment will reflect a balance between near-field, high valueexploration around our existing assets, further exploration and appraisal in regions that weknow well, and the establishment of new producing regions.
Deepwater oil will continue to be important to BP as we seek to extend the life of ourexisting assets in Angola and the Gulf of Mexico, while exploring new plays in Brazil andother basins recently accessed. With success in some of our key play tests in Brazil,Canada and Australia, exploration has the potential to sustain deepwater production formany years to come.
In conventional onshore and shallow water oil, our focus is on making the most of ourhigh-value portfolio in producing regions such as the North Sea – where we made a gooddiscovery this year - and we retain optionality through our position in giant fields in Iraq andour longer term Arctic options.
Conventional gas offers a number of opportunities for exploration around our existingassets in regions such as Trinidad and Azerbaijan, as well as new opportunities in regionssuch as Egypt and Australia.
And we see a significant growth opportunity in unconventionals, where we can leverageour US Lower 48 experience and track record of managing big projects on developmentssuch as Oman Khazzan. In addition, we are looking to pursue further access opportunitiesin international unconventionals as we continue to optimise the balance of our portfolio.
23

2424
So these are our key messages on resources and exploration:
– We have reloaded our exploration pipeline;
– We have had a successful 2013 and 2014 exploration programme ;
– We have grown our resource base by 4% despite divestments between 2011 and2014;
– Our existing portfolio underpins long-term underlying production growth; and
– We have a balanced portfolio of opportunities.

Let me now address the actions we are taking in the area of cost discipline.
Following the transition to our functional model we started - over 18 months ago - to lookclosely at inefficiencies that were developing in our Upstream organisation. We alsosought to counter the cost inflation that was developing alongside rising oil prices. Someof the impacts of this effort are already becoming embedded into our performance as youwill see today in the break-outs. That said, as we stand today, our net production is lowerthan it was four years ago as a result of divestments yet our operating costs have risenover the same period. So we still see material opportunities to improve by streamlining theactivity and processes that are driving our cost base, and we believe we can do thiswithout compromising safety or reliability.
We will concentrate our efforts in four key areas:
– First we will continue to focus our activity set on delivering the right activity at theright time, where we have distinctive capability;
– Second, we will actively manage our supply chain;
– Third, we will align our business support costs with reduced size of our operations;
– And finally, we will make choices in our portfolio. Recent examples include the Lower48 restructuring and Alaska divestments.
Of course this is not unique to BP. We see our peer group as having significant
25

opportunities to reduce costs, which we believe could well be amplifiedwithin a deflationary environment. A number of our competitors have givenyou indications of this. We expect to at least maintain the competitiveposition you see reflected on this chart without necessarily seeking to bethe lowest cost producer. We expect to see a material impact in 2015 andbelieve the benefits are sustainable over the long-term.
25

26
Next, I’d like to give you a high level overview of our gas position and strategy. This is anarea in which we have a number of exciting growth opportunities. But let me first tell youwhy I believe gas to be an area where we want to grow. First, gas is the cleanest fossilfuel. Second, the demand growth predicted for gas is twice that of oil. Third, we havesignificant gas positions in our portfolio. And finally, BP’s approach to gas is consistent withthat of oil - we participate in investments where the barriers are high for others, and wherewe have distinctive capabilities which allow for competitive growth and advantagednetbacks and returns. Key aspects of our approach are:
– We create value from gas when access and exploration or incumbency providesadvantaged access to the lowest cost resources in the basin. For example incumbentpositions in Trinidad, Azerbaijan, Egypt and Indonesia position us well to leverageskilled local staff, resources and existing infrastructure into which we can exploreand develop back-fill and incremental volumes.
– We apply commercial, financial and technical capability to participate selectively alongthe full value chain. For example, our position in Oman allow us to apply and transferour technological capabilities from the US Lower 48.
– We have a deliberate, balanced exposure to resource type, pricing exposure, andgeography. We have a competitively distinctive position that accesses growingdomestic markets, global LNG, and large markets such as Europe that are seekingdiversified energy sources.
– We are building a critical scale of LNG capacity to add materially to the margins ofboth our upstream and merchant businesses as well as to provide offtake assurancethrough a flexible portfolio approach.
We intentionally balance our portfolio, focusing on the cost of supply as much as on ourultimate gas sale price. Price alone is not equal to margin. This, combined with our

commercial, financial and technical capability, allows us to delivercompetitive returns.
Today gas contributes to around half of resources and production in ourportfolio and this is expected to grow over the next decade. The longplateau of most of these investments is altering the shape of Upstreamcash flow generation by bringing more long-term layers of operating cash inour portfolio, to balance the flows from our known, and equally strong,deepwater positions.
26

2727
So how does this strategy show up in the bottom line? Our gas portfolio has the potentialto double operating cash and improve returns over the next decade through volume andmargin growth.
As you can see from this slide, we have eight material gas value chains in production ordevelopment with the potential emergence of a ninth in Alaska. The slide shows how eachof these is anticipated to grow in operating cash flow, from 2014 to 2024. Our existing gasbusinesses deliver consistently, while we see the emergence of new hubs in India, Oman,Alaska and Azerbaijan. Our diverse positions offer exposure to a range of prices – currentlyaround a third of our production is priced off oil. In a number of countries we are activelynegotiating gas prices with state entities for mutual benefit.
Our Global LNG business is capable of growing from 12.5 million tonnes per annum toover 20 million. This reflects the growth in our positions, underpinned by the addition ofphysical equity LNG assets and an increase in our merchant LNG trading business. As wellas our Upstream assets, the ability to grow this position is founded on our significanttrading positions in the US, Europe and Asia, our LNG shipping fleet and access to re-gasification capacity in key demand regions.
We believe this balanced portfolio and margin growth to be distinctive compared to ourpeers and to reflect the competitive portfolio we have built. Through the break-out session,we hope to help you understand the elements of our gas strategy further.

28
Now turning to a part of our portfolio we are getting increasingly excited about. In March,we announced our plan to separate our US Lower 48 oil and gas business into a separateunit reporting to me. The rationale was that a new operating model was needed to improveperformance in this business. We expect faster decision making, more innovation andshorter cycle times through the value chain – and we expect that significant capital andcost efficiencies will follow.
We named David Lawler as the new CEO of this business with effect from 15thSeptember. Dave’s insights have already had an impact. I’m delighted to introduce Daveand also to have him share with you his vision and impressions of the business.

Thank you Lamar. It’s a pleasure to be here today and share with you my excitement atjoining BP and the opportunity to lead a great piece of the business.
Three key factors supported my decision to join BP. First and foremost, Bob and Lamar’scommitment to build the Lower 48 into an exceptional business was compelling. They hada clear vision of where they wanted to take the organisation. Becoming a premier onshoreoperator on every metric, with safety at the top, is our goal. Second, the technicalexpertise of the Lower 48 team is impressive. The operating and subsurface teams aresome of the most talented professionals I’ve worked with in my career. Third, the assetbase is significant, and the project inventory can generate some of the strongest returns inthe industry, even during periods of lower oil and gas prices.
The Lower 48 has a massive footprint of 5.5 million gross acres and daily production ofaround 300,000 barrels of oil equivalent. The total resource base is around 7.6 billion barrelsof oil equivalent, with around 2 billion barrels either proved or probable. Of these reserves,more than a fifth are liquids. This resource mix allows for optimisation under a broad rangeof oil and gas prices.
The separation of the business was well underway by the time I joined in September. Oneof the more important changes is a new financial framework that will allow us to retain andinvest our operating cash in order to establish a consistent development program andsustainable growth model. Investment decisions, capital allocation and portfolio strategieswill be directed by the Lower 48 management team, subject to the approval of our soon tobe formed board of directors, led by Lamar.
We have made progress on several other fronts. We completed our move to a newlocation within a mile of BP’s main campus in Houston. Not only are there cost efficiencieswith this move, but it is also symbolic of the nimbleness we expect to attain in the comingmonths. Our direct headcount at end 2012 was 2,648. At end of 2014, we expect this to bearound 1,700. Over the same period we expect operating cash costs will have come down
29

some 25%.
We have also linked compensation to improved safety and financialperformance, exclusive to the Lower 48 business.
To improve efficiency, we’re moving to work standards appropriate for theonshore operating environment, and more aligned with those used by ourcompetitors. Let me be clear, this does not mean lowering our safetystandards. Safe operations will remain our first priority.
In summary, I believe we have the commitment, expertise and asset baseneeded to become a premier onshore operator.
29

Now I’d like to highlight just three of our assets to give you a sense of the materialopportunity we have.
One of these is our Eagle Ford position located in South Texas. Not many in the industryhave a sense for just how sizable, or how robust the economics really are in this position.
We have 1.7 billion barrels of oil equivalent of resource potential within this rich sourcerock. It is a brittle shale, which responds well to fracture stimulation, and our results todate are consistent and improving. We have a successful partnership with Lewis Energygroup. Lewis – the operator - own a vertically integrated service company, and this helpsus deliver some of the lowest development costs in the region. As I mentioned earlier,with our exceptional subsurface expertise, BP adds considerable value through wellplacement and subsurface modeling. Over the five years of our partnership, production hasramped up to 43 thousand barrels of oil equivalent per day through 2014 and we expectthis to grow in 2015, through a projected 150 to 200 well program.
Recent rate improvements have come through better well completion techniques. Forexample, in 2012 our type curve for lean gas at Eagle Ford had an estimated ultimaterecovery (or EUR) of 5.5 billion cubic feet. The average EUR of similar wells from 2013through 2014 is 10 billion cubic feet, an 80% increase.
We are working on optimal well spacing along with further completion optimisation andsee the potential for another 4,000 locations over many, many years.
30

The second asset I’d like to highlight is the San Juan basin. Approximately 75% of ourproduction comes from what is considered to be the best coal bed methane reservoir inthe world. San Juan’s coal rank – a measure of coal thermal maturity - is ideal for both thegeneration and storage of methane. In addition it has a high cleat density which, in turn,means high productivity. Cleats are the small fractures that run throughout coal seams andit is that fracture network which contributes to the overall permeability of the system. Theremainder of the production comes from stacked conventional reservoirs in an area that isbeing appraised for future development.
Despite not drilling new wells in this basin for several years, we’ve been able to minimisedecline through active management of the existing well set. We’re now planning to growproduction by adding 2 drilling rigs in 2015 - one will continue to develop the coal bedmethane reservoir, and one will appraise the potential of the Mancos/Gallup condensateintervals. Horizontal drilling and the latest completion technology will be utilised in bothprograms.
We currently have over 1,000 locations identified, with a significant number of wells whichare economic at prices around $2.75 per thousand cubic feet. In summary, this is amaterial asset, with years of economic development ahead.
31

The third asset we wanted to share with you today is our position in the mid-continentarea, which includes the Anadarko, Arkoma and Fayetteville project areas.
We have a massive 1.2 million net acre position - which was acquired early on - with a highnet interest that is currently producing 85 thousand barrels of oil per day equivalent. Thisprolific, liquid-rich area makes for a high-return well program for many years to come.
Our position has stacked-pay opportunities and zones conducive to multi-lateraldevelopment from just a single vertical well bore. This of course translates into significantvalue upside.
Given the considerable opportunity set, we’re planning a ramp-up to six rigs by the end of2015. The pace of ramp-up will depend on how quickly we’re able to expand our team inthe region. We will initially focus on the Cleveland and Granite Wash portions of the playwhich have a liquids content over 40%. We also plan to apply the most advanced drilling,completion and artificial lift techniques to maximise our returns.
In closing, I hope by sharing a more detailed view of our Lower 48 assets and the changesto our business model, I was able to convey the excitement I feel about the growthpotential of this business. We will be providing increased transparency on operational andfinancial metrics in the future so the value proposition becomes more visible to ourshareholders.
With that, I’ll turn the presentation back to Lamar. Thank you.
32
3333
David Lawler hands back to Lamar:
Thank you Dave.
To sum up the key points we would like you to take with you into the break-outs:
First, the current environment is challenging but we believe we are well positioned torespond whilst also managing our business for the long-term. Our balance sheet is strongand we will make the right capital decisions for the group, taking advantage of theopportunities that deflation brings. In addition, we expect to be increasingly seeing theeffects of streamlining activity in our results going forward. We started this process some18 months ago in response to resizing the group. We will do this without compromisingour safety objectives.
Second, we have re-established a strong track record of delivery, which we plan tocontinue.
It starts with deep focus on execution within our base as we maximise recovery in ourreservoirs and as we boost production through new well delivery. With this also comes astrong focus on safety and operating reliability. This all works together to mitigate declinein the existing portfolio. We are also bringing on a strong suite of new projects that weestimate to be capable of adding over 900 thousand barrels a day of incremental netproduction to BP’s portfolio by 2020. This growth comes from building out our establishedand new conventional and deepwater oil positions, as well as from a material portfolio of

quality gas options which are rapidly becoming a greater source ofdistinction in our portfolio.
And the growth possibilities don’t end there. We have a quality pipeline ofopportunities capable of extending underlying growth well beyond 2020.
So I am excited about this business. I believe we have a fantastic portfoliowhich we will continue to actively manage. We are firmly focused onexecution efficiency, on operating safely and with greater plant reliability.And we have our sights set on growth. We know what we need to do andin our break-outs we hope to show you that we are busy doing it.
33

34
We’ll now move to a series of breakout presentations, led by members of the upstreamfunctional leadership teams.
We have four break-out sessions today, which you will attend in rotation either side of thelunch break. We then reconvene mid-afternoon for a wrap up and Q&A session.
On the front of your pass you’ll see a letter (A,B,C or D) listed. This allocates you to yourbreakout group. You will also find a personalised itinerary listing the rooms that you willvisit, in order, for each of these sessions. I would ask that you stay with your allocatedgroup throughout the day. A member of our Investor Relations team will accompany eachgroup, and will ensure you’re in the right place for each breakout.
The breakouts will be held in the meeting rooms just downstairs, and the intention is thatthese are informal – providing an opportunity for you to hear some more detail and contextfrom the people that run the different parts of our upstream business. I’d encourage you toask questions and to treat it as a conversation, rather than a set piece presentation.
Also, please take the opportunity to visit the technology stands.
So, we’ll now take a short 20 minute break, during which you can move downstairs to thebreakout areas, where there are facilities and refreshments. And members of the BP IRteam are available to guide you in the right direction.
Thank you, enjoy the break-outs and we will see you all back here later this afternoon forour Q&A session.

35