Pe Dodd FrankPrivate Equity and the SEC after Dodd-Frank 2015 01

Good Intentions Gone Bad? The Dodd-Frank Act and
Conflict in Africa’s Great Lakes Region∗
Jeffrey R. Bloem†
December 18, 2018
Abstract
The Dodd-Frank Act imposes reporting requirements on US companies regarding the pres-ence of ‘conflict minerals’ in their supply chains. Previous research uses within-DRC variationin the location of mineral mines to identify the effect of the Dodd-Frank Act on conflict. Dueto the presence of spillovers, the estimates reported by these studies may only be a lower boundof the effect. Moreover, in addition to regulating minerals mined in the DRC, the Dodd-FrankAct imposes regulations on all countries surrounding the DRC. To fully evaluate the effectof the Dodd-Frank Act, I investigate the prevalence of conflict events in the DRC and in allsurrounding countries. Difference-in-differences and synthetic control estimates show that theunintended consequences of this legislation within the DRC may be larger than previously re-ported. Additionally, despite important heterogeneity, there is no evidence of any reduction inconflict within all covered countries pooled together. Finally, the recent enforcement suspensionof the legislation appears to have had little effect on conflict both in the DRC and in all coveredcountries pooled together.
Keywords: Conflict Minerals, Civil War, International Trade Policy, and Policy Analysis
∗I am grateful for constructive feedback and comments from Marc Bellemare, Paul Glewwe, Jason Kerwin, JaneSumner, Bruce Wydick, Amy Damon, Ore Koren, Kim Yi Dionne, Emilia Tjernstrom, Noah Nathan, Natalie Letsa,Sarah Brierley, Jeff Conroy-Krutz, Jennifer Alix-Garcia, Lokendra Phadera, and Alexey Makarin. I am also thankfulfor helpful feedback from participants of the 2017 Midwest Group in African Political Economy meeting, the 2018Agricultural and Applied Economics Association (AAEA) Meetings, the 2018 North East Universities DevelopmentConsortium (NEUDC) Conference, and the Environmental and Natural Resource Seminar in the Department ofApplied Economics at the University of Minnesota. All errors are my own.†PhD Student, Department of Applied Economics, University of Minnesota, [email protected].
1

“In the Congo, despite the occasional hue and cry raised by the media, corporate responsibilityhas been largely ignored—the supply chain is more convoluted, passing through traders, brokers,smelters, and processing companies. The tin and coltan that come from the Congo are mixedwith those from Brazil, Russia, and China before they make it into our cell phones and laptops.There is a burgeoning consensus in international law that we should care about the conditionsunder which the products we consume—sweatpants, sneakers, and even timber—are produced. Ifwe can hold companies accountable for their business practices, we will give an incentive to theCongolese government to clean up the mining sector. The ‘conflict minerals’ legislation signed intolaw by President Obama in July 2010 is a step, albeit a small one, in the right direction” - Stearns,J. (2012) Dancing in the Glory of Monsters: The Collapse of the Congo and the Great War of Africa
“When his father could no longer make enough money from the tin mine, when he could nolonger pay for school, Bienfait Kabesha ran off and joined a militia. It offered the promise of lootand food, and soon he was firing an old rifle on the front lines of Africa’s deadliest conflict. He was14.” - Raghavan, S. (2014) The Washington Post
1 Introduction
‘Conflict minerals’ contribute in some way to an a large share of consumer products, including
mobile phones, laptops, jewelry, eyeglasses, cars, airplanes, and medical equipment. Revenues from
the extraction and production of these minerals also fuel conflict across the continent of Africa
(Berman et al. 2017). Over the past two decades, somewhere between 2 and 6 million people have
been killed due to violent conflict in the Democratic Republic of Congo (DRC) and surrounding
countries.1 The presence of violent conflict also stalls and even reverses economic development and
efforts to alleviate poverty (Collier et al. 2003). In 2010, US lawmakers passed legislation with the
intention of severing the connection between US consumers and armed rebel groups, and thereby
reducing conflict in Africa’s great lakes region. Section 1502 of the Dodd-Frank Wall Street Reform
and Consumer Protection Act requires companies registered with the US Securities and Exchange
Commission (SEC) to disclose whether tin, tantalum, tungsten, and gold (3TG) in their supply
chain are obtained from mines connected to armed groups. In particular, companies must perform
due diligence about whether any of these minerals in their supply chain originated in the DRC and
surrounding countries.2
The passage of this legislation was—and remains—controversial. Companies in the US, that
are most directly affected by this law, claim that compliance costs impose an undue burden on US
1See Spagat et al. (2009) for a discussion on the statistical discrepancies of estimating war deaths.2The full list of covered countries includes the DRC and any country that shares a national boarder with the DRC:
Angola, Burundi, Central African Republic, the Democratic Republic of Congo, the Republic of Congo, Rwanda,South Sudan, Tanzania, Uganda, and Zambia.
2
manufacturing.3 Critics also claim that the policy is built on faulty assumptions about the causal
factors leading to conflict in Africa’s Great Lakes Region. Ultimately, civil conflict and violence
in the DRC and surrounding countries is driven by a complex combination of poverty, land use,
corruption, local political and social frustrations, and hostile relationships between a myriad of
local actors—all factors that may be influenced by the passage of the Dodd-Frank Act (Autesserre
2012; Geenen 2012; Seay 2012; Radley and Vogel 2015; Vogel and Raeymaekers 2016).
This raises an important question: What is the impact of the Dodd-Frank Act on the prevalence
of conflict in the DRC and surrounding countries? Numerous studies examine the effects of the
Dodd-Frank Act on livelihoods in the DRC (Cuvelier et al. 2014; Geenen 2012; Radley and Vogel
2015; Vogel and Raeymaekers 2016). Although these studies provide suggestive evidence that
the Dodd-Frank Act may have unintended consequences, they ultimately struggle to pin down
the causal relationship between the Dodd-Frank Act and conflict (Stearns 2014). More recent
contributions compare outcomes in geographic areas within the DRC with ‘conflict mineral’ mines
to those without 3TG mines and find evidence that, while well-intentioned, the Dodd-Frank Act
may be causing harm in the DRC (Parker et al. 2016; Parker and Vadheim 2017; Stoop et al.
2018a). These studies provide an important and worthwhile methodological improvement, in terms
of causal identification, but still may suffer from endogeneity issues.
If conflict spreads within countries, rather than remaining isolated within given local geograph-
ical areas, then causal estimates of the impact of the Dodd-Frank Act—based on within country
comparisons—may be biased.4 Technically, if conflict spills over from geographic areas with 3TG
mineral mines into areas without 3TG mineral mines, then the stable unit treatment value assump-
tion (SUTVA) is violated and existing empirical estimates are an estimate of the lower bound of
the effect of the Dodd-Frank Act. Additionally, as Maystadt et al. (2014) note, the statistical
relationship between minerals and conflict in the DRC may possess characteristics of an ecological
fallacy; whereby extraction of minerals is not found to cause conflict when analyzing data within
territories, but is found to cause conflict across territories. Therefore, empirical analysis that exam-
ines cross-country variation in the coverage of the Dodd-Frank Act provides a worthwhile addition
to the existing literature. Moreover, since the Dodd-Frank Act imposed regulations on minerals
exported not only from the DRC but also surrounding countries, a complete impact evaluation of
3There are large discrepancies in estimates of the total compliance cost. The U.S. Securities and ExchangeCommission estimates the cost is $71 million, while the National Association of Manufacturers estimates the cost arebetween $9 and $16 billion.
4Note that even if conflict does not directly spillover, migration of internally displaced people from “treated” areasinto “comparison” areas may lead to an indirect spillover of conflict.
3

the Dodd-Frank Act should include these surrounding countries. This paper aims to build on the
existing literature by directly addressing the issue of bias from spillover effects and by evaluating
the effects within all covered countries.
I analyze the impact of the Dodd-Frank Act using data from the Armed Conflict Location
and Event Data (ACLED) project. To estimate the impact of this legislation, I use a difference-
in-differences estimation strategy. This method compares the prevalence of conflict over time at
the second sub-national administrative level across countries covered by the Dodd-Frank Act and
other sub-Saharan African countries not covered by the legislation. By examining the probability
of conflict at sub-national levels across countries, and due to the design of the legislation that
aims to limit cross-country spillover effects, this method avoids some of the concerns of statistical
identification present in within-DRC analysis. These estimates provide additional and broader
insight into the causal impact of the Dodd-Frank Act on the prevalence of conflict within the DRC
(Parker and Vadheim 2017; Stoop et al. 2018a). This study is also closely related to the existing
literature on the impacts of international trade regulations on locally extracted natural resources
and civil conflict (Janus 2012) and the relationship between commodity price fluctuations and
conflict (Berman et al. 2017; Bazzi and Blattman 2014; Bellemare 2015; Dube and Vargas 2013;
Fearon 2005; Koren 2018).
I find results suggesting the presence of sizable unintended consequences within the DRC stem-
ming from the passage of the Dodd-Frank Act. Impact estimates show that the Dodd-Frank Act
roughly doubled the probability of conflict at the second sub-national administrative level within
the DRC. This general result persists across different types of conflict; violence against civilians,
rebel group battles, riots and protests, and deadly conflict all substantially increase within the
DRC due to the passage of the Dodd-Frank Act. The estimated effect sizes are larger than exist-
ing effect estimates calculated using within-DRC comparisons (Parker and Vadheim 2017; Stoop
et al. 2018a), which is consistent with the idea that previous estimates only estimate the lower
bound of the true effect due to the potential bias from spillover effects. Therefore, the unintended
consequences of the Dodd-Frank Act within the DRC are more dramatic and devastating than
previously reported. These results are qualitatively robust to a variant of Fisher’s permutation test
(Fisher, 1935; also see Buchmueller et al. 2011; Cunningham and Shah 2018), and to synthetic
control estimation (Abadie et al. 2010; 2015).
Although the DRC is the primary focus of the ‘conflict mineral’ legislation within the Dodd-
Frank Act, the legislation also regulates minerals from countries that border the DRC. A complete
4

impact evaluation of the Dodd-Frank Act should therefore consider the prevalence of conflict in
these countries. This paper also examines the impact of the Dodd-Frank Act on all covered coun-
tries, and finds no evidence of systematic change in the prevalence of conflict within all of these
countries pooled together. Therefore, among all covered countries pooled together, the unintended
consequences of the legislation are much less dramatic. Pooling all covered countries together hides
important heterogeneity. Although effect sizes are smaller in neighboring countries compared to
the DRC, in some countries the Dodd-Frank Act seems to have increased conflict, while in other
countries the effect estimates suggest a reduction in conflict. Statistical inference of these estimates,
however, is not robust to permutation tests. These results further support the conclusion that the
Dodd-Frank Act did not achieve the intended outcome of a reduction in violence and conflict in
the region.
The contribution of this paper is threefold. First, in the primary analysis of this paper I address
the potential for bias driven by spillover effects in previous quantitative work in this literature
(Parker and Vadheim 2017; Stoop et al. 2018a) and conduct the first complete evaluation on
the impact of the Dodd-Frank Act on all countries covered by the conflict mineral legislation.
Parker and Vadheim (2017) examine the impact of the Dodd-Frank Act on the prevalence of
conflict within the DRC through 2012, two years before the SEC fully implemented Section 1502
of the Dodd-Frank Act. Stoop et al. (2018a) extend the same identification strategy, comparing
conflict events within the DRC, through 2015. I implement a cross-country analysis that extends
the impact evaluation through 2016, two full years after Section 1502 was officially implemented.
While providing an additional methodological approcah for estimating the impact of the Dodd-
Frank Act and corroborating within-country analysis, this cross-country analysis has the added
benefit of examining the impact of the Dodd-Frank Act on the full list of covered countries, rather
than only the DRC. Effect estimates align with the early warnings by political scientists and other
researchers performing ethnographic field work in eastern DRC that “top-down” regulations do
not address the root cause of conflict and may make the situation worse (Autesserre 2012; Geenen
2012; Seay 2012).
Second, I also present an investigation of the potential mechanisms driving the overall effect
of the Dodd-Frank Act in the DRC. There are, at least, two relevant mechanisms that could
theoretically drive the primary results. The feasibility mechanism (see Fearon 2005; Collier et
al. 2009; Nunn and Qian 2014; Dube and Naidu 2015; Bellemare 2015; Christian and Barrett
2017; Koren 2018) suggests that limiting the revenue earned by armed rebel groups through the
5

extraction of 3TG minerals tightens the budget constraint of armed rebel groups and limits their
ability to cause conflict. Alternatively, the opportunity cost mechanism (see Becker 1968; Ehrlich
1973; Hirshleifer 1995; Collier and Hoffler 1998; Grossman 1991; Fearon and Latin 2003; Dube and
Vargas 2013; Bazzi and Blattman 2014) suggests that a reduction of incomes earned by families,
households, and individuals in Eastern DRC decreases the opportunity cost of joining a rebel group
and increases the ability of armed rebel groups to perpetuate conflict. Consistent with the primary
results of large unintended consequences of the Dodd-Frank Act in the DRC, I find evidence the
the opportunity cost mechanism may be stronger than the feasibility mechanism.
Finally, this paper reports estimates of the effect of the decision by the US SEC to suspend
enforcement of the conflict minerals legislation in April of 2017. Suspending enforcement of a law
that has unintended and negative consequences may theoretically lead to a reversal in outcomes.
On the other hand, the Dodd-Frank Act—as well as the conflict minerals legislation—is still US law
and many companies may still be complying with the regulations. Extending the same difference-
in-differences estimation strategy as discussed above to the time period between May 2014 and
September 2018, I find that suspending enforcement of the conflict minerals legislation has had
little effect on conflict in both the DRC and all covered countries pooled together. This result
provides some early insights into how future policy could be designed that reverses the unintended
consequences experienced over the past decade.
The remainder of this paper is organized as follows. The next section provides a discussion of the
design, theory of change, and implementation of Section 1502 of the Dodd-Frank Act. Section three
describes the empirical framework of this study and explains the identification strategy employed
to estimate causal effects. Section four discusses the results. Section five investigates possible
mechanisms that explain the estimated effects. Section six uses the synthetic control method as a
robustness check on these estimated effects. Section seven reports on an investigation of the effect
of enforcement suspension by the US SEC. Finally, section eight concludes.
2 Background
Section 1502 of the Dodd-Frank Act aims to address concerns that the extraction and international
trade of tin, tantalum, tungsten, and gold finances conflict in the DRC and surrounding countries.
The legislation directs the US SEC to issue rules that require publicly traded US companies to
disclose the use of conflict minerals if those minerals are “necessary to the functionality or produc-
tion of a product” (Dodd-Frank Act, Section 1502, 2.B). As currently implemented, the legislation
6

requires companies to disclose whether conflict minerals originated in the DRC or surrounding
countries. If the company knows that their minerals did not originate in the DRC or surrounding
countries, then the company must provide a brief description of how they determined the origins
of their minerals. If the company knows or has reason to believe that their minerals may have
originated in the DRC or surrounding countries, then the company must undertake “due diligence”
on the source and supply chain links to armed groups of its minerals. In both cases, companies are
required publicly report the conclusion of their investigations on their website.
A couple details about the conflict minerals legislation in the Dodd-Frank Act should be briefly
clarified. First, although the DRC is the focus of the legislation, all countries that share a border
with the DRC are also included in the legislation as a “covered country”. This is presumably to limit
the smuggling of these minerals from the DRC to a neighboring country, a practice that already
persists, to circumvent the legislation. Second, there is no official penalty for non-compliance of US
companies to the rules set by the US SEC. Rather, the legislation implements measures to increase
the transparency of the international trade of conflict minerals and the financing of armed groups in
the DRC and surrounding countries. Therefore, a critical mechanism in the ideal implementation
of the legislation is to “name and shame” those companies that are unable to demonstrate a clean
supply chain. Third, the Dodd-Frank Act does not prohibit the purchase of minerals from the DRC
and surrounding countries. As long as 3TG minerals are mined in sites not connected to armed
groups then the international trade of these minerals can continue as usual. As I will discuss in
the next subsection, a de facto ban implemented by some key buyers of 3TG minerals mined in the
DRC complicates this detail of the policy.
2.1 Policy Implementation and Reaction
The Dodd-Frank Act was officially passed by the US Congress and signed into law in July 2010.
In September 2010, upon the passage of the Dodd-Frank Act and before the law was officially
implemented, the government of the DRC shut down its entire mineral export industry as a direct
reaction to the passage of the Dodd-Frank Act (de Koning 2010; Parker and Vadheim 2017). This
reaction publicly communicated an effort of the DRC government to clean up the mineral sector.
Although the mineral mines eventually re-opened in 2011, by April of that year the Malaysia
Smelting Corporation (MSC), a leading tin exporting and the Electronic Industry Citizenship
Coalition (EICC), an organization comprised of the world’s leading electronics companies, began a
de facto boycot on minerals originating from the DRC and surrounding countries. These actions,
7

which occurred even before the official implementation of Section 1502 of the Dodd-Frank Act,
lead to a dramatic reduction in mineral exports (see figure 3 in Parker and Vadheim 2017). More
specifically, stimates cited by Seay (2012) suggest that in North Kivu, a DRC region bordering
Uganda and Rwanda, exports of tin dropped by roughly 90 percent after the passage of, and
reaction to, the Dodd-Frank Act.
In August of 2012 the US Securities and Exchange Commission voted on the final rules to
require publicly traded companies to disclose information related to their use of conflict minerals.
A year later, in July 2013, the National Association of Manufacturers, the Chamber of Commerce,
and the Business Roundtable filed a lawsuit against the SEC. National Association of Manufactures
v. Securities and Exchange Commission ultimately focuses on two key objections: (1) The SEC
ignored its statutory obligations and engaged in rule-making that was arbitrary and capricious. (2)
The statute and rule violated the Constitution’s First Amendment freedom of speech grantee. This
lawsuit has gone to various federal courts after each decision and appeal. Meanwhile, US publicly
traded companies filed their first disclosures in May of 2014. In April of 2015 a US federal appeals
court struck down some aspects of the reporting requirements as a violation of corporations’ freedom
of speech, by forcing companies to label their products, but left other aspects of the legislation in
place (Seitzinger and Ruane 2015). After this ruling companies are not forced to describe certain
products as having been “not found to be DRC conflict free”, but must still file an annual report
on the linkages of their products to conflict minerals in the DRC and surrounding countries.
Most recently, in April 2017, the US SEC suspended enforcement of the legislation after a court
remanded the law due to violations to the US Constitution. This followed a public statement made
by Acting Chairman of the SEC Michael Piwowar after visiting the Great Lake Region in Africa,
saying, “It is unclear that the rule has in fact resulted in any reduction in the power and control
of armed gangs or eased the human suffering of many innocent men, women, and children in the
Congo and surrounding areas” (SEC 2017). The Financial CHOICE Act of 2017 included official
legislation that would abolish the ‘conflict mineral’ regulations of the Dodd-Frank Act. Although
this legislation passed the US House of Representatives it was subsequently dismissed in the US
Senate. Despite these recent developments, the legislation is still part of US law and can be enforced
again quite quickly. This being the case, many companies are still complying with the rules. Some
companies—such as Apple, Intel, and Tiffany & Co.—have publicly stated that they intend to
follow the rules of the legislation even if it is abolished, responding to what they perceive as a
market expectation for “conflict free” goods (Frankel 2017).
8

2.2 Conceptual Framework
The theory behind the implementation of Section 1502 of the Dodd-Frank Act rests on the strength
of the link between revenues earned by armed groups and the export of ‘conflict minerals’. In par-
ticular a critical assumption within the theory of change of the legislation is that mineral revenues
are the primary cause of conflict in the DRC and surrounding countries. Material published by the
Enough Project, an NGO that played a leading role in advocating for the passage of Section 1502
within the Dodd-Frank Act, claims that 3TG minerals are the most lucrative source of revenue to
armed groups in Central Africa. Citing their own study, they estimate that armed groups earned
roughly $158 million from conflict minerals in 2008 alone (Enough Project, 2009). Once this styl-
ized fact is established, it may seem reasonable to conclude that limiting US imports of conflict
minerals will establish beneficial international norms and perhaps reduce the prevalence of conflict
in the DRC and surrounding countries.
Previous theoretical work identifies several key channels in which natural resources in general,
and minerals in particular, relate to conflict (see Bazzi and Blattman 2014; Berman et al. 2017
for more general discussions). Each of these channels are concerned with mechanisms in which
minerals may cause conflict. It is important to keep in mind that the direction of this effect is
not always clear, as discussed by Brunnschweiler and Bulte (2008; 2009) who find that mineral
resource dependence may be a direct consequence of conflict, rather than a direct causal factor. In
the remainder of this section, I will discuss the various channels in which minerals may interact
with conflict and apply these mechanisms to the implementation of the Dodd-Frank Act.
Feasibility—Natural resources can improve the feasibility of conflict (Fearon 2005; Collier et al.
2009; Nunn and Qian 2014; Dube and Naidu 2015; Bellemare 2015; Christian and Barrett 2017;
Koren 2018). In this channel, revenue earned through looting, extortion, or informal taxation
relaxes the financial constraints facing rebel groups. This is the key channel through which the
Dodd-Frank Act intends to make a difference in the DRC and surrounding countries. By regulating
minerals originating from the Great Lakes Region, the Dodd-Frank Act aims to reduce the revenue
earned by armed groups and therefore reduce conflict.
Greed or rapacity—Natural resources increase the “prize” awarded through the capture of a
geographical region (Reuveny and Maxwell 2001; Grossman and Mendoza 2003; Hodler 2006; Caselli
and Coleman 2013). This channel is similar, but distinct, from the first channel. Whereas the
feasibility channel typically focuses on informal revenue streams for rebel groups, the greed or rent-
9

seeking channel typically focuses on formal revenue streams such as taxation of the natural resource
industry by the central government (Bazzi and Blattman 2014). It is unclear how the Dodd-Frank
Act may affect conflict through this channel. On the one hand, the Dodd-Frank Act led to a
compete shut-down of the mineral industry within the DRC by the central government. This at
least signaled a potential strengthening of regulation and transparency of the mining sector within
the DRC. This could increase the “prize” of controlling or influencing the central government in
the DRC and increase conflict. On the other hand, the Dodd-Frank Act also led to a dramatic
reduction in the international export of minerals originating in the DRC, signaling a—perhaps
permanent—negative shock to the revenue earning potential of controlling mineral mines. This
could decrease the “prize” of institutional rule or influence over the mining sector in the DRC and
decrease conflict.
Weak state capacity—A consequence of rent-seeking political institutions, perhaps due to re-
source wealth, is that they do not properly develop sufficient state capacity to organize and ad-
minister a free and fair society (Fearon 2005; Besley and Persson 2011; Bell and Wolford 2015).
This underdevelopment of state capacity makes states vulnerable to coups and broad-reaching po-
litical instability. It is difficult to understand how the Dodd-Frank Act influences this channel, in
either direction. The Dodd-Frank Act, first and foremost, is a legislation implemented by the US
government. The DRC government did respond to the passage of the legislation by shutting down
the mineral sector for several months, but there is no evidence that these actions improved the
legitimacy and capacity of key political institutions within the DRC or in surrounding countries.
Capital input intensity—Natural resource extraction and production is more capital intensive
than it is labor intensive. This being the case, an increase in the price of natural resources will incen-
tivize an increase in capital-intensive sectors (e.g., the natural resource sector) and dis-incentivize
labor-intensive sectors (e.g., the agricultural sector), which leaves excess labor available for joining
rebel groups (Dal Bo and Dal Bo 2011; Dube and Vargas 2013). The Dodd-Frank Act, implemented
as designed, reduced the price of minerals originating in the DRC and surrounding countries. In
theory, effects operating through this channel should decrease conflict. In practice, however, this
prediction is ambiguous. Although natural resource extraction may be relatively capital intensive,
compared to agriculture, mineral extraction and production still requires some labor. In 2008, for
example, the World Bank estimated that there are between 750,000 and 2,000,000 artisanal miners
living in the DRC (World Bank 2008). A reduction in mineral prices not only has the potential to
shut down machines, but also reduce the demand for labor of those who work in the mineral indus-
10

try. These workers now have a choice to either join the agricultural sector—often at a subsistence
level—or join a rebel group.
Grievances—Due to frustrations stemming from land access, environmental degradation, income
and/or wealth inequality, or a myriad of other factors, the extraction of natural resources can lead
to intensified conflict (Collier and Hoeffler 2004; Collier et al. 2009). It is again unclear how
the Dodd-Frank Act influences conflict through this channel. On one hand, the reduction in the
profitability of the mineral sector may attenuate grievances caused by access to and revenues earned
from mineral mines, and reduce conflict. On the other hand, the Dodd-Frank Act may contribute
to deepening poverty and inequality, which may further aggravate grievances, and increase conflict.
Migration—Changing migration patterns can meaningfully change the demographic composi-
tion of the local population in terms of ethnicity, age, gender, and standard of living (Le Billon 2001;
Ross 2004; Humphreys 2005; Sarsons (2015)). Demographic changes of this sort may spur conflict
in local areas. Migration can occur following either a boom or a bust, and in both cases these
changes can increase conflict. In regards to the Dodd-Frank Act, this channel implies an increase
in conflict due to migration and the changing demographic composition of local populations.
Opportunity cost—Natural resource extraction, particularly of lucrative minerals, can increase
the income level within a given region and can therefore increase the opportunity cost of joining
a rebel group (Becker 1968; Ehrlich 1973; Hirshleifer 1995; Collier and Hoffler 1998; Grossman
1991; Fearon and Laitin 2003; Dube and Vargas 2013; Bazzi and Blattman 2014). The symmetric
effect also holds. A reduction in natural resource extraction can decrease the income level and
opportunity cost of joining a rebel group. Effects operating through this channel imply that the
Dodd-Frank Act will increase conflict by decreasing local-level income earning potential and the
opportunity cost of joining rebel groups.
Taken together, the overall impact of the Dodd-Frank Act on the prevalence of conflict is ex ante
ambiguous. Those who contend that the Dodd-Frank Act will reduce conflict claim either that the
feasibility channel dominates the opportunity cost and migration channels or that the channels with
ambiguous effects will end up reducing conflict. Those who warn about the unintended consequences
of the Dodd-Frank Act in the DRC and surrounding countries claim that the opportunity cost and
migration channels dominate the feasibility channel or that the channels with ambiguous effects
will end up increasing conflict. Although this study cannot distinguish between each of these
mechanisms, the results of this study can provide insight into the overall effect of the Dodd-Frank
Act in the DRC and surrounding countries.
11

3 Empirical Framework
Previous research assessing the effect of the Dodd-Frank Act on the prevalence of conflict fall into
two broad categories. The first category consists of highly detailed political and anthropological
fieldwork that is mostly qualitative (Autesserre 2012; Geenen 2012; Radley and Vogel 2015; Vogel
and Raeymaekers 2016). This research is informative but ultimately not specifically designed to
quantitatively calculate the causal effect of the Dodd-Frank Act on the prevalence of conflict in the
DRC and surrounding countries. The second category consists of within-country, and more specif-
ically within-DRC, econometric analysis of the effect of the Dodd-Frank Act on conflict (Parker
and Vadheim 2017; Stoop et al. 2018a), and child mortality (Parker et al. 2016). This research
makes an important methodological contribution, in terms of estimating the causal effect of the
Dodd-Frank Act, but may still suffer from endogeneity issues—such as spillovers and other forms
of unobserved heterogeneity. Moreover, since the Dodd-Frank Act also regulates mineral mines
in countries surrounding the DRC, a complete evaluation of this legislation also needs to consider
effects in these countries.
This paper adds to both of these strands of the literature by estimating the effect of the Dodd-
Frank Act on conflict across countries. Following Parker and Vadheim (2017) and Maystadt et al.
(2014) I perform analysis at the level of sub-national administrative units. This is a preferable
approach as administrative units identify more meaningful topographical boundaries, compared
to grid cells of arbitrary size. In practice, these difference-in-difference estimates compare the
likelihood a conflict event occurs within the second sub-national administrative region in a given
month between the DRC and other sub-Saharan African countries not covered by the Dodd-Frank
Act. In order to estimate the effect on all covered countries, some specifications compare all
countries covered by the Dodd-Frank Act with other sub-Saharan African countries.
3.1 Data
The primary source of data for this empirical analysis comes from the Armed Conflict Location
and Event Data (ACLED) project (Raleigh et al. 2010). ACLED provides geocoded information
on conflict events across many developing countries. The full ACLED dataset includes close to
200,000 individual events spanning from 1997 through the present. I use a subset of the ACLED
database, which includes events from 38 sub-Saharan African countries from 2004 through 2016.5
5Following Parker and Vadheim (2017), this analysis begins in 2004 in order to avoid any effects driven by theSecond Congo War.
12

Figure 1: Conflict Events in Africa
Notes: The top panel plots the geographic distribution of conflict events in Africa from 2004 through 2010.The bottom panel plots the geographic distribution of conflict events in Africa from 2011 through 2016.Source: The Armed Conflict Location and Event Data Project (ACLED).
13

Countries included in this analysis are the DRC and surrounding countries—as defined by
Section 1502 of the Dodd-Frank Act—and other sub-Saharan African countries, excluding Sudan,
South Sudan, and Somalia.6 These countries are excluded due to complications with their own
civil wars and state failures. Another reason for excluding both Sudan and South Sudan is South
Sudan became a country in the middle of the study period. This complicates identifying consistent
geographical areas over time. Figure 1 shows the location of these conflict events across the entire
continent of Africa, split apart for years before and after the passage of the Dodd-Frank Act in
July of 2010.
A second source of data is the GADM database of global administrative areas. GADM provides
geocoded information on administrative areas from all countries, at all levels of sub-division. I use
the GADM database to construct a set of second sub-national administrative regions within each of
the countries included in the analysis. Combining the subset of ACLED data with the GADM set of
administrative regions, I construct a monthly panel dataset with information about the prevalence
of conflict at the second sub-national administrative region within each country. This panel data
set includes 156 time periods and 3,681 administrative regions within 38 countries, for a total of
574,236 units of observation.
With these data I construct binary outcome variables that indicate whether a given adminis-
trative region experienced a conflict event within a given month.7 ACLED codes conflict events
into different categories. With this information, I construct five different outcome variables. The
first pools all types of conflict together. The second, violence against civilians, is defined di-
rectly by ACLED. The third, rebel group battles, is defined by combining ACLED categories:
“Battle—Government regains territory”, “Battle–no change of territory”, and “Battle—non-state
actor overtakes territory”. The fourth, riots and protests, is defined by combining ACLED cate-
gories: “Headquarters or base established”, “Non-violent transfer of territory”, “remote violence”,
“Riots/protests”, and “Strategic development”. The fifth, deadly conflict, is defined as being a
conflict event of any type with at least one fatality.
6The countries included in this analysis are as follows: The DRC, Uganda, Rwanda, Burundi, Tanzania, Zambia,Angola, the Republic of Congo, the Central African Republic, Kenya, Ethiopia, Chad, Cameroon, Gabon, Mozam-bique, Malawi, Botswana, Namibia, Zimbabwe, South Africa, Nigeria, Senegal, Guinea, Sierra Leone, Liberia, IvoryCoast, Ghana, the Gambia, Guinea-Bissau, Togo, Benin, Burkina Faso, Eritrea, Djibouti, Lethoto, Swaziland, Niger,and Mali.
7In principle performing this analysis with count variables, rather than binary variables, is possible. In practice,however, many second sub-national regions experience no conflict events within a given month, which results inmany conflict counts of zero. In fact, the mean count of each of the five types of conflict within a given monthand geographic region are less than one. Nevertheless, Table 6 in the appendix shows the robustness of results toalternative dependent variable definitions. Specifically, these alternative dependent variables equal 1 if a region had
14

Table 1: Summary Statistics, Pre-Dodd-Frank Act
Mean Std. Dev. Trenda
Panel A: DRC Only(i) Conflict, all types 0.141 0.347 0.000
(0.000)(ii) Violence against civilians 0.084 0.277 0.001*
(0.000)(iii) Rebel group battles 0.082 0.274 0.000
(0.000)(iv) Riots and protests 0.050 0.219 -0.000
(0.000)(v) Deadly conflict 0.072 0.259 0.001*
(0.000)
Panel B: All Covered Countries(i) Conflict, all types 0.030 0.170 -0.000
(0.000)(ii) Violence against civilians 0.015 0.123 0.000**
(0.000)(iiI) Rebel group battles 0.013 0.114 -0.000***
(0.000)(iv) Riots and protests 0.010 0.100 -0.000
(0.000)(v) Deadly conflict 0.015 0.122 -0.000
(0.000)
Panel C: All Non-Covered Countries(i) Conflict, all types 0.022 0.148 0.000***
(0.000)(ii) Violence against civilians 0.010 0.100 0.000***
(0.000)(iii) Rebel group battles 0.007 0.0814 0.000***
(0.000)(iv) Riots and protests 0.010 0.097 0.000***
(0.000)(v) Deadly conflict 0.007 0.085 0.000***
(0.000)
Notes: a Pre-Dodd-Frank Trend is the linear fit of the givenoutcome variable prior to the passage of the Dodd-Frank Act.Standard errors, clustered by the 2nd subnational administra-tive area, in parentheses *** p<0.01, ** p<0.05, * p<0.1.
15

Figure 2: Conflict Trends by Type
Notes: Each panel refers to the trend in the probability of each of the five outcome variables calculatedat the 2nd subnational level within each country. Panel A refers to all conflict. Panel B refers to violenceagainst civilians. Panel C refers to rebel group battles. Panel D refers to riots and protests. Panel E refersto deadly conflict. In each graph, the solid line represents the point estimate when the DRC is “treated”.Probability of conflict computed at the 2nd subnational level in each country within each month from 2004through 2016. Source: The Armed Conflict Location and Event Data Project (ACLED).
16

Table 1 shows summary statistics, for months prior to the passage of the Dodd-Frank Act, of
these variables for the DRC, all covered countries, and all non-covered countries. The third column
of Table 1 records the trend of each of these outcomes variables prior to the passage of the Dodd-
Frank Act. Figure 2 visualizes these trends in these binary outcome variables both before and after
the passage of the Dodd-Frank Act.
A few details are worth a brief comment, based on Table 1 and the visual representations of these
data in Figures 1 and 2. First, Figure 1 shows that while there is a wide geographic distribution
of conflict events across the continent of Africa, many of these events tend to be clustered in a
general region commonly referred to as Africa’s Great Lakes Region. Second, Table 1 reports that
although there is a difference in levels, there is very little trend over time in these variables prior
to the passage of the Dodd-Frank Act. Additionally, there is very little difference in these trends
between the DRC, all covered countries, and all non-covered countries. Third, Figure 2 shows that,
compared to both the covered and non-covered countries, the trends in the probability of conflict
in the DRC is much more volatile. This detail presents complications when performing causal
inference and is addressed by implementing a variant of Fisher’s permutation test (Fisher 1935).
Finally, in the months after the passage of the Dodd-Frank Act, the trends in the probability of
conflict increase considerably for the DRC. This pattern largely persists across all types of conflict.
3.2 Estimation and Identification Strategy
I empirically estimate whether the Dodd-Frank Act increased or decreased the prevalence of con-
flict, in the DRC specifically and in all countries covered by the Dodd-Frank Act more generally.
Formally, this relationship is specified with the following linear probability regression model:
yrct = αrc + γt + β · 1{c = DRC} · 1{t ≥ July 2010}+ εrct (1)
The variable yrct represents an outcome variable in administrative area r in country c and in
month t. The main outcome of interest is a measure of any type of conflict event. Other outcomes
include specific types of conflict such as: violence against civilians, rebel group battles, riots and
protests, and deadly conflict. The specification also includes geographic (αrc) and month (γt)
fixed effects, and an error term (εrct). The coefficient of interest (β) is the difference-in-differences
estimate of the effect of the Dodd-Frank Act on the prevalence of conflict in the DRC. In this
specification the other countries covered by the Dodd-Frank Act (e.g., the countries that border
greater than 5 (Table 6, Panel A) or ten (Table 6, Panel B) conflict events in a given month.
17

the DRC) are excluded from the analysis. From a research design perspective, this is a beneficial
feature of the implementation of the Dodd-Frank Act. It essentially ensures that there will be
little spillover effects from the implementation of the legislation in the DRC to other regions within
comparison countries. These results are shown in Panel A of Table 2.
As discussed by Cunningham and Shah (2018) and Buchmueller et al. (2011), inference from this
difference-in-differences strategy relies on asymptotic assumptions, which may not be reasonable
since “treatment” occurs in only one country (e.g., in the specification where we only examine
the effects of the Dodd-Frank Act in the DRC). To address this issue, I implement a variant of
Fisher’s permutation test (Fisher 1935). I re-estimate equation (1) an additional 29 times, each
time replacing the DRC with an indicator for one of the other 29 sub-Saharan African countries not
covered by the Dodd-Frank Act. Next I compare the effect estimate for the DRC with the other 29
placebo estimates. This provides a distribution of effects. Robust effect estimates will consistently
be an outlier in these distributions, for all outcome variables. In Figure 3, I graph both the placebo
estimates and the DRC estimate for each of the five outcome variables. The vertical dashed lines
represent the 5th and 95th percent confidence interval of the distribution of placebo estimates
(excluding the estimate from the DRC). The solid line represents the difference-in-differences effect
estimate for the DRC.
In some versions of the specification detailed in equation (1), all countries covered by the Dodd-
Frank Act, that is the DRC plus all surrounding countries, are included in the regression. These
specifications estimate the effect of the Dodd-Frank Act for all covered countries combined. That
is the difference-in-difference estimates compare administrative regions in all covered countries to
administrative regions in other non-covered sub-Saharan African countries. These results are shown
in Panel B of Table 2. Concerns stemming from having only one treated unit are not present in
the specifications when all countries covered by the Dodd-Frank Act are included in the analysis.
A core identifying assumption for the validity of the effect estimates calculated in equation (1)
is that conflict in the DRC would have followed a trend along a path similar to other countries in
the absence of the Dodd-Frank Act. In order to test the validity of this assumption, I estimate
equation (2):
yrct = ηrc + λt + δt · 1{c = DRC} · 1{t = 2005, 2006, 2007, ..., 2016}+ ξrct (2)
In equation (2) all variables are the same as in equation (1). Outcomes in administrative area
r in country c and in month t are regressed on geographic (ηrc) and month (λr) fixed effects, with
18

an error term (ξrct). The key difference is in equation (2) δt, the coefficient on the difference-
in-difference interaction, is a vector that takes on a value for each associated year for months
between January 2004 through December 2016. In principle, equation (2) could be estimated with
interactions for each month between January 2004 and December 2016. In practice, for ease of
exposition, I estimate equation (2) with interactions for each year. This averages the monthly effect
estimates over the associated year. Similar to equation (1), in some versions of this specification all
countries covered by the Dodd-Frank Act are included in the regression. These specifications aim
at estimating the effect of the Dodd-Frank Act in all covered countries, rather than only within
the DRC. Estimation results calculated using equation (2) are reported graphically in Figures 4
and 5. If the identification strategy of this paper is valid, then effect estimates in time periods
prior to July 2010 will be statistically insignificant and/or relatively small in magnitude. Lastly,
in all estimates the standard errors are clustered at the country level to account for possible serial
correlation within countries (Bertrand et al. 2004) and to reflect the fact that treatment varies at
the country level (Abadie et al. 2017).
4 Did the Dodd-Frank Act Increase or Decrease Conflict?
The effect of the Dodd-Frank Act on the prevalence of conflict in the DRC and surrounding countries
is controversial. Advocacy organizations report overwhelming positive effects of the Dodd-Frank
Act within the DRC. For example, the Enough Project published a report in 2016 claiming, “...
positive advances corresponding to the stated purpose of Section 1502 [of the Dodd-Frank Act]”
(Dranginis 2016). These positive advances include, “... increased security for civilians...” and “...
a significant reduction in armed group control of mining areas...” (Dranginis 2016). On the other
hand, numerous accounts associate the Dodd-Frank Act with the opposite of the intended outcomes
(see Seay 2012 for a review). Additionally, econometric analysis suggests that, at least in years
immediately following the passage of the legislation and before full policy implementation, the
Dodd-Frank Act may have increased conflict in the Eastern DRC (Parker and Vadheim 2017). As
highlighted by The Washington Post—and noted at the beginning of this paper—one mechanism
for unintended consequence of requiring due diligence and reporting requirements is prominent
buyers of minerals shifting away from purchasing minerals from the DRC (Raghavan 2014). In
reducing the revenue earning potential of mineral mines, the Dodd-Frank Act may have removed a
viable economic alternative to substance agriculture or joining rebel groups for much of the rural
population. If these sorts of dynamics persists, there is a real possibility that the Dodd-Frank Act
19
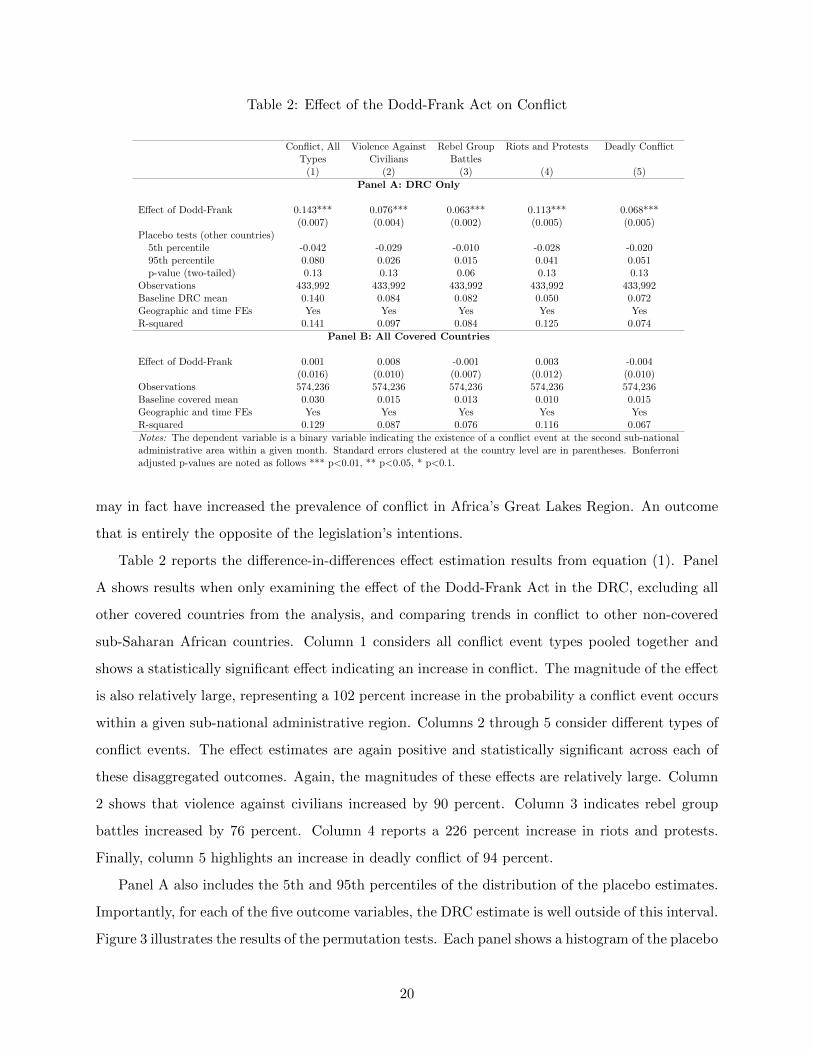
Table 2: Effect of the Dodd-Frank Act on Conflict
Conflict, All Violence Against Rebel Group Riots and Protests Deadly ConflictTypes Civilians Battles
(1) (2) (3) (4) (5)
Panel A: DRC Only
Effect of Dodd-Frank 0.143*** 0.076*** 0.063*** 0.113*** 0.068***(0.007) (0.004) (0.002) (0.005) (0.005)
Placebo tests (other countries)5th percentile -0.042 -0.029 -0.010 -0.028 -0.02095th percentile 0.080 0.026 0.015 0.041 0.051p-value (two-tailed) 0.13 0.13 0.06 0.13 0.13
Observations 433,992 433,992 433,992 433,992 433,992Baseline DRC mean 0.140 0.084 0.082 0.050 0.072Geographic and time FEs Yes Yes Yes Yes YesR-squared 0.141 0.097 0.084 0.125 0.074
Panel B: All Covered Countries
Effect of Dodd-Frank 0.001 0.008 -0.001 0.003 -0.004(0.016) (0.010) (0.007) (0.012) (0.010)
Observations 574,236 574,236 574,236 574,236 574,236Baseline covered mean 0.030 0.015 0.013 0.010 0.015Geographic and time FEs Yes Yes Yes Yes YesR-squared 0.129 0.087 0.076 0.116 0.067
Notes: The dependent variable is a binary variable indicating the existence of a conflict event at the second sub-nationaladministrative area within a given month. Standard errors clustered at the country level are in parentheses. Bonferroniadjusted p-values are noted as follows *** p<0.01, ** p<0.05, * p<0.1.
may in fact have increased the prevalence of conflict in Africa’s Great Lakes Region. An outcome
that is entirely the opposite of the legislation’s intentions.
Table 2 reports the difference-in-differences effect estimation results from equation (1). Panel
A shows results when only examining the effect of the Dodd-Frank Act in the DRC, excluding all
other covered countries from the analysis, and comparing trends in conflict to other non-covered
sub-Saharan African countries. Column 1 considers all conflict event types pooled together and
shows a statistically significant effect indicating an increase in conflict. The magnitude of the effect
is also relatively large, representing a 102 percent increase in the probability a conflict event occurs
within a given sub-national administrative region. Columns 2 through 5 consider different types of
conflict events. The effect estimates are again positive and statistically significant across each of
these disaggregated outcomes. Again, the magnitudes of these effects are relatively large. Column
2 shows that violence against civilians increased by 90 percent. Column 3 indicates rebel group
battles increased by 76 percent. Column 4 reports a 226 percent increase in riots and protests.
Finally, column 5 highlights an increase in deadly conflict of 94 percent.
Panel A also includes the 5th and 95th percentiles of the distribution of the placebo estimates.
Importantly, for each of the five outcome variables, the DRC estimate is well outside of this interval.
Figure 3 illustrates the results of the permutation tests. Each panel shows a histogram of the placebo
20

estimates for a different outcome variable. The dashed lines represent the 95 percent confidence
interval of the placebo effect estimates and the solid line represents the DRC effect estimate. These
figures show that for each of these outcomes, the DRC estimate is well outside the 95 percent
confidence interval. Note that, particularly in the present context, this is a very demanding test to
achieve statistical significance at conventional levels. With 30 countries, it is impossible to achieve
statistical significance from a two-tailed test at the 5 percent level. Achieving significance at the 10
percent level occurs if and only if the DRC is ranked first or last in the placebo effect distribution.
This occurs only in the case of rebel group battles. For the rest of the outcome variables the DRC
effect estimate is ranked second largest in the distribution of placebo estimates. P-values associated
with these permutation tests ,from two-tailed tests of statistical significance, are also reported in
Panel A of Table 2.
Panel B of Table 2 reports the difference-in-difference estimates for the effects of the Dodd-
Frank Act in all covered countries, rather than only within the DRC. In each of the five columns
I find a relatively precisely estimated statistically insignificant, null effect. Taken together, the
effect estimates for all covered countries pooled together are muted in terms of both effect size and
statistical significance compared to the results only within the DRC. This suggests that within the
complete set of countries covered by the Dodd-Frank Act there are many other factors that are
much more important for predicting conflict than the passage of the legislation. While there is no
evidence that the Dodd-Frank Act systematically increased the prevalence of conflict in all of these
countries combined, there is similarly little evidence that the legislation lead to any systematic
reduction in the prevalence of conflict.
This broad conclusion about the effect of the Dodd-Frank Act in all countries covered by the
legislation pooled together may hide important heterogeneity. Table 5, in the Appendix, shows
these country-specific effects among the various countries covered by the Dodd-Frank Act. The
prevalence of conflict—both in general and in the disaggregated measures—decreased in Angola,
the Republic of Congo, Rwanda, Tanzania, and Uganda. On the other hand, similar to the DRC,
the prevalence of conflict increased in the Central Africa Republic and Burundi. The magnitudes
of each of these effects, however, are substantially smaller than the estimated effects in the DRC.
The majority of these country-specific effects, for countries covered by the Dodd-Frank Act, are
within the 95 percent confidence interval for the distribution of the placebo estimates generated
from the permutation tests. Therefore, although the effects for each country covered by the Dodd-
Frank Act are mixed, statistical inference from only the strongest effects are robust to permutation
21

Figure 3: Placebo Estimates from Permutation Tests, DRC Only
Notes: This figure shows country effects estimated from placebo permutation tests for each column in Table1. Each panel refers to a placebo test for each of the five outcome variables. Panel A refers to all conflict.Panel B refers to violence against civilians. Panel C refers to rebel group battles. Panel D refers to riots andprotests. Panel E refers to deadly conflict. In each graph, the solid line represents the point estimate whenthe DRC is “treated”. The dashed lines represent the 5th and 95th percentiles.
22

Figure 4: Year Specific Effect Sizes, DRC Only
Notes: Each panel refers to each of the five outcome variables. Panel A refers to all conflict. Panel B refersto violence against civilians. Panel C refers to rebel group battles. Panel D refers to riots and protests.Panel E refers to deadly conflict. In each graph, the dashed line represents when the Dodd-Frank Act wassigned into US law.
tests. This is consistent with the implementation of Section 1502 of the Dodd-Frank Act which
specifically targeted the DRC, but also regulated minerals exported by surrounding countries.
As previously mentioned a key identifying assumption for the validity of this estimation frame-
work is that conflict in the DRC, or the other covered countries, would not trend differently com-
pared to other sub-Saharan African countries in the absence of the Dodd-Frank Act. Effect es-
timates from equation (2) help explore the validity of this assumption in the present context. If
year-specific effect estimates are statistically insignificant and/or relatively small prior to July 2010,
then this suggests evidence in favor of the validity of the identification strategy used in this paper.
Figure 4 reports the year-specific effect estimates for each of the five outcome variables. In Panel
A, year-specific effect estimates are statistically insignificant between the years 2006 and 2008. In
23

2005 and 2009 the estimates are statistically significant but relatively small compared to the effect
estimates for years after the passage of the Dodd-Frank Act. Specifically, the effects in 2005 and
2009 both have a coefficient smaller than 0.1, whereas beginning in 2011 the effect estimates are
twice as large with coefficients roughly around 0.2. This key finding is qualitatively similar across
all other outcome variables. Although the effects are strongest in Panel A, when all types of conflict
are pooled together, Panels B through E each report a statistically significant increase in conflict
in years after the passage of the Dodd-Frank. This indicates that the overall effect on all types
of conflict is not primarily driven by a change in a specific type of conflict. Moreover, the effects
are relatively stable over time. This indicates that the effects reported in Table 1 are not driven
by a dramatic spike in conflict in any one year. Taken together the findings presented in Figure 4
support the validity of the identification strategy for estimating the effect of the Dodd-Frank Act
on conflict within the DRC.
Figure 5 reports year-specific effect estimates for each of the five outcome variables, when all
countries covered by the Dodd-Frank Act are included in equation (2). In each of these panels,
the effect sizes are considerably smaller than the corresponding effect sizes in Figure 4. This is
consistent with the results reported in Panel B of Table 2. Pooling all types of conflict together,
in Panel A, the impact estimates prior to the passage of the Dodd-Frank Act are statistically
insignificant and relatively small. In years after the passage of the legislation, the effects indicate a
null effect of the Dodd-Frank Act within all countries pooled together. Effect estimates on violence
against civilians and riots and protests, reported in Panels B and D respectively, report small and
statistically insignificant results in years prior to the Dodd-Frank Act. This trend continues in
the years immediately following, but in 2015 and 2016 the probability of violence against civilians
increases slightly but remains statistically insignificant. In Panels C and E, the results support the
finding that factors other than the passage of the Dodd-Frank Act predict these types of conflict
in the full set of countries covered by the legislation. Similar to the results reported in Panel B of
Table 2, there is very little evidence that the Dodd-Frank Act systematically increased or decreased
the prevalence of conflict within all countries covered by the legislation.
Overall these results indicate that the Dodd-Frank Act increased the prevalence of conflict in
the DRC. This result is qualitatively similar when considering all types of conflict pooled together
or when considering disaggregated types of conflict. These effect estimates are also relatively large
in size. The probability of any type of conflict roughly doubled within the DRC after the passage
of the Dodd-Frank Act. Disaggregated types of conflict increased by rates between 75 and over
24
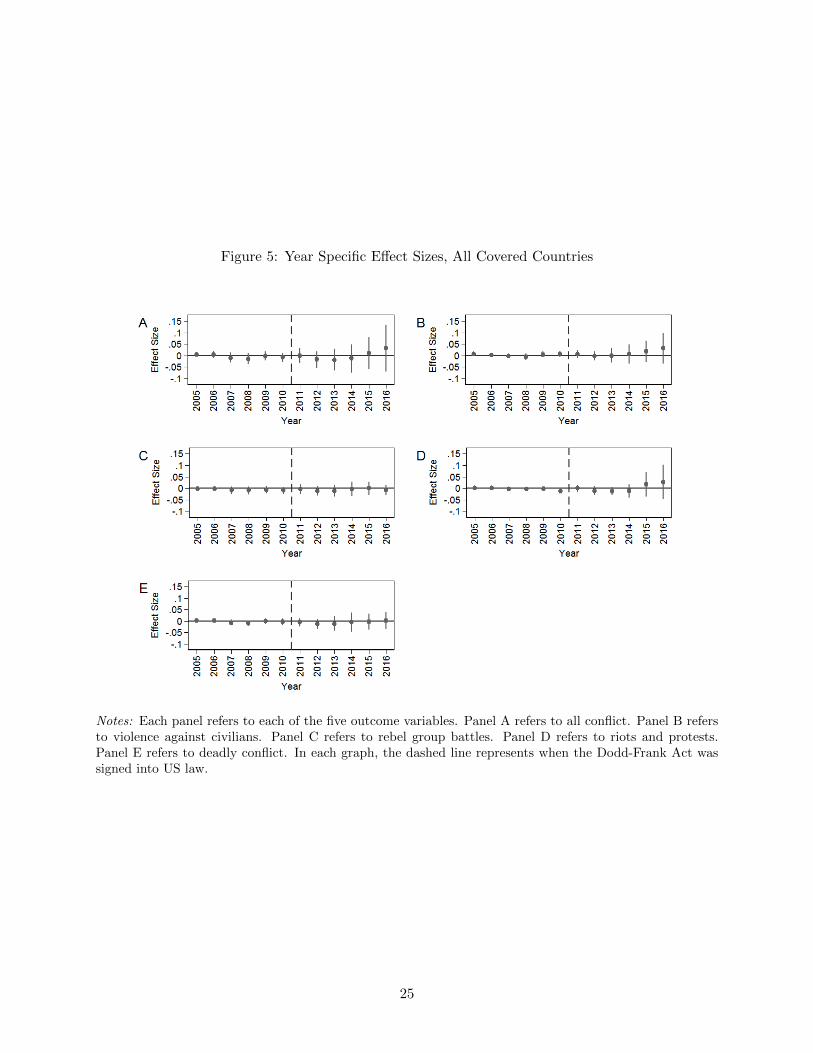
Figure 5: Year Specific Effect Sizes, All Covered Countries
Notes: Each panel refers to each of the five outcome variables. Panel A refers to all conflict. Panel B refersto violence against civilians. Panel C refers to rebel group battles. Panel D refers to riots and protests.Panel E refers to deadly conflict. In each graph, the dashed line represents when the Dodd-Frank Act wassigned into US law.
25
225 percent. This is evidence of substantial unintended consequences of the Dodd-Frank Act in the
DRC.
When considering all countries covered by the Dodd-Frank Act, the estimated effects are much
more muted. There is no evidence that the Dodd-Frank Act increased or decreased all types of
conflict across all of these countries together. Examining each of the covered countries individually
uncovers potentially important heterogeneity across countries. Each of these effect sizes, however,
are relatively small and statistical inference of these estimates is mostly not robust to permutation
tests. Therefore, although there is no evidence of systematic unintended consequences among all
countries covered by the legislation, there is also no evidence the Dodd-Frank Act systematically
reduced the prevalence conflict.
5 Mechanisms within the DRC
As noted above, there are a number of possible mechanisms that, in theory, could explain the esti-
mated effects of the Dodd-Frank Act. The most relevant mechanisms to disentangle are feasibility
(Fearon 2005; Collier et al. 2009; Nunn and Qian 2014; Dube and Naidu 2015; Bellemare 2015;
Christian and Barrett 2017; Koren 2018) and opportunity cost (Becker 1968; Ehrlich 1973; Hirsh-
leifer 1995; Collier and Hoffler 1998; Grossman 1991; Fearon and Laitin 2003; Dube and Vargas
2013; Bazzi and Blattman 2014). The assumed theory of change of Section 1502 of the Dodd-Frank
Act rests on the strength of the link between minerals and conflict. If this mechanism persists, then
the presence of armed groups at relevant mineral mines will decrease and so will the revenue earned
by armed groups from mineral extraction. This could effectively tighten the budget constraint of
armed groups and reduce their ability to perpetuate conflict. On the other hand, if the opportu-
nity cost mechanism persists, then either a reduction in incomes or a reduction in the number of
workers employed by relevant mineral mines could decrease the opportunity cost of joining a rebel
group. This could effectively strengthen the capacity of armed groups and increase their ability to
perpetuate conflict.
To test for the existence of these potential mechanisms I use data from the International Peace
Information Service (IPIS), and independent research institute that collects detailed information
about mineral mining within the DRC. The complete set of IPIS data includes information on 3,687
visits to mineral mines in the eastern provinces of the DRC from 2009 through 2017. I specifically
use information on the timing of the visit to each mineral mine, the number of workers involved,
and the presence of an armed group at the mining cite. Although these data include valuable
26

information, they are imperfect. IPIS tries their best to ensure that their visits to mineral mines
are representative of specific provinces in Eastern DRC. In some years, concerns relating to the
security of surveyors prohibit visits to all planned mining sites. In order to test for the sensitivity of
these details, I present two sets of results: one that uses the full set of IPIS data and another that
excludes visits in the years 2016 and 2017 due to their more focused and less representative nature.
Another limitation of the IPIS data is that it only exists within the DRC. Therefore, although
exploring potential mechanisms within the full list of covered countries and throughout the rest
of sub-Saharan Africa would be interesting, it is currently not possible given the availability of
detailed data on mineral mines.
The identification strategy used in this section to explore potential mechanisms follows that
used by Parker and Vadheim (2017) and Stoop et al. (2018). I compare outcomes between mining
cites that extract tin, tantalum, and tungsten (3T mineral mines) and mining cites that extract all
other minerals including gold. Parker and Vadheim (2017) cite two key reasons why the extraction
of 3T minerals are more likely to be influenced by the Dodd-Frank Act than gold even when all four
minerals are technically regulated by the legislation. First, the majority of the gold mined in the
DRC supplies jewelry markets in Middle Eastern and Asian countries (de Koning 2011). Second,
gold is more difficult to trace gold back to mines controlled by armed groups since it is quite easy to
melt and separate from any access rock. Alternatively, 3T minerals are easier to trace because they
are extracted with additional rock that can help distinguish the origin of the the mine (Lezhnev
and Prendergast 2009).
I specifically estimate the following difference-in-differences regression:
yir = φ · (3Tir · Postir) + ρ · 3Tir + τ · Postir + θr + µir (3)
In equation (3) yir represents the outcome of interest—either number of workers or the presence
of an armed group—for mine site visit i in administrative region r. The variable 3Tir is a binary
dummy variable indicating if the mine site extracts a 3T mineral. The variable Postir is a binary
dummy variable indicating if the mine site visit occurred after July 2010 or the passage of the Dodd-
Frank Act. The coefficient φ is the coefficient of interest on the interaction of 3T and Post and
estimates the impact of the Dodd-Frank Act on the outcome yir. Finally, θr is an administrative
area fixed effect and µir is the error term.
Table 3 reports the the estimates from equation (3). As previously noted, due to the limitations
of the IPIS data, I show two sets of estimates. Panel A shows results when using the the complete
27

Table 3: Effect of the Dodd-Frank Act on Number of Mine Workers and Presence of Armed Groups
IHS IHS IHS Binary Binary Binarynumber number number presence of presence of presence ofworkers workers workers armed group armed group armed group
(1) (2) (3) (4) (5) (6)
Panel A: All IPIS Data (2009 - 2017)
Effect of Dodd-Frank -0.733** -0.718** -0.532* -0.252 -0.199 -0.172(0.248) (0.242) (0.250) (0.143) (0.148) (0.125)
3T Mineral Mine 0.760** 0.742** 0.379 -0.130 -0.131 -0.00434(0.252) (0.261) (0.237) (0.113) (0.117) (0.105)
Post July 2010 -0.00904 -0.439 -0.425 0.0832 -0.180 -0.0942(0.217) (0.473) (0.452) (0.113) (0.157) (0.132)
Observations 3,029 3,029 3,029 3,439 3,439 3,439Baseline 3T mean - - - 0.327 0.327 0.327R-squared 0.016 0.076 0.223 0.128 0.179 0.389
Panel B: Truncated IPIS Data (2009 - 2015)
Effect of Dodd-Frank -0.978*** -1.001*** -0.765** -0.308* -0.287* -0.268*(0.264) (0.285) (0.255) (0.130) (0.136) (0.119)
3T Mineral Mine 0.760** 0.742** 0.557* -0.130 -0.131 0.0785(0.252) (0.261) (0.254) (0.113) (0.117) (0.0959)
Post July 2010 0.209 0.119 -0.154 0.161 0.0895 0.150(0.245) (0.326) (0.404) (0.0917) (0.120) (0.102)
Observations 2,371 2,371 2,371 2,621 2,621 2,621Baseline 3T mean - - - 0.327 0.327 0.327R-squared 0.021 0.053 0.185 0.149 0.166 0.426
Year FEs No Yes Yes No Yes YesTerritory FEs No No Yes No No Yes
Notes: The first three columns show the effect of the Dodd-Frank Act on the number of workersworking in 3T mineral mines. The dependent variable is transformed by the inverse hyperbolic sine(IHS) transformation. This transformation is log-like, and thus helps account for the highly non-Gaussian form of these data on number of workers, but is capable of mathematically handling zeros.The last three columns show the effect of the Dodd-Frank Act on the presence of armed groups atmineral sites. The dependent variable is expressed in terms of a binary dummy variable. Panel A usesthe complete set of IPIS data with mine visits from 2009 through 2017. Panel B uses a truncated set ofIPIS data from 2009 through 2015 that discards the more focused, and less representative, visits from2016 and 2017. Standard errors clustered at the territory level are shown in parentheses. Bonferroniadjusted p-values are noted as follows *** p<0.01, ** p<0.05, * p<0.1.
28
set of all IPIS data with mine site visits from 2009 through 2017. Panel B shows results when using
a truncated set of IPIS data which omits data from 2016 and 2017 which included visits to a much
more specialized selection of mine sites and is therefore less representative of provinces in Eastern
DRC.
IPIS data recording the number of workers associated with each mine is highly non-Gaussian,
with a long right tail on the distribution. Therefore, I transform the number of workers variable
by using the inverse hyperbolic sine (IHS) transformation (Burbidge et al. 1988; MacKinnon and
Magee 1990; Pence 2006). This transformation is similar to the natural log transformation, but
is mathematically capable of handling zeros. In order to interpret these coefficients, I follow the
derivations provided by Bellemare and Wichman (2018).8 In Columns (1) through (3) in Panel A
of Table 3 report the effect of the Dodd-Frank Act on the number of workers at 3T mineral mines
during IPIS visits. These estimates suggest that there is between a 42 and 51 percent reduction
in the number of workers due to the passage of the Dodd-Frank Act. The effect estimates are
slightly larger in Columns (1) through (3) in Panel B of Table 3, when using the truncated set of
IPIS data. Although the result is only marginally significant in Column (3) of Panel A, the results
are qualitatively robust to the inclusion of year and territory fixed effects. These results broadly
suggest that one of the persisting mechanisms driving the overall effect of the Dodd-Frank Act on
the prevalence of conflict is the opportunity cost mechanism.
Columns (4) through (6) in Panel A of Table 3 report the effect of the Dodd-Frank Act on the
presence of an armed rebel group at the mining site. These columns show that the effect of the
Dodd-Frank Act on the presence of an armed rebel group is statistically insignificant when using the
full set of IPIS data. Although the magnitude of these effects are quite large—representing roughly
an over 50 percent reduction in the probability an armed group is present at a mining site—these
estimates are relatively imprecise. In Columns (4) through (6) in Panel B of Table 3—when using
the truncated set of IPIS data—both the magnitudes and statistical significance of effect estimates
increase. These effects range between an 81 and a 94 percent decrease in the probability that an
armed group is present at a mining site. These results provide weak evidence suggesting that the
passage of the Dodd-Frank Act reduced the presence of armed rebel groups at 3T mineral mines.
Taken together all of this implies that it is possible that both the feasibility and opportunity
cost mechanisms persist within the DRC as a result of the Dodd-Frank Act. Consistent with the
8In the arcsine–linear with dummy independent variables, as specified in equation (3), the semi-elasticity is ap-proximately equal to 100 × exp(φ) −1.
29

overall effects presented above, however, the feasibility mechanism is seems to be the weaker than
the two and may ultimately be dominated by the opportunity cost mechanism. These results may
help explain both reports of reductions in armed group activity around mining areas (Graginis
2016) and the consistent finding in this literature of the Dodd-Frank Act leading to an increase,
rather than a decrease, in the prevalence of conflict in the DRC.
6 Robustness Check: Synthetic Control Estimation
An alternative method of analysis to estimate the causal effect of the Dodd-Frank Act is syn-
thetic control analysis. Since the synthetic control approach is a generalization of the difference-
in-difference estimation strategy it is well suited to serve as a robustness test for the core results
in this paper. Unlike the difference-in-difference approach, however, synthetic control analysis uses
of subset of comparison countries. Specifically the synthetic control is a convex combination of ad-
ministrative areas from comparison countries that best match the pre-intervention trend in conflict
within the DRC. Therefore, if there is any concern that non-covered sub-Saharan African countries
do not form the correct comparison group, this method should address the associated issues.
I follow Abadie et al. (2010; 2015) and use techniques designed to rigorously inform causal
inference with synthetic control estimation. The synthetic control method selects the optimal
weights, for each of the administrative areas of comparison countries which make up the donor
pool, that minimizes the root mean squared prediction error (RMSPE) prior to the treatment
period. These weights are then applied to the comparison countries after the treatment, and used
to estimate effects and inform causal inference. In the following exercise, I take the trends in
each conflict category—for the DRC and other non-covered sub-Saharan African countries—and
calculate an 11 month moving average across months. This procedure limits the volatility in the
probability of conflict within a given month and helps the synthetic control method more accurately
match the pre-treatment trends in each conflict category in the DRC.
Next I perform a placebo test that reassigns the treatment status from the DRC to a country
within the set of comparison countries (e.g., the donor pool). This test is similar to the variant of
Fisher’s (1935) permutation test discussed above and creates a distribution of placebo effects against
which to compare the effect estimate for the DRC. In particular, I compare the ratio of the post-
Dodd-Frank Act RMSPE and the pre-Dodd-Frank Act RMSPE. The RMSPE is a measure of the
magnitude of the gap in prevalence of conflict between each country and its synthetic comparison.
As noted by Abadie et al. (2015) a relatively large post-intervention RMSPE does not necessarily
30

indicate a relatively large effect of the intervention if the pre-intervention RMSPE is also relatively
large. This leads to the rational for using the ratio of the post-Dodd-Frank Act RMSPE and
the pre-Dodd-Frank Act RMSPE. A relatively large ratio indicates that the post-Dodd-Frank Act
RMSPE is large compared to the pre-Dodd-Frank Act RMSPE.
Panel A in Figure 6 shows the synthetic DRC trend before and after the passage of the Dodd-
Frank Act and compares this trend to the actual probability of conflict within the DRC. Panel B
in Figure 6 shows the gap between these two trends over time. Taken together these two figures
illustrate the dramatic increase in the prevalence of conflict within the DRC after the passage of
the Dodd-Frank Act. Specifically, the synthetic control estimation method finds that the passage of
the Dodd-Frank Act resulted in an increase in the probability of conflict at the second sub-national
administrative region within the DRC of roughly 93 percent. This is only slightly smaller than the
difference-in-difference effect estimate of 102 percent increase. Next, I apply the synthetic control
method to all 29 other sub-Saharan African countries not covered by the Dodd-Frank Act. The
DRC has the sixth highest ratio of post-Dodd-Frank Act RMSPE to pre-Dodd-Frank Act RMSPE.
The results are much more ambiguous for the various disaggregated types of conflict, and are
reported in Figures 7 through 10 in the Appendix. Panel A in Figure 7 shows the synthetic DRC
trend in violence against civilians compared with the actual DRC trend, and Panel B shows the
gap in these trends over time. The synthetic control estimate finds a 96 percent increase in the
probability of violence against civilians at the second sub-national administrative region within
the DRC. Difference-in-differences estimates, shown in Table 2, report a 90 percent increase in
the probability of violence against civilians. Similar to the results for all types of conflict pooled
together, effect estimates from these two procedures are very similar. However, the DRC is ranked
16th out of 30 in terms of the ratio of post-Dodd-Frank Act RMSPE to pre-Dodd-Frank Act
RMSPE.
The results for the rebel group battles, riots and protests, and deadly conflict are much less
robust. Figure 8 illustrates the synthetic control estimates for rebel group battles. The synthetic
control estimate reports a 135 percent increase in the probability of rebel group battles. This
estimate is almost twice the size of the difference-in-difference estimate of 76 percent, reported
in Table 2. This discrepancy is likely caused by a high amount of variability in the rebel group
battles outcome variable. Moreover, the DRC is ranked 19th out of 30 in terms of the pre-post
RMSPE ratio. Figure 9 reports the synthetic control estimates for riots and protests, and finds
a 166 percent increase in the probability of these events. This compares to a larger difference-
31

Figure 6: Synthetic Control, All Conflict Types
Notes: Panel A shows results of trends in the probability of conflict, within the DRC and the synthetic DRC,at the second sub-national level within each month from 2004 through 2016. Panel B shows the gap in theprobability of conflict at the second sub-national level within each month from 2004 through 2016 betweenthe DRC and the synthetic DRC.
32
in-differences estimate of a 226 percent increase. Additionally, the pre-post RMSPE ratio for the
DRC is ranked 5th out of 30. In this case, given the relatively high RMSPE ratio, the synthetic
estimate is likely a more accurate estimate of the true effect. Finally, Figure 10 shows the synthetic
control estimates for deadly conflict. In this case, the synthetic control method most poorly fits
the data. In fact, the pre-post RMSPE ratio for the DRC is ranked last when deadly conflict
is the outcome variable. Nevertheless the synthetic control effect estimate suggests a 33 percent
increase in the probability of deadly conflict. This is quite a bit smaller in magnitude from the
difference-in-difference estimate of a 94 percent increase in the probability of deadly conflict.
These synthetic control estimates provide a useful robustness check on the primary results
reported in this paper. Using a different estimation methodology the effect estimate on all types
of conflict pooled together is relatively robust. When looking at specific types of conflict, the
effect sizes differ slightly in the case of violence against civilians, and largely in other cases of rebel
group battles, riots and protests, and deadly conflict. Nevertheless, the core qualitative result holds
between the two estimation strategies. There seems to be a dramatic increase in the prevalence
of conflict within the DRC, relative to the prevalence of conflict in comparison countries, after the
passage of the Dodd-Frank Act.
7 The Effect of Enforcement Suspension
In April 2017 the US SEC suspended enforcement of the conflict minerals legislation.9 This followed
an attempt to overhaul the entire Dodd-Frank Act, which ultimately did not pass US Congressional
approval. Some are hopeful the suspension of enforcement will lead to positive outcomes in the
DRC and surrounding countries (Geenen 2017; Stoop et al. 2018b). As previously noted, however,
the entire Dodd-Frank Act remains part of the US law and can be enforced quite quickly again.
Furthermore, some companies—such as Apple, Intel, and Tiffany & Co—have publicly stated that
they intend to follow the requirements of the conflict minerals legislation even if it is officially
removed from US law. Therefore, although suspending enforcement of a law that has unintended
and negative consequences may theoretically lead to a reversal in outcomes, it is not at all clear
whether this effect is present in the context of the Dodd-Frank Act in Africa’s great lakes region.
9A statement made by the US SEC on April 7, 2018 notes the following, “In light of the uncertainty regardinghow the Commission will resolve those issues and related issues raised by commenters, the Division of CorporationFinance has determined that it will not recommend enforcement action to the Commission if companies, includingthose that are subject to paragraph (c) of Item 1.01 of Form SD, only file disclosure under the provisions of paragraphs(a) and (b) of Item 1.01 of Form SD.” Reports from news outlets, such as Reuters (Lynch 2017) and Supply ChainDive (Lopez and Burt 2017), support the interpretation of this statement to indicate that that the US SEC is, forthe time being, suspending enforcement of the conflict minerals legislation within the Dodd-Frank Act.
33

Table 4: Effect of Enforcement Suspension on Conflict
Conflict, All Violence Against Rebel Group Riots and Protests Deadly ConflictTypes Civilians Battles
(1) (2) (3) (4) (5)
Panel A: DRC Only
Effect of Enforcement Suspension 0.007 0.027*** 0.010*** -0.012 0.014***(0.007) (0.004) (0.003) (0.005) (0.003)
Placebo tests (other countries)5th percentile -0.046 -0.036 -0.015 -0.020 -0.02195th percentile 0.093 0.082 0.056 0.051 0.080p-value (two-tailed) 0.666 0.333 0.266 0.600 0.400
Observations 147,976 147,976 147,976 147,976 147,976Basline DRC mean 0.357 0.179 0.156 0.247 0.184Geographic and time FEs Yes Yes Yes Yes YesR-squared 0.181 0.116 0.135 0.164 0.131
Panel B: All Covered Countries
Effect of Enforcement Suspension -0.002 0.005 -0.006 -0.014 -0.006(0.0111) (0.010) (0.005) (0.008) (0.004)
Observations 195,676 195,676 195,676 195,676 195,676Basline Covered mean 0.092 0.052 0.022 0.051 0.037Geographic and time FEs Yes Yes Yes Yes YesR-squared 0.177 0.129 0.125 0.153 0.122
Notes: The dependent variable is a binary variable indicating the existence of a conflict event at the second sub-nationaladministrative area within a given month. Standard errors clustered at the country level are in parentheses. Bonferroniadjusted p-values are noted as follows *** p<0.01, ** p<0.05, * p<0.1.
This raises the question: What is the effect of suspending enforcement of the conflict minerals
legislation in the DRC and surrounding countries? I investigate this question by repeating a similar
estimation strategy as performed above over a different time period.10 I examine the prevalence of
conflict within the DRC, all covered countries, and all non-covered sub-Saharan African countries
from May 2014—when the conflict minerals legislation was officially implemented by the US SEC—
through September 2018. This analysis tests the effect of enforcement suspension of the conflict
minerals legislation on the prevalence of conflict in the DRC and surrounding countries.
Table 4 reports the difference-in-differences estimates of the effect of enforcement suspension.
Panel A shows results when only examining the effect of enforcement suspension in the DRC,
excluding all other covered countries from the analysis, and comparing trends in conflict to other
non-covered sub-Saharan African countries. Column 1 considers all conflict event types pooled
together and shows a relatively precise null effect, suggesting enforcement suspension has so far
had little effect on the prevalence of conflict within the DRC. A similar finding persists among
the riots and protests type of conflict, reported in column 4, suggesting that the prevalence of this
type of conflict is unaffected by suspending enforcement of the legislation. Effect estimates for
10This estimation strategy is similar to that defined by equation (1), but over a different time-frame. Results froman estimation strategy similar to equation (2) for this analysis of the effect of enforcement suspension are shown inFigures 12 and 13 in the Appendix.
34

violence against civilians, rebel group battles, and deadly conflict—reported in columns 2, 3, and
5 respectively—all increase in response to enforcement suspension. This may seem like a rather
surprising result, however, two details must be acknowledged. First, the effects are quite small
relative to the effects reported in Table 2 on the effect of the passaged of the Dodd-Frank Act—
representing between a 5 and 15 percent increase in each type of conflict. Second, and perhaps
more importantly, permutation tests find that none of these effects fall outside of the 5th or 95th
percentile of placebo estimates, suggesting that these effects are likely to be spurious artifacts of
the estimation strategy.11 Taken together, the results presented in Panel A of Table 4 suggest that
the suspension of enforcement of the conflict minerals legislation has little effect on conflict within
the DRC.
Panel B of Table 4 reports the difference-in-difference estimates of results for all covered coun-
tries pooled together, rather than for only the DRC. In each of the five columns I find a relatively
precisely estimated null effect. Similar to the results in Table 2—which estimated the effects of the
passage of the Dodd-Frank Act—the effect estimates reported in Panel B of Table 4 suggest that
enforcement suspension has very effect on conflict in all covered countries. Again, this suggests
that within the complete set of countries covered by the Dodd-Frank Act there are many other
factors that are much more important for predicting conflict than the suspension of enforcement of
the legislation.
There are at least two reasons to interpret these results estimating the effect of enforcement
suspension with caution. First, although the US SEC has made it known that the conflict minerals
legislation—for the time being—will not be enforced, the entire Dodd-Frank Act as well as the
conflict minerals legislation are still US law. Therefore, US companies may still be complying with
the regulation due to either legal ambiguity or a belief the legislation will be enforced again in the
future. Additionally, as previously discussed, some companies have expressed the belief that there
is a market expectation for conflict free products and therefore have intentions of complying with
the legislation even if the law were to be officially changed. Second, these estimates only consider a
relatively short time-frame and alternative findings may manifest in due time. The results reported
in Table 4 estimate the effect of enforcement suspension by using just over a year and a half (e.g.
20 months) of “post treatment” periods. It is entirely plausible that estimates taking into account
a longer time-frame may find different results.
Keeping these details in mind, the results reported in Table 4 suggest that simply suspending
11Results for these permutation tests are reported in Figure 11 in the Appendix.
35

enforcement of the Dodd-Frank Act’s conflict minerals regulation has little effect on conflict in the
DRC and surrounding countries. This provides some insights that may be helpful when thinking
about appropriate responses and re-designs of US policy with the intention of limiting the role of
US consumers in supporting conflict in Africa’s great lakes region. First, if these trends continue,
it may be unlikely that a more official repeal of the conflict minerals legislation—that is, actual
changes to US law—will have an overwhelming corrective effect in the DRC. Given the foregoing,
it seems reasonable to conclude that simply removing the conflict minerals legislation from US law
will be insufficient in restoring the DRC to pre-Dodd-Frank Act levels of conflict, let alone any
reduction from these levels. Second, perhaps a more effective policy will include localized economic
and social support for those households that have been adversely affected by the Dodd-Frank Act.
This could include aid that supports human rights and promotes economic opportunities in the
region. That said, much more work and research is needed to better understand and design more
effective future policies.
8 Discussion and Conclusion
This study finds evidence of unintended consequences of the Dodd-Frank Act. Difference-in-
differences estimates find that the Dodd-Frank Act increased the probability of conflict at the
second sub-national administrative region. For all types of conflict the estimated effect is roughly
double, when compared to other sub-Saharan countries not covered by the Dodd-Frank Act. These
effect estimates are qualitatively similar across all types of conflict including: violence against civil-
ians, rebel group battles, riots and protests, and deadly conflict. Year-specific estimates suggest
that these effects persist for all years since the passage of the Dodd-Frank Act. Finally, the effect
for all types of conflict combined is robust to synthetic control estimation and associated inferential
techniques. The disaggregated conflict types are less robust to synthetic control estimation and in-
ference, but largely support the qualitative result that the Dodd-Frank Act dramatically increased
the prevalence of conflict within the DRC.
Additionally, when considering all countries covered by the Dodd-Frank Act the estimated
effects fall in both size and statistical significance. Therefore, there is no evidence that the Dodd-
Frank Act makes any sort of meaningful change—positively or negatively—in terms of the preva-
lence of conflict when pooling all covered countries together. As the DRC-specific analysis high-
lights, however, pooling all countries covered by the legislation together hides important hetero-
geneity in the country-specific effects. In some countries the prevalence of conflict increased, and in
36
others the prevalence of conflict decreased, due to passage of the Dodd-Frank Act. None of these
effects, however, come close to the magnitude of the estimated effects within the DRC and most
are not robust to permutation tests.
An supplementary investigation into the potential mechanisms driving these primary results
suggest that although the passage of the Dodd-Frank Act may have reduced the presence of armed
groups at 3T mineral mines, the legislation also reduced the number of workers employed by
3T mineral mines. These findings suggest that although both the feasibility and opportunity
cost mechanisms may be present in the DRC, consistent with the overall finding of unintended
consequences, the opportunity cost mechanism dominates. The passage of the Dodd-Frank Act
and in particular the DRC’s response to shut down all mineral exports from 2010 through 2011,
may have caused a labor market shock to the mineral industry. Households who rely on income
from working in the mineral mines may therefore struggle to find sufficient alternative activities.
In many parts of the rural areas in the DRC and surrounding countries the only alternatives to
work in mineral mines is subsistence agriculture or joining the militia (Seay 2012). This deepens
poverty, perpetuates socio-economic inequality, generates more motivation to perpetuate conflict.
Moreover, although the Dodd-Frank Act may have levied a shock in revenue earning of armed rebel
groups, these groups are able shift to alternative revenue streams.
This paper provides suggestive insight into the underlying causes of conflict in the DRC and
other countries in sub-Saharan Africa (Berman et al. 2017; Bazzi and Blattman 2014; Blattman
and Miguel 2010; Brunnschweiler and Bulte 2008; Collier and Hoeffler 2004).These results support
the notion that minerals may not necessarily cause conflict. Rather conflict may be driven by a
host of additional factors such as chronic poverty, socio-economic inequality, and weak political
institutions. While policies and norms that push the private sector toward more accountable
business practices are likely necessary, they are not sufficient. It seems likely that the Dodd-Frank
Act, while perhaps forming beneficial international norms regarding natural resource extraction
in the context of weak political institutions, has also made life much more difficult for many in
Africa’s Great Lakes Region. Ultimately, much of the conflict is rooted in years of ethnic tensions
and conflicts over rights and freedom.
The devastating reality seems to be that the Dodd-Frank Act fueled these pre-existing tensions.
Unfortunately, good intentions and a policy specifically designed to address the economic factors
believed to be associated with conflict has been largely ineffective. A particularly tricky aspect of
the direct policy implications of these results is that abolishing the ‘conflict mineral’ regulations
37
of the Dodd-Frank Act are unlikely to reverse the increase in conflict. As previously noted, many
large and influential companies have publicly stated that they plan on complying with ‘conflict
mineral’ regulations due to a perception of a market expectation for conflict-free products. This
being the case, a more successful version of this legislation could provide development assistance to
the mining communities adversely affected by the unintended consequences the Dodd-Frank Act.
Without this assistance, the negative impacts identified by this analysis may threaten to continue
in future years effectively perpetuating and deepening Africa’s deadliest conflict.
Building off the present research, future work could focus on understanding what actually causes
conflict in the DRC and surrounding countries. It is through understanding these dynamics that
truly beneficial public policies with the objective of mitigating conflict in Africa’s great lakes region
have the possibility of being designed and implemented. Future research could also do well to
focus on how to best support and assist those who are adversely affected by the labor market
consequences of economic sanctions.
38

Appendix
In this section, I will describe the tables and figures in the Appendix. Table 5 reports the
country-specific estimates for each of the covered countries under the Dodd-Frank Act. This in-
cludes the Democratic Republic of Congo (DRC), Angola, Burundi, Central African Republic,
Republic of Congo, Rwanda, Tanzania, Uganda, and Zambia. Each of these country-specific esti-
mates are reported within their own panel in Table 5. Additionally, Table 5 reports the 5th and
95th percentile from the permutation tests, described in Section 3 of the main manuscript.
Table 6 reports results from a robustness test that defines two alternative binary dependent
variables. The first alternative, shown in Panel A, equals 1 if a region had greater than 5 conflict
events within a given month. The second alternative, shown in Panel B, equals 1 if a region had
greater than 10 conflict events within a given month.
Figures 7 through 10 show the synthetic control estimates for each of the different types of
conflict. Figure 7 reports on violence against civilians. Figure 8 reports on rebel group battles.
Figure 9 reports on riots and protests. Finally, Figure 10 reports on deadly conflict. In each of
these figures Panel A show the synthetic DRC trend before and after the passage of the Dodd-Frank
Act and compares this trend to the actual probability of the given type of conflict within the DRC.
Panel B shows the gap between these two trends over time.
Figure 11 shows results from permutation tests supporting the estimation strategy reported
in Table 4, estimating the effect of enforcement suspension. Similar to Figure 3, in the main
manuscript, each panel in Figure 11 represents a distribution of placebo estimates for each out-
come variable: all types of conflict events, violence against civilians, rebel group battles, riots and
protests, and deadly conflict.
Figures 12 and 13 show results from a variation of equation (2) in the main manuscript with
a different time-frame. These results provide a test of the assumption that conflict in the DRC,
in Figure 12, and all covered countries pooled together, in Figure 13, would have followed a trend
along a path similar to other non-covered sub-Saharan African countries in the absence of the
suspension of enforcement of the legislation.
39

Table 5: Country-Specific Effects of Dodd-Frank on Conflict
Conflict, All Violence Against Rebel Group Riots and Protests Deadly ConflictTypes Civilians Battles
(1) (2) (3) (4) (5)
Panel A: Democratic Republic of Congo
Effect of Dodd-Frank 0.143*** 0.076*** 0.063*** 0.113*** 0.068***(0.007) (0.004) (0.002) (0.005) (0.005)
Observations 434,031 434,031 434,031 434,031 434,031R-squared 0.141 0.098 0.084 0.125 0.074
Panel B: Angola
Effect of Dodd-Frank -0.031*** -0.011* -0.005* -0.023*** -0.014*(0.007) (0.004) (0.002) (0.005) (0.005)
Observations 451,620 451,629 451,620 451,620 451,620R-squared 0.115 0.071 0.042 0.111 0.047
Panel C: Burundi
Effect of Dodd-Frank 0.034*** 0.033*** 0.001 0.036*** 0.005(0.007) (0.004) (0.002) (0.005) (0.005)
Observations 450,372 450,372 450,372 450,372 450,372R-squared 0.112 0.069 0.040 0.109 0.046
Panel D: Central African Republic
Effect of Dodd-Frank 0.072*** 0.060*** 0.030*** 0.022*** 0.055***(0.007) (0.004) (0.002) (0.005) (0.005)
Observations 437,580 437,580 437,580 437,580 437,580R-squared 0.116 0.074 0.045 0.112 0.051
Panel E: Republic of Congo
Effect of Dodd-Frank -0.027*** -0.011** -0.005 -0.018*** -0.013**(0.007) (0.004) (0.002) (0.005) (0.005)
Observations 433,836 433,836 433,836 433,836 433,836R-squared 0.115 0.071 0.042 0.112 0.047
Panel F: Rwanda
Effect of Dodd-Frank -0.003 0.005 -0.004 -0.012 -0.016**(0.007) (0.004) (0.002) (0.005) (0.005)
Observations 431,028 431,028 431,028 431,028 431,028R-squared 0.114 0.071 0.041 0.111 0.047
Panel G: Tanzania
Effect of Dodd-Frank -0.022** -0.008 -0.004 -0.018** -0.010(0.007) (0.004) (0.002) (0.005) (0.005)
Observations 454,896 454,896 454,896 454,896 454,896R-squared 0.113 0.070 0.041 0.110 0.046
Panel H: Uganda
Effect of Dodd-Frank -0.035*** -0.016*** -0.028*** -0.007 -0.034***(0.007) (0.004) (0.002) (0.005) (0.005)
Observations 452,556 452,556 452,556 452,556 452,556R-squared 0.114 0.071 0.045 0.114 0.049
Panel I: Zambia
Effect of Dodd-Frank -0.005 0.003 -0.003 -0.006 -0.011(0.007) (0.004) (0.002) (0.005) (0.005)
Observations 437,892 437,892 437,892 437,892 437,892R-squared 0.113 0.070 0.041 0.109 0.047
Placebo tests (other countries)5th percentile -0.042 -0.029 -0.010 -0.028 -0.02095th percentile 0.080 0.026 0.015 0.041 0.047
Geographic and time FEs Yes Yes Yes Yes Yes
Notes: The dependent variable is a binary variable indicating the existence of a conflict event at the 2nd subnationaladministrative area within a given month. Standard errors clustered at the country level are in parentheses. Bonferroniadjusted p-values are noted as follows *** p<0.01, ** p<0.05, * p<0.1.
40

Table 6: Effect of the Dodd-Frank Act, Alternative Dependent Variable Definitions and DRC Only
Conflict, All Violence Against Rebel Group Riots and Protests Deadly ConflictTypes Civilians Battles
(1) (2) (3) (4) (5)
Panel A: DV = 1 if > 5 Conflict Events
Effect of Dodd-Frank 0.039*** 0.017*** 0.009*** 0.013*** 0.019***(0.002) (0.000) (0.000) (0.001) (0.003)
Observations 433,992 433,992 433,992 433,992 433,992Baseline DRC mean 0.030 0.009 0.015 0.001 0.049Geographic and time FEs Yes Yes Yes Yes YesR-squared 0.132 0.117 0.070 0.067 0.059
Panel B: DV = 1 if > 10 Conflict Events
Effect of Dodd-Frank 0.019*** 0.005*** 0.003*** 0.002*** 0.013***(0.001) (0.000) (0.000) (0.001) (0.002)
Observations 433,992 433,992 433,992 433,992 433,992Baseline DRC mean 0.014 0.003 0.007 0.000 0.035Geographic and time FEs Yes Yes Yes Yes YesR-squared 0.085 0.048 0.047 0.040 0.049
Notes: The dependent variable is a binary variable indicating the existence of either more than 5 or ten conflict events atthe second sub-national administrative area within a given month. Standard errors clustered at the country level are inparentheses. Bonferroni adjusted p-values are noted as follows *** p<0.01, ** p<0.05, * p<0.1.
41

Figure 7: Synthetic Control, Violence Against Civilians
Notes: Panel A shows results of trends in the probability of conflict, within the DRC and the synthetic DRC,at the second sub-national level within each month from 2004 through 2016. Panel B shows the gap in theprobability of conflict at the second sub-national level within each month from 2004 through 2016 betweenthe DRC and the synthetic DRC.
42

Figure 8: Synthetic Control, Rebel Group Battles
Notes: Panel A shows results of trends in the probability of conflict, within the DRC and the synthetic DRC,at the second sub-national level within each month from 2004 through 2016. Panel B shows the gap in theprobability of conflict at the second sub-national level within each month from 2004 through 2016 betweenthe DRC and the synthetic DRC.
43
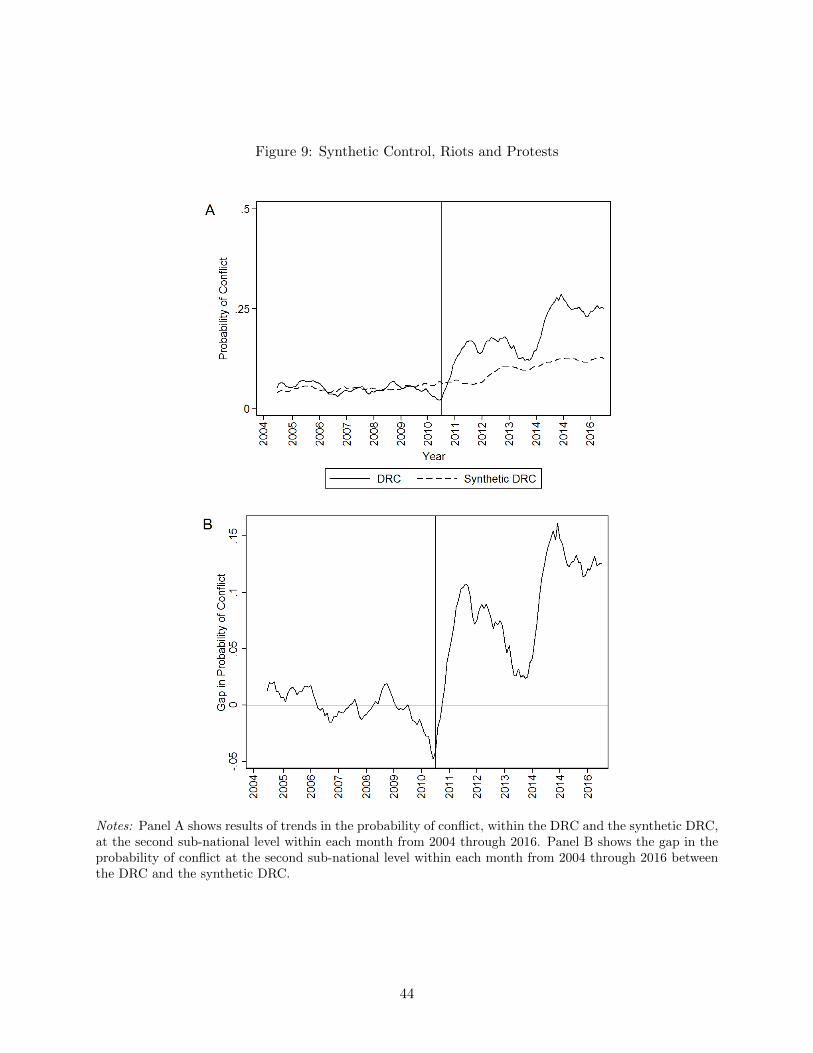
Figure 9: Synthetic Control, Riots and Protests
Notes: Panel A shows results of trends in the probability of conflict, within the DRC and the synthetic DRC,at the second sub-national level within each month from 2004 through 2016. Panel B shows the gap in theprobability of conflict at the second sub-national level within each month from 2004 through 2016 betweenthe DRC and the synthetic DRC.
44

Figure 10: Synthetic Control, Deadly Conflict
Notes: Panel A shows results of trends in the probability of conflict, within the DRC and the synthetic DRC,at the second sub-national level within each month from 2004 through 2016. Panel B shows the gap in theprobability of conflict at the second sub-national level within each month from 2004 through 2016 betweenthe DRC and the synthetic DRC.
45

Figure 11: Placebo Estimates from Permutation Tests, Enforcement Suspension and DRC Only
Notes: This figure shows country effects estimated from placebo permutation tests for each column in Table4. Each panel refers to a placebo test for each of the five outcome variables. Panel A refers to all conflict.Panel B refers to violence against civilians. Panel C refers to rebel group battles. Panel D refers to riots andprotests. Panel E refers to deadly conflict. In each graph, the solid line represents the point estimate whenthe DRC is “treated”. The dashed lines represent the 5th and 95th percentiles.
46

Figure 12: Year Specific Effect Sizes, Enforcement Suspension and DRC Only
Notes: Each panel refers to each of the five outcome variables. Panel A refers to all conflict. Panel B refersto violence against civilians. Panel C refers to rebel group battles. Panel D refers to riots and protests. PanelE refers to deadly conflict. In each graph, the dashed line represents when enforcement of the legislationwas suspended by the US SEC.
47

Figure 13: Year Specific Effect Sizes, Enforcement Suspension and All Covered Countries
Notes: Each panel refers to each of the five outcome variables. Panel A refers to all conflict. Panel B refersto violence against civilians. Panel C refers to rebel group battles. Panel D refers to riots and protests. PanelE refers to deadly conflict. In each graph, the dashed line represents when enforcement of the legislationwas suspended by the US SEC.
48
References
Abadie, A., Diamond, A., and Hainmueller, J. (2010) “Synthetic Control Methods for Comparative
Case Studies: Estimating the Effect of California’s Tobacco Control Program”, Journal of the
American Statistical Association, vol. 105, pp. 493-505.
Abadie, A., Diamond, A., and Hainmueller, J. (2015) “Comparative Politics and the Synthetic
Control Method”, American Journal of Political Science, vol. 59 (2), pp. 495-510.
Abadie, A., Athey, S., Imbens, G., and Wooldridge, J. (2017) “When Should You Adjust Standard
Errors for Clustering?” Working Paper, available online: https://arxiv.org/abs/1710.02926.
Autesserre, S. (2012) “Dangerous Tales: Dominant Narratives on the Congo and Their Unintended
Consequences”, African Affairs, vol. 111 (443), pp. 202-222.
Bazzi, S. and Blattman, C. (2014) “Economic Shocks and Conflict: Evidence from Commodity
Prices”, American Economic Journal: Macroeconomics, vol. 6 (4), pp. 1-38.
Bell, C. and Wlford, S. (2015) “Oil Discoveries, Shifting Power, and Civil Conflict”, International
Studies Quarterly, vol. 59 (3), pp. 517-530.
Bellemare, M.F. (2015) “Rising Food Prices, Food Price Volatility, and Social Unrest”, American
Journal of Agricultural Economics, vol. 97 (1), pp. 1-21.
Becker, G.S. (1968) “Crime and Punishment: An Economic Approach”, Journal of Political Econ-
omy, vol. 76 (2), pp. 169-217.
Berman, N., Couttenier, M., Rohner, D., and Thoenig, M. (2017) “This Mine is Mine! How
Minerals Fuel Conflicts in Africa”, American Economic Review, vol. 107 (6), pp. 1564-1610.
Bertrand, M., Duflo, E., and Mullainathan, S. (2004) “How much should we trust differences-in-
differences estimates?” Quarterly Journal of Economics, vol. 119, no. 1, pp. 249-275.
Besley, T. and Persson, T. (2010) “State Capacity, Conflict, and Development”, Econometrica,
vol. 78, pp. 1-34.
Besley, T. and Persson, (2011) “The Logic of Political Violence”, Quarterly Journal of Economics,
vol. 126 (3), pp. 1411-1445.
Blattman, C. and Miguel, E. (2010) “Civil War” Journal of Economic Literature, vol. 48, issue 1,
pp. 3-57.
Brunnschweiler, C.N. and Bulte, E.H. (2008) “Linking National Resources to Slow Growth and
More Conflict” Science, 320, pp. 616-617.
Brunnschweiler, C.N. and Bulte, E.H. (2009) “Natural resources and violent conflict: Resource
49

abundance, dependence, and the onset of civil wars” Oxford Economic Papers, vol. 61, pp. 651-
674.
Buchmueller, T.C. Dinardo, J., and Valletta, R.G. (2011) “The Effect of an Employer Health
Insurance Mandate on Health Insurance Coverage and the Demand for Labor: Evidence from
Hawaii”, American Economic Journal: Economic Policy, vol. 3, pp. 25-51.
Caselli, F. and Colleman, W. (2013) “On the Theory of Ethnic Conflict”, Journal of the European
Economic Association, vol. 11, pp. 161-192.
Christian, P. and Barrett, C. (2017) “Revisiting the effect of food aid on conflict: A methodological
caution”, World Bank Policy Research Working Paper, No. WPS8171.
Collier, P. Hoeffler, S. (1998) “On Economic Causes of Civil War”, Oxford Economic Papers, vol.
50 (4), pp. 563-573.
Collier, P., Elliot, V.L., Hegre, H., Hoeffler, A., Reynal-Querol, M. and Sambanis, N. (2003) Break-
ing the Conflict Trap: Civil War and Development Policy, World Bank and Oxford University
Press.
Collier, P. and Hoeffler, S. (2004) “Greed and Grievance in Civil War” Oxford Economic Papers,
vol. 56, pp. 564-595.
Collier, P. Hoeffler, A., and Rohner, D. (2009) “Beyond Greed and Grievance: Feasibility and Civil
War”, Oxford Economic Papers, vol. 61 (1), pp. 1-27.
Cuvelier, J. Van Bockstael, Vlassenroot, K., and Iguma, C. (2014) Analyzing the Impact of the
Dodd-Frank Act on Congolese Livelihoods, Social Science Research Council, New York, NY.
Cunningham, S. and Shah, M. (2018) “Decriminalizing Indoor Prostitution: Implications for Sex-
ual Violence and Public Health”, Review of Economic Studies, vol. 85 (3), pp. 1683-1715.
Dal Bo, E. and Dal Bo, P. (2011) “Workers, Warriors, and Criminals: Social Conflict in General
Equilibrium”, Journal of the European Economic Association, vol. 9 (4), pp. 646-677.
de Koning, R. (2010) “The mining ban in the Democratic Republic of the Congo: Will soldiers
give up the habit?”, Stockholm International Peace Research Institute.
Dube, O. and Naidu, S. (2015) “Bases, Bullets, and Ballots: The Effect of US Military Aid on
Political Conflict in Columbia”, Journal of Politics, vol. 77 (1), pp. 249-267.
Dube, O. and Vargas, J.F. (2013) “Commodity Price Shocks and Civil Conflict: Evidence from
Colombia”, Review of Economic Studies, vol. 80 (4), pp. 1384-1421.
Draginis, H. (2016) “Point of Origin: Status Report on the Impact of Dodd-Frank 1502 in Congo”,
Enough Project.
50
Ehrlich, I. (1973) “Participation in Illegitimate Activities: A Theoretical and Empirical Investiga-
tion”, Journal of Political Economy, vol. 81 (3), pp. 521-565.
Enough Project (2009) “A Comprehensive Approach to Congo’s Conflict Minerals” A Strategy
Paper, April 24, 2009.
Fisher, R.A. (1935) The Design of Experiments, Oliver and Boyd, Edinburgh, UK.
Fearon, J.D. (2005) “Primary Commodity Exports and Civil War”, Journal of Conflict Resolution,
vol. 49 (4), pp.483-507.
Fearon, J.D. and Laitin, D. (2003), “Ethnicity, Insurgency, and Civil War”, American Political
Science Review, vol. 97 (1), pp. 75-90.
Frankel, T.C. (2017) “Why Apple and Intel don’t want to see the conflict minerals rule rolled
back”, The Washington Post, February 23, 2017.
Geenen, S. (2012) “A dangerous bet: The challenges of formalizing artisanal mining in the Demo-
cratic Republic of Congo”, Resources Policy, vol. 37 (3), pp. 322-330.
Geenen, S. (2017) “Trump is right on Congo’s minerals, but for all the wrong reasons”, The
Conversation, February 22, 2017.
Grossman, S. (1991) “A General Equilibrium Model of Insurrections”, American Economic Review,
vol. 81 (4), pp. 912-921.
Grossman, H., and Mendoza, J. (2003) “Scarcity and Appropriative Competition”, European Jour-
nal of Political Economy, vol. 19 (4), pp. 747-758.
Hirshlelfer, J. (1995), “Anarchy and Its Breakdown”, Journal of Political Economy, vol. 103 (1),
pp. 26-52.
Hodler, R. (2006) “The Curse of Natural Resources in Fractionalized Countries”, European Eco-
nomic Review, vol. 50 (6), pp. 1367-1386.
Humphreys, M. (2015) “Natural Resources, Conflict, and Conflict Resolution: Uncovering the
Mechanisms”, Journal of Conflict Resolution, vol. 49 (4), pp. 508-537.
Janus, T. (2012) “Natural resource extraction and civil conflict”, Journal of Development Studies,
vol. 97, pp. 24-31.
Koren, O. (2018) “Food Abundance and Violent Conflict in Africa”, American Journal of Agri-
cultural Economics, vol. 100 (4), pp. 981-1006.
Le Billon, P. (2001) “The Political Ecology of War: Natural Resources and Armed Conflict”,
Political Geography, vol. 20 (5), pp. 561-584.
Lezhnev, S. and Prendergast, J. (2009) “From mine to mobile phone: The conflict minerals supply
51
chain”, Enough Project.
Lopez, E. and Burt, A. (2017) “SEC suspends conflict mineral rule enforcement”, Supply Chain
Dive, April 11, 2017.
Lujala, P. (2010) “The Spoils of Nature: Armed Civil Conflict and Rebel Access to Natural
Resources” Journal of Peace Research, vol. 47, pp. 15-28.
Lynch, S. (2017) “SEC halts some enforcement of conflict minerals rule amid review”, Reuters,
April 7, 2017.
Maystadt, J-F., De Luca, G., Sekeris, P.G., and Ulimwengu, J. (2014) “Mineral Resources and
Conflicts in DRC: A case of ecological fallacy?” Oxford Economic Papers, vol. 66, pp. 721-749.
Nunn, N. and Qian, N. (2014) “US Food Aid and Civil Conflict”, American Economic Review,
vol. 104 (6), pp. 1630-1666.
Parker, D. and Vadheim, B. (2017) “Resource Cursed or Policy Cursed? US Regulation of Conflict
Minerals and Violence in the Congo” Journal of the Association of Environmental and Resource
Economists, vol. 4 (1) pp. 1-49.
Parker, D., Foltz, J.D., and Elsea, D. (2016) “Unintended Consequences of Sanctions for Human
Rights: Conflict Minerals and Infant Mortality” Journal of Law and Economics, vol. 59, pp.
731-774.
Radley, B. and Vogel, C. (2015) “Fighting windmills in eastern Congo? The ambiguous impact of
the “conflict minerals” movement”, Extractive Industries and Society, vol. 2 (3), pp. 406-410.
Raghavan, S. (2014) “How a well-intentioned U.S. law left Congolese miners jobless”, The Wash-
ington Post, November 30, 2014.
Raleigh, C., Linke, A., Hegre, H., and Karlsen, J. (2010) “Introducing ACLED: An Armed Conflict
Location and Event Dataset”, Journal of Peace Research vol. 47 (5), pp. 651-660.
Reuveny, R. and Maxwell, J. (2001) “Conflict and Renewable Resources”, Journal of Conflict
Resolution, vol 45 (6), pp. 719-742.
Ross, M. (2004) “What Do We Know about Natural Resources and Civil War?”, Journal of Peace
Research, vol. 41 (3), pp. 337-356.
Ross, M. (2006) “A Closer Look at Oil, Diamonds, and Civil War” Annual Review of Political
Science, vol. 9, pp. 265-300.
Sarsons, H. (2015) “Rainfall and conflict: A cautionary tale” Journal of Development Economics,
vol. 115 pp. 62-72.
Seitzinger, M. and Ruane, K.A. (2015) “Conflict Minerals and Resource Extraction: Dodd-Frank,
52

SEC Regulations, and Legal Challenges, Congressional Research Service Report 7-5700.
Seay, L. (2012) “What’s Wrong with Dodd-Frank 1502? Conflict Minerals, Civilian Livelihoods,
and the Unintended Consequences of Western Advocacy” Center for Global Development, Working
Paper 284.
SEC (2017) “Reconsideration of Conflict Minerals Rule Implementation”, U.S. Securities and
Exchange Commission, Public Statement, January 31, 2017.
Spagat, M., Mack, A., Cooper, T., and Kreutz, J. (2009) “Estimating War Deaths: An Area of
Contestation” Journal of Conflict Resolution, vol. 53, issue 6, pp. 934-950.
Stearns, J. (2012) Dancing in the Glory of Monsters: The Collapse of the Congo and the Great
War of Africa, Public Affairs, New York, NY.
Stearns, J. (2014) “Causality and conflict: Tracing the origins of armed groups in the eastern
Congo”, Peacebuilding, vol. 2 (2), pp. 157-171.
Stoop, N. Verpoorten, M. and van der Windt, P. (2018a) “More Legislation, More Violence? The
Impact of Dodd-Frank in the DRC”, PLoS ONE, vol. 13, (8), e0201783.
Stoop, N Verpoorten, M. and van der Windt, P. (2018b) “Trump threatened to suspend the ‘conflict
minerals’ provision of Dodd-Frank. That might actually be good for Congo.” The Washington
Post, September 27, 2018
Vogel, C. and Raeyaekers, T. (2016) “Terr(it)or(ies) of Peace? The Congolese Mining Frontier and
the Fight Against ‘Conflict Minerals’”, Antipode, vol. 48 (4), pp. 1102-1121.
World Bank (2008) “Democratic Republic of Congo Growth with Governance in the mining sector”,
Report no. 43402-ZR.
53