Good Habits for Successful Gradient Separations€¦ · Good Habits for Successful Gradient...
42
Good Habits for Successful Gradient Separations Getting the most from your method April 2, 2014 Confidentiality Label 1
Transcript of Good Habits for Successful Gradient Separations€¦ · Good Habits for Successful Gradient...
Good Habits for Successful Gradient Separations
Getting the most from your
method
April 2, 2014
Confidentiality Label
1
Good Habits for Successful Gradient Separations
Developing good gradient habits is the key to long term
success. In this session we will start by discussing what it takes
to maximize gradient efficiency by balancing gradient speed
with adequate resolution needs. Since even the best gradient
can be compromised we are going to look at optimizing LC
system performance by minimizing un-needed physical volume,
making full use of system functions for maximum efficiency and
understanding the gradient delay volume effect on
performance. Last, but not least we will demonstrate
successfully transferring gradients from one instrument to
another.
April 2, 2014
Confidentiality Label
2

Good Habits for Successful Gradient Separations
Gradient methods are very popular
Optimize speed, efficiency, Rs
and LC for gradient methods
Achieve the shortest, most
productive methods
April 2, 2014
Confidentiality Label
3

Good Habits for Successful Gradient Separations
April 2, 2014
Confidentiality Label
4
Maximizing gradient efficiency – balancing speed and resolution
Choosing and optimizing LC system performance for gradients
Transferring gradients from one column or LC to another

Gradient Elution – So Many Questions!
What is gradient elution?
When should I use a gradient separation?
What parameters affect a gradient
separation?
How can I use these parameters to improve
my gradient separation?
What can I do to make a gradient method rugged?
What do I need to know about my instrument for
the best results?
Page 5

Gradient HPLC Separation of Phenolic Compounds in Olive Oil – Traditional Column
April 2, 2014
Confidentiality Label
6
Column: Eclipse Plus C18, 4.6 x 250mm, 5um Mobile Phase: A: water +0.2% H3PO4 B: Methanol C:
Acetonitrile
Gradient: see below
Post Time: 20 min Flow Rate; 1mL//min
Injection Volume: 6uL
Temp 25°C
Autosampler Temp: 6°C
DAD : 280 nm
Peak Width:>0.025 minutes (10Hz)
Time
(min)
%A (Water +
0.2% H3PO4
%B
(Methanol)
%C
(ACN)
0.0 96% 2% 2%
40 50% 25% 25%
45 40% 30% 30%
60 0% 50% 50%
70 0% 50% 50%
72 96% 2% 2%
The old approach! Long column, long
analysis!

Gradient HPLC Separation of Phenolic Compounds in Olive Oil – UHPLC Column
April 2, 2014
Confidentiality Label
7
Column: Eclipse Plus C18, 3.0 x 100mm, 1.8um Mobile Phase: A: water +0.2% H3PO4 B: Methanol C:
Acetonitrile
Gradient: see below
Post Time: 7.5 min Flow Rate; 0.6 mL/min
Injection Volume: 8.5uL
Temp 25°C
Autosampler Temp: 6°C
DAD : 280 nm
Peak Width:>0.013minutes (20Hz)
Time
(min)
%A (Water +
0.2% H3PO4
%B
(Methanol)
%C
(ACN)
0.0 96% 2% 2%
11 50% 25% 25%
13 40% 30% 30%
17 0% 50% 50%
20 0% 50% 50%
20.5 96% 2% 2%
Save 64 min per run and improve resolution!

What Habits do we Need to Get from Too Long to Short and Efficient Gradient Results
Selecting a more time efficient column – shorter, smaller particle size
• Reduce analysis time
• Reduce re-equilibration time, use appropriate post time
Optimize the gradient
• Achieve maximum resolution in the minimum time
• Consider the complete gradient range
Optimize the LC
• Are LC parameters set correctly?
• Is it configured to deliver the rapid results you need?
April 2, 2014
Confidentiality Label
8

Gradients are Critical Tools for Faster Methods
• Gradients provide faster method development
• Run a scouting method 5% to 95% organic (reversed phase)
• Evaluate whether gradient or isocratic method is best
• Quick evaluation: how much of the gradient is occupied
min 1 2 3 4
mAU
0
50
100
150
min 1 2 3 4
mAU
0
50
100
150
Ideal for Gradient Method
Ideal for Isocratic Method

min 2 4 6 8 10 12 14
Step 1: Choose, Shorter Efficient Column and do Gradient Scouting from 5%B-100% in 15min
Sample: 1. Aldicarb sulfoxide,
2. Oxamyl, 3. Methomyl, 4. Aldicarb
sulfone, 5. Carbofuran-3-hydroxy,
6. Aldicarb, 7. Propoxur,
8. Carbofuran, 9. Carbaryl,
10. Methiocarb, 11. 11. ISTD (BDMC)
Column: Poroshell 120 EC-C18
4.6 x 100 mm, 2.7 m
Gradient Time: 15 min
Mobile Phase: A: H2O B: Acetonitrile
Gradient Range: 5-100% = 95%
Flow Rate:1.0 mL/min
The scouting shows that there is wasted time in this chromatogram and
resolution of all components can be achieved. Optimization possible!
min 2 4 6 8 10 12 14
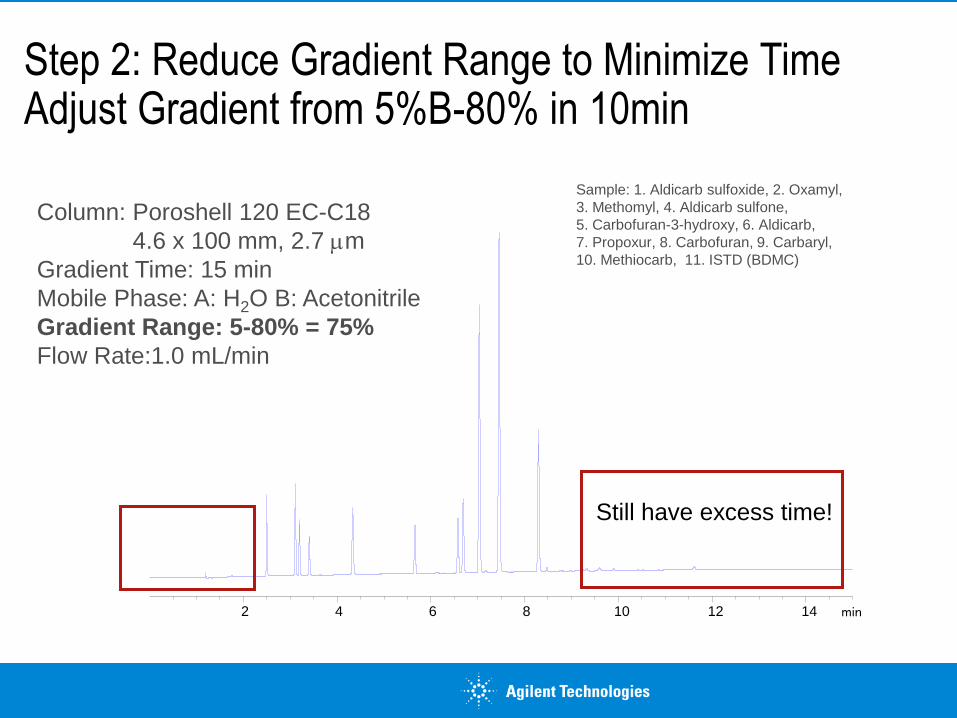
Step 2: Reduce Gradient Range to Minimize Time Adjust Gradient from 5%B-80% in 10min
Sample: 1. Aldicarb sulfoxide, 2. Oxamyl,
3. Methomyl, 4. Aldicarb sulfone,
5. Carbofuran-3-hydroxy, 6. Aldicarb,
7. Propoxur, 8. Carbofuran, 9. Carbaryl,
10. Methiocarb, 11. ISTD (BDMC)
Column: Poroshell 120 EC-C18
4.6 x 100 mm, 2.7 m
Gradient Time: 15 min
Mobile Phase: A: H2O B: Acetonitrile
Gradient Range: 5-80% = 75%
Flow Rate:1.0 mL/min
Still have excess time!

Step 3: Finalize Your Results - Increase Starting % Organic and Reduce time
April 2, 2014
Confidentiality Label
12
min 1 2 3 4 5
Column: Poroshell 120 EC-C18
4.6 x 100 mm, 2.7 µm
Gradient:15 – 80%B = 65%
in 5 minutes
Mobile Phase: A:H2O B: Acetonitrile
Flow Rate: 1.0 mL/min
Temperature: 20°C
Sample: Carbamates
Sample: 1. Aldicarb sulfoxide, 2. Oxamyl,
3. Methomyl, 4. Aldicarb sulfone,
5. Carbofuran-3-hydroxy, 6. Aldicarb,
7. Propoxur, 8. Carbofuran, 9. Carbaryl,
10. Methiocarb, 11. ISTD (BDMC)
Saved 50% of the time with method optimization. Used Poroshell 120 for
high efficiency and resolution.

Shorter Columns are Good Choices -Save Time and May Not Compromise Resolution
Page 13
Poroshell 120 EC-C18
4.6 x 100 mm, 2.7 m
N = 22,000
Poroshell 120 EC-C18
4.6 x 50 mm, 2.7 m
N = 11,000
Gradient: 15 – 80%B in 5 min
Mobile Phase: A:H2O
B: Acetonitrile
Flow Rate: 1.0 mL/min
Temperature: 20°C
Sample: Carbamates
1
4
5 6
7,8
9
10
11
1
2,3
4
5 6
7,8
9
10
11
2
3
min 0.5 1 1.5 2 2.5 3 3.5 4 4.5 min 1 2 3 4 5
Because the gradient time was kept to 5 minutes, the Rs was maintained and
the analysis time reduced (Vm increased).
Analysis Time: 5.2 min
Reequilibration: 6 min
Total: 11.2 min
Analysis Time: 4.0 min
Reequilibration: 3 min
Total: 7 min

min 1 2 3 4 5 6 7 8 9
Gradient Scouting Works for any Sample – Gradient from 5%-100% in 10min for Acetaminophen
Column: Poroshell 120 EC-C18, 4.6x50mm 2.7um
Separation takes place over shorter organic
range than 100%! Wasted time!
Mobile Phase: A: 10 mM ammonium acetate, pH 6.8; B: Acetonitrile
Flow Rate: 1.5 mL/min
Temperature: 30°C
Sample:
1.4-aminophenol
2.Acetaminophen
3.4-propionamidophenol
4.2-acetamidophenol
5.4’-acetoxyacetanilide
6.4-chloroacetanilide
7.2’-hydroxyacetophenone

Optimizing Gradient from 5%-50% in 5min to Reduce Wasted Time
min 0.5 1 1.5 2 2.5 3 3.5 4 4.5
Column: Poroshell 120 EC-C18, 4.6x50mm, 2.7um
Excellent resolution and distribution of peaks in the gradient – within 5 minutes.
Mobile Phase: A: 10 mM ammonium acetate, pH 6.8; B: Acetonitrile
Flow Rate: 1.5 mL/min
Temperature: 30°C
Sample:
1.4-aminophenol
2.Acetaminophen
3.4-propionamidophenol
4.2-acetamidophenol
5.4’-acetoxyacetanilide
6.4-chloroacetanilide
7.2’-hydroxyacetophenone

Final Optimization to Reduce Time - Gradient from 5%-50% in 3 min
min 0.5 1 1.5 2 2.5 3 3.5
Column: Poroshell 120 EC-C18, 4.6x50mm, 2.7um
Mobile Phase: A: 10 mM ammonium acetate, pH 6.8; B: Acetonitrile
Flow Rate: 1.5 mL/min
Temperature: 30°C
Sample:
1.4-aminophenol
2.Acetaminophen
3.4-propionamidophenol
4.2-acetamidophenol
5.4’-acetoxyacetanilide
6.4-chloroacetanilide
7.2’-hydroxyacetophenone
Adapting Gradient Methods to Different Columns
1. Determining conditions based on “gradient
equation”
2. Practical dwell/delay volume and other
instrument considerations
Page 17

1. Adapting Gradient Methods to Different Column Dimensions
Page 18
To adjust gradient methods to different column
dimensions keep gradient steepness (b) the same.
S Vm
tG F
1/k* = b = gradient steepness
If “b” is kept constant from run-to-run peaks will elute in the
same relative pattern.
S = constant
= change in % organic
during the gradient run
Vm = void volume of column
F = flow rate
tG = gradient time
k* = k of solute at mid point
of column

1. Adjusting a Gradient from a 4.6 x 150 mm Column to a 2.1 x 100 mm Column
Page 19
4.6 x 150 mm 2.1 x 100 mm
ΔФ = 40 (20% - 60%)
Vm = 1.5 mL
F = 1.0 mL/min
tG = 15 min
ΔФ = 40 (20% - 60%)
Vm = 0.2 mL
F = 0.2 mL/min
tG = ? (10 min)
ΔФ • Vm
F • tG
40 • 1.5
1.0 • 15
= = 4
Using b = 4 Using new dimensions
Solve for tG 40 • 0.2
0.2 • tG
40 • 0.2
0.2 • 4
= = = 4 10 min tG
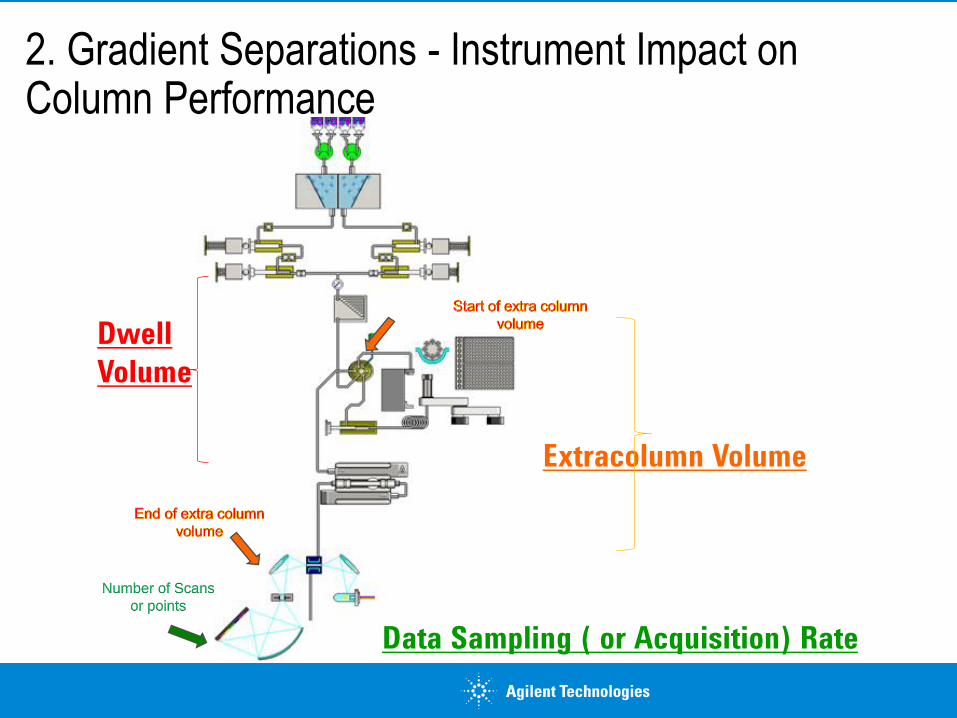
2. Gradient Separations - Instrument Impact on Column Performance
Extracolumn Volume
.
.
Data Sampling ( or Acquisition) Rate
Number of Scans
or points
Dwell
Volume

Instrument Impact on Column Performance
.
.
Number of Scans
or points
Dwell
Volume
#1 Dwell Volume
• Dwell volume = volume from formation of
gradient to the column

Minor Dwell Volume Differences Can Change Resolution
Page 22
VD = 0.43
mL
Column: ZORBAX Rapid Resolution Eclipse XDB-C8 4.6 x 75 mm, 3.5 µm
Mobile Phase: Gradient, 0 - 100 %B in 52.5 min.
A: 5/95 methanol/ 25 mM phosphate pH 2.50 B: 80/20 methanol/25 mM phosphate pH 2.50
Flow Rate: 0.5 mL/min
Temperature: 25°C
Injection: 5 L
Detection: 250 nm
Sample: Mixture of antibiotics and antidepressants
Upper trace simulates actual run data entered into DryLab® 3.0 software
Lower trace is simulated chromatogram for larger VD
VD = 2.0
mL
0 10 20 30 40
0 10 20 30 40

Determining the Dwell Volume of Your System
Look it up in the LC manual or……
Replace column with short piece of HPLC stainless steel tubing
Prepare mobile phase components A. Water - UV-transparent B. Water with 0.2% acetone - UV-absorbing
Monitor at 265 nm
Adjust attenuation so that both 100% A and 100% B are on scale
Run gradient profile 0 - 100% B/10 min at 1.0 ml/min
Record
Expected Dwell Volume in UHPLC’s – uL range!
Page 23

Measuring Dwell Volume (VD)
Page 24
Best straight
line fit through
linear trace
Extension of original baseline
tD
• Intersection of the two lines identifies dwell time (tD)
• Dwell volume is equal to product of the flow rate and the dwell time.
VD = tD x F 0 10 20
Time (min)

2. Gradient Separations- Instrument Impact on Column Performance
.
Extra-column
Volume
.
Number of Scans
or points

How Does Instrument Design Effect Performance?
• The Flow Path the Sample “Sees” from injection to Detection
Contributes to Dispersion and Peak Broadening
• Limiting excess volume will greatly reduce dispersion impact
on performance
• UHPLCs (Agilent 1290 Infinity) are already optimized for
Sub-2um , Poroshell and HPLC column performance
• Have options for ULD (ultra-low dispersion)
• What about other instruments?
1290 Infinity UHPLC

Comparison of 1290 Gradient Performance
April 2, 2014
Confidentiality Label
27
Binary Pump
Binary Pump
Autosampler
Diode Array Detector
Diode Array Detector
Solvent Tray
Solvent Tray
LC/MS LC/MS
Optimized 1290 LC Default 1290 LC
Needle Seat Capillary: 0.11 x 100 mm = 0.9 µL
ALSTCC Capillary: 0.08 x 220 mm = 1.1 µL
TCCDAD Capillary: 0.08 x 220 mm = 1.1 µL
Flow Cell V(σ)0.6 µL = 0.8 µL
TCCMS Capillary: 0.08 x 220 mm = 1.1 µL
2.1 x 50 mm Column = 172.3 µL
Void Volume of Column = 103.9 µL
Needle Seat Capillary: 0.12 x 100 mm = 1.1 µL
ALSTCC Capillary: 0.12 x 340 mm = 3.8 µL
TCCDAD Capillary: 0.12 x 220 mm = 2.5 µL
Flow Cell V(σ)1.0 µL = 2.3 µL
TCCMS Capillary: 0.12 x 340 mm = 3.8 µL
2.1 x 50 mm Column = 172.3 µL
Void Volume of Column = 103.9 µL
Autosampler
Column Compartment
Column Compartment
LC/UV systems extra column volume is reduced by 60% (from 9.7 to 3.9uL)
LC/MS system extra column volume is reduced by 64% (from 8.7 to 3.1 uL)
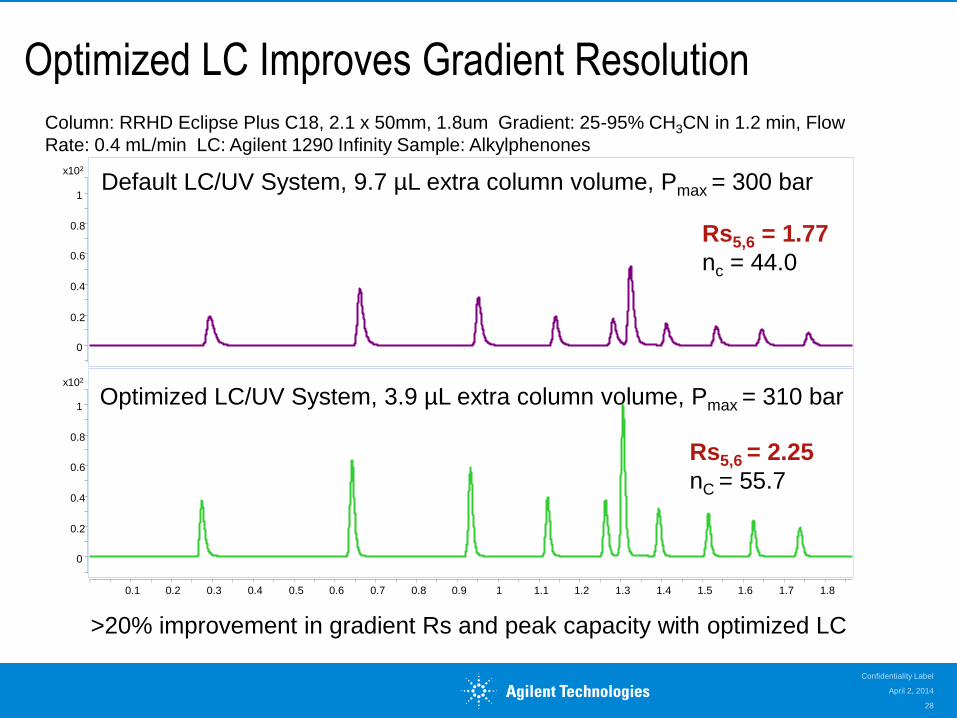
Optimized LC Improves Gradient Resolution
April 2, 2014
Confidentiality Label
28
Optimized LC/UV System, 3.9 µL extra column volume, Pmax = 310 bar
Default LC/UV System, 9.7 µL extra column volume, Pmax = 300 bar
x102
0
0.2
0.4
0.6
0.8
1
x102
0
0.2
0.4
0.6
0.8
1
0.1 0.2 0.3 0.4 0.5 0.6 0.7 0.8 0.9 1 1.1 1.2 1.3 1.4 1.5 1.6 1.7 1.8
Rs5,6 = 1.77
nc = 44.0
Column: RRHD Eclipse Plus C18, 2.1 x 50mm, 1.8um Gradient: 25-95% CH3CN in 1.2 min, Flow
Rate: 0.4 mL/min LC: Agilent 1290 Infinity Sample: Alkylphenones
Rs5,6 = 2.25
nC = 55.7
>20% improvement in gradient Rs and peak capacity with optimized LC

Tubing Volume
Tubing Length 10mm 50mm 100mm 150mm
Tubing i.d. Volume Volume Volume Volume
0.17mm (green) 0.227 uL 1.1uL 2.27 uL 3.3 uL
0.12mm (red) 0.113 uL 0.55uL 1.13 uL 1.65 uL

Dispersion in the Tubing
Dispersion Calculation
σt2 = π2r6Lu/24Dm
Dispersion in the tubing is proportional to the
• Length of tubing
• 6th power of the tube radius
Shortest tubing lengths possible minimize dispersion
Small changes in tubing i.d. have major effects on peak
width and efficiency
Month ##, 200X
Group/Presentation Title
Agilent Restricted

Conversion for Fast and Ultra-Fast HPLC 1200 through 1260 Series LC Systems
High pressure
Gradient pump
Std or Well
Plate sampler
Diode Array
Detector
Standard assembly
without standard mixer
0.12 x 400 mm capillary
Mass
Spectrometer
0.12 x XX mm PEEK Capillary
High pressure
Gradient pump
Std or Well
Plate sampler
Rapid Resolution
HT Column
Diode Array
detector
Waste
0.17 x 400 mm capillary
0.17 x 150 mm capillary
0.17 x 105 mm capillary
3 L
heat exchanger
Thermostatted
Column
compartment
Traditional LC Columns Fast LC/UHPLC Columns
Rapid Resolution
HT Column
0.12 x 150 mm capillary
0.12 x 105 mm capillary
3 L
heat exchanger
Thermostatted
Column
compartment

Optimizing Connecting Tubing Volume For UHPLC Columns
min 0.5 1 1.5 2 2.5
mAU
0
100
200
350
400
550
600 System Tubing Volume Optimized
0.12mm i.d. tubing
Peak width 0.018 min
Peak width 0.019 min
Resolution 1.902
min 0.5 1 1.5 2 2.5
mAU
0
100
200
300
400
System Tubing Volume Not Optimized
0.17mm i.d. tubing
Peak width 0.038 min
Peak width 0.037 min
Resolution 0.961

Smaller Column i.d. Requires a Lower Detector Cell Volume
April 2, 2014
Confidentiality Label
33
Black – 14 uL flow cell
3 x 100mm Column
Blue – 5 uL flow cell

2. Gradient Separations - Instrument Impact on Column Performance
.
Data Sampling (or Acquisition) Rate
.
Number of Scans
or points

Effect of Data Acquisition Rate (time constant) High definition UHPLC Requires High Definition Chromatogram
min 0.1 0.2 0.3 0.4 0.5 0
80Hz
PW=0.30sec
40Hz
PW = 0.33 sec
20 Hz
PW=0.42sec
10Hz
PW=0.67sec
5Hz PW=1.24sec
• Increased Data Rate
• More Accurate “ Picture”
• Make Sure Rate is
Adequate
• Faster Rates Generate
More Noise and Take up
More Memory

Solve Apparent Rs Problems with Optimum Data Collection Rate
min 0 0.1 0.2 0.3 0.4 0.5
mAU
0
20
40
60
80
100
min 0 0.1 0.2 0.3 0.4 0.5
mAU
0
10
20
30
40
50
Peak width = 0.017min at 80Hz
Peak width = 0.021min at
10Hz

Very Fast Gradients Benefit From Very Fast Scan MS with 40 Cycle/s, 5-90%B Gradient in 0.65min
0.05 0.10 0.15 0.20 0.25 0.30 0.35 0.40 0.45 0.50 0.55
0.60 Time, min
0.0
5.0e4
1.0e5
1.5e5
2.0e5
2.5e5
3.0e5
3.5e5
4.0e5
4.5e5
5.0e5
5.5e5
6.0e5
6.5e5
7.0e5
Inte
nsity
, cps
0.34s
0.36s
0.36s 0.42s
0.36s
Atenolol
Metoprolol
Primidone
Verapamil
Beclomethasone-
dipropionate
H2O/ACN
Flow =1.8ml/min
5-90%B in 0.5min
Stop time =0.65min
80°C, ACR
MS 40Hz
100-1000Da
Peak capacity of >40 in 39 sec in the MS chromatogram

Why Use Short, Low Volume Columns for Gradient Analysis
Fast analyses with fast gradients can be done on short, low
volume columns
Fast re-equilibration can be achieved, so gradient separations
take no additional time
Short columns with small particle sizes do not compromise
resolution (N)
High-throughput, screening separations are possible with
unknown samples
Page 38
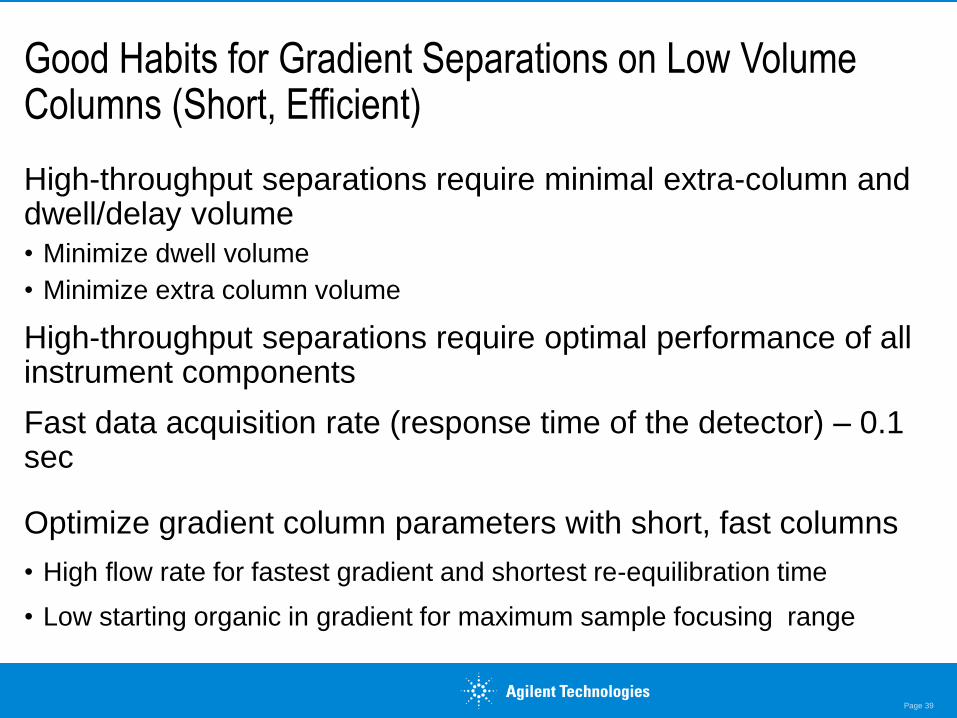
Good Habits for Gradient Separations on Low Volume Columns (Short, Efficient)
High-throughput separations require minimal extra-column and dwell/delay volume
• Minimize dwell volume
• Minimize extra column volume
High-throughput separations require optimal performance of all instrument components
Fast data acquisition rate (response time of the detector) – 0.1 sec
Optimize gradient column parameters with short, fast columns
• High flow rate for fastest gradient and shortest re-equilibration time
• Low starting organic in gradient for maximum sample focusing range
Page 39

Putting it All Together – High Performance Gradient Separations
Short, high efficient columns
Optimize your instrumentation
High flow rates
Result = high performance gradients
Page 40

Ultra-fast Gradient Analysis of 9 Alkylphenones
Page 41
min 0 0.2 0.4 0.6 0.8 1
1
2 3
4
5
6
7
8
9
mAU
0
200
400
Flow Rate 2.6ml/min
Temp. 32°C
Pressure 346 bar
CycleTime 1.5 min
Run Time 1.2 min
Analysis T. 0.912 min
Rs (4,5) 2.76
RT% RSD <0.2%.
Chromatographic conditions
Column: 4.6x50mm Zorbax StableBond-C18, 1.8µm
Injection: 1 µL
Separation: Mobile phase: A: water + 0.1% HCOOH; B: acetonitrile + 0.1% HCOOH.
Gradient: from 50% B to 100% B in 0.65 min, hold over 0.2 min.
Stop time = 1.2 min.
Sample: alkylphenones and acetanilide (100 ng/µL each) consisting of: 1 acetanilide, 2 acetophenone, 3 propiophenone, 4 butyrophenone,
5 benzophenone, 6 valerophenone, 7 hexanophenone, 8 heptanophenone and 9 octanophenone
Temperature: 32 °C
DAD detection: UV signal = 245 nm, 10 nm Reference = 360 nm, 80 nm
Slit: 8 nm
Peak width (response time): < 0.01 min (0.1 sec), i.e. 20 Hz data acquisition rate
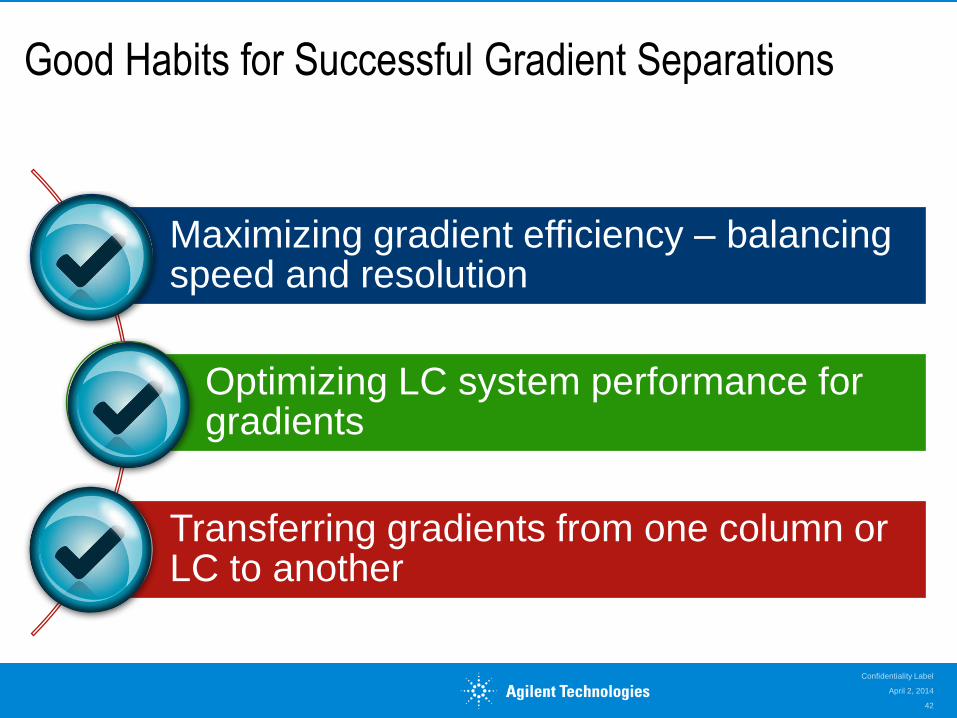
Good Habits for Successful Gradient Separations
April 2, 2014
Confidentiality Label
42
Maximizing gradient efficiency – balancing speed and resolution
Optimizing LC system performance for gradients
Transferring gradients from one column or LC to another