“Good Enough” Risk Adjustment Models for Physician …€œGood‐Enough” Risk Adjustment...
31
“Good‐Enough” Risk Adjustment Models for Physician Payment and Performance Assessment Randall Ellis 1,2 , Arlene S Ash 3,2 , Juan Gabriel Fernandez 4 1 Boston University; 2 Verisk Health, Inc; 3 University of Massachusetts Medical School 4 June 20, 2015
Transcript of “Good Enough” Risk Adjustment Models for Physician …€œGood‐Enough” Risk Adjustment...

“Good‐Enough” Risk Adjustment Models for Physician Payment and Performance Assessment
Randall Ellis1,2, Arlene S Ash3,2, Juan Gabriel Fernandez4
1Boston University; 2Verisk Health, Inc; 3 University of Massachusetts Medical School 4
June 20, 2015

Abstract: The Affordable Care Act has moved diagnosis‐based risk adjustment models to center stage, in part by embracing risk adjustment for health insurance exchanges, but less overtly in its promotion of payment innovations, and increased attention to performance measurement. Almost all system reform innovations, including Affordable Care Organizations (ACOs), Patient Centered Medical Homes (PCMH), and Pay‐for‐Performance, assume “good enough” risk adjustment models are available for use for payment and performance assessment, but the specifics for creating and evaluating these models, which present formidable challenges, are rarely fleshed out. A series of published articles (Ash and Ellis, 2012; Ellis and Ash, 2012; Vats et al. 2013) has described and evaluated “good enough” – imperfect but useful and implementable – risk adjustment models for the Primary Care Activity Level (PCAL) models for primary care payment and performance assessment. These primary care payment models described in these papers were developed in collaboration with researchers at Verisk Health, and use the DxCG‐HCC classification system to organize diagnostic information. The PCAL payment model is its fifth year of use by one health plan to pay primary care practitioners (PCPs), and was recently recalibrated in preparation for its use by the Massachusetts Medicaid (MassHealth) program in 2015. This paper augments our earlier work by summarizing a variety of alternative formulations underlying that work that we may foster further efforts developing “good enough” risk adjustment models. We start with a rationale for estimating “good enough” bundled payment models for primary care providers. The 2006‐2007 MarketScan Commercial Claims and Encounter data are used to select a sample, estimate payment models, assign patients to unique primary care practitioners (PCPs). An innovation is the creation of representative “pseudo‐PCP” panels of patients for each PCP, that includes assigning the 29% of patients who did not see any PCP during a two year period to a PCP practicing in the same county, and combining small panels into broader sets of patients in the same county to more closely mimic typical PCP patient loads of at least 800 patients. A sensitivity analysis is conducted of nine alternative bundles of services ‐ narrowly to broadly defined‐ potential useful for primary care payment, and evaluated for their predictiveness, implied financial risk to PCPs, and payment stability over time. Three alternative weighted sums of top‐coded services were developed to approximate the burdens facing PCPs for managing well the primary care needs of their patients. For the sample of 436 midsized practices with 500 to 5000 assigned patients, the preferred PCAL model used 653 parameters in a sample of 17.4 million, achieving an R2 of 67% in average spending at the individual level. The same model explains 72% of the per capita variation for large assigned NEWPCP level, and 82% at the Pseudo‐PCP level. Nine performance measures explain meaningful variation when models are customized for the dependent variables. Diagnosis based risk adjustment models can substantially improve predictions relative to age‐sex models, and with careful crafting concurrent models can explain over 50 percent of the practice‐level variation, which we believe is sufficient for ensuring the relatively stable payments and performance assessment for measures needed for PCP practices with 500‐5000 patients.

1. Introduction
It is increasingly recognized that in order to control costs and improve quality in the US dramatic
changes are needed in how primary care medicine is practiced, and many argue that primary care
practice reform and changes in payment systems will be the cornerstone of these changes. The Patient
Centered Medical Home (PCMH)1 is the leading example of how practice reform and bundled,
comprehensive payment may promote personalized, coordinated care that is cost‐effective, efficient,
and evidence‐based. As advocated in Goroll et al (2007) 2, carefully constructed, risk adjusted payments
will be at the center of payment reform that changes incentives. This paper develops, calibrates and
evaluates alternative risk adjustment models that could potentially be used in support of the PCMH or
other bundled payment systems for primary care.
As discussed in Goroll (2008) and by others, fee‐for‐service payment systems reward volume
and procedures and underpay for evaluation and management services; in so doing, they are widely
viewed as insufficient to incentivize effective primary care. A growing number of researchers and
policymakers (Goroll, et al., 2007; Guterman et al, 2009; McCarthy et al, 2009; McGuire 2010, plus
others) have argued for a fundamental change in the payment system away from FFS, toward more
bundled payments. Fundamental change in primary care payment is also featured prominently in the
2010 Health Care Reform Act.3
1 Patient Centered Primary Care Collaborative. Joint Principles of the Patient Centered Medical Home. February 2007: http://www.pcpcc.net/node/14. 2 Goroll AH. The future of primary care: reforming physician payment. N Engl J Med. 2008 Dec 18;359(25):2636-9. 3 The ACA created a new Center for Medicare and Medicaid Innovations and instructs it to select models to test that
include “(i) Promoting broad payment and practice reform in primary care, including patient-centered medical home models for high-need applicable individuals, medical homes that address women’s unique health care needs, and models that transition primary care practices away from fee-for-service based reimbursement and toward comprehensive payment or salary-based payment. ‘‘(ii) Contracting directly with groups of providers of services and suppliers to promote innovative care delivery models, such as through risk-based comprehensive payment or salary-based payment.

Payment reforms that utilize bundled payments and rewards for desired outcomes are critical
for changing incentives. We focus here on per patient per year risk‐adjusted base payments models for
primary care physicians that could be used in support of a PCMH as envisioned by Goroll (2007), in
which a per person per month payment would largely replace rather than simply augment the existing
levels of FFS. We leave it for other papers to examine reforms for specialty care, how to create bonus
systems in support of comprehensive payment, or other practice reforms that may be required beyond
payment reform not because we think they are any less important but because merely developing
concepts for a comprehensive base payment model is sufficiently ambitious.
There is growing evidence that the PCMH can control costs and improve quality. Experience with
Medical Homes in Louisiana is one prominent example. Another is the widely‐reported (e.g.,) June 2009
“White Paper” from Group Health Cooperative (GHC) medical center found their pilot PCMH site
demonstration to be cost‐neutral within 12 months, despite increased expenses for primary care.4 Their
PCMH pilot reduced urgent care and hospital use, improved indicators of quality of care, reduced face‐
to‐face visits while increasing e‐mail and telephone contacts, and, notably improved both the patient
and clinician experience. Based on these findings, GHC plans rapid deployment of its PCMH model to all
its clinics. Vats et al (2013) document meaningful savings at a provider network that adopted a PCMH
model in 2009. The success of the VA in controlling costs from its innovations is also relevant (XXX cites
and updates needed). Rosenthal (2010) provides evidence of cost savings and quality improvements
from Geisinger health plan use of payment reform. There have been several recent reviews of PCMH
demonstrations with mixed results (cites XXX).
The remainder of this paper is organized as follows. In the next section we discuss the
conceptual framework and model to be used. The subsequent section briefly describes the data being
4 http://www.scienceblog.com/cms/group-health-cooperative-shows-investing-more-primary-care-pays-itself-22376.html

used and our sample selection criteria. The breadth of services, the information used, and the modeling
framework are all considered. The fourth section presents the results from empirical estimates of a
feasible base payment model, and contrasts the models in terms of its predictive power and robustness
at the individual level. The fifth section discusses our approach to assigning patients uniquely to primary
care practitioners (PCPs) and evaluates the predictive model at the PCP level. While patients can only be
imperfectly assigned, some mechanism is needed in the interim to evaluate primary care payment
models until such time as large samples are available on which to both calibrate models and evaluate
their implications for real panels of patients assigned to actual physicians.
The next section presents a sensitivity analysis by comparing the estimated PCAL model to two
alternative specifications. Three models are evaluated for their predictiveness, the financial risk imposed
on PCPs, and the payment stability at the PCP (rather than the individual). The final section of the paper
discusses some of the limitations of the model, implementation issues, and needs for further research.
2. Conceptual framework
Motivation
It is conceptually clear that fee‐for‐service (FFS) payments that reward volume and intensive
interventions while underpaying for primary care evaluation, management and preventive services do
not encourage or support the coordinated care that could prevent or delay disease progression and
reduce "downstream" needs for intensive services.5, 6 In contrast, an appropriately resourced and
organized primary care team, operating as a patient‐centered medical home (PCMH), should be able to
5 Goroll, Allan H., Berenson, Robert A., Schoenbaum, Stephen C., and Gardner, Laurence B. “Fundamental Reform of Payment
for Adult Primary Care: Comprehensive Payment for Comprehensive Care.” J Gen Intern Med. 2007 March; 22(3): 410–415.
6 Goodson, John D. “Unintended Consequences of Resource-Based Relative Value Scale Reimbursements.” JAMA, November 21, 2007. 298 (19): 2308-2310.

deliver good value for society, reducing other health care spending by encouraging more prudent
patterns of use and improving population health. Payment reform is essential for practice reform.7
The PCMH model, like most proposed reforms of health care delivery in the US, relies for its
success upon being able to calculate, for specific panels of patients, what resources are needed for their
care and what outcomes to expect under good care. Such calculations, at the individual level, are
commonly called risk adjustment. Risk adjustment can compensate providers for the difficulty of
managing the sickest and most challenging patients (and avoid overcompensating for healthy ones); it is
also needed to make assessments of provider "outcomes" (quality measures) reflect the difficulty of
achieving those outcomes with their patients.
The Patient Centered Medical Home (PCMH)8 is used broadly to refer to a practice model that
delivers personalized, coordinated, comprehensive, evidence‐based care to a defined population (panel)
of patients. In a PCMH, a mixed clinical team assisted by health information technology collaborates in
managing care for a patient panel. Implementing the PCMH and achieving its comprehensive care goals
requires a net investment in, and restructuring of, medical practice.9 A clear overview of the many
challenges to creating a PCMH is provided in an unpublished summary from the Society of General
Internal Medicine (SGIM) based on meetings in October 7, 2008.10
The Risk‐Based Comprehensive Payment system envisioned by Allan Goroll and the MA CPR
relies on bundled payment, which replaces FFS’s volume‐based incentives with payments that support
comprehensive, patient‐centered primary care. The comprehensive payment will include 1) a risk‐
7 Guterman, S., K. Davis, C. Schoen, and K. Stremikis, Reforming Provider Payment: Essential Building Block for Health
Reform, The Commonwealth Fund, March 2009 8 Patient Centered Primary Care Collaborative. Joint Principles of the Patient Centered Medical Home. February 2007:
http://www.pcpcc.net/node/14. 9 Ibid. 10 Society of General Internal Medicine (SGIM) “Emerging Themes: Developing a Policy Relevant Research Agenda for the
PCMH.” (Working paper, circa November, 2008.)

adjusted “base” payment to the practice that ensures adequate financial resources to meet the needs of
the practice’s patients, and 2) a potentially substantial (up to 25%) supplemental bonus for achieving
desired outcomes in quality, patient experience, and cost‐effectiveness. This system differs from many
pay for performance approaches by tying these bonus rewards to measurable outcomes that are
compared to risk‐adjusted expected outcomes rather than specifying one‐size‐fits‐all performance
targets. (For example, this approach would not count each patient with diabetes as a success if and only
if the HbA1c is below 7). Using risk‐adjusted expected outcomes rather than clinically determined
performance targets also has the important value of enabling us to calculate measures immediately
rather than wait for clinical or policy guidelines to become established.
In this paper we focus on the calculation of the base payment amount, which primary care
practices would receive largely in place of their current FFS payments. For concreteness, it is useful to
think of this payment as reflecting about 75 percent of total practice compensation, with the remainder
being in the form of bonus (incentive) payments that reward specific performance achievements. There
is nothing inherent in the results presented that requires this proportional allocation, however, and the
models developed could be used for other allocations as well.
Any diagnosis‐based classification could be used to generate risk‐adjusted base payments and
bonus measures. We use the DxCG/HCC system, refined from the model we originally developed for the
Medicare program; it has been repeatedly validated as robust and predictive, and the first two authors
of this paper are key developers of the classification system. Diseases and health conditions (ICD codes)
are organized using DxCG’s Hierarchical Condition Category (HCC) classifications, Version 7.0, which
distinguishes 394 distinct condition categories that are arranged hierarchically according to their
severity and expected costs. Published and unpublished work by Verisk Health (formerly DxCG), have
documented estimated risk adjustment models for PCMH base payments using very large insurance

claims datasets. These models are based on the age, sex, and disease profile of each patient in a primary
care doctor’s panel. While the factors used to predict resource needs and expected outcomes should
eventually be expanded, we have found these HCC models to be highly predictive. While future models
may ultimately rely on a richer set of data from electronic health records, at this point, only insurance
claims and encounter data contain comprehensive data on very large samples that are highly
comparable across provider groups. This paper focuses only on claims and encounter based predictive
models.
Fundamental challenges for bundled payment for primary care
In developing bundled payment models for primary care, a series of challenges must be
addressed. The four challenges that we address in this paper are defined in the following Table 1.
The primary focus here is on the fourth item, identifying the a useful set of resources that
captures the resource PCP needs of diverse patients. We do not make any original contributions here on
Table 1 Fundamental questions to answer in calibrating and evaluating bundled payment for primary care
1. Definition of a PCP: Who is to be considered a primary care practitioner (PCP) eligible for bundled payment?
2. Patient‐PCP assignment problem: How are patients assigned to PCPs given that under the existing, fragmented US health care delivery system patients often see multiple PCPs or no PCPs during a one‐year period?
3. Primary care core services: What services will no longer be allowed to be billed for on a FFS basis?
4. Primary Care Activity Level: What weighted sum of existing services best approximates the level of resources needed in order to appropriately treat a given patient?
5. Primary care services not from the assigned PCP: How will bundled
payments be adjusted when a patient receives primary care from
a provider is not the assigned PCP.

the other topics other than having to address them in developing and evaluating our alternative PCAL
models. For the definition of who is considered a PCP, we limit our analysis to include only physicians in
four specialties: family practice, internal medicine, gerontology, and pediatrics. For the patient‐PCP
assignment problem, discussed extensively below, we match patients to PCPs using an empirical
algorithm, rather than requiring patients or physicians to enroll or self‐identify their assignments. This
broadens the applicability of our models even while introducing some imprecision in the patient‐PCP
assignment, which we discuss below. The identification of primary care core services is discussed below,
as are alternatives for paying for services procured from other than the assigned PCP.
Our distinction between primary care core services and Primary Care Activity Level (PCAL) is
more novel and deserves greater discussion. Since it is commonly understood that if a PCP starts to
receive a bundled base payment, the PCP will no longer be permitted to also continue to bill for certain
primary care core services, it might seem as if the sum of these existing core services could serve as the
outcome measure or dependent variable to be predicted. This would be wrong on several counts. First,
the existing system of payment is already paying too little for preventive care and for evaluation and
management services – information provision and diagnosis – which are at the heart of high quality
primary care. To use the existing payments will simply build in this underpayment. Second, existing
primary care cores services– which are likely underprovided – are often divided up among too many
different providers, and often provided in inefficient duplicative ways by specialists and PCPs or by
multiple PCPs. An improved system would do a better job at channeling most or all primary care services
to one identifiable PCP for each patient and avoiding duplication. Finally, it is widely believed (and
increasingly supported by empirical evidence) that higher quality primary care could reduce the use of
some times of specialty care, hospitalizations, emergency departments, and certain outpatient
prescriptions. But achieving these savings will presumably require more effort by PCPs, and this effort
will tend to be concentrated on patients with the types of conditions that currently use above average

rates of these services. The existing level of spending on primary care core services is not a desirable
metric to use for calculating appropriate levels of base payments for PCPs.
As elaborated in Ash and Ellis (2012) instead of modeling only the existing distorted current level
of core services, a different metric is needed, which we call the Primary Care Activity Level (PCAL).11
Conceptually, we wish to identify, for each person, the dollars that a practice can expect to need to
provide comprehensive primary care for that person. Each predicted (or expected) value of PCAL is
calculated as a function of demographic and medical risk factor data; the predictions for all individuals in
a practice are added together to calculate the practice's base payment. We do not know PCAL – we
need to find a plausible measure of (or proxy for) it; in this case, using a large (claims) database.
Specifically, we compute the variable PCAL as the sum of costs allowed for all traditional primary care
activities plus some fraction of the costs associated with other medical activities, such as hospitalizations
and ER visits. Our premise is that the kinds of patients who are likely to have these costly medical
outcomes should be getting more attention from their PCPs – either because better attention from the
PCMH could help avert the utilization or simply because good care for such people is complex. Note that
a person's RRS will be higher not because he is hospitalized, but on the basis of his medical profile –
because he has the conditions associated with people who do get hospitalized. Adding "slivers" of costs
from different services to PCAL is a way of compensating for the fact that the primary care services in
today's claims databases are distorted for the three reasons discussed above. We describe the logic for
how we calculated PCAL empirical in the following section after first discussion data.
11 In early drafts of our research we called this concept the Primary Care Burden (PCB), but this has a decided emphasis on the physician view of patients, who do not like to think of themselves as burdens. Since it is intended to be used to compensate PCPs for a level of their activity, PCAL was selected as a more appropriate moniker.

3. Data and Methods
Sample Selection
The ideal sample to use for this paper would be a very large sample of individuals, with
complete cost, diagnoses, procedure, pharmaceutical use, demographic, socioeconomic, survey, and
provider information, all combined with rich, accurate and uniformly coded electronic health record
information. Unfortunately we are not aware of any dataset that exists satisfying all of these properties.
Largely because it is readily available, very large, carefully cleaned and well understood by us and many
other researchers, for our analysis we use instead a much more limited set of information: insurance
claims information from commercially‐insured Truven Analytics (formerly Thompson‐Reuters)
Marketscan Claims and Encounter Data. The full sample of Marketscan commercial data for 2007
contains usable, complete inpatient, outpatient, prescription drug, and basic plan level information on
over 17 million people. The data excludes those with Medicare or Medicaid coverage and those without
insurance. Most enrollees have relatively generous insurance coverage. Starting from the universe of all
covered lives, we selected a basic estimation sample of 1,668,486 people with the following properties.
Insured for at least six months in 2007.
Non missing age and gender
In a plan type which was an HMO, FFS, PPO, POS, or POS with capitation plan (which excludes Consumer Directed Health Care plans and Exclusive Provider Organizations (EPOs)
In a health plan (or employer) with 1000 or more enrolled individuals and where at least 50 percent of the unique individuals who saw a provider had information about the provider county, provider ID, and provider specialty.
Has a valid enrollee county of residence
Services to use for calculating base payments
Most discussions of bundled or capitated payment for primary care services do not specify what
primary care services are to be included in the bundle (GHC white paper, XXXX, Guterman et al, 2009;

SGIM, XXXX, McGuire, 2010). Remarkably little analysis has been done on this topic. As discussed
above, two related decisions are needed for this assignment.
1. What specific services will no longer be permissible for the PCPs to bill the health plan for separately? We call these Primary Care Core Services. 2. What weighted sum of all services best reflects the expected burden imposed on PCPs for a given patient? We previously identified this sum as the Primary Care Activity Level or PCAL.
To identify the list of primary care core services, we asked a panel of physicians to review
several thousand individual CPT4 and ICD‐9 procedure codes, initially organized by the CMS’s Berenson‐
Eggers Type of Service (BETOS) classification system. Altogether, 377 procedure codes were identified as
core services. An additional 79 procedure codes were identified as mixed services, for which some but
not necessarily all of the services would be considered primary care. For these, we gave them a weight
of .5 and only counted half of their cost as spending on primary care core services. We call these semi‐
core services.
There is no general definition or conceptual framework for physicians or anyone about what
constitutes the PCAL. For this paper we consider three possible PCAL definitions, which evolved over
time. The conceptual differences between these three definitions are summarized in Table 2. The first
PCAL definition was a preliminary one which used only clusters of procedures commonly performed by
PCPs without regard to place of service or provider specialty. It closely approximates the initial concept
of core services, except that it includes a substantial set of services provided by non‐PCPs. It requires
only that each claim has a procedure code. Primarily because it was available earlier than the next two,
this first PCAL definition is the one currently in use by the three practices examined in Vats et al (2013)
which implemented a PCMH in 2009. Note that this definition does not include the cost of any services
such as hospitalizations, emergency departments, or pharmaceuticals.

Our second definition uses a smaller set of primary care core services, but a broader set of non‐
primary care services to define PCAL: it captures the additional burden or effort that a physician will
have to take for preventing, preparing for, and following up on other services such as hospitalizations,
emergency departments and pharmaceuticals. For this second definition, we looked at who actually
provided the core services, and attached different weights to them according to whether it was a PCP or
some other provider. We call this the “detailed PCAL” definition. As noted in Table 2, this detailed
method uses procedure codes, place of service, provider specialty, and non professional claims
(pharmacy, and inpatient facility claims, for instance). One significant drawback of this second definition,
however, is that it presupposes that physician IDs and provider specialties are present on the claim or
encounter record, and can be assigned accurately to specialty types that identify them as PCPs (since
different proportions of spending are used for PCPs than non‐PCPs).12 This “Detailed PCAL” definition
would be problematic to implement in settings where an individual patient does not always visit a
12 In the Thomson-Reuters Marketscan commercial claims and encounter data for 2007 that we are using for this analysis, provider ID, specialty and county was present on more than half of the claims for a given plan in only ten percent of the records and was the major factor in reducing our sample size from 17 million to the 1.7 million people used for estimation. Moreover, we observe that in some HMO and POS plans, claims often are coded with provider specialty “clinic” without always specifying a more precise PCP specialty, which is problematic to this measure.
Table 2 Three definitions of PCAL examined
PCAL Definition
Name Use subset of
procedure codes
Use place of service
information
Require identifying
PCPs
Include fraction of spending on non
physician services
1 Preliminary X
2 Refined X X X X
3 Pragmatic X X X

Table 3 Service Costs components of pragmatic PCAL
50% PCP core services by anyone
5% specialty and lab service spending
5% emergency department visit spending
5% hospital spending
10% prescription drug spending
25% fixed age‐sex based fixed component
100% total of the above
*Payments to be based on expected PCAL
physician during a primary care visit, which is common in many HMOs and particularly in multispecialty
clinics. Estimating the Detailed PCAL model required that we drop 90 percent of our Marketscan data
that did not reliably allow PCPs to be identified (although this was the same sample that contained
provider and enrollee counties which we also wanted).
Given the over simplicity of the “preliminary PCAL” definition, and the demanding data
requirements of the “Detailed PCAL” definition 1 (requiring accurate provider IDs and specialty
assignments) we selected as our preferred one a third definition, which we call the “pragmatic
PCAL“ definition. For the pragmatic PCAL measure we imposed the restriction that the only information
that could be used are procedure codes and place of service, and not provider specialty information.
Second, we wanted our measure to be stable over time, and highly predicted by acute and chronic
condition prevalence, much the way primary care services are, so we favored services that are more
predictable in our definition (See Ellis and McGuire, 2007, and Ellis, Jiang and Kuo, 2010 for discussion of
the predictability of different services). Finally we wanted our PCAL measure to approximate the
relative effort that doctors report that different activities take. It was unclear, for instance, whether
time spent prescribing drugs, time spent with inpatient care preparation, follow‐up and prevention, or
time spent making specialists referrals take up more time for the average PCP providing high quality
PCHM care.
Therefore we conducted a survey of a small sample of primary care doctors in well managed
group practices about their time allocation to
different types of activities. We then selected
weights on different types of services such
that the proportion of the PCAL that is
influenced by each broad types of service
corresponds to the reported time allocation

from the survey. The specific weights used and the list of procedure codes and interactions with place of
service is proprietary information owned by Verisk Health. Table 3 provides a summary of how the
Pragmatic PCAL definition was generated. Further discussion of the pragmatic PCAL is in Ash et al (2012).
Our three alternative PCAL measures of primary care resource need differ not only in the
information used and breadth of services they include, but also in their sample means. It might seem
that the generosity of payments to PCPs would vary greatly according to which measure we use. This
will not be true, however if we always use each model to create relative risk scores with a mean of 1.
The RRSs from any of these models can then be multiplied by the appropriate dollar weight to generate
predictions that have the right average payment. We are interested in how PCAL models can be used to
calculate relative payments, not absolute payments.

In addition to the three PCAL models estimated, we also explored the means and predictability
of six alternative summaries of professional and outpatient services. Sample means and standard
deviations are shown in Table 4. The MarketScan data suggests that only 3.5 percent of all spending is
on what we define to be core services provided by the assigned PCP, and that about a third more core
services are provided by other PCPs. Altogether, services by PCPs (providers in four specialties) account
for 7.2 percent of total health spending in 2007 in our sample.
4. Results from a pragmatic PCAL model
Summary statistics from our sample using the pragmatic PCAL definition are shown in Table 5.
Table 4: Summary statistics for alternative spending measures

The two columns correspond to two separate regressions predicting the annualized spending on
PCAL. The first column is for a model with only 34 age and gender dummy variables, while the second
column includes these 34 dummies plus an additional 384 HCC dummies and selected interactions.13
Each regression was run separately using weighted least squares with the fraction of the year eligible as
13 Ash et al (2000) is the best source for discussion of why the nonlinear relationship between age, gender and health spending mean that age-gender dummies are superior to using powers of age as explanatory variables.
Table 5: Regression results predicting Primary Care Activity Level
(PCAL) using pragmatic model

the weight. The sample mean is $546, and its coefficient of variation at 252 is less than that of total
spending in the same group.
The R‐Square, standard error, and mean absolute deviation are three popular measures of
goodness of fit. All three measures show that the HCC regression has substantially more predictive
power than the simple age‐sex specification. With a conventional and adjusted R2 of 51.1 percent, PCAL
is modestly more predicable than total spending on health care.
Even with 1.7 million observations, overfitting can be a problem in risk adjustment models if
both the dependent variable and the independent variables are highly skewed. Therefore we
recalculated the R2 using k‐fold validation with k=100. The K‐fold validated R2 gives an outside of sample
measure of goodness of fit that is superior to using a single split sample technique. With only a .5
percentage point reduction in the R2, overfitting is not a problem with this model.
Figure 1 shows that the actual and predicted means of PCAL by percentiles of individuals track
quite well for low and high PCAL relative risk scores. This figure uses 1.7 million people in the
development sample, and hence is a within sample demonstration of goodness of fit.
Figure 1 Comparison of actual and predicted pragmatic PCAL by percentiles of individuals
0
2
4
6
8
10
12
14
16
18
20
PCAL RRS
Percentiles of predicted PCAL RRS
Comparison of actual and predicted PCAL by percentiles of individuals
Actual PCAL
Predicted PCAL
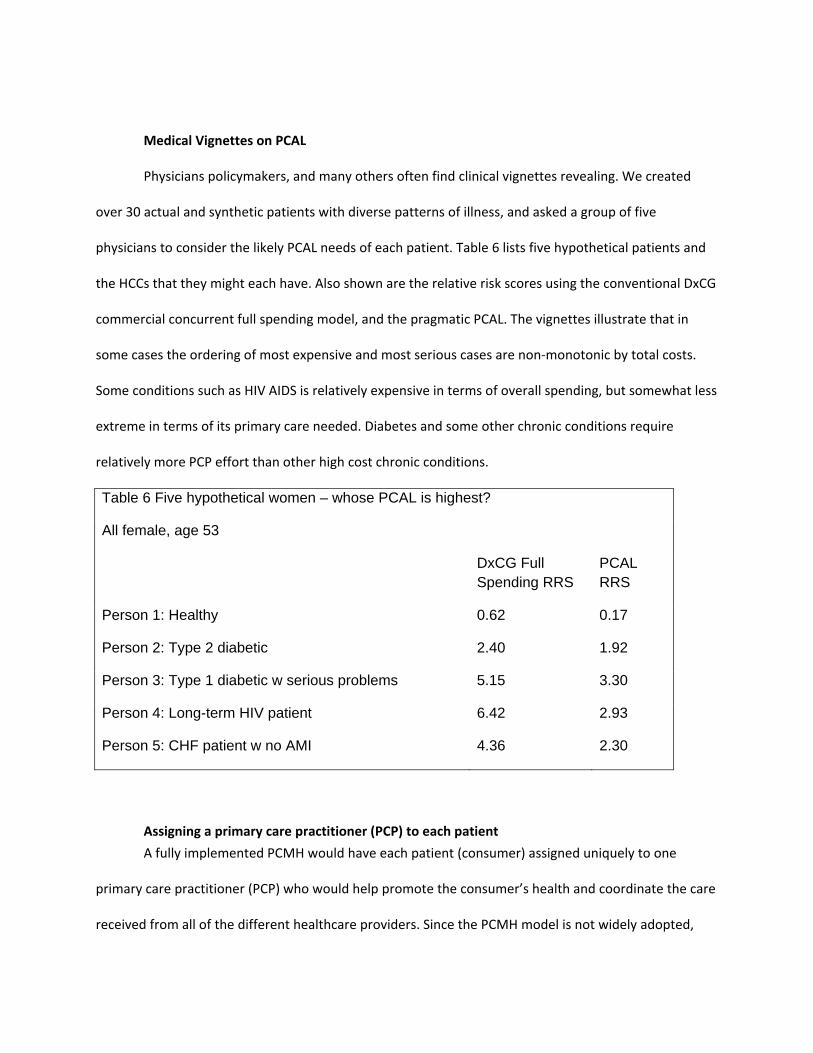
Medical Vignettes on PCAL
Physicians policymakers, and many others often find clinical vignettes revealing. We created
over 30 actual and synthetic patients with diverse patterns of illness, and asked a group of five
physicians to consider the likely PCAL needs of each patient. Table 6 lists five hypothetical patients and
the HCCs that they might each have. Also shown are the relative risk scores using the conventional DxCG
commercial concurrent full spending model, and the pragmatic PCAL. The vignettes illustrate that in
some cases the ordering of most expensive and most serious cases are non‐monotonic by total costs.
Some conditions such as HIV AIDS is relatively expensive in terms of overall spending, but somewhat less
extreme in terms of its primary care needed. Diabetes and some other chronic conditions require
relatively more PCP effort than other high cost chronic conditions.
Table 6 Five hypothetical women – whose PCAL is highest?
All female, age 53
DxCG Full Spending RRS
PCAL RRS
Person 1: Healthy 0.62 0.17
Person 2: Type 2 diabetic 2.40 1.92
Person 3: Type 1 diabetic w serious problems 5.15 3.30
Person 4: Long-term HIV patient 6.42 2.93
Person 5: CHF patient w no AMI 4.36 2.30
Assigning a primary care practitioner (PCP) to each patient
A fully implemented PCMH would have each patient (consumer) assigned uniquely to one
primary care practitioner (PCP) who would help promote the consumer’s health and coordinate the care
received from all of the different healthcare providers. Since the PCMH model is not widely adopted,

and since many consumers do not initially have a designated PCP, we need to have a framework for
calculating base payments for the PCMH using claims information that do not already presuppose
patients having chosen a PCP. Also, to evaluate how well a payment model will do with this payment
system, we need to know how patients will be assigned to a PCP. For this paper, we combine
information about actual patient use of PCPs with an algorithm that assigns all patients in a sample to a
PCP. For this paper, we only considered doctors to be potential PCPs if they were in the following four
primary care specialties: general practice, internal medicine, pediatrics and geriatrics. Recall that in the
previous step we only attempted to assign patients to PCPs in a sample in which provider IDs, specialty
codes, and county information was largely present.
The patient‐PCP assignment algorithm we used to assign was as follows from the full sample.
1. Divide the subsample of people who made at least one visit to a physician in a primary care specialty (i.e., a PCP) in 2007 into two parts: those visiting exactly one PCP (who are thereby uniquely assigned to one PCP) and those seeing multiple PCPs during 2007.
2. For the patients seeing more than one PCP during 2007, assign that patient to the PCP who accumulated the largest total payments (plan payments plus copayments).14 In the event of a tie in spending, assign the patient to the PCP most recently seen.
3. For those not seeing a PCP during 2007: examine their claims for the prior year (2006) and repeat steps 1 and 2 using 2006 data.
4. For those not seeing any PCP during 2006 or 2007, assign patients to PCPs from the same county as the enrollee’s county of residence, giving priority to children (age<=18) being assigned primarily to pediatricians and those over age 65 assigned primarily to geriatricians.
We call the patient panels created after conducting steps 1 to 3 the Actual PCP panels, since
each patient is assigned to an actual PCP that they visited. The actual PCP panels are unrepresentative of
the total sample because those with zero or little health care spending are not assigned to a PCP. The
fourth step, which is an innovation, is intended to ensure that every consumer is assigned to some PCP.
After merging on these individuals who did not see any PCP in either 2006 or 2007, we call these the
14 We also examined classifying people to PCPs based on having the largest number of visits and days of treatment in 2007, however the assignment was nearly identical. Since ultimately the PCP will be responsible for the costs of many types of services, we slightly prefer dollar sums to visit counts but either can be defended. Vats et al (2013), following Song et al (2012) examines alternative, more refined assignment algorithms, applied in an actual PCMH setting.

NEWPCP panels. Table 7 shows the proportion of patients assigned to PCPs at each step of this
algorithm. Unfortunately since we only observe patients from a selection of insurance plans, the average
panel size in both the ACTUALPCP and NEWPCP panels are relatively small ranging from 1 to 50,000
patients per PCP practice with a mean NEWPCP size of 31.4 patients. Recall that a practice can have
more than one PCP. MarketScan data may allow some Provider IDs to be a tax billing number, in which
case very large clinics or multispecialty practices may appear as a single NEWPCP. For some of our
analysis, we analyze what we call midsized NEWPCPs that have at least 50 but no more than 1500
patients.
Fortunately, our
sample is large enough, and
geographically concentrated
enough that we still have 4817
midsized NEWPCP panels to
analyze. A histogram showing
the distribution of these midsized NEWPCP panels by number of patients enrolled is shown in Figure 2.
This distribution may be typical of the distribution that might be observable by a single insurer or large
employer concentrated in a limited geographic area. The relatively small sizes highlight the challenges of
implementing a PCMH in a multiple payer setting, as well as the problem of making quality inferences
Table 7 Assignment of patients to PCPs N= 1,668,486
Percent of Patients
Saw exactly one PCP during 2007 42.4% Saw multiple PCPs in 2007 12.6% Saw at least one PCP in 2006 but none in 2007 15.7% Did not see any identifiable PCP 29.3%

based on such small panel sizes.
Figure 2: Histogram of PCP panel sizes after assigning patients with no visits.
Creation of realistically sized panels of patients: PSEUDO PCP panels
For some purposes it is useful to be able to assess how well our models will perform if we were
to observe all of the patients treated by a PCP. Since we do not have claims for Medicare, Medicaid, or
uninsured patients, we have no hope of creating panels of patients with diverse insurance coverage.
Because risk and precision are affected by sample sizes, it remains interesting to consider panel sizes
that approximate a full size PCP practices. Therefore, we create pseudo PCP panels by consolidating
patients across NEWPCPs within the same county or state, using patients as assigned to NEWPCPs as
generated by steps 1‐4 described in the previous section. We generate pseudo PCP panels by
undertaking the following steps.
1. Sort all patients assigned to NEWPCPS by their PCP’s state and county, so that PCPs in the same or nearby counties are adjacent.
2. Starting with the first NEWPCP, accumulate the count of patients assigned to a PSEUDO PCP. If the count for a PSEUDO PCP exceeds 800 then that group of patients is a complete panel. If the number of patients assigned is less than 800 then continue to add the patients for the next NEWPCP listed to that particular panel.

3. If a PSEUDOPCP had less than 800 members, we allowed merging of NEWPCPs from the next state. Remaining NEWPCPs at the end of the process were added to the final PSEUDOPCP.
This algorithm consolidates diverse NEWPCP’s into PSEUDO PCPs. These PSEUDO PCPs do not
cross state boundaries, although they may cross county lines; patients assigned to a particular PCP are
always grouped together into the same PSEUDOPCP panel. In all we generated 1380 such PSEUDO PCP
panels with an average of 1086 patients per panel. Note that because we are combining patients across
diverse PCPs, the PSEUDOPCP panels are more homogeneous than actual panels are likely to be.
However they do still maintain the geographic variation that is well‐established at the state and county
levels. Table 8 shows the alternative PCP panels created with the MarketScan data. Further details are
provided in appendix tables A1 and A2.
Table 8 Alternative PCP panels created using 2006‐2007 data
Number of PCP doctors
Average numbers of patients assigned
Total patients assigned
Mean total health spending per patient
Actual PCPs, their actual patients 53,192 20.6 1,058,906 $4,893
NEWPCPs: PCPs with all patients assigned, including those with no PCP visits 53,192 31.4
1,668,486 $4,144
Mid‐sized NEWPCPs: PCPS with all patients assigned, but seeing more than 50 patients and less than 1500 5,219 234
1,018,665 $4,139
Large NEWPCPs: PCPs with all patients assigned, but only PCPs seeing more than 500 patients and less than 5000 436 1048 456,781 $4,324
Pseudo PCPs: after assigning patients and merging NEWPCPs 1,380 1086 1,668,486 $4,144

5. PCP Level Results
Empirical measures of each of the eleven measures of primary care resources from Table 4 were
generated using our MarketScan commercial claims sample of 1,668,486 individuals assigned to
NEWPCPs and PSEUDO PCP. Using standard DxCG methods15, for each dependent variable predictions
were made at the individual level using 394 HCCs from Version 3.0 of the software and selected
interactions. Because of our large sample size, the overfitting problem is small, and we report here only
within‐sample measures, not out‐of‐sample, validated measures. These individual level predictions are
then aggregated up to the level of NEWPCPs and PSEUDO PCPs, both of which include patients with zero
spending during our two year period. When using a model to assess a practice, we sum actual and
predicted PCAL outcomes over all patients in a panel to create observed (O) and expected (E) values at
the practice level.
First we measured these models' predictive ability in the new data. The accuracy of a
model for predicting a continuous outcome, such as cost, is most commonly measured by R2, which is
the proportion of the total variability in the outcome that a model “explains.” When a model perfectly
predicts each outcome for each person, its (individual) R2 is 100%. For our purposes, however, we are
more interested in accurate predictions at the PCP level. It turns out that two measures of PCP level fit
can be used. If total spending measures are used, then size effects dominate the measures of goodness
of fit. See Figure 3‐6 for sample plots for large NEWPCPs. They show that the pragmatic PCAL model
15 We organized ICD‐9‐CM diagnostic information using Verisk Health’s Sightline DxCG’s disease classification
system Version 3.0, which was updated in 2010 to contain 394 HCCs. The DxCG model is an enhanced version of
the CMS‐HCC model used for Medicare Advantage capitation payments which uses 80 CMS‐HCCs. Results shown
here are from concurrent regressions using 394 HCCs plus 32 age and sex dummies plus interactions of sets of
HCCs.

does about as well as models of total spending, achieving a grouped R‐square of .723 for large
NEWPCPs.
Figure 3
Figure 4

Figure 5
Figure 6
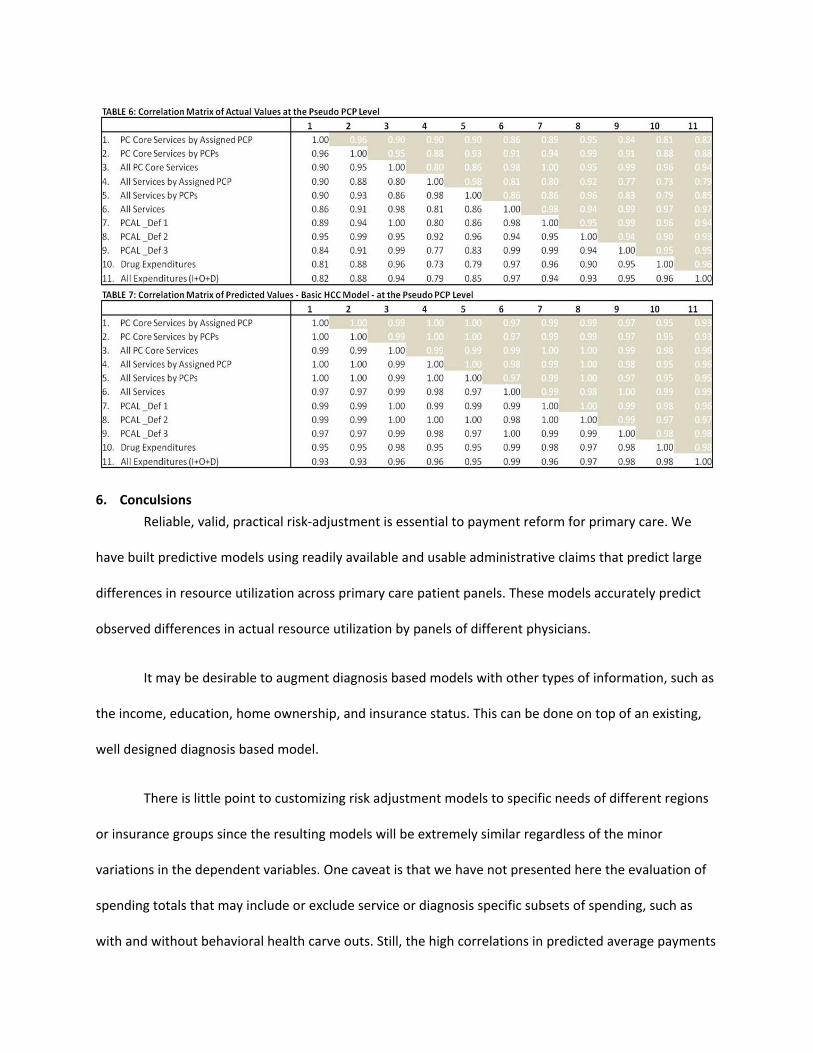
Correlations between the various measures.
For the payment system to work, it is important that payments be relatively stable over time,
and that they have face validity to providers. One metric of face validity is that they are relatively
insensitive to alternative definitions used for the PCAL measures. Tables 9 through 12 provide

correlation coefficients for our set of eleven measures at the NEWPCP and PSEUDO PCP levels. These
correlations show that all of the measures are highly correlated at the NEWPCP and PSEUDO PCP levels.
IN particular the correlations between the PREDCITED VALUES of the three alternative PCAL measures
are all .98 or better for both ways of simulating large PCPs. This means that for all intents and purposes
it does not matter which definition of PCAL is used for payment, since payments will be the same
regardless. There is little point in customizing the PCAL measure for a specific purpose since the
aggregate predictions of the various PCAL models are virtually indistinguishable. The results also suggest
that even models designed to predict only professional services, or only PC core services will also make
essentially the same paymewnts to PCPs. In this important sense, ANY of the nine measures that are
shown in these tables will be “Good Enough” for use, as is, for the purpose of approximating the relative
resources of diverse patients seeing PCPs.
6. Conculsions
Reliable, valid, practical risk‐adjustment is essential to payment reform for primary care. We
have built predictive models using readily available and usable administrative claims that predict large
differences in resource utilization across primary care patient panels. These models accurately predict
observed differences in actual resource utilization by panels of different physicians.
It may be desirable to augment diagnosis based models with other types of information, such as
the income, education, home ownership, and insurance status. This can be done on top of an existing,
well designed diagnosis based model.
There is little point to customizing risk adjustment models to specific needs of different regions
or insurance groups since the resulting models will be extremely similar regardless of the minor
variations in the dependent variables. One caveat is that we have not presented here the evaluation of
spending totals that may include or exclude service or diagnosis specific subsets of spending, such as
with and without behavioral health carve outs. Still, the high correlations in predicted average payments

even for such divers measures as total spending, total spending on procedures, and PCAL spending is
informative.
ReferencesAsh, Arlene S., and Randall P. Ellis (2012). “Risk‐Adjusted Payment and Performance Assessment for
Primary Care,” Medical Care, 50(8): 643‐653.
Ash, Arlene S., Ellis R.P., Gregory C. Pope, John Z. Ayanian, David W. Bates, Helen Burstin, L.I. Iezzoni, E.
McKay, W. Yu, (2000). “Using Diagnoses to Describe Populations and Predict Costs,” Health Care
Financing Review, Spring 21(3): 7‐28.
Berenson RA, Rich EC. (2010). “US approaches to physician payment: the deconstruction of primary care,” J Gen Intern Med, 25(6): 613‐618.
Bitton A, Martin C, Landon BE 2010. “A Nationwide Survey of Patient Centered Medical Home
Demonstration Projects,” Journal of General Internal Medicine, 25(6): 584–592. doi:10.1007/s11606‐
010‐1262‐8. PMC 2869409. PMID 20467907.
Goroll AH. The future of primary care: reforming physician payment. N Engl J Med. 2008 Dec 18;359(25):2636‐9.
Goroll AH, Berenson RA, Schoenbaum SC, Gardner LB. Fundamental reform of payment for adult primary care: comprehensive payment for comprehensive care. J Gen Intern Med. 2007 Mar;22(3):410‐5.
Guterman, S., K. Davis, C. Schoen, and K. Stremikis, Reforming Provider Payment: Essential Building
Block for Health Reform, The Commonwealth Fund, March 2009.
L. M. Kern, A. Edwards, and R. Kaushal, “The Patient‐Centered Medical Home, Electronic Health Records,
and Quality of Care,” Annals of Internal Medicine, June 2014 160(11):741–49.
Louisiana Health Care Quality Forum, June 2008. Downloaded June 28, 2009 from
http://www.commonwealthfund.org/Content/Innovations/State‐Profiles/2008/Jun/Louisiana‐
Health‐Care‐Quality‐Forum.aspx
Thomas G. McGuire, “Payment Reform to Finance a Medical Home.” Comment on “Achieving Cost
Control, Care Coordination, and Quality Improvement through Incremental Payment System Reform,”
Journal of Ambulatory Care Management, 33(1): 35‐37, 2010.
Nutting, P. A., W. L. Miller, B. F. Crabtree et al., "Initial Lessons from the First National Demonstration
Project on Practice Transformation to a Patient‐Centered Medical Home," Annals of Family Medicine
May/June 2009 7(3):254–60.
Massachusetts Executive Office of Health and Human Services (EOHHS) 2014. “Primary Care Payment
Reform Initiative” http://www.mass.gov/eohhs/gov/newsroom/masshealth/providers/primary‐care‐
payment‐reform‐initiative.html/ Accessed June 19, 2014.
Rittenhouse, D. R., L. P. Casalino, R. R. Gillies et al., Measuring the Medical Home Infrastructure in Large
Medical Groups, Health Affairs, September/October 2008, 1246‐58
McCarthy, D., K. Mueller, and I. Tillmann, Group Health Cooperative: Reinventing Primary Care by Connecting Patients with a Medical Home, The Commonwealth Fund, June 2009
Patient Centered Primary Care Collaborative. Joint Principles of the Patient Centered Medical Home. February 2007: http://www.pcpcc.net/node/14. Song, Zurui, Dana G Safran, Bruce E Landon, et al. (2011). “Health Care Spending and Quality in Year 1 of
the Alternative Quality Contract,” New England Journal of Medicine,365: 909‐918.
Vats, Sonal, Arlene S. Ash and Randall P. Ellis. (2013). “Bending the Cost Curve? Results from a
Comprehensive Primary Care Payment Pilot,” Medical Care, 51(11): 964‐969.
http://www.mass.gov/eohhs/docs/eohhs/healthcare‐reform/prev‐meetings/120216‐final‐proposal.pdf Verisk Health, Inc. 2013. DxCG Intelligence User Guide v4.2.1, Waltham MA.

Appendix Table A1 Analysis of actual spending on eleven measures for NEW PCPs, which include patients not seeing any PCP during the year.
Appendix Table A2 Analysis of actual spending on eleven measures for PSEUDO PCPs, which include patients not seeing any PCP during the year.