
Gonzalo G ómez, PhD. [email protected]
63
Gonzalo Gómez, PhD. [email protected] Madrid, Feb 16th, 2009. ::: Gene Set Enrichment Analysis - GSEA - Course on Functional Analysis Bioinformatics Uni CNI
-
Upload
mackenzie-payne -
Category
Documents
-
view
25 -
download
0
description
Course on Functional Analysis. ::: Gene Set Enrichment Analysis - GSEA -. Madrid, Feb 16th, 2009. Gonzalo G ómez, PhD. [email protected]. Bioinformatics Unit CNIO. ::: Contents. Introduction. GSEA Software Data Formats Using GSEA GSEA Output GSEA Results Leading Edge Analysis. - PowerPoint PPT Presentation
Transcript of Gonzalo G ómez, PhD. [email protected]

Gonzalo Gómez, PhD. [email protected] Gómez, PhD. [email protected]
Madrid, Feb 16th, 2009.Madrid, Feb 16th, 2009.
::: Gene Set Enrichment Analysis - GSEA - ::: Gene Set Enrichment Analysis - GSEA -
Course on Functional AnalysisCourse on Functional Analysis
Bioinformatics UnitCNIO
Bioinformatics UnitCNIO
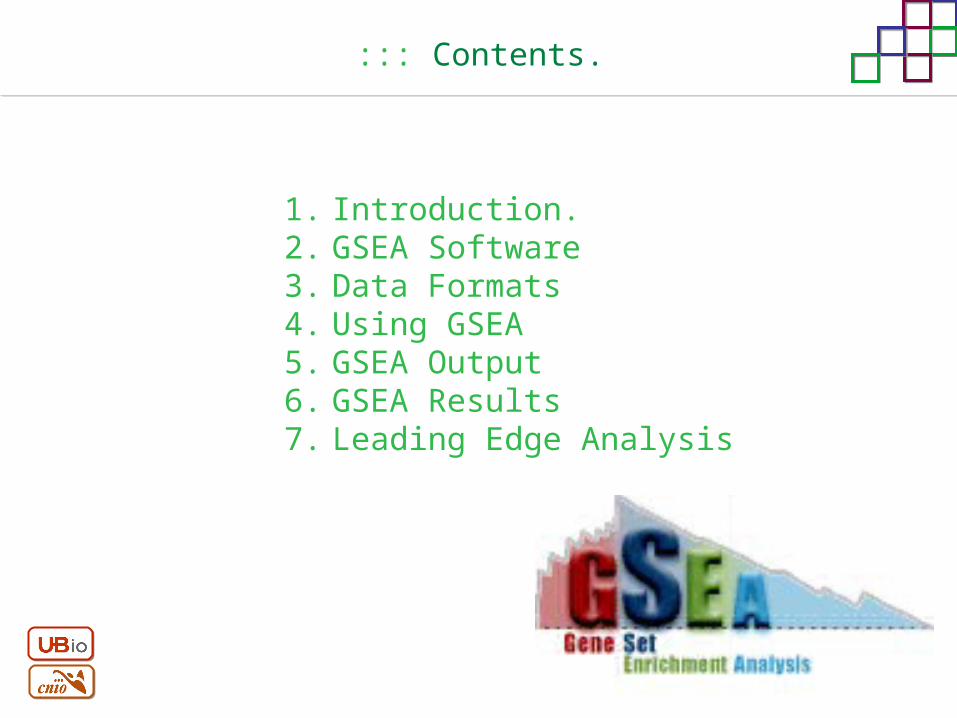
::: Contents.
1. Introduction.2. GSEA Software3. Data Formats4. Using GSEA5. GSEA Output6. GSEA Results7. Leading Edge Analysis

::: Contents.
1. Introduction.2. GSEA Software3. Data Formats4. Using GSEA5. GSEA Output6. GSEA Results7. Leading Edge
Analysis

Gene Set Enrichment Analysis - GSEA -
::: Introduction.
MITBroad Institute
v 2.0 available since Jan 2007v 2.0.1 available since Feb 16th 2007
Version 2.0 includes Biocarta, Broad Institute,GeneMAPP, KEGG annotations and more...
Platforms: Affymetrix, Agilent, CodeLink, custom...
GSEA
(Subramanian et al. PNAS. 2005.)

GSEA applies Kolmogorov-Smirnof test to find assymmetrical distributions for defined blocks of genes in datasets whole distribution.
Gene Set Enrichment Analysis - GSEA -
::: Introduction.
::: How works GSEA?
Is this particular Gene Set enriched in my experiment?
Genes selected by researcher, Biocarta pathways, GeneMAPP sets, genes sharing cytoband, genes targeted by common miRNAs
…up to you…
Dataset distribution Num
ber o
f genes
Gene Expression Level
Gene Set Enrichment Analysis - GSEA -
::: Introduction.
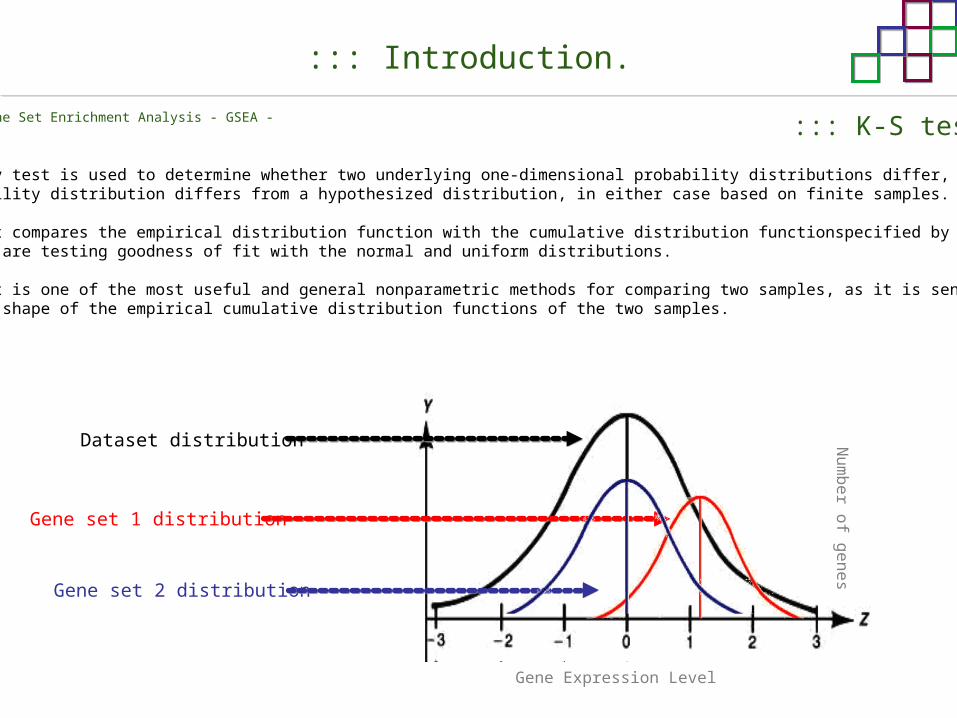
::: K-S test
The Kolmogorov–Smirnov test is used to determine whether two underlying one-dimensional probability distributions differ, or whether an underlying probability distribution differs from a hypothesized distribution, in either case based on finite samples.
The one-sample KS test compares the empirical distribution function with the cumulative distribution functionspecified by the null hypothesis. The main applications are testing goodness of fit with the normal and uniform distributions.
The two-sample KS test is one of the most useful and general nonparametric methods for comparing two samples, as it is sensitive to differences in both location and shape of the empirical cumulative distribution functions of the two samples.
Gene set 1 distribution
Gene set 2 distribution

ClassA ClassB
ttest cut-offttest cut-off
FDR<0.05
FDR<0.05
...testing genes independently...
Biological meaning?
Gene Set Enrichment Analysis - GSEA -
::: Introduction.
::: How works GSEA?

ES
/NE
S statistic
-
+
ClassA ClassB
Gene Set 1
ttest cut-offttest cut-off
Gene Set 2
Gene Set 3
Gene set 3enriched in Class B
Gene set 2enriched in Class A
Gene Set Enrichment Analysis - GSEA -
::: Introduction.
::: How works GSEA?

Gene Set Enrichment Analysis - GSEA -
::: Introduction.
ES examples :::

NESNES
pvalpval
FDRFDR
Gene Set Enrichment Analysis - GSEA -
::: Introduction.
The Enrichment Score :::
Benjamini-Hochberg

::: Contents.
1. Introduction.2. GSEA Software3. Data Formats4. Using GSEA5. GSEA Output6. GSEA Results7. Leading Edge Analysis

Gene Set Enrichment Analysis - GSEA -
http://www.broad.mit.edu/gsea/
::: GSEA software.
Download :::

Gene Set Enrichment Analysis - GSEA -
::: GSEA software.
Main Window :::

Gene Set Enrichment Analysis - GSEA -
::: GSEA software.
Loading data :::
!!!

Gene Set Enrichment Analysis - GSEA -
::: GSEA software.
Running GSEA :::
Gene Set Enrichment Analysis - GSEA -
::: GSEA software.
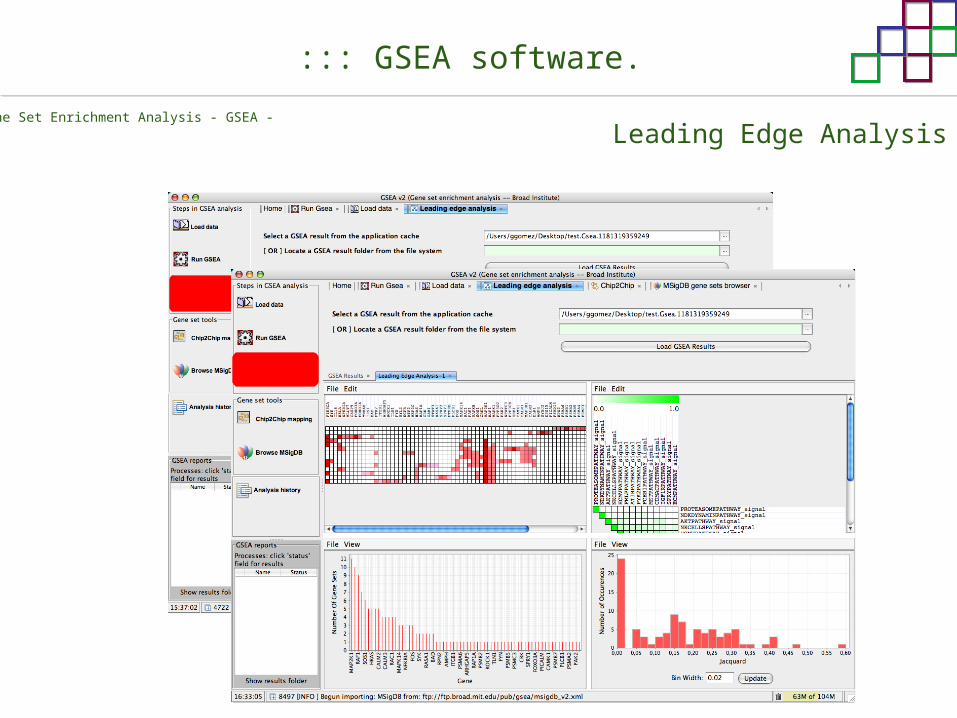
Leading Edge Analysis :::
Gene Set Enrichment Analysis - GSEA -
::: GSEA software.
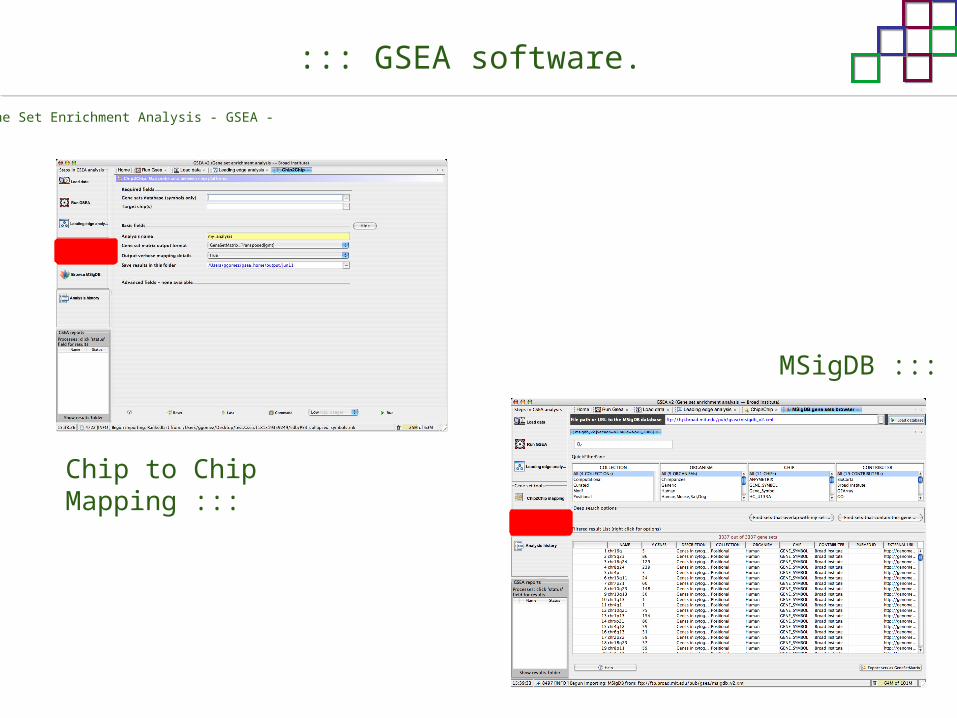
Chip to Chip Mapping :::
MSigDB :::

::: Contents.
1. Introduction.2. GSEA Software3. Data Formats4. Using GSEA5. GSEA Output6. GSEA Results7. Leading Edge Analysis

Gene Set Enrichment Analysis - GSEA -
::: Data Formats.

Gene Set Enrichment Analysis - GSEA -
::: Data Formats.

Gene Set Enrichment Analysis - GSEA -
Expression datasets :::
::: Data Formats.
*.gct*.gct

Gene Set Enrichment Analysis - GSEA -
Expression datasets :::
::: Data Formats.
*.res*.res

Gene Set Enrichment Analysis - GSEA -
Expression datasets :::
::: Data Formats.
*.pcl*.pcl

Gene Set Enrichment Analysis - GSEA -
Expression datasets :::
::: Data Formats.
*.txt*.txt
*.cls*.cls
Gene Set Enrichment Analysis - GSEA -
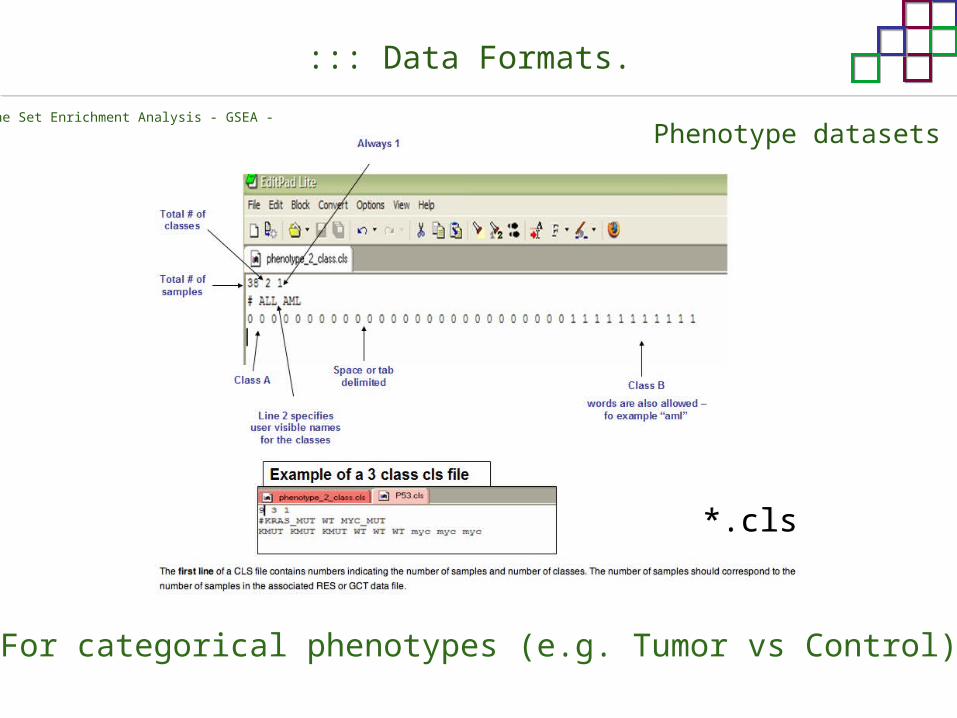
Phenotype datasets :::
::: Data Formats.
For categorical phenotypes (e.g. Tumor vs Control)

Gene Set Enrichment Analysis - GSEA -
Phenotype datasets :::
::: Data Formats.
For continuous phenotypes (e.g. Gene correlated to GeneSet)
For continuous phenotypes (e.g. Gene vs Time Series)
Time serie (each 30 minutes)
Peak profile wanted

Gene Set Enrichment Analysis - GSEA -
Gene Set Database :::
::: Data Formats.
*.gmx*.gmx

Gene Set Enrichment Analysis - GSEA -
Gene Set Database :::
::: Data Formats.
*.gmt*.gmt

Gene Set Enrichment Analysis - GSEA -
Ranked list format :::
::: Data Formats.
*.rnk*.rnk
::: Contents.
1. Introduction.2. GSEA Software3. Data Formats4. Using GSEA5. GSEA Output6. GSEA Results7. Leading Edge Analysis

Gene Set Enrichment Analysis - GSEA -
::: Using GSEA.
Loading data :::

Gene Set Enrichment Analysis - GSEA -
::: Using GSEA.
Loading data :::

Gene Set Enrichment Analysis - GSEA -
Running GSEA :::
::: Using GSEA.

Gene Set Enrichment Analysis - GSEA - ::: MSigDB.
gsea_homegsea_home
::: Using GSEA.
Gene Set Enrichment Analysis - GSEA -
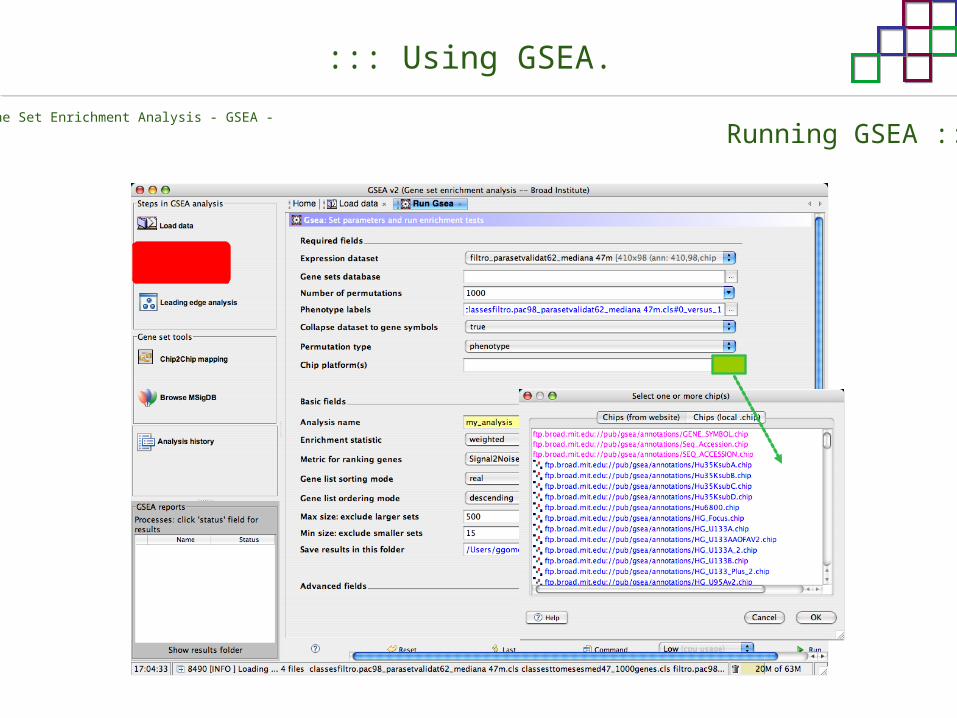
Running GSEA :::
::: Using GSEA.
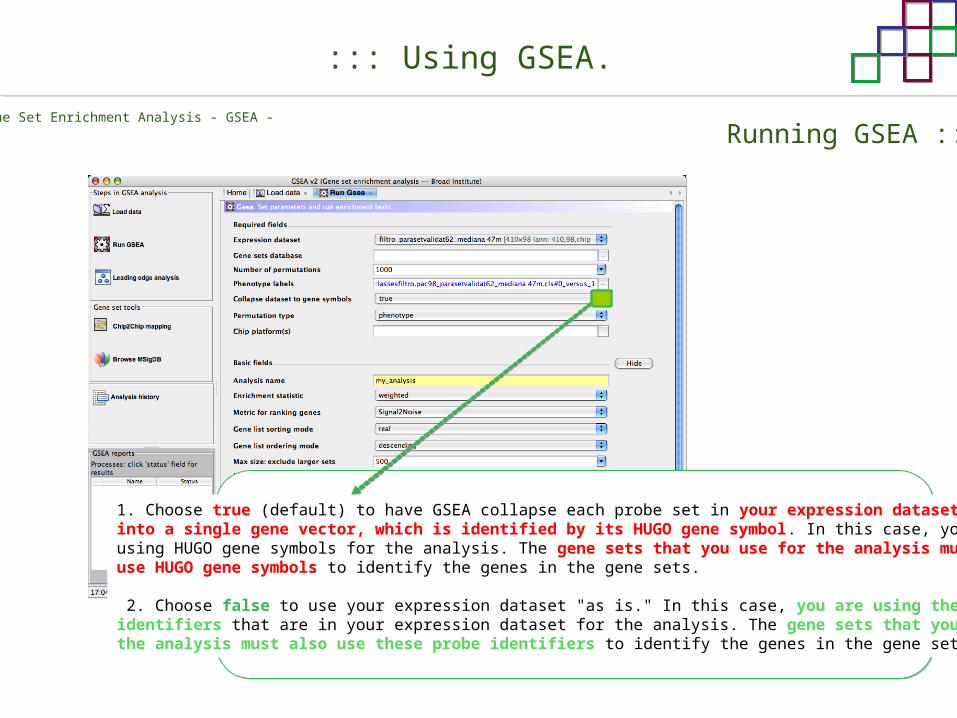
1. Choose true (default) to have GSEA collapse each probe set in your expression datasetinto a single gene vector, which is identified by its HUGO gene symbol. In this case, you areusing HUGO gene symbols for the analysis. The gene sets that you use for the analysis mustuse HUGO gene symbols to identify the genes in the gene sets.
2. Choose false to use your expression dataset "as is." In this case, you are using the probeidentifiers that are in your expression dataset for the analysis. The gene sets that you use forthe analysis must also use these probe identifiers to identify the genes in the gene sets.

Gene Set Enrichment Analysis - GSEA -
Running GSEA :::
PhenotypeGene Sets (few samples)
::: Using GSEA.
Gene Set Enrichment Analysis - GSEA -
Running GSEA :::
::: Using GSEA.

Gene Set Enrichment Analysis - GSEA - Chip2Chip mapping :::
Chip2Chip translates the gene identifiers in a gene sets from HUGO gene symbols
to the probe identifiers for a selected DNA chip.
::: Using GSEA.

Gene Set Enrichment Analysis - GSEA -
Enrichment statistic :::
To calculate the enrichment score, GSEA first walks down the ranked list of genes increasing a running-sumstatistic when a gene is in the gene set and decreasing it when it is not. The enrichment score is the maximum deviation from zero encountered duringthat walk. This parameter affects therunning-sum statistic used for the analysis.
::: Using GSEA.

Gene Set Enrichment Analysis - GSEA -
Ranking Metric :::
Signal2NoisetTestCosineEuclideanManhattenPearson (time series)Ratio of ClassesDiff of ClassesLog2_Ratio_of_Classes
Categorical phenotypesContinuous phenotypes
::: Using GSEA.

Gene Set Enrichment Analysis - GSEA -
Ranking Metric :::
::: Using GSEA.

Gene Set Enrichment Analysis - GSEA -
Ranking Metric :::
::: Using GSEA.

Gene Set Enrichment Analysis - GSEA -
real8.28.18.0…
-7.5-7.7-7.9
abs8.28.18.07.97.77.5…
parameter to determine whether to sort the genes in descending (default) or ascending order.
More parameters :::
::: Using GSEA.
Gene Set Enrichment Analysis - GSEA -
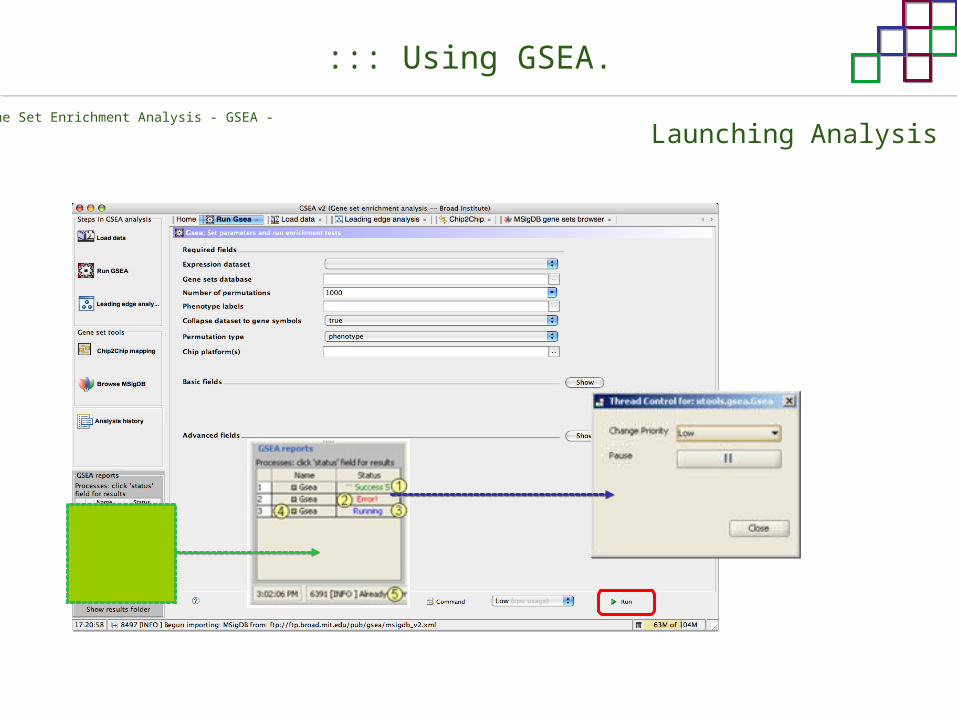
Launching Analysis :::
::: Using GSEA.

::: Contents.
1. Introduction.2. GSEA Software3. Data Formats4. Using GSEA5. GSEA Output6. GSEA Results7. Leading Edge Analysis

Gene Set Enrichment Analysis - GSEA -
::: GSEA output.
Results Accession :::
/Users/yourhome/gsea_home
C:\Documents and settings\username\gsea_home
By default in gsea_home

::: Contents.
1. Introduction.2. GSEA Software3. Data Formats4. Using GSEA5. GSEA Output6. GSEA Results7. Leading Edge Analysis
Gene Set Enrichment Analysis - GSEA -
::: GSEA results.
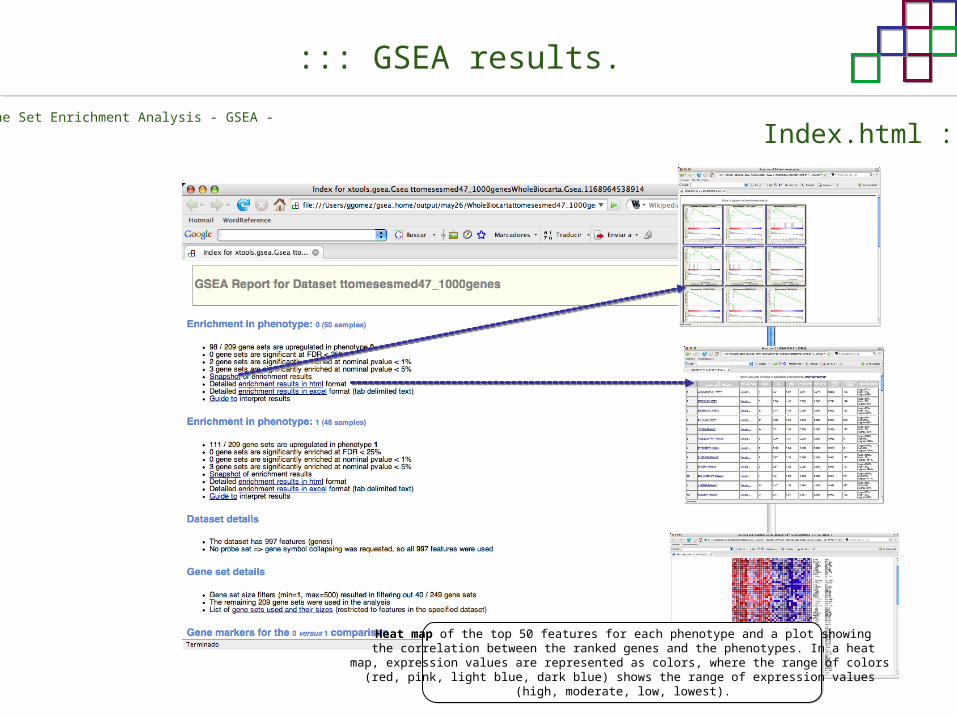
Index.html :::
Heat map of the top 50 features for each phenotype and a plot showingthe correlation between the ranked genes and the phenotypes. In a heat
map, expression values are represented as colors, where the range of colors (red, pink, light blue, dark blue) shows the range of expression values
(high, moderate, low, lowest).

Gene Set Enrichment Analysis - GSEA -
::: GSEA results.
Enrichment results in html :::

Gene Set Enrichment Analysis - GSEA -
::: GSEA results.
Enrichment results in html :::

Gene Set Enrichment Analysis - GSEA -
::: GSEA results.
Enrichment results in html :::
How can I decide about my results?
FDR ≤ 0.25
NOM p-val ≤ 0.05
::: Contents.
1. Introduction.2. GSEA Software3. Data Formats4. Using GSEA5. GSEA Output6. GSEA Results7. Leading Edge Analysis

Gene Set Enrichment Analysis - GSEA -
::: GSEA results.
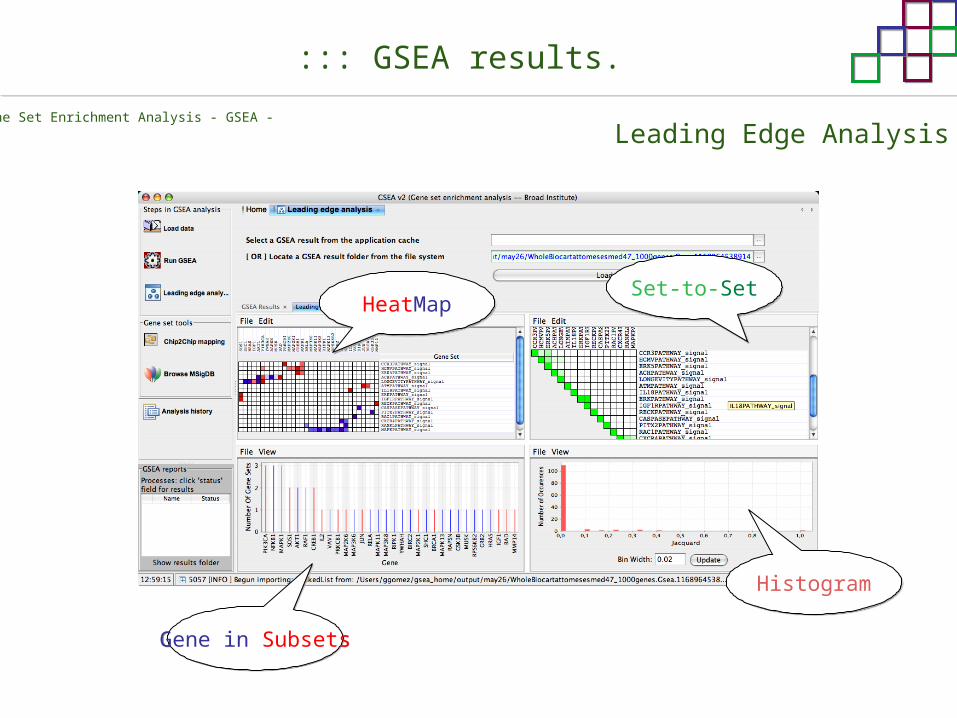
Leading Edge Analysis :::
Gene Set Enrichment Analysis - GSEA -
::: GSEA results.
Leading Edge Analysis :::
Gene in SubsetsGene in Subsets
Set-to-SetSet-to-SetHeatMapHeatMap
HistogramHistogram
Gene Set Enrichment Analysis - GSEA -
::: GSEA results.
Leading Edge Analysis :::
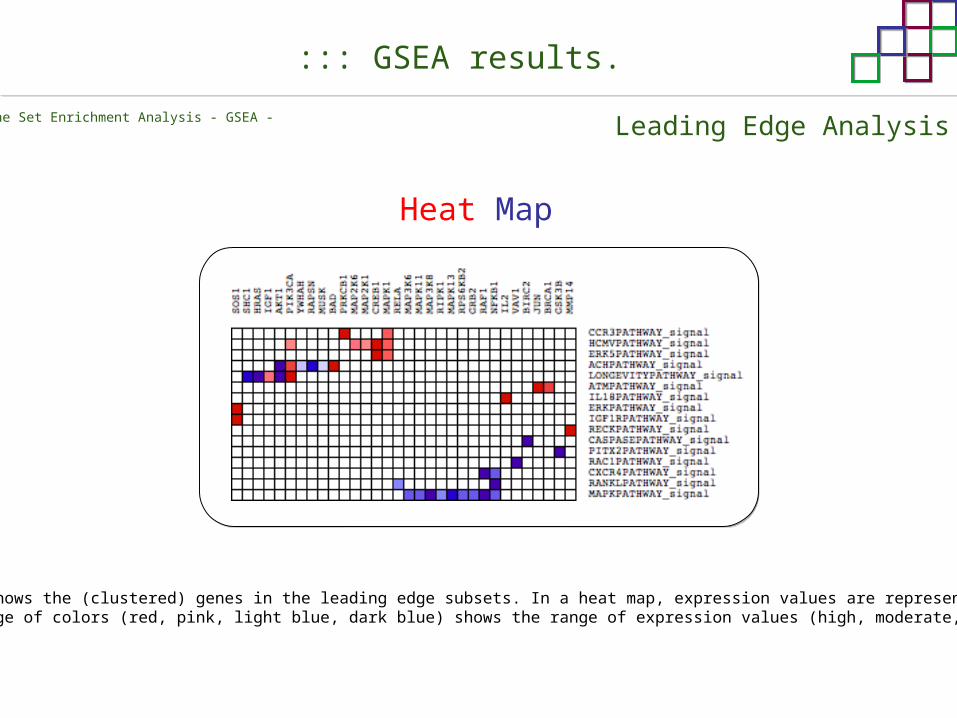
Heat Map
The heat map shows the (clustered) genes in the leading edge subsets. In a heat map, expression values are represented as colors, where the range of colors (red, pink, light blue, dark blue) shows the range of expression values (high, moderate, low, lowest).

Gene Set Enrichment Analysis - GSEA -
::: GSEA results.
Leading Edge Analysis :::
Set-to-Set
The graph uses color intensity to show the overlap between subsets: the darker the color, the greater the overlap between the subsets..When you compare a leading edge subset to itself, its members completely overlap so the corresponding cell is dark green. When you compare two subsets that have no overlapping members, the corresponding cell is white.

Gene Set Enrichment Analysis - GSEA -
::: GSEA results.
Leading Edge Analysis :::
Gene in Subsets
The graph shows each gene and the number of subsets in which it appears.

Gene Set Enrichment Analysis - GSEA -
::: GSEA results.
Leading Edge Analysis :::
Histogram
The last plot is a histogram, where the Jacquard is the intersection divided by the union for a pair of leading edge subsets. Number of Occurrences is the number of leading edge subset pairs in a particular bin. In this example, most subset pairs have no overlap (Jacquard = 0).

Gene Set Enrichment Analysis - GSEA -
::: GSEA & FatiScan.
Detects significant functions with Gene Ontology InterPro motifs, Swissprot KWand KEGG pathways in lists of genes ordered according to differents characteristics.
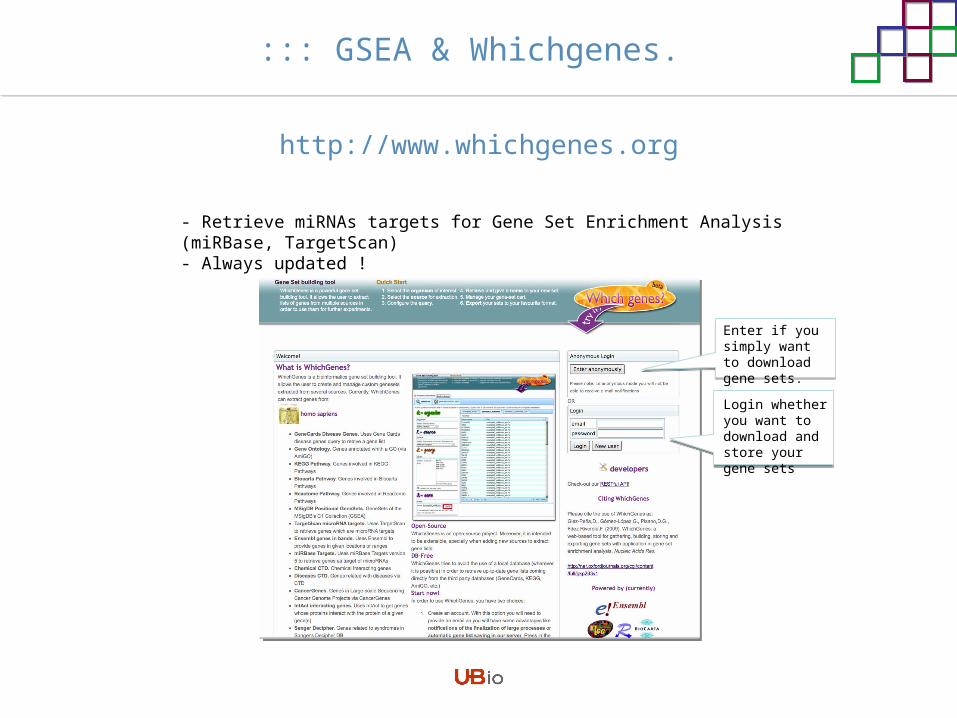
http://www.whichgenes.org
- Retrieve miRNAs targets for Gene Set Enrichment Analysis (miRBase, TargetScan)- Always updated !
Login whether you want to download and store your gene sets
Enter if you simply want to download gene sets.
::: GSEA & Whichgenes.

1. Choose oraanism. -Human - Mouse
2. Select source: - miRBase, TScan - Other sources
3. Copy and paste miRNAs identifiers.Create set per items.
4. Job name.
Create Sets
Looking for examples ?
Try a preloaded
example!!!
Retrieving targets
http://www.whichgenes.org
::: GSEA & Whichgenes.

Gene Sets Cart
1. Choose gene sets for downloading.
2. Select output format. e.g. .CSV, .TSV, .gmt, .gmx3. Select identifier.e.g. Agilent, Affy, Mgi…
4. DOWNLOAD GENE SETS !!!
http://www.whichgenes.org
::: GSEA & Whichgenes.


![Protein Sequence Analysis 1 Part II [web page]web page Osvaldo Graña CNIO Bioinformatics Unit ograna@cnio.es March 2013.](https://static.fdocuments.in/doc/165x107/56649e9d5503460f94b9d71b/protein-sequence-analysis-1-part-ii-web-pageweb-page-osvaldo-grana-cnio.jpg)